 Lisa E. Wallace
 Marlin L. Bowles
- 1Department of Biological Sciences, Old Dominion University, Norfolk, VA, United States
- 2The Morton Arboretum (retired), Lisle, IL, United States
Understanding how natural selection acts on intraspecific variation to bring about phenotypic divergence is critical to understanding processes of evolutionary diversification. The orchid family is well known for pollinator-mediated selection of floral phenotypes operating among species and along environmental or geographic gradients. Its effectiveness at small spatial scales is less understood, making the geographic scale at which intraspecific floral variation is examined important to evaluating causes of phenotypic divergence. In this study, we quantified phenotypic variation in the orchid Platanthera dilatata across 26 populations in coastal Southeast Alaska and compared this to edaphic and genetic variation at microsatellite loci. We sought to determine (1) if flower morphological variation is structured at smaller geographic scales, (2) the extent of genetic divergence in relation to phenotypic divergence, (3) the scale at which inter-population gene flow occurs, and (4) the relative importance of geographic distance and abiotic factors on population genetic structure. Two morphological groups were found to separate based on lip and spur length and are restricted to different habitats. Small-flowered forms occur in muskeg bogs, whereas large-flowered forms occur in fens and meadows, and rarely in sub-alpine habitat. Genetic analyses were concordant with the morphological clusters, except for four small-flowered populations that were genetically indistinguishable from large-flowered populations and considered to be introgressed. In fact, most populations exhibited some admixture, indicating incomplete reproductive isolation between the flower forms. Pollinators may partition phenotypes but also facilitate gene flow because short-tongued Noctuidae moths pollinate both phenotypes, but longer-tongued hawkmoths were only observed pollinating the large-flowered phenotype, which may strengthen phenotypic divergence. Nevertheless, pollinator movement between habitats could have lasting effects on neutral genetic variation. At this small spatial scale, population genetic structure is only associated with environmental distance, likely due to extensive seed and pollinator movement. While this study corroborates previous findings of cryptic genetic lineages and phenotypic divergence in P. dilatata, the small scale of examination provided greater understanding of the factors that may underlie divergence.
1. Introduction
Understanding the origin and maintenance of intraspecific variation is of central importance to evolutionary biology because they inform our understanding of diversification across space and time and illuminate the process of speciation (Pinheiro et al., 2018). Substantial intraspecific phenotypic variation may indicate the maintenance of polymorphisms over otherwise connected populations (Nobarinezhad and Wallace, 2022), or it could indicate the presence of evolutionarily divergent cryptic lineages that exhibit parallel ecological responses (Kahl et al., 2021). Whereas a polymorphic species is expected to experience spatially and temporally heterogeneous gene flow among populations, cryptic lineages exhibiting genetic divergence should be isolated from one another (Surveswaran et al., 2018). While genetic tools have been especially useful for identifying cryptic lineages, integrated approaches involving multiple data types and widespread sampling of populations provide not only the identification of cryptic lineages but also clues about their divergence and geographic spread (Surveswaran et al., 2018; Liu et al., 2022). When examined deeply, many species have been found to comprise cryptic lineages (Pinheiro et al., 2018). Linking such divergence with pollinator selection of floral traits is critical to understanding how it integrates with co-evolutionary processes in determining ecological speciation (Van der Niet et al., 2014).
The orchid genus Platanthera (L.) Rich. contains many phenotypically polymorphic species (e.g., Robertson and Wyatt, 1990; Wallace, 2003a; Bateman and Sexton, 2008; Bateman et al., 2013; Adhikari and Wallace, 2014) and potentially cryptic lineages (Wettewa et al., 2020). As in many orchids, this phenotypic variation is frequently attributed to pollinator-mediated selection (Hapeman and Inoue, 1997; Van der Niet et al., 2014). Such selection has been shown to operate even within species (Robertson and Wyatt, 1990). At larger geographic scales or along environmental gradients, pollinator-mediated selection is a reasonable hypothesis for morphological polymorphism if pollinators exhibit habitat preferences or have distributional limits. However, at smaller geographic scales, other factors must also be considered to explain the maintenance of phenotypic variation in Platanthera species. Characterizing the geographic scale of phenotypic variation within species is important for distinguishing among competing factors in the maintenance of this variation.
Platanthera dilatata (Pursh) Lind. ex L.C. Beck is distributed across the northern U.S. and Canada, reaching as far south as New Mexico and as far north as Alaska. This species has been treated as representing three varieties based on nectar spur length, which are thought to partition pollinators by corresponding proboscis lengths (Sheviak, 2002). However, as noted by Sheviak (2002), “the recognized varieties of P. dilatata are evidentially merely endpoints in a very complex variation pattern,” leading to unanswered questions as to why polymorphism in this species exists.
In this study, we examined phenotypic and genotypic divergence among populations of P. dilatata in Southeast Alaska and across elevational, climatic, and edaphic gradients. In the study area, P. dilatata populations do not readily fit into the varieties outlined by Sheviak (2002). Thus, we sampled across an area covering many habitats and flower types to quantify variation in soil characteristics, climatic variables, flower morphological traits, and genetic variation at microsatellite loci. We used these data to address the following questions: (1) Is flower morphological variation structured at smaller geographic scales, (2) Are floral phenotypes genetically divergent, (3) Does gene flow occur across morphologically distinct populations, and (4) How do geographic distance and environmental differences influence population genetic structure? We predicted strong isolation by distance at the regional scale (i.e., encompassing all study populations) because of limitations on gene flow via seeds and selection on flowers by pollinators, but at a local scale (i.e., less than 50 km between populations), we predicted that environmental factors would more strongly influence genetic structure because seeds should be capable of dispersal over these distances but may differ in adaptation to habitats and pollinators.
2. Materials and methods
2.1. Study area
This study took place in Southeast Alaska, United States. which comprises an 800 km mountainous coastline and adjacent island chain along the northwest coast of North America (Figure 1). The climate of this region is primarily wet maritime, averaging over 300 cm annual precipitation. The average maximum temperature reaches 18°C in July, and the average minimum temperature reaches -4°C in January (Shulski and Wendler, 2007; Bienek et al., 2012). The predominant coastal vegetation is northern rainforest; about 17% of the area is non-forested shrubland and peatland (Kirchoff et al., 2016). This area was glaciated <10,000 years BP; as a result, climate and post-glacial migration strongly affect vegetation composition (Andersen, 1955; Mathewes, 1985), but glacial refugia present during the late Wisconsin glaciation also may have allowed persistence and recolonization of vegetation within this region (Carrara et al., 2007).
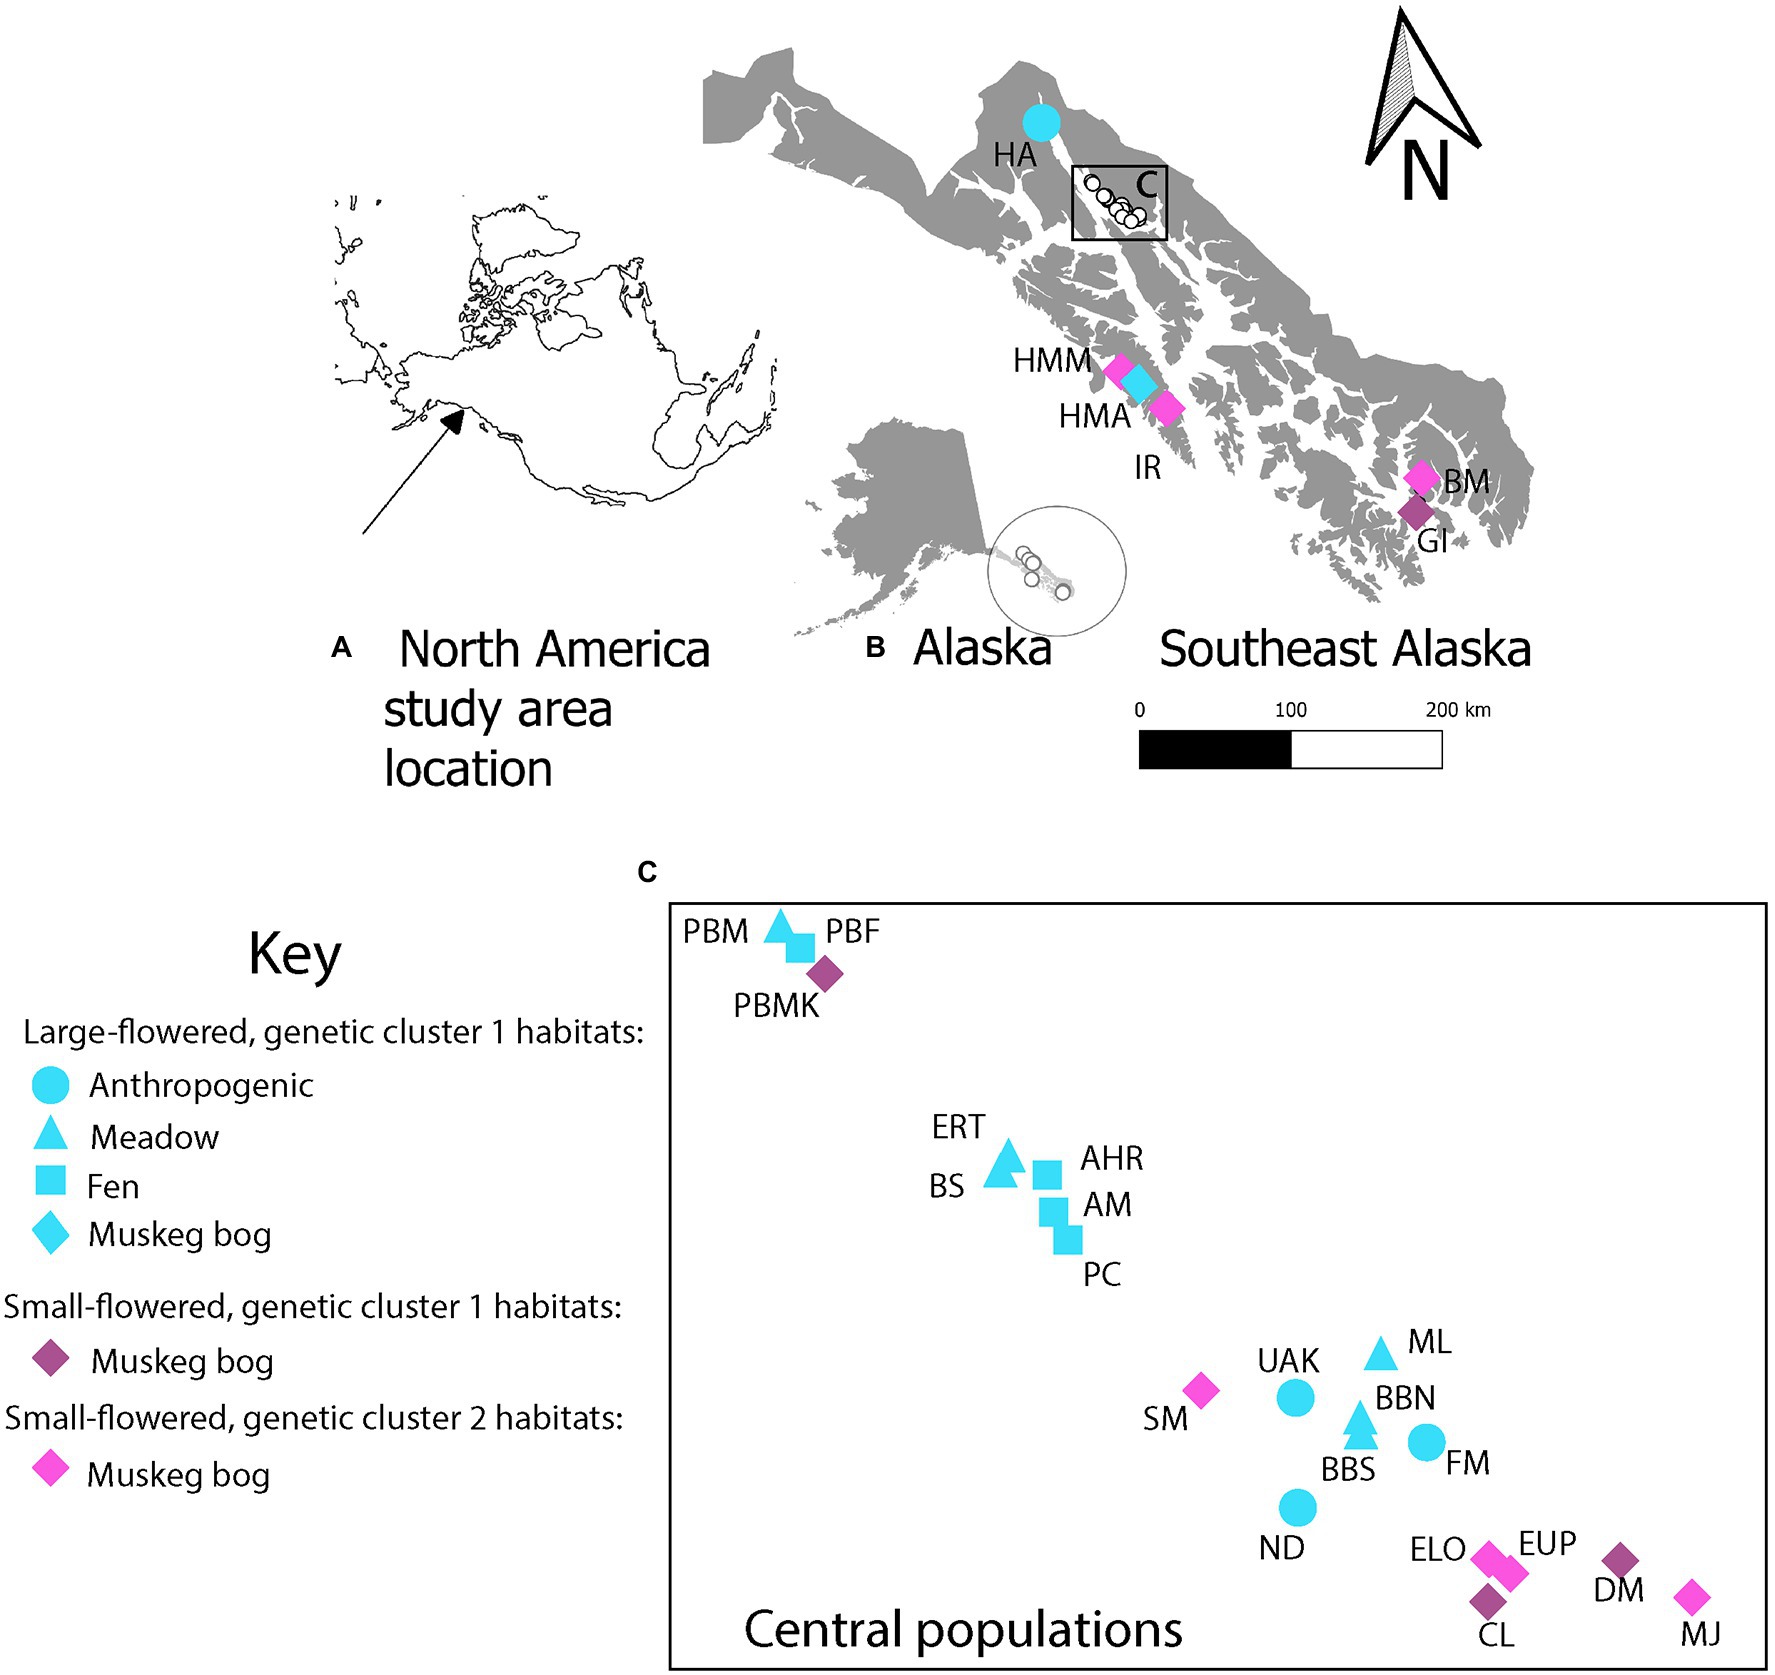
Figure 1. Location of (A) study area in North America, (B) Southeast Alaska collection sites of Platanthera dilatata sampled for morphology, genetic markers, and soil characteristics, and (C) distribution of populations shown in the box in panel B and referenced as central in landscape genetic analyses. In panels B and C, shapes and colors indicate the six combinations of habitat x flower size x genetic cluster observed in this study. Site names follow those in Table 1 and Supplementary Table S1.
In the study area, P. dilatata is most abundant in open bog and fen peatlands, coastal, lakeshore, and riverine meadows, and anthropogenic-disturbed roadsides (Figure 2). Bogs, also known as muskeg, are usually ombrotrophic and develop at low to mid-elevations but grade into subalpine conditions with less organic matter. These habitats usually comprise sapric to hemic peat, and support plant species of open bogs, including Sphagnum L. sp., Carex L. sp., and Ericaceous shrubs (Neiland, 1971). Fens usually occur at low elevations along drainage ways and range from weak to moderately minerotrophic, receiving greater nutrient input than bogs (Fellman and D’Amore, 2007; Fellman et al., 2008; D’Amore et al., 2010, 2015). They comprise floating or solid mats of hemic to fibric peat and support a subset of bog and meadow vegetation. Coastal meadows, also termed uplift meadows, are developed in fine-textured glacial outwash and lacustrine deposits and are undergoing isostatic uplift following glaciation. They are dominated by broad-leaved herbs, with a minor component of graminoid species, and may zonate along tidelands (Stone, 1993). Anthropogenic roadsides have mineral soils developed from grading and gravel deposition and tend to represent a subset of meadow vegetation that tolerates disturbances such as seasonal mowing.
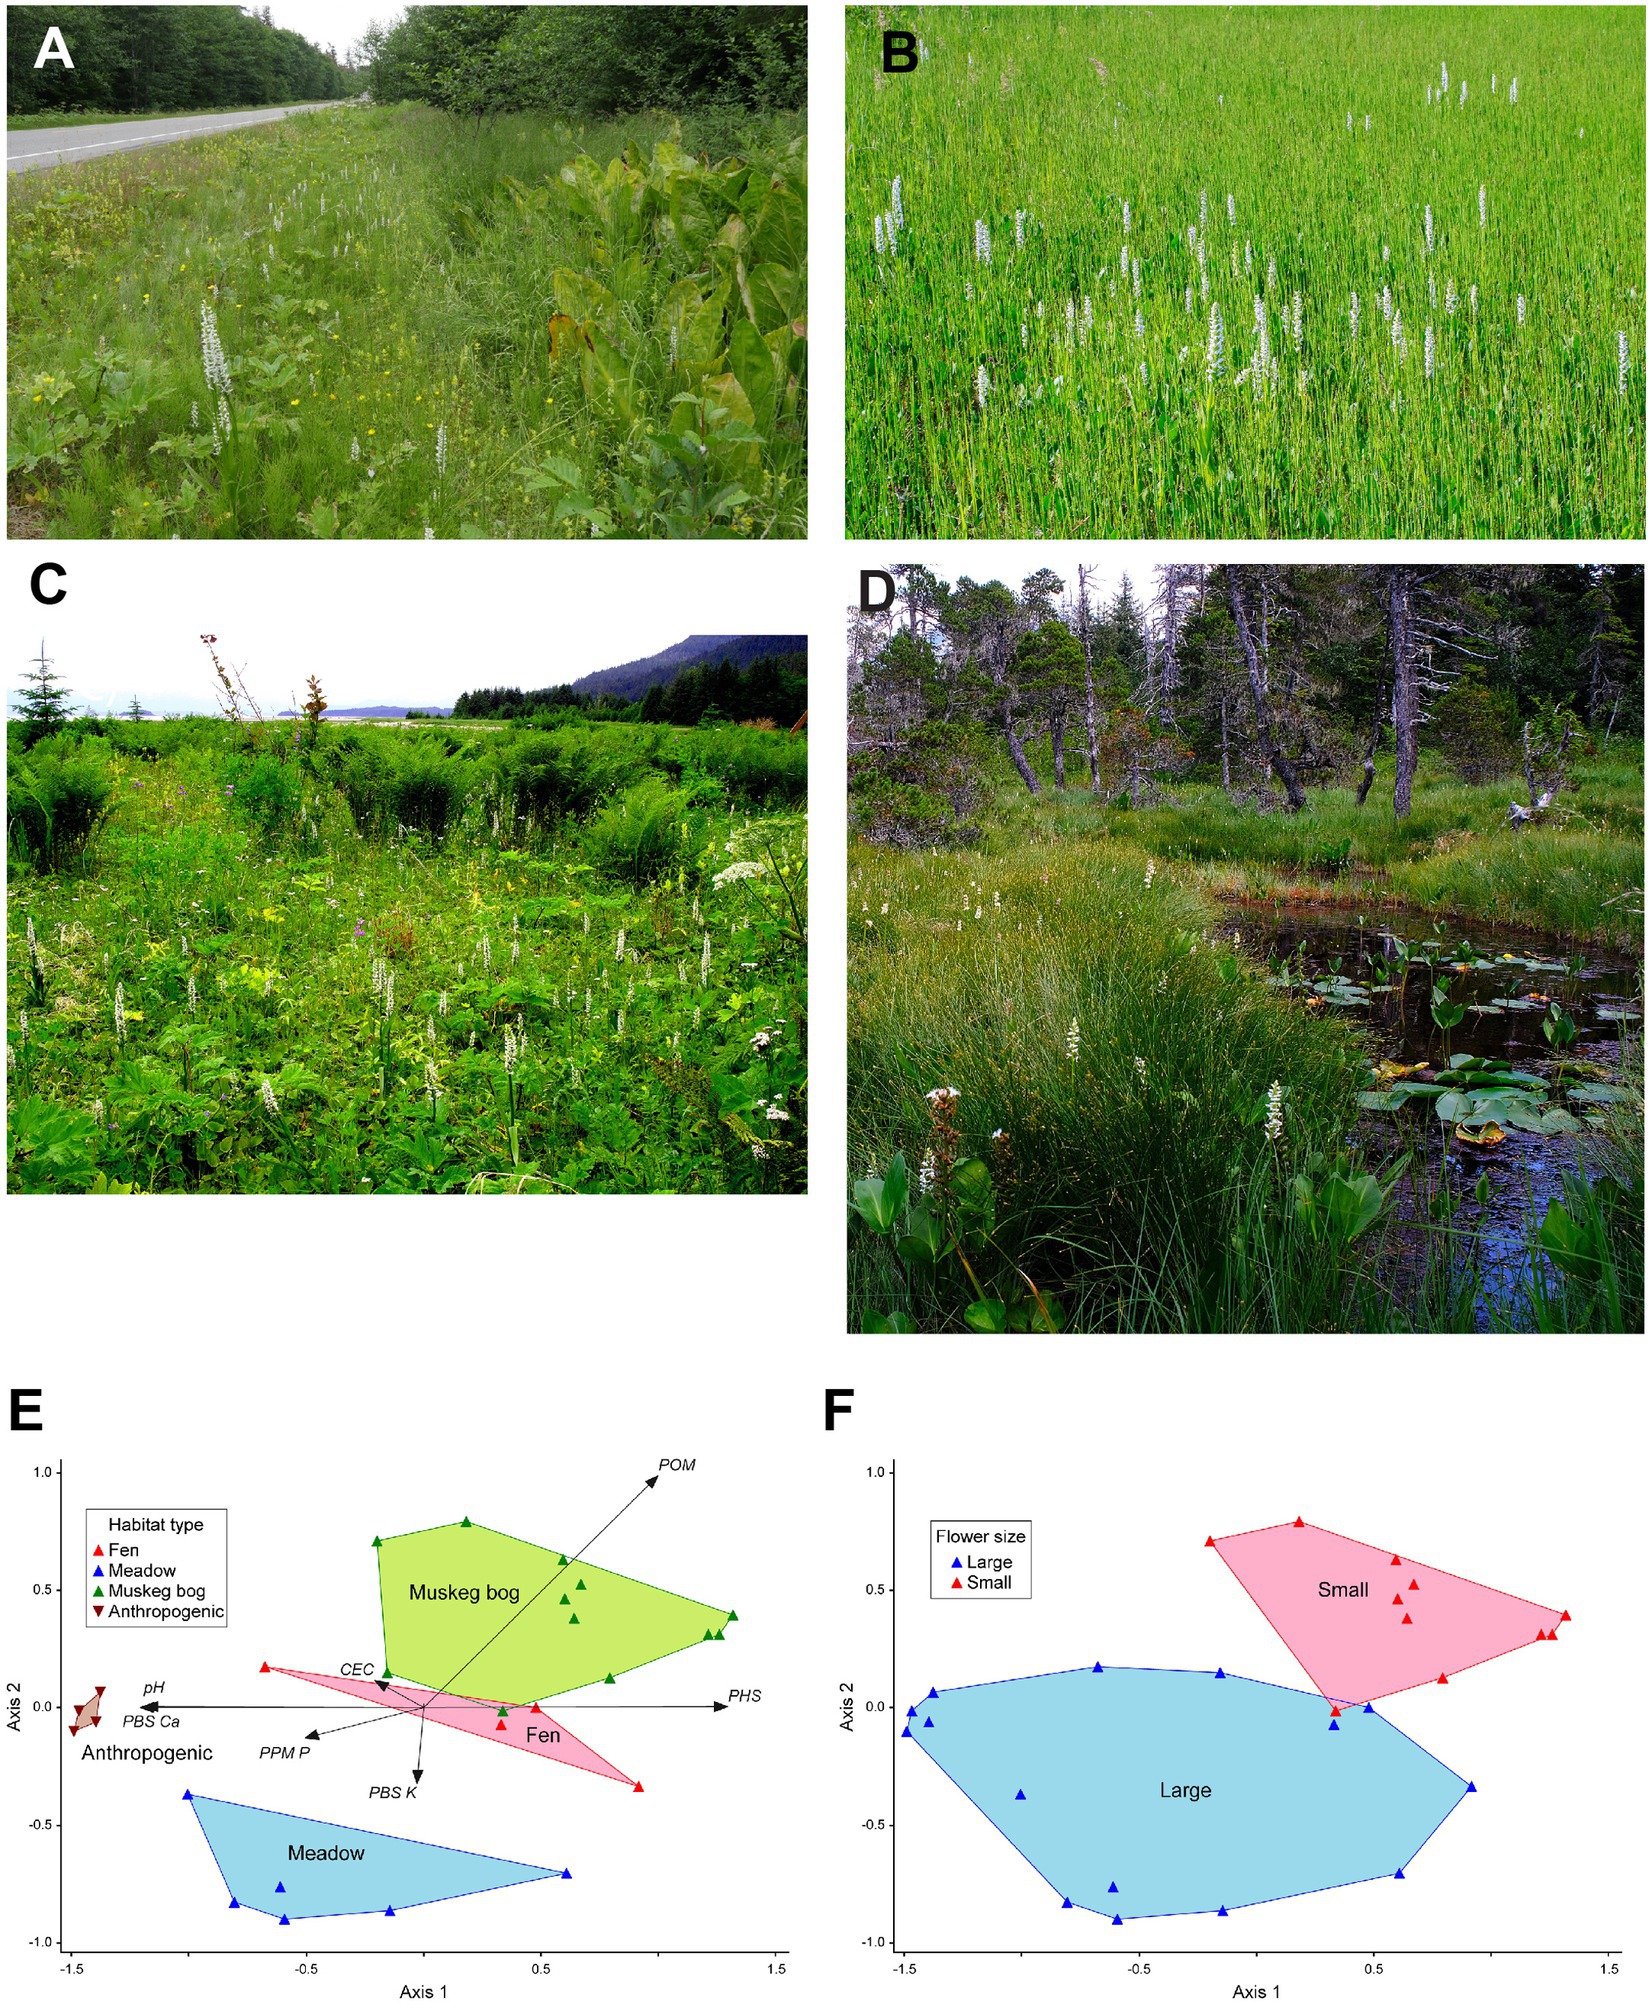
Figure 2. Variation in habitats and soils occupied by Platanthera dilatata. (A) anthropogenic roadside, (B) fen, (C) uplift meadow, (D) and muskeg bog. Panels (E,F) show the NMS ordination of habitat vegetation types in relation to soil characteristics and flower group as indicated by the K-means clustering analysis of floral traits (F). Ordination final stress = 3.4891, final instability = 0.0; probability of final stress obtained by chance (Axis 1 p = 0.002, Axis 2 p = 0.044). Cumulative correlations between ordination distances and distances in the original n-dimensional space: Axis 1 r2 = 0.828, Axis 2 r2 = 0.990. MRPP: all habitats (A = 0.41613688, p < 0.0001); anthropogenic habitats excluded (A = 0.26071168, p < 0.0001). See Supplemental Table S4 for soils variables axis correlation statistics.
The mycorrhizal fungi Ceratobasidium sp. and Tulasnella sp. have been identified in P. dilatata root samples from the study area. Two of three Ceratobasidium isolates were from muskeg, while 10 of 11 Tulasnella samples were from fen, meadow, or anthropogenic habitat (Melton, 2020; M. McCormick, pers. comm.; L. Zettler, pers. comm.). Pollinators of P. dilatata include Noctuidae moths, the hawkmoth Hyles gallii (Rottemburg, 1775), and the butterfly Pieris marginalis Scudder, 1861 (Figure 3); pollinia were deposited on the proboscises of these insects (Bowles and Armstrong, 2021). Noctuidae moths appear to be primary pollinators across all habitats, but hawkmoths may be most frequent in fens and meadows.
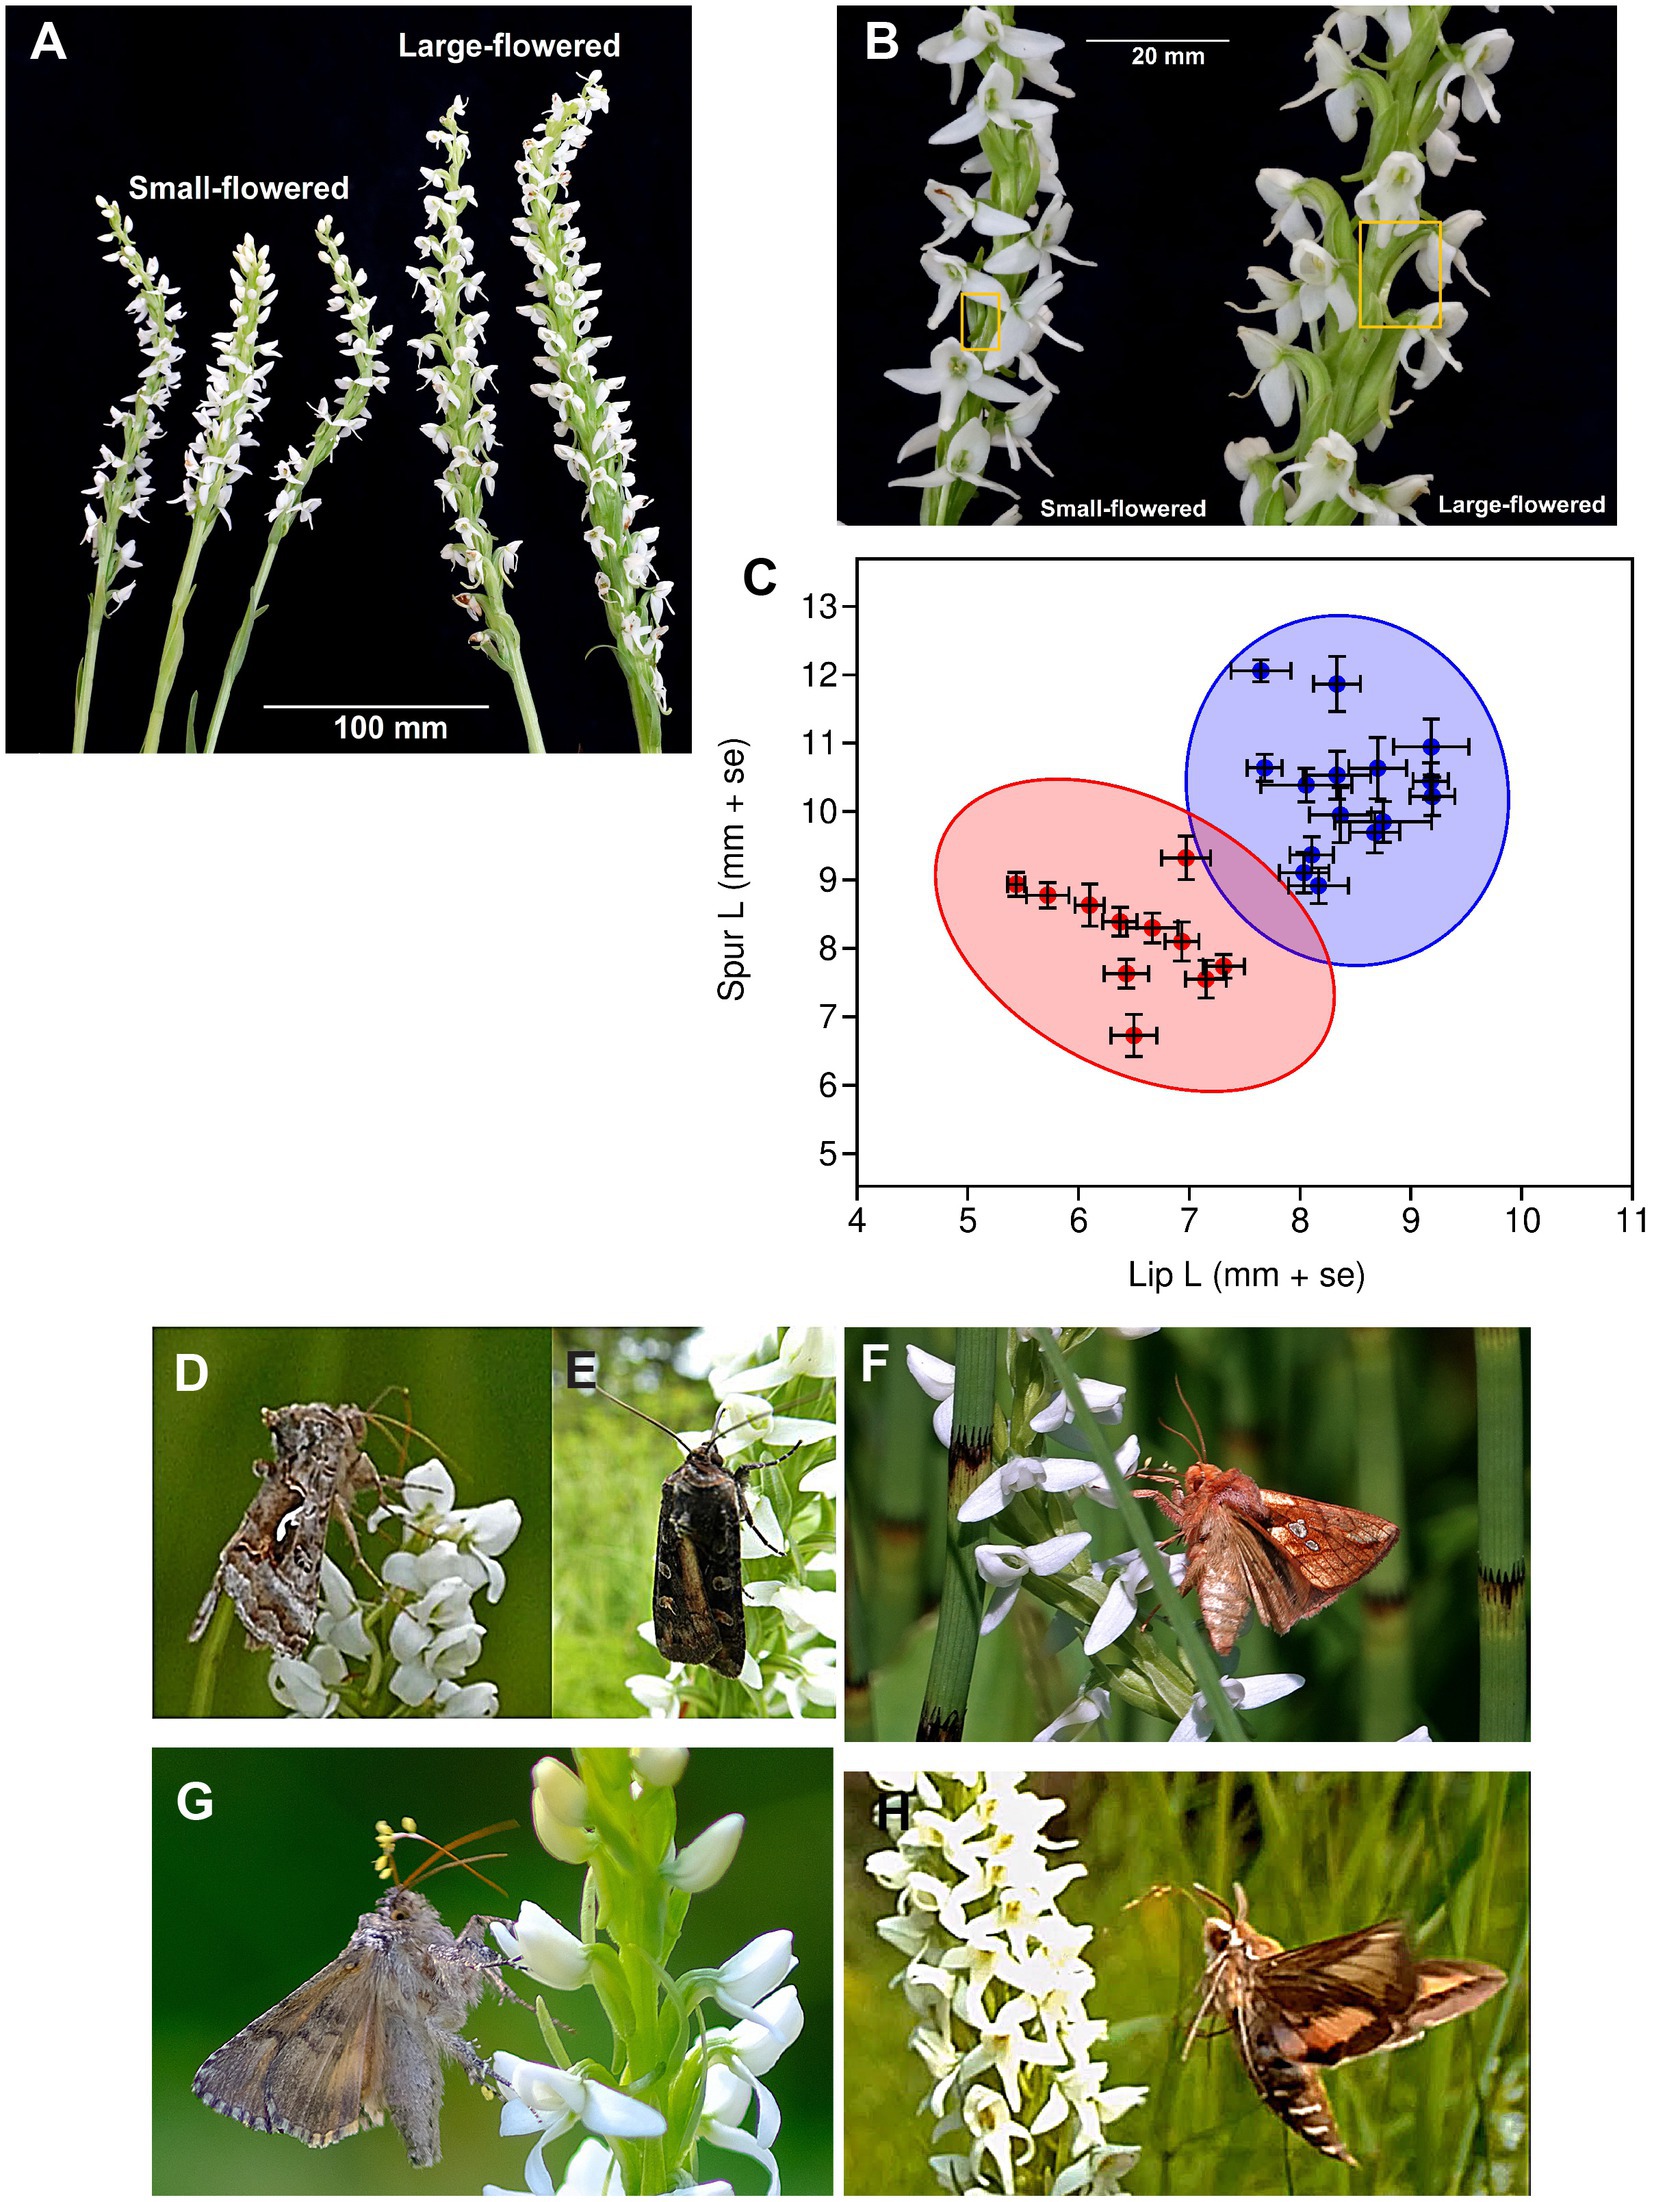
Figure 3. Variation in flower traits and pollinators of Platanthera dilatata in the study area of Southeast Alaska. Differences in (A) inflorescence size and (B) the lengths of spurs (in boxes) between plants grouped by flower size and (C) mean (+ se) lip and spur length of flowers, with the ellipses indicating 95% concentrations of populations within large and small-flowered groups identified by k-means cluster analysis. Pollinators observed on P. dilatata flowers in the study populations include (D) Autographa corusca Strecker, 1885 on small-flowered phenotype (photo: R. H. Armstrong), (E) Actebia fennica (Tauscher, 1806) on small-flowered phenotype (photo: G. Bayluss), (F) Plusia sp. Ochsenheimer 1816 on the large-flowered phenotype (photo: R. H. Armstrong), (G) Autographa corusca Strecker, 1885 on large-flowered phenotype, and (H), Hyles gallii (Rottemburg, 1775) on large-flowered phenotype (photo: R. H. Armstrong); D-G are Noctuidae species, and H is a Sphingidae species. Large-flowered group: lip mean = 8.43 (se = 0.13), spur mean = 10.31 (se = 0.23), t-test of lip and spur lengths: t = −7.089, p < 0,001; small-flowered group: lip mean = 6.49 (se = 0.173), spur mean = 8.11 (se = 0.25),), t-test of lip and spur lengths: t = −5.385, p < 0.001. One-way ANOVA between morphological groups: Lip F1,24 = 85.45, p < 0.0001, Spur F1,24 = 40.50, p < 0.0001. Lip-spur correlations: among groups (r = 0.6409, p = 0.0004); small-flowered group (r = −0.3877, p = 0.237); large-flowered group (r = −0.0581, p = 0.8435).
2.2. Site selection
The 26 study sites represented 12 muskeg bogs, six meadows, four fens and four anthropogenic roadsides, spanning ca. 500 km from north to south (Figure 1; Table 1; Supplementary Table S1). Although fen, meadow, and anthropogenic habitats may occur in southern Southeast Alaska, study sites for these habitats were restricted to northern Southeast Alaska. Sites were selected based on accessibility, lack of anthropogenic disturbance (excluding roadsides) presence of >10 flowering plants at each site, and regional distribution to maximize sampling in morphologically diverse populations and environmentally variable sites.
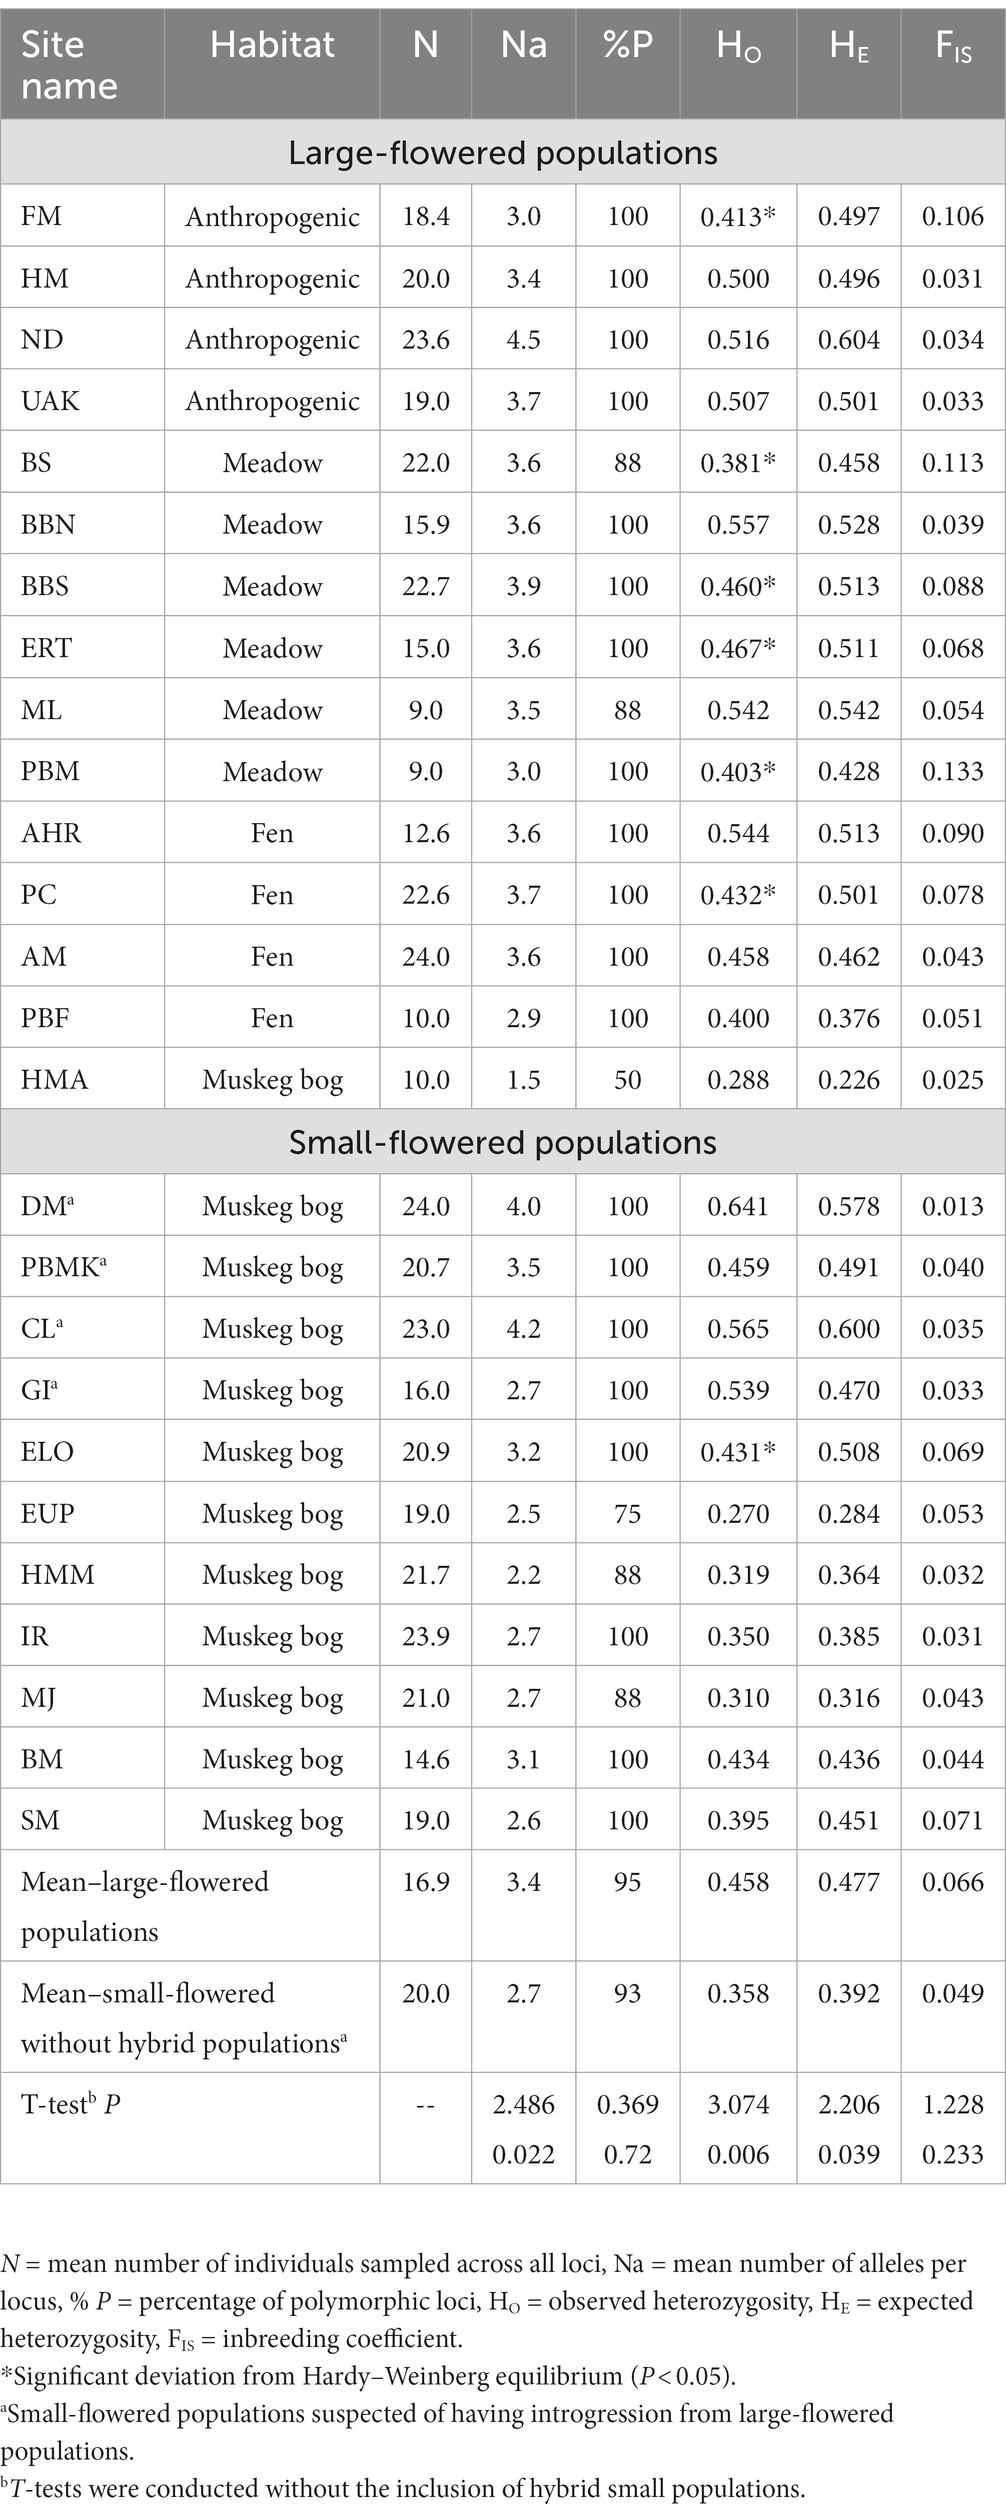
Table 1. Genetic diversity at eight microsatellite loci across sampled locations of Platanthera dilatata in Southeast Alaska.
2.3. Morphological data collection and analysis
Lip and spur length are the most important variables for distinguishing among varieties of P. dilatata (Adhikari and Wallace, 2014). These metrics were obtained from single flowers selected from 10–28 (mean = 17.4, se = 1.01) inflorescences from each study population. Flowers were collected in 2018–2019. Flower collection was stratified to represent the range of inflorescence sizes present; flowers were collected from the lower third of inflorescences to avoid nectar spurs that were not fully developed. Flowers were stored in zip-lock plastic bags at 4°C, and measured within 48 h. Each flower was dissected to remove the lip and spur, and their lengths were measured to the nearest 0.5 mm. Most spurs were falcate, and they were flattened under a flexible sheet of transparent plastic for linear measurement.
Population means (+ se) were calculated for flower and lip length. To assess whether morphological groups could be identified, a k-means cluster analysis was performed in NCSS statistical software (Hintze, 2013). This test evaluated 1–5 clusters, using 5 random starts to produce an optimum solution in which within-cluster sum of squares is minimized. A goodness of fit comparison of the percent variation in each within-cluster group sum of squares relative to one group was used to evaluate which number of clusters had the greatest reduction in variation (Hintze, 2013). The Duda and Hart (1973) test was also used to evaluate whether single or multiple clusters better fit the data, followed by application of the Calinski and Harabasz (1974) index to further evaluate the most likely number of clusters beyond one.
We calculated PST (Brommer, 2011) to estimate the degree of differentiation in lip and spur length among populations. PST was then compared to FST estimated from the microsatellite data (see below) to evaluate the relative potential for selection and genetic drift to drive the observed differences in floral traits. PST was estimated separately for lip length and spur length using the R package Pstat (Blondaeu Da Silva and Da Silva, 2018). Data were subjected to Atchinson transformation and the value of c/h2 was set to 1; bootstrap analysis with 1,000 replicates was used to calculate 95% confidence intervals for PST and this was compared to our estimate of FST based on microsatellite loci.
2.4. Soil data collection and analysis
Soil samples were collected from each study site in 2018–2022. Each sample comprised multiple excavations made to rooting depth with a hand trowel, which were combined into a single collection for each site. Samples were analyzed by Waypoint Analytical (Richmond, Virginia, USA) for percent organic matter (POM); parts per million (PPM) Ca, K, Mg, and P; percent base saturation (PBS) Ca, K and Mg; percent H saturation (PHS); and cation exchange capacity (CEC, meq/100 g). Analytic methods followed Horton (2011).
Soils data were analyzed with ANOVA and multivariate statistics. One-way ANOVA was used to test whether soils variables differed among muskeg, fen, meadow, and anthropogenic habitat groups, which supported different orchid phenotypes (see below). For these tests, transformations were used to approximate normality for POM and PBS K (arcsin transformation), PPM P (log transformation), PPM Ca and Ca (square root transformation). Non-metric Multidimensional Scaling (NMS) was used on PCORD (McCune and Mefford, 2011) to ordinate habitat groups using POM, pH, CEC, PPM P, PBS K, PBS Mg, PBS Ca, and PHS as metrics. A relative Euclidian distance measure with a random seed starting configuration and 100 runs with real data were used to project three axes using a Varimax rotation, for which stability was tested with a randomization test. Relationships of each metric with the first and second NMS axis were tested with correlation analysis. A Multi-Response Permutation Procedures (MRPP) test was used on PCORD to assess whether habitats differed in their multivariate distributions based on soils metrics. Because of skewed metrics in anthropogenic habitat soils, the MRPP test was repeated with this group excluded from the analysis.
2.5. Genetic data collection and analysis
Leaf samples used in genetic analyzes were collected in 2018–2019. A 5 cm length of fresh leaf tissue was removed from one leaf from 9–26 (mean = 18.8 se = 1.3) plants from each study site. Leaf samples were stored in zip-lock plastic bags at 4°C. These samples were dried within 24 h. by placing them in folded aluminum foil containing silica gel crystals and then sealed within double zip-lock plastic bags. DNA was extracted from dried leaves using the SYNERGY 2.0 Plant DNA extraction kit (OPS Diagnostics, Lebanon, New Jersey, USA) and stored in 1X TE buffer. DNA samples were standardized to 10 ng/μl for use in PCR. Each sampled plant was genotyped at nine microsatellite loci that were developed from a transcriptome library of P. dilatata (Wallace, unpublished data). Primer sequences are provided in Supplementary Table S2. The nine loci were amplified using a multiplex PCR with the Kapa 2G Fast multiplex PCR kit (Roche Sequencing and Life Science, Wilmington, Massachusetts, USA) and fluorescent labeled primers following protocols in Culley et al. (2013). Each fluorescently labeled primer contained a sequence that matched a tag sequence located on the 5′ end of the locus-specific forward primer. For each sample, each multiplex reaction was performed in a final volume of 10 μl in the presence of 10 ng of template DNA, 100 μmole of each of the reverse and tagged fluorescently labeled primers and 10 μmole of tagged forward primer using KAPA 2G Fast Multiplex PCR mix. The thermal cycler program used to amplify loci included 3 min at 95°C, 30 cycles of 15 s at 95°C, 30 s at 60°C, and 30 s at 72°C, and a final extension step of 1 min at 72°C. Amplified products were genotyped at the Institute of Biotechnology at Cornell University with LIZ 500 size standard, and individual alleles were sized using GeneMarker (SoftGenetics, State College, Pennsylvania, United States).
The presence of null alleles in each locus and population was checked using the program FreeNA (Chapuis and Estoup, 2007). Null allele frequencies <0.2 are not expected to greatly influence the results of population genetic analyzes (Dakin and Avise, 2004; Carlsson, 2008). Thus, we considered further only loci exhibiting a null allele frequency > 0.2, which occurred at three loci, 72267, 99945, and 107223, in eight, three, and three populations, respectively. Locus 72267 was removed from the dataset because of the extensive occurrence of potential null alleles. We further investigated inbreeding as a potential cause of null alleles for the other two loci. Heterozygote deficiency, which is a potential sign of null allele presence, has often been reported in association with significant FIS in other orchids (Chung et al., 2004; Alcantara et al., 2006; Andriamihaja et al., 2021). For each of the five populations suspected of having null alleles, we compared a model based on the inclusion of null alleles, inbreeding, and genotyping errors (i.e., nfb) with one lacking inbreeding (i.e., nb) using the software INEST v. 2.2 (Chybicki and Burczyk, 2009). These analyzes were implemented using a Bayesian approach with 1 million MCMC cycles, keeping every 100th result, and a burn-in of 10,000 prior to summarizing the results. DIC values were compared between the two models to evaluate the impact of inbreeding on observed diversity. For population PC, the full model had a substantially lower DIC than the model without inbreeding. For the other four populations (i.e., HMM, IR, SM, and ND), the difference in DIC between the two models was less than 1.5. As these results suggest that inbreeding may account for the lack of heterozygous individuals in these populations at the suspected loci, we chose to retain data for these locus-population combinations for further analysis of genetic diversity and structure.
Within each population, we tested for significant departures from Hardy–Weinberg expectations using a global test of heterozygote deficiency in GENEPOP version 3.2 (Raymond and Rousset, 1995; Rousset, 2008). Genotypic linkage disequilibrium was measured for each pair of loci in each population and tested through Fisher’s exact test using GENEPOP version 3.2 (Raymond and Rousset, 1995; Rousset, 2008) and applying a Bonferroni correction (Holm, 1979). Genetic diversity within populations was assessed as number of alleles per locus (Na), observed heterozygosity (HO), expected heterozygosity (HE), and percent of polymorphic loci (% P) using GenAlEx version 6.503 (Peakall and Smouse, 2012). Inbreeding coefficients were calculated in INEST (Chybicki and Burczyk, 2009) as described above. To determine if genetic diversity varies between large and small-flowered populations, as identified in the morphological K-means clustering, we compared mean values of Na, HO, HE, and FIS using t-tests in SPSS v. 27 (IBM Corp, 2020). p < 0.05 was used to identify significant differences in genetic diversity between the flower groups.
We evaluated population genetic structure according to the groups identified by morphological analyzes and NMS of the soil variables, that is, between large-flowered and small-flowered groups and separately among the four habitat types (Table 1) using analysis of molecular variance (AMOVA) (Excoffier et al., 1992), conducted in GenAlEx version 6.503 (Peakall and Smouse, 2012). Statistical significance of AMOVA was assessed by 9,999 permutations. We used the Bayesian clustering approach implemented in STRUCTURE v. 2.3.4 (Pritchard et al., 2000) to test for admixture and assignment of individuals to distinct genetic clusters. These analyzes were conducted using an admixture model with correlated allele frequencies, a ‘burn-in’ period of 50,000 MCMC replicates, sampling 100,000 replicates, and eight iterations of each K value, from one to 13. This range of K values was used in the final run because an initial analysis of four iterations each for K values from 1 to 25 under similar run parameters indicated low probability of a K value greater than five. For the final analysis multiple posterior probability values (log likelihood (lnL) values) for the eight iterations of each K were generated, and the most likely number of clusters was determined using STRUCTURE HARVESTER (Earl and vonHoldt, 2012) and Delta K- (Evanno et al., 2005). CLUMPP (Jakobsson and Rosenberg, 2007) was used to aggregate individual assignment probabilities from the eight iterations for the selected K. STRUCTURE PLOT (Ramasamy et al., 2014) was used to generate plots of individual assignment from the CLUMPP output file.
We estimated the potential for admixture in populations using several methods. Identify scores (Q-matrix scores) from the STRUCTURE analysis were used to infer if individuals were of pure ancestry or contained an admixed background. An identity score < 0.9 in a single cluster was used to assign an individual as admixed. NewHybrids v1.1 (Anderson and Thompson, 2002) was used to assign each individual to one of six genotypic classes (i.e., pure large-flowered, pure small-flowered, F1, F2, backcross with large-flowered, or backcross with small- flowered). This analysis was conducted without specifying individuals to a particular class, and all individuals were analyzed. We ran the analysis using a Jeffreys prior, 10,000 burn-in replicates, and 1 million sweeps before assignment probabilities were determined. No individual was assigned to any of the hybrid classes with probably >0.7, so we only considered a hybrid group, rather than F1, F2, or backcross generations. Furthermore, we used a cut-off probability of >0.9 to assign individuals into one of the pure parental groups, rather than the hybrid group.
BayesAss (Wilson and Rannala, 2003) and Geneclass 2 (Piry et al., 2004) were used to estimate the proportion of immigrants and non-immigrants. Whereas BayesAss (Wilson and Rannala, 2003) is better able to detect older instances of movement, Geneclass (Piry et al., 2004) more aptly identifies first generation immigrants. For these analyzes we assigned populations to one of three groups, large-flowered populations, small-flowered populations, and hybrid populations, after considering the morphological groupings and genetic assignments suggested by STRUCTURE and NewHybrids (see results, Supplementary Table S4; Figures 3C, 4A). Hybrid populations were identified by their conflicting placement into groups based on morphological and genetic variation (i.e., small-flowered plants that were genetically similar to large-flowered plants). BayesAss analysis was conducted using 50 million iterations, a burn-in of 1 million, and sampling every 5,000 generations. The Geneclass analysis was conducted to identify first generation immigrants only using the criterion of Rannala and Mountain (1997) with 10,000 simulated individuals under the simulation algorithm of Paetkau et al. (2004). A p < 0.05 was used to identify significant immigration events.
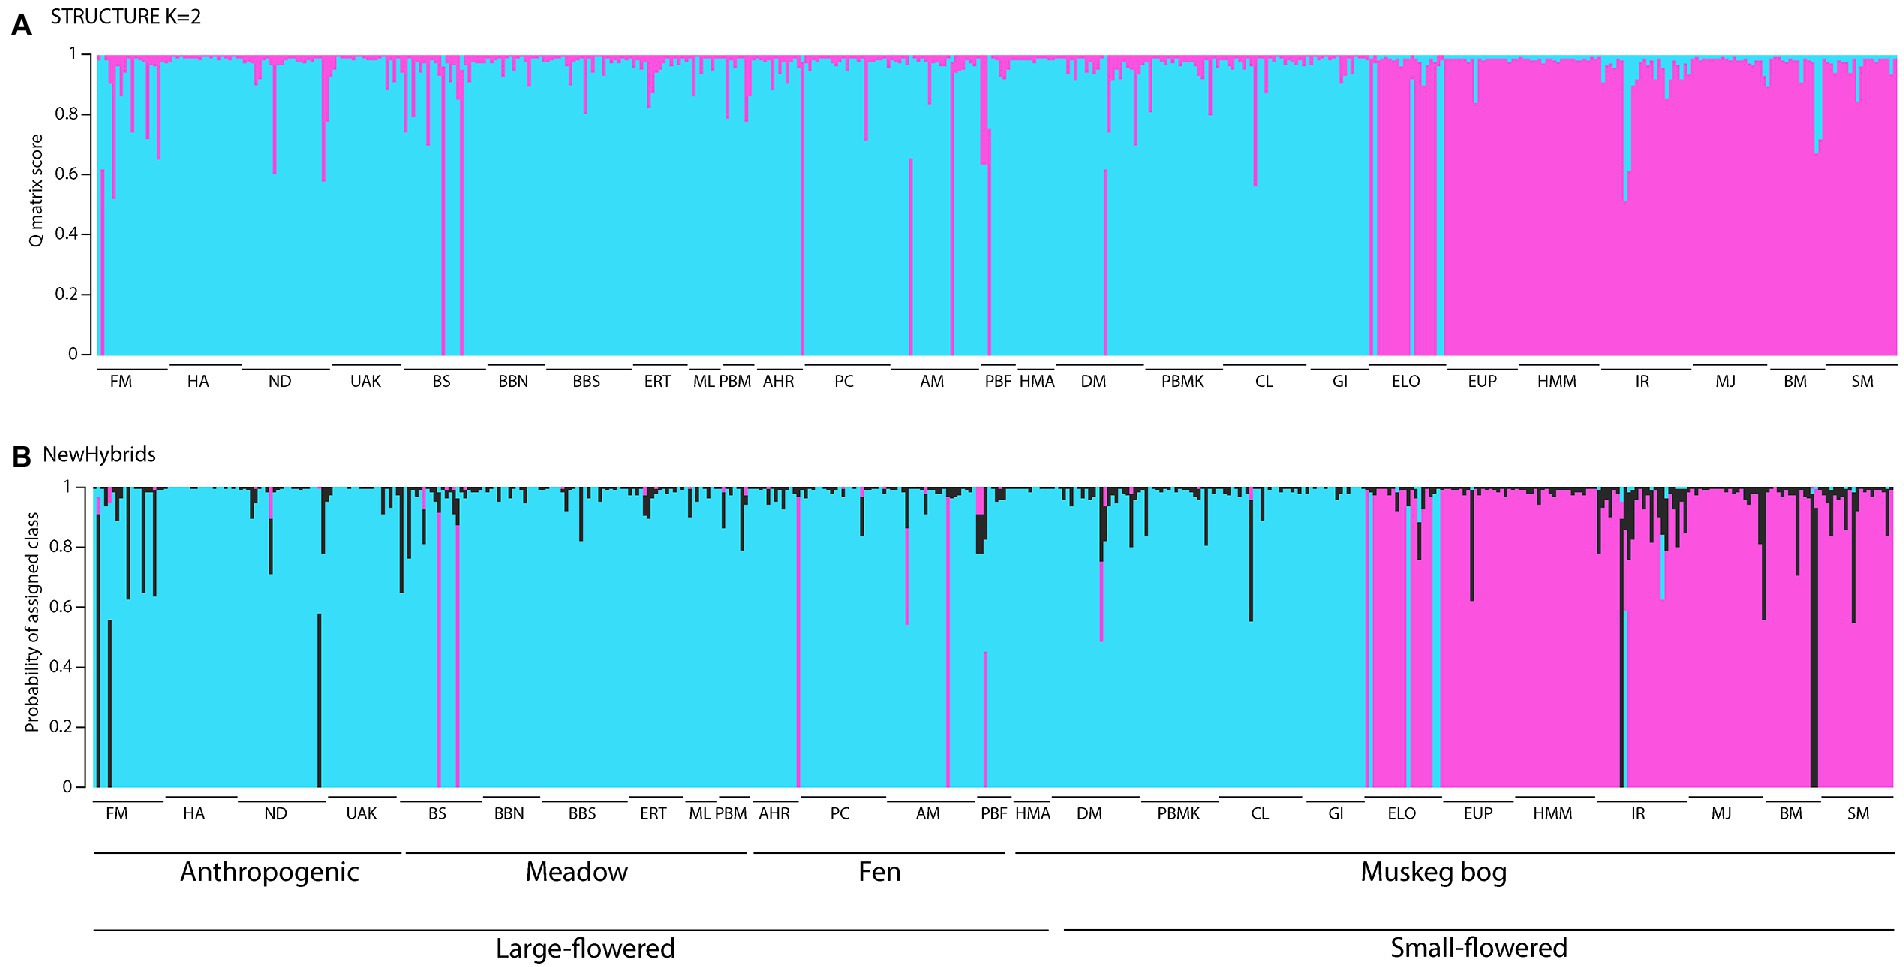
Figure 4. Admixture proportions for all samples of Platanthera dilatata from Southeast Alaska based on analysis with (A) STRUCTURE and (B) NewHybrids. For a, the Q-matrix scores for each individual according to the solution K = 2 (blue and pink clusters) are indicated. For (B), the estimated probability that an individual is from one of the pure parental groups (blue or pink) or a hybrid (black) is shown. Populations are arranged in the order shown in Table 1. See Figure 2E for alignment of habitat groups along soil gradients.
Past studies (e.g., Balkenhol et al., 2009; Kierepka and Latch, 2015) have found that different methods for assessing the role of geography, environment, or other factors on population genetic structure show only moderate agreement and recommend choosing multiple statistical approaches when testing for isolation by distance (IBD), isolation by environment (IBE), or other factors. Thus, we used multiple matrix regression (MMR) (Wang, 2013) and distance-based RDA (dbRDA) (Legendre and Anderson, 1999) to test for IBD and IBE. MMR compares pairwise population genetic distance against distance matrices based on explanatory variables using regression, whereas dbRDA assesses selected explanatory variables directly as predictors of population genetic distance. We conducted these analyzes at a regional scale, i.e., on all populations, as well as a local scale, i.e., the centrally located populations near Juneau (Figure 1B) to evaluate whether environmental factors are more predictive of genetic structure at the local scale and geographic distance at the regional scale, given that orchid seeds may be capable of dispersing over several hundred kilometers (Arditti and Ghani, 2000; Phillips et al., 2012).
For all analyzes, pairwise population genetic distances were generated using the distance metric of Cavalli-Sforza and Edwards (1967), with correction by the INA method implemented in FreeNA and described in Chapuis and Estoup (2007). For MMR, distance matrixes reflecting geography and environmental features were created in the following manner. The pairwise population geographic distance matrix was created using GPS coordinates and the distGeo() function in the geosphere package v. 1.5 (Hijmans et al., 2021) in R (R Core Team, 2022). These geographic distances were log-transformed to reduce the impact of the largest distances. For the environmental dataset we considered elevation, four soil factors that were important in the NMS ordination (i.e., POM, pH, Pppm, and PBSK), and five uncorrelated (r2 < 0.70) climate variables (i.e., precipitation in the warmest quarter, precipitation seasonality, mean temperature of the coldest quarter, mean temperature of the driest quarter, and mean temperature of the wettest quarter) sampled from 30-s layers of the WorldClim data set (Fick and Hijmans, 2017) for all locations considered in this study. The environmental dataset was subjected to principal component analysis (PCA) using R (R Core Team, 2022). Values for each site along the first two axes, which accounted for 49% of the observed variation, were used to construct an environmental distance matrix based on Euclidean distances in Passage 2 (Rosenberg and Anderson, 2011). Multivariate MMR was conducted using the MMRR script of Wang (2013) in R (R Core Team, 2022) using the explanatory matrixes of geographic distance and environmental distance and the response matrix of genetic distances. Significance was tested using 9,999 permutations.
For dbRDA, the geographic distance matrix was used in a principal coordinates of neighbor matrices (PCNM; Borcard and Legendre, 2002; Borcard et al., 2004) in R (R Core Team, 2022) with default threshold values to generate a set of independent variables reflecting spatial relationships among the populations. The positive PCNM axes were retained and tested as predictors of genetic distance in dbRDA. To test for IBE, we used the first two axes from a principal component analysis (PCA) of the environmental variables, as described above, as predictors of pairwise genetic distances. The explanatory variables were assessed independently in marginal tests and conditioned on geographic distance to account for potential correlation between environmental factors and geography. The dbRDA analyzes were conducted using the capscale () function of the Vegan package (Oksanen et al., 2020) in R (R Core Team, 2022). An analysis of variance was used to evaluate significance of each model. The varpart() function in R (R Core Team, 2022) was used to assess the contribution of each environmental and geographic variables to genetic distances.
3. Results
3.1. Flower morphology
In the k-means cluster analysis, a two-group solution reduced percent variation of within-sum of squares to 29.6%. Subsequent clusters further reduced variation by <10%. The Duda-Hart test indicated that the optimal clustering solution contained more than one group (DHK = 0.3555, alpha = 0.99), and the Calinski-Harabasz index also was greater for two clusters. Thus, two clusters were selected as the optimal solution.
The two-cluster analysis separated populations with significantly different lip and spur lengths, which were correlated among, but not within, groups (Figure 3C). In both groups, spurs were significantly longer (by >20%) than lips, however, one group had 20% longer lips and spurs than did the other group, and thus larger flowers (Figures 3A,B). A comparison of inflorescence size among three populations of small-flowered plants and four populations of large-flowered plants (among three habitats) found that small-flowered plants also had smaller inflorescences (N = 37, mean = 26.95, se = 1.60) than did large-flowered populations (N = 52, mean = 38.85, se = 2.25); nested ANOVA of ln-transformed data: F2,82 = 28.77, p = 0.033. The correspondence between habitats and flower morphology is shown in Figure 2F. The group with smaller flowers comprised populations occurring only in muskeg bog habitat (Figure 2D). The group with larger flowers included all fen, meadow, and anthropogenic habitats, as well as a single muskeg site that occurred at high elevation and is a transition to alpine habitat (Figures 2A–D).
Populations showed strong differentiation in spur length and lip length as PST values were 0.94 (95% CI: 0.930–0.959) for spur length and 0.97 (95% CI: 0.969–0.980) for lip length. These estimates were robust to variation in our selection of the value for c/h2. The critical value of PST, whereby quantitative traits are more strongly reflective of selection than genetic drift, occurred at c/h2 < 0.5 (Supplementary Figure S1).
3.2. Soil chemistry and fertility
Most soils variables differed significantly among habitat groups (Supplementary Table S3). Percent organic matter had the strongest differentiation. It was significantly greater in muskeg (64%) intermediate in fen (37%), and lower (< 10%) in meadow and anthropogenic habitats. Other significant variables (pH, CEC, ppm Ca, and PBS Ca) were greater in anthropogenic habitat and not different among other habitats. Ca was about 400% higher in anthropogenic habitat, where it reached 1783.5 PPM. Though it did not differ significantly (p = 0.115), PBS K tended to be higher in meadow habitat, where it reached 4.9%.
Non-metric Multidimensional Scaling reached a stable solution for ordination of two axes after 88 iterations (Figure 2E). Only CEC and PBS Mg were not significantly correlated with either ordination axis (Supplementary Table S4). On Axis 1, muskeg bog habitat was strongly associated with positive axis scores and highly correlated with increasing POM and PHS, while anthropogenic roadside habitat was strongly associated with negative axis scores and highly correlated with increasing pH and PBS Ca. Meadow habitat was most strongly associated with Axis 2 and greater PBS K, but also tended to be associated with increasing PPM P along Axis 1. Fen habitat was centrally located and intermediate with respect to soil chemistry and nutrients. With MRPP, all habitats had significantly different multivariate distributions, which remained different with anthropogenic habitat excluded from the model (Figure 2E).
3.3. Genetic variation and population structure
Among the 728 inter-locus comparisons, there were six instances of significant genetic disequilibrium identified in three populations. No locus pairs exhibited significant disequilibrium in multiple populations, but one population (i.e., ELO) did have four loci out of equilibrium. Overall, these results suggest that the loci are genetically independent, and that instances of linkage disequilibrium are likely due to demographic factors unique to the affected populations. Seven populations had a deficiency of heterozygotes consistent with deviation from Hardy–Weinberg equilibrium (Table 1). Mean genetic diversity was significantly higher in populations assigned to the large-flowered group than those assigned to the small-flowered group (excluding the four hybrid populations) when considering Na, HO, and HE but not for % P or the inbreeding coefficient (Table 1).
AMOVA assigned most of the observed genetic structure within populations (79–80%), then among populations (15–16%), and between the small and large-flowered groups (6%) or among the habitats (5%; Table 2). All F-statistics were significant (p < 0.01). The optimal number of groups, based on Bayesian analysis in STRUCTURE of the genetic variation, was two clusters (Figure 4A). The two clusters primarily align with large and small-flowered populations, although samples from four small-flowered populations (i.e., PBMK, CL, BM, and DM) were placed in the cluster with large-flowered populations. Most individuals (80%) were assigned to a single cluster with Q-matrix values >0.95.
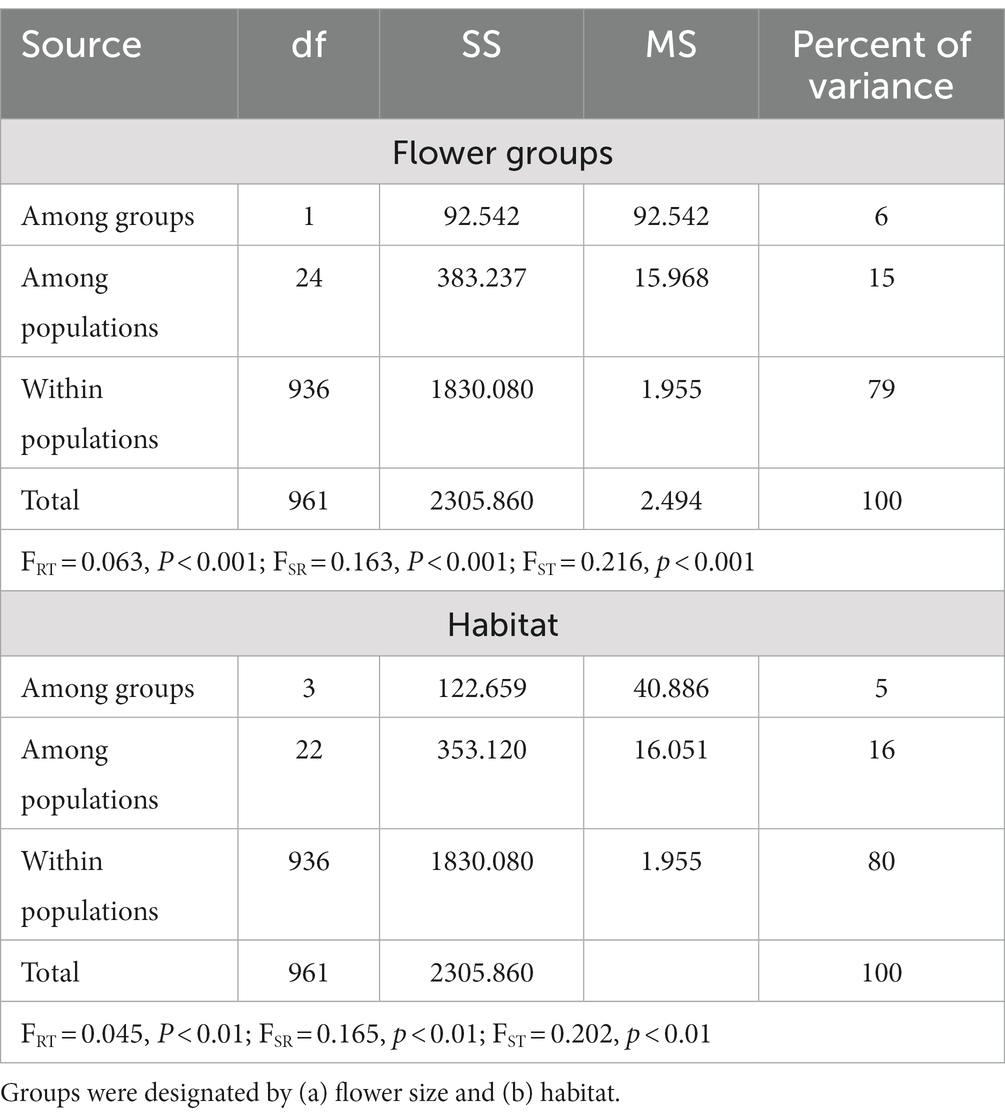
Table 2. Results from an analysis of molecular variance based on allelic diversity among populations of Platanthera dilatata from Southeast Alaska.
Our analyzes indicated admixture between the phenotypic groups. This was most extensive for the four small-flowered populations that are genetically-like large-flowered populations as all but seven samples from these populations were assigned to this cluster with Q-matrix scores >0.9 by STRUCTURE, but other instances of admixture were also noted for most populations (Figure 4A). In fact, based on a cut-off of 0.9 in Q-matrix scores from STRUCTURE, all but four populations (i.e., HA, HMA, HMM, and ML) contained at least one admixed individual, resulting in ca. 10% of all individuals assigned as admixed. NewHybrids produced nearly identical results to those from STRUCTURE (Figure 4B), although seven populations were not predicted to contain admixed individuals by this analysis. NewHybrids also estimated more extensive hybridization in the small-flowered IR population compared to STRUCTURE, which identified admixed genotypes in only four individuals in this population.
Further support of two genetically divergent groups was found in the estimated immigration rates, which were extremely low between large-flowered and small-flowered populations. Both BayesAss and Geneclass suggested that at least 97% of the individuals in each of these groups originated within their assigned group (Supplementary Table S5). BayesAss, but not Geneclass, indicated strongly unidirectional immigration from the large-flowered group into the hybrid populations. Only a low level of immigration was detected into the hybrid group from the small-flowered group, even though these populations share a common habitat type and are morphologically similar. Additionally, low levels of recent immigration were detected between large-flowered and small-flowered groups and from the hybrid group by GeneClass.
Landscape genetic analyzes indicated that at the regional level, both geographic distance and environmental factors are predictive of genetic structure. In MMR analysis at this scale, the multivariate model placed geographic distance as the strongest factor, with environmental distance slightly less important but still significant. The overall r-square for this model is 0.27, but it is significant (p = 0.0002). Comparable results were obtained with dbRDA, with geographic distance explaining slightly more variation than environmental factors when considered independently (Table 3). Despite a correlation between geographic distance and environmental distance, environmental factors do remain significant in the dbRDA conditioned on geographic distance. At a smaller local scale, geographic distance was not a significant factor explaining genetic structure among populations, but environmental factors were in both MMRR and dbRDA (Table 3; Supplementary Figure S3).
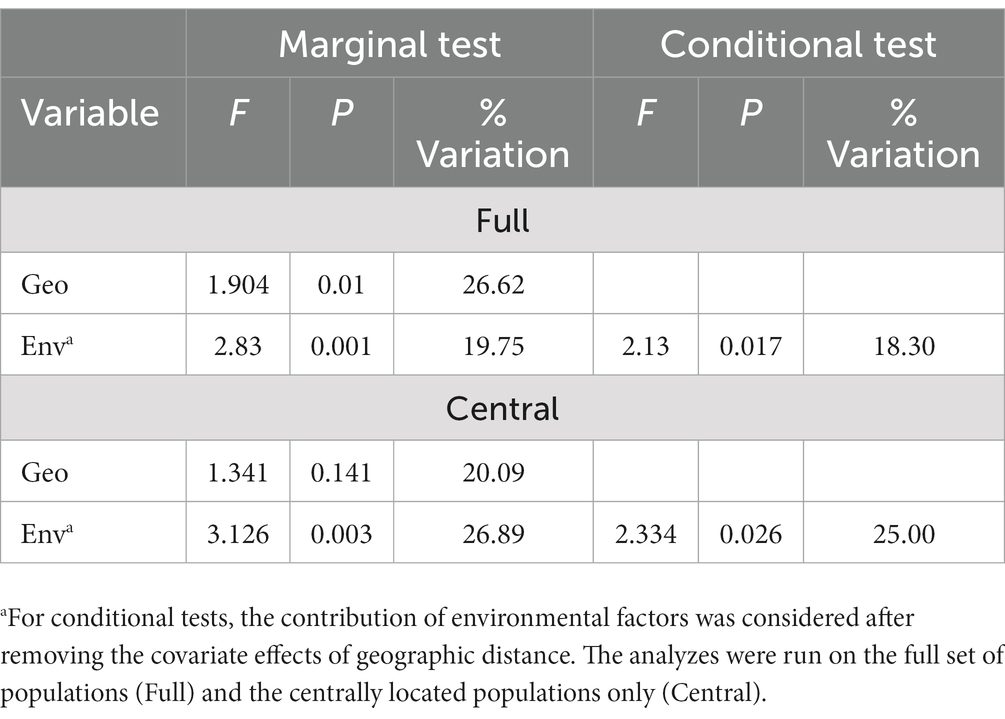
Table 3. Results from distance-based Redundancy Analyzes (dbRDA) testing the effects of geographic distance (Geo) and environmental factors (Env) on genetic distance among the populations of Platanthera dilatata surveyed in Southeast Alaska.
4. Discussion
No previous assessment of P. dilatata has concurrently examined genetic structure, morphological diversity, and habitat characteristics in populations with a shared regional geography. Examination of populations at this scale provided greater understanding of intraspecific variation for this species and of the environmental factors that may influence morphological and genetic variation. We note several novel results: (1) flower phenotypes are strongly associated with habitats, (2) there is a deep genetic divergence between small-flowered and large-flowered forms, (3) nevertheless, admixture has occurred between populations harboring different phenotypes and introgression is deeply rooted in some populations, and (4) whereas IBD and IBE both contribute to significant population genetic structure at regional scales, among closely spaced populations, environmental factors are stronger determinants of genetic structure.
4.1. Phenotypic variation in relation to environmental factors
Platanthera dilatata has long been recognized as a morphologically variable species (Luer, 1975; Sheviak, 2002). Within Southeast Alaska, P. dilatata populations have variable flower morphology, yet the phenotypes are partitioned by habitat (Figures 1, 2). Plants with inflorescences containing fewer flowers and flowers with shorter lips and spurs have a narrow habitat niche as they are restricted to muskeg bogs, whereas plants with larger inflorescences and flowers with longer lips and spurs have a broader habitat niche, occurring across a habitat gradient that is exclusive of muskeg bogs except at extremely high elevations.
The high estimates of PST for lip and spur lengths relative to FST is suggestive of divergent selection on flower morphology. When morphological variation is partitionable across populations, selection by pollinators has been documented as an underlying mechanism promoting its retention in Platanthera bifolia (Boberg et al., 2014), Disa draconis Sw. (Johnson and Steiner, 1997), and Gymnadenia odoratissima (L.) Rich. (Sun et al., 2014). Though flowers of P. dilatata fit the primitive “settling moth” syndrome characteristic of Noctuidae moths (Hapeman and Inoue, 1997), regional differences in primary and secondary pollinators readily occur. This variation includes seven Noctuidae species and a Hesperiidae butterfly in Newfoundland, Canada (Boland, 1993), a Noctuidae species in Oregon, United States (Larson, 1992), three Bombus Latreille bumblebee species, a Noctuidae, and a Nymphalidae butterfly in British Columbia, Canada (Van der Voort et al., 2022), and three Noctuidae, a Sphingidae moth, and a butterfly in Southeast Alaska (this study; Bowles and Armstrong, 2021). Such variation in primary and secondary pollinator types and abundance could drive selection for variable flower morphology at regional and local scales.
Nectar spur length in Platanthera determines whether an insect can access nectar and how pollinia are attached and pollen are deposited on the stigma, and selection should shift spur length toward pollinators that maximize fitness (Boberg et al., 2014). Such selection could be rapid if pollinators remain constant and gene flow from other populations is infrequent. In this study, Noctuidae moths were the most commonly observed pollinators on both the small- and large-flowered forms at all elevations. The hawkmoth Hyles gallii (Sphingidae) was observed only on large-flowered plants at low elevations and appeared to carry greater pollen loads than did Noctuidae pollinators. Because hawkmoths have a longer proboscis (ca. 25 mm; Miller, 1997) than Noctuidae moths (< 11 mm; Zenker et al., 2011; Zhang et al., 2021), they may be more effective pollinators for longer-spurred orchids than are Noctuidae (Tao et al., 2018). Based on iNaturalist observations (n = 27), the median elevation at which H. gallii has been observed in SE Alaska is less than 50 m (range 1–285 m), much lower than the median elevation (215 m, range 10–600 m) of muskegs in the study area. If H. gallii is prevalent in non-muskeg habits, then selection for longer spurs is expected to drive flower morphology to match the most efficient pollinator (Johnson and Steiner, 1997; Boberg et al., 2014; Sun et al., 2014) despite counter-selection from the more frequent Noctuidae moth pollinators across the study area. By contrast, if plants in muskeg bogs are visited only by shorter tongued Noctuidae species, then selection is expected to drive flowers toward shorter spurs and lead to adaptation of those plants to muskeg habitat. Absence or rarity of Sphingidae moths at higher elevations could limit gene flow across an altitudinal gradient. Further work is needed to characterize pollinators and their selection for flower size and nectar spur length for P. dilatata across its distribution to test this hypothesis of localized selection.
A strong correspondence between phenotype and soil conditions has not been previously noted for this species and suggests the possibility that other factors might also influence phenotypic variation. While phenotypic plasticity often underlies phenotypic variation that aligns with environmental differences (Schlichting, 1986), it has rarely been documented for flower traits (Sultan, 2000; Pélabon et al., 2011), and the alpine population HMA also occurs in a muskeg-like habitat at high elevation yet retains a large-flowered phenotype similar to populations at lower elevations. This suggests that flower size is not a plastic trait, and that soil fertility does not influence flower size. An alternative hypothesis is that the small-flowered phenotype is a stress tolerant poor competitor that is adapted to the skewed soil chemistry of muskeg habitat. Although bog habitats may appear to have adequate base concentrations, most nutrients are bound in OM in peat soils and are not available for plant uptake, especially under acidic conditions (Verhoeven, 1986; Vitt and Chee, 1990). Indeed PHS, which was relatively high in muskeg (Figure 2E), was negatively correlated with CEC (r = −0.4046, p = 0.0403). Mycorrhizal fungi may increase efficiency of mineral uptake in peat soils and could provide a competitive advantage as well as a favorable germination site for orchids in these habitats (Rasmussen, 1995). Unlike Ceratobasidium, which can utilize N from both ammonium and nitrate, Tulasnella requires ammonium as a N source (Fochi et al., 2017). Ammonium is the predominant form of N in dissolved nutrient concentrations in bogs and fens our study area, but it is much more highly concentrated in fens (Fellman et al., 2008). This could explain the greater presence of Tulasnella in fens in our study area and might suggest that the larger phenotype uses these fungi. However, it is unknown whether obligate relationships exist between the large and small P. dilatata phenotypes and different fungal species. Other habitats associated with the large-flowered phenotype also tended to have greater fertility and association with the Tulasnella fungus. If these mycorrhizal fungi occur in different environments because of nutrient availability (Fochi et al., 2017; Thixton et al., 2020) and have strong relationships with P. dilatata phenotypes, then they could reinforce their habitat selection. Given the importance of mycorrhizae to orchid life history, research to understand the potential for mycorrhizae to impose selection on orchid phenotypes would also be useful.
4.2. Concordance between morphological differentiation and genetic differentiation
Whereas previous studies identified significant morphological and genetic divergence in P. dilatata at broad geographic scales, they have not previously correlated genetic differentiation with phenotypic divisions (Wallace, 2003a; Adhikari and Wallace, 2014). The allelic variation reported in this study provides the strongest indication yet that a shared evolutionary history connects phenotypically similar populations and distinguishes these from phenotypically dissimilar populations. The genetic dataset has also revealed some major differences between the phenotypic groups. For example, small-flowered populations that are not strongly admixed have lower allelic variation and heterozygosity and greater population differentiation compared to large-flowered populations. These results suggest greater isolation, which could occur due to lower density of populations and reduced gene flow over widely spaced muskeg habitats, as non-forest habitats cover only 17% of the landscape in Southeast Alaska.
The deep genetic divergence in phenotypic groups may also reflect historical divergence, perhaps associated with Pleistocene refugia in this area (Carrara et al., 2007; Marr et al., 2008; Geml et al., 2010; Shafer et al., 2010). The Alexander Archipelago of Southeast Alaska contains more than 2,000 individual islands and stretches across 16,000 km of coastline (Carrara et al., 2007), giving the region’s extensive topographical and geographical complexity that undoubtedly influences gene flow and population isolation. The impact of the last glacial period was heterogenous across Southeast Alaska, with numerous refugia proposed along the western edges of the Alexander Archipelago and exposed areas of the continental shelf (Carrara et al., 2007). More recently, successional changes in coastal vegetation were associated with uplift following the Little Ice Age between 1770–1790 (Motyka, 2003). With isostatic changes continuing to occur, extensive uplift meadows may have rapidly developed in the area (e.g., Auffret and Cousins, 2018). While these habitats could represent an earlier successional stage relative to muskeg, they may harbor older genetic lineages if they persisted during glaciation. Phylogeographic studies would be useful to understand the evolutionary and historical connections among populations in the study area and the presence of multiple refugia within the Alexander Archipelago or dispersal from other refugia in northwestern North America.
4.3. Hybridization between divergent phenotypes
While most populations we studied have at least one admixed sample (Figures 4A,B), the extensive and cryptic introgression that characterized several small-flowered populations was unexpected as these populations are morphologically similar to other small-flowered populations sampled in muskeg bogs. While other studies have reported cryptic introgression, for example in Protea L. (Mitchell and Holsinger, 2018) and in Lomatia R. Br. (McIntosh et al., 2014), these studies also found hybrids with both genetic and morphological intermediacy. In our study, morphologically intermediate populations were not readily detected when averaged across samples. Nevertheless, at the individual level, statistical outliers representing larger flowers were observed in muskeg populations and could indicate admixed individuals due to pollinator-mediated gene flow from large-flowered populations (M.L. Bowles, unpublished data).
Phillips et al. (2012) suggested that seed dispersal between populations at regional scales (e.g., < 250 km) is likely common, but gene flow might be more limited at larger geographic scales. Our analyzes indicated that genetic distance among populations reflects isolation by distance at large scales but not at small scales, consistent with the patterns described by Phillips et al. (2012). The low incidence of admixture detected by STRUCUTRE and NewHybrids in the four hybrid populations suggests that introgression may have occurred swiftly and early in their history. Given the commonality of small-flowered populations in muskeg, we suggest it is more likely that these small-flowered populations were colonized from other small-flowered populations, rather than large-flowered populations. If gene flow occurred early in their establishment and was not maladaptive, then it would persist in the growing population. The alternative explanation for the genetic similarity of hybrid populations to large-flowered populations, that they originated from large-flowered colonizers of muskeg bogs that subsequently evolved smaller flowers, seems less likely in the absence of a functional basis for variation in flower size due to climate or soils.
The contemporary presence of large-flowered populations in more diverse habitats may indicate greater historical abundance across the landscape compared to small-flowered populations and muskeg habitats (Auffret and Cousins, 2018). To produce extensive and cryptic introgression in the small-flowered populations, large-flowered plants would need to be nearby and accessible to pollinators to facilitate repeated introgression and backcrossing with newly colonized small-flowered populations in the area. All but one of the hybrid populations sampled (GI) are located within 250 km of a large-flowered population in the study area, which is consistent with the maximum distance for seed dispersal that was suggested by Phillips et al. (2012).
While seed dispersal may have led to colonization of small-flowered forms in areas containing large-flowered populations, pollinators must be the agents of gene flow leading to introgression. Different spur lengths are expected to reduce cross-pollination between phenotypes, but not to prevent it. Because hawkmoths are strong fliers that may easily cross between habitats, gene flow may be more easily mediated from larger flowers to smaller flowers. Noctuidae moths can also transport pollen long distances (Hendrix et al., 1987), but this may be more likely during migration. Whereas pollinaria adhere to the proboscis of both pollinators, they would adhere closer to the eyes of Noctuidae moths visiting longer-spurred flowers of P. dilatata (Figure 3) than for hawkmoths. In short-spurred flowers, positioning of pollinaria closer to the proboscis tip for hawkmoths might facilitate contact with the column leading to successful cross-pollination. Thus, even occasional visits to these populations by hawkmoths carrying pollinia from long-spurred populations could have long-lasting impacts because an orchid pollinarium contains enough pollen to fertilize thousands of ovules. Many inter-specific hybrids are known within Platanthera (Wallace, 2003b; Brown, 2004; Alcantara et al., 2006; Brown et al., 2008; Wettewa et al., 2020; Hartvig et al., 2022), indicating that spur length does not consistently prevent cross-pollination and pollinators readily move pollen between species.
4.4. Genetic structure and factors influencing gene flow
Factors determining genetic structure may vary across the landscape and across spatial scales. We expected that across the extent of the study area, which is nearly 500 km, geographic distance would be important because of limited gene flow. By contrast, within the areas where seed dispersal can occur over shorter distances or pollinators are capable of flying between sites, environmental factors are expected to be more important determinants of genetic structure. In the study area, both elevation and habitat differences might influence gene flow at varying scales. When considering all populations, both geographic distance and habitat (i.e., elevation, soils, and climate) are significant predictors of genetic distance. Nevertheless, consistent with our hypothesis, geographic distance explained more of the observed variation in genetic distances than environmental factors did (Table 3; Supplementary Figure S2). The extensive topographic variation of Southeast Alaska could impose barriers to gene flow if orchid seeds are not able to move between mountains and the orchids are adapted to soil types or interact with other organisms, e.g., mycorrhizae or pollinators, that are themselves restricted by environmental factors.
At a smaller spatial scale encompassing the central populations, ca. 50 km north-to-south, we found that geographic distance was not predictive of genetic distance. This suggests that seeds and/or pollinators readily move about populations at this scale. By contrast, environmental factors were found to significantly influence genetic distance, indicating the presence of habitat barriers to successful movement. This is expected if the small and large-flowered populations are adapted to different habitats or are limited by symbiotic partners that are themselves adapted to these differing habitats as noted for larger geographic scales. The difference in the pattern of genetic structure across spatial scales demonstrates a complexity of landscapes in how they influence population connectivity. While these results suggest that orchid seeds and or pollen may readily move about, we are unable to discern the relative importance of these factors for gene flow. Additionally, the complex history of this region has undoubtedly impacted the patterns observed today, but without a phylogeographic context we also cannot account for how historical factors have influenced the genetic structure of P. dilatata in this region. Future studies that test hypotheses about the locations of glacial refugia are important foci for future studies of this species across western North America.
4.5. Taxonomic implications
With four habitats and two phenotypic groups, eight unique combinations could characterize P. dilatata in Southeast Alaska. Yet, we found only five of these combinations as small-flowered plants are restricted to muskeg bogs and large-flowered plants are rarely found in these habitats. The deep genetic divergence between groups of populations supports the inference that there are multiple evolutionary lineages in the study area. Nevertheless, placing these lineages within the current taxonomy of this species is difficult. Plants from Southeast Alaska have a mean spur length that exceeds lip length (Figure 3A), which would place all of them in var. leucostachys. Yet, the range of spur and lip lengths measured on plants in the study area (spurs: 6.5–9 mm for small-flowered and 9–12 mm for large-flowered; lips: 5.25–7.25 mm for small-flowered and 7–9.5 mm for large-flowered) encompasses or exceeds the lengths described for the three varieties by previous authors (Sheviak, 2002; Wallace, 2003a; Sears, 2008; Adhikari and Wallace, 2014; Supplementary Table S6) but lie primarily within vars. dilatata and leucostachys. These morphological measurements are not consistent with varietal circumscriptions by Sheviak (2002) or the suggestion that three varieties occur in Southeast Alaska.
An additional consideration in metric comparisons among studies is the presence of artifacts associated with measurement methods. It is difficult to measure nectar spur length because they are falcate; thus, intact spurs will appear shorter than flattened spurs. The source of the flowers for measurement (i.e., fresh, dried, or spirit-preserved) also influences measurements as preservation can introduce distortions (Bateman et al., 2013), and spur length has been reported to increase over the flowering season in individual plants (Sheviak, 2002).
Taxonomic revision of P. dilatata is warranted because the division of three varieties is inadequate to explain the variation encountered in many areas of the distribution. Furthermore, ecological or pollination studies should explicitly include morphological measurements of samples, rather than simply giving a varietal designation, as this would provide more transparency in morphological variability of studied populations. Such data would also contribute to a greater ability to synthesize variation at local scales, which is needed to evaluate the cohesiveness of P. dilatata populations and to quantify the geographic scale of discord in morphological and genetic divergence.
5. Conclusion
By studying genetic, morphological and habitat diversity at the regional scale in P. dilatata we have identified novel patterns, yet consistency with previous studies on this species. Strong genetic divergence between flower groups suggests the presence of distinct evolutionary lineages within Southeast Alaska. Evidence of bidirectional gene flow between flower forms, nevertheless, indicates that they are not reproductively isolated. Although orchid seeds are considered capable of long-distance gene flow, our results indicate that gene flow most readily occurs only at shorter geographic distances, perhaps <50 km. Environmental factors also contribute significantly to genetic structure and could reflect adaptations of the orchids themselves to these habitats or adaptations of their symbiotic partners. Further studies are needed to understand the evolution of adaptation in this species and its phylogeographic history. Platanthera dilatata should be considered a model system for understanding the process of diversification in temperate orchids.
Data availability statement
The original contributions presented in the study are included in the article/Supplementary files, further inquiries can be directed to the corresponding author.
Author contributions
LW and MB conceived of the study, collected data, wrote the manuscript, and critically reviewed the manuscript. All authors contributed to the article and approved the submitted version.
Funding
Funding was provided through the Robert Stiffler Endowment through Old Dominion University.
Acknowledgments
We thank Naghmeh Moghimi for aid in extracting DNA from leaf samples, Robert Armstrong, Matt Goff, Judy Hall Jacobson, and Kris Larson for aid in field sampling, Elizabeth Esselman for review and for sharing data on mycorrhizal isolates from the studied species, and three reviewers for comments that improved the manuscript. Collection permits were graciously provided by the US Forest Service to access sites within the Tongass National Forest. The herbaria of the Juneau Botanical Club located at the Alaska State Museum, US Forest Service Forestry Research Lab (Juneau, AK), and the University of Alaska contributed digitized herbarium records through ARCTOS that were helpful in this study.
Conflict of interest
The authors declare that the research was conducted in the absence of any commercial or financial relationships that could be construed as a potential conflict of interest.
Publisher’s note
All claims expressed in this article are solely those of the authors and do not necessarily represent those of their affiliated organizations, or those of the publisher, the editors and the reviewers. Any product that may be evaluated in this article, or claim that may be made by its manufacturer, is not guaranteed or endorsed by the publisher.
Supplementary material
The Supplementary material for this article can be found online at: https://www.frontiersin.org/articles/10.3389/fevo.2023.1085938/full#supplementary-material
References
Adhikari, B., and Wallace, L. E. (2014). Does the Platanthera dilatata (Orchidaceae) complex contain cryptic species or continuously variable populations? Plant Syst. Evol. 300, 1465–1476. doi: 10.1007/s00606-013-0974-8
Alcantara, S., Semir, J., and Solferini, V. N. (2006). Low genetic structure in an epiphytic Orchidaceae (Oncidium hookeri) in the Atlantic rainforest of South-Eastern Brazil. Ann. Bot. 98, 1207–1213. doi: 10.1093/aob/mcl202
Andersen, H. E.. (1955). Climate in Southeast Alaska in Relation to Tree Growth. Station Paper No. 3, Alaska Forest Research Center, Juneau, Alaska.
Anderson, E. C., and Thompson, E. A. (2002). A model-based method for identifying species hybrids using Multilocus genetic data. Genetics 160, 1217–1229. doi: 10.1093/genetics/160.3.1217
Andriamihaja, C. F., Ramarosandratana, A. V., Grisoni, M., Jeannoda, V. H., and Besse, P. (2021). Drivers of population divergence and species differentiation in a recent group of indigenous orchids (Vanilla spp.) in Madagascar. Ecol. Evol. 11, 2681–2700. doi: 10.1002/ece3.7224
Arditti, J., and Ghani, A. K. A. (2000). Numerical and physical properties of orchid seeds and their biological implications. New Phytol. 146:569.
Auffret, A. G., and Cousins, S. A. O. (2018). Land uplift creates important meadow habitat and a potential original niche for grassland species. Proc. R. Soc. B 285:20172349. doi: 10.1098/rspb.2017.2349
Balkenhol, N., Waits, L. P., and Dezzani, R. J. (2009). Statistical approaches in landscape genetics: an evaluation of methods for linking landscape and genetic data. Ecography 32, 818–830. doi: 10.1111/j.1600-0587.2009.05807.x
Bateman, R. M., Rudall, P. J., and Moura, M. (2013). Systematic revision of Platanthera in the Azorean archipelago: not one but three species, including arguably Europe’s rarest orchid. PeerJ 1:e218. doi: 10.7717/peerj.218
Bateman, R. M., and Sexton, R. (2008). Is spur length of Platanthera species in the British Isles adaptively optimized or an evolutionary red herring? Watsonia 28, 1–21.
Bienek, P. A., Bhatt, U. S., Thoman, R. L., Angeloff, H., Partin, J., Papineau, J., et al. (2012). Climate divisions for Alaska based on objective methods. J. Appl. Meteorol. Climatol. 51, 1276–1289. doi: 10.1175/JAMC-D-11-0168.1
Blondaeu Da Silva, S. B., and Da Silva, A. (2018). Pstat: An R package to assess population differentiation in phenotypic traits. R J. 10, 447–454. doi: 10.32614/RJ-2018-010
Boberg, E., Alexandersson, R., Jonsson, M., Maad, J., Ågren, J., and Nilsson, L. A. (2014). Pollinator shifts and the evolution of spur length in the moth-pollinated orchid Platanthera bifolia. Ann. Bot. 113, 267–275. doi: 10.1093/aob/mct217
Boland, J. T. (1993). The Floral Biology of Platanthera dilatata (Pursh) Lindl. (Orchidaceae) [M.S. Thesis]. St. John’s (Newfoundland, Canada): Memorial University.
Borcard, D., and Legendre, P. (2002). All-scale spatial analysis of ecological data by means of principal coordinates of neighbour matrices. Ecol. Model. 153, 51–68. doi: 10.1016/S0304-3800(01)00501-4
Borcard, D., Legendre, P., Avois-Jacquet, C., and Tuomisto, H. (2004). Dissecting the spatial structure of ecological data at multiple scales. Ecology 85, 1826–1832. doi: 10.1890/03-3111
Bowles, M. L., and Armstrong, R. H. (2021). Pollination, pilfering, and predation in an orchid pollinator network in the Juneau area of Southeast Alaska. Newslett. Alaska Entomol. Soc. 14, 12–25.
Brommer, J. E. (2011). Whither Pst? The approximation of Qst by Pst in evolutionary and conservation biology. J. Evol. Biol. 24, 1160–1168. doi: 10.1111/j.1420-9101.2011.02268.x
Brown, P. M. (2004). Understanding Platanthera chapmanii (Orchidaceae), its origins and hybrids. Sida 21, 853–859.
Brown, P. M., Smith, C., and Shriver, J. S. (2008). A new species of fringed Platanthera from the Central Appalachian Mountains of Eastern North America. N. Am. Native Orchid J. 14, 238–254.
Calinski, R. B., and Harabasz, J. (1974). A dendrite method for cluster analysis. Commun. Stat. 3, 1–27.
Carlsson, J. (2008). Effects of microsatellite null alleles on assignment testing. J. Hered. 99, 616–623. doi: 10.1093/jhered/esn048
Carrara, P. E., Ager, T. A., and Baichtal, J. F. (2007). Possible refugia in the Alexander Archipelago of southeastern Alaska during the late Wisconsin glaciation. Can. J. Earth Sci. 44, 229–244. doi: 10.1139/e06-081
Cavalli-Sforza, L. L., and Edwards, A. W. F. (1967). Phylogenetic analysis–models and estimation procedures. Am. J. Hum. Genet. 19, 233–257.
Chapuis, M. P., and Estoup, A. (2007). Microsatellite null alleles and estimation of population differentiation. Molec. Biol. Evol. 24, 621–631. doi: 10.1093/molbev/msl191
Chung, M. Y., Nason, J. D., and Chung, M. G. (2004). Spatial genetic structure in populations of the terrestrial orchid Cephalanthera longibracteata (Orchidaceae). Am. J. Bot. 91, 52–57. doi: 10.3732/ajb.91.1.52
Chybicki, I. J., and Burczyk, J. (2009). Simultaneous estimation of null alleles and inbreeding coefficients. J. Hered. 100, 106–113. doi: 10.1093/jhered/esn088
Culley, T. M., Stamper, T. I., Stokes, R. L., Brzyski, J. R., Hardiman, N. A., Klooster, M. R., et al. (2013). An efficient technique for primer development and application that integrates fluorescent labeling and multiplex PCR. Appl. Plant Sci. 1:1300027. doi: 10.3732/apps.1300027
D’Amore, D. V., Edwards, R. T., Herendeen, P. A., Hood, E., and Fellman, J. B. (2015). Dissolved organic carbon fluxes from hydropedologic units in Alaskan coastal temperate rainforest watersheds. Soil Sci. Soc. Am. J. 79, 378–388. doi: 10.2136/sssaj2014.09.0380
D’Amore, D. V., Fellman, J. B., Edwards, R. T., and Hood, E. (2010). Controls on dissolved organic matter concentrations in soils and streams from a forested wetland and sloping bog in Southeast Alaska. Ecohydrology 3, 249–261. doi: 10.1002/eco.101
Dakin, E. E., and Avise, J. C. (2004). Microsatellite null alleles in parentage analysis. Heredity 93, 504–509. doi: 10.1038/sj.hdy.6800545
Earl, D. A., and vonHoldt, B. M. (2012). Structure harvester: a website and program for visualizing structure output and implementing the Evanno method, version 2.3.4. Conservation Genet. Resour. 4, 359–361. doi: 10.1007/s12686-011-9548-7
Evanno, G., Regnaut, S., and Goudet, J. (2005). Detecting the number of clusters of individuals using the software STRUCTURE: a simulation study. Molec. Ecol. 14, 2611–2620. doi: 10.1111/j.1365-294X.2005.02553.x
Excoffier, L., Smouse, P. E., and Quattro, J. M. (1992). Analysis of molecular variance inferred from metric distances among DNA haplotypes: application to human mitochondrial DNA restriction data. Genetics 131, 479–491. doi: 10.1093/genetics/131.2.479
Fellman, J. V., and D’Amore, D. V. (2007). Nitrogen and phosphorus mineralization in three wetland types in Southeast Alaska, USA. Wetlands 27, 44–53. doi: 10.1672/0277-5212(2007)27[44:NAPMIT]2.0.CO;2
Fellman, J. B., D’Amore, D. V., Hood, E., and Boone, R. D. (2008). Fluorescence characteristics and biodegradability of dissolved organic matter in forest and wetland soils from coastal temperate watersheds in Southeast Alaska. Biogeochemistry 88, 169–184. doi: 10.1007/s10533-008-9203-x
Fick, S. E., and Hijmans, R. J. (2017). WorldClim 2: new 1km spatial resolution climate surfaces for global land areas. Int. J. Climatol. 37, 4302–4315. doi: 10.1002/joc.5086
Fochi, V., Chitarra, W., Kohler, A., Voyron, S., Singan, V. R., Lindquist, E. A., et al. (2017). Fungal and plant gene expression in the Tulasnella calospora–Serapias vomeracea symbiosis provides clues about nitrogen pathways in orchid mycorrhizas. New Phytol. 213, 365–379. doi: 10.1111/nph.14279
Geml, J., Tulloss, R. E., Laursen, G. A., Sazanoa, N. A., and Taylor, D. L. (2010). “Ectomycorrhizal Basidiomycete, Amanita muscaria, suggest forest refugia in Alaska during the Last Glacial Maximum” in Relict Species. eds. J. C. Habel and T. Assmann (Berlin: Springer)
Hapeman, J. R., and Inoue, K. (1997). “Plant-pollinator interactions and floral radiation in Platanthera (Orchidaceae)” in Molecular Evolution and Adaptive Radiation. eds. T. J. Givnish and K. J. Sytsma (Cambridge, UK: Cambridge University Press), 433–454.
Hartvig, I., Evans, S., Ligon, J., Eserman, L., Coffey, E., and McCormick, M. (2022). Quantitative morphological variation in the orange and white fringed orchids (Platanthera) in the eastern U.S. Orchids 91, 532–539.
Hendrix, W. H. III, Mueller, T. F., Phillips, J. R., and Davis, O. K. (1987). Pollen as an indicator of long-distance movement of Heliothis zea (Lepidoptera: Noctuidae). Environ. Entomol. 16, 1148–1151. doi: 10.1093/ee/16.5.1148
Hijmans, R. J., Karney, C., Williams, E., and Vennes, C. (2021). Geosphere: Spherical Trigonometry. R Package Version 1.5–14. Available at: https://CRAN.R-project.org/package=geosphere (Accessed October 26, 2022).
Horton, M. L.. (2011). Recommended soil testing procedures for the northeastern United States. Revised Third Edition Northeastern Regional Publication No. 493. Agricultural Experiment Stations of Connecticut, Delaware, Maine, Maryland, Massachusetts, New Hampshire, New Jersey, New York, Pennsylvania, Rhode Island, Vermont, and West Virginia.
Jakobsson, M., and Rosenberg, N. A. (2007). CLUMPP: a cluster matching and permutation program for dealing with label switching and multimodality in analysis of population structure. Bioinformatics 23, 1801–1806. doi: 10.1093/bioinformatics/btm233
Johnson, S. D., and Steiner, K. E. (1997). Long-tongued fly pollination and evolution of floral spur length in the Disa draconis complex (Orchidaceae). Evolution 51, 45–53. doi: 10.2307/2410959
Kahl, S. M., Kappel, C., Joshi, J., and Lenhard, M. (2021). Phylogeography of a widely distributed plant species reveals cryptic genetic lineages with parallel phenotypic responses to warming and drought conditions. Ecol. Evol. 11, 13986–14002. doi: 10.1002/ece3.8103
Kierepka, E. M., and Latch, E. K. (2015). Performance of partial statistics in individual-based landscape genetics. Mol. Ecol. Resour. 15, 512–525. doi: 10.1111/1755-0998.12332
Kirchoff, M., Smith, M., and Walker, N. (2016). “Biological setting: land cover and forest vegetation” in Ecological Atlas of Southeast Alaska. ed. M. A. Smith (Alaska: Audubon), 44–50.
Larson, R. J. (1992). Pollination of Platanthera dilatata var. dilatata in Oregon by the noctuid moth Discestra oregonica. Madrono 39, 236–237.
Legendre, P., and Anderson, M. J. (1999). Distance-based redundancy analysis: testing multispecies responses in multifactorial ecological experiments. Ecol. Monogr. 69, 1–24. doi: 10.1890/0012-9615(1999)069[0001:DBRATM]2.0.CO;2
Liu, R., Wang, H., Yang, J. B., Corlett, R. T., Randle, C. P., Li, D. Z., et al. (2022). Cryptic species diversification of the Pedicularis siphonantha complex (Orobanchaceae) in the mountains of Southwest China since the Pliocene. Front. Plant Sci. 13:811206. doi: 10.3389/fpls.2022.811206
Luer, C. A.. (1975). The Native Orchids of the United States and Canada, Excluding Florida. New York: Botanical Garden.
Marr, K. L., Allen, G. A., and Hebda, R. J. (2008). Refugia in the Cordilleran ice sheet of western North America: chloroplast DNA diversity in the Arctic–alpine plant Oxyria digyna. J. Biogeogr. 35, 1323–1334. doi: 10.1111/j.1365-2699.2007.01879.x
Mathewes, R. W. (1985). “Paleobotanical evidence for climatic change in southern British Columbia during late-glacial and Holocene time” in Climatic Change in Canada 5: Critical Periods in the Quaternary Climatic History of Northern North America. ed. C. R. Harington, vol. 55 (Ottawa, Canada: National Museums of Canada, National Museum of Natural Sciences, Syllogeus Series), 397–442.
McCune, B., and Mefford, M. J.. (2011). PC-ORD. Multivariate Analysis of Ecological Data. Version 6.08. Gleneden Beach, Oregon: MjM Software Design.
McIntosh, E. J., Rossetto, M., Weston, P. H., and Wardle, G. M. (2014). Maintenance of strong morphological differentiation despite ongoing natural hybridization between sympatric species of Lomatia (Proteaceae). Ann. Bot. 113, 861–872. doi: 10.1093/aob/mct314
Melton, C. (2020). Symbiotic germination of Spiranthes cernua and S. vernalis in Illinois and identification of mycorrhizal fungus associates of Platanthera dilatata in Alaska. [M.S. Thesis]. Edwardsville, IL: Southern Illinois University.
Miller, W. E. (1997). Diversity and evolution of tongue length in hawkmoths (Sphingidae). J. Lepid. Soc. 51, 9–31.
Mitchell, N., and Holsinger, K. E. (2018). Cryptic natural hybridization between two species of Protea. S. Afr. J. Bot. 118, 306–314. doi: 10.1016/j.sajb.2017.12.002
Motyka, R. J. (2003). Little Ice Age subsidence and post Little Ice Age uplift in Juneau, Alaska, inferred from dendrochronology and geomorphology. Quat. Res. 59, 300–309. doi: 10.1016/S0033-5894(03)00032-2
Neiland, B. J. (1971). The forest-bog complex of Southeast Alaska. Vegetatio 22, 1–64. doi: 10.1007/BF01955719
Nobarinezhad, M. H., and Wallace, L. E. (2022). Genetic structure and phenotypic diversity in Chamaecrista fasciculata (Michx.) Greene (Fabaceae) at its range edge. Castanea 87, 129–146. doi: 10.2179/0008-7475.87.1.129
Oksanen, J., Blanchet, F. G., Friendly, M., Kindt, R., Legendre, P., McGlinn, D., et al. (2020). Vegan: Community Ecology Package. R Package Version 2.5–7. https://CRAN.R-project.org/package=vegan/. (Accessed October 26, 2022).
Paetkau, D., Slade, R., Burden, M., and Estoup, A. (2004). Direct, real-time estimation of migration rate using assignment methods: a simulation-based exploration of accuracy and power. Mol. Ecol. 13, 55–65. doi: 10.1046/j.1365-294X.2004.02008.x
Peakall, R., and Smouse, P. E. (2012). GenAlEx 6.5: genetic analysis in Excel. Population genetic software for teaching and research-an update. Bioinformatics 28, 2537–2539. doi: 10.1093/bioinformatics/bts460
Pélabon, C., Armbruster, W. S., and Hansen, T. F. (2011). Experimental evidence for the Berg hypothesis: vegetative traits are more sensitive than pollination traits to environmental variation. Funct. Ecol. 25, 247–257. doi: 10.1111/j.1365-2435.2010.01770.x
Phillips, R. D., Dixon, K. W., and Peakall, R. (2012). Low population genetic differentiation in the Orchidaceae: implications for the diversification of the family. Mol. Ecol. 21, 5208–5220. doi: 10.1111/mec.12036
Pinheiro, F., Dantas-Queiroz, M. V., and Palma-Silva, C. (2018). Plant species complexes as models to understand speciation and evolution: A review of South American studies. CRC Crit. Rev. Plant Sci. 37, 54–80. doi: 10.1080/07352689.2018.1471565
Piry, S., Alapetite, A., Cornuet, J.-M., Paetkau, D., Baudouin, L., and Estoup, A. (2004). GENECLASS2: A software for genetic assignment and first-generation migrant detection. J. Hered. 95, 536–539. doi: 10.1093/jhered/esh074
Pritchard, J. K., Stephens, M., and Donnelly, P. (2000). Inference of population structure using multilocus genotype data. Genetics 155, 945–959. doi: 10.1093/genetics/155.2.945
R Core Team. (2022). R: A Language and Environment for Statistical Computing. Vienna, Austria: R Foundation for Statistical Computing. Available at: http://www.R-project.org/. (Accessed October 26, 2022).
Ramasamy, R. K., Ramasamy, S., Bindroo, B. B., and Naik, V. G. (2014). STRUCTURE PLOT: a program for drawing elegant STRUCTURE bar plots in user friendly interface. SpringerPlus 3:431. doi: 10.1186/2193-1801-3-431
Rannala, B., and Mountain, J. L. (1997). Detecting immigration by using multilocus genotypes. Proc. Natl. Acad. Sci. U. S. A. 94, 9197–9201. doi: 10.1073/pnas.94.17.9197
Rasmussen, H. N. (1995). Terrestrial Orchids: From Seed to Mycotrophic Plant. Cambridge, United Kingdom: Cambridge University Press.
Raymond, M., and Rousset, F. (1995). GENEPOP: population genetics software for exact tests and ecumenicism, version 1.2. J. Hered. 86, 248–249. doi: 10.1093/oxfordjournals.jhered.a111573
Robertson, J. L., and Wyatt, R. (1990). Evidence for pollination ecotypes in the yellow-fringed orchid, Platanthera ciliaris. Evolution 44, 121–133. doi: 10.2307/2409528
Rosenberg, M. S., and Anderson, C. D. (2011). PASSaGE: Pattern analysis, spatial statistics, and geographic exegesis. Version 2. Methods Ecol. Evol. 2, 229–232. doi: 10.1111/j.2041-210X.2010.00081.x
Rousset, F. (2008). Genepop’007: a complete reimplementation of the Genepop software for Windows and Linux. Molec. Ecol. Resour. 8, 103–106. doi: 10.1111/j.1471-8286.2007.01931.x
Schlichting, C. D. (1986). The evolution of phenotypic plasticity in plants. Annu. Rev. Ecol. Syst. 17, 667–693. doi: 10.1146/annurev.es.17.110186.003315
Sears, C. J. (2008). Morphological discrimination of Platanthera aquilonis, P. huronensis, and P. dilatata (Orchidaceae) herbarium specimens. Rhodora 110, 389–405. doi: 10.3119/07-24.1
Shafer, A. B. A., Cullingham, C. I., Côté, S. D., and Coltman, D. W. (2010). Of glaciers and refugia: a decade of study sheds new light on the phylogeography of northwestern North America. Mol. Ecol. 19, 4589–4621. doi: 10.1111/j.1365-294X.2010.04828.x
Sheviak, C. J. (2002). “Platanthera” in Flora of North America: Magnoliophyta: Liliidae: Liliales and Orchidales: Editorial Committee, vol. 26 (New York: University Press), 551–571.
Shulski, M., and Wendler, G. (2007). The Climate of Alaska. Fairbanks, Alaska: University of Alaska Press.
Sultan, S. E. (2000). Phenotypic plasticity for plant development, function, and life history. Trends Plant Sci. 5, 537–542. doi: 10.1016/S1360-1385(00)01797-0
Sun, M., Gross, K., and Schiestl, F. P. (2014). Floral adaptation to local pollinator guilds in a terrestrial orchid. Ann. Bot. 113, 289–300. doi: 10.1093/aob/mct219
Surveswaran, S., Gowda, V., and Sun, M. (2018). Using an integrated approach to identify cryptic species, divergence patterns, and hybrid species in Asian ladies’ tresses orchids (Spiranthes, Orchidaceae). Mol. Phylogenet. Evol. 124, 106–121. doi: 10.1016/j.ympev.2018.02.025
Tao, Z. B., Ren, Z. X., Bernhardt, P., Wang, W. J., Liang, H., Li, H. D., et al. (2018). Nocturnal hawkmoth and noctuid moth pollination of Habenaria limprichtii (Orchidaceae) in sub-alpine meadows of the Yulong Snow Mountain (Yunnan, China). Bot. J. Linn. Soc. 187, 483–498. doi: 10.1093/botlinnean/boy023
Thixton, H. L., Esselman, E. J., Corey, L., and Zettler, L. W. (2020). Further evidence of Ceratobasidium D. P. Rogers (Basidiomycota) serving as the ubiquitous fungal associate of Platanthera leucophaea (Orchidaceae) in the North American tallgrass prairie. Bot. Stud. 61:12. doi: 10.1186/s40529-020-00289-z
Van der Niet, T., Peakall, R., and Johnson, S. D. (2014). Pollinator-driven ecological speciation in plants: new evidence and future perspectives. Ann. Bot. 113, 199–212. doi: 10.1093/aob/mct290
Van der Voort, G. E., Gilmore, S. R., Gorrell, J. C., and Janes, J. K. (2022). Continuous video capture, and pollinia tracking, in Platanthera (Orchidaceae) reveal new insect visitors and potential pollinators. PeerJ. 10:e13191. doi: 10.7717/peerj.13191
Verhoeven, J. T. A. (1986). Nutrient dynamics in minerotrophic peat mires. Aquat. Bot. 25, 117–137. doi: 10.1016/0304-3770(86)90049-5
Vitt, D. H., and Chee, W. L. (1990). The relationships of vegetation to surface water chemistry and peat chemistry in fens of Alberta, Canada. Vegetatio 89, 87–106. doi: 10.1007/BF00032163
Wallace, L. E. (2003a). An evaluation of taxonomic boundaries in Platanthera dilatata (Orchidaceae) based on morphological and molecular variation. Rhodora 105, 322–336.
Wallace, L. E. (2003b). Molecular evidence for allopolyploid speciation and recurrent origins in Platanthera huronensis (Orchidaceae). Int. J. Plant Sci. 164, 907–916. doi: 10.1086/378658
Wang, I. J. (2013). Examining the full effects of landscape heterogeneity on spatial genetic variation: a multiple matrix regression approach for quantifying geographic and ecological isolation. Evolution 67, 3403–3411. doi: 10.1111/evo.12134
Wettewa, E., Bailey, N., and Wallace, L. E. (2020). Comparative analysis of genetic and morphological variation in the Platanthera hyperborea complex (Orchidaceae). Syst. Bot. 45, 767–778. doi: 10.1600/036364420X16033962925303
Wilson, G. A., and Rannala, B. (2003). Bayesian inference of recent migration rates using multilocus genotypes. Genetics 163, 1177–1191. doi: 10.1093/genetics/163.3.1177
Zenker, M. M., Penz, C., de Paris, M., and Specht, A. (2011). Proboscis morphology and its relationship to feeding habits in noctuid moths. J. Insect Sci. 11:42. doi: 10.1673/031.011.0142
Keywords: cryptic divergence, flower variation, genetic structure, gene flow, soils, isolation by distance, isolation by environment, Platanthera dilatata
Citation: Wallace LE and Bowles ML (2023) Floral and genetic divergence across environmental gradients is moderated by inter-population gene flow in Platanthera dilatata (Orchidaceae). Front. Ecol. Evol. 11:1085938. doi: 10.3389/fevo.2023.1085938
Edited by:
Tiiu Kull, Estonian University of Life Sciences, EstoniaReviewed by:
Caroline Turchetto, Federal University of Rio Grande do Sul, BrazilJeremie Benjamin Fant, Chicago Botanic Garden, United States
Kadri Tali, Estonian University of Life Sciences, Estonia
Copyright © 2023 Wallace and Bowles. This is an open-access article distributed under the terms of the Creative Commons Attribution License (CC BY). The use, distribution or reproduction in other forums is permitted, provided the original author(s) and the copyright owner(s) are credited and that the original publication in this journal is cited, in accordance with accepted academic practice. No use, distribution or reproduction is permitted which does not comply with these terms.
*Correspondence: Lisa E. Wallace, bGV3YWxsYWNAb2R1LmVkdQ==