
95% of researchers rate our articles as excellent or good
Learn more about the work of our research integrity team to safeguard the quality of each article we publish.
Find out more
ORIGINAL RESEARCH article
Front. Ecol. Evol. , 18 October 2023
Sec. Ecophysiology
Volume 11 - 2023 | https://doi.org/10.3389/fevo.2023.1046332
 Emma Carrié1,2†
 Isabelle Grechi1,2†
 Frédéric Boudon3,4†Elzbieta Frak5†
 Didier Combes5†
 Frédéric Normand1,2*†
Light is a key factor in plant ecophysiological modeling because of its crucial effects on plant growth and development. However, solar light quantity and quality change with environmental factors such as sky condition and solar elevation. When passing through a tree crown, light is modified by its interaction with the phytoelements, leaves and axes. This leads to a variability of light quantity and quality within the crown, with consequences on light-related processes such as photosynthesis and photomorphogenesis. We evaluated the effects of positional (depth within the crown) and environmental (sky condition, solar elevation) factors on light quantity and quality within the crown of the tropical evergreen mango tree. Functional relationships were modeled between morphogenetically active radiation variables that describe light quality [narrowband red (Rn), narrowband far-red (FRn), the ratio ζ=Rn : FRn, and UVA-blue (UVA-BL)] and light quantity [photosynthetic photon flux density (PPFD) and relative transmitted PPFD (TrPPFD)]. Light quantity and quality varied within the mango tree crown in a wide range similar to that of a forest. This variability was structured by the depth within the crown as well as by sky condition and solar elevation. Linear relationships linked Rn, FRn and UVA-BL to PPFD, and non-linear relationships linked ζ to TrPPFD. These relationships were strong, accurate and unbiased. They were affected by positional and environmental factors. The results suggested that these relationships were shaped by the characteristics of incident solar light and/or by the interactions between light and phytoelements. Two consequences of interest emerged from this research: i) the modeled relationships allow to infer light quality, that is difficult and time-consuming to simulate, from light quantity modeling within a tree crown, and ii) sky condition and solar elevation should be considered to improve light modeling within a tree crown.
Light is a key factor for plant growth and development, and is therefore of major importance for ecophysiological modeling (DeJong et al., 2011). It is characterized by two dimensions, light quantity, i.e., the quantity of photons per area and time units, that is relevant for photosynthesis, and light quality, i.e., the spectral composition of light, that is relevant for photomorphogenesis and photosynthesis. Modeling ecophysiological and developmental light-related processes in plant models requires an accurate estimation of light quantity and quality at the level of specific organs (e.g., leaves, buds), which might be difficult in complex architecture like trees. The difficulty arises from two points. First, the quantity and quality of incident solar light may vary with environmental conditions, and light quantity and quality vary within the tree (Durand et al., 2021). Second, light models focus mostly on simulating the quantity of light at the level of plant organs. Simulating light quality is more complex and time-consuming (Henke and Buck-Sorlin, 2017) since the whole spectral composition of each ray has to be computed with wavelength-specific processes during the interactions with each organ. Consequently, characterizing the effects of factors affecting light quantity and quality from the sun to the organs, and modeling light quality from light quantity would help improving the simulation of light for ecophysiological and developmental plant models.
Solar radiation interacts with tree crown phytoelements, i.e., the leaves and the stems, by wavelength-selective reflection, transmission and absorption of photons. The proportion of light components (direct and diffuse beams from above the canopy, scatterings from within the canopy) is affected by the crown structure (i.e., the geometry and arrangement of the phytoelements) and by the optical properties of the phytoelements (Grant, 1997; Kim et al., 2011). The optical properties of phytoelements are partly related to their species-specific composition and concentration in pigments, including chlorophyll. In this way, leaves absorb radiation in blue and red wavelengths and reflect or transmit most far-red wavelengths (Casal, 2013), leading to a simultaneous change in the quantity and quality of light at any point within and below a crown or canopy. Light modification mostly occurs in the range of photosynthetically active radiation (PAR, 400–700 nm) and of morphogenetically active radiation (MAR, 350–800 nm) (Varlet-Grancher et al., 1993; Combes et al., 2000). The simultaneous modification of light quantity and quality can be modeled by functional relationships between variables related to light quality (i.e., the photon flux density integrated into bands specific to the MAR variables or the ratio between red and far-red photon flux density (see below)) and variables related to light quantity (the photosynthetic photon flux density (PPFD), i.e., the photon flux density integrated into the PAR band, or the relative transmitted PPFD (TrPPFD), i.e., the ratio between PPFD within the vegetation and incident PPFD). These relationships have been mostly described in temperate forests (Muraoka et al., 2001; Pecot et al., 2005; Leuchner et al., 2007), in a wet tropical forest (Capers and Chazdon, 2004), and more rarely in a stand of a single annual species (Escobar-Gutiérrez et al., 2009) or within a single tree crown (Combes and Escobar-Gutiérrez, 2009). The functional relationships can vary with species and crown characteristics, e.g., between deciduous and coniferous stands (Leuchner et al., 2007).
MAR is perceived by different plant photoreceptors, mainly phytochromes and cryptochromes (Casal, 2013). Phytochromes are sensitive to the narrowband red (Rn: 655–665 nm) and the narrowband far-red (FRn: 725–735 nm) wavelengths. The Rn : FRn ratio, denoted ζ, regulates various adaptive responses such as seed germination, stem growth, leaf expansion, leaf senescence, and branching (Franklin, 2008; Demotes-Mainard et al., 2016). Cryptochromes are sensitive to the UVA-BL wavelengths (350–500 nm). UVA-BL promotes bud burst, stomatal opening and regulates the time of flowering (Leduc et al., 2014; Brelsford and Robson, 2018). Furthermore, far-red wavelengths could achieve more efficient photosynthesis under fluctuating light (Kono et al., 2020) and could enhance photosynthesis when combined with shorter wavelengths (Zhen et al., 2021). Thus, the knowledge of light distribution (i.e., range of values taken by variables that describe light quantity and quality) within a plant or a stand is of great importance when studying or modeling light-related processes such as photosynthesis and photomorphogenesis. Recent studies aiming at improving photosynthesis efficiency under fluctuating light environment (Slattery et al., 2018; De Souza et al., 2022; Long et al., 2022) could benefit from such detailed light models. Most of the studies that focus on light distribution are related to ecology and describe PPFD and MAR under deciduous, coniferous and mixed temperate forests, as well as under tropical forests (Chazdon and Fetcher, 1984; Turnbull and Yates, 1993; Capers and Chazdon, 2004; Navrátil et al., 2007; Hertel et al., 2011). Studies measuring light distribution in annual crops (Chelle et al., 2007) or individual deciduous (Combes and Escobar-Gutiérrez, 2009) or evergreen (Ladux et al., 2021) tree crowns are rare. Within an evergreen tree crown, the contrasting light environment between the outer and the inner part of the crown is permanent throughout the year, with probable effects on bud burst and architectural development, contrary to deciduous trees where light environment, at the time of bud burst in spring, varies little between the buds which are exposed to direct solar light.
Light within the plant stand or tree crown depends on the characteristics of incident solar light, which is influenced by environmental factors such as solar elevation and atmospheric composition. The quantity of incident light above the canopy follows the solar elevation angle α during the day. Light quality may also vary throughout the day. At low solar elevation (α < 20°), the fraction of blue wavelengths is higher than at high solar elevation (α > 20°), whereas the opposite is observed for the fraction of red wavelengths (Chiang et al., 2019). Similarly, high variability of ζ values is observed at twilight, compared to stable values during the rest of the day (Kotilainen et al., 2020). The effect of solar elevation can vary with the position within the canopy and the atmospheric composition (Navrátil et al., 2007). Atmosphere with more clouds and/or higher aerosol concentration has a higher proportion of diffuse light because of scatterings. In this way, clouds reduce light quantity compared to clear sky and modify light quality. Under cloudy sky, as compared to clear sky, incident light is depleted in the red and far-red wavelengths and is enriched in the UV and blue wavelengths (Durand et al., 2021). The ratio ζ of the incident light remains constant or slightly increases under cloudy sky (Chiang et al., 2019). However, within the tree canopy, ζ has significantly higher values under cloudy sky compared to clear sky (Leuchner et al., 2007; Hertel et al., 2011; Dengel et al., 2015). Thus, since solar elevation and sky conditions (cloudiness, aerosols) affect the characteristics of incident solar light, they may alter the relationships between light quality and quantity within the plant stand (Capers and Chazdon, 2004; Pecot et al., 2005; Leuchner et al., 2007) and should therefore be considered when modeling these relationships.
Mango tree (Mangifera indica L.) is a tropical evergreen tree of economic, nutritional and cultural importance in many countries throughout the tropics. Its crown is roughly spherical and formed by a dense, about 1-m-thick, layer of leafy axes (Figure 1A). Leafless scaffolds and branches are in the central part of the crown (Figure 1B). To quantify light distribution and model the functional relationships between MAR and PAR variables within this evergreen fruit tree crown would provide a better understanding of the range and variability of light environment within a complex tree crown. Furthermore, it would improve the simulation of light quantity and quality in the functional-structural plant model V-Mango (Boudon et al., 2020; Vaillant et al., 2022), contributing to improve the modeling of photosynthesis and photomorphogenic processes. We addressed three main questions in this study based on an extensive data set collected in the field. What are the ranges of light quantity and quality within the mango tree crown under different environmental conditions (solar elevation and sky condition)? How can be modeled the functional relationships linking light quality and quantity? How are these relationships affected by environmental conditions and position within the crown?
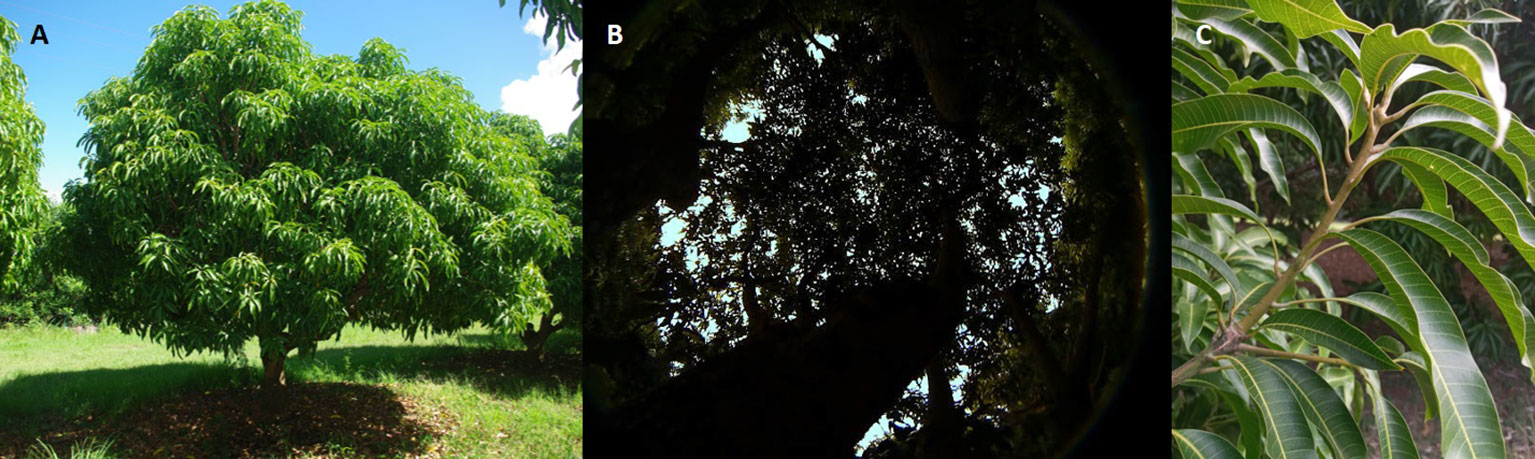
Figure 1 Photographs illustrating adult mango tree, cultivar Cogshall, presenting an exterior spherical outer crown (A) and a leafless shaded inner crown (B) (hemispherical photograph taken at dawn, positioned above the trunk at 1.20 m high). Measurements were done on the apical end of sampled growth units (C) at each depth within the crown (outer, middle, and inner parts) and orientation (along the row and perpendicular to the row).
The study site is an experimental orchard located at the CIRAD (French Agricultural Research Center for International Development) research station at Saint-Pierre, Reunion Island (21°06’S, 55°32’E, 125 m a.s.l.). The experimental orchard is composed of 153 mango trees (cultivar ‘Cogshall’ grafted onto ‘Maison Rouge’ rootstock). Trees were planted in 2004 with a spacing of 5 m between trees along the row and 6 m between rows. Row orientation was northeast-southwest (34° from the north). Trees were pruned every two years starting in 2012. Irrigation was applied with a drip system on an evapotranspiration basis (about 5 mm d−1 on average) as of flowering, until rainfall was sufficient to maintain soil moisture.
Light measurements were performed during the hot and rainy season, from December 18, 2019, to February 17, 2020, on four mango trees randomly selected in the orchard. The four trees were (mean ± s.d.) 4.5 ± 0.4 m high, and their canopy diameter was 5.0 ± 0.3 m along the row and 5.3 ± 0.2 m between rows.
In order to capture the variability of light quantity and quality within the mango tree crown and the effects of environmental conditions, light was measured on a sample of terminal and non-terminal growth units with different positions within the crown, and under different solar elevations and sky conditions. A growth unit (GU) is a leafy portion of axis stemming from a vegetative bud and whose extension is uninterrupted (Figure 1C). In the mango tree, GU extension lasts 8 to 12 days (Dambreville et al., 2013). Twelve GUs were sampled per tree at three different positions (hereafter called ‘depth’) defined according to their depth within the leafy layer of the crown (outer part of the crown, middle leafy part of the crown, inner part of the crown without leaves). For each depth modality, four GUs were sampled at each of four orientation zones (the four zones are defined as the two opposite crown sides of two orientations: on the diameter along the row and on the diameter perpendicular to the row).
The environmental conditions consisted of three solar elevations and two sky conditions. Solar elevation was referred to as the local time of measurement (7:00, 12:00 and 17:00, UTC+4:00). Average solar elevations during the measurement campaign were 22.98° at 7:00, 85.16° at 12:00 and 19.58° at 17:00. Sky conditions (clear and cloudy) were defined according to the average percentage of diffused light in incident light during a measurement series. A series consisted of the 48 light measurements made the same day at a given solar elevation on the 12 GUs of the four trees. Measurement series with an average percentage of diffuse light greater (resp. lower) than 40% were classified as a cloudy (resp. clear) sky condition. The relevance of this sky classification based on the percentage of diffuse light was checked with a second indicator, the clearness index Kt. It is a dimensionless number ranging from 0 to 1, with low (resp. high) values under cloudy (resp. clear) sky conditions. Methods to measure and calculate the two indicators are described in Supplementary Material 1. Across our measurement series, the average percentage of diffused light was 21% under clear skies and 63% under cloudy skies, with values ranging from 9%–40% and 45%–77%, respectively. Measurement series were associated with an average Kt = 0.67 under clear sky and an average Kt = 0.30 under cloudy sky, with values ranging from 0.56-0.81 and 0.17–0.48, respectively. The sky classification of the measurement series therefore appeared to be relevant on the basis of the Kt values since Kt was > 0.5 (resp. < 0.5) for all series under clear (resp. cloudy) sky conditions (Supplementary Figure S1).
A total of 31 light measurement series, corresponding to 1488 light spectra, were acquired during the campaign. Series were split into two independent datasets. The first dataset (Dataset 1) consisted of 18 measurement series (three series per solar elevation × sky condition combination) with a total of 864 light spectra. The second dataset (Dataset 2) consisted of the remaining 13 measurement series, with a total of 624 light spectra. Dataset 1 was a balanced combination of the depth, solar elevation and sky condition factor levels (3 series × 4 trees × 4 GUs × 3 depth × 3 solar elevations × 2 sky conditions) and was used for model calibration. On the contrary, Dataset 2 was unbalanced for solar elevation and sky condition factors (there were four series at 7:00 under clear sky, five series at 12:00 under clear sky, two series at 17:00 under clear sky and two series at 17:00 under cloudy sky) and was used for model validation.
Light spectral irradiance (µW cm−2 nm−1) was measured with a JAZ spectrometer (Ocean Insight, USA), with wavelength ranging from 200 to 1100 nm and a spectral resolution of 1 nm. The spectrometer was connected to an optical fiber and a cosine corrector (i.e., optical diffuser) to collect signal with a 180° field of view. Spectrometer was adapted to solar light and to dark using calibration files before measurements. After calibration, the sensor was placed above the apical end of the sampled GUs and maintained horizontally during the measurement thanks to a gimbal stabilizer. At the same time, the incident PPFD (µmol m−2 s−1) received horizontally above the canopy was measured in an open field at about 100 m from the experimental orchard using a PQS1 PAR quantum sensor (Kipp & Zonen, the Netherlands) connected to a CR1000 X (Campbell, USA) data logger. The output signal of the PQS1 PAR quantum sensor was measured at 5-s intervals and averaged every 30 s. Before the series of measurements, a relationship was calibrated between the incident PPFD measured with the JAZ spectrometer and measured with the PQS1 PAR quantum sensor for each sky condition and at different hours between 7:00 and 18:00 to cover the full range of incident PPFD (Supplementary Material 1; Supplementary Figure S2). This relationship was used to correct the measurement obtained with the PQS1 PAR quantum sensor on the JAZ spectrometer for each series.
Based on the spectral irradiance measured in energy (µW cm−2 nm−1) with the JAZ spectrometer, irradiance in photon flux density (μmol m−2 s−1) was calculated for each wavelength using series of conversions and considering the geographical location of the site and the integration time recorded in JAZ files, according to the manufacturer’s instructions described in Supplementary Material 2. Then, PPFD, UVA-BL, Rn and FRn variables (µmol m−2 s−1) were calculated by integrating the photon flux density in the PAR band (400–700 nm; PPFD), UVA-blue band (350–500 nm; UVA-BL), narrowband red (655–665 nm; Rn) and narrowband far-red (725–735 nm; FRn). The variable ζ (dimensionless) was calculated as the ratio between Rn and FRn. Relative transmitted PPFD (TrPPFD) was calculated as the ratio between the PPFD measured with the spectrometer in the mango tree crown and the incident PPFD measured at the same time with the PQS1 PAR quantum sensor.
Three-way analyses of variance (ANOVAs) were used to test the effects of the positional (depth within the crown) and environmental (sky condition and solar elevation) factors and their second- and third-order interactions on the six light variables (PPFD, TrPPFD, UVA-BL, Rn, FRn and ζ). Light variables were log-transformed prior to analysis to conform to normality, except ζ for which a square-root-transformation was applied. Analyses were performed on Dataset 1.
UVA-BL, Rn and FRn were related to PPFD with linear models (Equation 1).
where y represents UVA-BL, Rn or FRn, a (µmol m−2 s−1) is the y-intercept, and b (dimensionless) is the slope. The y-intercept a was set at 0 for Rn since the wavelength range of this variable is totally included in the PAR band; consequently, y = 0 when PPFD = 0. On the contrary, the wavelength range of UVA-BL and FRn is partially or completely, respectively, outside the PAR band. In such a case, y might be > 0 when PPFD = 0 due to the contribution of broadband irradiance. Therefore, the y-intercept a was not set at 0 for UVA-BL and FRn.
The relationship between ζ and TrPPFD was non-linear and modeled using the Schnute equation (Schnute, 1981) (Equation 2).
where parameters a and b define the shape of the curve, x1 and x2 are the first and last values of the TrPPFD domain for which the model was fitted, and parameters c and d are the values of ζ at x1 and x2, respectively. All parameters are dimensionless. On the basis of the range of TrPPFD measurements (see results), the lower and upper bounds for TrPPFD, x1 and x2, were set to 0 and 1, respectively. When TrPPFD = x1 = 0 (i.e., no light between 400 and 700 nm), Rn = 0 (since Rn range is included in PPFD range) and FRn > 0 (since FRn range is outside the PPFD range) then ζ = 0. The parameter c was therefore set to 0. Consequently, the Schnute equation was simplified as follows:
The functional relationships were calibrated globally, i.e., independently of the positional and environmental factors, on Dataset 1 using the least-squares method.
Model goodness-of-fit was assessed on the calibration data (Dataset 1) with calculation of model bias (systematic errors) and accuracy (random errors). A common bias measurement is the average error ME (Equation 4; Walther and Moore, 2005). It indicates if the model, on average, overestimates (ME > 0) or underestimates (ME < 0) the data. The expected value is 0. A scaled statistic was used to assess model accuracy in terms of the percentage relative root mean square error with mean normalization (RRMSE) (Equation 5). Model accuracy is considered excellent when RRMSE < 10%, good if 10% < RRMSE < 20%, fair if 20% < RRMSE < 30%, and poor if RRMSE > 30% (Despotovic et al., 2016).
where is the ith observed value, is the corresponding value estimated by the model, is the mean of observed values, and n is the number of observed data.
The models were also evaluated by assessing their predictive quality on independent data (Dataset 2). Values predicted with the model were compared to observed values using the previous statistics (ME and RRMSE) and a plot analysis. The regression line between predicted and observed values was computed. The expected values for the slope, the y-intercept and the coefficient of determination of the regression are 1, 0 and 1, respectively. It was then checked if 1 and 0 were included in the 95% confidence interval of the slope and y-intercept, respectively.
The effects of positional (depth within the crown) and environmental (sky condition and solar elevation) factors on the linear relationships linking UVA-BL, Rn and FRn to PPFD (Equation 1) were tested using analyses of covariance (ANCOVAs), with the studied MAR variable as the response variable, PPFD as the independent variable, and the tested factor as the covariable. The interaction between PPFD and the factor was tested first. A significant interaction indicated an effect of the factor on the slope, and no conclusion could be drawn on the effect of the factor on the y-intercept in this case. If the interaction was not significant, then the analysis of covariance was performed without interaction to test for the effect of the factor on the y-intercept. When a significant effect of a factor with more than two levels was detected on the slope (or y-intercept) of the relationship, pairwise comparisons were performed with Bonferroni P-value adjustment for multiple comparisons in order to identify groups of homogeneous slopes (or y-intercepts).
The effects of positional and environmental factors on the non-linear relationship between ζ and TrPPFD, modeled with the simplified Schnute equation (Equation 3), were analyzed using the likelihood ratio methodology described in Kimura (1980). Kimura’s likelihood ratio test (LRT) provides a general method for the statistical comparison of non-linear curves fitted to data, under the assumption of independent and normally distributed errors. In our case, considering a factor with I levels, each following the Schnute equation with parameters , a base model (Ω) was specified as follows: , where referred to the Schnute equation and j is the jth observation in the ith factor level. Assuming that all curves were coincident, i.e., the parameters were not significantly different for the I factor levels, a coincident model (ω) was specified by adding the following set of r = 3(I − 1) equality constraints on parameters of base model Ω:
Testing the hypothesis that the factor had no effect on the relationship between ζ and TrPPFD was thus equivalent to testing the hypothesis that all curves were coincident. The test is based on the LRT statistic, which approximately follows a χ2 distribution:
where df is the number of degrees of freedom (equal to the number r of linear constraints), N is the total number of observations (all levels combined), RSSΩ is the total residual sum of squares derived from fitting the base model Ω (curves were fitted separately for each factor level and their residual sums of squares were summed), and RSSω is the residual sum of squares derived from fitting the coincident model ω with the hypothesized constraints. When a significant effect of a factor with more than two levels was detected, the same LRT approach was used to perform pairwise comparisons with Bonferroni P-value adjustment for multiple comparisons in order to identify which pair(s) of curves significantly differed.
Covariance and LRT analyses described above were performed on Dataset 1 in two steps. First, the analyses were performed separately for each factor. All data were used when testing the effects of sky condition and solar elevation. However, only the data subset corresponding to the highest solar elevation (local time = 12:00) was used when testing the effect of depth within the crown in order to have direct, vertical and unmodified light beams reaching the tree crown, and without light beams passing through the crown of the adjacent tree crowns at lower solar elevation. Second, the effect of solar elevation was separately tested under clear and cloudy sky conditions because it was assumed that the effect of solar elevation on the functional relationships was more likely under the clear than the cloudy sky condition. Indeed, directional distribution of light beams is anisotropic under the clear sky condition and isotropic under the cloudy sky condition. Light beams are therefore more homogeneous between the different solar elevations under cloudy than clear sky.
Statistical analyses were performed with R software, version 4.1.2 (R Core Team, 2021). Pairwise comparisons of estimated slopes and y-intercepts were performed with the emtrends() and emmeans() functions, respectively, of the emmeans package (Lenth, 2016). The Schnute non-linear equation was fitted with the nxlb() function in the nlmrt package (Nash, 2014). Because of the large sample size and to highlight the main factors affecting light variables and functional relationships, the significance level in statistical tests was set at P = 0.01.
During the measurement series (Dataset 1), incident PPFD ranged from 119 to 2383 µmol m−2 s−1, with an average (± standard error, s.e.) value of 934 (± 17) µmol m−2 s−1. PPFD measured within the mango tree crown ranged from 1 to 2221 µmol m−2 s−1, with an average value of 136 (± 10) µmol m−2s−1 TrPPFD ranged from 0.001 to 0.94, with an average value of 0.107 (± 0.005). UVA-BL ranged from 0.2 to 767.5 µmol m−2 s−1, with an average value of 47.8 (± 3.7) µmol m−2 s−1. Rn ranged from 0.01 to 77.6 µmol m−2 s−1with an average value of 4.66 (± 0.36) µmol m−2 s−1. FRn ranged from 0.10 to 73.0 µmol m−2 s−1 with an average value of 5.02 (± 0.32) µmol m−2 s−1. Values of ζ varied from 0.02 to 1.27, with an average value of 0.53 ± 0.01.
Depth within the crown, sky condition and solar elevation significantly affected the PAR and MAR variables within the mango tree crown (Table 1; Figure 2). The three-way interaction ‘sky condition : solar elevation : depth within the crown’ and the two-way interaction ‘sky condition : depth within the crown’ were not significant for any variable. On the contrary, the depth within the crown had a significant and marked effect on the six studied variables (Table 1).
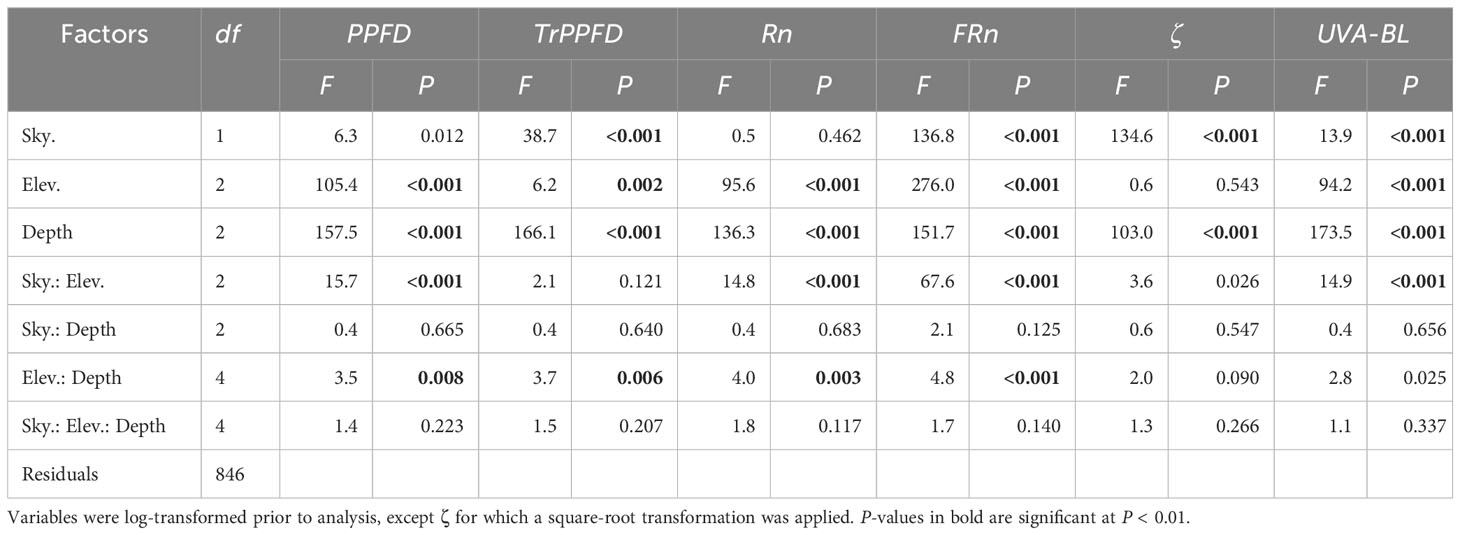
Table 1 F- and P-values of the three-way ANOVAs testing the effects of sky condition (Sky.), solar elevation (Elev.) and depth within the crown (Depth) on photosynthetic photon flux density (PPFD), relative transmitted PPFD (TrPPFD), narrowband red (Rn), narrowband far-red (FRn), Rn : FRn ratio (ζ), and UVA-blue (UVA-BL) measured within four mango tree crowns.
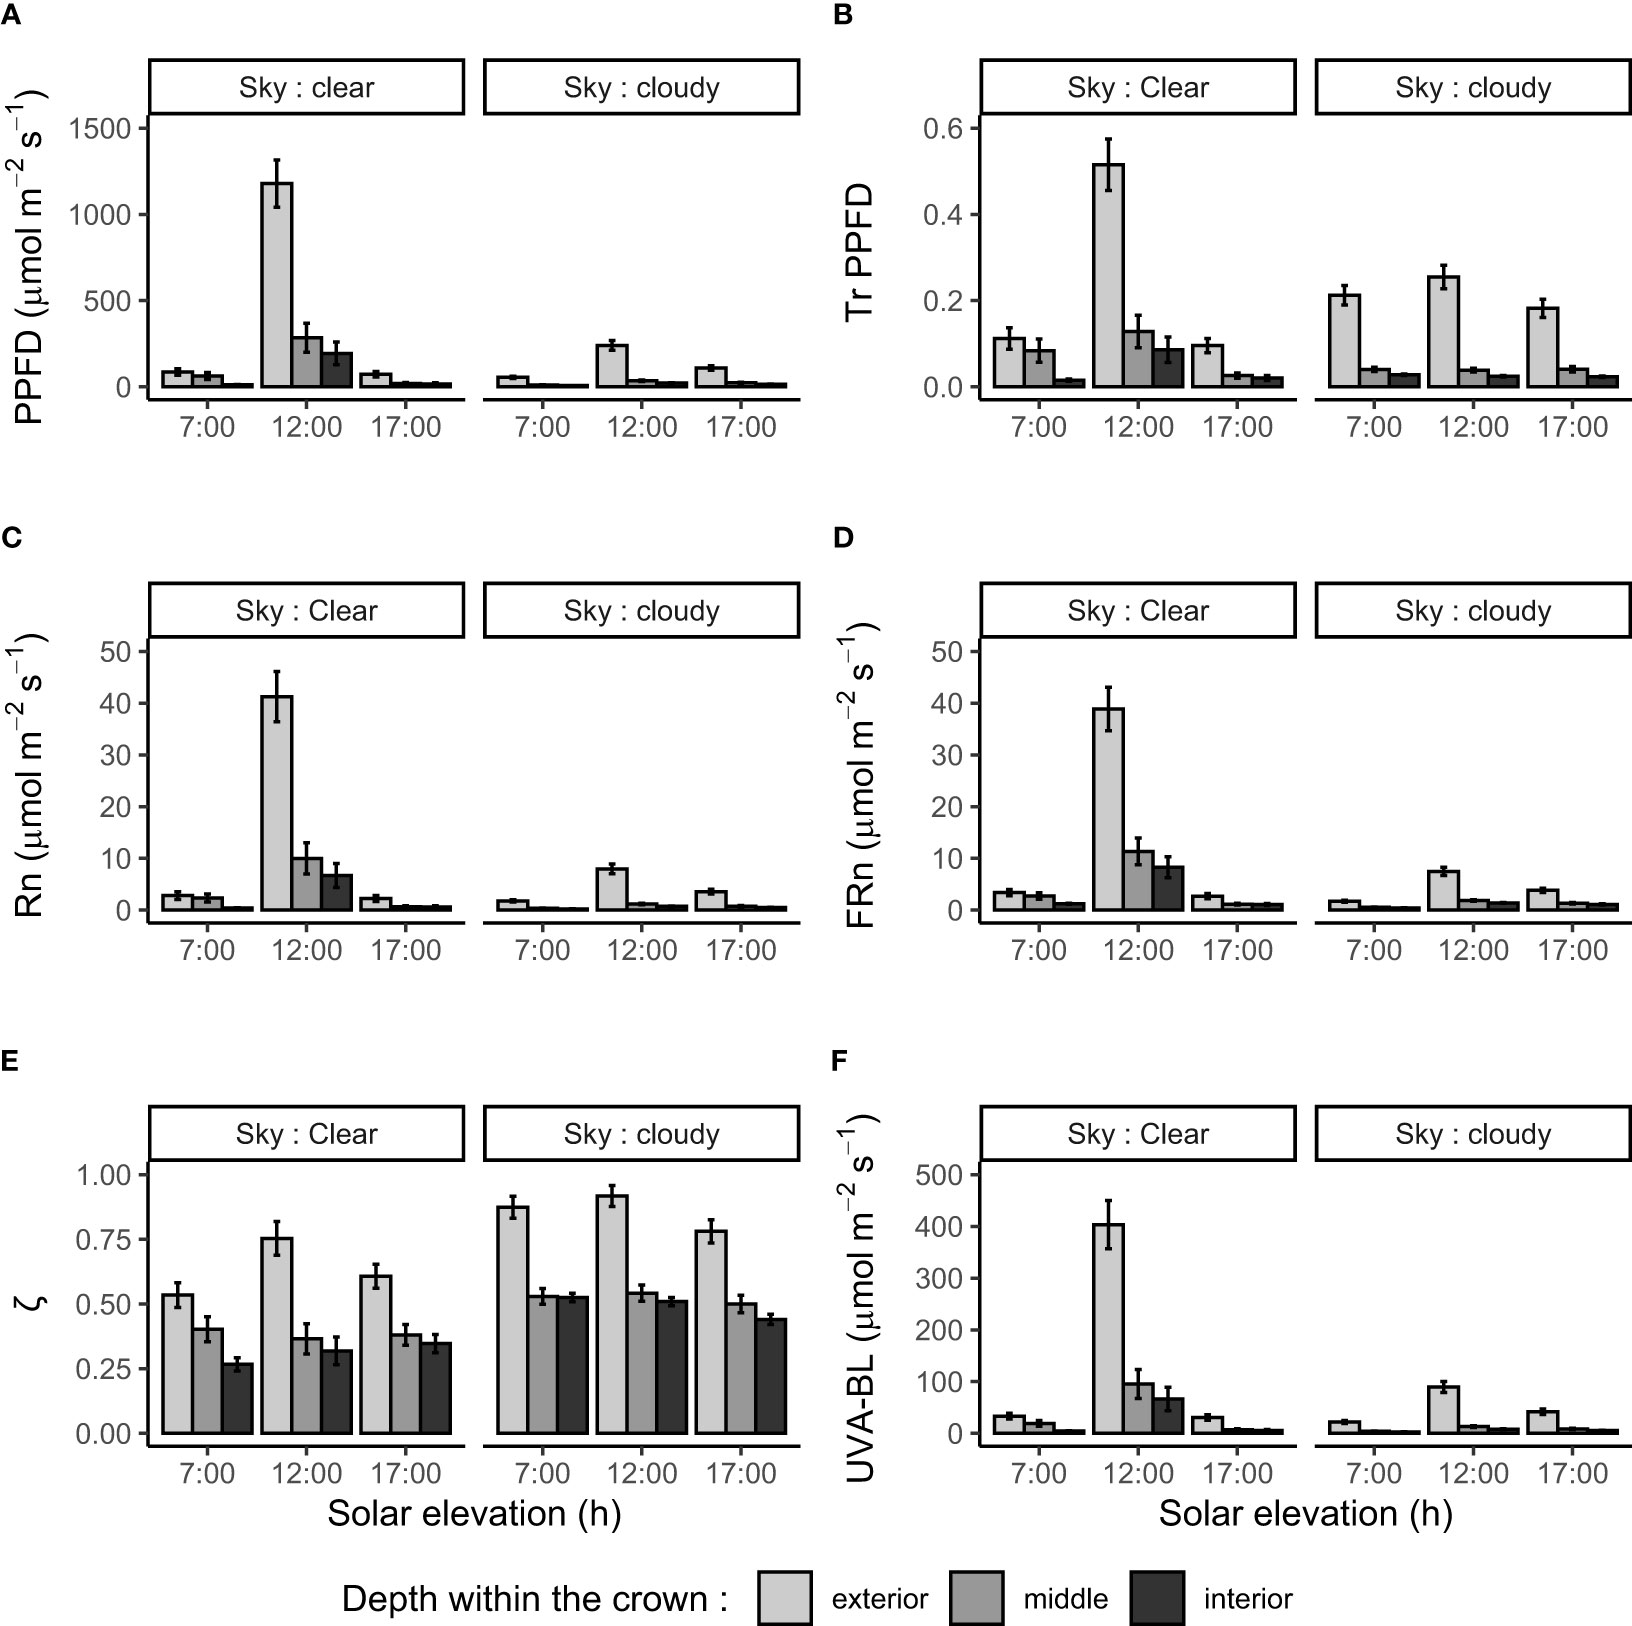
Figure 2 Photosynthetic photon flux density (PPFD; A), relative transmitted PPFD (TrPPFD; B), narrowband red (Rn; C), narrowband far-red (FRn; D), Rn : FRn ratio (ζ; E), and UVA-blue (UVA-BL; F) measured within four mango tree crowns according to sky condition (clear or cloudy), solar elevation (referred to as local time: 7:00, 12:00, 17:00) and depth within the crown (outer, middle and inner parts). Bars and segments represent means and standard errors (n = 48) of observed data, respectively.
PPFD, Rn, FRn and UVA-BL displayed a very similar pattern according to the studied factors (Figures 2A, C, D, F). Those variables were markedly affected by depth within the crown and solar elevation (Table 1). As a general rule, average values were higher in the outer part of the tree crown, in particular, at high solar elevation (12:00). Two interactions were significant for these variables. The first one, ‘sky condition : solar elevation’, expressed the fact that average values for each solar elevation were less variable under cloudy sky than under clear sky where the average value at high solar elevation (12:00) was much higher than those at low solar elevation (7:00 and 17:00). The second interaction, ‘solar elevation : depth within the crown’ (which, however, was barely significant for UVA-BL; Table 1), expressed the fact that average values varied more with solar elevation in the outer part of the crown than within the crown (middle and inner parts). In particular, average values were higher at high solar elevation (12:00).
TrPPFD was markedly affected by depth within the crown (TrPPFD was on average higher in the outer part of the tree crown), by sky condition (TrPPFD was on average higher under clear sky), and by solar elevation (TrPPFD was on average higher at high solar elevation). The ‘solar elevation : depth within the crown’ interaction was significant. Overall, PPFD, Rn, FRn, UVA-BL and TrPPFD varied more with solar elevation in the outer part of the crown (with the higher values at 12:00) and under clear sky than under cloudy sky.
The variable ζ was affected by sky condition (ζ was on average higher under cloudy sky) and by depth within the crown (ζ was on average higher at the outer part of the crown). Solar elevation had no significant effect on ζ, and no interaction was significant.
Fits of the linear models linking MAR variables UVA-BL, Rn and FRn to PPFD on the calibration Dataset 1 were highly significant (r² > 0.99; P < 0.001), with little variability around the fit (Table 2; Supplementary Figure S3). Goodness-of-fit indicators showed that the models were not biased (ME null or close to 0) and had an excellent (Rn) to good (FRn and UVA-BL) accuracy (RRMSE < 20%).
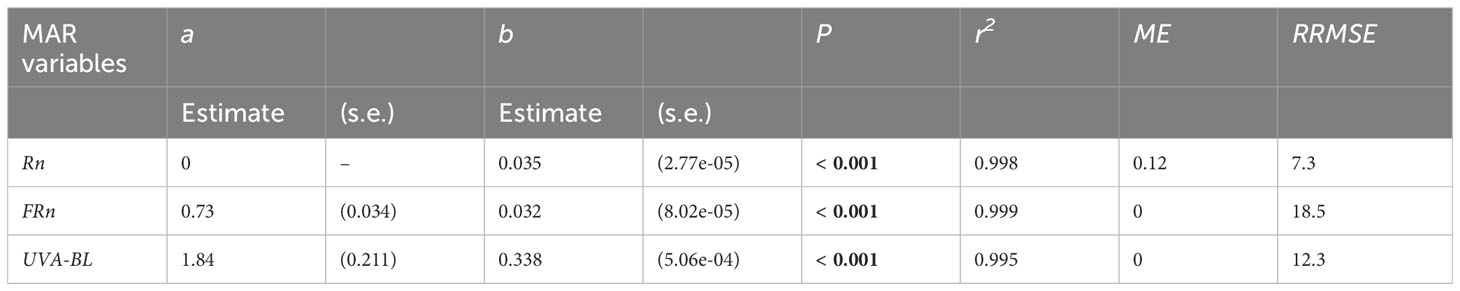
Table 2 Parameter estimates (standard error, s.e.) of the linear models (y = a + b PPFD; Equation 1) linking MAR variables (Rn, FRn, UVA-BL) to photosynthetic photon flux density (PPFD) in mango tree crowns, and statistics of model calibration and goodness-of-fit (P, r2: P-value and coefficient of determination of the regression line between PPFD and MAR variables; ME, mean error; RRMSE, percentage relative root mean square error).
The fit of the non-linear Schnute equation linking ζ to TrPPFD on the calibration Dataset 1 was highly significant (r² = 0.92; P < 0.001, Figure 3). Goodness-of-fit indicators showed that the model was not biased (ME = 0.002) and had a good accuracy (RRMSE = 17.9%).
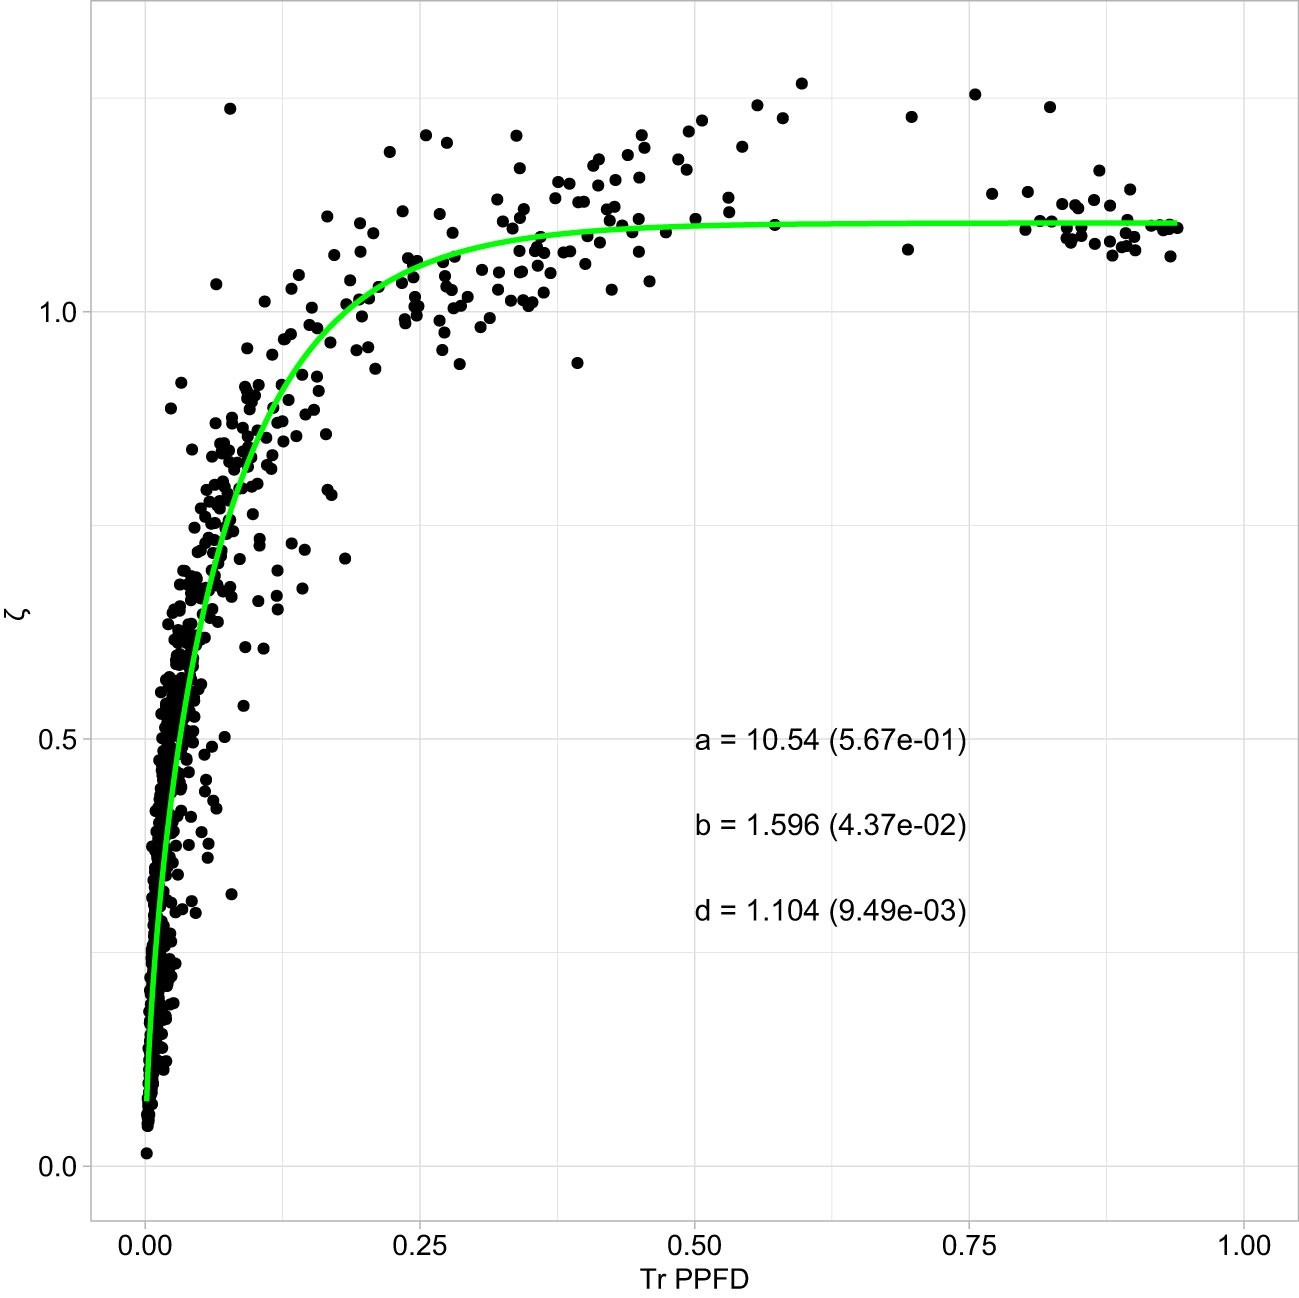
Figure 3 Non-linear functional relationship linking the MAR variable ζ (Rn : FRn ratio) to the relative transmitted photosynthetic photon flux density (TrPPFD) in mango tree crowns. Points are observed data and the green line represents the simplified Schnute equation, (Equation 3), fitted to data, with the estimates (± standard error, s.e.) of model parameters indicated on the graph.
The validation of the functional relationships linking MAR variables to PPFD and ζ to TrPPFD on the independent Dataset 2 revealed the quality and the relevance of these relationships (Table 3; Supplementary Figure S3 & S4). Bias (ME) was close to 0 and very small with respect to the range of values of the four variables. The accuracy (RRMSE) was excellent for Rn and UVA-BL, good for FRn, and fair for ζ. The linear relationships between predicted and observed data were very close to what was expected (i.e., 1 for r² and slopes, and 0 for y-intercepts) for Rn, FRn and UVA-BL, and close to what was expected for ζ (Table 3). The lowest quality of the functional relationship for ζ (with respect to the other variables) was related to the higher, but not biased, variability of observed ζ around the predicted values (Figure 3), suggesting that the simplified Schnute non-linear equation with TrPPFD as predictor was appropriate, but that factor(s) other than TrPPFD contributed to ζ variability.
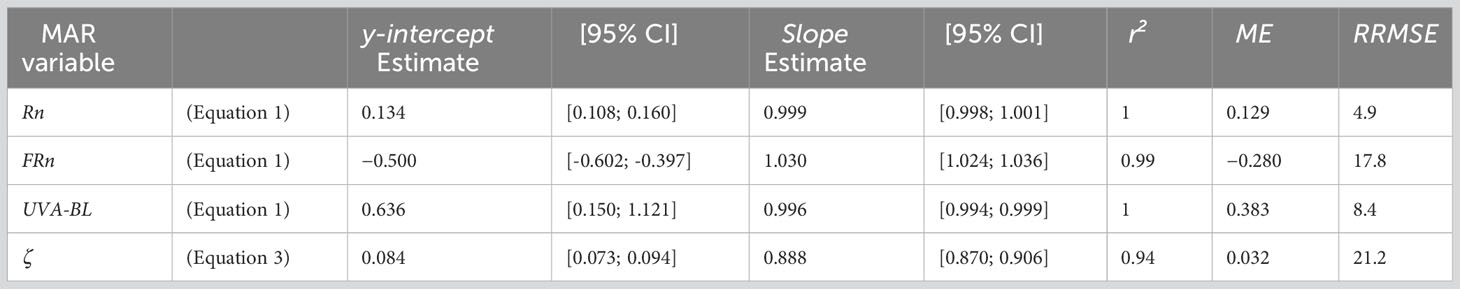
Table 3 Statistics of model validation performed on the independent Dataset 2 for the linear models (Equation 1) predicting narrowband red (Rn), narrowband far-red (FRn) and UVA-blue (UVA-BL) as a function of the photosynthetic photon flux density (PPFD), and for the simplified Schnute non-linear equation (Equation 3) predicting the Rn : FRn ratio (ζ) as a function of the relative transmitted PPFD (TrPPFD) in mango tree crowns (Slope, y-intercept, r2: slope, y-intercept and coefficient of determination of the regression line between predicted and observed values; 95% CI: 95% confidence interval around the slope and y-intercept estimates; ME, mean error; RRMSE, percentage relative root mean square error).
Sky condition, solar elevation and depth within the crown had a significant effect on the slope of the linear functional relationships linking Rn and UVA-BL to PPFD (P < 0.001; Table 4). Only sky condition affected the slope of the relationship linking FRn to PPFD, and solar elevation and depth within the crown affected the y-intercept of the relationship (Table 4).
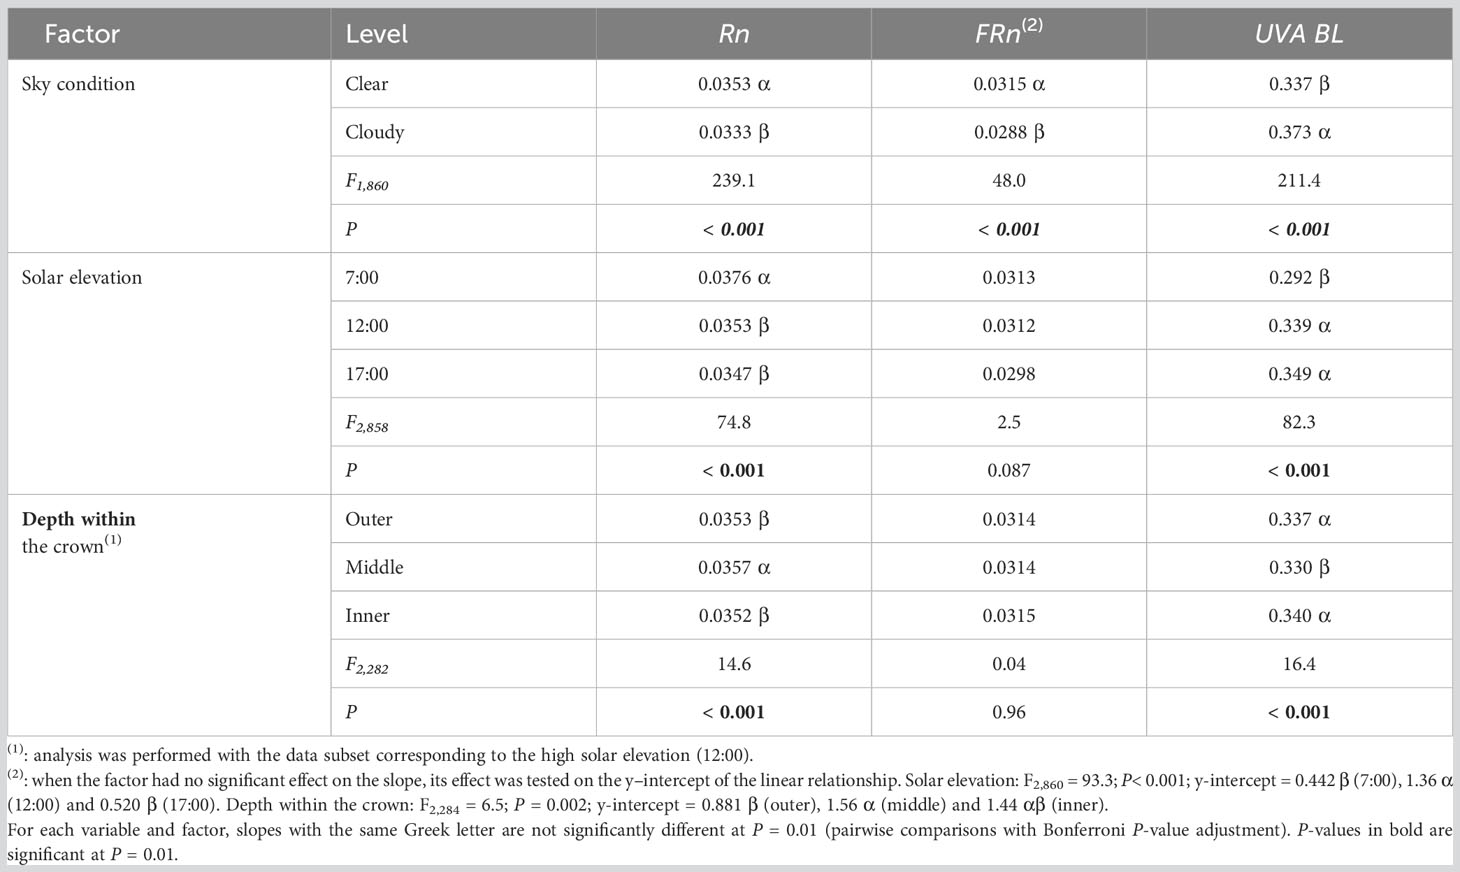
Table 4 Slope estimates and F- and P-values of the analyses of covariance testing the effects of sky condition, solar elevation and depth within the crown on the slope of the linear functional relationships linking narrowband red (Rn), narrowband far-red (FRn), and UVA-blue (UVA-BL) to photosynthetic photon flux density (PPFD) in mango tree crowns.
The slope of the linear relationship linking MAR to PPFD variables was higher under clear sky than under cloudy sky for Rn and FRn, indicating that the flux of Rn and FRn photons increased more rapidly with PPFD under clear sky. On the contrary, the slope of the relationship was higher under cloudy sky for UVA-BL. Similarly, solar elevation and depth within the crown had opposite effects on the slope of the relationships linking Rn to PPFD and UVA-BL to PPFD. Thus, photon flux for red and blue wavelengths in the PPFD appeared to vary antagonistically. With respect to solar elevation, the slope was the highest at low solar elevation in the morning (7:00) for Rn, whereas, at that time, it was the lowest for UVA-BL. For Rn and UVA-BL, slopes were similar at high solar elevation (12:00) and at low solar elevation in the afternoon (17:00). Interestingly, the slopes were significantly different for the low solar elevation in the morning (7:00) and in the afternoon (17:00), suggesting that the slope was affected by factors other than solar elevation, differing between early morning and late afternoon. With respect to depth within the crown, the slope was higher in the middle leafy part of the crown than in the outer and inner parts for Rn, whereas the lowest slope was recorded in the middle leafy part for UVA-BL. This indicated that the flux of Rn or UVA-BL photons increased differently with PPFD in the middle leafy part of the crown, on the one hand, and in the outer and inner parts of the crown, on the other.
The y-intercept of the relationship linking FRn to PPFD was significantly higher at high solar elevation (12:00) than at low solar elevation (7:00 and 17:00). In addition, it was significantly higher in the middle leafy part of the crown, lower in the outer part of the crown, and intermediate in the inner part of the crown (Table 4). Those results indicated that, on average, the flux of FRn photons increased with PPFD in a similar way, regardless of solar elevation and depth within the crown (since none of these factors affected the slope), but that it was higher at high solar elevation and in the middle leafy part of the crown for any PPFD. However, the difference between significantly different y-intercepts (0.92 and 0.68 µmol m−2 s−1 for solar elevation and depth within the crown, respectively, Table 4) was very small in comparison to the range of FRn values (0.10-73 µmol m−2 s−1).
The effects of solar elevation on the linear functional relationships linking MAR variables to PPFD changed with the sky condition (Table 5). Under clear sky, in accordance with previous results (Table 4), the slope was significantly higher for Rn and significantly lower for UVA-BL at low solar elevation in the morning (7:00) than at high solar elevation (12:00) and at low solar elevation in the afternoon (17:00). Under cloudy sky, the way solar elevation affected slopes of the relationships linking Rn and UVA-BL to PPFD was reversed from the clear sky condition: the slope was significantly lower for Rn and significantly higher for UVA-BL at low solar elevation in the morning than at high solar elevation and low solar elevation in the afternoon. The absolute difference between the highest and lowest slope values for Rn or UVA-BL was approximately two to three times greater under clear sky than under cloudy sky. This probably explained why the results of the global solar elevation analysis (Table 4) were similar to those obtained under clear sky (Table 5).
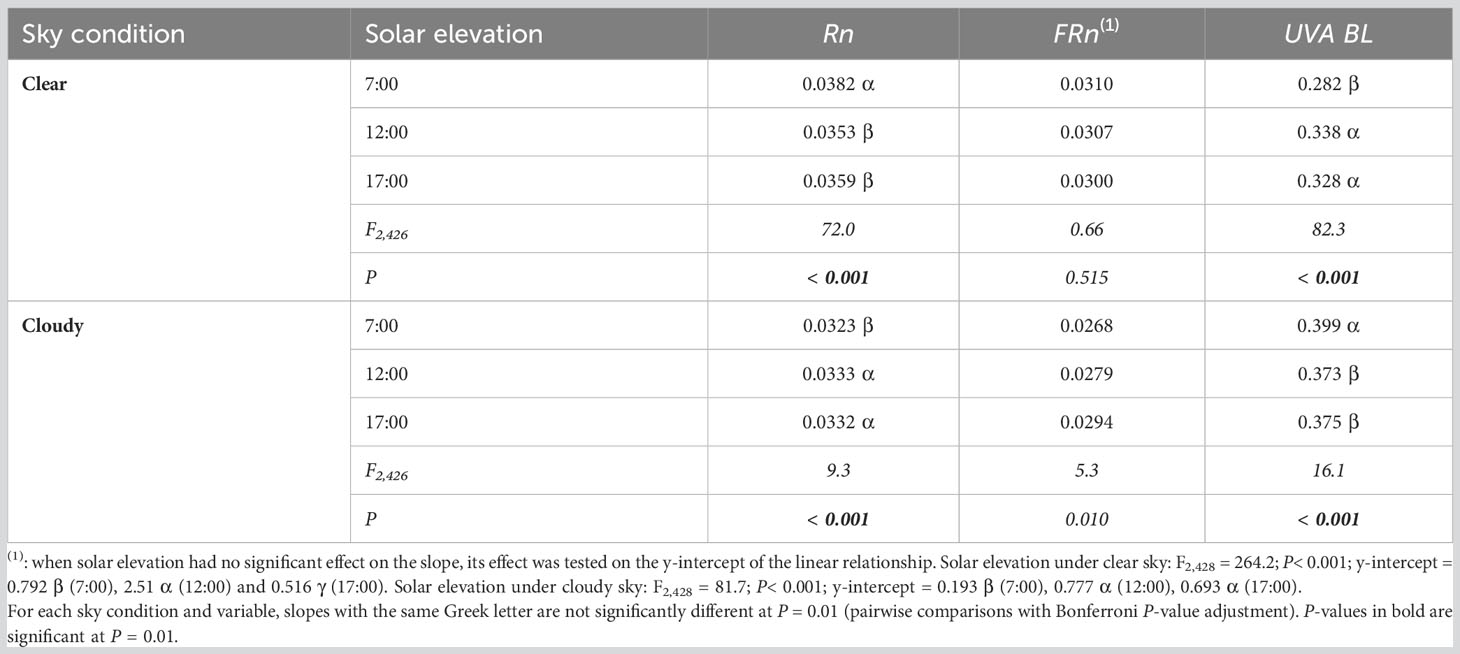
Table 5 Slope estimates and F- and P-values of the analyses of covariance testing the effect of solar elevation under clear or cloudy sky condition on the slope of the linear functional relationships linking narrowband red (Rn), narrowband far-red (FRn), and UVA-blue (UVA-BL) to photosynthetic photon flux density (PPFD) in mango tree crowns.
In accordance with previous results (Table 4), solar elevation had no (clear sky) or only marginal (cloudy sky) effect on the slope of the relationship linking FRn to PPFD, but had a significant effect on its y-intercept. Under clear sky, the y-intercept was higher at 12:00 than at 7:00 and 17:00. Under cloudy sky, the y-intercept was significantly lower at 7:00 than at 12:00 and 17:00.
LRT analyses showed that sky condition, solar elevation and depth within the crown significantly affected the non-linear functional relationship linking ζ to TrPPFD with the Schnute equation (Table 6; Figure 4).
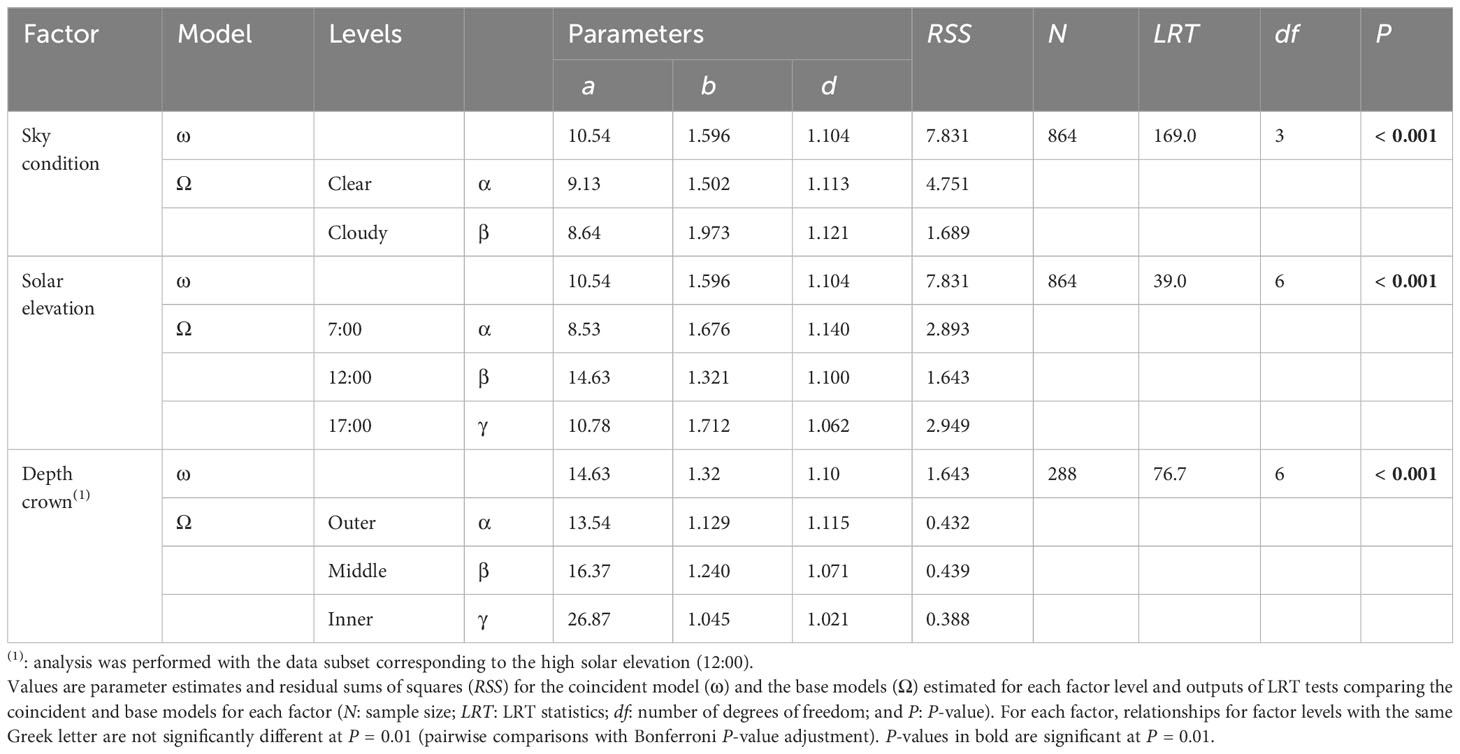
Table 6 Results of the LRT analysis testing the effects of sky condition, solar elevation and depth within the crown on the non-linear functional relationship linking ζ (ratio between the narrowband red Rn and narrowband far-red FRn) to the relative transmitted photosynthetic photon flux density (TrPPFD) with the simplified Schnute equation, (Equation 3), in mango tree crowns.
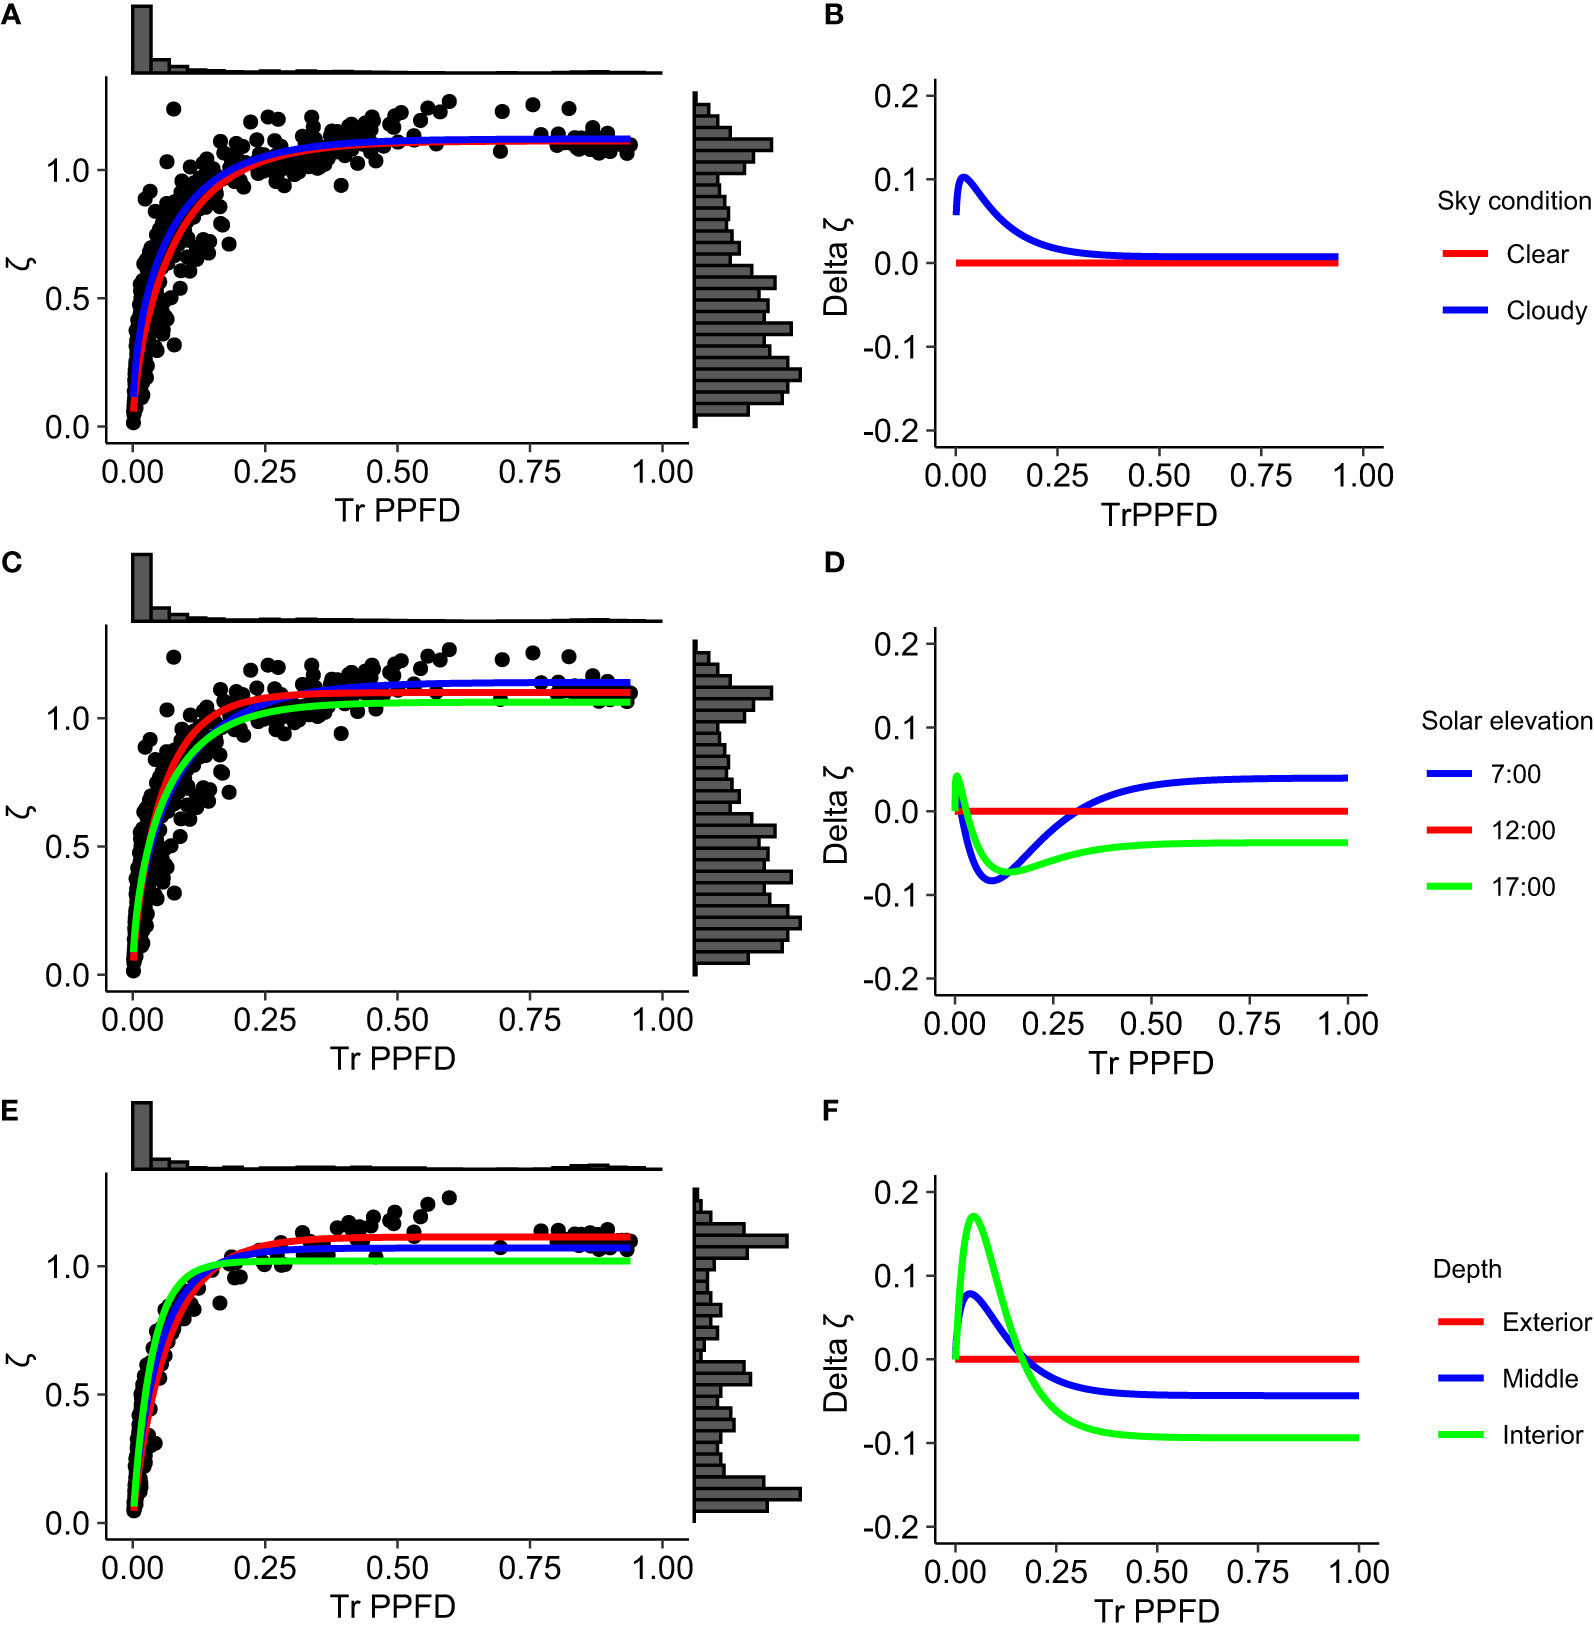
Figure 4 Non-linear functional relationships linking the MAR variable ζ (Rn : FRn ratio) to the relative transmitted photosynthetic photon flux density (TrPPFD) in mango tree crowns, according to sky condition (A, B), solar elevation (C, D) and depth within the crown (E, F). Graphs (A, C, E) points are observed data, curves represent the simplified Schnute equation, (Equation 3), fitted to data for each factor level, and histograms are distributions of ζ and TrPPFD variables. Graphs (B, D, F) curves represent the difference (delta ζ) between ζ predicted by the model for each factor level and ζ predicted for a reference level as a function of TrPPFD. ‘Clear’, ‘12:00’ and ‘Outer’ are the reference levels for sky condition, solar elevation and depth within the canopy factors, respectively.
With respect to sky condition, ζ was higher under cloudy sky than under clear sky, in particular when TrPPFD ≤ 0.30 (Figures 4A,B). The ζ difference between the two sky conditions reached up to 0.1 for small TrPPFD (0.02).
The functional relationships estimated for the three solar elevations were significantly different from each other (Table 6; Figures 4C, D). In particular, the relationships at low solar elevation in the morning (7:00) and in the afternoon (17:00) were significantly different, suggesting that factor(s) other than solar elevation affected the relationship. When TrPPFD ≤ 0.30 (except for very small TrPPFD values), ζ was lower at low solar elevation in the morning (7:00) and in the afternoon (17:00) than at high solar elevation (12:00). The maximal difference was 0.08 at TrPPFD = 0.10, and 0.07 at TrPPFD = 0.14 for the 7:00 and 17:00 levels, respectively. When TrPPFD > 0.30, ζ became higher at low solar elevation in the morning (7:00) than at high solar elevation (12:00), whereas at low solar elevation in the afternoon (17:00), it remained lower than at high solar elevation (12:00).
The functional relationships estimated for the three depths within the crown at the highest solar elevation (12:00) were also significantly different from each other (Table 6). The relationships estimated for the middle leafy part and for the inner part of the crown varied similarly with respect to the relationship estimated for the outer part of the crown and considered as a reference (Figures 4E, F). Values of ζ for the middle and inner parts of the crown were higher than for the outer part of the crown when TrPPFD< 0.20, with a maximum difference of 0.17 between the outer and inner parts, occurring at TrPPFD = 0.05. When TrPPFD > 0.20, ζ for the middle and inner parts of the crown were lower than for the outer part of the crown. Over the whole TrPPFD range, ζ differences with the outer part of the crown were higher for the inner part of the crown than for the middle leafy part of the crown. As a consequence, ζ was higher inside than at the periphery of the mango tree crown for low TrPPFD, whereas the reverse ranking of ζ was observed for higher TrPPFD, with higher values at the periphery than inside the crown.
The non-linear functional relationship linking ζ to TrPPFD was affected differently by solar elevation under clear or cloudy sky (Table 7). Under clear sky, the relationships estimated for each solar elevation were significantly different from each other. Under cloudy sky, the relationships estimated at low solar elevation in the morning (7:00) and at high solar elevation (12:00) were not significantly different, and both differed from the relationship estimated at low solar elevation in the afternoon (17:00). As for the previous result obtained on the complete dataset (Table 6), the relationships estimated at low solar elevation in the morning and in the afternoon were significantly different, independently of the sky condition.
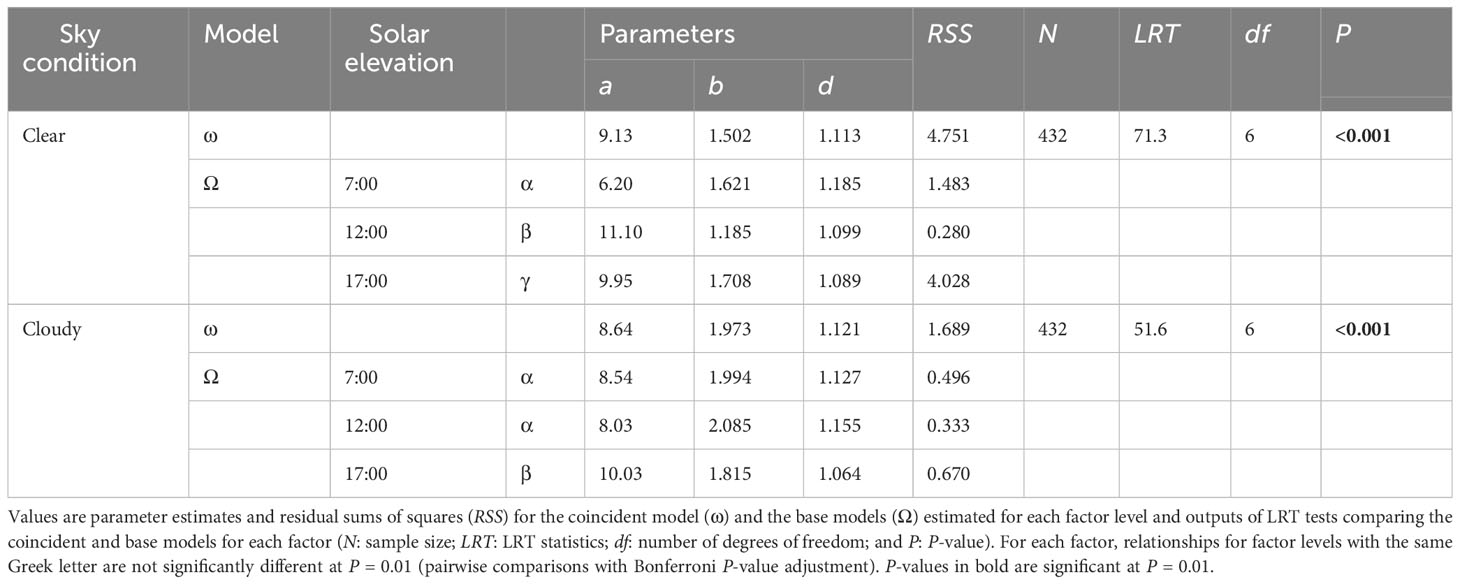
Table 7 Results of the LRT analysis testing the effects of solar elevation under clear or cloudy sky condition on the non-linear functional relationship linking ζ (ratio between the narrowband red Rn and narrowband far-red FRn) to the relative transmitted photosynthetic photon flux density (TrPPFD) with the simplified Schnute equation, (Equation 3), in mango tree crowns.
This research investigated the variability of light quantity (PAR variables: PPFD, TrPPFD) and quality (MAR variables: UVA-BL, Rn, FRn, ζ = Rn : FRn), and the relationships between light quality and light quantity within the crown of the evergreen mango tree. We also explored how this variability and the relationships were shaped by the depth within the mango crown and affected by two environmental factors: sky condition and solar elevation. Besides the originality of the approach, the results are useful for studying and modeling light-related processes in plants (photosynthesis, photomorphogenesis).
The experimental design that took account of different depths within the crown, solar elevations and sky conditions made it possible to capture almost the whole range of light conditions with TrPPFD varying from 0.001 to 0.94. This range was slightly wider than the one measured in neotropical rainforests (0.01–0.9; Lee, 1987). Similarly, the range of measured ζ values was large (0.02–1.27) and covered almost the whole range of this variable. The lowest ζ values in the mango tree crown were closer to the ones measured in temperate beech and spruce forests (0.02–0.05; Ammer, 2003; Hertel et al., 2011) or wheat stands (0.05; Evers et al., 2007a) than to those measured in neotropical rainforests (0.17; Lee, 1987). These results indicated that because of the evergreen status of the species, the whole range of light quantity and quality can be found permanently within mango tree crown, with negative consequences on photosynthesis, bud burst, and modifications of axis morphology in the most shaded parts of the crown.
The variability of all variables related to light quantity and quality was highly structured by the depth within the crown (Table 1), with a significant decrease of the variables with increasing depth (Figure 2). However, this decrease was not regular, with a larger decrease between the outer and the middle part of the crown than between the middle and the inner part of the crown, probably in relation to the strong interactions between light and leaves in the dense, leafy middle part of the crown. Light quality and quantity were indeed less modified from the middle to the inner part of the crown where leaves were scarce and scattered and, consequently, where interactions were limited. FRn was on average less attenuated that Rn and UVA-BL between the outer and the inner parts of the crown (79% vs. 84%, respectively), in relation to the preferential absorption of UVA-BL and Rn compared to FRn by the mango leaves (Lee et al., 1987). These authors measured that average absorption of UVA-BL, Rn and FRn by mango leaves of the cultivar Tommy Atkins was 94%, 91% and 13%, respectively. FRn is mostly reflected or transmited, through scattering on leaf surface according to the structure and orientation of the leaf (Ustin and Jacquemoud, 2020). The differential absorption of Rn and FRn explained the decrease of ζ within the crown. These results were similar to data recorded in temperate forests (Hertel et al., 2011) or individual peach trees (Baraldi et al., 1994) despite different depth gradients (radial/horizontal in our experiment and vertical in published studies), suggesting that the same physical processes of interactions between light and phytoelements are involved.
Light quantity and quality variables in the mango tree crown were lower under cloudy sky than under clear sky, except ζ, which showed an opposite trend. These results are in agreement with those obtained in various vegetation types and structures (Messier et al., 1989; Pecot et al., 2005; Reinhardt et al., 2010; Hertel et al., 2011; Dengel et al., 2015). Clouds modify both the quantity and quality of incident solar light (Durand et al., 2021). They decrease the overall quantity of light and increase the diffuse fraction of light because of scattering. Solar light is enriched in blue wavelengths and depleted in red and far-red wavelengths under cloudy sky (Durand et al., 2021; Musiolková et al., 2021). Moreover, water vapor more specifically absorbs the 728 nm band corresponding to FRn, leading to higher ζ values in incident solar light under cloudy sky (Lee and Downum, 1991). In mango tree crown, the similar variations in average PPFD, Rn, FRn and UVA-BL values between clear and cloudy skies (Figure 2) suggested that the decrease in Rn, FRn and UVA-BL under cloudy sky was predominantly explained by the decrease in PPFD since these variables were linearly related (see below), as shown in Musiolková et al. (2021). In contrast, the higher average ζ values under cloudy sky, irrespective of the depth within the crown (Figure 2E), was probably related to the higher ζ value of incident solar light and to the higher proportion of diffuse incident light that can penetrate deeper within the crown (Li and Yang, 2015). The differences were considerable since average ζ values under cloudy sky in the middle and inner parts of the crown were about 0.5, similar to those in the outer part under clear sky in the early morning or late afternoon.
Solar elevation affects incident light quantity and quality by altering the length of solar ray paths in the atmosphere (Holmes and Smith, 1977). The results on light variability within the mango tree crown were consistent with this rule. PPFD, TrPPFD, Rn, FRn and UVA-BL were significantly affected by solar elevation, with higher average values at high solar elevation (12:00) than at low solar elevation (7:00 and 17:00). Similarly to the effect of sky condition and for the same reason, the effect of solar elevation on Rn, FRn and UVA-BL was probably explained by the effect of solar elevation on PPFD (Figure 2). On the contrary, the ratio ζ was not significantly affected by solar elevation within the mango tree crown. Durand et al. (2021) reported that ζ within canopies can be constant or vary with solar elevation according to the sky condition or to the species. For the mango tree crown, the stability of ζ with solar elevation was related to the similar changes of Rn and FRn with solar elevation for each sky condition (Figures 2C, D) probably in relation to their linear dependence with PPFD (Supplementary Figure S3).
The large variability of the variables describing light quantity and light quality within a mango tree crown made it possible to determine the functional relationships between light quality and light quantity, and, more originally, to investigate how these relationships varied within the crown and with sky condition and solar elevation.
Rn, FRn and UVA-BL were linearly related to PPFD. The relationships were strong, unbiased, with little variability around the trend, and excellently validated with independent data. The estimated slopes were very close to those estimated for the same relationships in a sorghum stand (Escobar-Gutiérrez et al., 2009), despite considerable differences in plant material (e.g., stand architecture, leaf morphology, geometry and optical properties) and measurement protocols (e.g., sensor orientations). This suggests that the relationships for Rn and UVA-BL mostly reflected the fact that these wavelength bands are completely or almost completely included in the PAR. Variation in PPFD consequently led to proportional variation in the photon flux of these MAR bands. The strong linear relationship between FRn and PPFD showed that there was also proportionality between PPFD and the photon flux of the FRn wavelength band close to, but outside the PAR range. This probably explained why the goodness-of-fit of the linear relationships was slightly lower for FRn in calibration and validation (RRMSE; Tables 2 and 3).
Depth within the crown, sky condition and solar elevation affected the slopes of the relationships for Rn and UVA-BL, i.e., the proportion of these wavelength bands within PPFD. Only the sky condition affected the slope of the relationship for FRn, and depth within the crown and solar elevation affected the y-intercept, i.e., generated a constant difference in FRn flux within the PPFD range. The slopes of the relationships for UVA-BL were higher under cloudy sky than under clear sky, whereas the opposite was true for Rn and FRn. This was probably related to the quality of incident light that is enriched in blue wavelengths and depleted in red and far-red wavelengths under cloudy sky (Navrátil et al., 2007; Durand et al., 2021; Musiolková et al., 2021). The lack of effect of the factors, solar elevation and depth within the crown, on the slope of the relationship between FRn and PPFD suggested that the effects of these factors were related to the higher absorbance of Rn and UVA-BL than FRn by leaves (Lee et al., 1987).
In the four relationships linking Rn and UVA-BL to PPFD under two sky conditions (Table 5), slopes at high solar elevation and at low solar elevation in the afternoon were similar and differed from the slope at low solar elevation in the morning. This indicated that solar elevation was not the only factor involved in this effect since slopes of the relationships at low elevation differed between morning and afternoon. Such differences in light quality between morning and afternoon for similar solar elevation have also been recorded at two distinct geographical (Finland, India) and climatological locations (Kotilainen et al., 2020). Two other factors could be involved, but further investigations are required to decipher the effects of solar elevation on these relationships. First, air humidity is generally higher in the morning and could therefore affect the proportion of Rn and UVA-BL in incident light in comparison to the afternoon since atmospheric water vapor affects, independently of the sky condition, the relative proportion of blue and red wavelengths in incident light (Kotilainen et al., 2020). Second, photosynthesis generally occurs in the morning when the vapor pressure deficit is low and stomata are still open, and could lead to differential absorption of Rn and UVA-BL by leaves (Gitelson et al., 2021; Liu and van Iersel, 2021).
Our assumption that the effect of solar elevation on the functional relationships was more likely under the clear than cloudy sky condition was not completely supported by the results since the effect was significant under both sky conditions. However, differences in slope values for Rn and UVA-BL relationships, and in y-intercept for FRn relationships between solar elevations were larger under clear sky than under cloudy sky (Table 5), suggesting that the more isotropic directional distribution of light beams under cloudy sky mitigated the effect of solar elevation on the relationships between light quality and quantity.
The ratio ζ was non-linearly related to TrPPFD in the mango tree crown, as revealed in various types of vegetation (Muraoka et al., 2001; Leuchner et al., 2007; Escobar-Gutiérrez et al., 2009). The relationship was strong, unbiased and satisfactorily validated with independent data. The variability around the trend was, however, larger than that observed in the previous linear relationships. The ratio ζ remained high (1 <) and stable for TrPPFD > 0.30, and decreased rapidly for TrPPFD < 0.25. The curvature of the relationship between ζ and TrPPFD was higher than that observed in a sorghum stand, as supported by the different value of the shape parameter ‘a‘ in the Schnute equation (Equation 3) used to fit the relationships in these two species, whereas the two other parameters (‘b’ and ‘d’ in Equation 3) were similar (Escobar-Gutiérrez et al., 2009). The variability in the shape of this relationship among various vegetation types (see Muraoka et al., 2001; Leuchner et al., 2007) and the variability of the data around the trend (Figure 3) suggest that the relationship between ζ and TrPPFD is mostly shaped by physical interactions between light and phytoelements, and is therefore affected, globally and locally, by factors such as stand/canopy architecture and leaf morphology, geometry and optical properties. In particular, genotype appears as the main source of variability of leaf optical properties (Atherton et al., 2017; Hovi et al., 2017), because of differences in leaf biochemical composition and anatomical features (Govaerts et al., 1996), notably for wavelengths above 700 nm (Hovi et al., 2017), i.e., including FRn. Consequently, the relationship modeled in this study may vary with mango cultivar, and also with the characteristics of the neighboring trees (age, dimensions, method for canopy management) or the orchard design (planting density and/or trees arrangement), which may influence the stand/canopy architecture. Measurements should be performed in various orchards to evaluate this variability.
The three factors (depth within the crown, sky condition and solar elevation) affected the non-linear relationship. The most pronounced effects of these factors were observed in low light environments, below a TrPPFD value varying between 0.20 and 0.30 depending on the factor (Figure 4). This strengthened the idea that this relationship was shaped by the interactions between light and phytoelements since these interactions led to low TrPPFD. In particular, the effect of depth within the crown was opposite of what was expected in low light environments (TrPPFD < 0.20) since ζ was higher in the inner part than in the outer part of the crown. The difference reached 0.17, which was considerable in relation to the low ζ values for low TrPPFD. The expected decrease of ζ between the outer and the inner part of the crown was observed for TrPPFD > 0.20. An increase of ζ has been similarly observed in the lowest part of vertical profiles of light quality in forest stands (Hertel et al., 2011; Dengel et al., 2015). Hertel et al. (2011) hypothesized the role of unattenuated diffuse light penetrating from the side of the stand. The explanation probably involves diffuse and direct light as well as scattering within the crown, all of which are difficult to measure locally. A modeling approach of the interactions between light and phytoelements would be helpful to decipher the origins of this phenomenon.
The ratio ζ was higher under cloudy sky than under clear sky in low light environments (TrPPFD < 0.30), with a difference reaching 0.10 suggesting that incident diffuse light under cloudy sky could penetrate more evenly within the crown, leading to higher ζ values (Leuchner et al., 2007; Hertel et al., 2011; Dengel et al., 2015).
Solar elevation affected the relationship linking ζ to TrPPFD (Table 6), with different behaviors for the low solar elevation levels in the morning and in the afternoon with respect to the high solar elevation (Figure 4). At low solar elevation, incident light passed through crowns of neighboring trees in the orchard and the light in the shaded part of the crown was probably modified (through absorption and scattering) more strongly by crown and neighboring trees than when it arrived vertically on the crown at 12:00. Thus, for a low TrPPFD, ζ was lower at 7:00 and 17:00 than at 12:00. In medium and high light environments, ζ in the morning (7:00) was higher than during the rest of the day, probably because of incident light characteristics. This increasing of ζ could be related to the change in humidity content in the atmosphere during the day (Kotilainen et al., 2020). This seems contradictory with the lack of effect of solar elevation on ζ in the mango tree crown (Table 1). This latter result was probably a consequence of a high proportion of data with small TrPPFD (see data distribution in Figure 4E). The study of the relationship linking ζ to TrPPFD therefore made it possible to highlight the specific effects of solar elevation (as well as sky condition and depth within the crown) for different light environments.
Coupling the functional relationships linking light quality to light quantity with light interception models into functional-structural plant models was previously done for a generic individual-based model of forage legumes (Louarn and Faverjon, 2018). In this model, ζ was estimated from the computation of TrPPFD in order to simulate the interactions between the individuals. Such strategy of light signal simulation can allow rapid, accurate and dynamic simulation of light quality at the level of the organs within a tree crown model like V-Mango for the mango tree (Boudon et al., 2020; Vaillant et al., 2022). This can contribute to improve the performance of models for light-related processes such as photosynthesis and especially photomorphogenesis for which the simulation of MAR bands is necessary. A consequence of taking into account the easier simulation of light quality may be a better consideration of its effects on ecophysiological processes (e.g. stomata behavior, Buckley and Mott, 2013; Sun et al., 2014) and on developmental processes like bud burst and branching (Franklin, 2008; Leduc et al., 2014; Demotes-Mainard et al., 2016) in plant modeling. This latter point would lead to a dynamic interplay between bud burst and light, in particular in complex architectures like leafy tree crowns of evergreen species or deciduous species (during the season of vegetative growth), with expected new insights on the 3D plant structure development (Evers et al., 2007b).
Our study highlighted the effects of environmental factors, sky condition and solar elevation, and of the depth within the crown on the quantity and quality of light within a tree crown, and especially on the functional relationships between them. Light interception models take into account implicitly or explicitly the two environmental factors (they determine the incident light) to calculate light quantity at any point of a plant structure (Vos et al., 2010). Light quality can be computed from this light quantity simulation, as suggested above, with the functional relationship corresponding to the conditions (sky condition, solar elevation, depth within the crown) of the simulation in order to have a more accurate estimation, in particular for the estimation of ζ at low TrPPFD (Figure 4).
From a practical point of view, the close functional relationships revealed between light quality and light quantity under natural conditions in the mango tree crown does not allow to analyze the respective effects of light quality and quantity on morphogenesis, such as bud burst. This type of investigation would require uncoupling these effects under controlled light conditions, for example with colored filters (Maaike Wubs et al., 2014). These results also provide basic knowledge for improving light environment within the mango tree crown via pruning and tree training, with expected positive impacts on processes promoting mango production, in particular branching (Capelli et al., 2016) and photosynthesis (Urban et al., 2003). Finally, these results can be helpful in designing in silico experiments in order to determine where and how (duration, composition, effect) the light signal is perceived by the plant.
Light quantity and quality within the crown of the adult evergreen mango tree varied within a wide range similar to that of a forest, with probable consequences on light-related processes. This variability was structured by the radial gradient of depth within the crown, and by sky condition and solar elevation. These three factors also affected the close functional relationships between light quality and quantity. The functional relationships coupled with light interception models in functional-structural plant models can allow rapid and dynamic simulation of light quantity and quality at the level of the organs within a plant in order to improve the modeling of light-related ecophysiological and developmental processes.
The raw data supporting the conclusions of this article will be made available by the authors, without undue reservation.
All authors designed the experiment. EC collected the data. EC, IG, and FN analyzed the data. EC wrote the first draft of the manuscript. All authors contributed to the article and approved the submitted version.
The author(s) declare financial support was received for the research, authorship, and/or publication of this article. This work was carried out as part of the CIRAD DPP COSAQ (activities 2018–2021) and DPP SADUR (activities 2022–2023) agronomical research programs funded by the European Community (ERDF fund) and the Conseil Régional de la Réunion. The funding sources had no involvement in study design, in the collection, analysis or interpretation of data, in the writing of the report, or in the decision to submit the article for publication.
The authors thank Emmanuel Jouen for the loan of the Jaz spectrometer, and Raymond Nativel for his help in programming the Campbell datalogger and installation of PAR quantum sensors.
The authors declare that the research was conducted in the absence of any commercial or financial relationships that could be construed as a potential conflict of interest.
All claims expressed in this article are solely those of the authors and do not necessarily represent those of their affiliated organizations, or those of the publisher, the editors and the reviewers. Any product that may be evaluated in this article, or claim that may be made by its manufacturer, is not guaranteed or endorsed by the publisher.
The Supplementary Material for this article can be found online at: https://www.frontiersin.org/articles/10.3389/fevo.2023.1046332/full#supplementary-material
Ammer C. (2003). Growth and biomass partitioning of Fagus sylvatica L. and Quercus robur L. seedlings in response to shading and small changes in the R/FR-ratio of radiation. Ann. For. Sci. 60, 163–171. doi: 10.1051/forest:2003009
Atherton J., Olascoaga B., Alonso L., Porcar-Castell A. (2017). Spatial variation of leaf optical properties in a boreal forest is influenced by species and light environment. Front. Plant Sci. 8. doi: 10.3389/fpls.2017.00309
Baraldi R., Rossi F., Facini O., Fasolo F., Rotondi A., Magli M., et al. (1994). Light environment, growth and morphogenesis in a peach tree canopy. Physiol. Plant 91, 339–345. doi: 10.1111/j.1399-3054.1994.tb00442.x
Boudon F., Persello S., Jestin A., Briand A.-S., Grechi I., Fernique P., et al. (2020). V-Mango: a functional–structural model of mango tree growth, development and fruit production. Ann. Bot. 126, 745–763. doi: 10.1093/aob/mcaa089
Brelsford C. C., Robson T. M. (2018). Blue light advances bud burst in branches of three deciduous tree species under short-day conditions. Trees 32, 1157–1164. doi: 10.1007/s00468-018-1684-1
Buckley T. N., Mott K. A. (2013). Modelling stomatal conductance. Plant Cell Environ. 36, 1691–1699. doi: 10.1111/pce.12140
Capelli M., Lauri P. É., Normand F. (2016). Deciphering the costs of reproduction in mango – vegetative growth matters. Front. Plant Sci. 7. doi: 10.3389/fpls.2016.01531
Capers R. S., Chazdon R. L. (2004). Rapid assessment of understory light availability in a wet tropical forest. Agric. For. Meteorol. 123, 177–185. doi: 10.1016/j.agrformet.2003.12.009
Casal J. J. (2013). Canopy light signals and crop yield in sickness and in health. ISRN. Agron. 2013, 1–16. doi: 10.1155/2013/650439
Chazdon R. L., Fetcher N. (1984). “Light environments of tropical forests,” in Physiological ecology of plants of the wet tropics. Tasks for vegetation Science, vol. 2 . Eds. Medina E., Mooney H. A., Vázquez-Yánes C. (Springer Netherlands), 27–36. doi: 10.1007/978-94-009-7299-5_4
Chelle M., Evers J. B., Combes D., Varlet-Grancher C., Vos J., Andrieu B. (2007). Simulation of the three-dimensional distribution of the red:far-red ratio within crop canopies. New Phytol. 176, 223–234. doi: 10.1111/j.1469-8137.2007.02161.x
Chiang C., Olsen J. E., Basler D., Bånkestad D., Hoch G. (2019). Latitude and weather influences on sun light quality and the relationship to tree growth. Forests 10, 610–622. doi: 10.3390/f10080610
Combes D., Escobar-Gutiérrez A. J. (2009). “Morphogenetically Active Radiation within tree canopies: estimations from PAR and solar broadband irradiance measurements,” in 2009 Third International Symposium on Plant Growth Modeling, Simulation, Visualization and Applications (PMA) (Beijing, China: IEEE), 72–78. doi: 10.1109/PMA.2009.65
Combes D., Sinoquet H., Varlet-Grancher C. (2000). Preliminary measurement and simulation of the spatial distribution of the Morphogenetically Active Radiation (MAR) within an isolated tree canopy. Ann. For. Sci. 57, 497–511. doi: 10.1051/FOREST:2000137
Dambreville A., Normand F., Lauri P.É. (2013). Plant growth co-ordination in natura: a unique temperature-controlled law among vegetative and reproductive organs in mango. Funct. Plant Biol. 40, 280–291. doi: 10.1071/FP12243
DeJong T. M., Da Silva D., Vos J., Escobar-Gutiérrez A. J. (2011). Using functional–structural plant models to study, understand and integrate plant development and ecophysiology. Ann. Bot. 108, 987–989. doi: 10.1093/aob/mcr257
Demotes-Mainard S., Péron T., Corot A., Bertheloot J., Le Gourrierec J., Pelleschi-Travier S., et al. (2016). Plant responses to red and far-red lights, applications in horticulture. Environ. Exp. Bot. 121, 4–21. doi: 10.1016/j.envexpbot.2015.05.010
Dengel S., Grace J., MacArthur A. (2015). Transmissivity of solar radiation within a Picea sitchensis stand under various sky conditions. Biogeosciences 12, 4195–4207. doi: 10.5194/bg-12-4195-2015
De Souza A. P., Burgess S. J., Doran L., Hansen J., Manukyan L., Maryn N., et al. (2022). Soybean photosynthesis and crop yield are improved by accelerating recovery from photoprotection. Science 19, 851–854. doi: 10.1126/science.adc9831
Despotovic M., Nedic V., Despotovic D., Cvetanovic S. (2016). Evaluation of empirical models for predicting monthly mean horizontal diffuse solar radiation 56, 246–260. doi: 10.1016/j.rser.2015.11.058
Durand M., Murchie E. H., Lindfors A. V., Urban U., Aphalo P. J., Robson T. M. (2021). Diffuse solar radiation and canopy photosynthesis in a changing environment. Agric. For. Meteorol. 311, 1–13. doi: 10.1016/j.agrformet.2021.108684
Escobar-Gutiérrez A. J., Combes D., Rakocevic M., de Berranger C., Eprinchard-Ciesla A., Sinoquet H., et al. (2009). Functional relationships to estimate Morphogenetically Active Radiation (MAR) from PAR and solar broadband irradiance measurements: The case of a sorghum crop. Agric. For. Meteorol. 149, 1244–1253. doi: 10.1016/j.agrformet.2009.02.011
Evers J. B., Vos J., Chelle M., Andrieu B., Fournier C., Struik P. C. (2007a). Simulating the effects of localized red:far-red ratio on tillering in spring wheat (Triticum aestivum) using a three-dimensional virtual plant model. New Phytol. 176, 325–336. doi: 10.1111/j.1469-8137.2007.02168.x
Evers J., Vos J., Fournier C., Andrieu B., Chelle M., Struik P. C., et al. (2007b). An architectural model of spring wheat: Evaluation of the effects of population density and shading on model parameterization and performance. Ecol. Model. 200, 308–320. doi: 10.1016/j.ecolmodel.2006.07.042
Franklin K. A. (2008). Shade avoidance. New Phytol. 179, 930–944. doi: 10.1111/j.1469-8137.2008.02507.x
Gitelson A., Arkebauer T., Solovchenko A., Nguy-Robertson A., Inoue Y. (2021). An insight into spectral composition of light available for photosynthesis via remotely assessed absorption coefficient at leaf and canopy levels. Photosynth. Res. 151, 47–60. doi: 10.1007/s11120-021-00863-x
Govaerts Y. M., Jacquemoud S., Verstraete M. M., Ustin S. L. (1996). Three-dimensional radiation transfer modeling in a dicotyledon leaf. Appl. Opt. 35 (33), 6585–6598. doi: 10.1364/AO.35.006585
Grant R. H. (1997). Partitioning of biologically active radiation in plant canopies. Int. J. Biometeorol. 40, 26–40. doi: 10.1007/BF02439408
Henke M., Buck-Sorlin. G. G. (2017). Using a full spectral raytracer for calculating light microclimate in functional-structural plant modelling. Computing. Informatics. 36, 1492–1522. doi: 10.4149/cai_2017_6_1492
Hertel C., Leuchner M., Menzel A. (2011). Vertical variability of spectral ratios in a mature mixed forest stand. Agric. For. Meteorol. 151 (8), 1096–1105. doi: 10.1016/j.agrformet.2011.03.013
Holmes M. G., Smith H. (1977). The Function of phytochrome in the natural Environment—I. Characterization of daylight for studies in photomorphogenesis and photoperiodism. Photoch. Photobiol. 25, 533–538. doi: 10.1111/j.1751-1097.1977.tb09124.x
Hovi A., Raitio P., Rautiainen M. (2017). A spectral analysis of 25 boreal tree species. Silva Fenn. 51 (4). doi: 10.14214/sf.7753
Kim H.-S., Palmroth S., Therezien M., Stenberg P., Oren R. (2011). Analysis of the sensitivity of absorbed light and incident light profile to various canopy architecture and stand conditions. Tree Physiol. 31, 30–47. doi: 10.1093/treephys/tpq098
Kimura D. K. (1980). Likelihood methods for the Von Bertalanffy growth curve. Fishery. Bull. 77, 765–776.
Kono M., Kawaguchi H., Mizusawa N., Yamori W., Suzuki Y., Terashima I. (2020). Far-Red light accelerates photosynthesis in the low-light phases of fluctuating light. Plant Cell Physiol. 61, 192–202. doi: 10.1093/pcp/pcz191
Kotilainen T., Aphalo P. J., Brelsford C. C., Böök H., Devraj S., Heikkilä A., et al. (2020). Patterns in the spectral composition of sunlight and biologically meaningful spectral photon ratios as affected by atmospheric factors. Agric. For. Meteorol. 291, 1–14. doi: 10.1016/j.agrformet.2020.108041
Ladux F. J., Trentacoste E. R., Searles P. S., Rousseaux M. C. (2021). Light quality environment and photomorphological responses of young olive trees. Hortic 7(10):369. doi: 10.3390/horticulturae7100369
Leduc N., Roman H., Barbier F., Péron T., Huché-Thélier L., Lothier J., et al. (2014). Light signaling in bud outgrowth and branching in plants. Plants 3, 223–250. doi: 10.3390/plants3020223
Lee D. W. (1987). The spectral distribution of radiation in two neotropical rainforests. Biotropica 19, 161–166. doi: 10.2307/2388739
Lee D. W., Brammeier S., Smith A. P. (1987). The selective advantages of anthocyanins in developing leaves of mango and cacao. Biotropica 19, 40–49. doi: 10.2307/2388458
Lee D. W., Downum K. R. (1991). The spectral distribution of biologically active solar radiation at Miami, Florida, USA. Int. J. Biometeorol. 35, 48–54. doi: 10.1007/bf01040963
Lenth R. V. (2016). Least-squares means: The R package lsmeans. J. @. Stat. Software. 69, 1–33. doi: 10.18637/jss.v069.i01
Leuchner M., Menzel A., Werner H. (2007). Quantifying the relationship between light quality and light availability at different phenological stages within a mature mixed forest. Agric. For. Meteorol. 142, 35–44. doi: 10.1016/j.agrformet.2006.10.014
Li T., Yang Q. (2015). Advantages of diffuse light for horticultural production and perspectives for further research. Front. Plant Sci. 6. doi: 10.3389/fpls.2015.00704
Liu J., van Iersel M. W. (2021). Photosynthetic physiology of blue, green, and red light: light intensity effects and underlying mechanisms. Front. Plant Sci. 12. doi: 10.3389/fpls.2021.619987
Long S. P., Taylor S. H., Burgess S. J., Carmo-Silva E., Lawson T., De Souza A. P., et al. (2022). Into the shadows and back into sunlight: photosynthesis in fluctuating light. Annu. Rev. Plant Biol. 73, 617–648. doi: 10.1146/annurev-arplant-070221-024745
Louarn G., Faverjon L. (2018). A generic individual-based model to simulate morphogenesis, C–N acquisition and population dynamics in contrasting forage legumes. Ann. Bot. 121, 875–896. doi: 10.1093/aob/mcx154
Maaike Wubs A., Heuvelink E., Marcelis L. F. M., Buck-Sorlin G. H., Vos J. (2014). Axillary budbreak in a cut rose crop as Influenced by light intensity and red:far-red ratio at bud level. J. Amer. Soc Hortic. Sci. 139, 131–138. doi: 10.21273/JASHS.139.2.131
Messier C., Honer T. W., Kimmins J. P. (1989). Photosynthetic photon flux density, red:far-red ratio, and minimum light requirement for survival of Gaultheriashallon in western red cedar–western hemlock stands in coastal British Columbia. Can. J. For. Res. 19, 1470–1477. doi: 10.1139/x89-223
Muraoka H., Hirota H., Matsumoto J., Nishimura S., Tang Y., Koizumi H., et al. (2001). On the convertibility of different microsite light availability indices, relative illuminance and relative photon flux density. Funct. Ecol. 15, 798–803. doi: 10.1046/j.0269-8463.2001.00581.x
Musiolková M., Huszár P., Navrátil M., Špunda V. (2021). Impact of season, cloud cover, and air pollution on different spectral regions of ultraviolet and visible incident solar radiation at the surface. Q. J. R. Meteorol. Soc 147, 2834–2849. doi: 10.1002/qj.4102
Nash J. C. (2014). nlmrt: Functions for nonlinear least squares solutions. R package version 2014.5.4. Available at: https://CRAN.R-project.org/package=nlmrt.
Navrátil M., Špunda V., Marková I., Janouš D. (2007). Spectral composition of photosynthetically active radiation penetrating into a Norway spruce canopy: the opposite dynamics of the blue/red spectral ratio during clear and overcast days. Trees 21, 311–320. doi: 10.1007/s00468-007-0124-4
Pecot S. D., Horsley S. B., Battaglia M. A., Mitchell R. J. (2005). The influence of canopy, sky condition, and solar angle on light quality in a longleaf pine woodland. Can. J. For. Res. 35 (6), 1356–1366. doi: 10.1139/x05-069
R Core Team (2021). R: A language and environment for statistical computing (Vienna, Austria: R Foundation for Statistical Computing). Available at: https://www.R-project.org/.
Reinhardt K., Smith W. K., Carter G. A. (2010). Clouds and cloud immersion alter photosynthetic light quality in a temperate mountain cloud forest. Botany 88, 462–470. doi: 10.1139/b-10-008
Schnute J. (1981). A versatile growth model with statistically stable parameters. Can. J. Fish. Aquat. Sci. 38, 1128–1140. doi: 10.1139/f81-153
Slattery R. A., Walker B. J., Weber A. P. M., Ort D. R. (2018). The impacts of fluctuating light on crop performance. Plant Physiol. 176 (2), 990–1003. doi: 10.1104/pp.17.01234
Sun Z., Jin X., Albert R., Assmann S. M. (2014). Multi-level modeling of light-induced stomatal opening offers new insights into its regulation by drought. PLoS. Comput. Biol. 10, e1003930. doi: 10.1371/journal.pcbi.1003930
Turnbull M. H., Yates D. J. (1993). Seasonal variation in the red/far-red ratio and photon flux density in an Australian sub-tropical rainforest. Agric. For. Meteorol. 64, 111–127. doi: 10.1016/0168-1923(93)90096-Z
Urban L., Le Roux X., Sinoquet H., Jaffuel S., Jannoyer M. (2003). A biochemical model of photosynthesis for mango leaves: evidence for an effect of the fruit on photosynthetic capacity of nearby leaves. Tree Physiol. 23, 289–300. doi: 10.1093/treephys/23.5.289
Ustin S. L., Jacquemoud S. (2020). “How the optical properties of leaves modify the absorption and scattering of energy and enhance leaf functionality,” in Remote Sensing of Plant Biodiversity. Eds. Cavender-Bares J., Gamon J. A., Townsend P. A. (Cham: Springer). doi: 10.1007/978-3-030-33157-3_14
Vaillant J., Grechi I., Normand F., Boudon F. (2022). Towards virtual modelling environments for functional–structural plant models based on Jupyter notebooks: application to the modelling of mango tree growth and development. in silico Plants 4, diab040. doi: 10.1093/insilicoplants/diab040
Varlet-Grancher C., Moulia B., Sinoquet H., Russel G. (1993). “Spectral modification of light within plant canopies,” in Crop Structure and Light Microclimate: Characterization and Application. Eds. Varlet- Grancher C., Bonhomme R., Sinoquet H. (Versailles: INRA), 427–452.
Vos J., Evers J. B., Buck-Sorlin G. H., Andrieu B., Chelle M., de Visser P. H. B. (2010). Functional–structural plant modelling: a new versatile tool in crop science. J. Exp. Bot. 61, 2101–2115. doi: 10.1093/jxb/erp345
Walther B. A., Moore J. L. (2005). The concepts of bias, precision and accuracy, and their use in testing the performance of species richness estimators, with a literature review of estimator performance. Ecography 28, 815–829. doi: 10.1111/j.2005.0906-7590.04112.x
Keywords: crown depth, light spectrum, Mangifera indica, modeling, red : far-red ratio, sky condition, solar elevation
Citation: Carrié E, Grechi I, Boudon F, Frak E, Combes D and Normand F (2023) Modeling functional relationships between morphogenetically active radiation and photosynthetic photon flux density in mango tree crown. Front. Ecol. Evol. 11:1046332. doi: 10.3389/fevo.2023.1046332
Received: 16 September 2022; Accepted: 28 September 2023;
Published: 18 October 2023.
Edited by:
Jonathon H. Stillman, San Francisco State University, United StatesCopyright © 2023 Carrié, Grechi, Boudon, Frak, Combes and Normand. This is an open-access article distributed under the terms of the Creative Commons Attribution License (CC BY). The use, distribution or reproduction in other forums is permitted, provided the original author(s) and the copyright owner(s) are credited and that the original publication in this journal is cited, in accordance with accepted academic practice. No use, distribution or reproduction is permitted which does not comply with these terms.
*Correspondence: Frédéric Normand, ZnJlZGVyaWMubm9ybWFuZEBjaXJhZC5mcg==
†ORCID: Emma Carrié, orcid.org/0000-0001-6012-3908
Isabelle Grechi, orcid.org/0000-0002-3399-6102
Frédéric Boudon, orcid.org/0000-0001-9636-3102
Elzbieta Frak, orcid.org/0000-0002-1676-5249
Didier Combes, orcid.org/0000-0001-7632-7999
Frédéric Normand, orcid.org/0000-0002-4322-8262
Disclaimer: All claims expressed in this article are solely those of the authors and do not necessarily represent those of their affiliated organizations, or those of the publisher, the editors and the reviewers. Any product that may be evaluated in this article or claim that may be made by its manufacturer is not guaranteed or endorsed by the publisher.
Research integrity at Frontiers
Learn more about the work of our research integrity team to safeguard the quality of each article we publish.