
95% of researchers rate our articles as excellent or good
Learn more about the work of our research integrity team to safeguard the quality of each article we publish.
Find out more
ORIGINAL RESEARCH article
Front. Ecol. Evol. , 09 June 2023
Sec. Conservation and Restoration Ecology
Volume 11 - 2023 | https://doi.org/10.3389/fevo.2023.1031321
This article is part of the Research Topic Human-Wildlife Conflicts: Consequences of the Erosion of the Available Habitat, Introduction of Alien Species, and Anthropization View all 5 articles
 Dipanjan Naha1,2*
 Stéphanie Périquet2J. Werner Kilian3
 Caitlin A. Kupferman1,4Tammy Hoth-Hanssen5
 James C. Beasley1,4
The erection of peripheral fences around protected areas has been shown to adversely affect the movement behavior, genetic connectivity and long-term viability of animal populations. However, fencing is also used extensively to reduce human encroachment, limit poaching activities, and mitigate human–wildlife conflicts. Limited information on the movement behavior of carnivores is available along the periphery of protected areas, particularly in semi-arid environments. To quantify the potential effects of the 824 km perimeter fence surrounding the Etosha National Park (Etosha, Namibia) on the movement and space use of carnivores, we collected GPS movement data from 36 lions (Panthera leo) and seven spotted hyenas (Crocuta crocuta) over a 14-year period. For these two apex carnivores, we measured the impact of the Etosha fence on their movements (step lengths and path straightness), calculated the likelihood of fence crossings, and evaluated the spatial–temporal characteristics of these crossings. Our results indicated that lions and hyenas moved faster (longer step lengths) when closer to the fence. Lions showed no variation in path straightness with respect to the fence but hyenas had straighter movement paths when closer to the fence. When moving within the vicinity of the fence, lions had a 9% likelihood of crossing the fence, while hyenas were much more likely (18%) to do so, which suggests that the Etosha fence was more permeable for hyenas than for lions. Fence crossings predominantly occurred at night for both species. Lions were more likely to cross the fence during the cold dry season (May–August) whereas hyenas crossed more often during the warm wet season (December–April). Female and adult lions had a higher probability of crossing the fence than males and subadults. These findings could be useful in the development of appropriate strategies to mitigate human–carnivore conflicts and thus promote the conservation of carnivores in multiple-use areas along the periphery of the park. Further research is needed to better elucidate the impact of perimeter fences on a broader suite of carnivores and other large mammals, including species-specific variation in the response to fences, as well as the economic benefits of fencing provided to local communities.
Large mammals are often wide-ranging and thus need to move across large areas to meet their social, reproductive, and dietary requirements. However, with the global increase in human and livestock populations, extensive areas are being converted to agricultural lands and human settlements, leading to fragmentation and loss of wildlife habitats (Ripple et al., 2017). In addition to direct impacts on wildlife, human encroachment can indirectly influence wildlife populations through alteration of gene flow, behavior, population dynamics, and other attributes (Ceballos et al., 2015; Habrich et al., 2021). For example, a global review of movements from 57 species of mammals revealed restricted movement in areas with high anthropogenic impacts compared to relatively natural ecosystems (Tucker et al., 2018). Increasing competition between humans and large mammals for space and resources also has led to a rise in human–wildlife conflicts (Minin et al., 2021).
Fencing is often used as a tool to separate large mammals and humans and reduce negative interactions. In addition to mitigation of human–wildlife conflicts, fencing is widely adopted for a diversity of reasons such as protecting endangered wildlife, preventing poaching, reducing habitat encroachment, and restricting movement of invasive species (Somers and Hayward, 2012). In particular, in parts of Southern Africa that still support substantial megafaunal populations with relatively low human densities compared to other developing regions of the world, fencing is a popular tool used to separate humans, agriculture, and livestock from wildlife (Durant et al., 2015). Fencing is also used as a management tool in Africa for veterinary purposes such as reducing risk of disease transmission between wildlife, livestock, and humans (Durant et al., 2015). However, artificial barriers can disrupt connectivity between resource patches, threatening the viability of free ranging wildlife populations (McDonald and St. Clair, 2004; Fahrig and Rytwinski, 2009; Morales et al., 2010; Cozzi et al., 2013). Specifically, large-scale fencing can lead to genetic isolation of populations, fragmentation of habitats, and restricted access to vital resources such as food, water, and mates, ultimately leading to increased threats of local extinction for wide-ranging species (Harris et al., 2009; Cushman et al., 2016). The extent to which fencing influences the mobility of animal communities is governed by a combination of physical and behavioral aspects of the species, fence characteristics, and the environmental conditions in the vicinity of the fence (Wilkinson et al., 2021). In areas where there are minimal barriers to movement, such as within protected areas, animals exhibit larger, faster, and straighter movements. However, in human-dominated landscapes, where barriers to movement are common, animals exhibit shorter and slower movements as well as more complex movement paths (Turchin, 1991; Roshier et al., 2008; Wato et al., 2018). Animals also exhibit faster and straighter movements within human dominated landscapes where risk of persecution is high (landscape of fear) (Graham et al., 2009; Oriol-Cotterill et al., 2015).
Although there are several records of perimeter fences restricting carnivore movement, our understanding of their impacts within African ecosystems is limited (Cozzi et al., 2013; O’Neill et al., 2021). The impact of fences may be particularly detrimental in dryland ecosystems of Africa, where resources are limited and patchily distributed and mobility of both humans and wildlife is essential to access patchy resources (Durant et al., 2015). Thus, a thorough understanding of the role of fences on animal communities within such ecosystems is crucial to help develop appropriate conservation strategies for wildlife, especially along the periphery of protected areas (O’Neill et al., 2021). Lions (Panthera leo) and spotted hyenas (Crocuta crocuta, hyena hereafter) are two of the most charismatic and widely occurring carnivore species across Africa (Hatton et al., 2015). However, in the past 100 years, the population size and distribution of lions has declined significantly through a combination of human-lion conflicts, poaching, decline of prey, and loss of habitats (Lindsey et al., 2018). More than fifty percent of the current lion range occurs within protected areas, with the rest distributed across several human-dominated landscapes (Lindsey et al., 2017; Jacobson and Riggio, 2018). Fencing of protected areas as a tool for conserving lion populations is debatable, with Packer et al. (2013) suggesting use of fences as a cost-effective strategy while Creel et al. (2013) reported there was no evidence of fencing increasing the population size of lions. Similarly, although hyenas modify their activity patterns and habitat use to avoid detection and persecution by humans, enabling them to occur in close proximity to humans (Green and Holekamp, 2019), their populations have declined across Africa due to persistent human–carnivore conflicts (Bohm and Höner, 2015). Despite their behavioral adjustments, both predators have extensive home ranges that include multiple used areas outside protected reserves. They move between habitats and diverse land use types which allows them to maintain genetic connectivity between populations (Green et al., 2018). However, artificial barriers such as fences could disrupt this movement and reduce connectivity between habitats, thereby affecting ecosystem function.
In this study, we explore the impact of the perimeter fence surrounding Etosha National Park (Etosha, hereafter) in northern Namibia on the movement behavior of two large carnivores: lions and spotted hyenas. Etosha is one of the largest fenced protected areas in sub-Saharan Africa and is surrounded by a mosaic of communal and private lands with a multitude of land use. Etosha supports the largest population of lions and hyenas in Namibia (Weise et al., 2021). The perimeter fence is partially permeable to large carnivores as they move outside the park into private and communal lands, resulting in frequent livestock depredation events (Berry, 1983; Stander, 2004; Goelst, 2018) and retaliatory killings (Stander, 2004; Goelst, 2018). Approximately 10% of the Etosha lion population is estimated to be lost to human–carnivore conflicts each year (Goelst, 2018) and the disproportionate killings of sub-adult male lions outside Etosha have been reported to affect the social dynamics of lions within the park (Trinkel, 2013; Trinkel et al., 2016). In addition to subadults, a high proportion of adult female lions are also killed on farmlands bordering Etosha (Trinkel et al., 2016). Using data generated from GPS collars deployed on lions and hyenas both inside and outside Etosha, we studied the effects of the perimeter fence on the movement behavior of large carnivores and tested the following hypotheses:
1) Both lions and hyenas exhibit faster movement and more convoluted paths near the fence since it is an artificial barrier and large carnivores exhibit avoidance of such structures.
2) The Etosha fence would restrict the movement of lions and hyenas into the surrounding human-dominated landscape, but that individuals in proximity to the fence would exhibit occasional crossing behavior.
3) Both carnivores mainly cross the fence during night when they are most active and detection by humans would be lower.
4) Both carnivores cross the fence more in the wet season when wild prey is more dispersed in the landscape and more difficult to encounter and kill.
This study was carried out in the Greater Etosha Landscape (GEL) encompassing Etosha National Park and a surrounding 40-km buffer of human-dominated landscape (Weise et al., 2021) with a mosaic of communal and private free-hold lands, including communal conservancies, livestock and/or game farms, private game reserves, agricultural areas, and human settlements in Northern Namibia (Figure 1). Etosha NP covers an area of approximately 23,000 km2 and is enclosed by an 824 km long game-proof wire fence that was established in 1973 to prevent human–wildlife conflicts and reduce disease transmission from wild herbivores to livestock. Within the GEL, lions and hyenas were collared in Etosha, Ongava Game Reserve (hereafter Ongava), and the Hobatere Concession Area (hereafter Hobatere).
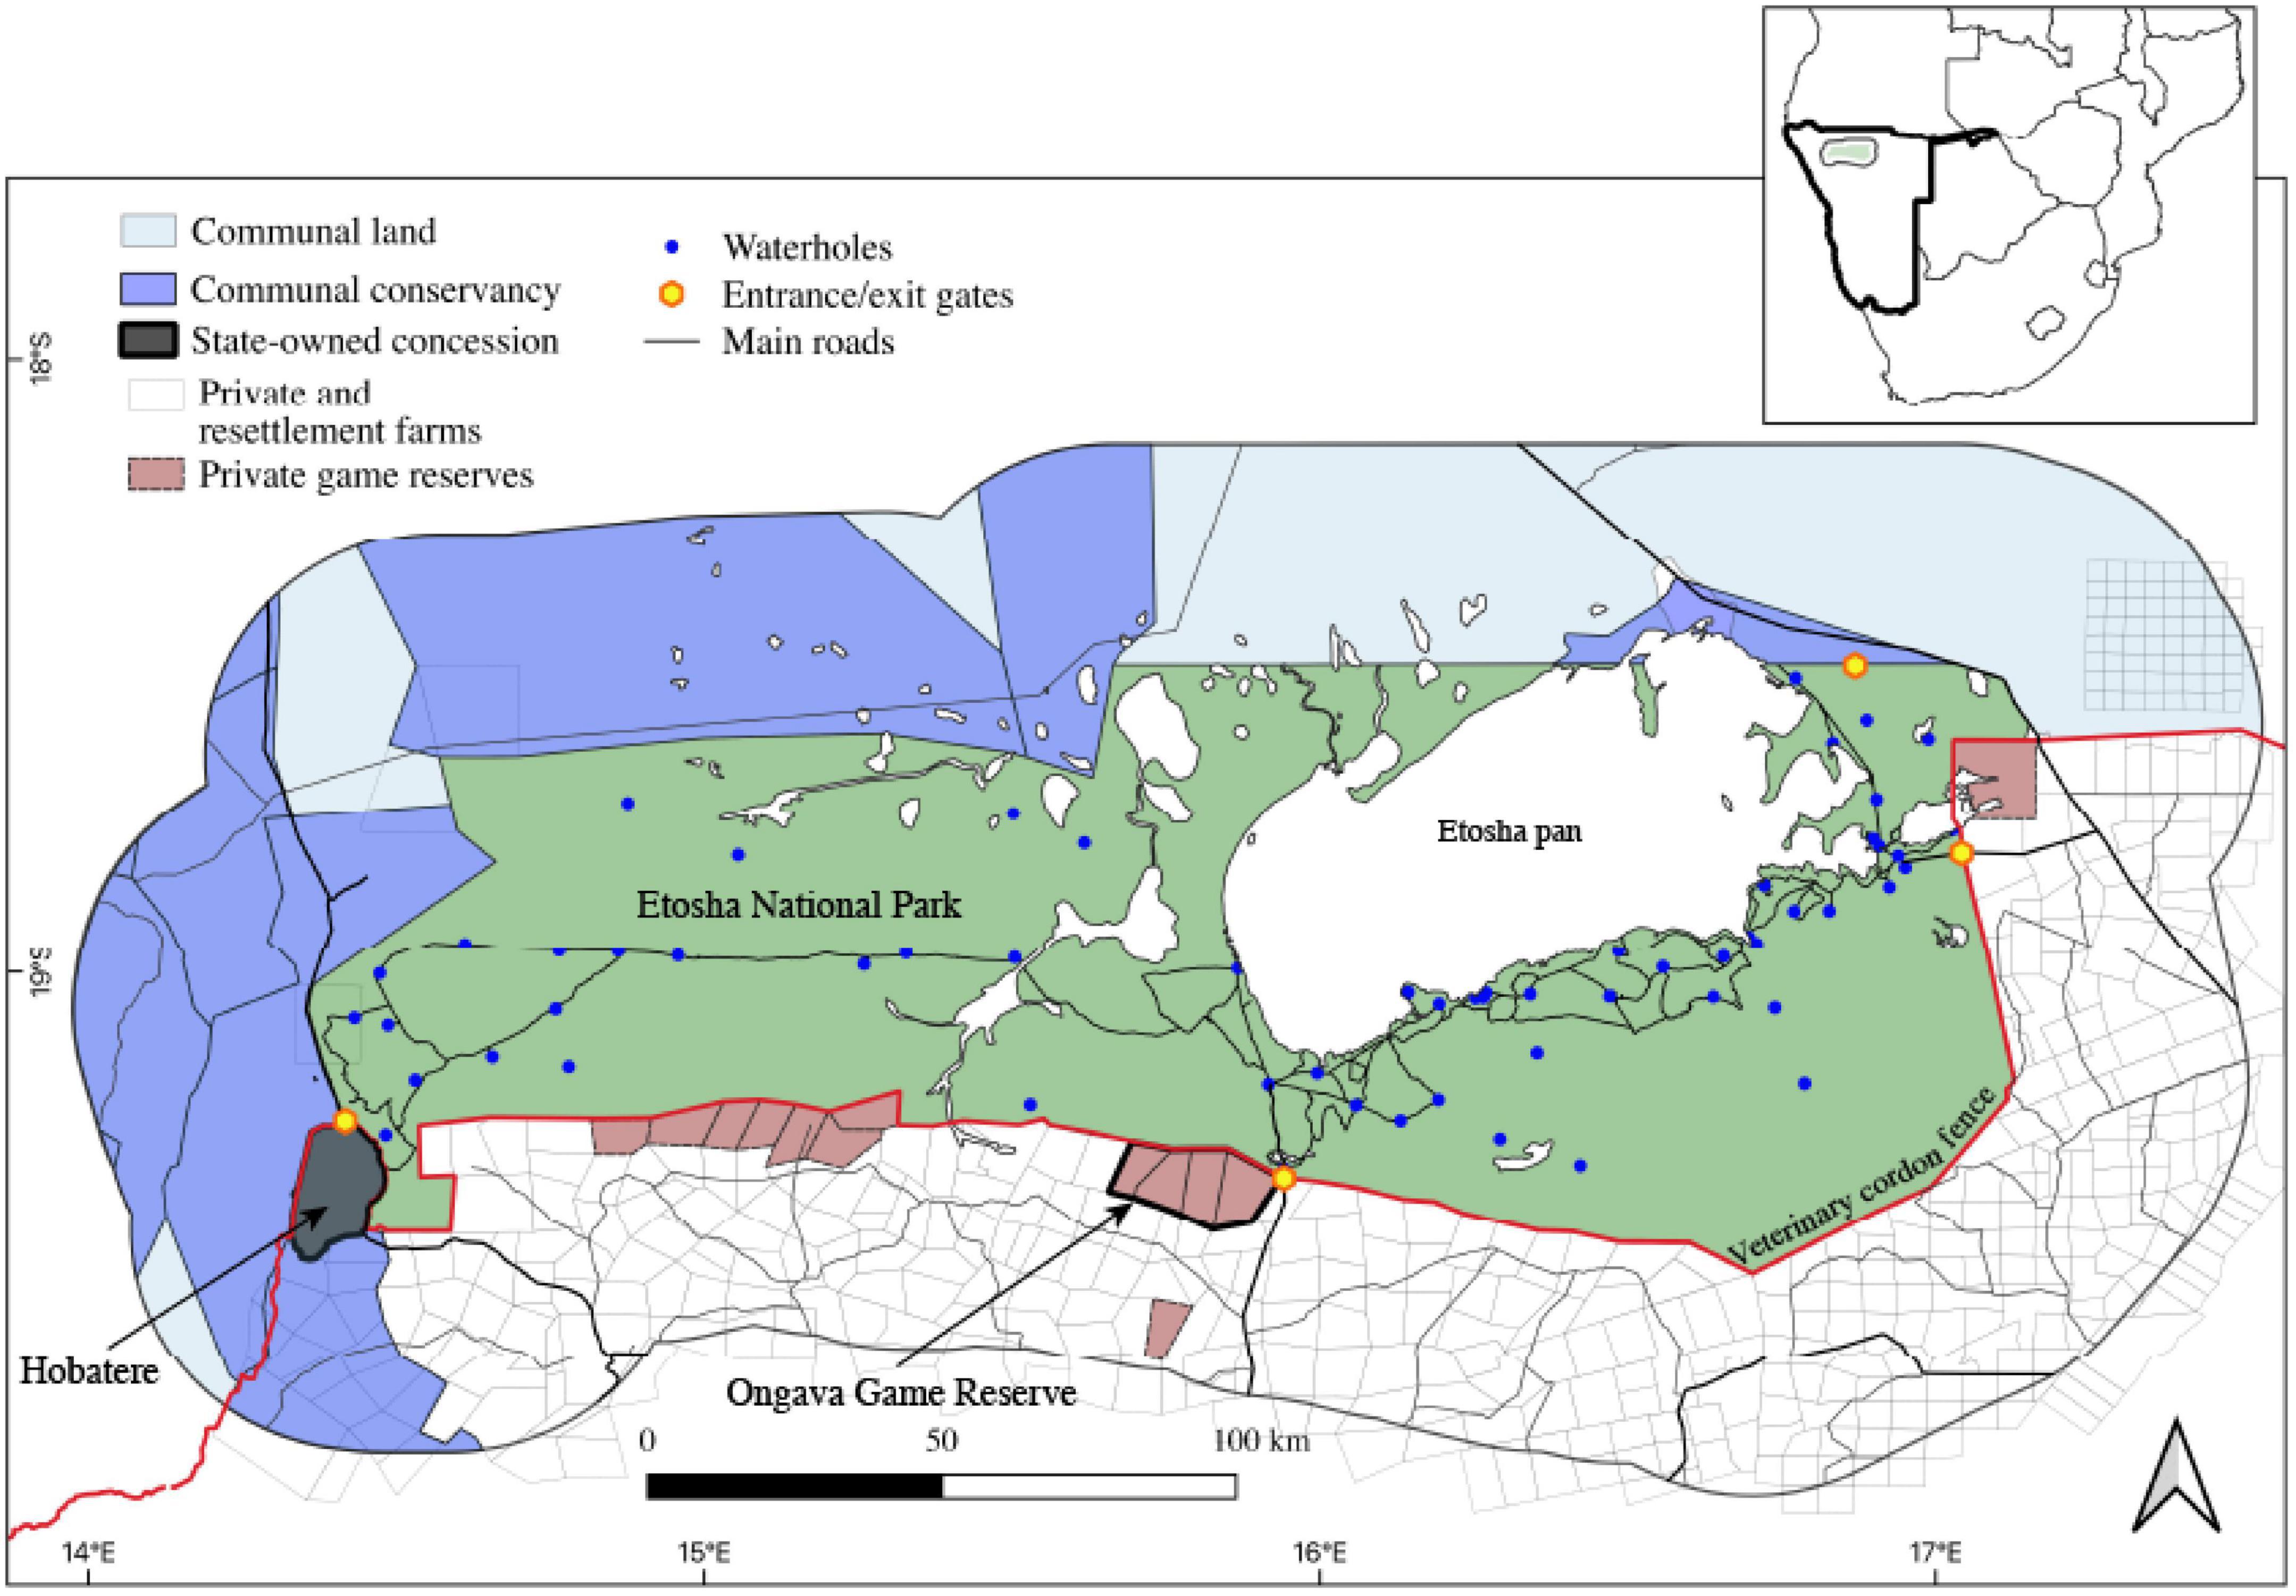
Figure 1. Study area encompassing the Greater Etosha Landscape in Namibia (Etosha National Park and the surrounding human-dominated landscape within 40 km buffer) along with the location of waterholes, entrance gates, roads, communal land, conservancies, concession areas, private game reserves, and private and resettlement farms.
The central part of Etosha is a salt pan which is comprised of a saline desert surrounded by shortgrass plains with an area of 4,800 km2 (Le Roux et al., 1988). Surface water is available throughout the year at natural springs and artificial waterholes across the park. The vegetation is comprised of grassy plains and adjacent woodlands with Colophospermum mopane (J Kirk ex Benth.) J. Leonard, acacia sp. (Acacia P. Mill.), Combretum Loefl., and tropical almond (Terminalia L.) as the dominant tree species (Le Roux et al., 1988). Etosha harbors a full guild of ungulates from megaherbivores (>1,000 kg) to small antelopes (<10 kg), of which plains zebra (Equus quagga) and springbok (Antidorcas marsupialis) are the most abundant (Ministry of Environment, Forestry and Tourism [MEFT], 2021). Etosha also supports source populations of several large carnivores including lion, spotted hyena, cheetah (Acinonyx jubatus) and leopard (Panthera pardus) and medium sized meso-carnivores including the brown hyena (Parahyaena brunnea).
Ongava covers an area of approximately 300 km2 located immediately to the south of Etosha and is completely fenced-in (Figure 1). At the time of collar deployment, the boundary fence between Ongava and Etosha was permeable to carnivores, but not to medium and large-sized herbivores, while the fence separating Ongava from farmland to the East, South, and West was a 2 m-high electrified game fence not permeable for carnivores. Ongava’s habitat is termed Karstveld, with vegetation comprised primarily (up to 70%) of Colophospermum mopane shrub and woodland, with some savannah-like areas (∼35%). There are several natural water dams on the reserve, although most of these only contain water during the wet season and water is supplied via artificial boreholes during the remainder of the year. Ongava supports a diversity of mammalian herbivores from mega-herbivores to small antelopes (Stratford and Stratford, 2011), as well as a complete guild of carnivores similar to those found in Etosha.
Hobatere is situated on the western periphery of Etosha and covers an area of approximately 320 km2 (Figure 1). The concession area supports most of the mammalian species occurring within Etosha. The habitat is dominated by Vachellia and Senegalia species and C. mopane woodland and savannah interspersed with undulating hillocks. Hobatere is surrounded by communal conservancies and freehold livestock farms. At the time of collar deployment, the fence between Etosha and Hobatere was permeable to most mammals including large carnivores and ungulates, which could move between the park and the concession area. This area also serves as an important corridor for wildlife moving from Etosha to the Skeleton Coast via communal farmlands which includes conservancies, concessions, and farms located within the Kunene region (Heydinger et al., 2019).
The mean annual precipitation in the region ranges between 200 and 600 mm with an increasing gradient eastward and most of the precipitation occurring between December and April (Turner et al., 2022). For our analyses, we distinguished three seasons based on rainfall and temperature patterns: warm wet (December to April), cold dry (May to August) and hot dry (September to November).
Between 2007 and 2020, we recorded locations for 89 lions and 22 hyenas using GPS-radio collars deployed on individuals in Etosha, Ongava and Hobatere (Figure 1). All immobilizations and collaring procedures were performed by veterinarians registered with the Namibian Veterinary Council. Details about this procedure can be found in Stratford and Stratford (2011); AfriCat Hobatere Lion Research Project [AHLRP] (2016).
For the analyses, we only considered individuals that used areas within a 40 km buffer of the perimeter fence of Etosha (both inside and outside the park). The choice of 40 km as a buffer was motivated by the fact that the majority of human–carnivore conflict events are recorded within this distance of the Etosha fence (Goelst, 2018; Turner et al., 2022). The criteria for selecting the individuals included in our analysis were a) that they did not occupy the core areas of the park and b) had home ranges in the peripheral areas of the park and the surrounding human-dominated landscape. By limiting our analysis to individuals with territories at the periphery of the park we were able to quantify how the perimeter fence affects carnivore movements. Collars were programmed to record GPS locations at various frequencies (15-min to 6-h intervals), although the majority recorded locations at 2-h intervals or less. Therefore, we subsampled locations to obtain a consistent 2-h interval (± 20 min) for both species, and individuals or periods during which GPS locations were obtained at longer intervals were discarded from the analyses. After subsampling, 36 lions (15 lions within Ongava, 14 lions within Hobatere, and seven lions within Etosha) and seven hyenas (two within Ongava and five within Etosha, Figures 2, 3) had sufficient data for inclusion in our analyses. All analyses were performed using R software (R Core Team, 2020).
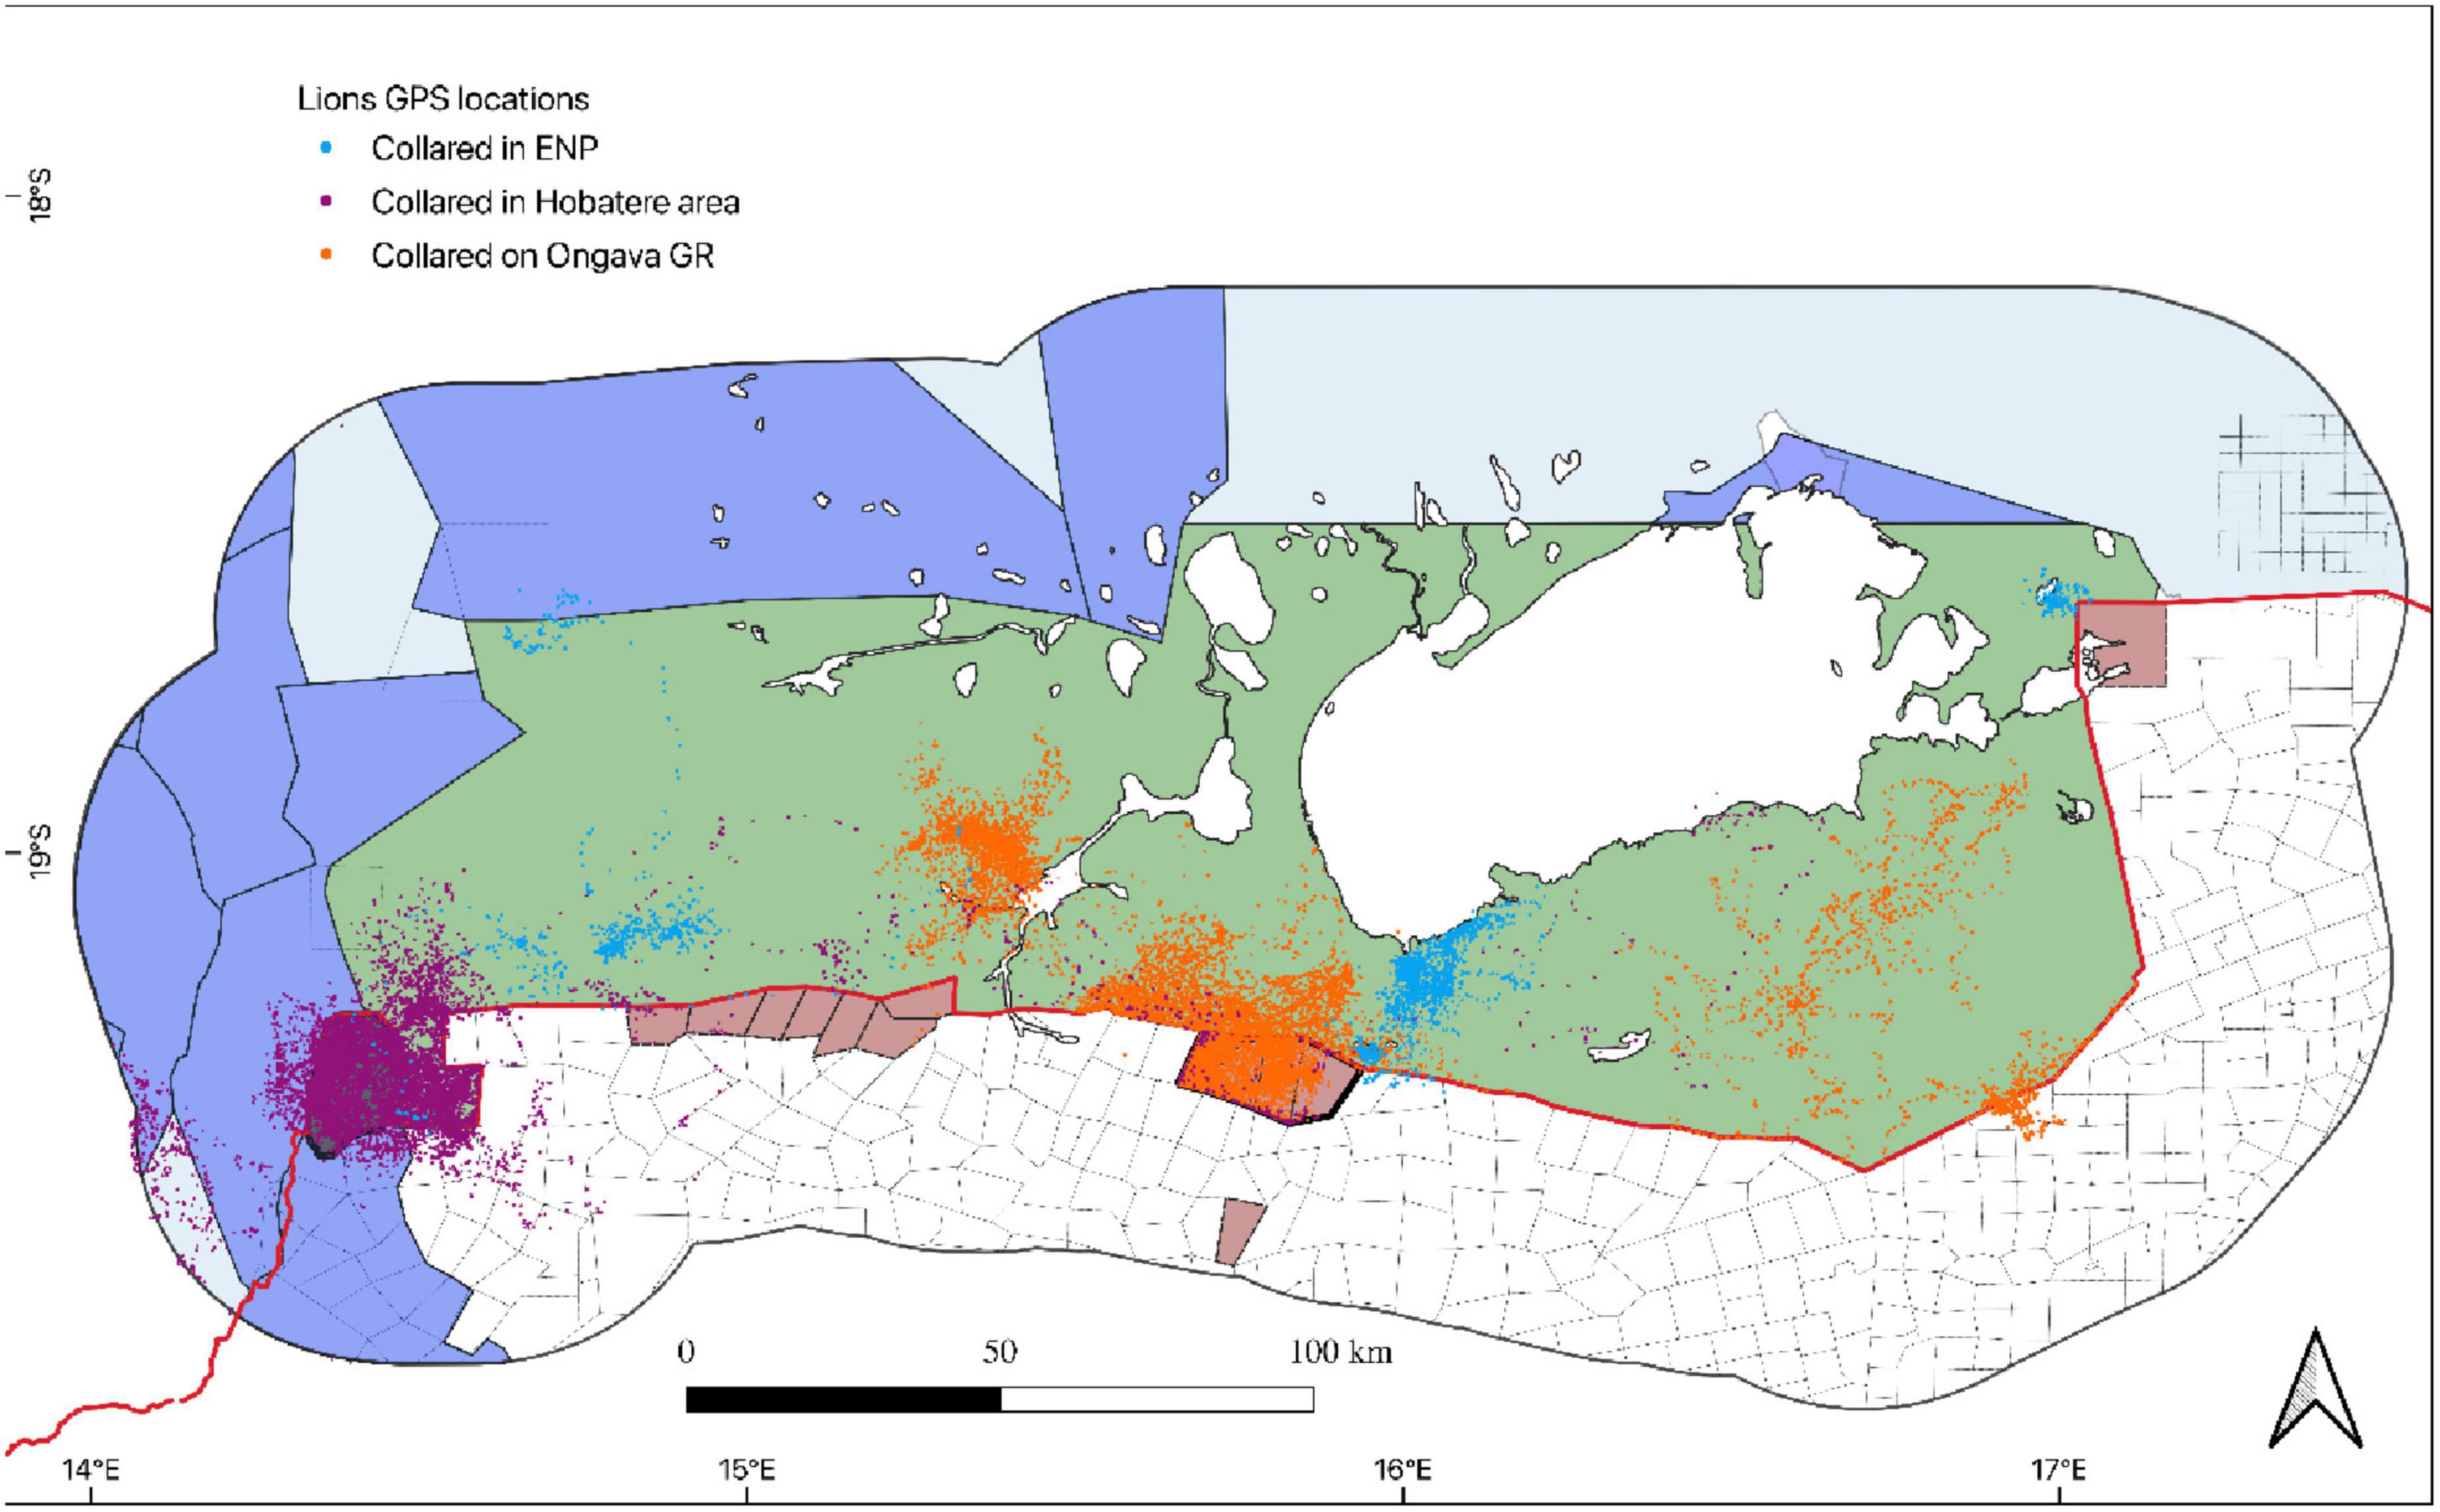
Figure 2. GPS locations 2-h interval of lions (Panthera leo), collared within the Greater Etosha Landscape in Namibia between 2007 and 2020.

Figure 3. GPS locations 2-h interval of spotted hyenas (Crocuta crocuta) collared within the Greater Etosha Landscape in Namibia between 2008 and 2020.
To test the effect of the Etosha fence on the movement behavior of lions and hyenas, we quantified variation in step lengths and path straightness relative to their proximity to the fence. We categorized GPS locations based on whether they were inside or outside Etosha and computed their distance to the fence. We calculated the quantiles (20, 50, 75, and 95%) of the distribution of locations relative to their distance to the fence. Since 75% of GPS locations were within 10 km from the fence, we classified locations into three distance categories: 0–0.5 km, 0.5–1 km and >10 km from the fence. These distance categories were selected so that a comparison could be made between carnivore movements in areas with (0–0.5 km and 0.5–1 km distance from fence) and without fences (>10 km distance from fence).
We defined step length as the distance travelled between consecutive GPS locations using the “amt” package in program R (Signer et al., 2019; R Core Team, 2020). Based on their starting location, we assigned each step to one of three seasons defined above and one of two times of the day: either day or night based on sunset and sunrise times. Only steps with starting and ending locations in the same category of distance (defined above) to the Etosha fence were used in the analyses.
We defined paths as successive steps starting and ending in the same season, same time of day and same category of distance to the fence. For each path, we computed its straightness defined as the ratio between the net displacement (the straight-line distance between the path starting and ending locations) and the total displacement (the sum of all step lengths within the path). Path straightness varies between 0 and 1 with values close to 1 typical of straight movement while values close to zero suggest a convoluted movement path (Almeida et al., 2010). We only considered paths comprised of at least four steps in our analyses as we considered paths composed of fewer steps to be less reliable for estimation of net and total displacement (defined below).
For each species, we built separate linear mixed-effects models with either step length or path straightness as dependent variables and included season, time of day, sex, age, and distance category from the Etosha fence as fixed effects. Animal ID was used as a random intercept to account for pseudo-replication. We also included the interaction between time of day and distance from the fence. For hyenas, only adult females were collared, hence sex and age were not included in hyena models. We performed these analyses using the “lme4” R package (Bates et al., 2013). We verified model assumptions by plotting fitted residuals against all covariates included (Zuur and Ieno, 2016).
We investigated the likelihood of crossing the Etosha fence by comparing the number of times lions and hyenas crossed the fence to the number of times they had the potential to do so but did not (whichever side of the fence they were on). To identify situations where animals could have crossed the fence, we first calculated the average step length for both species. The average step length was 640 m for lions and 1,100 m for hyenas. We added an additional buffer and approximated these distances to 700 m for lions and 1,200 m for hyenas and assumed that animals within these distances from the fence would have the opportunity to cross the fence within the following 2 h. These threshold values for the buffer width did not exceed 10% of the average step length for both species. We classified each step as a crossing or non-crossing using the following rules. We first classified non-crossing steps as those with starting and ending locations on the same side of the fence, except for those that ended within 10 m of the fence. Due to potential GPS error, these ending locations could have actually been on the other side of the fence. For these steps, we classified them as crossing only if the ending location of the following step was the on opposite side of the fence from the starting location, otherwise they were classified as non-crossing. All steps with the ending location more than 10 m from the fence and on the opposite side compared to the starting location were classified as crossings. Once a crossing event was confirmed, we calculated how long individuals spend on other side of the fence by plotting the successive locations using Arc Map and Google Earth. We checked whether all individuals returned to the park or remained outside based on the date, time, and location of successive 2 h interval GPS fixes for movement paths using Google Earth. We also used Arc Map and Google Earth to determine whether individuals returned to the park at the same place of fence crossing or if they returned through fence gaps in a different location along the boundary fence.
We calculated the proportion of crossings versus non-crossings stratified by time of day, season, and sex for both species, as well as age for lions only and estimated the monthly average number of fence crossings per individual for both species. We also computed the proportion of crossings from Etosha to areas outside the park as well as from outside the park to Etosha. Based on the spatial distribution of crossing events, we visually identified hotspot areas along the perimeter fence where crossings were frequent using Arc Map 10.5.0. Finally, we checked for differences in Etosha fence crossing likelihoods between the two species.
To explore the effects of landscape, environmental, and individual attributes on the probability of fence crossings, we assigned the starting location of each step to a habitat type using the land cover map of Namibia (ESRI, 2009). To consolidate similar habitat types, we reclassified habitats into five major categories: (i) closed to open grassland, (ii) closed to open shrubland, (iii) mosaic of forest, shrubland, grassland, (iv) mosaic of vegetation and croplands, and (v) open broadleaf deciduous forest. We classified each step into four major land use types based on their starting location: national park, communal conservancy, farmland, and game reserve, and examined the proportion of locations within these land use types. We also categorized each step as within a protected area (PA) or not, with Etosha, Ongava, Onguma (Private Game Reserve) and Hobatere as PAs whereas locations within conservancies and farms were considered non-PA. We analyzed the Etosha fence crossing likelihood separately for each species using generalized linear mixed-effects models with a binomial distribution using crossing (crossing: 1 and non-crossing: 0) as a binary response variable. Season, time of day, habitat type, land use type, sex, and age (sex and age were excluded from hyena models) were considered as fixed effects while animal ID was added as a random intercept. For land use type, we only considered two categories: PA and non-PA. We also included the interaction between time of the day and land use type in our models. We verified model assumptions by plotting fitted residuals against all covariates included (Zuur and Ieno, 2016).
This project was approved by the Ministry of Environment, Forestry and Tourism and National Commission on Research, Science and Technology and data collected under the permit 1479/2010 for Ongava, RCIV00072018 for Etosha and 2066/2015 for Hobatere.
Based on the 2-h intervals, we obtained 109,524 locations from 36 lions and 8,006 locations from seven spotted hyenas across 14 years (2007–2020). For lions, we had data from 22 males (14 adults, eight subadults) and 14 females (12 adults, two subadults) whereas for hyenas our data only included adult females.
For lions, movement steps were significantly longer in the cold dry season compared to the warm dry and warm wet season (Supplementary Table 1). There was no difference in step lengths between adult and subadult lions and male and female lions. Step lengths were significantly longer inside the national park than outside. Steps were longer at night than during the day (Figure 4A). The step lengths were significantly affected by the interaction between time of the day and distance to the fence. The step lengths were greater in the vicinity of the fence (0–0.5 km) compared to (0.5–1 km) and (>10 km) distance categories both during the day and night (Figure 4A and Supplementary Table 1).
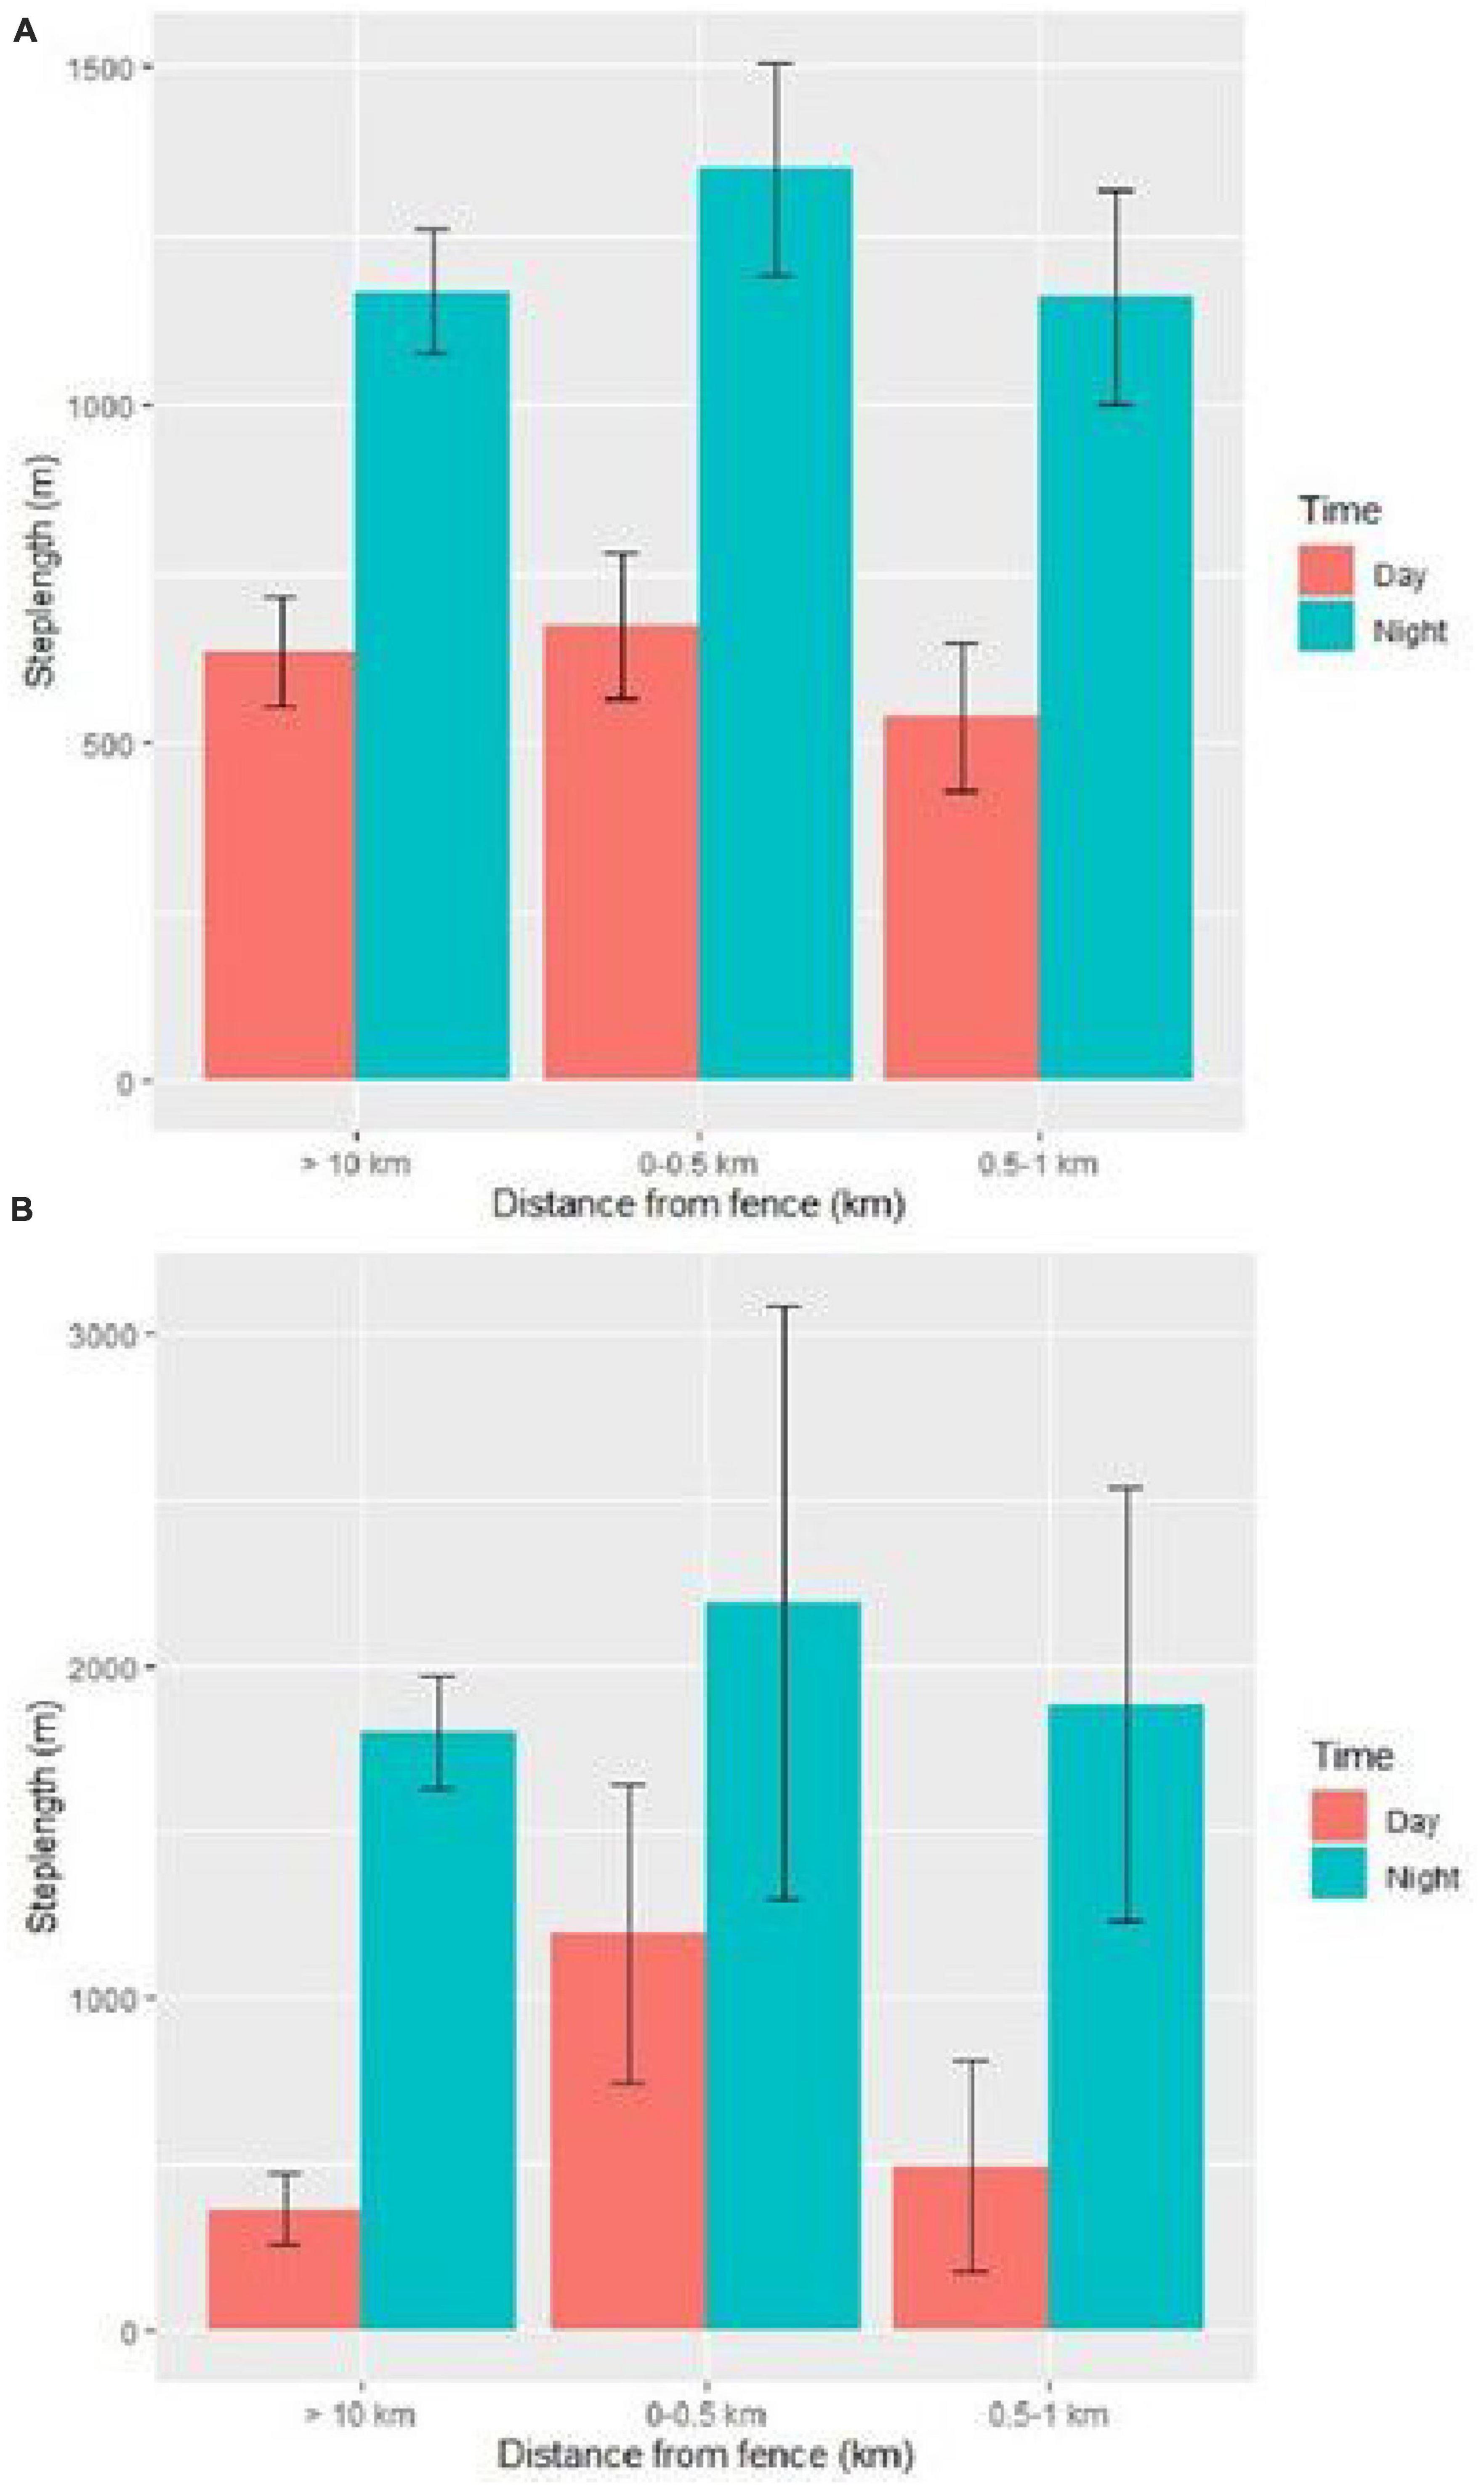
Figure 4. Step lengths of lions (A) and hyenas (B) subset by time of day for different distance categories from the Etosha National Park fence in Namibia based on beta coefficient values from the mixed-effect models regarding effect of the Etosha fence on step lengths of large carnivores. Error bars represent the standard error for the step lengths within each category. Movement data was obtained from GPS collars deployed from 2007 to 2020.
For hyenas, movement steps were longer in the cold dry season compared to the warm dry season (Supplementary Table 2). There was no difference between step lengths inside or outside Etosha. The steps were longer at night than during the day (Figure 4B). There was no significant effect of the interaction between time of day and distance to the fence on the step length of hyenas. Step lengths were greater in the vicinity of the fence (0–0.5 km) compared to (0.5–1 km) and (>10 km) distance categories both during the day and night (Figure 4B and Supplementary Table 2).
The step lengths were longer for both species in the closest to fence category.
Movement paths of lions were straighter in the cold dry season compared to the warm dry and warm wet season (Supplementary Table 3). Age and sex had no effect on path straightness of lions in relation to the fence. The path straightness values were larger during the day compared to night (Figure 5A). The path straightness of lions was not affected by the interaction between time of day and distance to the fence as there was no variation in path straightness values between day and night and within different distance categories from the fence (Figure 5A and Supplementary Table 3).
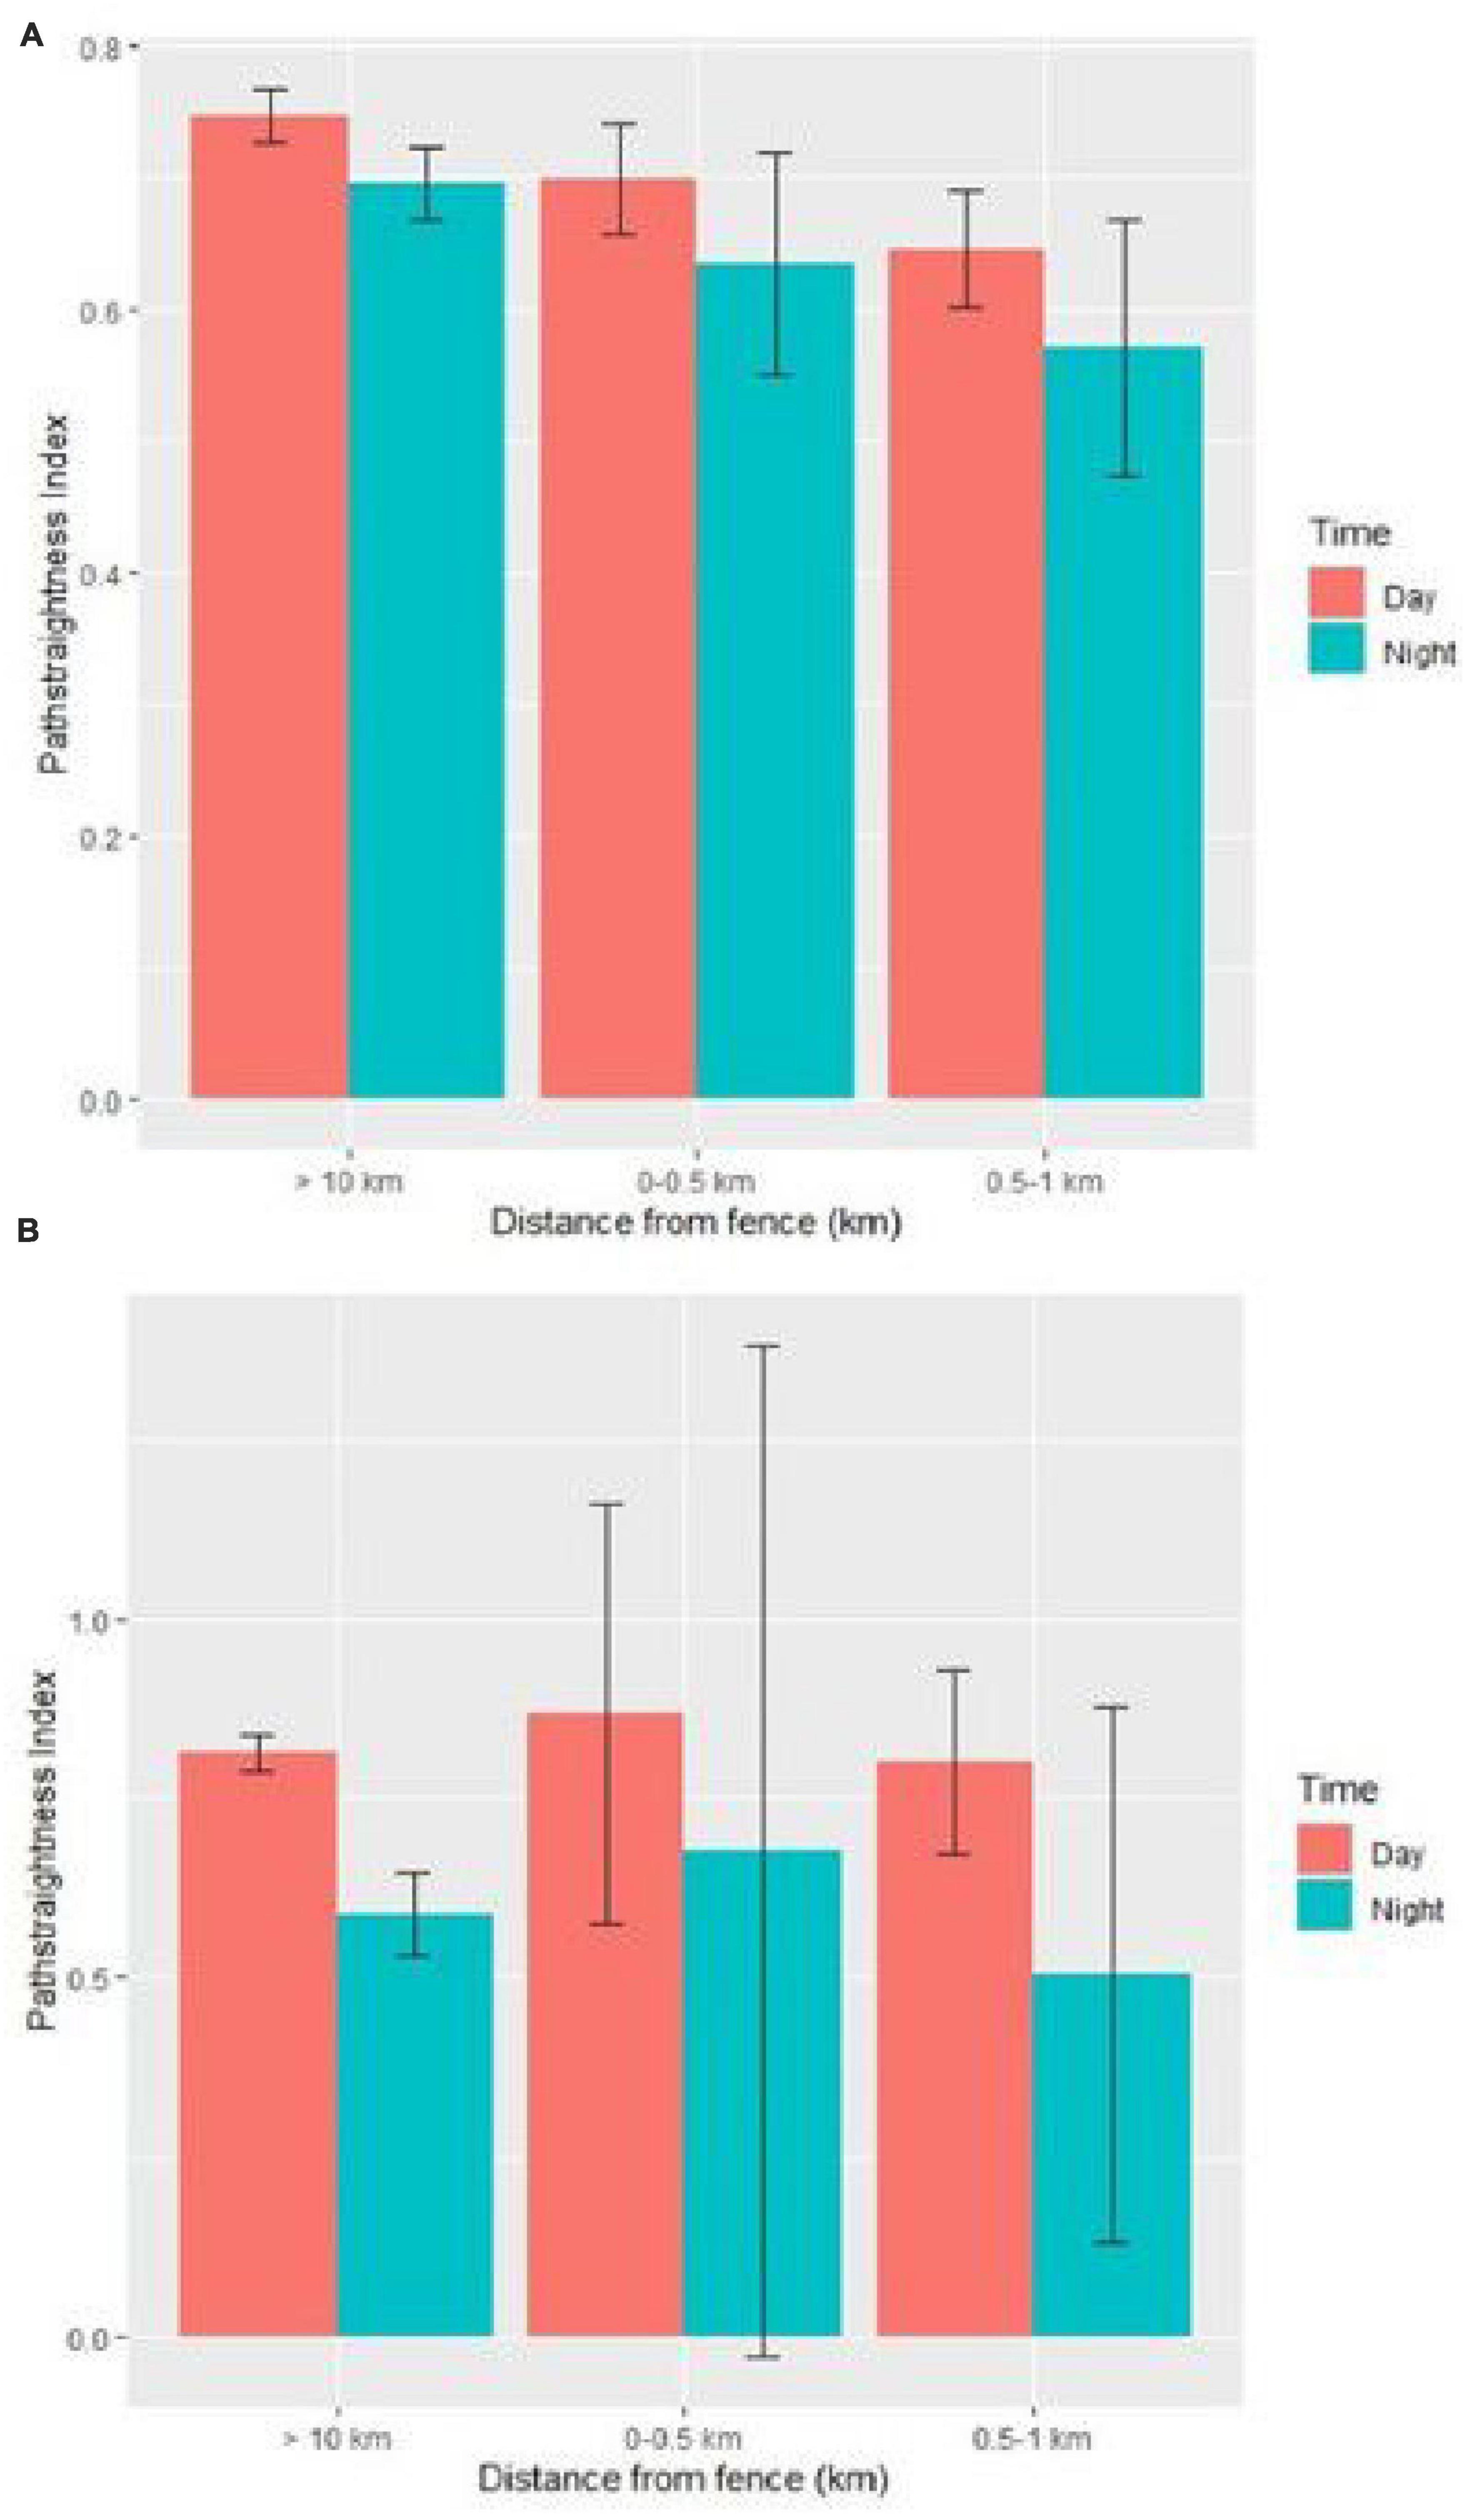
Figure 5. Path straightness of lions (A) and hyenas (B) subset by time of day for different distance categories from the Etosha National Park fence in Namibia based on beta coefficient values from the mixed effect models regarding effect of the Etosha fence on path straightness of large carnivores. Error bars represent the standard error for the path straightness within each category. Movement data was obtained from GPS collars deployed from 2007 to 2020.
Movement paths of hyenas were significantly straighter in the cold dry season compared to the warm dry season (Supplementary Table 4). The path straightness values were larger during the day resembling straighter paths compared to the night (Figure 5B). There was no significant effect of the interaction between the time of day and the distance to the fence on the path straightness for hyenas. Hyena movement paths were straighter in the vicinity of the fence (0–0.5 km) compared to (0.5–1 km) and (>10 km) distance categories both during the day and night (Figure 5B and Supplementary Table 4).
Overall, there was no difference in path straightness index for lions but hyenas exhibited straighter paths closer to the fence.
During the tracking period (2007–2020), 27 lions moved within the average step length distance (700 m) from the fence. Of these, 24 (89%, including adults and subadults) crossed the fence at least once. Of those individuals that crossed, each lion crossed the fence on average once per month (range = 1–4, SD = 1.2). There was a total of 5,810 steps within the average step length and only 511 of these resulted in a crossing; thus, the likelihood of crossing based on our criteria was 8.8%. Ninety-two percent of males and 85% of the females that had territories within the periphery of the park crossed the fence (based on the 27 lions near the fence). Only 6% of steps recorded during the day (which represent 47% of the dataset) resulted in a crossing, whereas 11% of the steps at night resulted in crossing events. Only 10% of steps resulted in a crossing during the warm dry season (44% of the dataset), 9% during the cold dry season (31% of the data), and 8% during the warm wet season (25% of the data). Overall, 55% of the starting locations for all steps (N = 5,810) within the average step length were within Etosha, 23% within farms, 14% within game reserves, 7% within concessions, and 1% within a communal conservancy. The proportion of fence crossings by lions (inside and outside of Etosha) was similar i.e., 50% each, so the likelihood of crossing the fence was equal when lions were inside or outside of Etosha. Lions spent an average of 13 h (range 2–192, SD = 26.23) on the other side of the fence. Seventy-eight percent of the lions returned to the side of the fence from where it crossed. Individuals that came back returned on the same area of the fence 53% of the time. The remaining individuals travelled an average of 1,660 m (range 100–15,000, SD = 2456.43) before crossing through another gap in the fence.
Most of the lion fence crossings occurred on the south-western, south-central and south-eastern periphery of Etosha in the vicinity of commercial livestock farms, private game reserves and wildlife concession areas (Figure 6). Hotspots were identified near the main entrance gates (i.e., the Galton gate and Andersson’s gate) on the south-western and south-central periphery of the park. Galton gate is adjacent to Hobatere and the communal conservancies and livestock farms, whereas Andersson’s gate is adjacent to Ongava and livestock farms. Fence crossing locations on the south-eastern periphery of Etosha were adjacent to livestock farms. The fence crossings in the north-western tip of the park were in close proximity to a communal conservancy with cattle posts and homesteads.
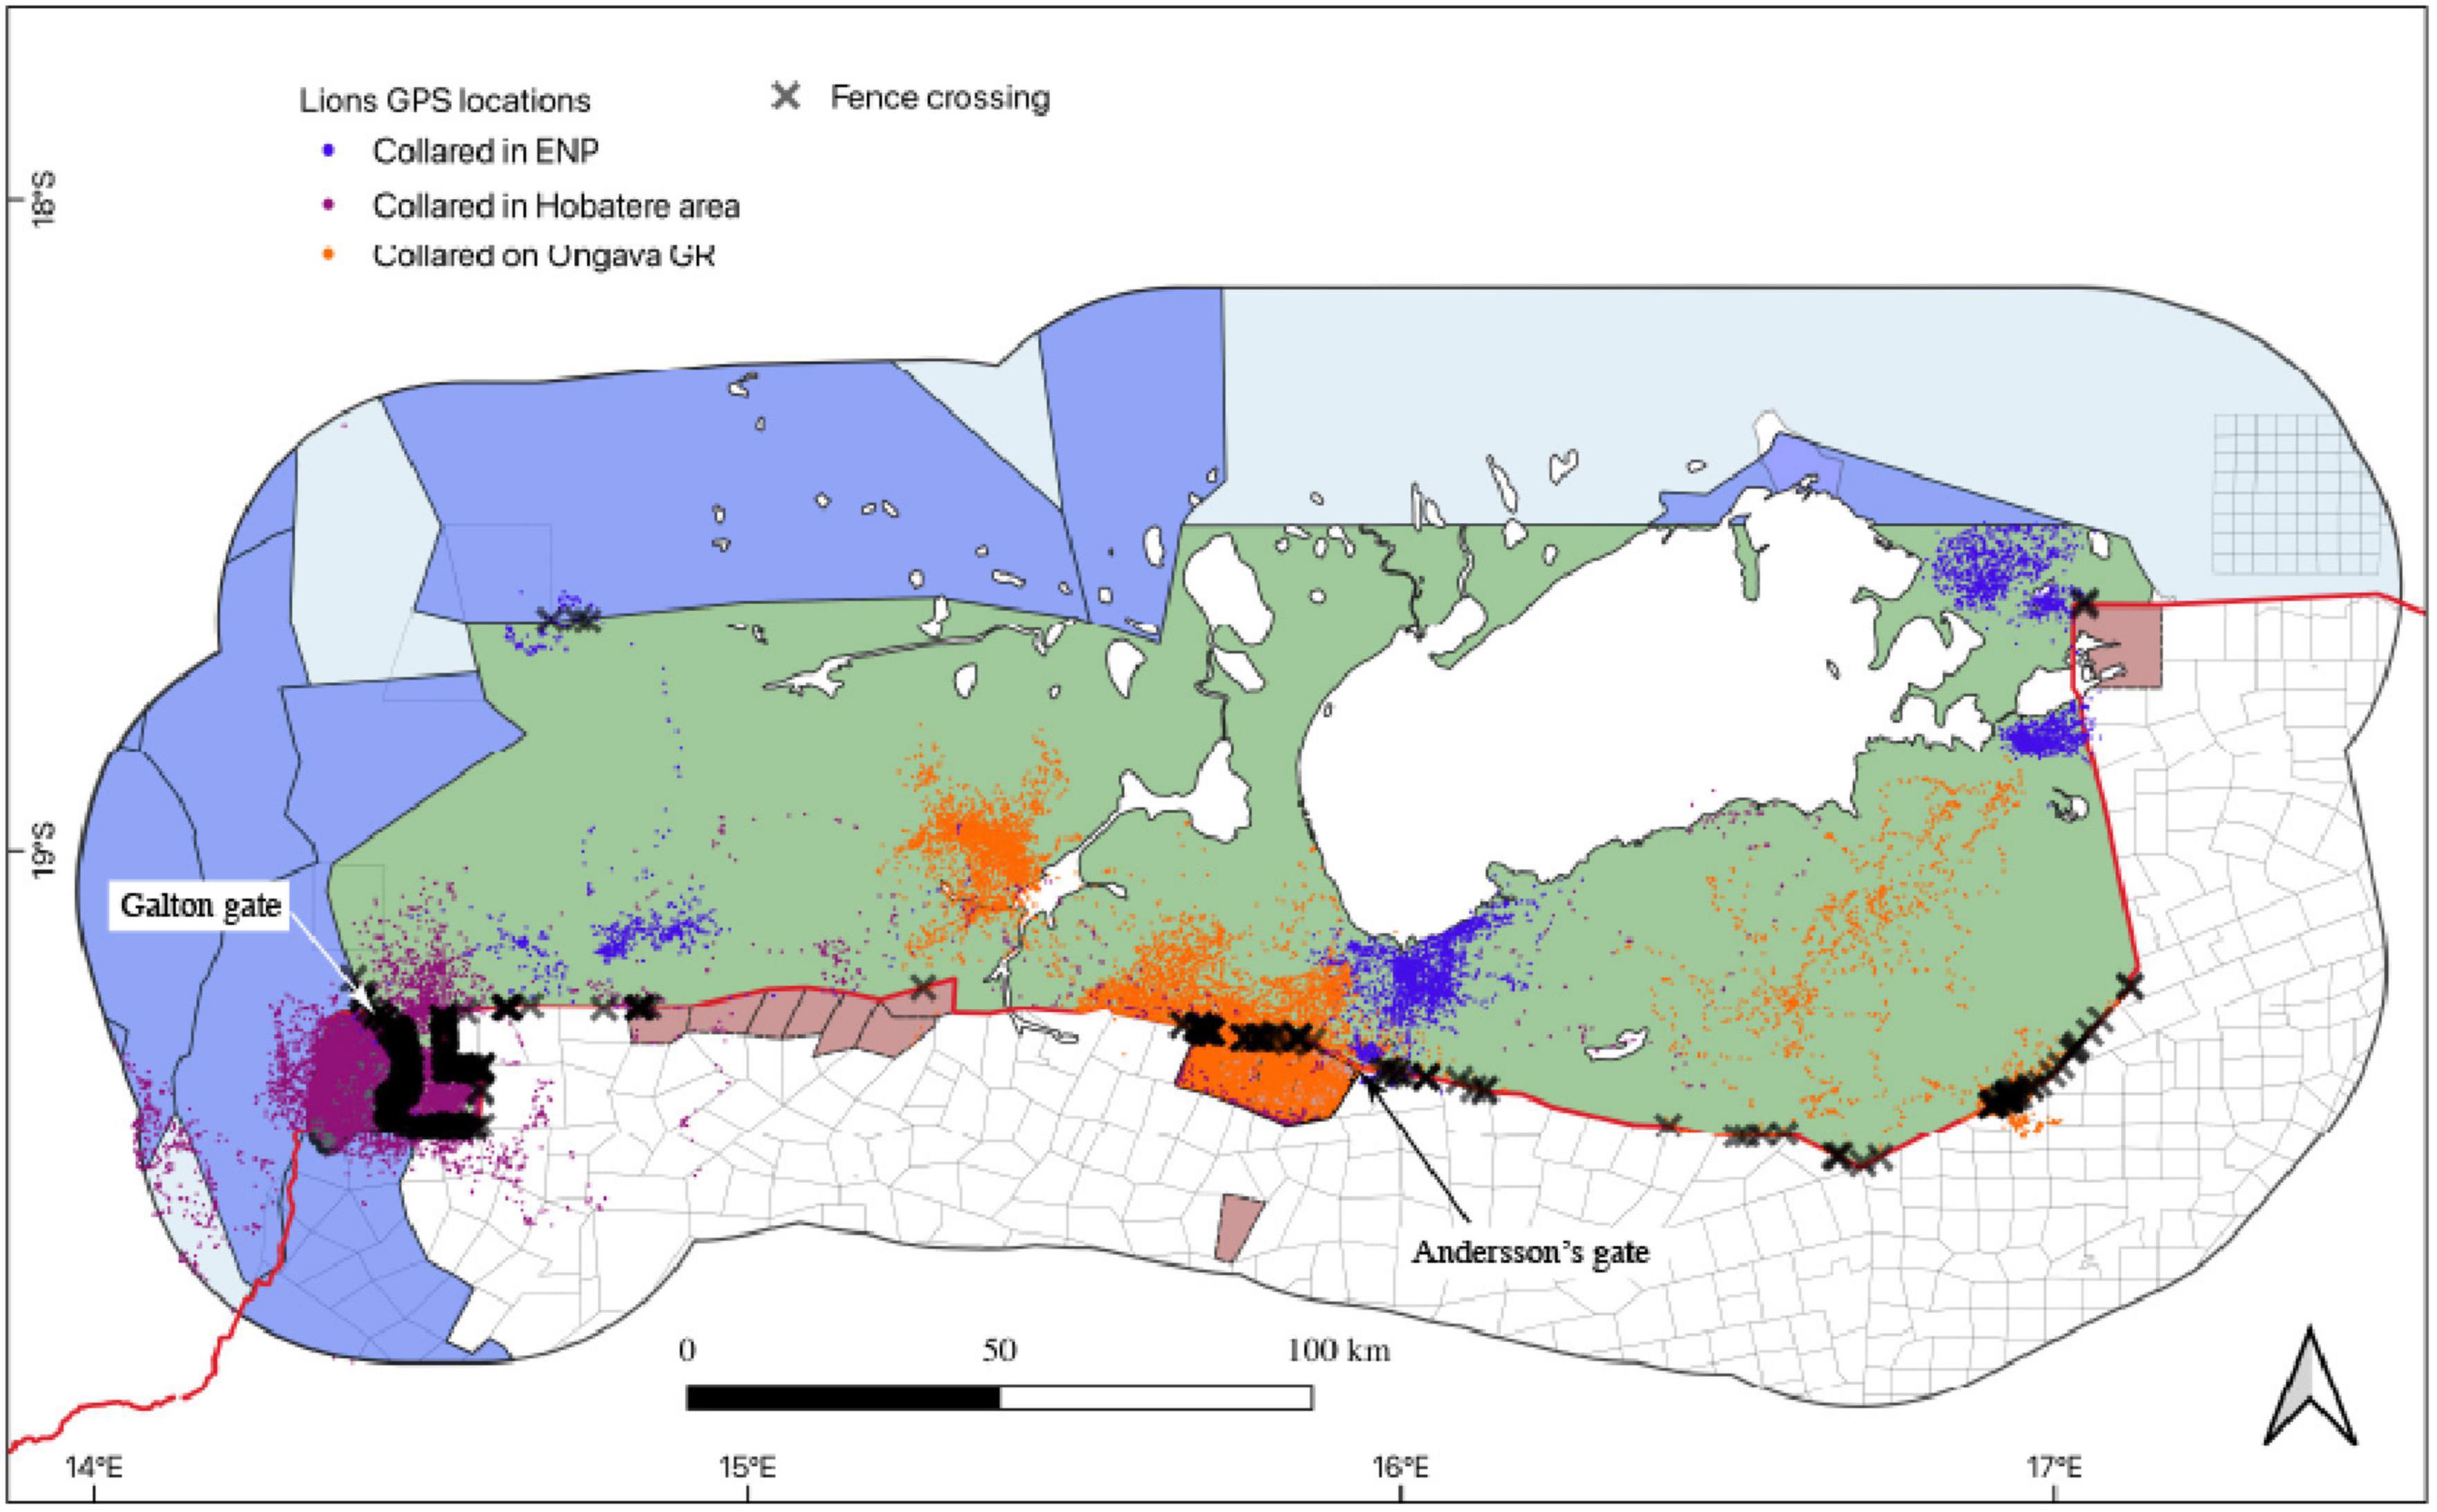
Figure 6. Locations of GPS-collared lions and hotspots of Etosha National Park fence crossings in Namibia obtained from 2007 to 2020.
Lions had a higher probability of crossing the fence in the cold dry season compared to the warm wet season (Supplementary Table 5). The interaction between time of the day and land use type had no effect on the probability of fence crossings (Supplementary Table 5) but both variables influenced the probability of fence crossings. The probability of crossing was greater during the night and from protected areas compared to the day and non-protected areas. Adults and females had a higher probability of crossing than subadults and males. The probability of crossing was significantly higher when lions were within a mosaic of vegetation, cropland, and closed to open shrubland habitat.
During the tracking period (2008–2020), seven hyenas came within the average step length distance from the fence (1,200 m) and therefore had the opportunity to cross it. Of these, 6 hyenas crossed the fence at least once. Each hyena crossed the fence on average once per month (0–1, SD = 1). There was a total of 389 steps within the average step length (1,200 m) of the fence, of which 68 resulted in a successful crossing; thus, the likelihood of crossing was 17.5% based on our criteria. Only 6% of the steps recorded during the day within the average step length distance (which represented 36% of the dataset) resulted in a crossing whereas at night 24% resulted in a crossing. Based on the overall number of steps which resulted in a successful crossing, 33% resulted in a crossing during the warm wet season (28% of the dataset), 14% resulted in a crossing during the warm dry season (43% of the dataset), and 11% resulted in a crossing during the cold dry season (29% of the dataset). Seventy percent of the actual fence crossings by hyenas represented movements from outside the park into Etosha, whereas only 30% represented movements from inside Etosha to outside. The likelihood of crossing the fence was higher when hyenas were outside Etosha. Overall, 59% of the starting locations for all steps (N = 389) were within Etosha, 21% within farms, 19% within game reserves and only 1% within communal conservancies. Upon crossing, hyenas spent an average of 11 h (range 2–48, SD = 17.91) on the other side of the fence. All the hyenas returned through the same area side of the fence from where they crossed. After crossing, hyenas returned through the same area of the fence 33% of the time. The remaining individuals travelled an average of 1,745 m (range 480–4,100, SD = 1608.34) before crossing through another gap in the fence.
The majority of hyena fence crossings occurred on the southern-central and north-eastern periphery of Etosha, in the vicinity of where these individuals were collared (Figure 6). On the south-central periphery of Etosha, hotspots were identified near the main entrance (the Andersson’s Gate adjacent to the Ongava Private Game Reserve). On the north-eastern periphery, hotspots were identified near the main entrance gates (Von Lindequist and King Nehale) located in close proximity of the Onguma Private Game Reserve and King Nehale Communal Conservancy (Figure 7).
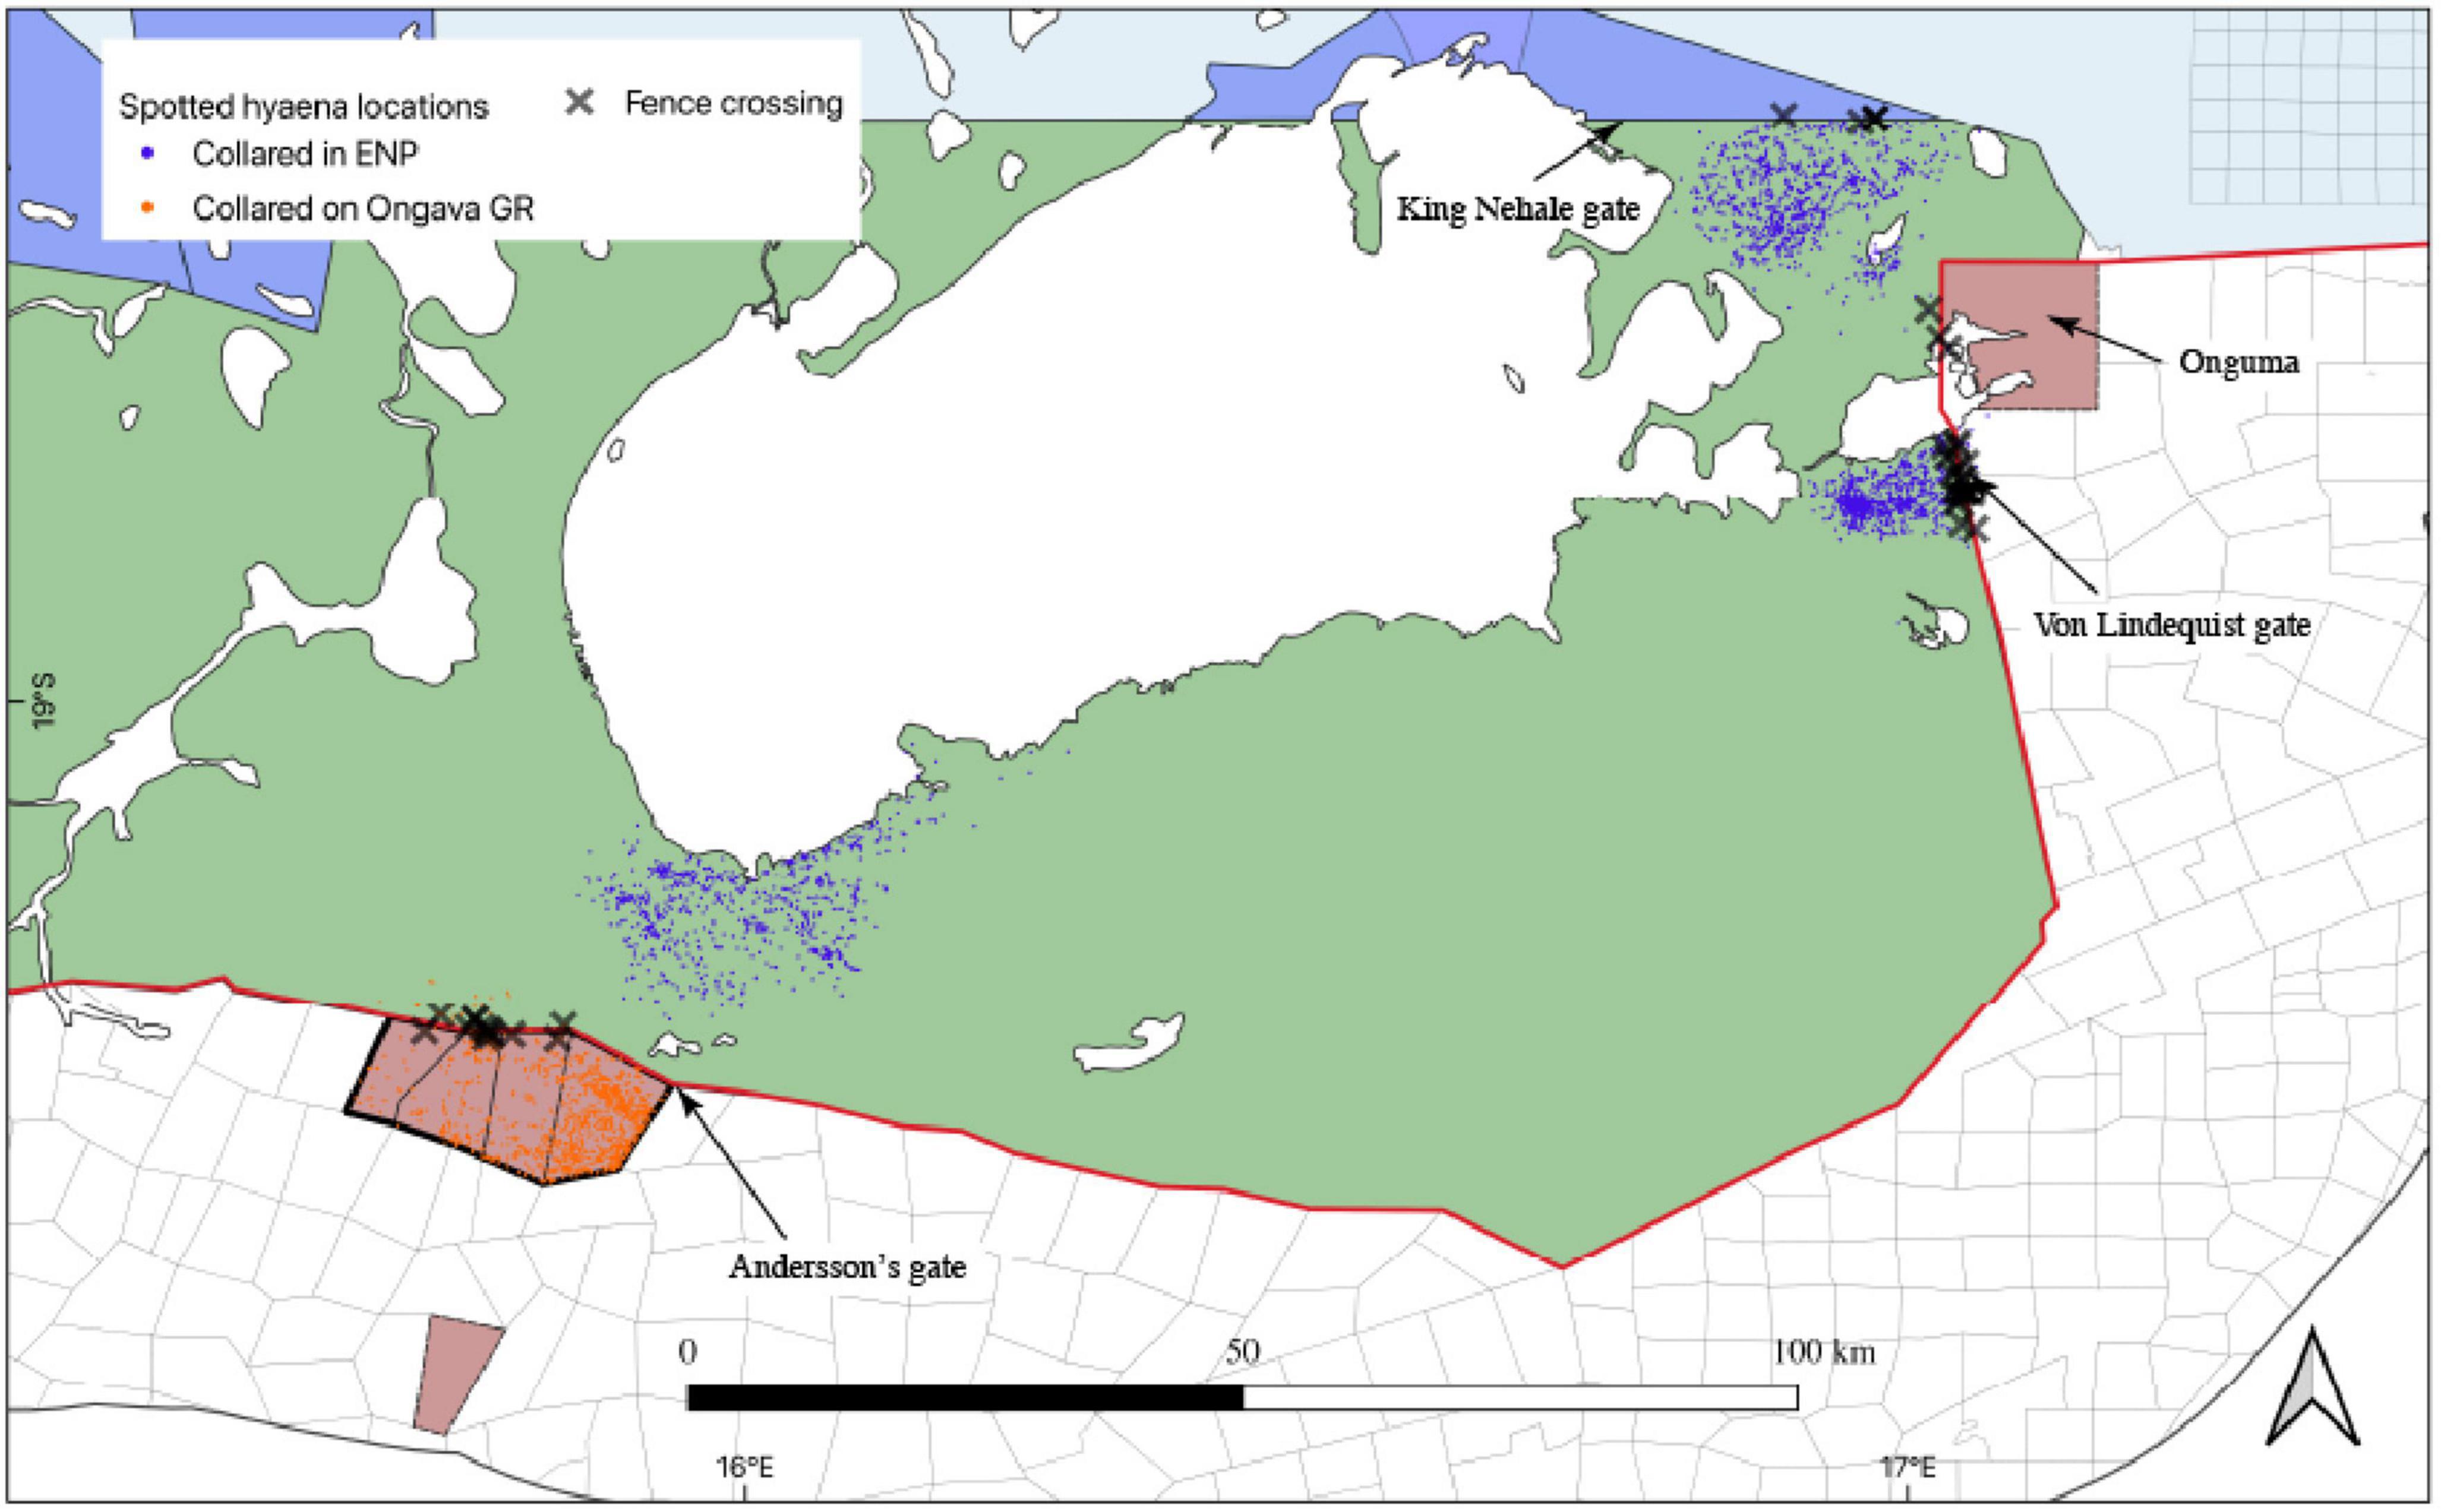
Figure 7. Locations of GPS-collared hyenas and hotspots of Etosha National Park fence crossings in Namibia obtained from 2008 to 2020.
Hyenas had a higher probability of crossing the fence in the warm wet season compared to the cold dry and warm dry seasons (Supplementary Table 6). Habitat type had no significant effect on the probability of fence crossings. The fence crossings were significantly affected by the interaction between time of the day and land use type with the probability of crossings higher during the night and from protected areas compared to the day and non-protected areas (Supplementary Table 6).
Understanding the effects of artificial barriers, such as perimeter fences around protected areas, on the ranging behavior of large mammals is fundamental to assessing their overall effectiveness as a tool for management and conservation. GPS collars deployed on lions and hyenas in the Etosha landscape provided a unique opportunity to understand the impact of fences on large carnivore movements along the periphery of semi-arid protected areas in sub-Saharan Africa. Our results partially support hypotheses 1 and 4 that large carnivores would exhibit faster movements near the fence and seasonal pattern of fence crossings. Our results also were in accordance with hypotheses 2 and 3, indicating that the Etosha fence restricts the movement of large carnivores and that carnivores cross the fence more frequently at night. However, although the perimeter fence restricted large carnivore movement our results revealed it was permeable as most lions and hyenas that had home ranges adjacent to the park boundary crossed the fence on numerous occasions. The permeability of the fence differed between the two species, and was more effective at restricting lion movement compared to hyenas.
Regarding fence crossings, our results highlighted contrasting seasonal patterns, with lions more likely to cross during the cold dry season, and hyenas more likely to cross during the warm wet season. Although fence crossings by lions and hyenas were infrequent, we documented numerous crossings between protected areas and the surrounding shared-use landscape, highlighting the potential for human–carnivore conflicts, especially at the protected area–farmland interface along the southern periphery of the park. Both species returned to the same place from where they crossed the fence an average of (33–53) percent of the time. For the rest of the crossing events, individuals travelled an average of 1.7 km to pass through another gap in the fence. The Etosha NP fence is 824 km long and has been operational for the past several decades. Our results suggest that such a long, linear infrastructure has a direct impact on the movement behavior of large carnivores, which could have an energetic cost and warrants further study. Apart from the park fence, there are several other fences within the game reserves, commercial farms which could impact the long-term population persistence of large mammals within the GEL.
Lions have been reported to move slower with tortuous paths when closer to water holes whereas elephants (Loxodonta Africana) have been reported to move faster and straighter toward water. Such movements are a response to the distribution of essential resources such as increased prey and availability of water within such semi-arid areas (Valeix et al., 2010; Wato et al., 2018). Lions are also reported to avoid risky areas and modify their behavior based on their perception of risk (Loveridge et al., 2017; Suraci et al., 2019). Anthropogenic features such as roads and fences can act as barriers that restrict movements between habitats, altering landscape connectivity and access to critical resources. For example, fencing and distribution of artificial water holes has been shown to affect the ranging behavior of elephants in arid habitats, negatively impacting the structure and functioning of the ecosystem (Loarie et al., 2009; Asner and Levick, 2012). Similarly, in temperate ecosystems, roads represented barriers to movements, and carnivores were reported to travel faster in areas with increased road density to avoid encounters with people (Whittington et al., 2022).
In our study, both carnivore species had longer step lengths (i.e., faster movements) when closer to the fence suggesting that carnivores travelled faster in the vicinity of the fence. This finding is in accordance with the first part of hypothesis 1. Carnivores could have moved faster in the vicinity of the fence due to the presence of humans and other anthropogenic features along the periphery of the park. The anthropogenic mortality of lions especially within commercial farms bordering ENP is high (Goelst, 2018) and thus peripheral areas of the park likely represent “landscape of fear” triggering faster movements. Therefore, the faster movements in the vicinity of the fence could be due to the combined effect of an artificial barrier and the risk of persecution within the farmlands bordering the park.
Though lions travelled faster they did not vary their path straightness in relation to the fence. Unlike lions, hyenas travelled faster and exhibited straighter paths when closer to the fence, suggesting directional movements along the fence. This finding is not in accordance with the second part of hypothesis 1. Such movements suggests that hyenas use these paths or routes regularly and there are holes/gaps in the fence that are used repeatedly. Straighter or directional movements of hyenas suggested that they were aware of the location of the fence and moved in a more or less uniform direction/pattern toward the linear infrastructure. The differences in movement near the fence between the two carnivores could be due to their specific behavioral traits as hyenas are more tolerant of anthropogenic structures compared to lions (Mwampeta et al., 2021). For this study, we did not have information at which frequency new breaks in the Etosha fences are created nor the frequency at which breaks are repaired. However, through personal observations we have noted that fence gaps can remain for several weeks or months depending on season, location, as well as other factors. Further study is needed to monitor the fence gaps and record wildlife movements based on land management types bordering ENP. Step lengths were longer at night for both species which is in accordance with the nocturnal movement behavior and temporal avoidance of humans by carnivores (Oriol-Cotterill et al., 2015).
Our results supported our second hypothesis regarding the effect of the Etosha fence on large carnivore movements outside ENP. We found that the Etosha fence was a more effective barrier to lions than to hyenas. This finding is in accordance with studies from Botswana where lions were reported to have much lower fence crossing likelihood compared to spotted hyenas and wild dogs (Cozzi et al., 2013). This species-specific movement behavior seems to be a major factor determining the permeability of the Etosha perimeter fence. The difference in fence permeability could be due to the fact that hyenas are often less sensitive and more adaptive to anthropogenic impacts compared to lions (Mwampeta et al., 2021). These differences could also be driven by the structure of the perimeter fence, as hyenas may be more adapted to utilize smaller gaps and holes and even resort to digging along the fence (Dupuis-Desormeaux et al., 2018; Wilkinson et al., 2021). The Etosha fence differs considerably in structure (e.g., electrified, game proof fence, mesh, cable, etc.) and maintenance. However, this study spanned several years and we did not have information to test the effect of the fence structure and gap type on the likelihood of crossings. Future studies investigating fence crossing behavior of wildlife would benefit from documentation of fence structure and maintenance to better elucidate the effects of fencing on species-specific crossing behaviors. Our study could not provide information about how these carnivores crossed the Etosha fence. However, based on personal observations and discussions with park staff, farmers, and local community members we suspect that majority of the individuals either used gaps/holes made by elephants and other species or dug underneath the fence themselves.
Our results demonstrate seasonal differences in patterns of fence crossings, as lions were more likely to cross during the cold dry season whereas hyenas were more likely to cross during the warm wet season. These results partially support hypothesis 4. The seasonal patterns of fence crossing for lions are similar to findings from central Botswana where lions were documented crossing the fence more frequently in the dry season (Kesch et al., 2015). Differences in seasonal patterns of fence crossings between the two carnivores could be due to variation in diet between species and the movements of preferred wild prey and livestock within the areas where the carnivores were operating (Zidon et al., 2017; Hering et al., 2022). Though both species have been documented to have considerable dietary overlap (Hayward and Kerley, 2005), lions in general are reported to prefer large-bodied prey while hyenas prefer medium sized prey (Jones et al., 2021), and lions have been reported to shift their diets based on the seasonal availability and movement of large bodied prey (Loveridge et al., 2009). Similarly, studies on hyena diets from Southern Africa have documented variability between seasons with increased prey availability during the wet season and drought and low prey availability and more scavenging opportunities during the dry season (Pereira et al., 2013). The large and medium sized wild prey within Etosha might exhibit variation in movement patterns between the dry and wet seasons and this could have triggered large carnivore movements, especially along the peripheral areas of the park. Indeed, a study on ungulate movements on the south-western periphery of Etosha found seasonal variation in fence crossings based on rainfall as well as the availability of grass and water (Hering et al., 2022). Antelopes were documented to use gaps/breaks created by elephants to move in and out of the park and fence crossings peaked during the end of the dry season, probably as a result of the availability of green forage along the south-western periphery of Etosha. The major wild prey within the Greater Etosha Landscape occur within the Etosha National Park, private game reserves (Ongava, Onguma, Etosha Heights) and the Hobatere concession area (Turner et al., 2022). There is also wild prey presence within the communal conservancies on the north, west and south-west of ENP and on the game farms on the south, east of ENP. Livestock presence is restricted to the communal conservancies, communal lands and commercial farms bordering ENP (Turner et al., 2022). Limited knowledge exists on wild prey and livestock abundance, distribution and movements within the different land management types and research should be undertaken to study their effects on large carnivore movements within ENP and the surrounding multi-used landscape (Weise et al., 2019; Turner et al., 2022).
Compared to other habitat types near the fence, the probability of lion crossings was higher in areas with a matrix of open shrublands and croplands which suggests that lions preferred areas with less vegetation cover to move in and out of Etosha. Lions are reported to prefer grasslands and open shrublands (Sargent et al., 2022), and fence crossings by lions in open habitats could be due to the abundance of wild prey and livestock and enhanced ability to detect humans within such areas. Unlike lions, hyenas displayed no effect of habitat type on the probability of crossings, likely reflecting their adaptability to survive in a broad range of conditions as habitat generalists (Bohm and Höner, 2015). The likelihood of fence crossings by lions and hyenas were higher during the night and when they were within protected areas, which is in accordance with temporal peaks in activity for both species (Gaynor et al., 2018). These results are in accordance with hypothesis 3 which predicted nocturnal fence crossing behavior for both species. The increased likelihood of fence crossings from the protected areas (national park, game reserve and concession) to the surrounding human dominated landscape at night (farms, communal lands, conservancy) highlight potential for livestock depredation within the freehold farms and communal lands and possibilities of human-carnivore conflicts (Goelst, 2018).
The frequency of lion fence crossings was similar within and outside of Etosha NP including protected areas and the other dominant land use types. For lions, livestock presence and animal husbandry practices along the peripheral areas could have influenced fence crossings behavior. Within the freehold farms on the southern periphery of the park, livestock are largely kept unsupervised at night (Trinkel et al., 2016) and this region is a hotspot for human–lion conflicts due to livestock depredation (Goelst, 2018). For hyenas, fence crossings were higher specifically in areas located near privately managed game reserves and communal conservancies. Hyenas monitored in this study were largely moving in the south central and north-eastern periphery of the park between protected areas (Ongava, Onguma), tourist lodges and communal conservancies, whereas the lions were operating both within the protected areas and the surrounding human-dominated landscape. Thus, hyena fence crossing behavior reported in our study may not reflect movements of individuals with home ranges bordering communal and freehold farmlands where the potential for conflicts is higher. However, given the number of crossings observed among the hyenas collared for our study, as well as the extent to which conflicts with hyenas have been reported in and around freehold farms bordering Etosha (Trinkel et al., 2006), hyenas likely move between protected areas and the surrounding human dominated landscape frequently. The human provisioned food subsidies near the entrance of the park (Andersson’s gate on the south-central and Von Lindequist gate on the eastern periphery) could have influenced fence crossings, as numerous hyena crossings were documented near these areas (Kuijper et al., 2016). Based on the distribution of animal locations, none of the collared individuals for either species crossed the southern periphery of the Ongava fence that were high-electrified game proof fence, suggesting that well maintained, electrified game proof fencing substantially reduces fence crossing by lions and hyenas (Cozzi et al., 2013). This finding emphasizes the effectiveness of fence structure and their impact on restricting carnivore movements.
The fence crossing hotspots observed in our study overlapped extensively with areas prone to human–lion conflicts, especially along the southern and south-western periphery of the park (Trinkel et al., 2016). The major limitation of our study was that we didn’t have GPS locations of carnivores along the entire periphery of the park, hence our findings are biased to areas where we had collared individuals. Future studies should target individuals occupying different peripheral areas and major land management types surrounding ENP. Almost 70% of the lion persecution by humans has been recorded within the commercial farms (freehold livestock farms) on the southern periphery of Etosha NP with an annual mortality of 21 lions killed between 1975 and 2017 (Goelst, 2018). Commercial farmers don’t claim compensation from the government for livestock losses to carnivore attacks (Goelst, 2018). Adult females and subadult males comprised of the highest proportion of conflict-related lion mortalities. As a consequence of human–lion conflicts, low numbers of adult males have been documented in some areas inside the park. Due to the low number of pride males, females with cubs may not be well protected from immigrating males. In case of such events, whole families of lions (female with cubs) have been reported to move outside the park and were killed by livestock and game farmers (Trinkel et al., 2016). Our results suggest that females had a greater probability of crossing the fence compared to males, which may be one factor contributing to the high female mortality around the park (Trinkel, 2013, Trinkel et al., 2016). However, our results also suggest that adult lions had a higher probability of crossing the fence, which could be an artifact of the high proportion of adults (>70%) collared within this study.
For hyenas the fence crossing hotspots overlapped with the main entrance gates on the south-central, eastern periphery and communal conservancy on the north-eastern corner of the park. The probability of crossing in these areas, where livestock are abundant, highlights the potential for livestock depredation and incidents of human–hyena conflicts. Unlike lions, there is lack of information on the extent and demography of hyenas killed on the farmlands bordering the park. However, the anthropogenic mortality of large carnivores on the farmlands bordering the southern boundary of Etosha highlight the area as a hotspot of human–carnivore conflicts (Trinkel, 2009). Though hyenas are more adaptive than lions (Mwampeta et al., 2021), the lack of adequate applied research on the species and the potential for conflicts (Weise et al., 2021) along the park-farmland interface pose a considerable challenge to their conservation within the human-dominated GEL.
The lion population within Etosha is connected to the desert-adapted lion population that inhabits the Skeleton Coast Park and other parts of the Kunene region (Damaraland) in north-western Namibia (Trinkel et al., 2016; W. Versfeld pers comm). This connectivity is primarily maintained through the south-western boundary of the park through the communal lands, concession areas, conservancies, and farms. Through this study, we identified the south-western boundary as a hotspot for fence crossings which is crucial for maintaining connectivity between the two lion populations in northern Namibia. However, the threat of increasing human-lion conflicts in the region (Stander, 2006) suggests that community-based mitigation measures should be implemented to ensure connectivity between the populations.
This study explored the effects of perimeter fencing on the movement behavior of large carnivores within one of the largest national parks in Africa. We found that while the Etosha fence was a partial barrier to lion movement, it was comparatively much more permeable to hyenas. Hyenas crossed the fence more frequently during the warm wet season whereas lions crossed the fence during the cold dry season which could be related to the seasonal and patchy distribution of resources within a semiarid environment. While fences are widely used as a conservation tool to manage wildlife populations, their impacts on large mammals have been relatively less studied (McInturff et al., 2020). We did not have data to measure the impact of the fence structure and maintenance efforts on the movement and crossing behavior of large carnivores. However, we assume that a substantial amount of money and manpower is required for the annual maintenance of the perimeter fence (Packer et al., 2013). The Etosha fence was constructed in 1973 primarily to prevent disease transmission from wildlife to livestock, manage human-wildlife conflicts, prevent encroachment, and conserve biodiversity of the ecosystem. The fence has never been a complete barrier to large carnivore movement as lions are reported to move between Etosha and north-western Namibia and helped repopulate a desert adapted population along the Skeleton Coast in recent times (Stander, 2019). While fences have the potential to be an important tool for managing wildlife populations, careful consideration should be given regarding their efficacy as a conservation tool to reduce costs of coexistence for local communities and their impacts on population connectivity of wide-ranging species (McInturff et al., 2020). Our findings provide evidence that can be used to aid in the management of large carnivores and highlight the need for further research to monitor livestock, wild prey movements and changes in environmental conditions at the interface of protected areas and the surrounding human-dominated landscapes to facilitate coexistence between humans and large carnivores.
The raw data supporting the conclusions of this article will be made available by the authors, without undue reservation.
This study was approved by the Ministry of Environment, Forestry and Tourism and National Commission on Research, Science and Technology and data collected under the permit 1479/2010 for Ongava, RCIV00072018 for Etosha and 2066/2015 for Hobatere.
DN, SP, JB, and JK conceived of the research. JK, TH-H, and SP provided the data. DN, SP, and CK processed and analyzed the data. DN wrote the first draft of the manuscript. JB and SP helped refine it. JB, JK, and SP provided supervision, advice, and editing of the manuscript. All authors discussed results and contributed to the final manuscript.
Funding for this research was provided by the Ongava Research Centre, the Namibian Lion Trust, the Ministry of Environment, Forestry, and Tourism, Namibia, and by the University of Georgia. Contributions of JB and CK were partially supported by the US Department of Energy Office of Environmental Management under Award Number DE-EM0005228 to the University of Georgia Research Foundation.
We thank the MEFT for their support of the research in Etosha. We are grateful for the substantial logistical support by the Etosha Management staff, in particular, Pierre du Preez, Evaristo Nghilai, Martin Herman, Petrina Ndumbu, Manuel Bakker, and Bernd Brell. MEFT veterinarians Axel Hartmann, Carl-Heinz Moeller, and Janine Sharpe are thanked for their efforts in immobilizing and collaring animals. We are grateful to Michelle Moeller, Martina Kusters, and Claire Goelst who assisted with animal captures and database management. We thank MEFT rangers, Johannes Kapner and Seth Guim who assisted with animal captures. We also thank the team at Ongava Research Centre, Etosha Ecological Institute and Namibian Lion Trust for providing data on large carnivores collared within and around Etosha NP. We acknowledge the Namibian National Commission On Research Science and Technology, who permitted this research (1479/2010 for Ongava, RCIV00072018 for Etosha and 2066/2015 for Hobatere).
The authors declare that the research was conducted in the absence of any commercial or financial relationships that could be construed as a potential conflict of interest.
All claims expressed in this article are solely those of the authors and do not necessarily represent those of their affiliated organizations, or those of the publisher, the editors and the reviewers. Any product that may be evaluated in this article, or claim that may be made by its manufacturer, is not guaranteed or endorsed by the publisher.
This manuscript was prepared as an account of work sponsored by an agency of the United States Government. Neither the United States Government nor any agency thereof, nor any of their employees, makes any warranty, express or implied, or assumes any legal liability or responsibility for the accuracy, completeness, or usefulness of any information disclosed, or represents that its use not infringe privately owned rights. Reference herein to any specific commercial product, process, or service by trade name, trademark, manufacturer, or otherwise does not constitute or imply its endorsement, recommendation, or favoring by the United States Government or any agency thereof. The views and opinions of the authors expressed herein do not necessarily state or reflect those of the United States Government or any agency thereof.
The Supplementary Material for this article can be found online at: https://www.frontiersin.org/articles/10.3389/fevo.2023.1031321/full#supplementary-material
AfriCat Hobatere Lion Research Project [AHLRP] (2016). Lion (Panthera leo) population within the Hobatere Concession Area and movement between the Hobatere Concession Area, western Etosha National Park and adjacent communal farmland. Otjiwarongo: The AfriCat Foundation.
Almeida, P. J., Vieira, M. V., Kajin, M., Forero-Medina, G., and Cerqueira, R. (2010). Indices of movement behaviour: Conceptual background, effects of scale and location errors. Zoologia 27, 674–680.
Asner, G. P., and Levick, S. R. (2012). Landscape-scale effects of herbivores on treefall in African savannas. Ecol. Lett. 15, 1211–1217. doi: 10.1111/j.1461-0248.2012.01842.x
Bates, D., Maechler, M., and Bolker, B. (2013). lme4: Linear-mixed effects models using S4 classes R package version 0.999999-2. Available online at: http://CRAN.R-project.org/package=lme4 (accessed April 25, 2023).
Berry, H. (1983). The ecology, behavior and population dynamics of large predators at Etosha. Progress report for the period October 1983-October 1984. Okaukuejo: Etosha Ecological Institute.
Bohm, T., and Höner, O. R. (2015). Crocuta crocuta. IUCN Red List Threatened Species 9, 2015–2013. doi: 10.2305/IUCN.UK.2015-2.RLTS.T5674A45194782.en
Ceballos, G., Ehrlich, P. R., Barnosky, A. D., García, A., Pringle, R. M., and Palmer, T. M. (2015). Accelerated modern human–induced species losses: Entering the sixth mass extinction. Sci. Adv. 1:e1400253. doi: 10.1126/sciadv.1400253
Cozzi, G., Broekhuis, F., Weldon McNutt, J., and Schmid, B. (2013). Comparison of the effects of artificial and natural barriers on large African carnivores: Implications for interspecific relationships and connectivity. J. Anim. Ecol. 82, 707–715. doi: 10.1111/1365-2656.12039
Creel, S., Becker, M. S., Durant, S. M., M’Soka, J., Matandiko, W., Dickman, A. J., et al. (2013). Conserving large populations of lions–the argument for fences has holes. Ecol. Lett. 16, 1413, e1–3. doi: 10.1111/ele.12145
Cushman, S. A., Elliot, N. B., Macdonald, D. W., and Loveridge, A. J. (2016). A multi-scale assessment of population connectivity in African lions (Panthera leo). J. Landsc. Ecol. 31, 1337–1353.
Dupuis-Desormeaux, M., Kaaria, T. M., Mwololo, M., Davidson, Z., and MacDonald, S. E. (2018). A ghost fence-gap: Surprising wildlife usage of an obsolete fence crossing. PeerJ 6:e5950. doi: 10.7717/peerj.5950
Durant, S. M., Becker, M. S., Creel, S., Bashir, S., Dickman, A. J., Beudels-Jamar, R. C., et al. (2015). Developing fencing policies for dryland ecosystems. J. Appl. Ecol. 52, 544–551.
Fahrig, L., and Rytwinski, T. (2009). Effects of roads on animal abundance: An empirical review and synthesis. Ecol. Soc. 14:21.
Gaynor, K. M., Hojnowski, C. E., Carter, N. H., and Brashares, J. S. (2018). The influence of human disturbance on wildlife nocturnality. Science 360, 1232–1235. doi: 10.1126/science.aar7121
Goelst, C. E. (2018). Assessing patterns of spatial occurrence and human-carnivore conflict for African lions (Panthera leo) in and around Etosha National Park, Namibia. Master’s thesis. New York City, NY: Columbia University.
Graham, M. D., Douglas-Hamilton, I., Adams, W. M., and Lee, P. C. (2009). The movement of African elephants in a human-dominated land-use mosaic. Anim. Conserv. 12, 445–455. doi: 10.1111/j.1469-1795.2009.00272.x
Green, D. S., and Holekamp, K. E. (2019). Pastoralist activities affect the movement patterns of a large African carnivore, the spotted hyena (Crocuta crocuta). J. Mamm. 100, 1941–1953. doi: 10.1093/jmammal/gyz135
Green, D. S., Johnson-Ulrich, H. L., Couraud, H. E., and Holekamp, K. E. (2018). Anthropogenic disturbance induces opposing population trends in spotted hyenas and African lions. J. Biodivers. Conserv. 27, 871–889.
Habrich, A. K., Lawrence, E. R., and Fraser, D. J. (2021). Varying genetic imprints of road networks and human density in North American mammal populations. Evol. Appl. 14, 1659–1672. doi: 10.1111/eva.13232
Harris, G., Thirgood, S., Hopcraft, J. G., Cromsigt, J. P., and Berger, J. (2009). Global decline in aggregated migrations of large terrestrial mammals. Endanger. Species Res. 7, 55–76.
Hatton, I. A., McCann, K. S., Fryxell, J. M., Davies, T. J., Smerlak, M., Sinclair, A. R., et al. (2015). The predator-prey power law: Biomass scaling across terrestrial and aquatic biomes. Science 349, 1–13. doi: 10.1126/science.aac6284
Hayward, M., and Kerley, G. (2005). Prey preferences of the lion (Panthera leo). J. Zool. 267, 309–322. doi: 10.1017/S0952836905007508
Hering, R., Hauptfleisch, M., Jago, M., Smith, T., Kramer-Schadt, S., Stiegler, J., et al. (2022). Don’t stop me now: Managed fence gaps could allow migratory ungulates to track dynamic resources and reduce fence related energy loss. Front. Ecol. Evol. 10:907079. doi: 10.3389/fevo.2022.907079
Heydinger, J., Packer, C., and Tsaneb, J. (2019). Desert-adapted lions on communal land: Surveying the costs incurred by, and perspectives of, communal-area livestock owners in northwest Namibia. Biol. Conserv. 236, 496–504.
Jacobson, A., and Riggio, J. (2018). Big cats in Africa: Status update on the African lion, cheetah and leopard, with recommendations for effective big cat conservation funding. Washington DC: National Geographic Society.
Jones, A. K., Blockley, S. P. E., Schreve, D. C., and Carbone, C. (2021). Environmental factors influencing spotted hyena and lion population biomass across Africa. Ecol. Evol. 11, 17219–17237. doi: 10.1002/ece3.8359
Kesch, M. K., Bauer, D. T., and Loveridge, A. (2015). Break on through to the other side: The effectiveness of game fencing to mitigate human–wildlife conflict. Afr. J. Wildl. Res. 45, 76–87. doi: 10.3957/056.045.0109
Kuijper, D. P. J., Sahlén, E., Elmhagen, B., Chamaillé-Jammes, S., Sand, H., Lone, K., et al. (2016). Paws without claws? Ecological effects of large carnivores in anthropogenic landscapes. Proc. Royal Soc. B. 283:20161625. doi: 10.1098/rspb.2016.1625
Le Roux, C. J., Grunow, J. O., Bredenkamp, G. J., Morris, J. W., and Scheepers, J. C. (1988). A classification of the vegetation of the Etosha National Park. South Afr. J. Bot. 54, 1–10. doi: 10.1016/S0254-6299(16)31355-2
Lindsey, P. A., Miller, J. R., Petraccaa, L. S., Coad, L., Dickman, A. J., Fitzgeraldh, K. H., et al. (2018). More than $1 billion needed annually to secure Africa’s protected areas with lions. Proc. Natl. Acad. Sci. U.S.A. 115, 10788–10796. doi: 10.1073/pnas.1805048115
Lindsey, P. A., Petracca, L. S., Funston, P. J., Bauer, H., Dickman, A., Everatt, K., et al. (2017). The performance of African protected areas for lions and their prey. Biol. Conserv. 209, 137–149. doi: 10.1016/jbiocon.2017.01.011
Loarie, S. R., Van Arde, R. J., and Pimm, S. L. (2009). Fences and artificial water affect African Savannah elephant movement patterns. Biol. Conserv. 142, 3086–3098. doi: 10.1016/j.biocon.2009.08.008
Loveridge, A. J., Valeix, M., Davidson, Z., Murindagomo, F., Fritz, H., and Macdonald, D. W. (2009). Changes in home range size of African lions in relation to pride size and prey biomass in a semi-arid savanna. Ecography 32, 953–962. doi: 10.1111/j.1600-0587.2009.05745.x
Loveridge, A. J., Valeix, M., Elliot, N. B., and Macdonald, D. W. (2017). The landscape of anthropogenic mortality: How African lions respond to spatial variation in risk. J. Appl. Ecol. 54, 815–825.
McDonald, R. W., and St. Clair, C. C. (2004). The effects of artificial and natural barriers on the movement of small mammals in Banff National Park, Canada. Oikos 105, 397–407.
McInturff, A., Xu, W., Wilkinson, C. E., Dejid, N., and Brashares, J. S. (2020). Fence ecology: Frameworks for understanding the ecological effects of fences. BioScience 70, 971–985. doi: 10.1093/biosci/biaa103
Minin, E. D., Slotow, R., Fink, C., Bauer, H., and Packer, C. (2021). A pan-African spatial assessment of human conflicts with lions and elephants. Nat. Commun. 12:2978. doi: 10.1038/s41467-021-23283-w
Ministry of Environment, Forestry and Tourism [MEFT] (2021). Management plan: Etosha National Park “A framework for a business plan” 2021/2022–2031/2032. Windhoek: Ministry of Environment, Forestry and Tourism, Namibia.
Ministry of Environment, Forestry and Tourism, and Namibian Association of Cbnrm Support Organisations. (2021). The state of community conservation in Namibia. Windhoek: Ministry of Environment, Forestry and Tourism.
Morales, J. M., Moorcroft, P. R., Matthiopoulus, J., Frair, J. L., Kie, J. G., Powell, R. A., et al. (2010). Building the bridge between animal movements and population dynamics. Philos. Trans. R. Soc. Lond. B. Biol. Sci. 365, 2289–2301. doi: 10.1098/rstb.2010.0082
Mwampeta, S. B., Wilton, C. M., Mkasanga, I. J., Masinde, L. M., Ranke, P. S., Røskaft, E., et al. (2021). Lion and spotted hyena distributions within a buffer area of the Serengeti-Mara ecosystem. Sci. Rep. 11:22289. doi: 10.1038/s41598-021-01518-6
O’Neill, H. M., Durant, S. M., Strebel, S., and Woodroffe, R. (2021). Fencing affects African wild dog movement patterns and population dynamics. Oryx 56, 128–136. doi: 10.1017/S0030605320000320
Oriol-Cotterill, A., Macdonald, D. W., Valeix, M., Ekwanga, S., and Frank, L. G. (2015). Spatiotemporal patterns of lion space use in a human-dominated landscape. Anim. Behav. 101, 27–39.
Packer, C., Loveridge, A., Canney, S., Caro, T., Garnett, S. T., Pfeifer, M., et al. (2013). Conserving large carnivores: Dollars and fence. Ecol. Lett. 16, 635–641. doi: 10.1111/ele.12091
Pereira, L. M., Owen-Smith, N., and Moleón, M. (2013). Facultative predation and scavenging by mammalian carnivores: Seasonal, regional and intra-guild comparisons. Mamm. Rev. 44, 1–12. doi: 10.1111/mam.12005
R Core Team (2020). R: A language and environment for statistical computing. Vienna: R Foundation for Statistical Computing.
Ripple, W. J., Wolf, C., Newsome, T. M., Galetti, M., Alamgir, M., Crist, E., et al. (2017). World scientists’ warning to humanity: A second notice. BioScience 67, 1026–1028. doi: 10.1093/biosci/bix125
Roshier, D. A., Doerr, V. A., and Doerr, E. D. (2008). Animal movement in dynamic landscapes: Interaction between behavioural strategies and resource distributions. Oecologia 156, 465–477. doi: 10.1007/s00442-008-0987-0
Sargent, R., Deere, N. J., McGowan, P. J., Bunnefeld, N., and Pfeifer, M. (2022). Room to roam for African lions Panthera leo: A review of the key drivers of lion habitat use and implications for conservation. Mamm. Rev. 52, 39–51.
Signer, J., Fieberg, J., and Avgar, T. (2019). Animal movement tools (amt): R package for managing tracking data and conducting habitat selection analyses. Ecol. Evol. 9, 880–890. doi: 10.1002/ece3.4823
Somers, M. J., and Hayward, M. W. (2012). An introduction to fencing for conservation in Fencing for conservation. Biol. Conserv. 142, 1–13. doi: 10.1007/978-1-4614-0902-1_1
Stander, P. (2004). An analysis of the spatial, temporal, and demographic patterns of lions destroyed along the borders of Etosha National Park over a 20-year period. Unpublished Internal Report. Windhoek: Ministry of Environment and Tourism.
Stander, P. (2006). Population ecology and demography of Kunene lions: Towards resolving human-lion conflicts with applied research and proactive management. Research Paper 2006/1. Windhoek: Predator Conservation Trust.
Stander, P. (2019). Lions (Panthera leo) specialising on a marine diet in the Skeleton Coast National Park, Namibia. Namib. J. Environ. 3, 1–10.
Stratford, K. J., and Stratford, S. M. (2011). Fine-scale movements and use of space by spotted hyaena (Crocuta crocuta) on Ongava Game Reserve. Namibia. Afr. J. Ecol. 49, 343–352.
Suraci, J. P., Frank, L. G., Oriol-Cotterill, A., Ekwanga, S., Williams, T. M., and Wilmers, C. C. (2019). Behavior-specific habitat selection by African lions may promote their persistence in a human-dominated landscape. Ecology 100, 1–11. doi: 10.1002/ecy.2644
Trinkel, M. (2009). Prey selection and prey preferences of spotted hyenas Crocuta rocuta in the Etosha National Park, Namibia. Ecol. Res. 25, 413–417. doi: 10.1007/s11284-009-0669-3
Trinkel, M. (2013). Climate variability, human wildlife conflict and population dynamics of lions Panthera leo. Naturwissenschaften 100, 345–353. doi: 10.1007/s00114-013-1034-5
Trinkel, M., Fleischmann, P. H., and Slotow, R. (2016). Electrifying the fence or living with consequences? Problem animal control threatens the long-term viability of a free-ranging lion population. J. Zool. 301, 41–50. doi: 10.1111/jzo.12387
Trinkel, M., Fleischmann, P. H., Steindorfer, A. F., and Kastberger, G. (2006). Spotted hyenas (Crocuta crocuta) follow migratory prey. Seasonal expansion of a clan territory in Etosha, Namibia. J. Zool. 264, 125–133. doi: 10.1017/S0952836904005588
Tucker, M. A., Böhning-Gaese, K., Fagan, W. F., Fryxell, J. M., Van Moorter, B., Alberts, S. C., et al. (2018). Moving in the Anthropocene: Global reductions in terrestrial mammalian movements. Science 359, 466–469. doi: 10.1126/science.aam9712
Turchin, P. (1991). Translating foraging movements in heterogeneous environments into the spatial distribution of foragers. Ecology 72, 1253–1266. doi: 10.2307/1941099
Turner, W. C., Périquet, S., Goelst, C. E., Vera, K. B., Cameron, E. Z., Alexander, K. A., et al. (2022). Africa’s drylands in a changing world: Challenges for wildlife conservation under climate and land-use changes in the Greater Etosha Landscape. Global Ecol. Conserv. 38:e02221. doi: 10.1016/j.gecco.2022.e02221
Valeix, M., Loveridge, A. J., Davidson, Z., Madzikanda, H., Fritz, H., and MacDonald, D. W. (2010). How key habitat features influence large terrestrial carnivore movements: Waterholes and African lions in a semi-arid savanna of north-western Zimbabwe. Landsc Ecol. 253, 337–351.
Wato, Y. A., Prins, H. H., Heitkönig, I. M., Wahungu, G. M., Ngene, S. M., Njumbi, S., et al. (2018). Movement patterns of African elephants (Loxodonta africana) in a semi-arid savanna suggest that they have information on the location of dispersed water sources. Front. Ecol. Evol. 6:167. doi: 10.3389/fevo.2018.00167
Weise, F. J., Fynn, R. W., Stein, A. B., Tomeletso, M., Somers, M. J., and Periquet, S. (2019). Seasonal selection of key resources by cattle in a mixed savannah-wetland ecosystem increases the potential for conflict with lions. Biol. Conserv. 237, 253–266.
Weise, F. J., Kilian, J. W., and Périquet, S. (2021). Of teeth and claws: Taking stock of carnivore research in the greater Etosha landscape. NJE 5, 12–24.
Whittington, J., Hebblewhite, M., Baron, R. W., Ford, A. T., and Paczkowski, J. (2022). Towns and trails drive carnivore movement behaviour, resource selection, and connectivity. Mov. Ecol. 10, 1–18. doi: 10.1186/s40462-022-00318-5
Wilkinson, C. E., McInturff, A., Kelly, M., and Brashares, J. S. (2021). Quantifying wildlife responses to conservation fencing in East Africa. Biol. Conserv. 256:109071. doi: 10.1016/j.biocon.2021.109071
Zidon, R., Garti, S., Getz, W. M., and Saltz, D. (2017). Zebra migration strategies and anthrax in Etosha National Park, Namibia. Ecosphere 8:e01925. doi: 10.1002/ecs2.1925
Keywords: carnivore, conservation, human–wildlife conflicts, spatial ecology, movement, lion, spotted hyena, land use
Citation: Naha D, Périquet S, Kilian JW, Kupferman CA, Hoth-Hanssen T and Beasley JC (2023) Fencing affects movement patterns of two large carnivores in Southern Africa. Front. Ecol. Evol. 11:1031321. doi: 10.3389/fevo.2023.1031321
Received: 29 August 2022; Accepted: 22 May 2023;
Published: 09 June 2023.
Edited by:
Spartaco Gippoliti, Storia Della Fauna, ItalyReviewed by:
Vicente Urios, University of Alicante, SpainCopyright © 2023 Naha, Périquet, Kilian, Kupferman, Hoth-Hanssen and Beasley. This is an open-access article distributed under the terms of the Creative Commons Attribution License (CC BY). The use, distribution or reproduction in other forums is permitted, provided the original author(s) and the copyright owner(s) are credited and that the original publication in this journal is cited, in accordance with accepted academic practice. No use, distribution or reproduction is permitted which does not comply with these terms.
*Correspondence: Dipanjan Naha, ZGlwLnN1bmRhcmJhbnNAZ21haWwuY29t
Disclaimer: All claims expressed in this article are solely those of the authors and do not necessarily represent those of their affiliated organizations, or those of the publisher, the editors and the reviewers. Any product that may be evaluated in this article or claim that may be made by its manufacturer is not guaranteed or endorsed by the publisher.
Research integrity at Frontiers
Learn more about the work of our research integrity team to safeguard the quality of each article we publish.