 Jia Wang
 Shigeru Tabeta
- Department of Environment Systems, Graduate School of Frontier Sciences, The University of Tokyo, Tokyo, Japan
Reef-associated fish are a crucial source of protein for coastal residents and play an important role in the economy and ecology of marine ecosystems. However, human activities and climate change have led to the degradation of their habitats in the South China Sea (SCS) and East China Sea (ECS). This study models the potential habitats of reef-associated fish in the SCS and ECS between 1993 and 2019 using high-spatial-resolution environmental factors and fish presence data, estimates the importance of environmental factors on habitat distribution and identifies seasonal variation and distribution shifts over recent decades, the results show moderate and highly suitable areas for reef-associated fish in the region total 360,000 km2. Sea body temperature, chlorophyll-α concentration, and seawater salinity are crucial for determining the distribution of reef-associated fish. Moreover, reef-associated fish are also sensitive to seawater temperature in winter. Suitable areas for reef-associated fish near coastlines have decreased due to environmental changes within the region. The findings of this study offer valuable resource for developing fishery management and conservation strategies for this important functional group.
1. Introduction
Reef-associated fish, such as Seriola dumerili, Ablennes hians, and Carcharias taurus, are among the most economically and ecologically essential functional groups. Reef-associated fish are a significant source of protein for ~85% of coastal inhabitants, but more than 80% of global shallow reefs have been damaged owing to the rising demand for high-quality protein (Manikandan et al., 2014). Moreover, climate change is another primary determinant of the distribution of fish (Cheung et al., 2010; Tang et al., 2020) as the consequent alterations in environmental factors impact marine life. The loss of marine ecosystems and species could result from an abrupt increase in the temperature and acidity of seawater (Cheung et al., 2010).
The South China Sea (SCS) and East China Sea (ECS) are the two most important large marine ecosystems (LMEs) in Asia, and contain biodiversity and ecosystems of global significance (Sherman, 2014). The SCS, located in the Indo-West Pacific, is the third-largest marginal sea in the world and includes over 200 islands and islets. It covers an area of approximately 3.2 million km2 and contains over 3,000 fish species (Randall and Lim, 2000). Marine species in the SCS are genetically and phylogenetically diverse (Fan et al., 2022). The ECS is located in the western Pacific Ocean and covers an area of approximately 0.8 million km2. High biodiversity is also a feature of the ECS, which is home to more than 12,000 tropical and subtropical species (Froese and Pauly, 2022). These two LMEs are bounded to the north by South Korea’s Jeju Island, to the east by Japan’s Ryukyu and Kyushu Islands, to the west by mainland China, and touch the shores of Taiwan, the Philippines, Malaysia, Brunei, Indonesia, and Vietnam (Figure 1). These countries and regions are among the world’s major fishing entities, and rely heavily on fishing for their economic and subsistence needs; nearly 20 million tons of fish are caught annually from the two LMEs, with a market value of over 30 billion USD ( et al., 2019). There are over 1,000 reef-associated fish species in the SCS and ECS (Arai, 2015; Froese and Pauly, 2022). Nearly 95% of reef-associated fish in the SCS and ECS inhabit the epipelagic zone, which extends from the water surface to a depth of 200 m (Froese and Pauly, 2022).
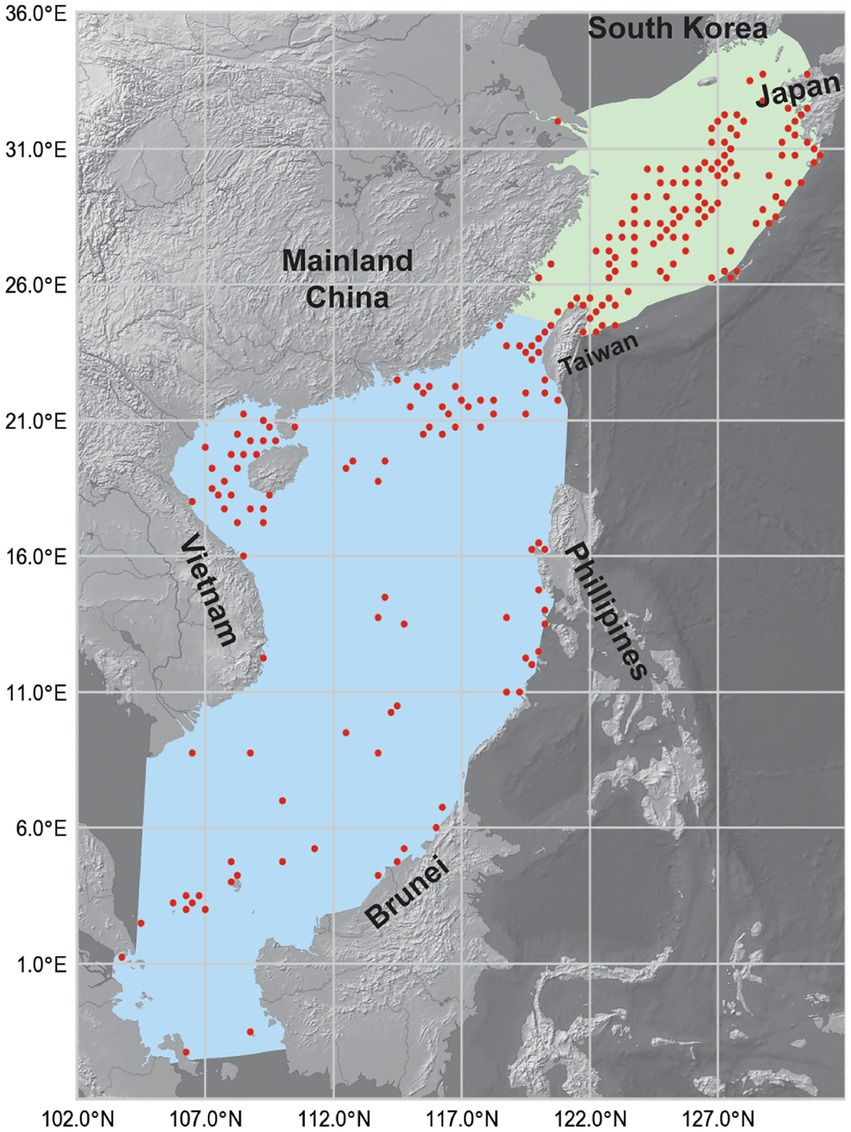
Figure 1. Map showing the South China Sea (SCS, blue areas) and the East China Sea (ECS, green areas). Red dots show the occurrence records of reef-associated fish from 1993 to 2019. The map has a spatial resolution of 0.25° × 0.25°. Shapefiles of the two LMEs were downloaded from the Large Marine Ecosystems Hub, and the background map was made with Natural Earth.
In recent years, many scholars have used species distribution models (SDMs) to estimate potential species distributions. Due to insufficient data on fish presence, however, few studies on the habitat suitability of reef-associated fish in the SCS and ECS have been conducted. The reef-associated fish population in the SCS and ECS has been harmed by overfishing and climate change (Li and Zhang, 2012; Zhang et al., 2021). By obtaining distribution maps of reef-associated fish from previous years using SDMs, it is anticipated that the most significant environmental factors affecting reef-associated fish habitats will be identified. This information could be beneficial to take specific actions for environmental management. Moreover, by observing the distribution shift, it could also provide fishermen with information regarding the potential concentrations and shrinkage in areas of reef-associated fish, as well as their potential habitat evolution, which could be helpful for species management.
For this purpose, in this study, we estimated the habitat suitability of reef-associated fish in the SCS and ECS from 1993 to 2019 using MaxEnt. We trained eight MaxEnt models to investigate the seasonality and tendency of potentially suitable habitats for reef-associated fish in order to investigate the effects of environmental factors more thoroughly. This study provides a theoretical basis for the conservation and sustainable fishing of reef-associated fish in a changing environment.
2. Materials and methods
2.1. Survey area
The boundaries of the SCS are approximately −2.46°–24.57°N and 103.16°–121.50°E (Marineregions.org, 2019). The southern portion of the SCS has coral reefs in water about <200 m deep; the northern portion consists of basins with depths of approximately 5,000 m. The boundaries of the ECS are approximately 24.01°–35.19°N and 118.50°–131.57°E (Marineregions.org, 2019). The average depth of the ECS is approximately 370 m and its maximum depth is approximately 2,300 m. We defined the survey area as a combination of the SCS and ECS, located between −2.46°–35.19°N and 103.16°–131.57 °E (Figure 1). The survey area covered a total ocean area of approximately 4.0 million km2.
2.2. Environmental factors
We downloaded 13 environmental factors from January 1, 1993, to December 31, 2019, on a monthly scale from the Copernicus Marine Environment Monitoring Service1 (CMEMS), with a spatial resolution of 0.25° × 0.25 °between −4°–36°N and 102°–132°E (Table 1). The coordinate system used was the WGS84. We used seasonal-scale data to study the seasonal patterns of potentially suitable habitats. Thus, we calculated the average sea surface temperature (ST2) of the survey area for each month and then determined that winter lasted from January to March (average ST2 of 24.3°C), spring lasted from April to June (average ST2 of 26.5°C), summer lasted from July to September (average ST2 of 27.1°C), and autumn lasted from October to December (average ST2 of 26.2°C). Then, we calculated the average temperature in summer/winter for the sea body and sea surface temperatures. As most reef-associated fish live in the depth range of 0–200 m (Froese and Pauly, 2022), we defined sea body temperature as the average sea water temperature of the top 200 m of the water column.
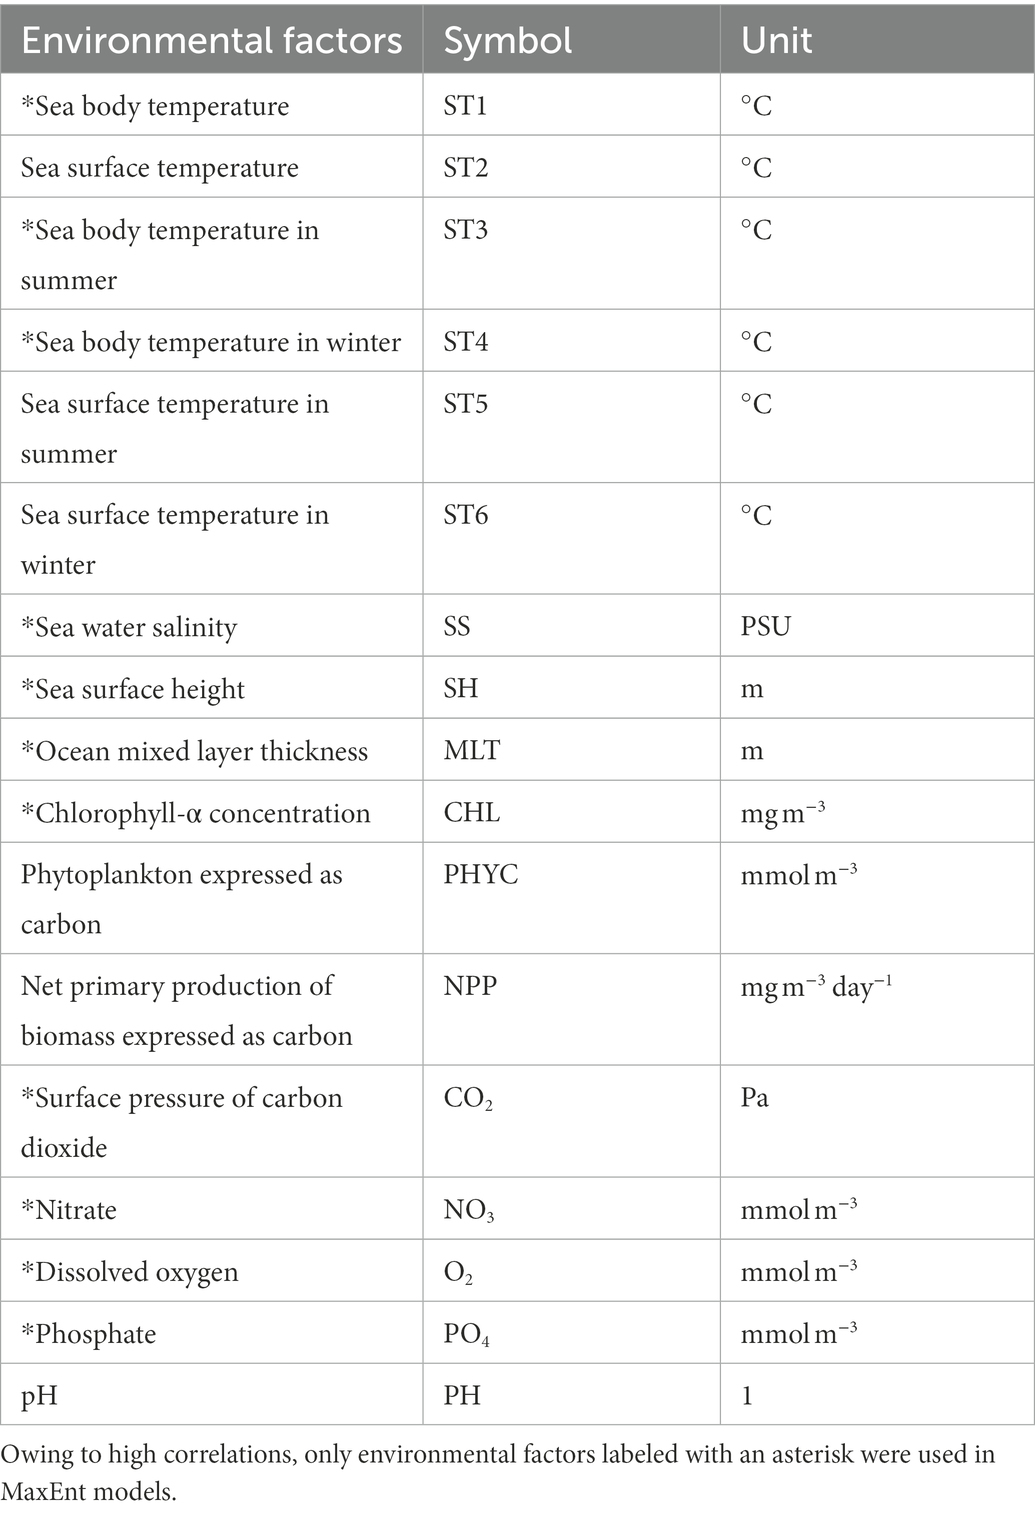
Table 1. Environmental factors used in this study and their units.
The MaxEnt model is prone to overfitting because of collinearity between different environmental factors (Graham, 2003); therefore, we performed a linear correlation test for the environmental factors. If the factor had a correlation coefficient higher than or equal to 0.8 with another factor, this factor was removed. Based on the correlation test, we decided not to use net primary production expressed as carbon (NPP), pH value (PH), phytoplankton expressed as carbon (PHYC), and sea surface temperature (ST2, ST5, and ST6) in the MaxEnt models. Finally, we selected 11 environmental factors for MaxEnt modeling of reef-associated fish (Table 1).
As we aimed to research the seasonality and habitat suitability of reef-associated fish, we took the average of the environmental factors to derive eight data sets. The first four data sets and factors (winter, spring, summer, and autumn from 1993 to 2019) were used to study seasonality. The other four data sets (1993–1999, 2000–2006, 2007–2012, and 2013–2019), were utilized to investigate this tendency. In the eight data sets, we used sea body temperature (ST1), chlorophyll-α concentration (CHL), the surface pressure of carbon dioxide (CO2), ocean mixed layer thickness (MLT), nitrate (NO3), dissolved oxygen (O2), phosphate (PO4), sea surface height (SH), and seawater salinity (SS). Moreover, in the four data sets for studying tendency, we used sea body temperatures in summer (ST3) and winter (ST4). All environmental factors were converted into the ASCII format via QGIS 3.26 (QGIS.org,2 QGIS Geographic Information System, QGIS Association) for the MaxEnt software.
2.3. Occurrence data
The presence point records of reef-associated fish in the survey area were collected from Fishbase,3 the Global Biodiversity Information Network Database4 (GBIF), and the Ocean Biodiversity Information System5 (OBIS). The list of reef-associated fish species was retrieved from Fishbase. Then, for each species on the list, we searched Fishbase, GBIF, and OBIS for the catch data, which represented occurrence data for the MaxEnt simulation. The study region consisted of the LMEs of the SCS and the ECS between −4°–36°N and 102°–132°E. The depth ranged from the water’s surface to 200 meters below. The period spanned from January 1, 1993, to December 31, 2019. The occurrence data included the location (including latitude, longitude, and depth) where the fish was caught, the date when the fish was caught, and the species of fish that was caught. The temporal resolution of the occurrence data was 1 month; the original spatial resolution was 0.01° × 0.01°. This spatial resolution is not equal to that of the environmental variables, so we decreased it to 0.25° × 0.25° by counting the occurrence records of the same species in neighboring locations as one record. Figure 1 shows the reported occurrence locations of reef-associated fish from 1993 to 2019, which shows that reef-associated fish were more likely to be present near the coastline of Taiwan Island, the southern shoreline of Japan’s Kyushu Island, and the central part of the ECS. The data from the three databases might have included duplicate records, but this would not have affected the modeling because we set the model to ignore duplicated presence records.
The SCS and the ECS are habitat to a total of 1,075 reef-associated fish species, according to Fishbase. The total number of occurrence records for reef-associated fish from 1993 to 2019 is 18,016. The three most common species all belong to different species groups: Upeneus japonicus (77 records), Caranx sexfasciatus (68 records), and Parupeneus multifasciatus (65 records). The median number of occurrence records is Pomacentrus tripunctatus at 12. There are numerous species with few records, but none with a disproportionately large number of records. A complete species list could be found in the Supplementary materials. We chose the reef-associated functional group rather than individual species for research because: 1. the species in this functional group share similar habitats; 2. the majority of them live in coral reef areas in the epipelagic zone at a depth of less than 200 meters, where marine environmental properties are relatively consistent and uniform; and 3. the records of individual species are insufficiently small for the purpose of this study.
The occurrence data were also divided into eight data sets according to temporal periods (four seasons and four time stages) for MaxEnt modeling. In each occurrence data set, sampling bias was removed using spatial thinning method (Aiello-Lammens et al., 2015), and the minimum neighbor distance was set to one unit cell (0.25°); consequently, each presence location has no a neighboring presence point. Each data set contains the following number of occurrence records: 119 for winter, 192 for spring, 156 for summer, 196 for autumn, 132 for 1993–1999, 149 for 2000–2006, 137 for 2007–2012, and 191 for 2013–2019. The Supplementary material contained additional information, including species lists for each data set.
2.4. MaxEnt simulation and evaluation
MaxEnt is a niche-based habitat suitability model that analyzes species distributions at maximum entropy (Phillips et al., 2004, 2006, 2017). It is a presence-only modeling technique that is most robust when there are few presence records; hence, it has been employed worldwide (Elith et al., 2011; Zhang et al., 2016; Fiedler et al., 2018). In recent years, the MaxEnt model has successfully predicted potentially suitable habitats for various species, including marine species (de Souza and de Marco, 2014; Fiedler et al., 2018; Zhang K. et al., 2018; Zhang Q. et al., 2018; Tang et al., 2020; Yan et al., 2021; Li et al., 2022). In this study, we trained eight MaxEnt models using the eight aforementioned data groups. The MaxEnt software used in this study was MaxEnt 3.4.4 (Phillips et al., 2020). We first analyzed the contribution of all environmental factors by MaxEnt’s optimization of training gain and the internal Jackknife test, and then produced suitable habitat areas for reef-associated fish in the SCS and ECS at different periods. For each training process, we loaded the environmental factors that were saved as *. asc; species occurrence data were saved as *. csv to the MaxEnt software and the regularization multiplier was set as 1. We used 75% of the occurrence data for training and 25% as test data for evaluating the prediction capabilities of the model. The model was trained for 500 iterations or terminated when a convergence threshold of 0.00001 was reached. The model eventually yielded the probability of presence as a function of the environmental factors of each grid cell. The accuracy of the simulation was verified using the area under the receiver operating characteristic curve (AUC). AUC values of >0.8 indicated the model had good confidence, and AUC values of >0.9 were considered excellent (Swets, 1988; Manel et al., 2001). The MaxEnt model’s internal jackknife test for factors’ contributions was performed after each simulation. We trained eight MaxEnt models for seasons in the past 27 years from 1993 to 2019: winter (S1), spring (S2), summer (S3), and autumn (S4), and for the time spans: 1993–1999 (T1), 2000–2006 (T2), 2007–2012 (T3), and 2013–2019 (T4), using the corresponding data sets.
The predicted presence probabilities range from 0 to 1, and we defined a presence probability of <0.4 as low habitat suitability, 0.4–0.6 as moderate habitat suitability, and > 0.6 as high habitat suitability. The resultant suitability map was visualized using QGIS 3.26, and the geographical areas of low, moderate, and high habitat suitability for reef-associated fish were calculated.
3. Results
3.1. Model performance for reef-associated fish
Receiver operating characteristic (ROC) analysis is acknowledged as the best assessment indicator for diagnostic testing (Peterson et al., 2008), and AUC values are used to assess the precision of model prediction. The AUC values of S3 and T3 were >0.9, and those of the others were >0.8 and very close to 0.9 (Table 2), indicating that the MaxEnt models predicted potentially suitable areas for reef-associated fish in the SCS and ECS over recent decades with high credibility.
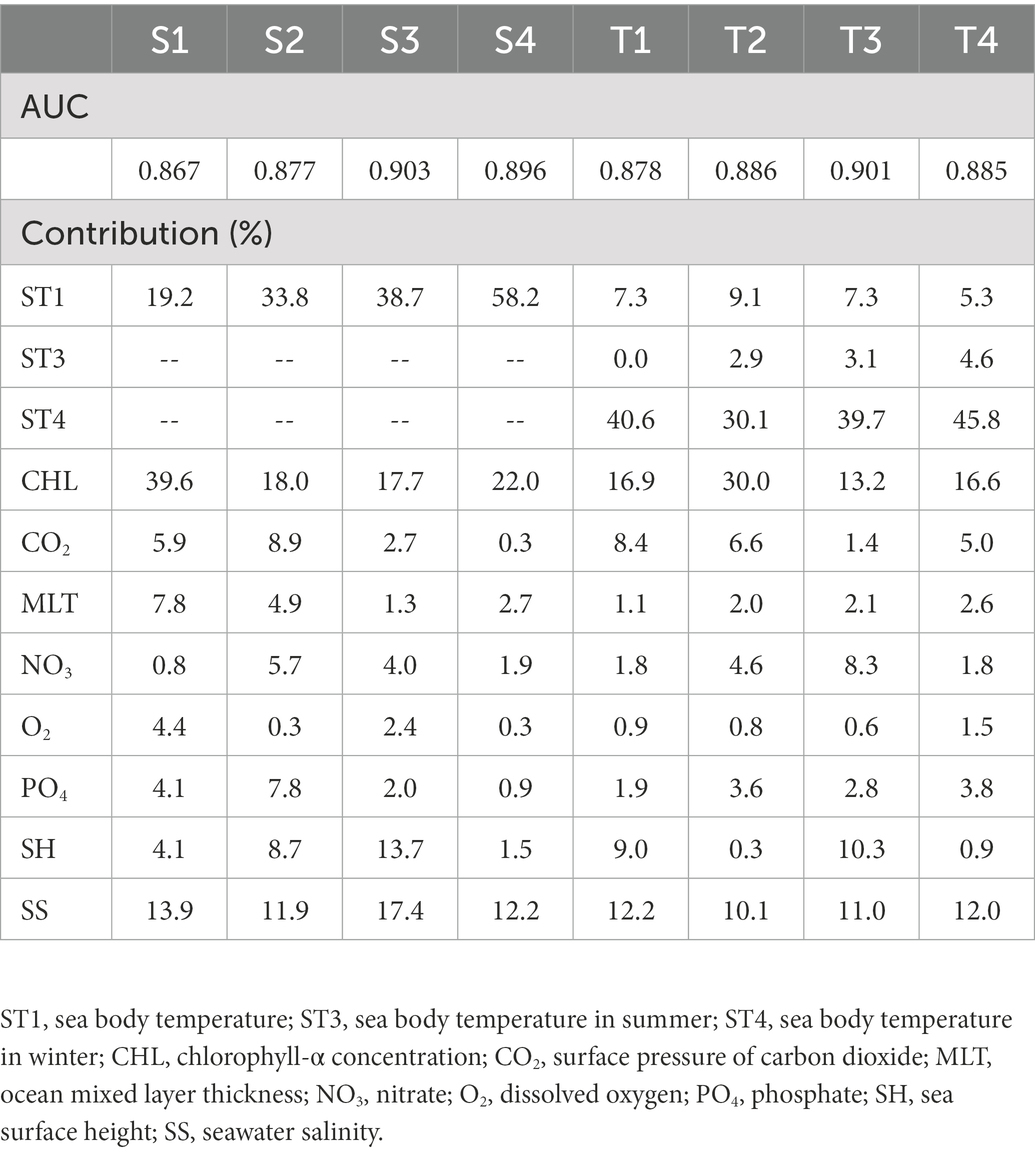
Table 2. Area under the receiver operating characteristic curves (AUCs) for MaxEnt modeling and the contribution of environmental factors.
3.2. Effect of environmental factors on reef-associated fish
The relative importance of environmental factors was determined by the contribution rates calculated by MaxEnt. The effect of environmental factors on reef-associated fish distribution increased with contribution rate. MaxEnt’s internal jackknife test can assess each environmental factor using a knife-cut approach and determine the impact of different factors on the potential distribution area of species (Wu, 1986; Berger and Skinner, 2005; Berger, 2007). The contribution rates of the environmental factors are listed in Table 2, and the results of the jackknife test are shown in Figure 2. The results show that sea body temperature (ST1) is the most critical factor in predicting the seasonal distribution of reef-associated fish in the SCS and ECS, with a contribution rate of 19.2% in winter (S1), 33.8% in spring (S2), 38.7% in summer (S3), and 58.2% in autumn (S4). In addition, chlorophyll-α concentration (CHL, 39.6% in S1, 18.0% in S2, 17.7% in S3, and 22.0% in S4) and seawater salinity (SS, 13.9% in S1, 11.9% in S2, 17.4% in S3, and 12.2% in S4) are also important environmental factors for seasonal distribution. In the models for predicting the distribution for 1993–1999 (T1), 2000–2006 (T2), 2007–2012 (T3), and 2013–2019 (T4), sea body temperature in winter (ST4) was the most important factor. ST4’s contribution rate reached 40.6% for T1, 30.1% for T2, 39.7% for T3, and 45.8% for T4. The other two factors with high impact were chlorophyll-α concentration (CHL, 16.9% in T1, 30.0% in S2, 13.2% in S3, and 16.6% in S4) and seawater salinity (SS, 12.2% in S1, 10.1% in S2, 11.0% in S3, and 12.0% in S4).
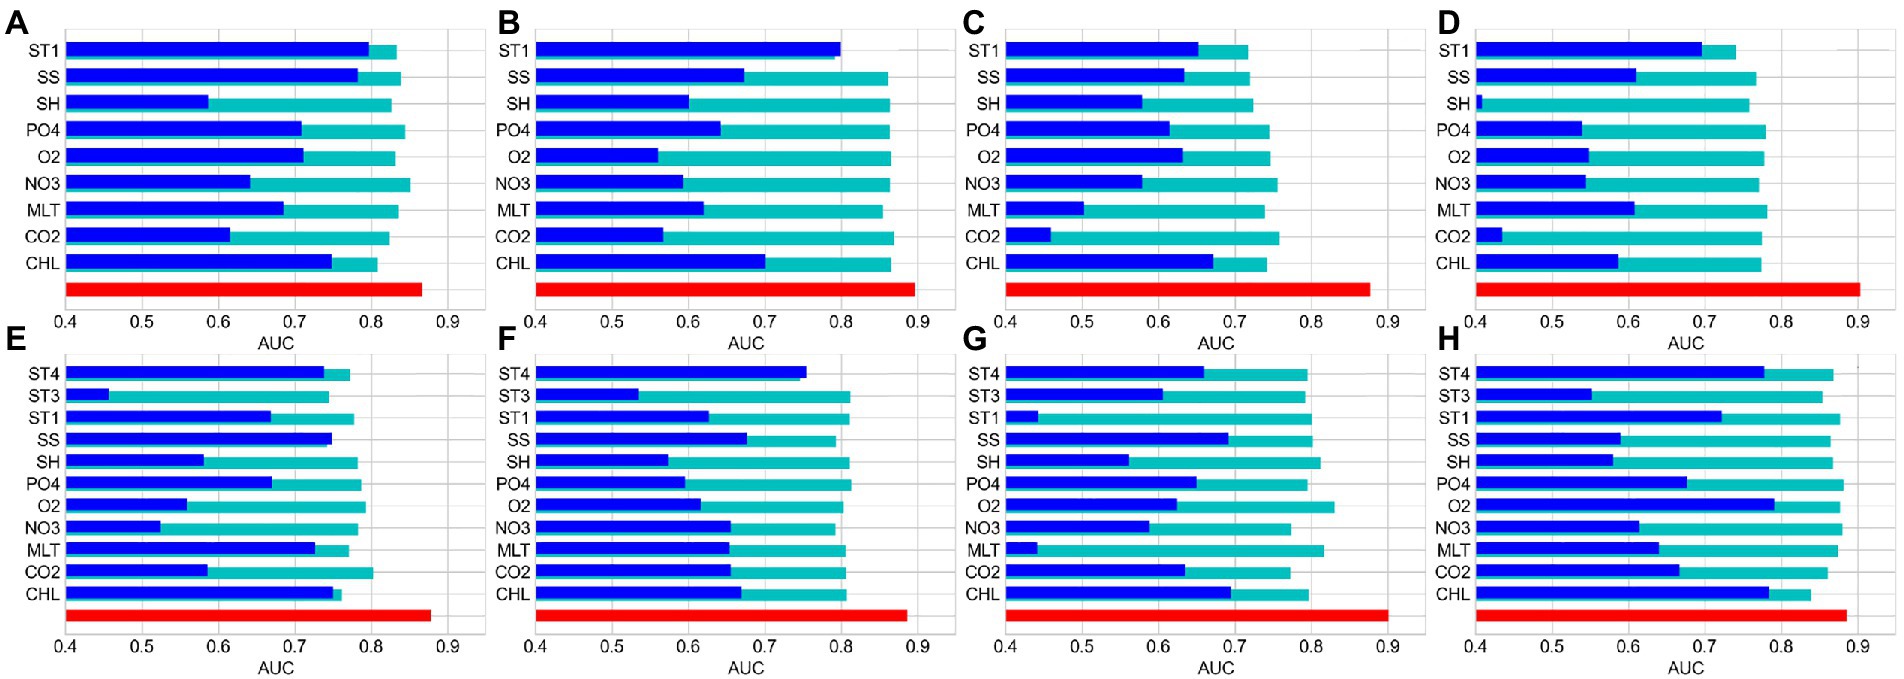
Figure 2. MaxEnt’s internal Jackknife test results on regularized training gain for reef-associated fish in the South China Sea (SCS) and East China Sea (ECS). (A–D) Winter, spring, summer, and autumn. (E–H) 1993–1999, 2000–2006, 2007–2012, and 2013–2019.
The response curves of the MaxEnt models for reef-associated fish suggested a high chance of occurrence (suitability >0.6) of this functional group in the SCS and ECS, as illustrated in Figures 3, 4. The suitable sea body temperature for reef-associated fish is between 20°C and 24°C, which dramatically affects the distribution pattern of reef-associated fish. In particular, reef-associated fish were found to be significantly influenced by sea body temperature in winter, indicating that these species are susceptible to low temperatures. From 1993 to 2019, the contribution rate of sea body temperature in winter increased, showing that reef-associated fish in the area have some capacity for ecological adaptation under climate change. Seawater salinity and chlorophyll-α concentration are the second essential environmental factors for reef-associated fish; moreover, sea surface height (ST, 13.7% in S3, and 10.3% in T3) and Carbon dioxide (CO2, 8.9% in S2) impact reef-associated fish in some cases. This suggests a complicated scenario in which reef-associated fish in the region are affected by different environmental factors.
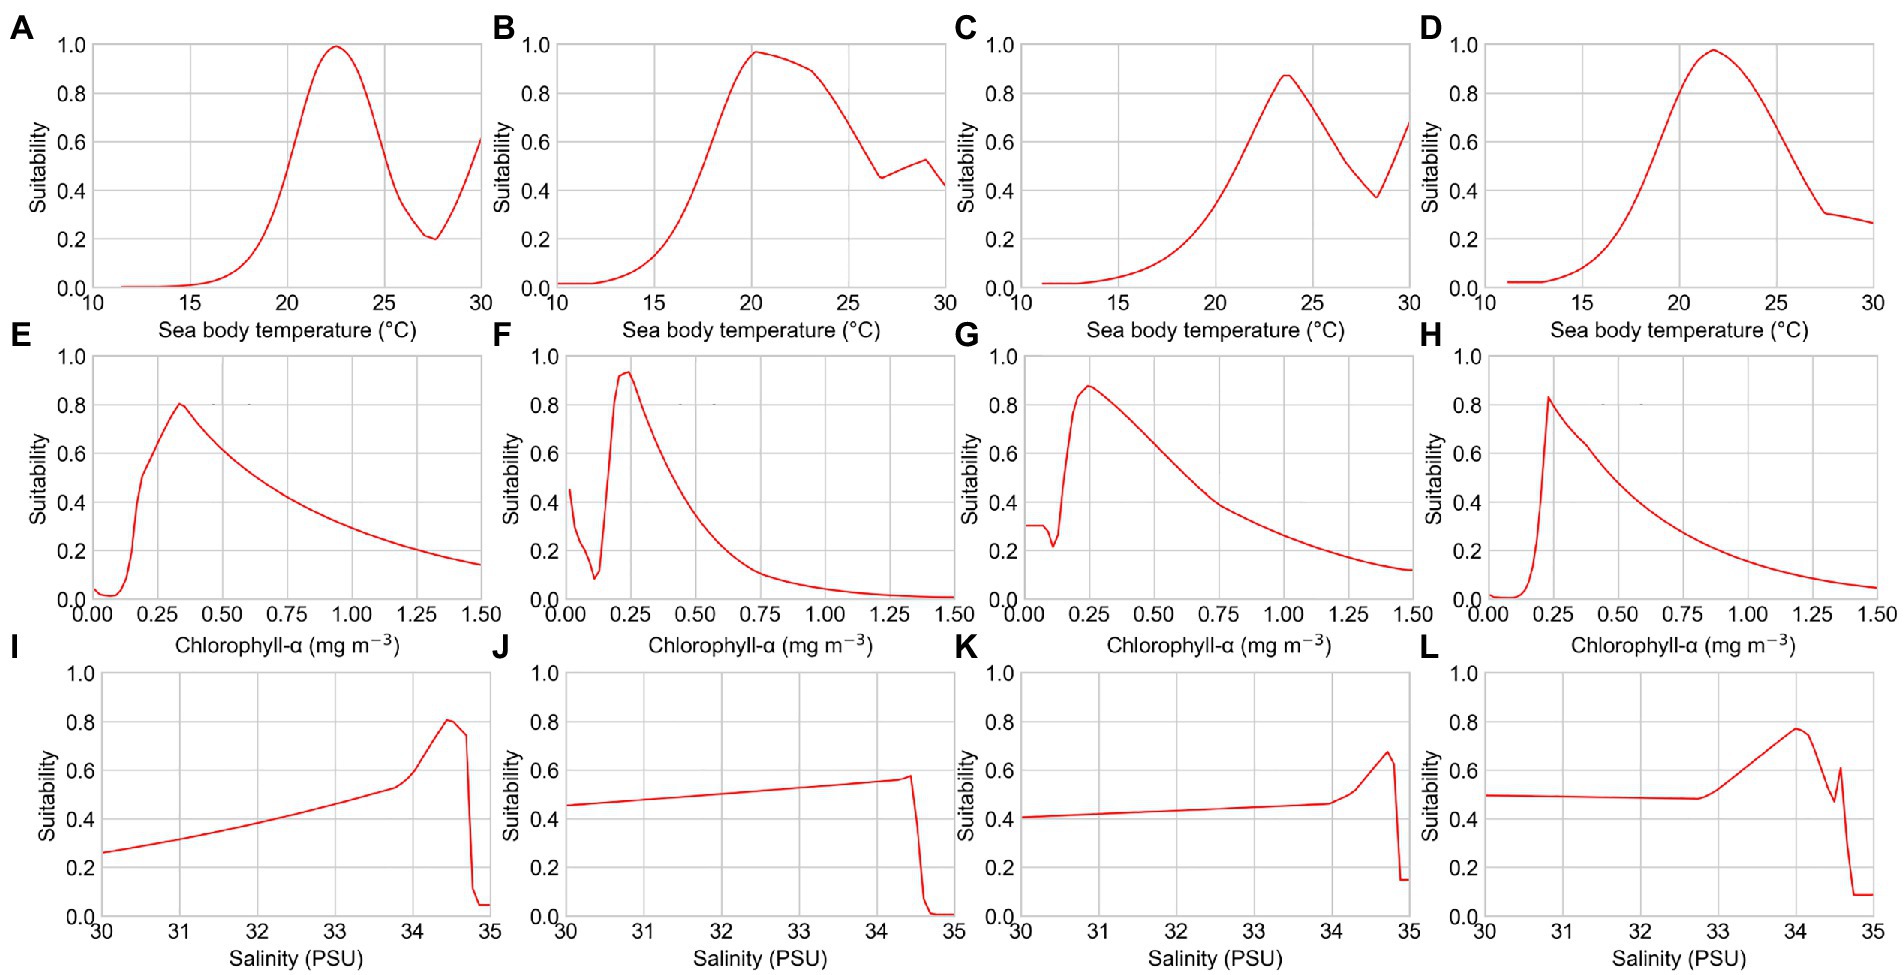
Figure 3. Response curves of several environmental factors affecting the distribution of reef-associated fish from the seasonal pattern simulation. (A–D) Sea body temperatures of S1, S2, S3, and S4; (E–H) chlorophyll-α concentration of S1, S2, S3, and S4; and (I–L) seawater salinity of S1, S2, S3, and S4. PSU, practical salinity units.
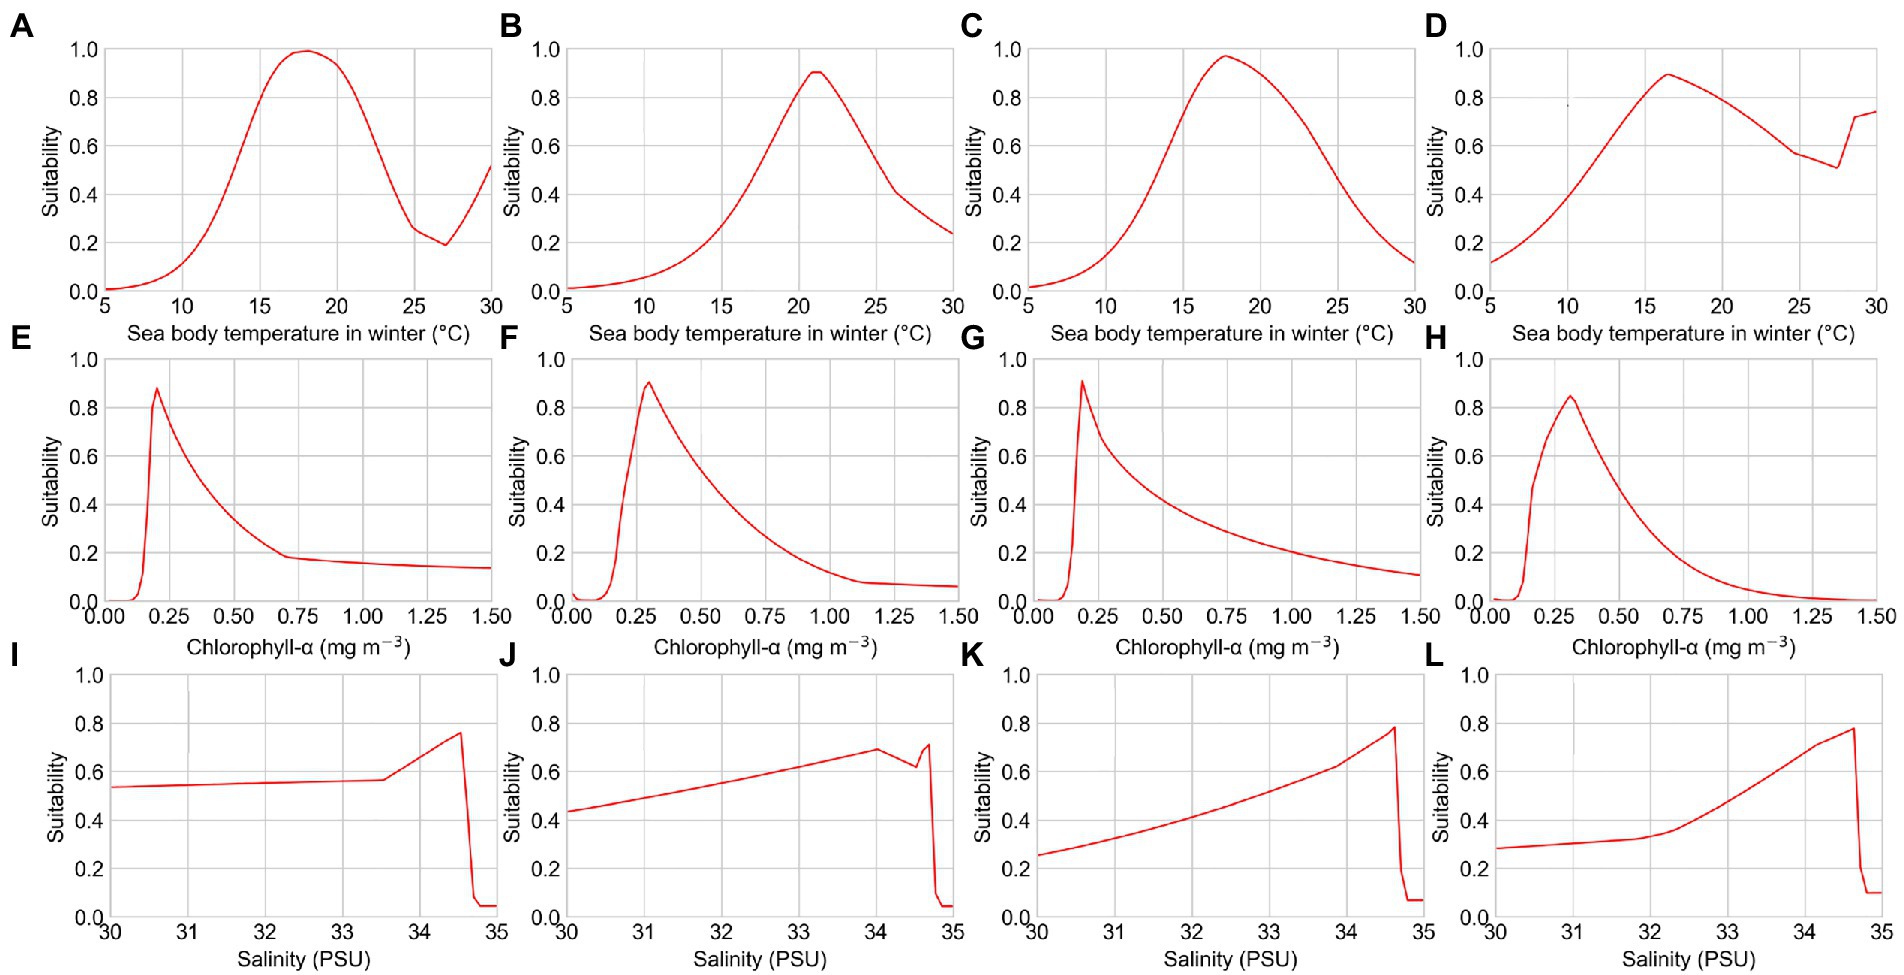
Figure 4. Response curves of several environmental factors affecting the distribution of reef-associated fish from the distribution tendency simulation. (A–D) Sea body temperature in winter of T1, T2, T3, and T4; (E–H) chlorophyll-α concentration of T1, T2, T3, and T4; and (I–L) seawater salinity of T1, T2, T3, and T4.
3.3. Predicted potentially suitable habitats in recent decades
Prediction maps of suitable area for reef-associated fish from 1993 to 2019 are shown in Figure 5. Overall, reef-associated fish have a wide distribution near coastlines, and the total area of potentially suitable habitats in the SCS and the ECS is >2.0 million km2; most suitable habitat areas are concentrated in the eastern–central ECS, along the coastline of Taiwan, and around the southern coastline of mainland China. The average area of high habitat suitability (presence probability >0.6) was approximately 200,000 km2, and the average area of moderate habitat suitability (presence probability 0.4–0.6) was approximately 160,000 km2.
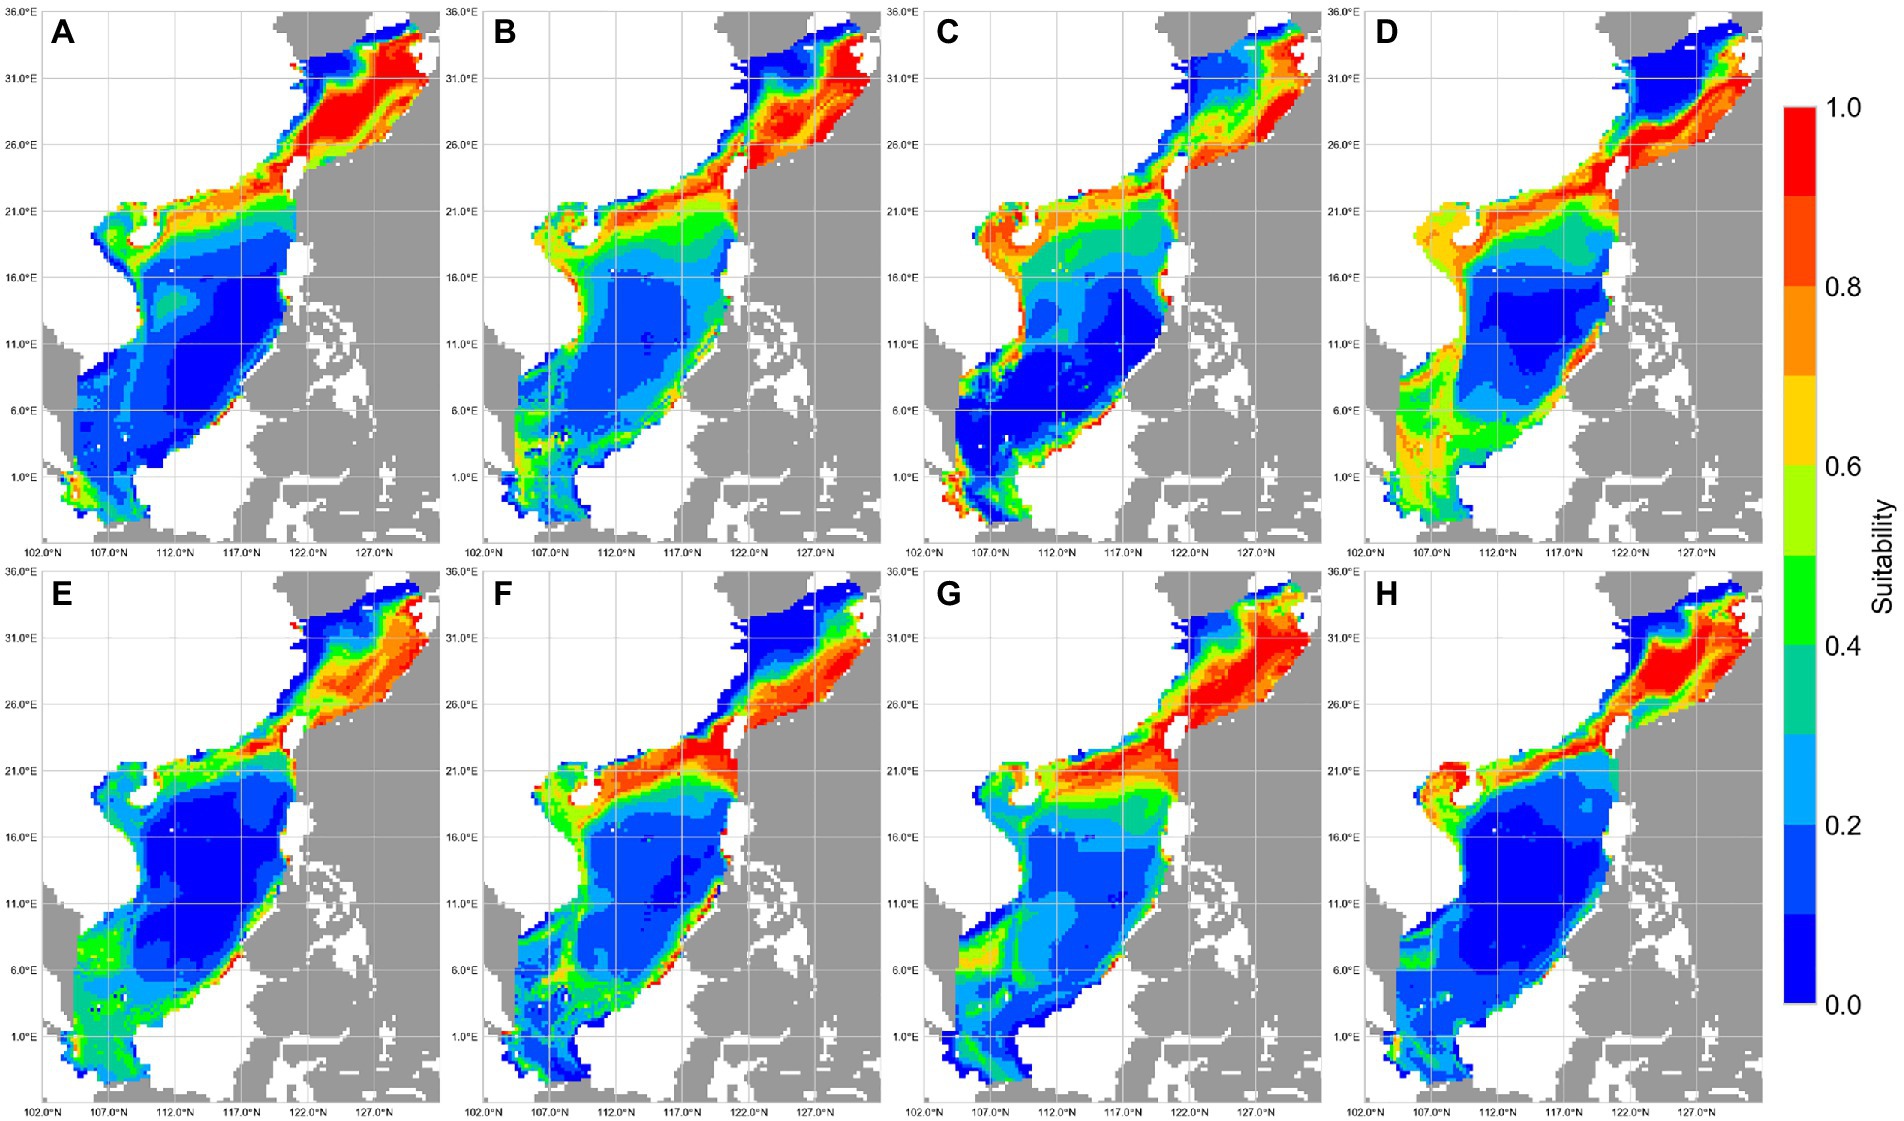
Figure 5. Suitability of reef-associated fish in the South China Sea (SCS) and East China Sea (ECS) predicted by MaxEnt. (A–D) Winter, spring, summer, and autumn. (E–H) 1993–1999, 2000–2006, 2007–2012, and 2013–2019.
4. Discussion
4.1. Seasonality and trends of reef-associated fish distribution
Reef-associated fish are valuable resources for coastal countries and regions; however, they face threats from climate change, overfishing, and habitat damage (Sadovy, 2005). In this study, we performed MaxEnt modeling of reef-associated fish habitats in the SCS and ECS under environmental conditions from 1993 to 2019 to study the seasonal variation and trends of suitable habitats for their conservation. Reef-associated fish inhabit coral reef ecosystems, and the predicted suitable habitat is consistent with the coral reef distribution in the two LMEs (Niino and Emery, 1961; Yu, 2012). Thus, our prediction is in agreement with the actual situation.
Marine species are expected to exhibit seasonal habitat variability (Mellin et al., 2007; Wilson et al., 2014). Coral reef ecosystems undergo seasonal change owing to factors such as sea temperature shifts (Bates, 2002; Kayanne et al., 2005; Fulton et al., 2014). We found that reef-associated fish in the SCS and ECS show apparent seasonal variation in habitat use: in winter, reef-associated fish concentrate in the eastern–central ECS, along the coastline of Taiwan Island, and around the southern coastline of China; in spring and summer, some reef-associated fish habitats shift to the southern SCS; in autumn, more fish are concentrated in the southern SCS. The total area of moderate and highly suitable habitats in spring and summer is approximately 20% larger than that in winter and autumn.
Fishery resource assessment, including the trends of fish habitats, has become a research focus (Xu et al., 2021) as climate change has become increasingly severe. Our predictions reveal the tendencies for suitable habitats for reef-associated fish. In the SCS, suitable habitats have continuously decreased, and the total area of moderate and highly suitable habitats in the two LMEs decreased by over 10% over the study period. This is because coral reefs in the SCS have experienced continuous damage owing to climate change and sea pollution (Yu, 2012). Based on our findings, major fishing nations in the region should protect reef-associated fish in response to damage to their habitats.
4.2. Environmental factors influencing reef-associated fish distribution
Suitable habitats for reef-associated fish are sensitive to sea body temperature. The average sea body temperature within the region increased by almost 0.2°C from 1993 to 2019; correspondingly, suitable habitats for reef-associated fish have decreased. Moreover, seasonal patterns of suitable habitats can be driven by short-term temperature changes during different seasons. Both short-and long-term temperature changes affect the distribution of reef-associated fish (Eme and Bennett, 2009; Heupel and Simpfendorfer, 2014; Tang et al., 2014; Holland et al., 2020). The predicted suitable habitats for reef-associated fish in this study are sensitive to sea body temperature in winter; therefore, we suggest that winter climate conditions could impact reef-associated fish in the SCS and ECS. Although the detailed mechanisms remain unknown, researchers have reported the rapid influence of winter climatic conditions on the distribution of marine species (Wingate and Secor, 2008; Morley et al., 2017).
Other crucial environmental factors for reef-associated fish distribution are chlorophyll-α concentration and seawater salinity, which significantly affected both seasonal variation in fish distribution and long-term distribution shifts. The concentration of chlorophyll-α is a measure of phytoplankton biomass, the primary producer of the coral reef food web. Among reef-associated fish in the study area, herbivorous fish are the primary consumers, and the phytoplankton biomass directly affected their habitats. However, a great number of predators, including groupers, tunas, or sharks, have an indirect relationship with Chlorophyll-α concentration. The biomass of predators was found to be much greater than that of primary consumers (Grigg et al., 1984; Polunin, 1996), indicating that trophic exchanges between habitats are necessary for sustaining coral reef ecosystems (Valentine and Heck, 2005). Therefore, chlorophyll-α concentration is considered to indirectly influence the distribution of reef-associated fish to some extent (Mátyás et al., 2003). A seawater salinity of approximately 34.5 practical salinity units (PSUs) is optimum for reef-associated fish in the study region.
The seasonal patterns of suitability maps could be explained by seasonality of important environmental factors. The most important environmental factor for spring, summer, and autumn is sea body temperature, but that for winter is chlorophyll-α concentration. The reef-associated fish prefers sea body temperatures between 20°C and 24°C (see Figures 3A–D), and the moderate and high habitat suitability areas in spring, summer, and autumn agree with the geographical distribution of this temperature range. In winter, however, reef-associated fish nest in the ECS, where the average temperature is relatively low (around 16°C). This suggests that the winter distribution pattern is significantly influenced by other environmental factors, such as chlorophyll-α concentration and seawater salinity. With an average value of 0.4 mg m−3 and 35 PSU, chlorophyll-α concentration and seawater salinity are significantly higher in the ECS during winter than during other seasons.
Long-term changes in the mean values of important environmental factors in the study area can be used to interpret the tendency of distribution patterns. We found that the spatial distribution of magnitude of important environmental factors in this region has not shifted significantly from 1993 to 2019. However, the average sea body temperature in winter has increased by 0.3°C, the average seawater salinity has decreased by 0.3 PSU, and the average chlorophyll-α concentration has decreased by 10%. These long-term changes in environmental factors could lead to the shift of potentially suitable areas for reef-associated fish in the past decades. The increase in the average sea surface temperature in the study area should be attributable to global warming. Chlorophyll-α concentration is generally influenced by sea surface temperature, with a higher sea surface temperature resulting in a lower chlorophyll-α concentration (Gregg and Conkright, 2002). Causes of changes of seawater salinity are more complicated to discuss. On the one hand, seawater salinity is also affected by sea body temperature (Cox et al., 1970; Schmitt, 1981). On larger time scales, however, seawater salinity exhibits multidecadal variability (Durack et al., 2012). The last freshening period in the study area began in the mid-1990s (Du et al., 2015). The weakening of the Kuroshio intrusion has been found to be the primary factor controlling the freshening in the two LMEs (Nan et al., 2016). The salinification period in the study area has been detected since the middle of the 2010s, caused by a stronger Kuroshio intrusion and human activities such as the rising Luzon Straits transport (Zeng et al., 2018).
4.3. Application of MaxEnt to marine species
The MaxEnt model predicts the geographical distribution of a species based on the idea of maximum entropy (Phillips et al., 2004, 2006, 2017). It has been widely used to predict the distribution of terrestrial species such as plants (Zhang K. et al., 2018; Zhang Q. et al., 2018; Tang et al., 2020, 2021), and has been extensively applied to studying marine species’ current distribution patterns and future distribution under climate change (Reiss et al., 2011; Fiedler et al., 2018; Melo-Merino et al., 2020). This study shows the possibility of using MaxEnt to study the distribution shift of different time periods and the seasonality of marine species.
A potential shortcoming of the MaxEnt model is that it cannot differentiate between the effects of climate change and human activity on the distribution of fish. However, human activities such as overfishing pose a risk to approximately 75% of coral reefs, resulting in a global decline in the quality of habitats for reef-associated fish (Pandolfi et al., 2003; Halpern et al., 2008; Leprieur et al., 2008; Barange et al., 2010; MacNeil et al., 2015; Spalding and Brown, 2015; Madin et al., 2016). This may lead to inaccuracies in the MaxEnt projection of the future fish habitat, but we consider it should not have an impact on investigating the present seasonal variation and distribution trend of fish habitats. We expect that, in addition to predicting the future distribution trend of fish, studying the mechanisms of human activities and climate change affecting the distribution of fish will also be the focus of future research.
Complex SDMs, such as MaxEnt, are reported to perform well within particular regions at finer resolutions, but predict poorly at large spatial scales and produce constrained predictions (Drake et al., 2006; Jiménez-Valverde et al., 2008; Jones et al., 2012). The spatial range of the study area in this investigation is large, but the generated suitability maps have wide distributions. We considered that MaxEnt performed well in this study because reef-associated fish have a broad distribution in the SCS and ECS, which is beneficial for MaxEnt predictions (Elith et al., 2011; Schmidt et al., 2020; Huang et al., 2021).
In response to changing conditions in marine environments, marine species tend to relocate and change their geographic range. The spatial–temporal distribution of marine species is a reflection of their population dynamics, which is a crucial factor for conservation strategies. Other researchers’ modeling of the seasonal distribution of marine species (Pitchford et al., 2016) and our research on seasonal patterns of reef-associated fish’s distribution demonstrate MaxEnt’s capacity to handle seasonal geographical shifts of marine species. Migratory species with complex spatial dynamics may also experience geographical range shifts, as they may alter their habitat preferences between migratory endpoints or across life stages (McKinney et al., 2012). The majority of research on this topic has focused on seabirds or mammals (Melo-Merino et al., 2020). Studying fish migration using MaxEnt will be the focus of future research.
As a presence-only distribution model, the maximum accuracy and stability in MaxEnt rely on sample capacity. Compared with recording the occurrence of terrestrial species, it is more difficult to accurately document the presence of marine species, such as fish. If sampling does not fully cover the survey area, then the prediction of the MaxEnt model will be biased (Fiedler et al., 2018). Although MaxEnt’s predictions of species distribution often shows the high model performance, this may also be attributable to MaxEnt’s propensity to overfit the sample occurrence data (Jiménez-Valverde et al., 2008). This can be caused by biased sampling effort. MaxEnt is generally regarded as robust to sample size variations (Bučas et al., 2013); nonetheless, large sample of biased data is not considered superior to a small amount of well-sampled data (Bean et al., 2012). The sampling completeness, whether the observed samples are consistent with the real distribution of species, of environmental gradients should take precedence over sample size, as this is the most important factor in determining the model’s accuracy (Newbold et al., 2009). Moreover, selecting appropriate environmental factors and removing high-correlated factors reduce MaxEnt’s tendency for overfitting (Graham, 2003). In this study, we made an effort to eliminate the sampling bias and remove environmental factors with high correlations.
The prediction results of this study were consistent with ecological plausibility, demonstrating that the MaxEnt model may accurately predict the distribution of marine species to some extent.
Based on our research findings, the reef-associated fish distribution in the SCS and ECS is most likely caused by changes in environmental factors such as sea body temperature, chlorophyll-a concentration, and seawater salinity. Clearly, steps must be taken to safeguard reef-associated fish populations in the SCS and ECS. To ensure the conservation and management of this functional group, additional research will be required to monitor the alterations of important environmental factors and to predict future reef-associated fish habitats. We recommend that potential strategies for coastal nations in this region include regulations or incentives to reduce emissions of greenhouse gases, which cause global warming and contribute to increases in sea water temperature; regulating human activities that contribute to the decline of chlorophyll-a, such as nutrient pollution; and establishing marine protected areas to help conserve reef-associated fish populations by shielding them from overfishing.
5. Conclusion
Investigating the seasonal variation and trends in reef-associated fish’s distribution and estimating the effects of important environmental factors are essential for fishery resource conservation. Our findings indicate that the distribution of reef-associated fish in the SCS and ECS has obvious seasonal patterns, and reef-associated fish are generally concentrated in the eastern–central ECS, along the coastline of Taiwan, and around the southern coastline of mainland China. Our results also show that suitable habitats for reef-associated fish have decreased along with rising temperatures in recent decades, with the most rapid decline occurring in the southern SCS. Our study serves as a reference for the development of fishery management and conservation strategies for this important functional group and region.
Data availability statement
The datasets presented in this study can be found in online repositories. The names of the repository/repositories and accession number(s) can be found below: FishBase, OBIS, and GBIF. Environmental factors can be downloaded from the archive of CMEMS (https://doi.org/10.48670/moi-00019, https://doi.org/10.48670/moi-00021). For all other requests, please contact the corresponding author.
Author contributions
JW: conceptualization, methodology, formal analysis, data curation, writing—original draft preparation. JW and ST: writing—review and editing. ST: supervision. All authors contributed to the article and approved the submitted version.
Acknowledgments
We would like to acknowledge Editage (https://editage.com/) for English language editing.
Conflict of interest
The authors declare that the research was conducted in the absence of any commercial or financial relationships that could be construed as a potential conflict of interest.
Publisher’s note
All claims expressed in this article are solely those of the authors and do not necessarily represent those of their affiliated organizations, or those of the publisher, the editors and the reviewers. Any product that may be evaluated in this article, or claim that may be made by its manufacturer, is not guaranteed or endorsed by the publisher.
Supplementary material
The Supplementary material for this article can be found online at: https://www.frontiersin.org/articles/10.3389/fevo.2023.1027614/full#supplementary-material
Footnotes
References
Aiello-Lammens, M. E., Boria, R. A., Radosavljevic, A., Vilela, B., and Anderson, R. P. (2015). spThin: an R package for spatial thinning of species occurrence records for use in ecological niche models. Ecography 38, 541–545. doi: 10.1111/ecog.01132
Arai, T. (2015). Diversity and conservation of coral reef fishes in the Malaysian South China Sea. Rev. Fish Biol. Fish. 25, 85–101. doi: 10.1007/s11160-014-9371-9
Barange, M., Cheung, W. W. L., Merino, G., and Perry, R. I. (2010). Modelling the potential impacts of climate change and human activities on the sustainability of marine resources. Curr. Opin. Environ. Sustain. 2, 326–333. doi: 10.1016/j.cosust.2010.10.002
Bates, N. R. (2002). Seasonal variability of the effect of coral reefs on seawater CO2 and air-sea CO2 exchange. Limnol. Oceanogr. 47, 43–52. doi: 10.4319/lo.2002.47.1.0043
Bean, W. T., Stafford, R., and Brashares, J. S. (2012). The effects of small sample size and sample bias on threshold selection and accuracy assessment of species distribution models. Ecography 35, 250–258. doi: 10.1111/j.1600-0587.2011.06545.x
Berger, Y. G. (2007). A jackknife variance estimator for Unistage stratified samples with unequal probabilities. Biometrika 94, 953–964. doi: 10.1093/biomet/asm072
Berger, Y. G., and Skinner, C. J. (2005). A jackknife variance estimator for unequal probability sampling. J. R. Stat. Soc. B 67, 79–89. doi: 10.1111/j.1467-9868.2005.00489.x
Bučas, M., Bergström, U., Downie, A.-L., Sundblad, G., Gullström, M., von Numers, M., et al. (2013). Empirical modelling of benthic species distribution, abundance, and diversity in the Baltic Sea: evaluating the scope for predictive mapping using different modelling approaches. ICES J. Mar. Sci. 70, 1233–1243. doi: 10.1093/icesjms/fst036
Cheung, W. W. L., Lam, V. W. Y., Sarmiento, J. L., Kearney, K., Watson, R., Zeller, D., et al. (2010). Large-scale redistribution of maximum fisheries catch potential in the global ocean under climate change. Glob. Change Biol. 16, 24–35. doi: 10.1111/j.1365-2486.2009.01995.x
Cox, R. A., McCartney, M. J., and Culkin, F. (1970). The specific gravity/salinity/temperature relationship in natural sea water. Deep Sea Res. Oceanogr. Abs. 17, 679–689. doi: 10.1016/0011-7471(70)90034-3
de Souza, R. A., and de Marco, P. (2014). The use of species distribution models to predict the spatial distribution of deforestation in the western Brazilian Amazon. Ecol. Model. 291, 250–259. doi: 10.1016/j.ecolmodel.2014.07.007
Drake, J. M., Randin, C., and Guisan, A. (2006). Modelling ecological niches with support vector machines. J. Appl. Ecol. 43, 424–432. doi: 10.1111/j.1365-2664.2006.01141.x
Du, Y., Zhang, Y., Feng, M., Wang, T., Zhang, N., and Wijffels, S. (2015). Decadal trends of the upper ocean salinity in the tropical indo-Pacific since mid-1990s. Sci. Rep. 5:16050. doi: 10.1038/srep16050
Durack, P. J., Wijffels, S. E., and Matear, R. J. (2012). Ocean salinities reveal strong global water cycle intensification during 1950 to 2000. Science 336, 455–458. doi: 10.1126/science.1212222
Elith, J., Phillips, S. J., Hastie, T., Dudík, M., Chee, Y. E., and Yates, C. J. (2011). A statistical explanation of MaxEnt for ecologists. Divers. Distrib. 17, 43–57. doi: 10.1111/j.1472-4642.2010.00725.x
Eme, J., and Bennett, W. A. (2009). Critical thermal tolerance polygons of tropical marine fishes from Sulawesi, Indonesia. J. Therm. Biol. 34, 220–225. doi: 10.1016/j.jtherbio.2009.02.005
Fan, H., Huang, M., Chen, Y., Zhou, W., Hu, Y., and Wei, F. (2022). Conservation priorities for global marine biodiversity across multiple dimensions. Natl. Sci. Rev. doi: 10.1093/nsr/nwac241
Fiedler, P. C., Redfern, J. V., Forney, K. A., Palacios, D. M., Sheredy, C., Rasmussen, K., et al. (2018). Prediction of large whale distributions: a comparison of presence-absence and presence-only modeling techniques. Front. Mar. Sci. 5:419. doi: 10.3389/fmars.2018.00419
Froese, R., and Pauly, D. (2022). FishBase. World wide web electronic publication. Available at: www.fishbase.org (Accessed July 22, 2022).
Fulton, C. J., Depczynski, M., Holmes, T. H., Noble, M. M., Radford, B., Wernberg, T., et al. (2014). Sea temperature shapes seasonal fluctuations in seaweed biomass within the Ningaloo coral reef ecosystem. Limnol. Oceanogr. 59, 156–166. doi: 10.4319/lo.2014.59.1.0156
Graham, M. H. (2003). Confronting multicollinearity in ecological multiple regression. Ecology 84, 2809–2815. doi: 10.1890/02-3114
Gregg, W. W., and Conkright, M. E. (2002). Decadal changes in global ocean chlorophyll. Geophys. Res. Lett. 29, 20-1–20-4. doi: 10.1029/2002GL014689
Grigg, R. W., Polovina, J. J., and Atkinson, M. J. (1984). Model of coral reef ecosystem. III. Resource limitation, community regulation, fisheries yield and resource management. Coral Reefs 3, 23–27. doi: 10.1007/BF00306137
Halpern, B. S., Walbridge, S., Selkoe, K. A., Kappel, C. V., Micheli, F., D’Agrosa, C., et al. (2008). A global map of human impact on marine ecosystems. Science 319, 948–952. doi: 10.1126/science.1149345
Heupel, M., and Simpfendorfer, C. (2014). Importance of environmental and biological drivers in the presence and space use of a reef-associated shark. Mar. Ecol. Prog. Ser. 496, 47–57. doi: 10.3354/meps10529
Holland, M. M., Smith, J. A., Everett, J. D., Vergés, A., and Suthers, I. M. (2020). Latitudinal patterns in trophic structure of temperate reef-associated fishes and predicted consequences of climate change. Fish Fish. 21, 1092–1108. doi: 10.1111/faf.12488
Huang, Z., Huang, A., Dawson, T. P., and Cong, L. (2021). The effects of the spatial extent on modelling Giant panda distributions using ecological niche models. Sustainability 13:11707. doi: 10.3390/su132111707
Jiménez-Valverde, A., Lobo, J. M., and Hortal, J. (2008). Not as good as they seem: the importance of concepts in species distribution modelling. Divers. Distrib. 14, 885–890. doi: 10.1111/j.1472-4642.2008.00496.x
Jones, M. C., Dye, S. R., Pinnegar, J. K., Warren, R., and Cheung, W. W. L. (2012). Modelling commercial fish distributions: prediction and assessment using different approaches. Ecol. Model. 225, 133–145. doi: 10.1016/j.ecolmodel.2011.11.003
Kayanne, H., Hata, H., Kudo, S., Yamano, H., Watanabe, A., Ikeda, Y., et al. (2005). Seasonal and bleaching-induced changes in coral reef metabolism and CO2 flux. Glob. Biogeochem. Cycles 19, 1–11. doi: 10.1029/2004GB002400
Leprieur, F., Beauchard, O., Blanchet, S., Oberdorff, T., and Brosse, S. (2008). Fish invasions in the world’s river systems: when natural processes are blurred by human activities. PLoS Biol. 6, e28–e0410. doi: 10.1371/journal.pbio.0060028
Li, Z., Liu, Y., and Zeng, H. (2022). Application of the MaxEnt model in improving the accuracy of ecological red line identification: a case study of Zhanjiang, China. Ecol. Ind. 137:108767. doi: 10.1016/j.ecolind.2022.108767
Li, Y., and Zhang, Y. (2012). Fisheries impact on the East China Sea shelf ecosystem for 1969–2000. Helgoland Mar. Res. 66, 371–383. doi: 10.1007/s10152-011-0278-8
MacNeil, M. A., Graham, N. A. J., Cinner, J. E., Wilson, S. K., Williams, I. D., Maina, J., et al. (2015). Recovery potential of the world’s coral reef fishes. Nature 520, 341–344. doi: 10.1038/nature14358
Madin, E. M. P., Dill, L. M., Ridlon, A. D., Heithaus, M. R., and Warner, R. R. (2016). Human activities change marine ecosystems by altering predation risk. Glob. Change Biol. 22, 44–60. doi: 10.1111/gcb.13083
Manel, S., Williams, H. C., and Ormerod, S. J. (2001). Evaluating presence-absence models in ecology: the need to account for prevalence. J. Appl. Ecol. 38, 921–931. doi: 10.1046/j.1365-2664.2001.00647.x
Manikandan, B., Ravindran, J., Shrinivaasu, S., Marimuthu, N., and Paramasivam, K. (2014). Community structure and coral status across reef fishing intensity gradients in Palk Bay reef, southeast coast of India. Environ. Monit. Assess. 186, 5989–6002. doi: 10.1007/s10661-014-3835-1
Marineregions.org (2019). South China Sea. Available at: https://marineregions.org/gazetteer.php?p=details&id=8565
Marineregions.org (2019). East China Sea. Available at: https://marineregions.org/gazetteer.php?p=details&id=8557
Mátyás, K., Oldal, I., Korponai, J., Tátrai, I., and Paulovits, G. (2003). Indirect effect of different fish communities on nutrient chlorophyll relationship in shallow hypertrophic water quality reservoirs. Hydrobiologia 504, 231–239. doi: 10.1023/B:HYDR.0000008523.83752.14
McKinney, J., Hoffmayer, E., Wu, W., Fulford, R., and Hendon, J. (2012). Feeding habitat of the whale shark Rhincodon typus in the northern Gulf of Mexico determined using species distribution modelling. Mar. Ecol. Prog. Ser. 458, 199–211. doi: 10.3354/meps09777
Mellin, C., Kulbicki, M., and Ponton, D. (2007). Seasonal and ontogenetic patterns of habitat use in coral reef fish juveniles. Estuar. Coast. Shelf Sci. 75, 481–491. doi: 10.1016/j.ecss.2007.05.026
Melo-Merino, S. M., Reyes-Bonilla, H., and Lira-Noriega, A. (2020). Ecological niche models and species distribution models in marine environments: a literature review and spatial analysis of evidence. Ecol. Model. 415:108837. doi: 10.1016/j.ecolmodel.2019.108837
Morley, J. W., Batt, R. D., and Pinsky, M. L. (2017). Marine assemblages respond rapidly to winter climate variability. Glob. Change Biol. 23, 2590–2601. doi: 10.1111/gcb.13578
Nan, F., Yu, F., Xue, H., Zeng, L., Wang, D., Yang, S., et al. (2016). Freshening of the upper ocean in the South China Sea since the early 1990s. Deep Sea Res. Part 1 Oceanogr. Res. Pap. 118, 20–29. doi: 10.1016/j.dsr.2016.10.010
Newbold, T., Reader, T., Zalat, S., El-Gabbas, A., and Gilbert, F. (2009). Effect of characteristics of butterfly species on the accuracy of distribution models in an arid environment. Biodivers. Conserv. 18, 3629–3641. doi: 10.1007/s10531-009-9668-5
Niino, H., and Emery, K. O. (1961). Sediments of shallow portions of East China Sea and South China Sea. Geol. Soc. Am. 72:731. doi: 10.1130/0016-7606(1961)72[731:sospoe]2.0.co;2
Pandolfi, J. M., Bradbury, R. H., Sala, E., Hughes, T. P., Bjorndal, K. A., Cooke, R. G., et al. (2003). Global trajectories of the long-term decline of coral reef ecosystems. Science 301, 955–958. doi: 10.1126/science.1085706
Peterson, A. T., Papeş, M., and Soberón, J. (2008). Rethinking receiver operating characteristic analysis applications in ecological niche modeling. Ecol. Model. 213, 63–72. doi: 10.1016/j.ecolmodel.2007.11.008
Phillips, S. J., Anderson, R. P., Dudík, M., Schapire, R. E., and Blair, M. E. (2017). Opening the black box: an open-source release of Maxent. Ecography 40, 887–893. doi: 10.1111/ecog.03049
Phillips, S. B., Aneja, V. P., Kang, D., and Arya, S. P. (2006). Modelling and analysis of the atmospheric nitrogen deposition in North Carolina. Int. J. Glob. Environ. Issues 190, 231–259. doi: 10.1016/j.ecolmodel.2005.03.026
Phillips, S.J., Dudík, M., and Schapire, R.E. (2004). “A maximum entropy approach to species distribution modeling.” in Twenty-First International Conference on Machine Learning—ICML ‘04 (New York, NY: ACM Press), 83.
Phillips, S.J., Dudik, M., and Schapire, R.E. (2020). Maxent software for modeling species niches and distributions (Version 3.4.4). Available at: http://biodiversityinformatics.amnh.org/open_source/maxent/. (Accessed July 30, 2022).
Pitchford, J. L., Howard, V. A., Shelley, J. K., Serafin, B. J. S., Coleman, A. T., and Solangi, M. (2016). Predictive spatial modelling of seasonal bottlenose dolphin (Tursiops truncatus) distributions in the Mississippi sound. Aquat. Conserv. Mar. Freshwat. Ecosyst. 26, 289–306. doi: 10.1002/aqc.2547
Polunin, N. V. C., and Roberts, C. M. (1996). “Trophodynamics of reef fisheries productivity” in Reef Fisheries. eds. N. V. C. Polunin and C. M. Roberts (Netherlands: Springer), 113–135.
Randall, J. E., and Lim, K. K. P. (2000). A checklist of the fishes of the South China Sea. Raffles Bull. Zool. 8, 569–677.
Reiss, H., Cunze, H., König, K., Neumann, K., and Kröncke, I. (2011). Species distribution modelling of marine benthos: a North Sea case study. Mar. Ecol. Prog. Ser. 442, 71–86. doi: 10.3354/meps09391
Sadovy, Y. (2005). Trouble on the reef: the imperative for managing vulnerable and valuable fisheries. Fish Fish. 6, 167–185. doi: 10.1111/j.1467-2979.2005.00186.x
Schmidt, H., Radinger, J., Teschlade, D., and Stoll, S. (2020). The role of spatial units in modelling freshwater fish distributions: comparing a subcatchment and river network approach using MaxEnt. Ecol. Model. 418:108937. doi: 10.1016/j.ecolmodel.2020.108937
Schmitt, R. W. (1981). Form of the temperature-salinity relationship in the central water: evidence for double-diffusive mixing. J. Physic. Oceanogr. 11, 1015–1026. doi: 10.1175/1520-0485(1981)011<1015:FOTTSR>2.0.CO;2
Sherman, K. (2014). Toward ecosystem-based management (EBM) of the world’s large marine ecosystems during climate change. Environ. Dev. 11, 43–66. doi: 10.1016/j.envdev.2014.04.006
Spalding, M. D., and Brown, B. E. (2015). Warm-water coral reefs and climate change. Science 350, 769–771. doi: 10.1126/science.aad0349
Swets, J. A. (1988). Measuring the accuracy of diagnostic systems. Science 240, 1285–1293. doi: 10.1126/science.3287615
Tang, C.-H., Leu, M.-Y., Shao, K., Hwang, L.-Y., and Chang, W.-B. (2014). Short-term effects of thermal stress on the responses of branchial protein quality control and osmoregulation in a reef-associated fish, Chromis viridis. Zool. Stud. 53:21. doi: 10.1186/s40555-014-0021-7
Tang, X., Yuan, Y., Li, X., and Zhang, J. (2021). Maximum entropy modeling to predict the impact of climate change on pine wilt disease in China. Front. Plant Sci. 12:652500. doi: 10.3389/fpls.2021.652500
Tang, X., Yuan, Y., and Zhang, J. (2020). How climate change will alter the distribution of suitable dendrobium habitats. Front. Ecol. Evol. 8:536339 doi: 10.3389/fevo.2020.536339
Teh, L. S. L., Cashion, T., Alava Saltos, J. J., Cheung, W. W. L., and Sumaila, U. R. (2019). Status, trends, and the future of fisheries in the east and South China seas. Fisheries Centre Res. Rep. 27, 8–14. doi: 10.14288/1.0379884
Valentine, J. F., and Heck, K. L. (2005). Perspective review of the impacts of overfishing on coral reef food web linkages. Coral Reefs 24, 209–213. doi: 10.1007/s00338-004-0468-9
Wilson, S. K., Fulton, C. J., Depczynski, M., Holmes, T. H., Noble, M. M., Radford, B., et al. (2014). Seasonal changes in habitat structure underpin shifts in macroalgae-associated tropical fish communities. Mar. Biol. 161, 2597–2607. doi: 10.1007/s00227-014-2531-6
Wingate, R. L., and Secor, D. H. (2008). Effects of winter temperature and flow on a summer-fall nursery fish assemblage in the Chesapeake Bay, Maryland. Trans. Am. Fish. Soc. 137, 1147–1156. doi: 10.1577/t07-098.1
Wu, C. F. J. (1986). Jackknife, bootstrap and other resampling methods in regression analysis. An. Stat. 14, 1261–1295. doi: 10.1214/aos/1176350142
Xu, P., Xie, M., Zhou, W., and Suo, A. (2021). Research on fishery resource assessment and sustainable utilization (FRASU) during 1990–2020: a bibliometric review. Glob. Ecol. Conserv. 29:e01720. doi: 10.1016/j.gecco.2021.e01720
Yan, H., He, J., Xu, X., Yao, X., Wang, G., Tang, L., et al. (2021). Prediction of potentially suitable distributions of Codonopsis pilosula in China based on an optimized MaxEnt model. Front. Ecol. Evol. 9:773396. doi: 10.3389/fevo.2021.773396
Yu, K. (2012). Coral reefs in the South China Sea: their response to and records on past environmental changes. Sci. China Earth Sci. 55, 1217–1229. doi: 10.1007/s11430-012-4449-5
Zeng, L., Chassignet, E. P., Schmitt, R. W., Xu, X., and Wang, D. (2018). Salinification in the South China Sea since late 2012: a reversal of the freshening since the 1990s. Geophys. Res. Lett. 45, 2744–2751. doi: 10.1002/2017GL076574
Zhang, M. G., Slik, J. W. F., and Ma, K. P. (2016). Using species distribution modeling to delineate the botanical richness patterns and phytogeographical regions of China. Sci. Rep. 6:22400. doi: 10.1038/srep22400
Zhang, Q., Wen, J., Chang, Z.-Q., Xie, C.-X., and Song, J.-Y. (2018). Evaluation and prediction of ecological suitability of medicinal plant American ginseng (panax quinquefolius). Chin. Herbal Med. 10, 80–85. doi: 10.1016/j.chmed.2018.01.003
Zhang, K., Yao, L., Meng, J., and Tao, J. (2018). Maxent modeling for predicting the potential geographical distribution of two peony species under climate change. Sci. Total Environ. 634, 1326–1334. doi: 10.1016/j.scitotenv.2018.04.112
Keywords: MaxEnt, reef-associated fish, South China Sea, East China Sea, suitable habitats
Citation: Wang J and Tabeta S (2023) MaxEnt modeling to show patterns of coastal habitats of reef-associated fish in the South and East China Seas. Front. Ecol. Evol. 11:1027614. doi: 10.3389/fevo.2023.1027614
Edited by:
Wenliang Zhou, Southern Marine Science and Engineering Guangdong Laboratory (Guangzhou), ChinaReviewed by:
mohammad reza shokri, Shahid Beheshti University, IranHem Nalini Morzaria-Luna, Long Live the Kings, United States
Huizhong Fan, Institute of Zoology (CAS), China
Copyright © 2023 Wang and Tabeta. This is an open-access article distributed under the terms of the Creative Commons Attribution License (CC BY). The use, distribution or reproduction in other forums is permitted, provided the original author(s) and the copyright owner(s) are credited and that the original publication in this journal is cited, in accordance with accepted academic practice. No use, distribution or reproduction is permitted which does not comply with these terms.
*Correspondence: Jia Wang, ✉ NzkzNzU4MjQyMkBlZHUuay51LXRva3lvLmFjLmpw