 Wen-Yu Song1,2
 Kenneth Otieno Onditi2,3
 Xue-You Li2
 Zhong-Zheng Chen2,4
 Shui-Wang He2
 Quan Li2
 Xue-Long Jiang2*
- 1Vector Laboratory, Institute of Pathogens and Vectors, Yunnan Provincial Key Laboratory for Zoonosis Control and Prevention, Dali University, Dali, Yunnan, China
- 2State Key Laboratory of Genetic Resources and Evolution, Kunming Institute of Zoology, Chinese Academy of Sciences, Kunming, Yunnan, China
- 3Kunming College of Life Science, University of Chinese Academy of Sciences, Kunming, Yunnan, China
- 4Anhui Provincial Key Laboratory of the Conservation and Exploitation of Biological Resources, College of Life Sciences, Anhui Normal University, Wuhu, Anhui, China
Introduction: Species distribution in alpine areas is constrained by multiple abiotic and biotic stressors. This leads to discrepant assembly patterns between different locations and study objects as opposite niche-based processes—limiting similarity and habitat filtering—simultaneously structure communities, masking overall patterns. We aimed to address how these processes structure small mammal communities in the alpine tree line transition zone, one of the most distinct vegetation transitions between alpine and montane habitats.
Methods: We compiled a dataset of species checklist, phylogeny, and functional traits from field collection and published sources spanning 18 mountains in southwest China. We first examined hypothetical niche-based processes with frequently used phylogenetic and trait approaches using this dataset. The species traits were decomposed into different niche components to explore the respective effects of specific stressors. Indices representing evolutionary history, trait space, and pairwise species distance were estimated and compared with null model expectations. Linear mixed-effect models were used to assess the association patterns between diversity indices and elevation.
Results: The results indicated that phylogenetic and functional richness were positively correlated with species richness. In contrast, distance-based indices were either negatively or weakly positively correlated with species richness. Null model analyses suggested no evidence of non-random phylogenetic or overall trait patterns. However, the resource acquisition niche tended to be more overdispersed (positive slopes), while the habitat affinity niche tended to be more clustered (negative slopes) beyond the high elevation tree line.
Discussion: These findings show that opposite niche-based processes simultaneously structure small mammal communities in alpine areas. Overall, the present study provides vital insights into the complexity of assembly processes in these habitats. It also highlights the importance of relating relevant traits to distinguish the influences of specific abiotic and biotic stressors.
1. Introduction
Species assembling processes in communities remain central ecological concerns (Keddy, 1992; Weiher and Keddy, 1995; Cadotte and Tucker, 2017). The classic niche-based framework mainly explains community assembly with two opposite deterministic processes—habitat filtering and limiting similarity (Webb et al., 2002; Mayfield and Levine, 2010; Kraft et al., 2015). Under habitat filtering, abiotic and biotic factors systematically exclude species lacking traits suited to surviving in a community, increasing species similarity. Otherwise, limiting similarity emphasizes that interspecific competition for resources prevents the coexistence of functionally similar species (Kraft et al., 2015). Habitat filtering and limiting similarity can be inferred by comparing observed diversity values with values expected from null-model communities, i.e., comprised of species randomly drawn from the regional species pool or randomizing species relations and ecological attributes (Kembel, 2009; Miller et al., 2017). Under a null expectation, if habitat filtering dominates the assembly process, the traits of species in the focus community would be more similar than expected (functional clustering). In contrast, if the assembly process is primarily driven by limiting similarity, the traits of species would be less similar than expected (functional overdispersion) (Mouchet et al., 2010; Jarzyna et al., 2021). When trait evolution exhibits a robust phylogenetic signal (when related species tend to resemble each other more than when randomly drawn from the community), the phylogeny may serve as a proxy for species functional relationships (Mouquet et al., 2012). Consequently, patterns of phylogenetic diversity may be used as proxies for functional diversity to infer the process underlying community assembly (Webb et al., 2002; Cavender-Bares et al., 2004).
Recently, ecologists have increasingly recognized that the assembly processes explained by phylogenetic and trait dimensions have incongruent patterns, even when trait evolution conforms to phylogenetic relatedness (strong phylogenetic signal) (Du et al., 2017; Ding et al., 2021; Jarzyna et al., 2021). This incongruity highlights that using either trait or phylogenetic diversity alone is insufficient and reiterates the need for complementary analyses with both diversity dimensions (Cadotte et al., 2019; Ding et al., 2021). Additionally, multiple processes could simultaneously structure the community through different niche components (Spasojevic and Suding, 2012; Lessard et al., 2016), blurring the magnitude of deviation between observed patterns and null expectations (Helmus et al., 2007). The effect of different assembly processes has emerged as a critical question in community ecology (Kohli et al., 2021; Wang et al., 2022). Studying assembly processes by classifying traits into environmental tolerance or resource competition niches may help resolve this puzzle (Lopez et al., 2016; Kohli et al., 2021). Moreover, given that a habitat can be characterized by several abiotic or biotic stressor variables, identifying essential traits influencing species persistence in communities can significantly improve our understanding of individual processes (Kirk et al., 2022).
Over the last few decades, considerable progress has been made toward a better understanding community assembly along environmental gradients, from local to global scales. A prevalent perspective asserts that communities in harsher habitats are usually structured by habitat filtering (Cavender-Bares et al., 2009; Read et al., 2018; Zhang et al., 2020) because survival under stressful environmental conditions often requires specialized traits (Gohli and Voje, 2016; Kohli et al., 2022; Tang et al., 2022). These findings are foundational hypotheses for investigating community assembly in mountain areas characterized by rapid environmental changes along elevational gradients. Due to low temperatures, biomass, and oxygen levels (Barry, 2008; Sherman et al., 2008; Körner, 2013), an alpine habitat is considerably harsh for the species (Chen et al., 2020; Zhang et al., 2020). Previous studies have revealed highly complex assembly processes in such habitats. In plants, phylogenetic or functional clustering in high elevations has been reported in single and multiple mountain systems (Takahashi and Tanaka, 2016; Qian et al., 2021), supporting the dominant influence of habitat filtering. However, Spasojevic and Suding (2012) have highlighted the simultaneous impact of multiple processes shaping alpine tundra communities by distinguishing traits related to different life requirements. In animals, Montaño-Centellas et al. (2019), studying phylogenetic and functional dimensions in birds along 46 elevational gradients, found no general increasing or decreasing pattern, highlighting the uniqueness of each mountain system and the corresponding influence on species assembly. Still, other studies have observed an increasing tendency for functional or phylogenetic overdispersion (or even both) toward high elevation. For instance, Jarzyna et al. (2021) found that bird assemblages in cold temperate highlands were functionally overdispersed across 46 mountain systems worldwide.
Similarly, Kohli et al. (2021) found that small mammal communities tended to be more phylogenetically and functionally overdispersed in high elevations. In contrast, Ding et al. (2021) found that phylogenetic structure, but not functional structure, was more overdispersed in bird assemblages at high elevations in the central Chinese Himalayas. The tendency of small mammal assemblages to be phylogenetically and functionally clustered in high elevations also showed contrasting patterns in three elevational gradients in Kenya (Musila et al., 2019; Onditi et al., 2022). Overall, these works have prompted more studies into the complexity of community assembly dynamics in the alpine area. Most previous studies on community assembly in alpine areas either focused on single or a few elevational gradients (Zhang et al., 2020; Ding et al., 2021; Kohli et al., 2021; Montaño-Centellas et al., 2021) or gradients across broad geographical extents with coarse species distribution information (Jarzyna et al., 2021; Qian et al., 2021). The assembly processes underpinning mammal communities in alpine areas have not been exhaustively studied.
Here, we used standardized field surveys to collect small mammals below, along, and above the alpine tree line from 18 sites across the Three Parallel Rivers of Yunnan Protected Areas in southwest China. We compiled a regional species pool comprising a species checklist, phylogeny, and functional traits from field data and literature records to examine hypothetical community assembly processes. Based on the current knowledge of the potential factors determining small mammal distribution in the alpine habitat (Feist and White, 1989; Ramírez-Bautista and Williams, 2019; Carrasco et al., 2022), we tested two alternative hypotheses of abiotic drivers of phylogenetic and functional diversity patterns (Webb et al., 2002; Cavender-Bares et al., 2009; Mayfield and Levine, 2010). First, if the low temperature or reduced habitat complexity in the alpine areas constraints species persistence and dominates the assembly process (Reymond et al., 2013; Song et al., 2020), phylogenetic and functional patterns should be more clustered than expected (synonymous with habitat filtering). Alternatively, considering that the low biomass in the alpine area may drive species to compete for limited resources (Costa-Pereira et al., 2019), resource competition should lead to a more overdispersed pattern than expected (synonymous with limiting similarity). Moreover, we grouped traits into three niche components (Lopez et al., 2016) to test whether habitat constraint and resource competition simultaneously drove the assembly process (Spasojevic and Suding, 2012; Lessard et al., 2016; Kohli et al., 2021). We expected temperature and habitat constraint traits to be more clustered toward higher elevations (Kirk et al., 2022), while resources-related traits would be more overdispersed (Cisneros et al., 2014). By testing these hypotheses, we aim to reveal how community assembly are impacted by opposite niche-based processes.
2. Materials and methods
2.1. Study area and field sampling
The study region is located in the southwest mountains of China, a global biodiversity hotspot (Mittermeier et al., 2011), covering the Three Parallel Rivers of Yunnan Protected Areas (Figure 1A). Four north–south trending mountain ranges dominate the topography of the region (from west to east, Gaoligong, Nushan, Yunling, and Shaluli). Eighteen prominent sites (or sky islands) belonging to these mountain ranges were selected to represent the geography of the region (Supplementary Table S1). The tree line in these mountains is 3,800–4,200 m above sea level (a.s.l.). It represents one of the most distinct vegetation boundaries separating alpine from montane habitats (Körner, 2013; Testolin et al., 2020). Alpine habitats in the region experience a moderate decline in annual precipitation from west to east (Sherman et al., 2008) and a mean annual temperature of 6.7°C at the tree line (Wang et al., 2013). The vegetation rapidly transitions from dark coniferous forests to dwarf shrubs, meadows, and screes from below to above the tree line (Figures 1B–D; Sherman et al., 2008).
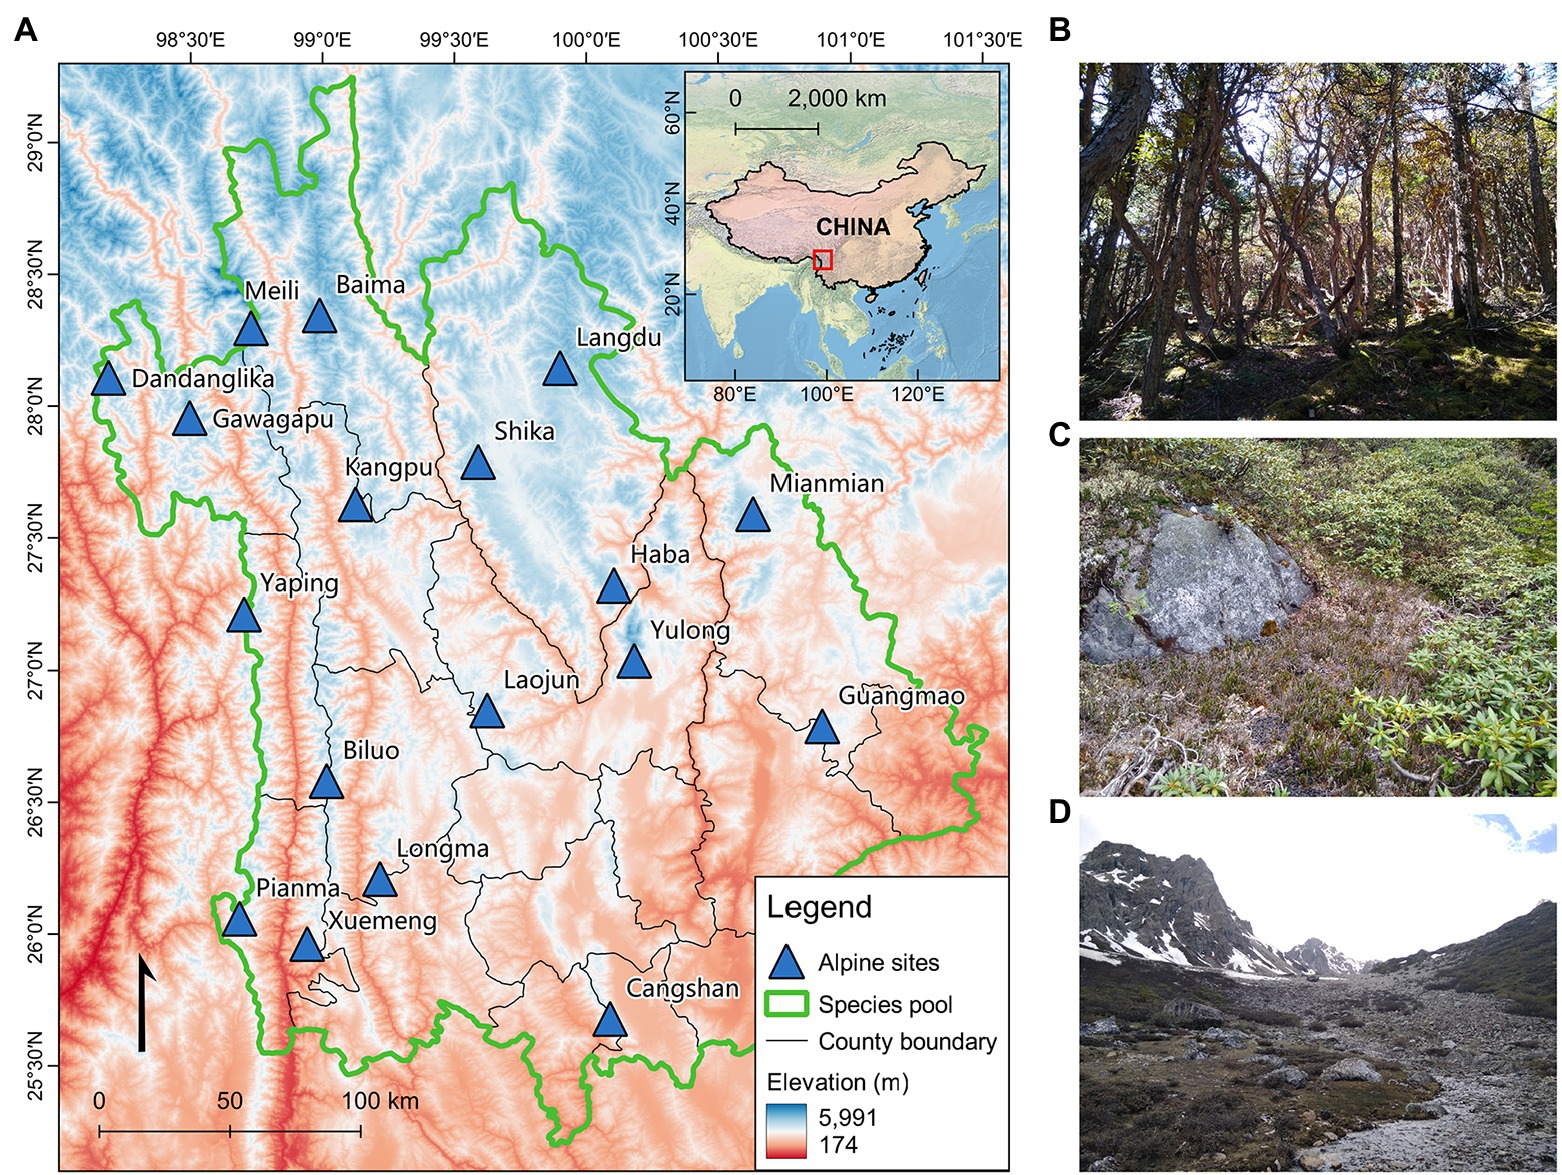
Figure 1. Map of the study area and photos showing typical habitat transitions. (A) Topographic map of the extent to which the regional species pool was compiled, including the 18 alpine sites surveyed. The inset map marks the boundary and extent of China, with the study region framed in a red box. The photos to the right show the typical habitat transition in the study sites from below to above the alpine tree line; (B) Dark coniferous forests at 4,000 m a.s.l., (C) dwarf shrubs at 4,200 m a.s.l., and (D) meadows and scree at 4,400 m a.s.l. (Photo taken at Baima Mountain in June 2017).
Small mammals were sampled from 2013 to 2018 using a standardized field method (see Song et al., 2020 for details). Briefly, three 200 m interval elevational transects (at approximately 200 m below the tree line, along the tree line, and approximately 200 m above the tree line) were established in each mountain, representing the environmental transition zones from montane to alpine habitats. Sherman traps (7.62 cm × 8.89 cm × 22.86 cm, HB Sherman Traps Inc., Tallahassee, FL, USA), museum snaps (10 cm × 6 cm), and buckets (Φ20 cm × 20 cm) were set along these transects to collect small mammal species. Beyond this elevational extent, activities of any known small mammal species in the study region significantly decline because of the low mean annual temperature (<0°C), sparse plant density, and permanent glaciers (Sherman et al., 2008). Thus, the elevation range covered in our study represents the most distinct habitat transition zone for most small mammal species before their upper distribution limits. In seven mountains, we could not set the transects beyond the tree line because their peaks merely transcended the tree line (<200 m), and the remaining elevations were inadequate for a full transect.
For each captured small mammal, measurements of body weight (BW), head-body length (HB), tail length (TL), hindfoot length (HF), and ear length (EL) were recorded in the field. At least one stuffed voucher and skull specimen were prepared from each site, representing each morphologically discriminable group. Liver and muscle tissues were collected from each specimen, dehydrated, and preserved in 2 ml vials (81–8,204, Biologix Inc., Shandong, China) with 99.7% ethanol for DNA extraction. All samples were identified by morphological comparison and DNA barcoding of the mitochondrial cytochrome b (CYTB) gene (Borisenko et al., 2008). All collections were deposited at the Kunming Institute of Zoology, Chinese Academy of Sciences.
2.2. Reginal species pool
The regional species pool has a considerable influence on the conclusion of assembly patterns and processes in the local community (Weiher and Keddy, 1995). Depending on different ecological processes, species from the regional pool can colonize, establish, or inhabit the focal (local) communities (Lessard et al., 2012). We derived the regional species pool of small mammals primarily from Wen et al. (2016). This dataset contains county-level species occurrence records covering our study sites. We extracted species information from the counties where the 18 studied sites were located to avoid eliminating influences of potential habitat filtering in alpine communities a priori (Lessard et al., 2012; Figure 1A), aiming to represent all species along the entire elevational gradient. The final species pool included four orders (Eulipotyphla, Lagomorpha, Rodentia, and Scandentia) after removing species that were unlikely to be captured by field sampling methods, such as marmots, flying squirrels, and hares. We carefully checked the species list and replaced debatable names with the most recent taxonomic evaluations to avoid problems related to outdated taxonomical records. New species records from the current study were noted (Song et al., 2021). Those occurrences that did not match any known species were assigned temporary taxonomic identifications. Species abundance was Hellinger-transformed to mitigate the effect of zero occupancy (Legendre and Gallagher, 2001).
2.3. Phylogenetic reconstruction
Total DNA was extracted from newly collected samples, and the CYTB gene was amplified and sequenced for phylogenetic reconstruction. The CYTB gene reliably reconstructs phylogenetic associations among mammal species (Tobe et al., 2010). It is frequently used in phylogenetic studies of small mammals (e.g., Koju et al., 2017; Bannikova et al., 2018; Liu et al., 2018). The total DNA was extracted from 1–2 individuals of morphologically distinct species from each site using the SQ Tissue DNA Kit (D6032, Omega Bio-tek Inc., Norcross, USA) following the manufacturer’s protocol. The CYTB gene was amplified and sequenced following Koju et al. (2017). The PCR primers for the genus Ochotona were L14724 and H15913 (Koju et al., 2017) and L14725_hsw1 (ATG ACA TGA AAA ATC ATC GTT GT) and H15915_hsw1 (TCY CCA TTT CTG GTT TAC AAG ACC) for other species. The sequenced CYTB products were assembled in Geneious R11.11 and aligned in MEGA X (Kumar et al., 2018) using MUSCLE (Edgar, 2004). The alignment was verified in BLAST (https://blast.ncbi.nlm.nih.gov/Blast.cgi) to handle sequencing errors and misidentifications. The alignment for further phylogenetic analysis comprised one complete CYTB sequence of each newly captured species and sequences downloaded from GenBank for species not captured during our field survey (for field numbers and GenBank accession numbers, see Supplementary Table S2). The phylogenetic tree was reconstructed in the IQ-TREE web server2 (Trifinopoulos et al., 2016) using maximum likelihood (ML) with 10,000 bootstrap replicates.
2.4. Traits used to quantify functional diversity
Traits were classified into morphology, resource acquisition, and habitat affinity combinations. Morphological characteristics, including body size and extremities (e.g., ears, limbs, and tail), are critical to cold adaption (Feist and White, 1989; Blackburn and Hawkins, 2004; Alhajeri et al., 2020), a prominent constraint in high elevations. The morphological traits, represented by BW, HB, TL, HF, and EL, were measured in the field as numerical variables and were represented by the mean values of recorded individuals for each species, with TL, HF, and EL first transformed as proportions of HB (Du et al., 2017). Resource acquisition traits included activity cycle, trophic level, diet breadth, and diet composition extracted from the COMBINE dataset (Soria et al., 2021). Habitat affinity traits, including habitat breadth, habitat occupations, fossoriality, and foraging stratum, were obtained from Ding et al. (2022). Habitat breadth was the number of available habitat types, while habitat occupation was the availability of a specific habitat type to a species. Fossoriality and foraging stratum represented the spatial separation in a given habitat, i.e., underground, above-ground, or arboreal. Among these traits, diet composition comprised three subdivisions (vertebrate, invertebrate, and plants), while habitat occupation comprised six subdivisions (forest, shrublands, grassland, wetlands, rocky areas, and artificial). Diet composition was estimated as the percentage proportion of different food types (Soria et al., 2021) and habitat occupation included binary levels of availability (available = 1 and unavailable = 0) of a particular habitat type for a species (Ding et al., 2022). Traits were classified into nominal, circular, or quantitative types, as implemented in the ‘funct.dist’ function of the ‘mFD’ R package (Magneville et al., 2021).
The traits were reorganized following Mouillot et al. (2021). Trait distances between species were estimated from Gower’s pairwise distance using the overall trait data and each trait combination (i.e., morphology, resource acquisition, and habitat affinity). While estimating the pairwise distances, the weight of each trait and subdivision was adjusted until the total weight was equaled to one, i.e., each trait was weighted as 1/n, and each subdivision within the traits was weighted as 1/(n*m), with n being the number of traits and m being the number of trait subdivisions (Jarzyna et al., 2021). Principal coordinates analysis (PCoA) was imposed on the pairwise distance matrices to identify orthogonal axes of trait dissimilarity. The Gower’s distance and PCoA were calculated with the functions ‘funct.dist’ and ‘quality.fspaces’ in the ‘mFD’ package (Magneville et al., 2021). The lowest mean absolute deviation (MAD) was used as a cutoff for retaining the PCoA axes as new trait variables (Magneville et al., 2021). The first four PCoA axes were retained for overall traits (MAD = 0.30), although the lowest MAD reached the first six axes (MAD = 0.23). This is because the number of traits should be strictly less than the number of species within the community (Villéger et al., 2008); in Yulong Mountain, only five species were detected in the 4,200 m a.s.l. transect. In the final analyses, 4, 3, 3, and 3 PCoA axes were retained to represent the overall, morphology, resource acquisition, and habitat affinity trait combinations, respectively.
2.5. Testing phylogenetic signals
We employed Blomberg’s K statistic (Blomberg et al., 2003) to test the phylogenetic signals of the traits’ PCoA axes. Blomberg’s K statistic assesses whether the trait variation conforms to the expected value when trait evolution along the phylogenetic structure follows a Brownian motion (Blomberg et al., 2003). Blomberg’s K was calculated using the function ‘multiphylosignal’ available in the ‘picante’ R package (Kembel et al., 2010). K < 1 indicates that the phylogenetic signal is weaker than the expectation of random evolution, whereas K > 1 indicates a strong phylogenetic signal or niche conservatism (Grigoropoulou et al., 2022). The K statistic calculation also returned a p-value based on the variance of phylogenetically independent contrasts relative to tip shuffling randomization (PIC.variance.p < 0.05 indicates that the K statistic product is not random).
2.6. Quantifying diversity indices
Diversity metrics were chosen based on their ecological relevance. Species richness (SR) was estimated as the number of species in a community. We estimated phylogenetic richness as Faith’s phylogenetic diversity (PD; Faith, 1992) and functional richness as the minimum convex hull volume of all species at a site (FRic; Cornwell et al., 2006). PD is calculated as the sum of the branch length of a phylogenetic tree and summarizes the evolutionary history of species within a focal community (Faith, 1992). FRic represented the amount of niche space occupied by an assemblage (Villéger et al., 2008). We quantified abundance-based phylogenetic and functional diversity indices based on pairwise species distances. For phylogenetic diversity, these indices included the mean pairwise distance (MPD) and the mean nearest taxon distance (MNTD) (Webb et al., 2002). For functional diversity, the functional mean pairwise distance (FMPD) and functional mean nearest neighbor distance (FNND) were adopted (Magneville et al., 2021). The MPD estimated the average phylogenetic relatedness distance between all species pairs in a community, while FMPD estimated the species functional similarity. The MNTD and FNND estimated the average distance between a species and its nearest neighbor within a community. The diversity metrics used in the present study provide comprehensive information regarding evolutionary history, niche space, species abundance, and the influence of trait space packing and phylogenetic depths (Tucker et al., 2017; Mammola et al., 2021; Montaño-Centellas et al., 2021). The observed PD, MPD, and MNTD were obtained with the ‘picante’ package. The FRic, FMPD, and FNND were computed for overall and classified trait combinations with the ‘alpha.fd.multidim’ functions available in the ‘mFD’ R package (Magneville et al., 2021). Correlations between the observed diversity indices were evaluated using Pearson’s correlation coefficient.
2.7. Testing hypothetical assembly processes
Null models were employed to determine the degree to which the observed diversity indices deviated from null-model communities (species in the local community randomly drawn from the regional species pool) to evaluate the assembly process. The null-model communities were reconstructed by randomizing the species pool matrix while maintaining the species richness and species occurrence frequency of each transect using the “independent swap” algorithm with 999 randomizations for p-value estimations (Gotelli, 2000). The null models for phylogenetic diversity (PD, MPD, and MNTD) were estimated with the ‘picante’ package, while the functional diversity (FRic, FMPD, and FNND) null models were estimated with the ‘mFD’ package following the procedure described by Swenson (2014). The null-model construction helped determine the non-randomness of the assembly process based on the standardized effect size (SES) (Gotelli and Rohde, 2002), calculated as (observed-mean(null))/SD(null). SES > 0 indicates overdispersion (driven mainly by resource competition), while SES < 0 indicates clustering (caused primarily by habitat constraint). Bivariate correlations between the SESs measuring similar ecological aspects (PD vs. FRic, MPD vs. FMPD, MNTD vs. FNND) were evaluated with Pearson’s correlation coefficient if the two-sample Kolmogorov–Smirnov test provided evidence for a similar distribution. Otherwise, Spearman’s rank correlation coefficient was used.
Finally, to test whether a general community assembly process dominated the 18 alpine gradients, we fitted linear mixed-effect models with the ‘lme4’ R package using the diversity indices (SR, PD, MPD, MNTD, FRic, FMPD, FNND, and their SESs, if available) as the dependent variable, elevational position relative to the tree line as a fixed factor, and study site as a random factor. SESs generally decrease as the effect dominating the assembly process changes gradually from resource competition to habitat constraint (Mason et al., 2007; Wang et al., 2022). Therefore, for the SES patterns, a positive slope indicated a tendency for overdispersion, and a negative slope indicated a clustering trend (Montaño-Centellas et al., 2019). Evidence (p-value) for the model products (intercept and slope) was obtained using the likelihood ratio test (Bolker et al., 2009). All statistical analyses and result illustrations were processed in the R 4.1.0 environment (R Core Team, 2021).
3. Results
A total of 5,744 individuals belonging to 41 known and three undescribed species were recorded from the field (Supplementary Table S3). Another 50 species from the study region were recorded in previous literature but not captured in the field. Therefore, the regional species pool comprised 94 species. All species included in the phylogenetic tree were assigned names based on the morphological identification and BLAST search results (Supplementary Figure S1).
Species richness decreased from low to high elevations around the tree line in all 18 sites (Figure 2). The phylogenetic (PD) and functional (FRic) richness were positively correlated with the species richness (Figure 2; Supplementary Table S4). In contrast, distance-based indices (MPD, MNTD, FMPD, and FNND) were not correlated with species richness (Supplementary Table S4).
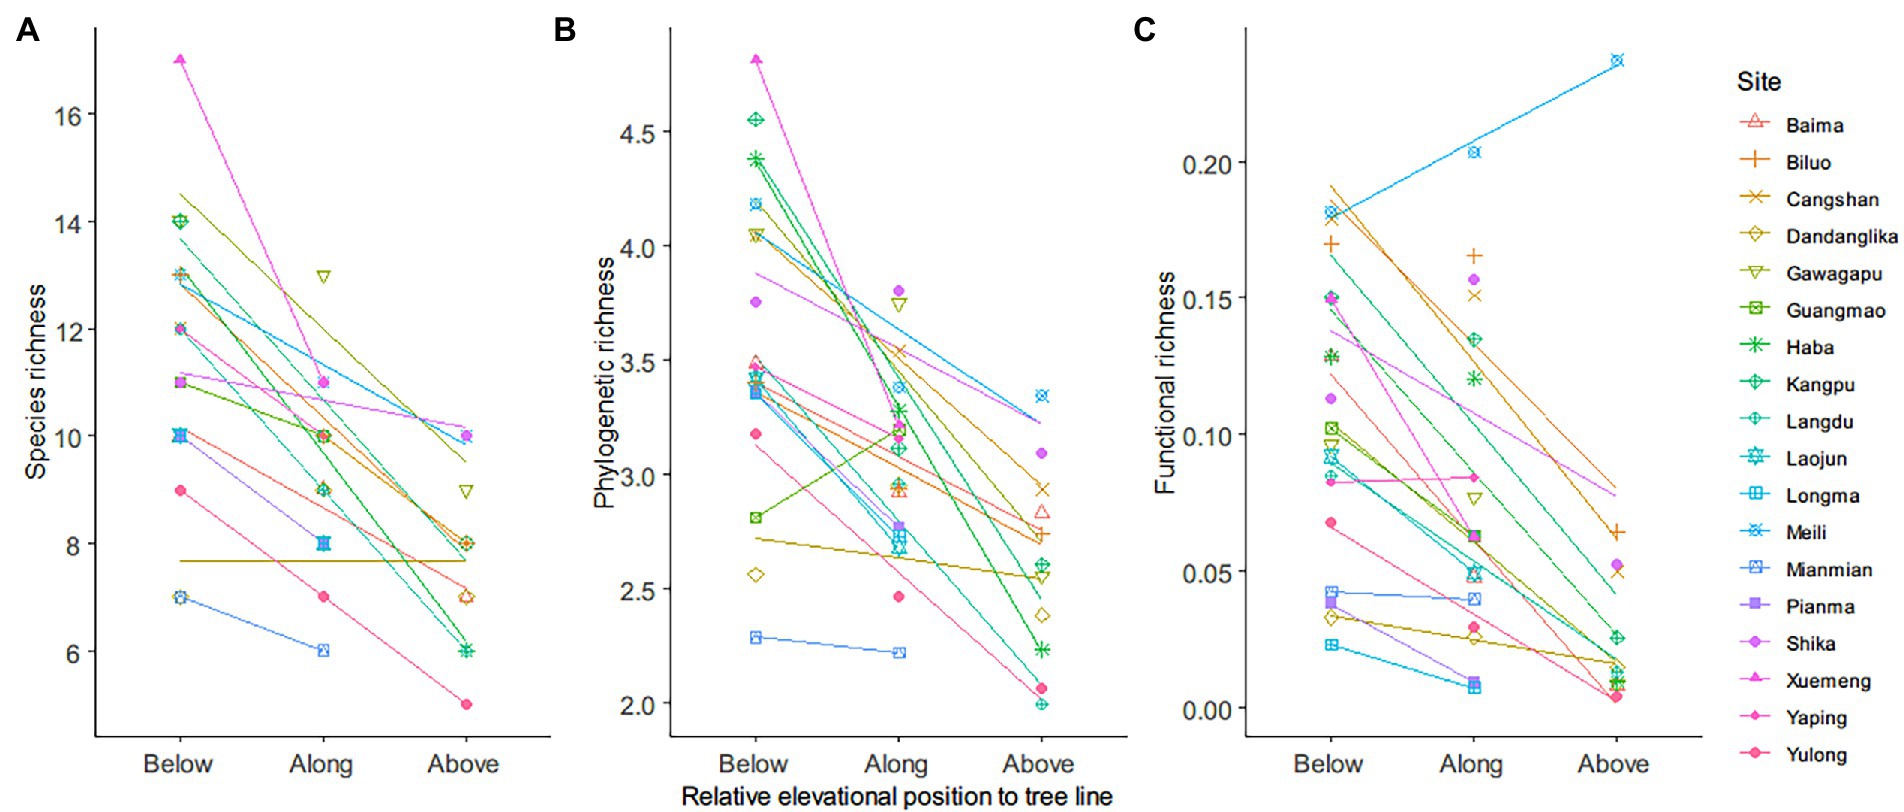
Figure 2. Associations between observed richness metrics and elevation position. (A) Species richness was the number of species in a community. (B) Phylogenetic richness was measured as the sum of the branch length of a phylogenetic tree. (C) Functional richness was measured as the minimum convex hull volume. The point symbols with different shapes and colors mark the observed richness values in different sites (18 sites). The solid lines show the linear regression relationships between the richness values and elevation position.
For different trait combinations, the evidence for Blomberg’s K statistic products was robust (PIC.variance.p < 0.05) for all PCoA axes (Supplementary Table S5). The first two PCoA axes (PC1 and PC2) derived from the overall traits had strong phylogenetic signals (K > 2). At the same time, phylogenetic signals of the third and fourth axes (PC3 and PC4) were weak (K < 1), indicating that trait evolution represented by these axes did not follow a pattern congruent with phylogenetic conservatism. Phylogenetic signals of PC3 for morphological traits and PC1 and PC2 for resource acquisition traits were strong (K > 1). In contrast, the rest of the PCoA axes (PC1 and PC2 for morphological traits and PC3 for resources acquisition traits) had weak phylogenetic signals (K < 1). Notably, phylogenetic signals of all 3 PCoA axes of the habitat affinity traits were weak (K < 1), indicating that the assembly process determined by the habitat affinity niche might not be explained by phylogenetic relatedness.
The SESs derived from the phylogeny, overall traits, and each trait combination were plotted against the elevational position (Figures 3, 4) to illustrate the assembly process inferred from the regional species pool and the tendency of overdispersion and clustering toward higher elevation. The SESs of phylogenetic diversity metrics had a greater propensity for overdispersion (SESs > 0) compared to the null expectations, unlike the functional diversity SESs for overall traits, which did not show a clear pattern, i.e., comparable numbers of positive and negative SES values (Supplementary Table S6). The SESs of the morphological and habitat affinity traits had more negative than positive values. In contrast, the resource acquisition traits had more positive SES values. The evidence for overdispersion or clustering was weak, with only 1–3 SESs having p values > 0.975 or <0.025 in each diversity metric. Most of the SESs measuring similar ecological aspects between phylogenetic and functional dimensions (SES.PD vs. SES.FRic, SES.MPD vs. SES.FMPD, SES.MNTD vs. SES.FNND) were not correlated, with the highest correlation coefficient (r = 0.437) supported by strong evidence (p = 0.002) recorded between SES.MPD and SES.FMPD of morphological trait combination (Supplementary Table S7).
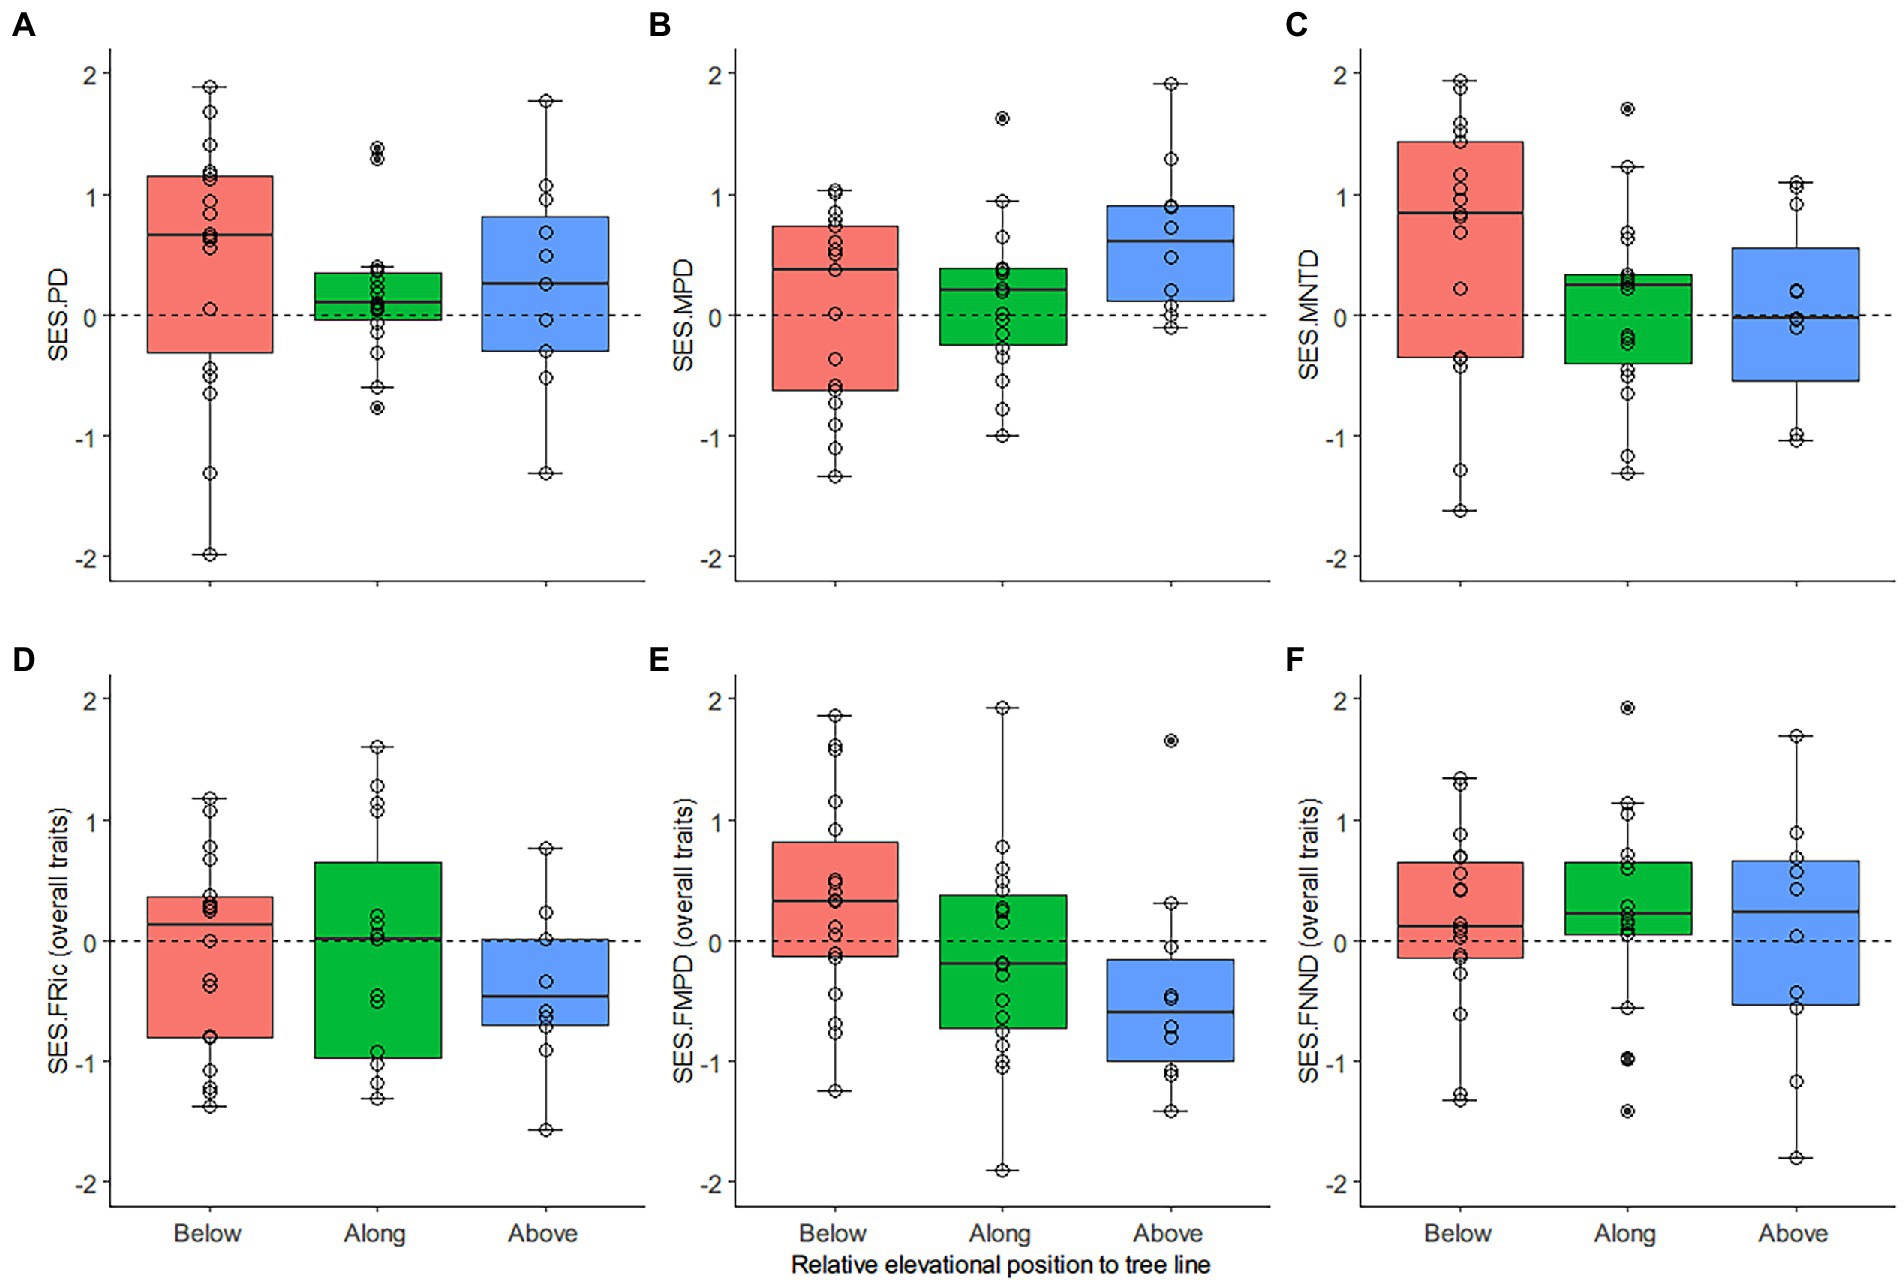
Figure 3. Distribution patterns of the standardized effect size (SES) of diversity metrics derived from phylogeny and overall traits. (A) phylogenetic richness (Faith’s index, PD), (B) average phylogenetic differences between all species pairs—mean pairwise distance (MPD), (C) average phylogenetic differences between closely related species pairs—mean nearest taxon distance (MNTD) and (D) functional richness (FRic), measured as the minimum convex hull volume, (E) average trait difference between all species pairs—functional mean pairwise distance (FMPD), (F) average trait difference between similar species pairs—functional mean nearest neighbor distance (FNND). The X-axes mark transects from low (below the tree line) to high (above the tree line) elevation. The circles mark the SES values of the transects. The boxplot summarizes values for each transect position: the horizontal solid line inside the box indicates the median, the box height represents values ranging from 25% to 75% percentile (the middle 50% of scores), the upper and lower whiskers represent scores outside the middle 50%, and the dots mark the outliers.
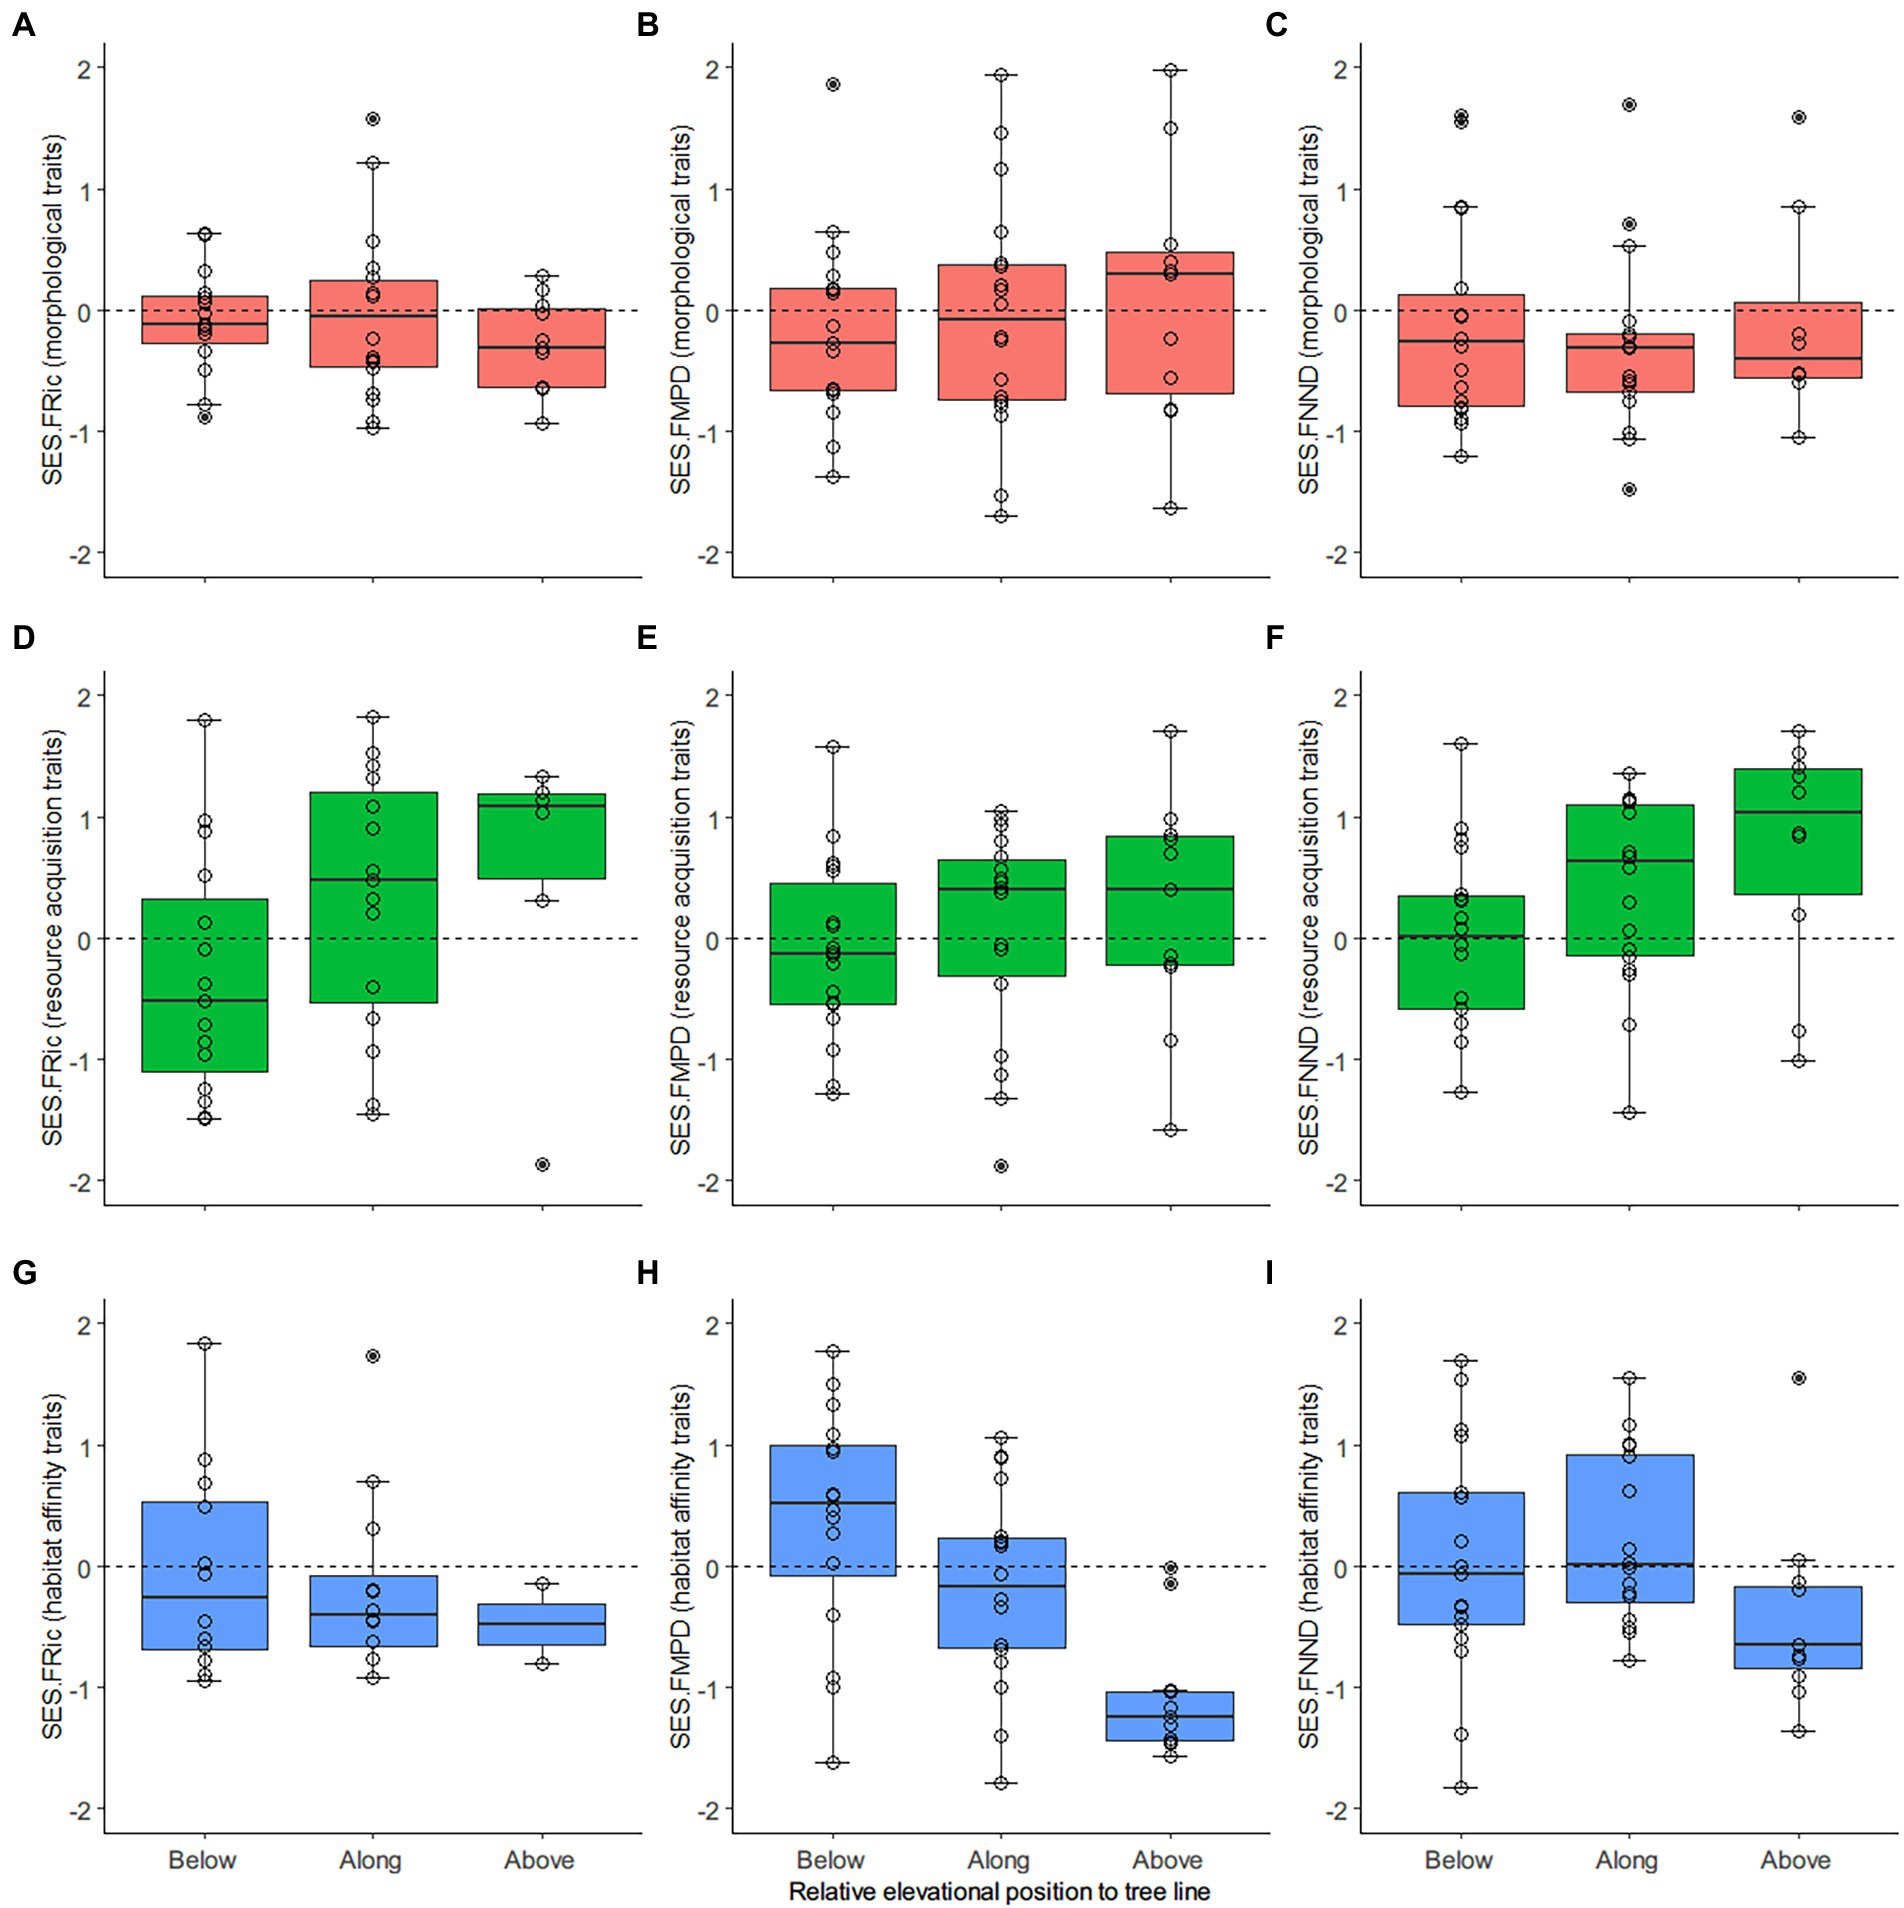
Figure 4. Distribution of the standardized effect size (SES) of the functional diversity metrics derived from different trait combinations. (A,D,G) Functional richness (FRic), measured as the minimum convex hull volume; (B,E,H) Average trait difference of all species pairs, functional mean pairwise distance (FMPD); (C,F,I) Average trait difference of every two most similar species, functional mean nearest neighbor distance (FNND). From top to bottom are the SESs derived from morphological (A-C), resource acquisition (D-F), and habitat affinity (G-I) traits. The X-axes mark transects from low (below the tree line) to high (above the tree line) elevation. The circles mark the SES values for the transects. In the boxplot, the horizontal solid line inside the box indicates the median, the box height represents values ranging from 25% to 75% percentile (middle 50% of scores), the upper and lower whiskers represent scores outside the middle 50%, and the dots mark the outliers.
Richness-controlled diversity patterns of phylogenetic relatedness and overall traits did not have a clear association tendency with increasing elevation, except SES.FMPD declined below to above the tree line (Figure 3). Similarly, the SESs derived from morphological traits had near horizontal slopes as elevation increased. In contrast, the SESs derived from resource acquisition traits tended to be more overdispersed as elevation increased, while the SESs derived from habitat affinity traits had opposite patterns (Figure 4).
The linear mixed-effect models had robust evidence for a negative slope of SR against increasing elevations (p < 0.01) (Table 1). For the phylogenetic dimension, SES.PD and SES.MNTD decreased. In contrast, SES.MPD increased toward a higher elevation, with strong evidence only found in the negative slopes of SES.MNTD (p < 0.05). For overall traits, SES.FRic, SES.FMPD, and SES.FNND did not have a general trend. Nonetheless, there was strong evidence (p < 0.05) for decreasing SES.FMPD as elevation increased. The slope coefficients for transects along the tree line for morphological traits were positive for SES.FRic and negative for SES.FMPD and SES.FNND. At the same time, the slope coefficients for transects beyond the tree line were all positive but generally weak (p > 0.05). The SES.FRic, SES.FMPD, and SES.FNND of resource acquisition traits tended to be more overdispersed (positive slopes) as elevation increased and biomass reduced (vegetation cover changes from dark coniferous forests to treeless screes). In contrast, SES.FRic, SES.FMPD, and SES.FNND of habitat affinity traits had negative slopes as elevation increased, although only SES.FMPD had strong evidence (p < 0.05), indicating that functional patterns defined by the habitat affinity niche tended to be more clustered.
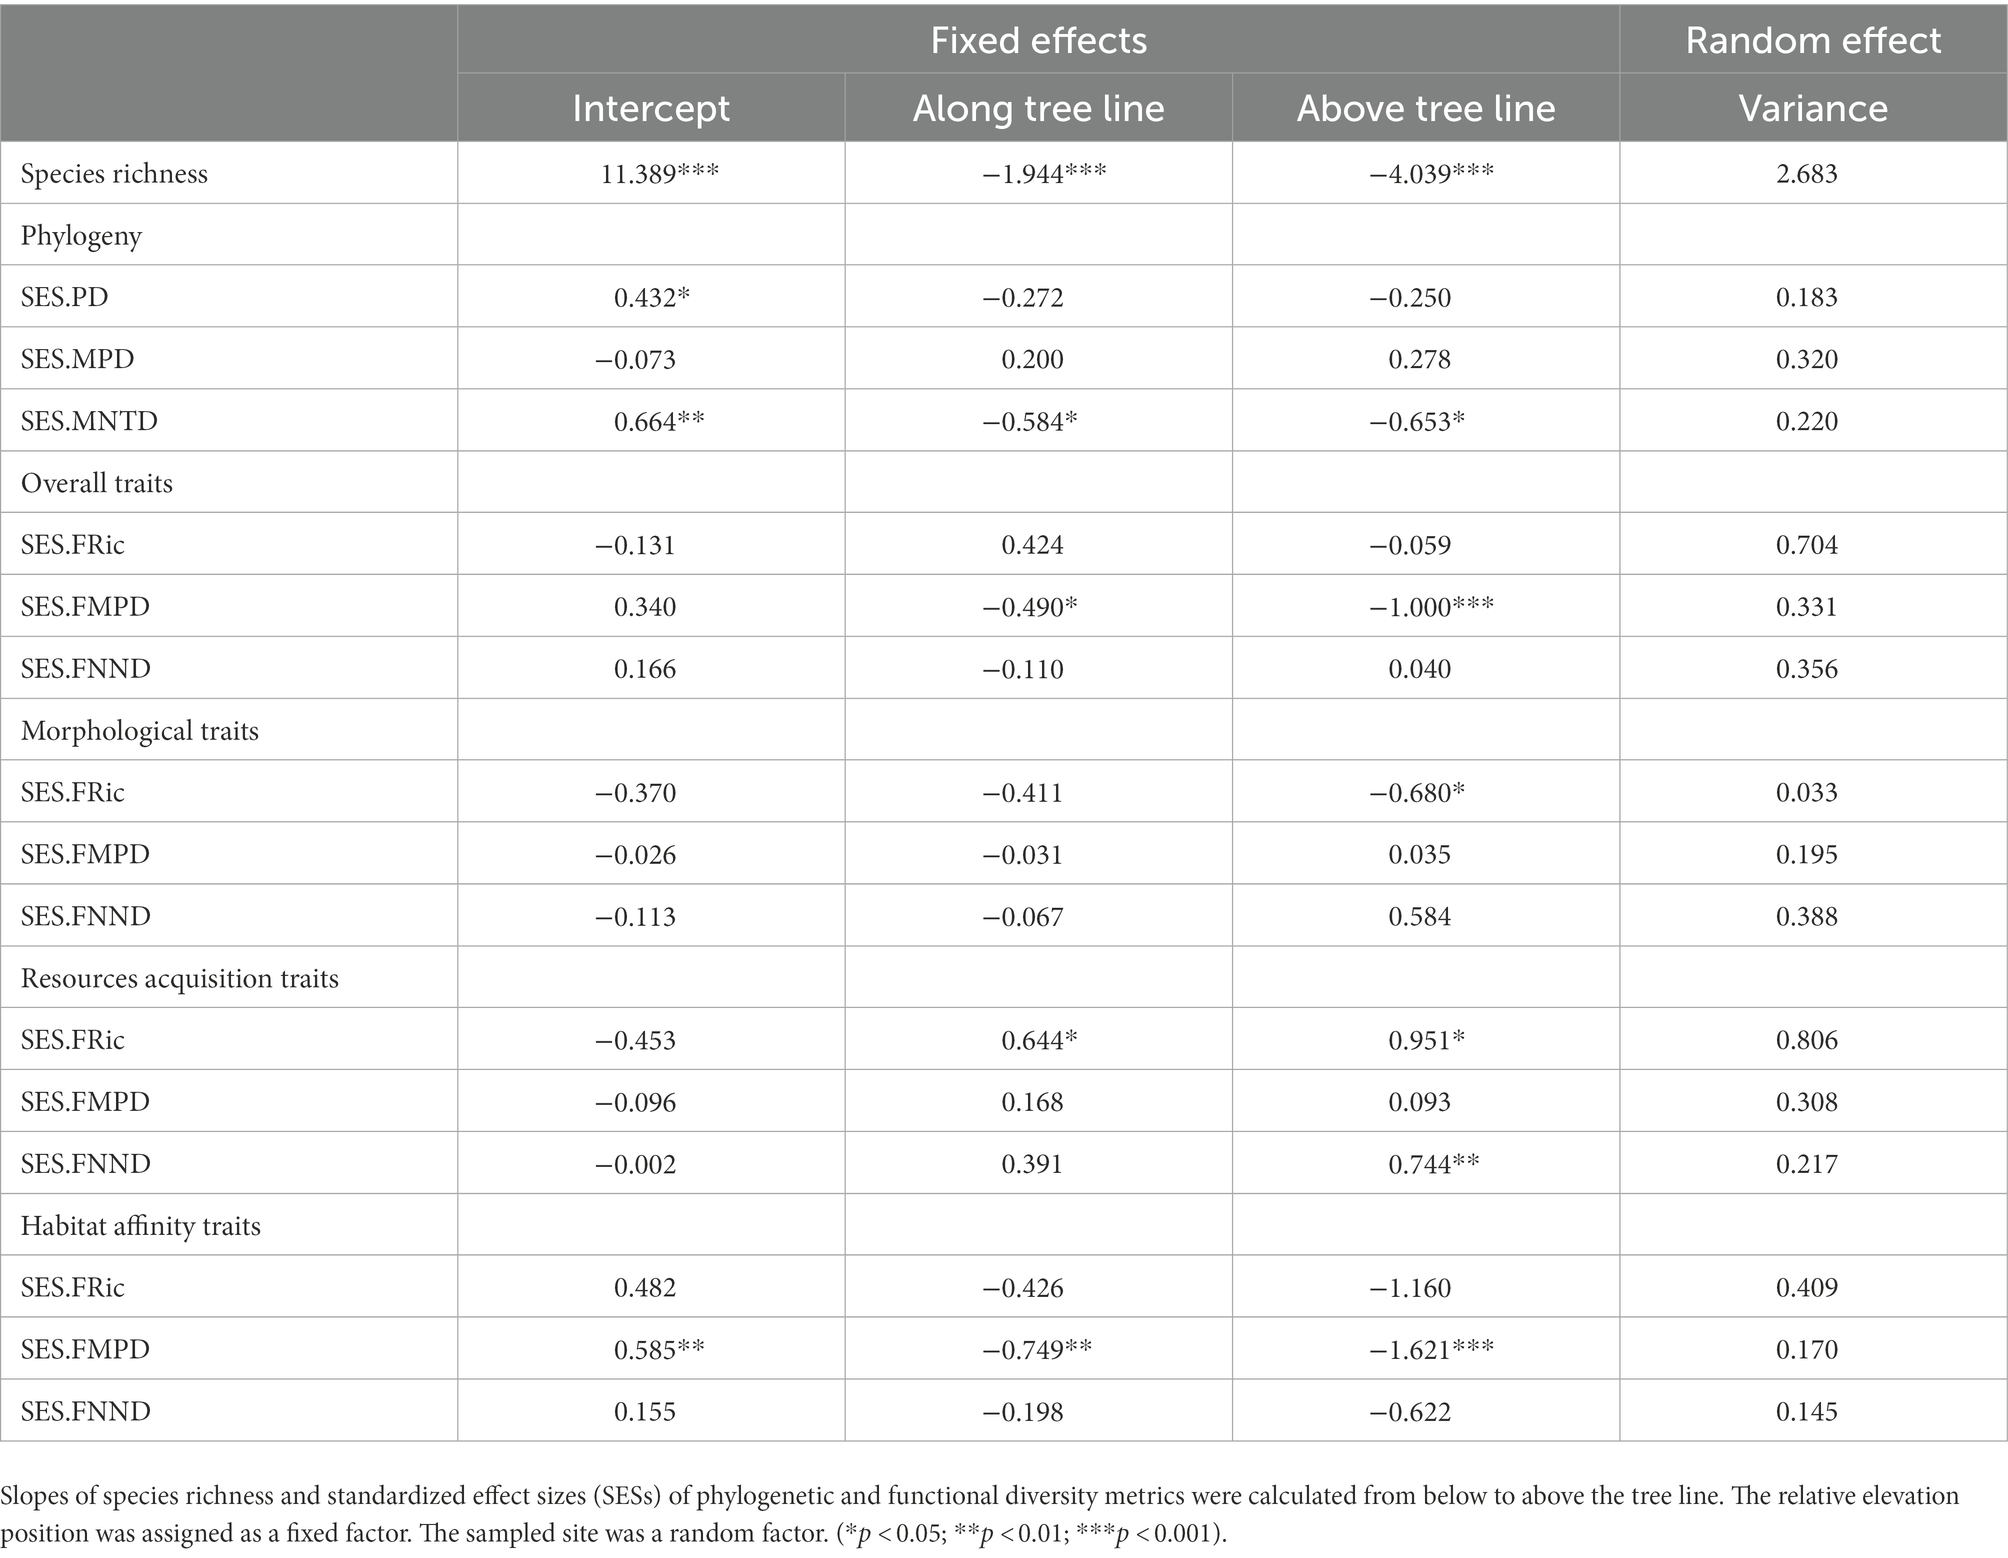
Table 1. Results of linear mixed-effect models.
4. Discussion
Among terrestrial ecosystems, alpine areas represent distinctive biogeographic units (Testolin et al., 2020). Species inhabiting alpine areas usually exhibit high endemicity (Wen et al., 2018; Chen et al., 2020) and vulnerability (Franzén and Molander, 2012), making many of them conservational priorities. Although the diversity patterns and assembly processes along elevational gradients have frequently been studied, our knowledge of alpine communities remains limited. Our results showed that the decline in species richness in alpine areas as elevation increases does not necessarily correspond with similar decreasing patterns of phylogenetic or functional diversity. We found no evidence of a general deterministic process with phylogenetic or overall trait diversity. Nonetheless, the species richness-controlled functional diversity metrics had contrasting patterns between different niche components, suggesting that multiple processes acted simultaneously on the alpine small mammal assemblages.
4.1. Using phylogeny and overall traits to infer the assembly process
We found that species richness declined with elevation at the tree line (i.e., consistently high in transects below the tree line and low in transects above the tree line in all 18 sites). This pattern concurs with previous studies, in which it was observed that vertebrate species richness predominantly declines in high elevation when various patterns occur in low to mid-elevation (McCain and Grytnes, 2010). Species loss in high elevations can be explained by multiple drivers (e.g., climate stress, spatial effects, and evolutionary history) (McCain and Grytnes, 2010). In high-elevation areas, the reduction of species richness may be attributed to the influence of the distribution edges of species under the “cold range limit” theory (Louthan et al., 2015). However, this edge effect varies between species (Feist and White, 1989) and may be mediated by biotic interactions (Burner et al., 2020; Sirén et al., 2021). Productivity decline has been considered another vital environmental variable that could decrease species richness in high elevations (McCain and Grytnes, 2010) because primary productivity directly or indirectly determines the availability of food resources for mammals (Gebert et al., 2019). Alternatively, the spatial effect hypothesis asserts that higher species richness should dominate in larger areas or geometric centers (Lomolino, 2001; Colwell et al., 2004). Moreover, reduced species richness in high elevation can be explained by historical events since the species distributed in such habitats may have fewer speciation and colonization opportunities and a higher extinction risk compared to those living in low elevation (Brown, 2001; Wiens and Donoghue, 2004). In this study, the elevational range were narrow (≤400 m). Thus, climatic and historical events, which have a substantial effect on a large spatial scale (Peters et al., 2016; Onditi et al., 2022), may not be the predominant driver of the species richness pattern. Given that the total height of each mountain varied vastly (3,600 to 6,740 m a.s.l.), the corresponding transects were set in different positions between mountains, implying that area and geometric property are unlikely to be the main drivers of the observed patterns of richness loss. Therefore, the decline in species richness can mainly be attributed to decreasing productivity from below to beyond the tree line (Ramírez-Bautista and Williams, 2019; De Souza Ferreira Neto et al., 2022).
The observed phylogenetic (PD) and functional (FRic) richness were positively correlated with decreasing species richness, which is not surprising because the richness indices are intrinsically correlated (Walker et al., 2008; Ochoa-Ochoa et al., 2020; Smiley et al., 2020). However, FRic, which is a functional richness index rooted in the multidimensional space (Cornwell et al., 2006), was weakly correlated with SR compared with PD, which may be because the niche space occupied by a community should not have an a priori relationship with species richness (Mayfield et al., 2010). Functional richness could remain unchanged as species richness increases when the additional species have redundant traits, thus not expanding the total niche space of the focal community (Mason et al., 2005; Mouchet et al., 2010). In our study, such an association is illustrated by the negative correlation between FRic and species richness observed in the Yaping and Meili Mountains. This further highlights the critical contribution of species with unique traits which could expand the niche space despite the species richness being low (Legras et al., 2018; Montaño-Centellas et al., 2019). The correlation coefficients between species richness and abundance-weighted indices were weakly positive (MPD and FMPD) or negative (MNTD and FNND). This association supports the idea that a community with low species richness can still have high phylogenetic or functional diversities because of distantly evolutionarily related or functionally dissimilar species (Walker et al., 2008). Overall, the observed correlations between species richness, phylogenetic, and functional metrics emphasize the importance of using multidimensional approaches to understand diversity patterns and the ecological information captured by each index.
Using a phylogenetic diversity pattern to infer the assembly process requires conserved trait evolution across the phylogeny, i.e., a robust phylogenetic signal (Cavender-Bares et al., 2004; Mouquet et al., 2012; Grigoropoulou et al., 2022). However, robust phylogenetic signals were found only in the first two PCoA axes when all traits were included. None of the trait combinations (different niche components) portrayed strong phylogenetic signals on all PCoA axes. Notably, all the PCoA axes of habitat affinity traits had weak phylogenetic signals. Thus, adding these traits to the overall combination might diminish the correlation between phylogenetic and functional patterns (Lopez et al., 2016). The phylogenetic signal analyses suggest that phylogenetic relatedness might not adequately represent trait similarity. Thus, the phylogenetic pattern should not be considered a surrogate for the functional pattern in the present study. Indeed, the correlations between phylogenetic and functional SESs measuring similar ecological aspects were weak or nonexistent. These findings indicate that, singularly, neither phylogenetic nor functional indices suffice to capture the processes shaping community structure. It is necessary to include both dimensions in complementary analyses (Cadotte et al., 2017; Ding et al., 2021).
The SESs of phylogenetic and functional metrics did not have general positive or negative associations along elevation gradients, and very few p values fell in the non-random range (>0.975 or <0.025). Thus, the phylogenetic or functional patterns of small mammal communities in the studied alpine area did not strongly deviate from null expectations. These results indicate that the deterministic process per se does not adequately explain phylogenetic or trait diversity patterns in the present study. So far, the assembly process in high-elevation habitats seems challenging to predict. Cisneros et al. (2014) found greater phylogenetic and functional dispersion of bat communities in high elevations, suggesting that interspecific competition (resulting in competitive exclusion) increased as productivity decreased. In contrast, Zhang et al. (2020) reported trait convergence in clustered highland bird assemblages, which was highly correlated with reduced vegetation productivity and tree height, reinforcing the role of habitat filtering. Recent studies have continued to document increasing overdispersion of vertebrate assemblages in high-elevation areas despite overall clustered patterns (Ding et al., 2021; Jarzyna et al., 2021; Montaño-Centellas et al., 2021), emphasizing the potential role of competition in resource-scarce habitats. These studies also highlight the uncertainty of the assembly process under multiple stressors and that the overall pattern could be masked by various niche components (Spasojevic and Suding, 2012).
4.2. Insights into the complexity of the assembly process from niche decomposition
If the observed diversity pattern deviates strongly from the random distribution, the influence of different deterministic processes can be easily distinguished. For example, high levels of phylogenetic or functional clustering in high elevations can be explained by the dominance of habitat filtering (Graham et al., 2009; Takahashi and Tanaka, 2016; Qian et al., 2021). However, one process may be variably active throughout an environmental gradient (Mason et al., 2007), and one community can be simultaneously affected by different mechanisms (Helmus et al., 2007). Distinguishing deterministic processes from stochastic ones remains fuzzy (Mouchet et al., 2010). Therefore, the conclusion should consider the roles of different processes (Münkemüller et al., 2020). When phylogeny and overall traits do not provide clear evidence, analyzing diversity patterns separately for different niche components can assess each process’s influence (Spasojevic and Suding, 2012; Lessard et al., 2016; Lopez et al., 2016; Kohli et al., 2021).
Contrary to our expectation, functional SESs derived from morphological traits did not decrease as elevation increased. Instead, no general pattern was found. Thus, the hypothesis that temperature stress increases habitat filtering in the alpine area was not supported. This can be explained by the narrow range of the studied elevation gradients and the comprehensive ecological relevance of the morphological traits. First, our sampled elevational range was narrow, with only a maximum 400-m interval between the highest and the lowest transect within each site. While this elevational range represents a unique and vital ecotone in mountain systems (Körner, 2013; Testolin et al., 2020), it is a single unit of the combined elevational gradient (McCain and Grytnes, 2010; Kohli et al., 2021). Under such conditions, temperature variation might not be strong enough to cause apparent morphological selection compared to other studies (e.g., Lessard et al., 2016). Another plausible explanation for these results is that a combination of processes influences morphological traits. Variations in morphological traits among animals have been mainly attributed to temperature; animals are hypothesized to have larger body sizes and smaller extremities in colder environments (Feist and White, 1989). Thus, body size and extremity length have frequently been used to examine the influence of temperature in niche-based processes, with low temperatures noted to act as an environmental filter (Dreiss et al., 2015; Lessard et al., 2016; Du et al., 2017). For example, communities in colder habitats often have a narrower breadth of body size niche (Read et al., 2018).
Nevertheless, associations between temperatures and morphological traits could vary between taxa and spatial scales. For example, Gohli and Voje (2016) found that associations between body size and temperature were either positive, negative, or uncorrelated across the 22 studied families. They also found limited support for the predicted association between temperature and the extremities. Similarly, Du et al. (2017) found that temperature was not always the dominant driver in structuring functional dispersion patterns of body size and tail length along elevational gradients. These observations may be explained by the involvement of morphological traits in other ecological properties (Gohli and Voje, 2016). For example, mammalian body size may be mainly influenced by productivity (Aava, 2001; Alhajeri and Steppan, 2016) and their ability to colonize different habitats (Whitmee and Orme, 2013). In contrast, foot length and tail length may be mainly influenced by vegetation cover (Alroy, 2019; Alhajeri et al., 2020). Our results are congruent with these previous studies, further supporting the idea that the assembly process explained by morphological traits cannot be generally attributed to either resource competition or habitat constraints in the alpine area.
The mixed-effect models showed that SESs of resource acquisition traits had positive slopes and habitat affinity traits had negative slopes toward higher elevations, with strong evidence for nearly half of the slopes. Thus, the expectations for these two niche components were met. These results indicate that multiple stressor variables simultaneously increase resource competition and habitat constraints in the alpine area, with low resource availability increasing competition and habitat simplification increasing habitat constraints. These conclusions are also partly supported by the higher number of positive values in resource acquisition SESs and the negative values in habitat affinity SESs. The alpine tree line marks the most distinct biome boundary in mountain systems. The dominance of bare or scarcely vegetated areas beyond the tree line reflects a global system characterized by low-productive habitats (Körner, 2013; Testolin et al., 2020), representing our high-elevation transects (Sherman et al., 2008). In our study region, species recorded in the highest transects had considerably diverse feeding guilds, e.g., shrews (nocturnal, carnivorous), voles (nocturnal, herbivorous), and pikas (diurnal, herbivorous). This resulted in an increasing tendency for overdispersion in the resource acquisition niche, which may be an adaptation to overcome the sharp vegetational transitions.
On the other hand, habitat types are reduced in the alpine area due to the absence of trees. Under these conditions, species unable to inhabit grassland or scree habitats, e.g., squirrels, white-bellied rats (arboreal or scansorial) (Wells et al., 2004; Alroy, 2019), and the genera Anourosorex, Parascaptor, and Scaptonyx (high affinity to fallen trees and thick humus) are usually excluded. These species were relatively abundant in the transects below the tree line. As a result, functional clustering increased with elevation when diversity patterns were measured using the habitat affinity niche. Overall, the observed resource competition and habitat constraints’ impacts on the assembly process based on different niche components suggest that limiting similarity and habitat filtering simultaneously affect small mammal communities in the alpine area. The support from functional diversity metrics based on trait space (FRic) and pairwise species distance (FMPD and FNND) bolstered these results. However, given that the increase or decrease trends were not consistent throughout the study sites, the respective intensity of opposite deterministic processes likely varied in different alpine habitats.
5. Conclusion
Our simultaneous analysis of phylogenetic and functional diversity and the decomposition of niche components suggest highly diverse and complex processes driving alpine small mammal assembly. We found inconsistent increasing or decreasing tendencies between alpine sites as elevation increased, suggesting that there were no unified assembly patterns (Montaño-Centellas et al., 2019). Despite such variations, we found that the resource competition niche generally increased while the habitat affinity niche decreased toward higher elevations. These results show that small mammal communities in alpine habitats are influenced by opposite niche-based processes, enabling a better understanding of distinguishing multiple deterministic drivers from stochastic ones (Helmus et al., 2007; Spasojevic et al., 2014).
One of the interesting findings is that the absence of trees beyond the alpine tree line introduces two opposite filters for small mammal species. First, species that rely on trees are excluded because of the unavailability of a suitable spatial stratum (Zhang et al., 2020). Second, when productivity is low because forest habitat transitions into scarcely vegetated habitats, species may specialize in feeding strategies to avoid competition for resources (Costa-Pereira et al., 2019). Future studies should consider multiple facets of an individual factor when disentangling the drivers of diversity patterns. We found no evidence to support an association between temperature stress and morphological traits; this is inconsistent with previous findings (Lessard et al., 2016; Read et al., 2018). A better understanding of the association between temperature stress and morphological traits may require sampling a broader geographical or elevational gradient. Moreover, as we found discrepant patterns when relating different niche components to individual processes, our results highlight the importance of niche decomposition. Thus, taking relevant traits into account when studying environmental gradients may help to distinguish the critical constraint factor, such as water utility traits in aridity gradients (Rymer et al., 2016; Kohli et al., 2021).
Data availability statement
The original contributions presented in the study are included in the article/Supplementary material, further inquiries can be directed to the corresponding author.
Ethics statement
The animal study was reviewed and approved by Kunming Institute of Zoology, Chinese Academy of Sciences (approval ID: SMKX-2 012 023 & SMKX-20 161 115-01).
Author contributions
W-YS, KO, and X-LJ conceived and designed the study. W-YS, Z-ZC, and QL performed the fieldwork. W-YS, Z-ZC, S-WH, KO, and QL carried out species identification and conducted genetic lab work. W-YS, KO, S-WH, and X-YL conducted the analyses and wrote the manuscript. All authors contributed to the article and approved the submitted version.
Funding
This work was supported by the Second Tibetan Plateau Scientific Expedition and Research Program (STEP, 2019QZKK0501), the National Key Research and Development Program of China (2017YFC0505202), the National Natural Science Foundation of China (32260277), and the Open Project from the State Key Laboratory of Genetic Resources and Evolution, Kunming Institute of Zoology, Chinese Academy of Sciences (GREKF22-03).
Acknowledgments
We thank the Yunnan Provincial Forestry and Grassland Bureau for permission for the field investigation. We also thank Pu Shidong, You Baoquan, Peng Dazhou, and Jin Yuqiu, who participated in the field.
Conflict of interest
The authors declare that the research was conducted in the absence of any commercial or financial relationships that could be construed as a potential conflict of interest.
Publisher’s note
All claims expressed in this article are solely those of the authors and do not necessarily represent those of their affiliated organizations, or those of the publisher, the editors and the reviewers. Any product that may be evaluated in this article, or claim that may be made by its manufacturer, is not guaranteed or endorsed by the publisher.
Supplementary material
The Supplementary material for this article can be found online at: https://www.frontiersin.org/articles/10.3389/fevo.2022.999573/full#supplementary-material
Footnotes
References
Aava, B. (2001). Primary productivity can affect mammalian body size frequency distributions. Oikos 93, 205–212. doi: 10.1034/j.1600-0706.2001.930204.x
Alhajeri, B. H., Fourcade, Y., Upham, N. S., and Alhaddad, H. (2020). A global test of Allen’s rule in rodents. Glob. Ecol. Biogeogr. 29, 2248–2260. doi: 10.1111/geb.13198
Alhajeri, B. H., and Steppan, S. J. (2016). Association between climate and body size in rodents: a phylogenetic test of Bergmann’s rule. Mamm. Biol. 81, 219–225. doi: 10.1016/j.mambio.2015.12.001
Alroy, J. (2019). Small mammals have big tails in the tropics. Glob. Ecol. Biogeogr. 28, 1042–1050. doi: 10.1111/geb.12912
Bannikova, A. A., Chernetskaya, D., Raspopova, A., Alexandrov, D., Fang, Y., Dokuchaev, N., et al. (2018). Evolutionary history of the genus Sorex (Soricidae, Eulipotyphla) as inferred from multigene data. Zool. Scr. 47, 518–538. doi: 10.1111/zsc.12302
Blackburn, T. M., and Hawkins, B. A. (2004). Bergmann’s rule and the mammal fauna of northern North America. Ecography 27, 715–724. doi: 10.1111/j.0906-7590.2004.03999.x
Blomberg, S. P., Garland, T. Jr., and Ives, A. R. (2003). Testing for phylogenetic signal in comparative data: behavioral traits are more labile. Evolution 57, 717–745. doi: 10.1111/j.0014-3820.2003.tb00285.x
Bolker, B. M., Brooks, M. E., Clark, C. J., Geange, S. W., Poulsen, J. R., Stevens, M. H. H., et al. (2009). Generalized linear mixed models: a practical guide for ecology and evolution. Trends Ecol. Evol. 24, 127–135. doi: 10.1016/j.tree.2008.10.008
Borisenko, A. V., Lim, B. K., Ivanova, N. V., Hanner, R. H., and Hebert, P. D. N. (2008). DNA barcoding in surveys of small mammal communities: a field study in Suriname. Mol. Ecol. Resour. 8, 471–479. doi: 10.1111/j.1471-8286.2007.01998.x
Brown, J. H. (2001). Mammals on mountainsides: elevational patterns of diversity. Glob. Ecol. Biogeogr. 10, 101–109. doi: 10.1046/j.1466-822x.2001.00228.x
Burner, R. C., Boyce, A. J., Bernasconi, D., Styring, A. R., Shakya, S. B., Boer, C., et al. (2020). Biotic interactions help explain variation in elevational range limits of birds among Bornean mountains. J. Biogeogr. 47, 760–771. doi: 10.1111/jbi.13784
Cadotte, M. W., Carboni, M., Si, X., and Tatsumi, S. (2019). Do traits and phylogeny support congruent community diversity patterns and assembly inferences? J. Ecol. 107, 2065–2077. doi: 10.1111/1365-2745.13247
Cadotte, M. W., Davies, T. J., and Peres-Neto, P. R. (2017). Why phylogenies do not always predict ecological differences. Ecol. Monogr. 87, 535–551. doi: 10.1002/ecm.1267
Cadotte, M. W., and Tucker, C. M. (2017). Should environmental filtering be abandoned? Trends Ecol. Evol. 32, 429–437. doi: 10.1016/j.tree.2017.03.004
Carrasco, L., Giam, X., Sheldon, K. S., and Papeş, M. (2022). The relative influence of history, climate, topography and vegetation structure on local animal richness varies among taxa and spatial grains. J. Anim. Ecol. 91, 1596–1611. doi: 10.1111/1365-2656.13752
Cavender-Bares, J., Ackerly, D. D., Baum, D. A., and Bazzaz, F. A. (2004). Phylogenetic Overdispersion in Floridian oak communities. Am. Nat. 163, 823–843. doi: 10.1086/386375
Cavender-Bares, J., Kozak, K. H., Fine, P. V. A., and Kembel, S. W. (2009). The merging of community ecology and phylogenetic biology. Ecol. Lett. 12, 693–715. doi: 10.1111/j.1461-0248.2009.01314.x
Chen, Z., Li, X., Song, W., Li, Q., Onditi, K., Khanal, L., et al. (2020). Small mammal species richness and turnover along elevational gradient in Yulong Mountain, Yunnan, Southwest China. Ecol. Evol. 10, 2545–2558. doi: 10.1002/ece3.6083
Cisneros, L. M., Burgio, K. R., Dreiss, L. M., Klingbeil, B. T., Patterson, B. D., Presley, S. J., et al. (2014). Multiple dimensions of bat biodiversity along an extensive tropical elevational gradient. J. Anim. Ecol. 83, 1124–1136. doi: 10.1111/1365-2656.12201
Colwell, R. K., Rahbek, C., and Gotelli, N. J. (2004). The mid-domain effect and species richness patterns: what hve we learned so far? Am. Nat. 163, E1–E23. doi: 10.1086/382056
Cornwell, W. K., Schwilk, D. W., and Ackerly, D. D. (2006). A trait-based test for habitat filtering: convex hull volume. Ecology 87, 1465–1471. doi: 10.1890/0012-9658(2006)87[1465:ATTFHF]2.0.CO;2
Costa-Pereira, R., Araújo, M. S., Souza, F. L., and Ingram, T. (2019). Competition and resource breadth shape niche variation and overlap in multiple trophic dimensions. Proc. R. Soc. B Biol. Sci. 286:20190369. doi: 10.1098/rspb.2019.0369
De Souza Ferreira Neto, G., Ortega, J. C. G., Melo Carneiro, F., Souza De Oliveira, S. Jr., Oliveira, R., and Beggiato Baccaro, F. (2022). Productivity correlates positively with mammalian diversity independently of the species’ feeding guild, body mass, or the vertical strata explored by the species. Mammal Rev. 52, 377–391. doi: 10.1111/mam.12282
Ding, Z., Hu, H., Cadotte, M. W., Liang, J., Hu, Y., and Si, X. (2021). Elevational patterns of bird functional and phylogenetic structure in the central Himalaya. Ecography 44, 1403–1417. doi: 10.1111/ecog.05660
Ding, C., Liang, D., Xin, W., Li, C., Ameca, E. I., and Jiang, Z. (2022). A dataset on the morphological, life-history and ecological traits of the mammals in China. Biodivers. Sci. 30:21520. doi: 10.17520/biods.2021520
Dreiss, L. M., Burgio, K. R., Cisneros, L. M., Klingbeil, B. T., Patterson, B. D., Presley, S. J., et al. (2015). Taxonomic, functional, and phylogenetic dimensions of rodent biodiversity along an extensive tropical elevational gradient. Ecography 38, 876–888. doi: 10.1111/ecog.00971
Du, Y., Wen, Z., Zhang, J., Lv, X., Cheng, J., Ge, D., et al. (2017). The roles of environment, space, and phylogeny in determining functional dispersion of rodents (Rodentia) in the Hengduan Mountains, China. Ecol. Evol. 7, 10941–10951. doi: 10.1002/ece3.3613
Edgar, R. C. (2004). MUSCLE: multiple sequence alignment with high accuracy and high throughput. Nucleic Acids Res. 32, 1792–1797. doi: 10.1093/nar/gkh340
Faith, D. P. (1992). Conservation evaluation and phylogenetic diversity. Biol. Conserv. 61, 1–10. doi: 10.1016/0006-3207(92)91201-3
Feist, D. D., and White, R. G. (1989). “Terrestrial mammals in cold,” in Animal Adaptation to Cold. ed. L. C. H. Wang (Berlin, Heidelberg: Springer Berlin Heidelberg), 327–360.
Franzén, M., and Molander, M. (2012). How threatened are alpine environments? A cross taxonomic study. Biodivers. Conserv. 21, 517–526. doi: 10.1007/s10531-011-0197-7
Gebert, F., Njovu, H. K., Treydte, A. C., Steffan-Dewenter, I., and Peters, M. K. (2019). Primary productivity and habitat protection predict elevational species richness and community biomass of large mammals on Mt. Kilimanjaro. J. Anim. Ecol. 88, 1860–1872. doi: 10.1111/1365-2656.13074
Gohli, J., and Voje, K. L. (2016). An interspecific assessment of Bergmann’s rule in 22 mammalian families. BMC Evol. Biol. 16:222. doi: 10.1186/s12862-016-0778-x
Gotelli, N. J. (2000). Null model analysis of species co-occurrence patterns. Ecology 81, 2606–2621. doi: 10.1890/0012-9658(2000)081[2606:NMAOSC]2.0.CO;2
Gotelli, N. J., and Rohde, K. (2002). Co-occurrence of ectoparasites of marine fishes: a null model analysis. Ecol. Lett. 5, 86–94. doi: 10.1046/j.1461-0248.2002.00288.x
Graham, C. H., Parra, J. L., Rahbek, C., and Mcguire, J. A. (2009). Phylogenetic structure in tropical hummingbird communities. Proc. Natl. Acad. Sci. U. S. A. 106, 19673–19678. doi: 10.1073/pnas.0901649106
Grigoropoulou, A., Schmidt-Kloiber, A., Múrria, C., and Qiao, H. (2022). Incongruent latitudinal patterns of taxonomic, phylogenetic and functional diversity reveal different drivers of caddisfly community assembly across spatial scales. Glob. Ecol. Biogeogr. 31, 1006–1020. doi: 10.1111/geb.13479
Helmus, M. R., Savage, K., Diebel, M. W., Maxted, J. T., and Ives, A. R. (2007). Separating the determinants of phylogenetic community structure. Ecol. Lett. 10, 917–925. doi: 10.1111/j.1461-0248.2007.01083.x
Jarzyna, M. A., Quintero, I., and Jetz, W. (2021). Global functional and phylogenetic structure of avian assemblages across elevation and latitude. Ecol. Lett. 24, 196–207. doi: 10.1111/ele.13631
Keddy, P. A. (1992). Assembly and response rules: two goals for predictive community ecology. J. Veg. Sci. 3, 157–164. doi: 10.2307/3235676
Kembel, S. W. (2009). Disentangling niche and neutral influences on community assembly: assessing the performance of community phylogenetic structure tests. Ecol. Lett. 12, 949–960. doi: 10.1111/j.1461-0248.2009.01354.x
Kembel, S. W., Cowan, P. D., Helmus, M. R., Cornwell, W. K., Morlon, H., Ackerly, D. D., et al. (2010). Picante: R tools for integrating phylogenies and ecology. Bioinformatics 26, 1463–1464. doi: 10.1093/bioinformatics/btq166
Kirk, M. A., Rahel, F. J., and Laughlin, D. C. (2022). Environmental filters of freshwater fish community assembly along elevation and latitudinal gradients. Glob. Ecol. Biogeogr. 31, 470–485. doi: 10.1111/geb.13439
Kohli, B. A., Miyajima, R. J., and Jarzyna, M. A. (2022). Elevational diversity patterns of rodents differ between wet and arid mountains. Glob. Ecol. Biogeogr. 31, 1726–1740. doi: 10.1111/geb.13552
Kohli, B. A., Stevens, R. D., Rickart, E. A., and Rowe, R. J. (2021). Mammals on mountainsides revisited: trait-based tests of assembly reveal the importance of abiotic filters. J. Biogeogr. 48, 1606–1621. doi: 10.1111/jbi.14099
Koju, N. P., He, K., Chalise, M. K., Ray, C., Chen, Z., Zhang, B., et al. (2017). Multilocus approaches reveal underestimated species diversity and inter-specific gene flow in pikas (Ochotona) from southwestern China. Mol. Phylogenet. Evol. 107, 239–245. doi: 10.1016/j.ympev.2016.11.005
Körner, C. (2013). “Alpine ecosystems,” in Encyclopedia of Biodiversity. 2nd ed. S. A. Levin. (Waltham, MA: Academic Press).
Kraft, N. J., Adler, P. B., Godoy, O., James, E. C., Fuller, S., and Levine, J. M. (2015). Community assembly, coexistence and the environmental filtering metaphor. Funct. Ecol. 29, 592–599. doi: 10.1111/1365-2435.12345
Kumar, S., Stecher, G., Li, M., Knyaz, C., and Tamura, K. (2018). MEGA X: molecular evolutionary genetics analysis across computing platforms. Mol. Biol. Evol. 35, 1547–1549. doi: 10.1093/molbev/msy096
Legendre, P., and Gallagher, E. D. (2001). Ecologically meaningful transformations for ordination of species data. Oecologia 129, 271–280. doi: 10.1007/s004420100716
Legras, G., Loiseau, N., and Gaertner, J. C. (2018). Functional richness: overview of indices and underlying concepts. Acta Oecol. 87, 34–44. doi: 10.1016/j.actao.2018.02.007
Lessard, J. P., Belmaker, J., Myers, J. A., Chase, J. M., and Rahbek, C. (2012). Inferring local ecological processes amid species pool influences. Trends Ecol. Evol. 27, 600–607. doi: 10.1016/j.tree.2012.07.006
Lessard, J. P., Weinstein, B. G., Borregaard, M. K., Marske, K. A., Martin, D. R., Mcguire, J. A., et al. (2016). Process-based species pools reveal the hidden signature of biotic interactions amid the influence of temperature filtering. Am. Nat. 187, 75–88. doi: 10.1086/684128
Liu, S. Y., He, K., Chen, S. D., Jin, W., Murphy, R. W., Tang, M. K., et al. (2018). How many species of Apodemus and Rattus occur in China? A survey based on mitochondrial cyt b and morphological analyses. Zool. Res. 39, 309–320. doi: 10.24272/j.issn.2095-8137.2018.053
Lomolino, M. V. (2001). The species-area relationship: new challenges for an old pattern. Prog. Phys. Geogr Earth Environ. 25, 1–21. doi: 10.1177/030913330102500101
Lopez, B., Burgio, K., Carlucci, M., Palmquist, K., Parada, A., Weinberger, V., et al. (2016). A new framework for inferring community assembly processes using phylogenetic information, relevant traits and environmental gradients. One Ecosystem 1:e9501. doi: 10.3897/oneeco.1.e9501
Louthan, A. M., Doak, D. F., and Angert, A. L. (2015). Where and when do species interactions set range limits? Trends Ecol. Evol. 30, 780–792. doi: 10.1016/j.tree.2015.09.011
Magneville, C., Loiseau, N., Albouy, C., Casajus, N., Claverie, T., Escalas, A., et al. (2021). mFD: an R package to compute and illustrate the multiple facets of functional diversity. Ecography 2022, 1–15. doi: 10.1111/ecog.05904
Mammola, S., Carmona, C. P., Guillerme, T., and Cardoso, P. (2021). Concepts and applications in functional diversity. Funct. Ecol. 35, 1869–1885. doi: 10.1111/1365-2435.13882
Mason, N. W. H., Lanoiselée, C., Mouillot, D., Irz, P., and Argillier, C. (2007). Functional characters combined with null models reveal inconsistency in mechanisms of species turnover in lacustrine fish communities. Oecologia 153, 441–452. doi: 10.1007/s00442-007-0727-x
Mason, N. W. H., Mouillot, D., Lee, W. G., and Wilson, J. B. (2005). Functional richness, functional evenness and functional divergence: the primary components of functional diversity. Oikos 111, 112–118. doi: 10.1111/j.0030-1299.2005.13886.x
Mayfield, M. M., Bonser, S. P., Morgan, J. W., Aubin, I., Mcnamara, S., and Vesk, P. A. (2010). What does species richness tell us about functional trait diversity? Predictions and evidence for responses of species and functional trait diversity to land-use change. Glob. Ecol. Biogeogr. 19, 423–431. doi: 10.1111/j.1466-8238.2010.00532.x
Mayfield, M. M., and Levine, J. M. (2010). Opposing effects of competitive exclusion on the phylogenetic structure of communities. Ecol. Lett. 13, 1085–1093. doi: 10.1111/j.1461-0248.2010.01509.x
McCain, C. M., and Grytnes, J. A. (2010). Elevational Gradients in Species Richness. Encyclopedia of life. Chichester: John Wiley & Sons, Ltd.
Miller, E. T., Farine, D. R., and Trisos, C. H. (2017). Phylogenetic community structure metrics and null models: a review with new methods and software. Ecography 40, 461–477. doi: 10.1111/ecog.02070
Mittermeier, R. A., Turner, W. R., Larsen, F. W., Brooks, T. M., and Gascon, C. (2011). “Global biodiversity conservation: the critical role of hotspots,” in Biodiversity Hotspots: Distribution and Protection of Conservation Priority Areas. eds. F. E. Zachos and J. C. Habel (Berlin, Heidelberg: Springer).
Montaño-Centellas, F. A., Loiselle, B. A., and Tingley, M. W. (2021). Ecological drivers of avian community assembly along a tropical elevation gradient. Ecography 44, 574–588. doi: 10.1111/ecog.05379
Montaño-Centellas, F. A., Mccain, C., and Loiselle, B. A. (2019). Using functional and phylogenetic diversity to infer avian community assembly along elevational gradients. Glob. Ecol. Biogeogr. 29, 232–245. doi: 10.1111/geb.13021
Mouchet, M. A., Villéger, S., Mason, N. W. H., and Mouillot, D. (2010). Functional diversity measures: an overview of their redundancy and their ability to discriminate community assembly rules. Funct. Ecol. 24, 867–876. doi: 10.1111/j.1365-2435.2010.01695.x
Mouillot, D., Loiseau, N., Grenié, M., Algar, A. C., Allegra, M., Cadotte, M. W., et al. (2021). The dimensionality and structure of species trait spaces. Ecol. Lett. 24, 1988–2009. doi: 10.1111/ele.13778
Mouquet, N., Devictor, V., Meynard, C. N., Munoz, F., Bersier, L.-F., Chave, J., et al. (2012). Ecophylogenetics: advances and perspectives. Biol. Rev. 87, 769–785. doi: 10.1111/j.1469-185X.2012.00224.x
Münkemüller, T., Gallien, L., Pollock, L. J., Barros, C., Carboni, M., Chalmandrier, L., et al. (2020). Dos and don’ts when inferring assembly rules from diversity patterns. Glob. Ecol. Biogeogr. 29, 1212–1229. doi: 10.1111/geb.13098
Musila, S., Chen, Z. Z., Li, Q., Yego, R., Zhang, B., Onditi, K., et al. (2019). Diversity and distribution patterns of non-volant small mammals along different elevation gradients on Mt. Kenya, Kenya. Zool. Res. 40, 53–60. doi: 10.24272/j.issn.2095-8137.2019.004
Ochoa-Ochoa, L. M., Mejía-Domínguez, N. R., Velasco, J. A., Dimitrov, D., and Marske, K. A. (2020). Dimensions of amphibian alpha diversity in the New World. J. Biogeogr. 47, 2293–2302. doi: 10.1111/jbi.13948
Onditi, K. O., Song, W., Li, X., Chen, Z., Li, Q., He, S., et al. (2022). Patterns and predictors of small mammal phylogenetic and functional diversity in contrasting elevational gradients in Kenya. Front. Ecol. Evol. 9:742524. doi: 10.3389/fevo.2021.742524
Peters, M. K., Hemp, A., Appelhans, T., Behler, C., Classen, A., Detsch, F., et al. (2016). Predictors of elevational biodiversity gradients change from single taxa to the multi-taxa community level. Nat. Commun. 7:13736. doi: 10.1038/ncomms13736
Qian, H., Ricklefs, R. E., and Thuiller, W. (2021). Evolutionary assembly of flowering plants into sky islands. Nat. Ecol. Evol. 5, 640–646. doi: 10.1038/s41559-021-01423-1
R Core Team (2021). R: A Language and Environment for Statistical Computing. Vienna, Austria.: R Foundation for Statistical Computing.
Ramírez-Bautista, A., and Williams, J. N. (2019). The importance of productivity and seasonality for structuring small rodent diversity across a tropical elevation gradient. Oecologia 190, 275–286. doi: 10.1007/s00442-018-4287-z
Read, Q. D., Grady, J. M., Zarnetske, P. L., Record, S., Baiser, B., Belmaker, J., et al. (2018). Among-species overlap in rodent body size distributions predicts species richness along a temperature gradient. Ecography 41, 1718–1727. doi: 10.1111/ecog.03641
Reymond, A., Purcell, J., Cherix, D., Guisan, A., and Pellissier, L. (2013). Functional diversity decreases with temperature in high elevation ant fauna. Ecol. Entomol. 38, 364–373. doi: 10.1111/een.12027
Rymer, T. L., Pillay, N., and Schradin, C. (2016). Resilience to droughts in mammals: a conceptual framework for estimating vulnerability of a single species. Q. Rev. Biol. 91, 133–176. doi: 10.1086/686810
Sherman, R., Mullen, R., Li, H., Fang, Z., and Wang, Y. (2008). Spatial patterns of plant diversity and communities in alpine ecosystems of the Hendguan Mountains, Northwest Yunnan, China. J. Plant Ecol. 1, 117–136. doi: 10.1093/jpe/rtn012
Sirén, A. P. K., Sutherland, C. S., Bernier, C. A., Royar, K. J., Kilborn, J. R., Callahan, C. B., et al. (2021). Abiotic stress and biotic factors mediate range dynamics on opposing edges. J. Biogeogr. 48, 1758–1772. doi: 10.1111/jbi.14112
Smiley, T. M., Title, P. O., Zelditch, M. L., and Terry, R. C. (2020). Multidimensional biodiversity hotspots and the future of taxonomic, ecological and phylogenetic diversity: a case study of north American rodents. Glob. Ecol. Biogeogr. 29, 516–533. doi: 10.1111/geb.13050
Song, W. Y., Li, X. Y., Chen, Z. Z., Li, Q., Onditi, K., He, S. W., et al. (2020). Isolated alpine habitats reveal disparate ecological drivers of taxonomic and functional beta diversity of small mammal assemblages. Zool. Res. 41, 670–683. doi: 10.24272/j.issn.2095-8137.2020.085
Song, W. Y., Wang, H. J., Li, Y. X., He, S. W., and Jiang, X. L. (2021). New records of Tibetan shrew (Sorex thibetanus Kastschenko, 1905) and Gansu shrew (Sorex cansulus Thomas, 1912) in Yunnan Province. Acta Theriol. Sin. 41, 352–360. doi: 10.16829/j.slxb.150520
Soria, C. D., Pacifici, M., Di Marco, M., Stephen, S. M., and Rondinini, C. (2021). COMBINE: a coalesced mammal database of intrinsic and extrinsic traits. Ecology 102:e03344. doi: 10.1002/ecy.3344
Spasojevic, M. J., Copeland, S., and Suding, K. N. (2014). Using functional diversity patterns to explore metacommunity dynamics: a framework for understanding local and regional influences on community structure. Ecography 37, 939–949. doi: 10.1111/ecog.00711
Spasojevic, M. J., and Suding, K. N. (2012). Inferring community assembly mechanisms from functional diversity patterns: the importance of multiple assembly processes. J. Ecol. 100, 652–661. doi: 10.1111/j.1365-2745.2011.01945.x
Takahashi, K., and Tanaka, S. (2016). Relative importance of habitat filtering and limiting similarity on species assemblages of alpine and subalpine plant communities. J. Plant Res. 129, 1041–1049. doi: 10.1007/s10265-016-0852-x
Tang, R. X., Wang, J., Li, Y. F., Zhou, C. R., Meng, G. L., Li, F. J., et al. (2022). Genomics and morphometrics reveal the adaptive evolution of pikas. Zool. Res. 43, 813–826. doi: 10.24272/j.issn.2095-8137.2022.072
Testolin, R., Attorre, F., and Jiménez-Alfaro, B. (2020). Global distribution and bioclimatic characterization of alpine biomes. Ecography 43, 779–788. doi: 10.1111/ecog.05012
Tobe, S. S., Kitchener, A. C., and Linacre, A. M. T. (2010). Reconstructing mammalian phylogenies: a detailed comparison of the cytochrome b and cytochrome oxidase subunit I mitochondrial genes. PLoS One 5:e14156. doi: 10.1371/journal.pone.0014156
Trifinopoulos, J., Nguyen, L. T., Von Haeseler, A., and Minh, B. Q. (2016). W-IQ-TREE: a fast online phylogenetic tool for maximum likelihood analysis. Nucleic Acids Res. 44, W232–W235. doi: 10.1093/nar/gkw256
Tucker, C. M., Cadotte, M. W., Carvalho, S. B., Davies, T. J., Ferrier, S., Fritz, S. A., et al. (2017). A guide to phylogenetic metrics for conservation, community ecology and macroecology. Biol. Rev. 92, 698–715. doi: 10.1111/brv.12252
Villéger, S., Mason, N. W. H., and Mouillot, D. (2008). New multidimensional functional diversity indices for a multifaceted framework in functional ecology. Ecology 89, 2290–2301. doi: 10.1890/07-1206.1
Walker, S. C., Poos, M. S., and Jackson, D. A. (2008). Functional rarefaction: estimating functional diversity from field data. Oikos 117, 286–296. doi: 10.1111/j.2007.0030-1299.16171.x
Wang, W., Körner, C., Zhang, Z., Wu, R., Geng, Y., Shi, W., et al. (2013). No slope exposure effect on alpine treeline position in the three parallel Rivers region, SW China. Alp. Bot. 123, 87–95. doi: 10.1007/s00035-013-0118-3
Wang, X. Y., Zhong, M. J., Zhang, J., Si, X. F., Yang, S. N., Jiang, J. P., et al. (2022). Multidimensional amphibian diversity and community structure along a 2 600 m elevational gradient on the eastern margin of the Qinghai-Tibetan plateau. Zool. Res. 43, 40–51. doi: 10.24272/j.issn.2095-8137.2021.166
Webb, C. O., Ackerly, D. D., Mcpeek, M. A., and Donoghue, M. J. (2002). Phylogenies and community ecology. Ann. Rev. Ecol. Syst. 33, 475–505. doi: 10.1146/annurev.ecolsys.33.010802.150448
Weiher, E., and Keddy, P. A. (1995). Assembly rules, null models, and trait dispersion: new questions from old patterns. Oikos 74, 159–164. doi: 10.2307/3545686
Wells, K., Pfeiffer, M., Lakim, M. B., and Linsenmair, K. E. (2004). Use of arboreal and terrestrial space by a small mammal community in a tropical rain forest in Borneo, Malaysia. J. Biogeogr. 31, 641–652. doi: 10.1046/j.1365-2699.2003.01032.x
Wen, Z., Wu, Y., Cheng, J., Cai, T., Du, Y., Ge, D., et al. (2018). Abundance of small mammals correlates with their elevational range sizes and elevational distributions in the subtropics. Ecography 41, 1888–1898. doi: 10.1111/ecog.03558
Wen, Z., Yang, Q., Quan, Q., Xia, L., Ge, D., and Lv, X. (2016). Multiscale partitioning of small mammal β-diversity provides novel insights into the quaternary faunal history of Qinghai-Tibetan plateau and Hengduan Mountains. J. Biogeogr. 43, 1412–1424. doi: 10.1111/jbi.12706
Whitmee, S., and Orme, C. D. L. (2013). Predicting dispersal distance in mammals: a trait-based approach. J. Anim. Ecol. 82, 211–221. doi: 10.1111/j.1365-2656.2012.02030.x
Wiens, J. J., and Donoghue, M. J. (2004). Historical biogeography, ecology, and species richness. Trends Ecol. Evol. 19, 639–644. doi: 10.1016/j.tree.2004.09.011
Keywords: environmental stress, habitat constraint, trait space, niche-based process, overdispersion, resource competition
Citation: Song W-Y, Onditi KO, Li X-Y, Chen Z-Z, He S-W, Li Q and Jiang X-L (2023) Decomposing niche components reveals simultaneous effects of opposite deterministic processes structuring alpine small mammal assembly. Front. Ecol. Evol. 10:999573. doi: 10.3389/fevo.2022.999573
Edited by:
Rosane Garcia Collevatti, Universidade Federal de Goiás, BrazilReviewed by:
Hao Shen, Beijing Normal University, ChinaMarie Westover, Los Rios Community College District, United States
Gang Fu, Institute of Geographic Sciences and Natural Resources Research (CAS), China
Copyright © 2023 Song, Onditi, Li, Chen, He, Li and Jiang. This is an open-access article distributed under the terms of the Creative Commons Attribution License (CC BY). The use, distribution or reproduction in other forums is permitted, provided the original author(s) and the copyright owner(s) are credited and that the original publication in this journal is cited, in accordance with accepted academic practice. No use, distribution or reproduction is permitted which does not comply with these terms.
*Correspondence: Xue-Long Jiang,  amlhbmd4bEBtYWlsLmtpei5hYy5jbg==