- 1School of Forestry and Landscape Architecture, Anhui Agricultural University, Hefei, China
- 2Hefei National Urban Ecosystem Research Station, Hefei, China
- 3School of Art and Design, Dalian Polytechnic University, Dalian, China
- 4School of Geography, South China Normal University, Guangzhou, China
- 5SCNU Qingyuan Institute of Science and Technology Innovation Co., Ltd., Qingyuan, China
Under the pressure of rapid urbanization, the spatiotemporal dynamics of urban green spaces (UGS) have enormous impacts on the local ecological system and environment at different scales. In this study, UGS in Hefei City, which has experienced rapid urbanization from 1995 to 2015, were extracted based on time-series Landsat-5 TM and Landsat-8 OLI images, and different types of parks were mapped based on GF-2 images combined with multi-source metadata. Dynamic patterns of green space were examined by drawing the spatial variations of green space at the city, inner city, and park scales. Results revealed that: (1) At the city level, UGS decreased with the rapid urbanization, especially farmland sharply lost in areas around existing urban areas and along the transportation corridors. (2) At the inner-city level, concentric analyses showed that UGS changes in different rings had unique trends, and the dynamic changes were the most significant in Rings 2 and 3. Comparative analysis of old and new districts showed that the common characteristics of UGS changes were the transfer-out of farmland and the transfer-in of built-up land, and the newer the region, the more intense the changes. (3) At the park level, the number and area of urban parks were increasing from the center to the periphery, and the type of park gradually changed from single to rich. Significant spatial heterogeneity was identified in the landscape patterns of urban parks based on fishnet cell analysis. It is fundamental to assign urban construction land for socio-economic development, while planning UGS at different scales; moreover, integrating different green space-related policies could protect the UGS and maintain its stability. Only in this way can UGS combine economic, social, and ecological benefits under the background of rapid urbanization.
Introduction
As rapid urbanization continues worldwide, approximately 68% of the population will live in urban areas by 2050 (United Nations, 2018). This will result in the ongoing expansion of built-up areas (Li et al., 2013; Haaland and van den Bosch, 2015; Fan et al., 2017), which are generally preserved forests, prime agricultural lands, and important wetlands (Ehrenfeld, 2000; Huang et al., 2009; Wu et al., 2019a). Ultimately, a sharp shrinking in green space and many eco-environment problems arises from the loss and fragmentation of urban green spaces (UGS) under rapid urbanization. Therefore, the spatiotemporal dynamics of UGS have received increasing attention in sustainable urban development research (Wu et al., 2019b).
The system of UGS varies widely all over the world (Chang et al., 2015). In this paper, UGS can be defined as the areas comprising natural or human-maintained, public or private vegetation cover (forests, shrubs, grass, etc.), cultivated lands (agricultural areas, crop fields, and fallow lands) and waterbodies (stream and rivers, lakes, reservoir and ponds, wetlands) (Byomkesh et al., 2012; Wu et al., 2019b; Liu et al., 2021). As the focal point of urban ecological space, UGS play a crucial role in supporting urban ecosystems and sustainable development (Fineschi and Loreto, 2020), such as mitigating urban heat islands (Masoudi and Tan, 2019; Li et al., 2020; Ke et al., 2021; Liu et al., 2022), controlling urban pollution (Escobedo et al., 2011), adjusting the microclimate (Ehbrecht et al., 2019), protecting biodiversity (Hüse et al., 2016), reducing runoff (Yang and Lee, 2021), and controlling floods (Da et al., 2020). UGS is critical for improving the quality of life (Chi et al., 2020), increasing the sustainability of the living environment, and physical and psychological wellbeing (Huang et al., 2021). UGS has emerged as an important potential solution to a variety of urban environmental problems coupled with urbanization (Haaland and van den Bosch, 2015). Therefore, it is urgent to develop a sustainable protection, planning, and management strategy for green space considering the spatial dynamics of UGS. Additionally, the sustainable development of green space and the urban ecological environment is essential.
In recent years, the importance of green spaces in urban ecosystems has been widely recognized by the government. For example, a series of greening policies and UGS projects throughout the world have been developed to protect urban ecosystems, adapt to climate change, conserve biodiversity, increase social cohesion, enhance the quality of life of citizens, and maintain and bring more green areas into cities (Momm-Schult et al., 2013; Kanniah, 2017; Hernández-Moreno and Reyes-Paecke, 2018; Pauleit et al., 2019; Liu et al., 2021). The Chinese government has made significant efforts to bridge the gap between society and ecosystems. From broad to fine scales, a series of policies and strategies have been formulated in China, such as the “Basic Farmland Protection Policy,” “Ecological Red Lines Controlling,” “UGS System Planning,” “Park System Planning,” and “Greenway Network Planning.” Evaluations of the rapid urbanization and green space policies on spatial variation of UGS and insights into the spatiotemporal dynamics changing trends of UGS are vital for optimizing the patterns and developing appropriate decisions to protect the urban ecosystem.
Recently, interest in the spatiotemporal dynamics research about UGS focuses on two scales. At the local scale, based on a field survey of the number of samples selection from a large range has been widely used in different cities (Yang et al., 2005; McBride, 2008). At the regional scale, multiple-source remote sensing datasets and geographical information system (GIS) techniques have been broadly applied to monitor a more accurate and large-scale assessment of UGS variation (Shahtahmassebi et al., 2021). Numerous studies have used remotely sensed data from medium spatial resolution (i.e., Landsat Thematic Mapper images) to high spatial resolution image data (i.e., SPOT-5) to quantify the spatial pattern changes of UGS (Kong and Nakagoshi, 2006; Miller, 2012; Portillo-Quintero et al., 2012; Qian et al., 2015; Sun et al., 2019; Liu et al., 2021). Different methods, such as landscape metrics, land-use transition matrices, and linear spectral analysis, have been widely applied to quantify the spatiotemporal variation of UGS (Luck and Wu, 2002; Kong and Nakagoshi, 2006; Zhou and Wang, 2011; Yu et al., 2017). Although most studies have calculated and analyzed the characteristics and patterns of green space variation in a specific neighborhood, district, city or region scales (Tang et al., 2018; Zhang et al., 2019; Chen et al., 2021; Liu et al., 2021; Woldesemayat and Genovese, 2021), the continuous and comprehensive variation of green space across different scales of a city remains a limitation.
Previous studies have demonstrated that UGS planning plays an important role in controlling urban sprawl and improving urban ecosystem services (Zhao, 2010; Xu et al., 2011; Chang et al., 2015; Mu et al., 2020; Zhang et al., 2022). However, most of studies focus on quantity of green spaces to improve urban ecosystem services or urban sustainability. It is necessary to explore relationships between distribution and structural of green spaces and planning relating to green space spatiotemporal changes. To address this gap, we focused especially on green space issues and planning focus at different scales in an examination of the links between planning of green spaces and spatiotemporal dynamics of UGS.
The process of green space transform to construction land has been widely observed in cities worldwide, and especially prominent in Asian cities. For example, the UGS of Kuala Lumpur, the capital city of Malaysia, has experienced high losses of green space since the 1980s (Kanniah, 2017), and they also significantly reduced in Greater Dhaka, Bangladesh during 1975–2005 (Byomkesh et al., 2012). Elsewhere in China, Shanghai’s green space decreased from 84.8% in 1990 to 61.9% in 2015, as a result of extensive construction in both the city center and suburban districts, similar trends are obvious in Beijing (Yang et al., 2021), Kunming (Zhou and Wang, 2011), and Xiamen (Sun et al., 2019). Hefei, a principal city in central China and the largest city in Anhui Province, has also undergone unprecedented rapid urbanization. Rapid urbanization results in continuous pressure on the environment and serious competition between construction land supply and UGS protection. The trade-offs between limited land resources and the need for sustainable urbanization have been emphasized in several studies on Hefei (Zhang et al., 2013; Chen et al., 2019; Liu et al., 2019). However, the protection policy did not change the rate of urban area development; more than 10 km2 of farmland was transferred to other land-use types every year from 1995 to 2005 in Hefei (Huang et al., 2013). To protect and understand UGS and its ecological benefits, it is necessary to extract the status of the historical and modern spatial dynamics of the green space of Hefei City. In addition, China has many regional central cities that have faced similar development problems as Hefei, highlighting the importance of setting goals to optimize the layout of UGS for ecosystem stability and human wellbeing.
This study aims to understand the spatial dynamics of green spaces using remote sensing datasets and GIS techniques. We selected Hefei as the test area to explore the status of green spaces on three different scales. We acquired the spatial distribution of land-cover/use-based supervised classification, which helps to extract the distribution and transition of green space and urbanized areas. Spatial and landscape metrics analysis methods were used to understand the characteristics of green spaces on a spatial scale. The objectives of this study are: (1) to examine the dynamic patterns of green space across three scales (city, inner-city, and park scales) and (2) to discuss some of the major implications for the UGS planning of Hefei City at different scales and offer insights for other fast-growing cities.
Materials and methods
Study area
Hefei (30°56′N–32°32′N, 116°40′E–117°58′E) is located in the center of eastern China’s Anhui province, with an area of 11,430 km2. As the provincial capital, Hefei is also the political, economic, and cultural center of Anhui. This region is characterized by a northern subtropical monsoon climate with an annual average temperature of 15.7°C and mixed broadleaved forests of deciduous and evergreen species. Its rainfall averages 1,000 mm/year and mostly occurs between May and August. The Hefei area is located on the hilly terrain between the Yangtze River and Huaihe River, with Chaohu Lake flowing on the southeast side of the city. Its present administrative boundary comprises four districts (Luyang, Shushan, Baohe, and Yaohai), one county-level city (Chaohu City), and four counties (Feidong, Feixi, Changfeng, and Lujiang).
Hefei is a typical city in urban planning, famous for its Ring Park and fan-shaped urban space structure. In 1992, it was rated as one of China’s first national garden cities due to the natural and splendid urban greening created by Ring Park around the old downtown area (Hefei Municipal Government, 2012). Since 2000, several urban development strategies have been implemented to shape the new metropolis, such as the “141” (namely the formation of “a major city, four city groups and a new lakeside district”) spatial development strategy in 2007 and the “1,331” (namely the formation of “a major city, three city groups, three industrial parks and a new lakeside district”) development strategy in 2013, making Hefei experience unprecedented economic and urban area growth. Its population also increased from 4.47 million in 2000 to 7.87 million in 2015. Especially after 2011, the Greater Hefei region has almost doubled its administrative area and increased the population by nearly 2 million, making it an important city in the “Rise of Central China” strategy and the “National Metropolitan Group Along the Yangtze River in Anhui Province” strategy. The growth of Hefei has led to urbanization in the east Chinese province. To prevent the loss of UGS caused by rapid urbanization and improve the urban environment, it is necessary to review Hefei’s previous UGS change so as to manage and develop the UGS rationally.
At the inner-city level, our research focuses on the city center of Hefei, the rectangular sample window shown in Figure 1, covering an area of approximately 1,367.7 km2. Three typical urban function zones (UFZs) were selected to represent the areas experiencing significant landscape changes from 1995 to 2015. The three UFZs, each being 5 km × 5 km, are located within three urban areas that are representative of the different stages of the urbanization landscape in the old downtown (Ring Park area) and two new downtowns (Swan Lake Park area and Tangxi Lake Park area). The Ring Park area is a typical mixture of old municipal administration, historical museums, large theaters, commercial and business areas, and residential areas, surrounded by the Ring Park. The Swan Lake Park area is a typical mixture of municipal administration, commercial and business areas, culture, and residences, featuring Swan Lake Park in the middle. Tangxi Lake Park is a typical new development area mixture of municipal administration, residential areas, commercial and business areas, and recreational landscaping, featuring Tangxi Lake Park in the center.
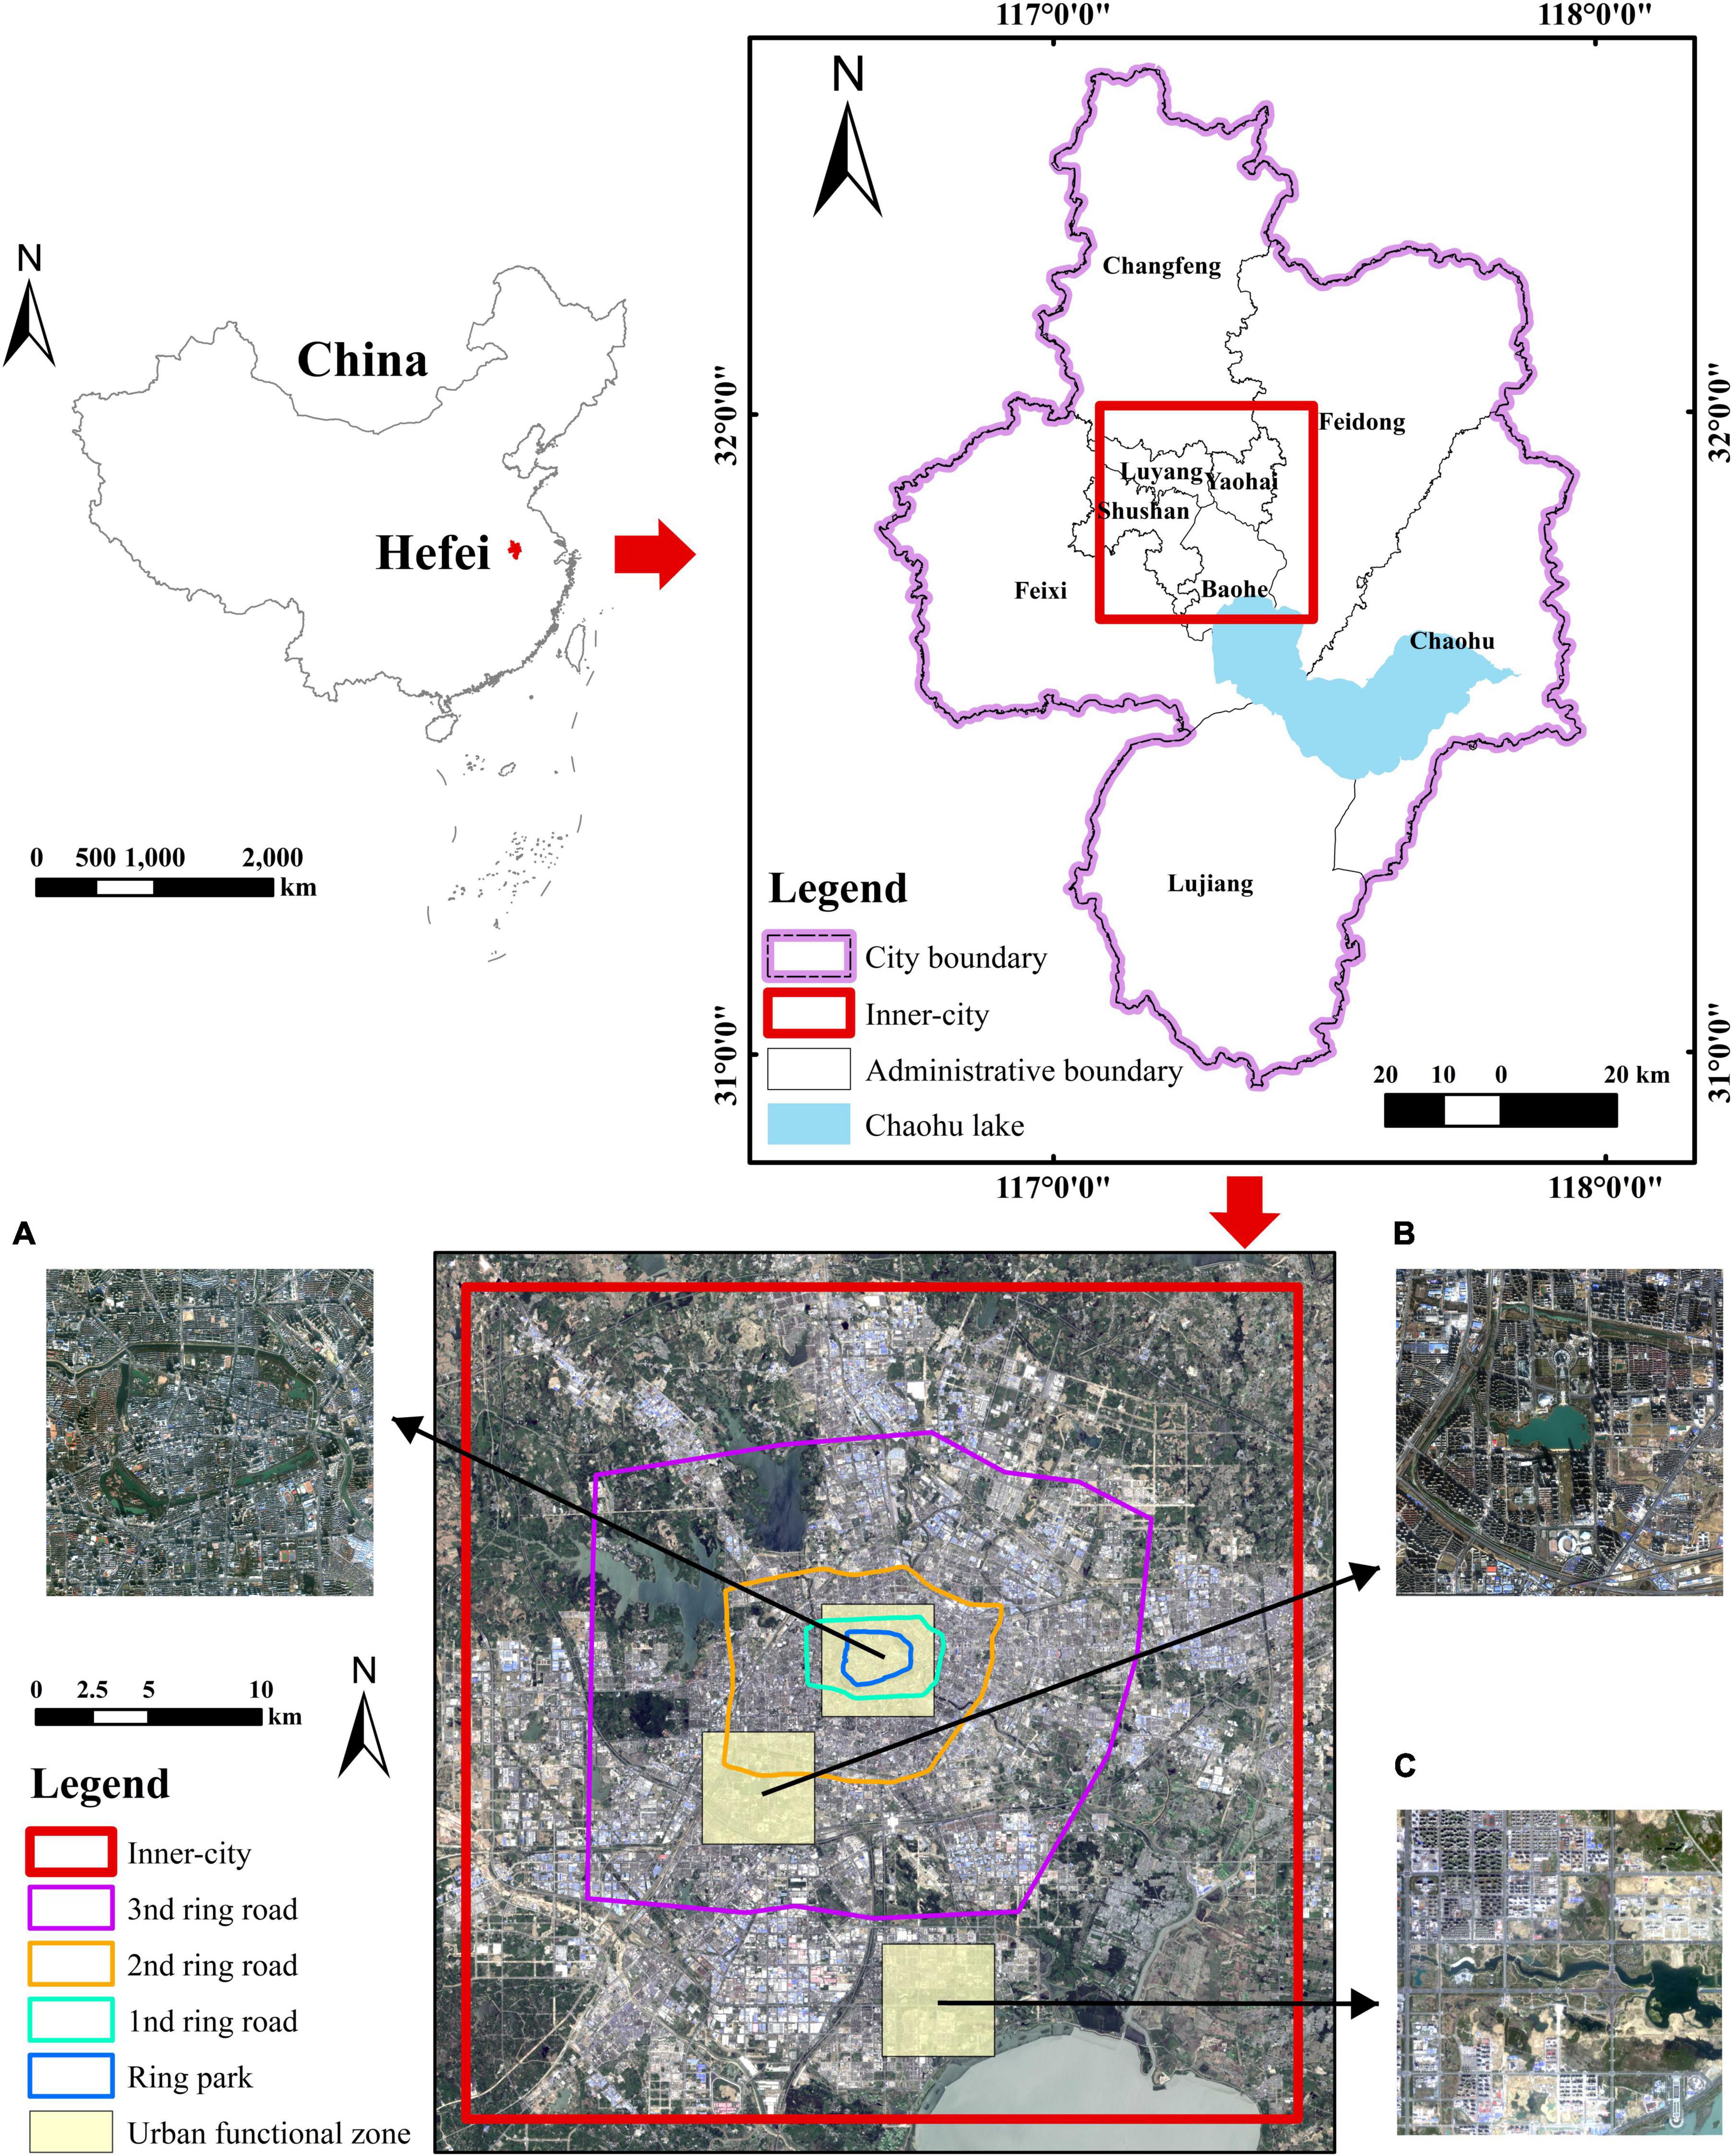
Figure 1. Location of the study area. (A–C) Ring Park area, Swan Lake Park area, and Tangxi Lake Park area, respectively.
Data and preprocessing
Remote sensing datasets mainly used Landsat 5 TM images (acquired on September 2, 1995), Landsat 8 OLI images (acquired on October 26, 2015), and GF-2 images (acquired on April 14, 2015), provided by the Geospatial Data Cloud Platform of the Computer Network Information Center of the Chinese Academy of Sciences. The spatial resolutions of Landsat 5 TM and Landsat 8 OLI were 30 m. The spatial resolution of GF-2 was 1 m in the panchromatic band and 8 m in the multispectral band. All remote sensing datasets were transferred to UTM projection and preprocessed with radiometric calibration and atmospheric correction using FLAASH atmospheric correction based on ENVI 5.3 software.
Land-use/cover was classified using the supervised classification method based on Landsat 5 TM images and Landsat 8 OLI images. Firstly, we established the classification system of land-use/cover, including built-up areas, forests, farmlands, water bodies, and others. Then, region of interest (ROI) was mapped as the sample data based on the images and the separability was evaluated. At last, the maximum likelihood method was adopted to realize the classification when the separability was greater than 1.9. Also, accuracy assessments were performed by the true land-cover types marked using ArcGIS and Google Earth images. The overall accuracies of 1995 and 2015 were 93 and 92%, respectively, with Kappa coefficients of 0.85 and 0.84, respectively. In this study, forest, farmland, and water bodies were set as UGS categories.
Vector datasets for the road network and residential areas were obtained from OpenStreetMap (OSM).1 We selected road network datasets with railways, primary roads, trunk roads, and secondary roads from the attributes of the road layers in the OSM data. Residential datasets were extracted from the attributes of the land-use layer in the OSM data.
Socioeconomic data included population distribution (POP) data and gross domestic product (GDP) data. Population data for 1995 and 2015 were derived from the Oak Ridge National Laboratory LandScan global population distribution data at an approximately 1-km spatial resolution.2 The 1-km grid GDP data used in 1995 and 2015 were provided by RESDC.3
Park attributes were derived from the official website of each park. Parks have been mapped by visual interpretation based on GF-2 images, divided into different types, including greenbelt, country, pocket, community, theme, and regional parks.
Methods
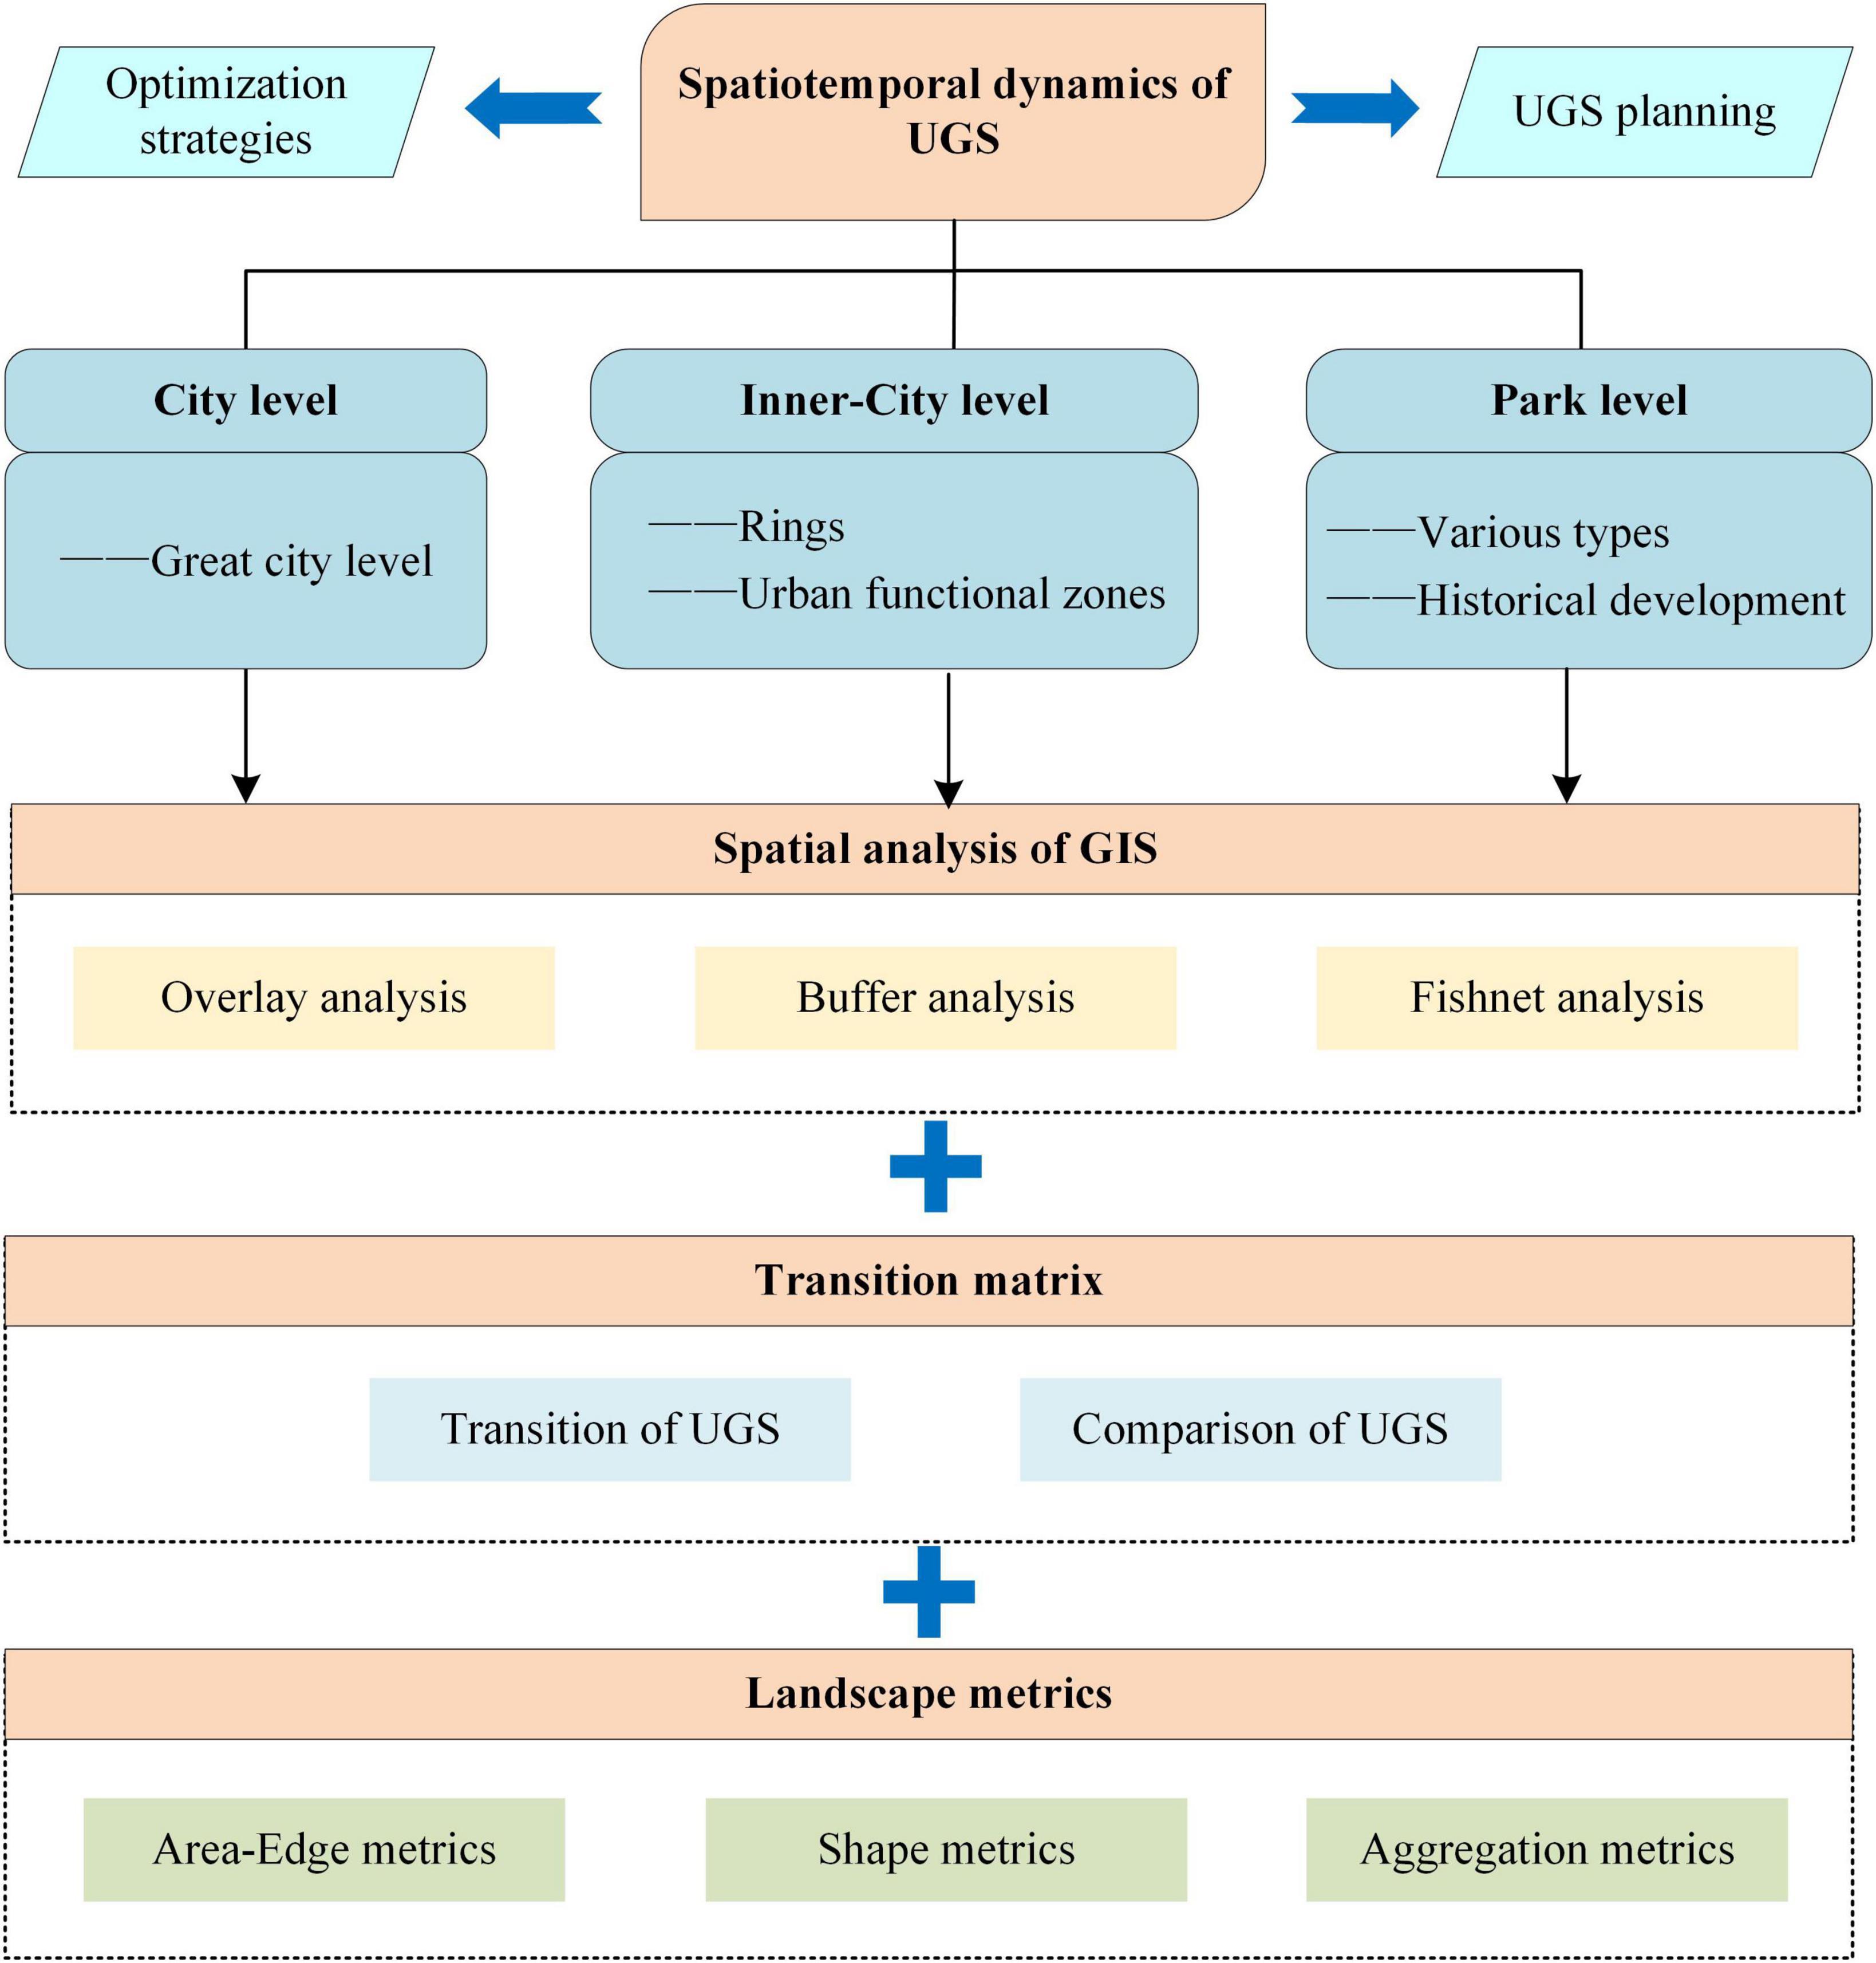
To analyze the spatiotemporal dynamics of the UGS in Hefei at different levels, we proposed an analysis method, as shown in Figure 2.
Spatial pattern analysis at three spatial scales
We analyzed the spatial pattern of green spaces at three spatial scales: city, inner city, and park. At the city level, Hefei City was used to investigate green space composition and configuration evolution. At the inner-outer level, five ring belts along the main roads, namely Ring Park, Ring 1 (between Ring Park and the first ring road), Ring 2 (between the first and second ring roads), Ring 3 (between the second and third ring roads), and Ring 4 (between the third ring road and inner city line), were used to investigate the spatial distribution of green space among different land-use types. Green space composition was compared between old and new development areas in the three functional zones.
At the park level, the spatiotemporal dynamics of parks in Hefei were evaluated using descriptive techniques. These methods evaluate park distribution from the standpoint of three spatial goals: spatial distribution, social services, and landscape patterns.
Transition matrix
A transition matrix was used to understand the inter-variation in land-use change. The general form of the transition matrix is as follows (Lopez et al., 2001; Guan et al., 2011):
where S is the area of land-cover type, n represents the number of land-cover types, i is the land-cover type at the beginning of the period, and j is the land-cover type at the end of the period. When i = j, Sij represents the unchanged area of the land-cover type, and when i≠j, Sij represents the area transferred from land-cover type i to type j.
Spatial analysis of geographical information system
Spatial analyses, including overlay, buffer, and fishnet analyses, were applied in this study. Urban park and ring data were used to analyze the distribution characteristics of parks in inner cities based on overlay analysis. Socioeconomic and ring data were overlaid to obtain the population of different districts. Buffer analysis was applied to establish a buffer range at a certain distance for the calculation of park accessibility. Fishnet analysis was used to explore the spatial heterogeneity of park distribution and to calculate the landscape metrics of urban parks. The fishnet cell used in this study was 3 km × 3 km (Shi et al., 2017; Samanta et al., 2018).
Landscape metrics analysis
Landscape metrics analysis was used to measure the changes in the UGS landscape during different periods (Xiao et al., 2021). Landscape metrics were quantified based on the raster format using FRAGSTATS 4.2 software (McGarigal et al., 2012). Some metrics from the area-edge, shape, and aggregation aspects were selected. Area-edge metrics included the percentage of landscape (PLAND), largest patch index (LPI) and edge density (ED). The shape metrics included the contiguity index distribution (CONTIG) and landscape shape index (LSI). Aggregation metrics included patch density (PD), and aggregation index (AI). Their formulas are as follows:
Where, aij is the area of patch ij of UGS, A is the area of the whole UGS types, eik is the total edge length of the UGS types, ei is the total edge length of UGS type i, minei is the minimum possible value of ei, ni is the number of patches of UGS type i; cijr is the adjacent value of the pixel r located in the patch ij, v is the sum of the adjacent values based on the 3 × 3 pixel template, gii is the number of nodes between pixels of type i based on haploid method, maxgii is the maximum number of nodes.
Results
City level spatial variations in green space distribution
Spatio-temporal evolution of urban green spaces in the greater-city level
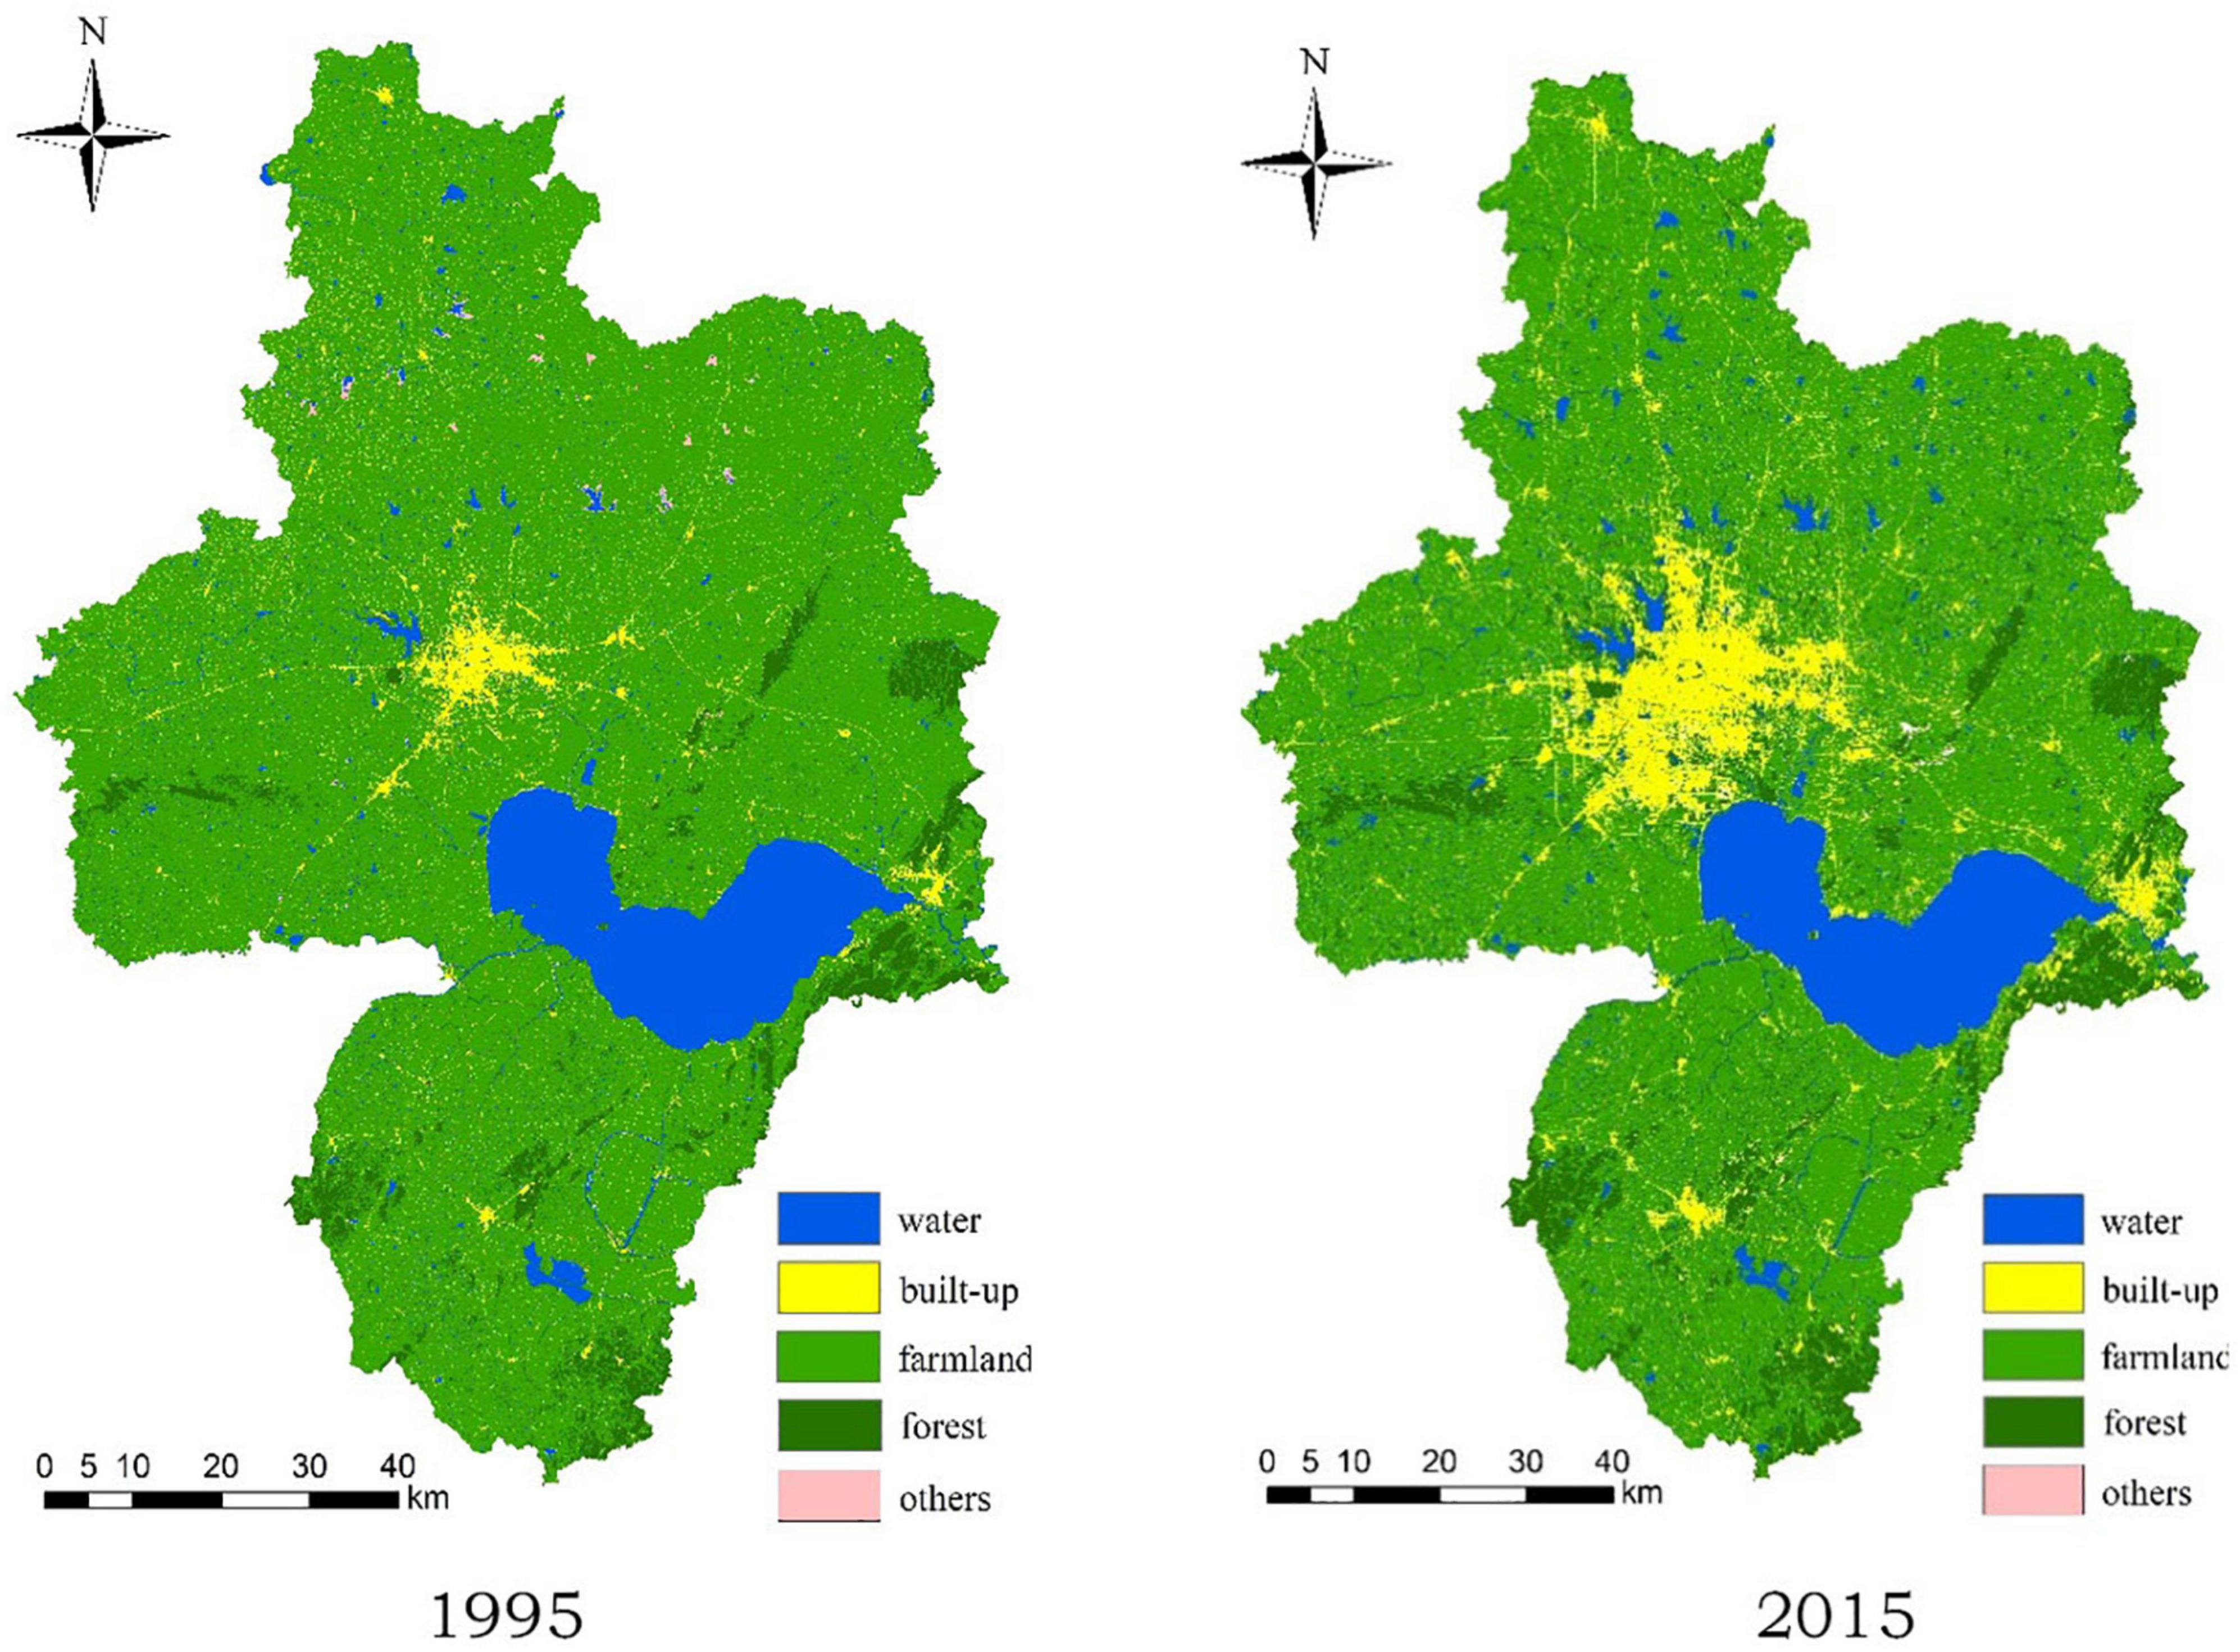
The spatial patterns of UGS in 1995 and 2015 are shown in Figure 3. The spatial distribution pattern of UGS in Hefei City in 2015 was substantially different from that in 1995 (Table 1). The ratio of green space declined from 94.72% in 1995 to 88.4% in 2015, whereas the built-up area increased from 4.94 to 11.19%, with a growth rate of 126.57%. Among the different types of green spaces, the loss of farmland was the most intense; the proportion declined from 78.95% in 1995 to 67.69% in 2015. Although the reduction rate was 14.26%, it was still the largest among all land-use types in Hefei. Compared to 1995, the forest area increased by 479.26 km2, with a growth rate of 66.62%, and the water bodies increased by 84.64 km2, with a growth rate of 7.82%.
Transition of urban green spaces change
The overall transfer trend of Hefei City can be understood through the land-cover transfer matrix. It can be seen from Table 2 that the transfer changes of different land-cover types from 1995 to 2015 were more significant, of which the changes in farmland, forest, and built-up area were more noticeable. From 1995 to 2015, farmland was transferred out the most, of which 901.07 km2 was converted into built-up areas, accounting for 50.21% of the net losses of farmland. The transition from water to the built-up area was also relatively large (38.03 km2), accounting for 28.8% of the transition of water bodies. The net transfer area of the forest was 272.36 km2, from the main transfer to 211.68 km2 of farmland and 46.47 km2 of built-up area.
The transition among different green space types was predominantly from farmland to forest. The past 20 years have witnessed a net 1,794.45 km2 reduction in farmland, of which 39.20% has been converted into forest. This might be attributed to the implementation of the “grain for green” policy in Hefei.
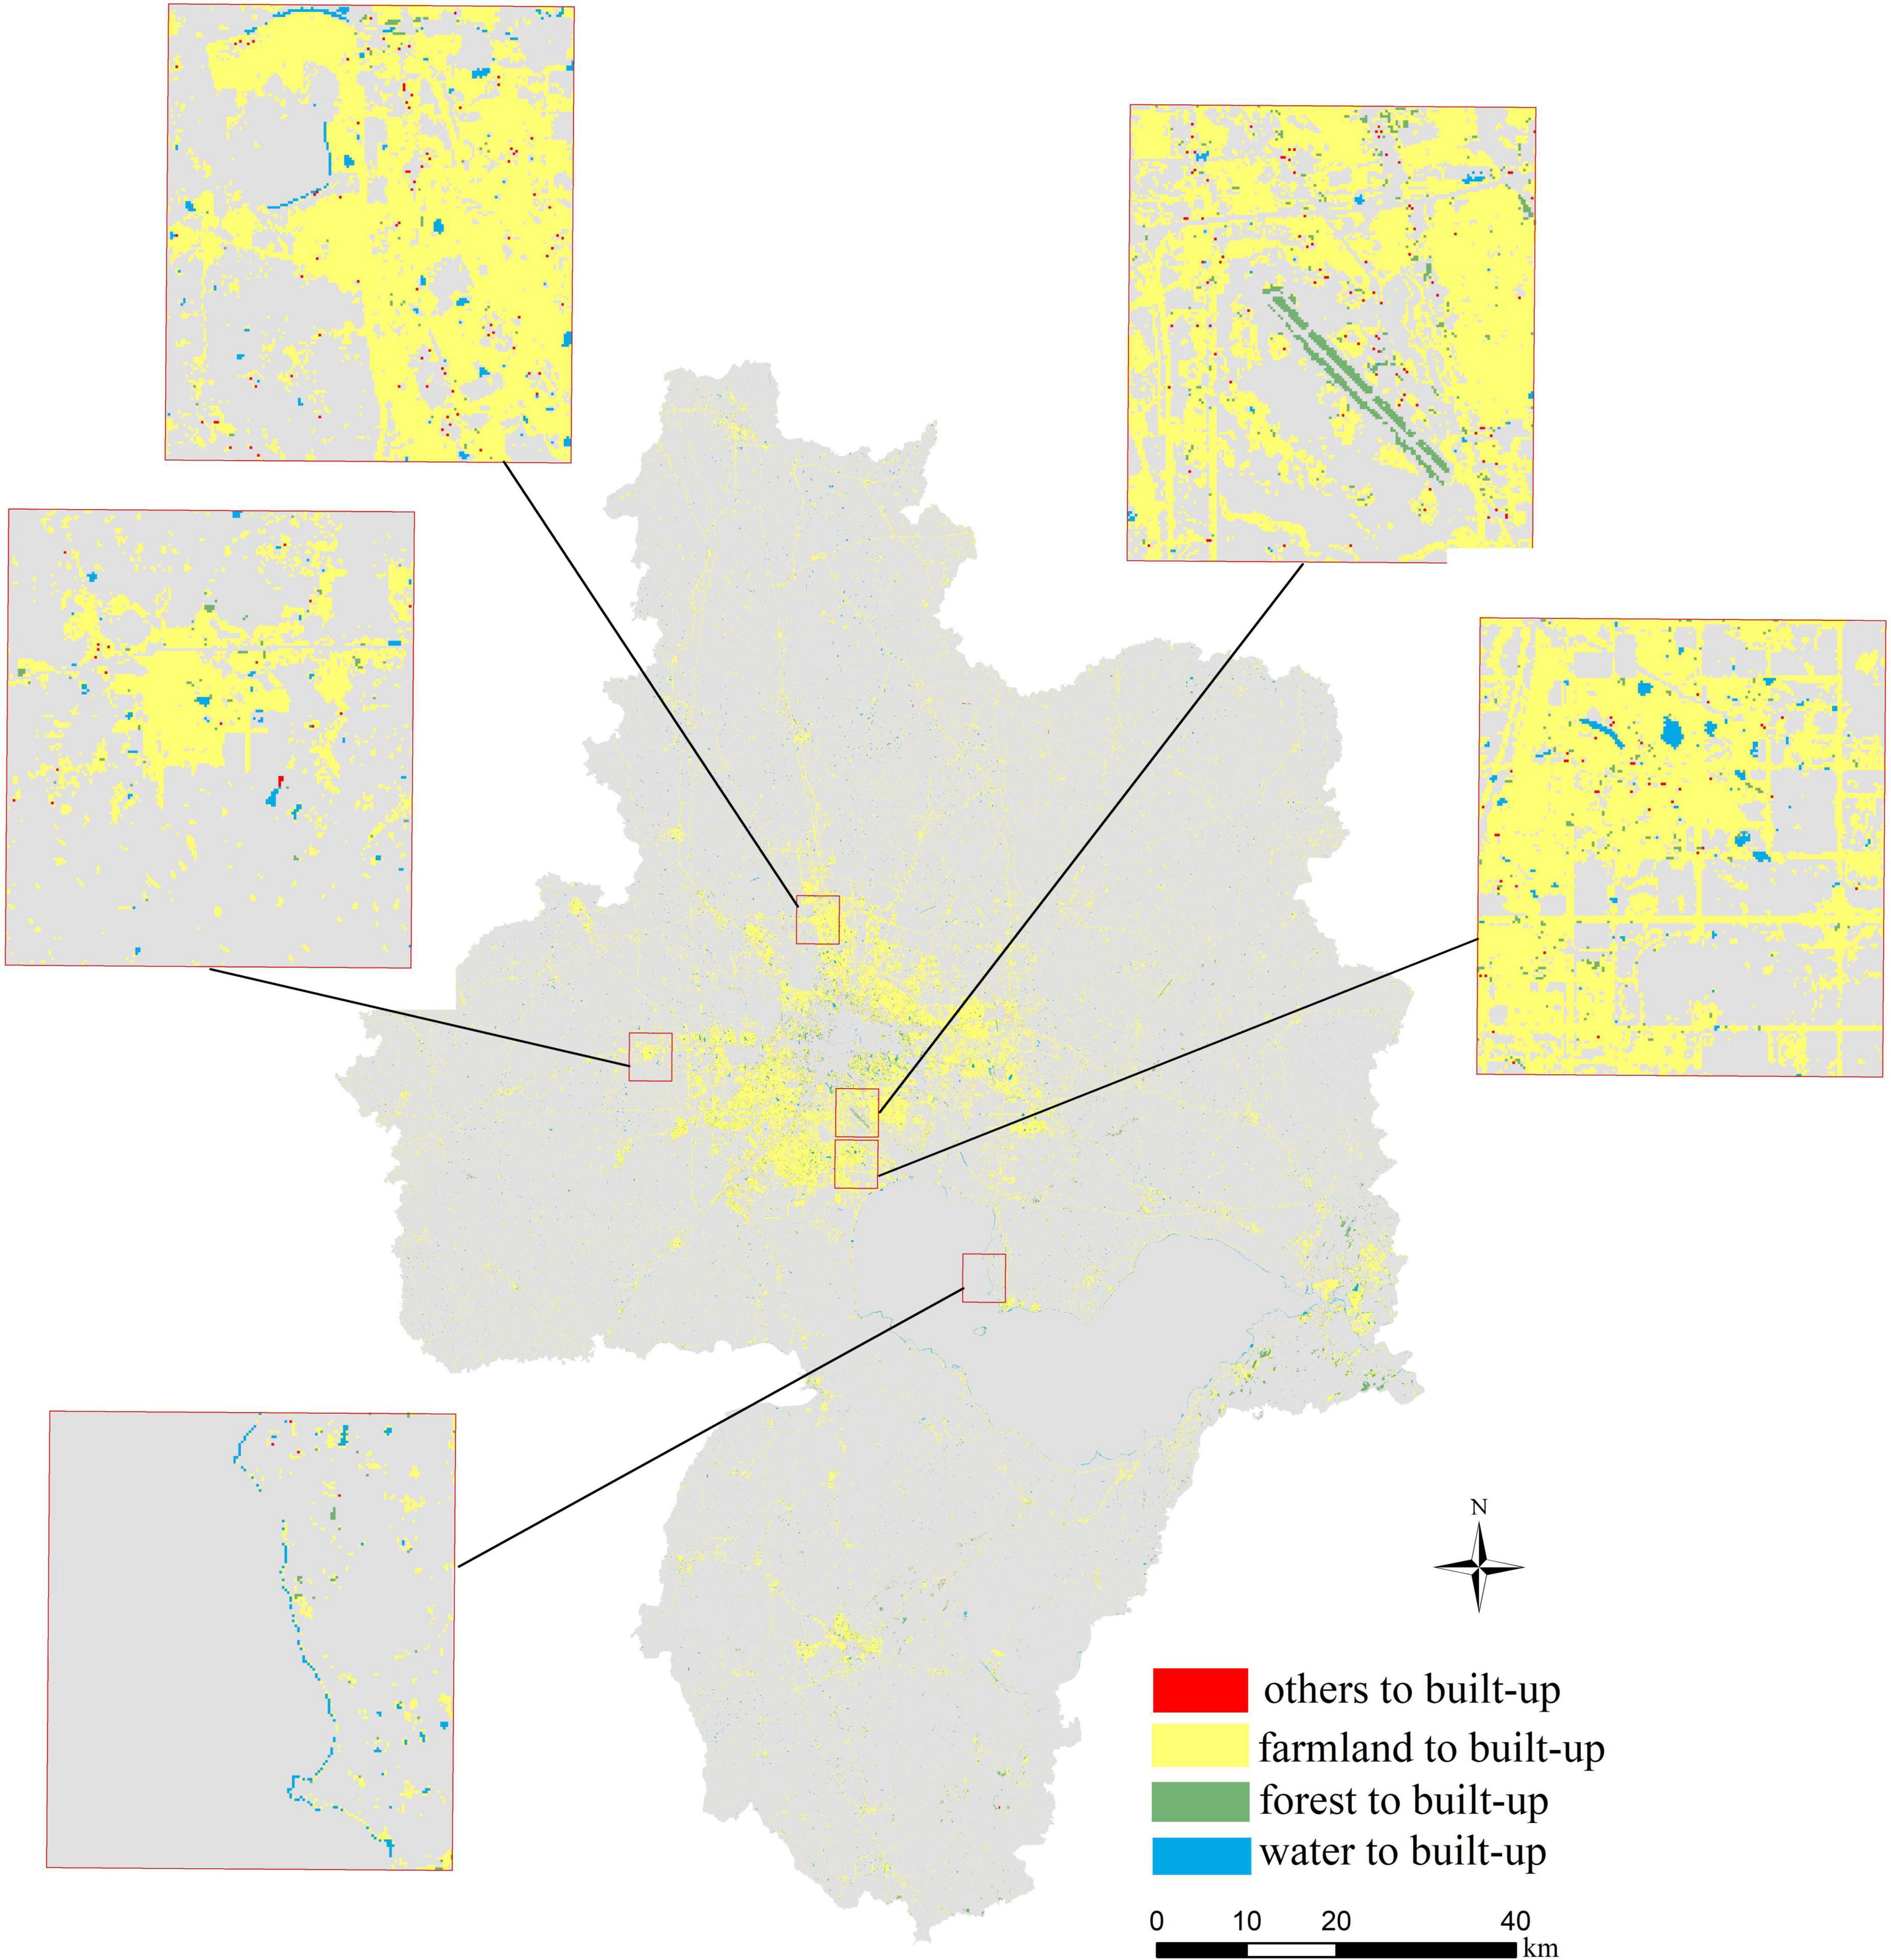
Figure 4 shows the spatial transition from green space to built-up areas from 1995 to 2015, where farmland around the urban fringes and small towns in the far suburbs was intensively transferred into built-up areas. The decrease in water bodies mainly occurred in suburban areas facing rapid urbanization. The forest transferred to the built-up area was dispersed. In general, the results showed that the land-cover pattern of Hefei City has changed significantly over the past 20 years, and attention should be paid to spatial areas.
Inner-city level spatial variations in green space distribution
Comparison of green space in rings
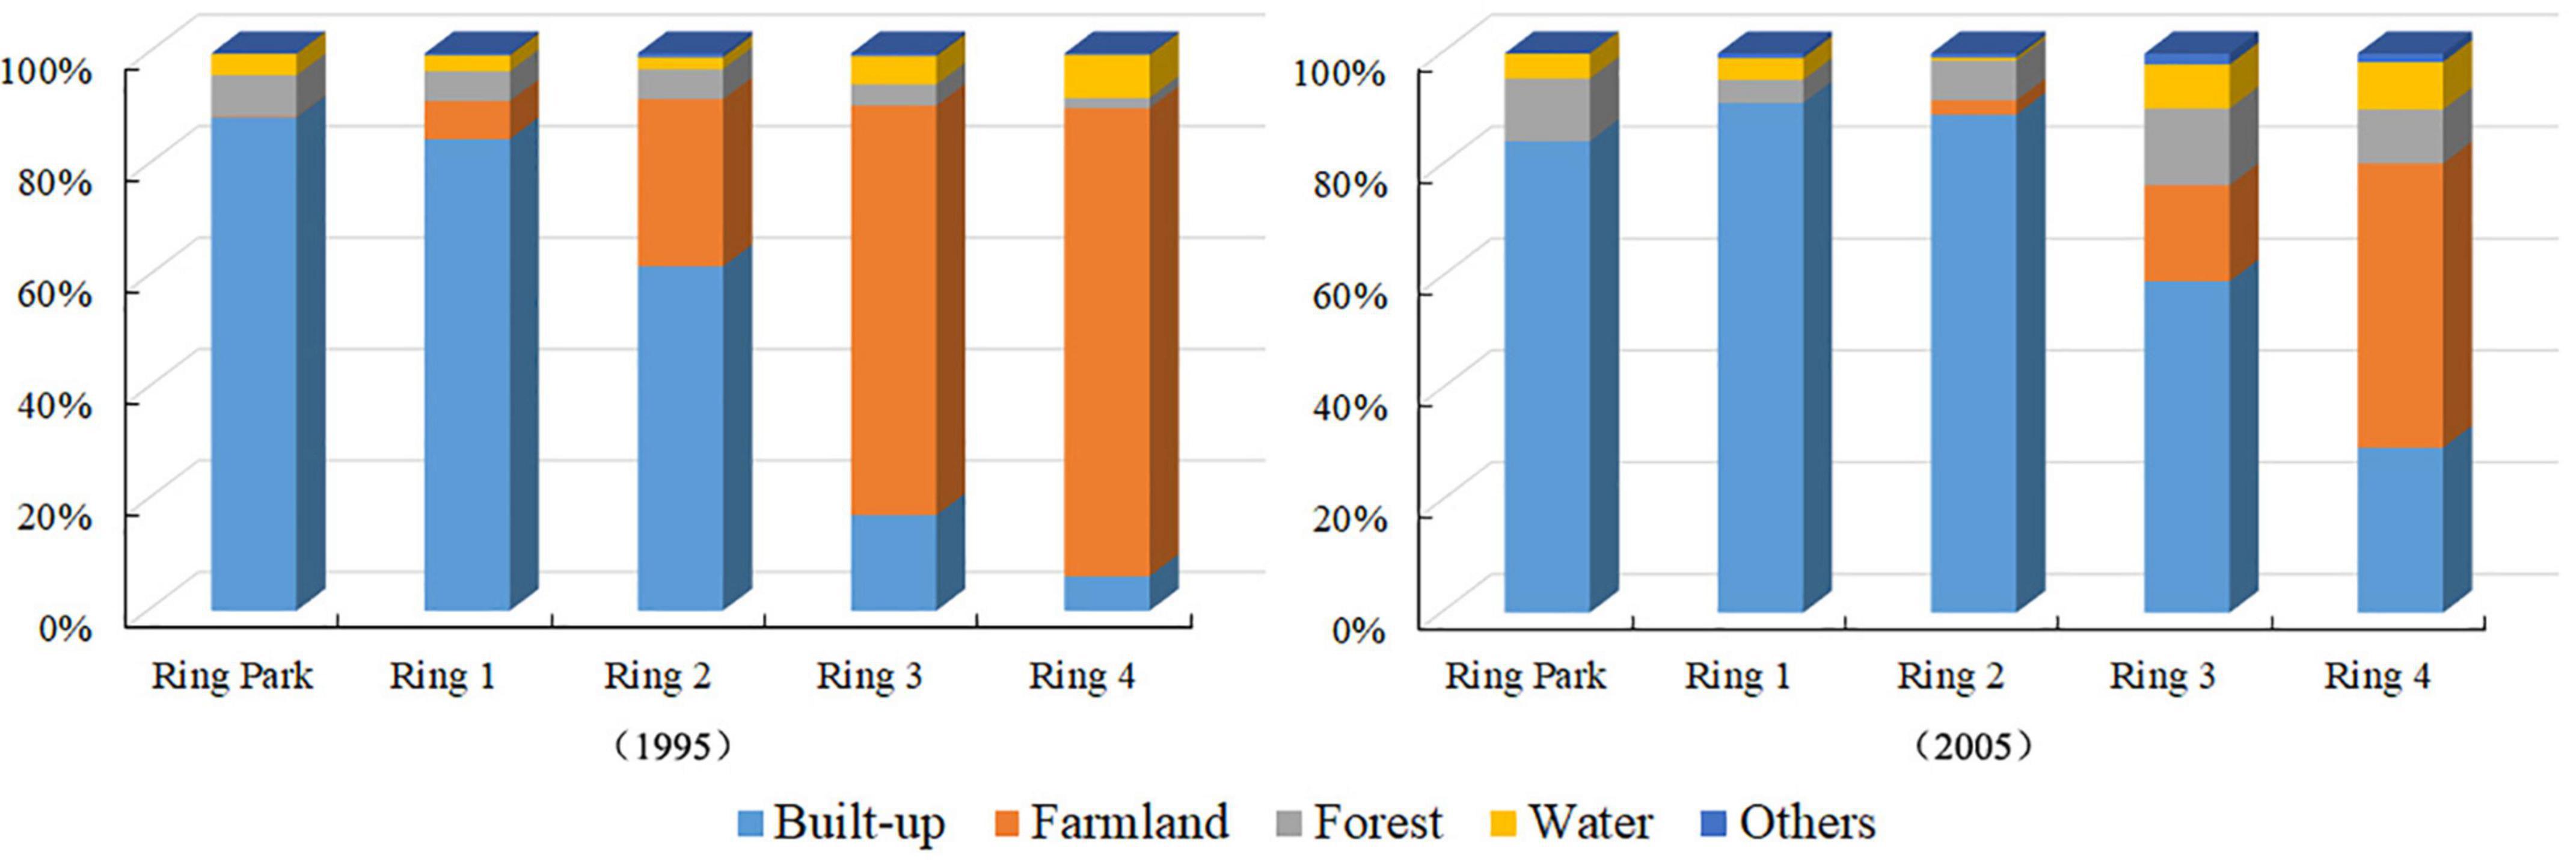
The percentage of green space in different rings from 1995 to 2015 was calculated, as shown in Figure 5. The largest UGS was in Ring 4 of Hefei, with percentages of 93.31 and 61.71% in 1995 and 2015, respectively. In contrast, the smallest UGS resided within Ring Park in 1995 and Ring 3 in 2015, with percentages of 11.49 and 19.21%, respectively. From 1995 to 2015, Ring 3 changed the most, with the largest increase in the proportion of built-up land from 17.16 to 59.29% and the largest decrease in farmland from 73.45 to 17.17%. The following in size were Rings 4 and 2, with build-up land and forest increasing and farmland decreasing. The UGS in Ring Park and Ring 1 changed only slightly.
Comparison of urban green spaces in old and new districts
Three areas with different levels of urbanization development, the Ring Park area, Swan Lake Park area, and Tangxi Lake Park area, were selected to conduct a comparative analysis of UGS.
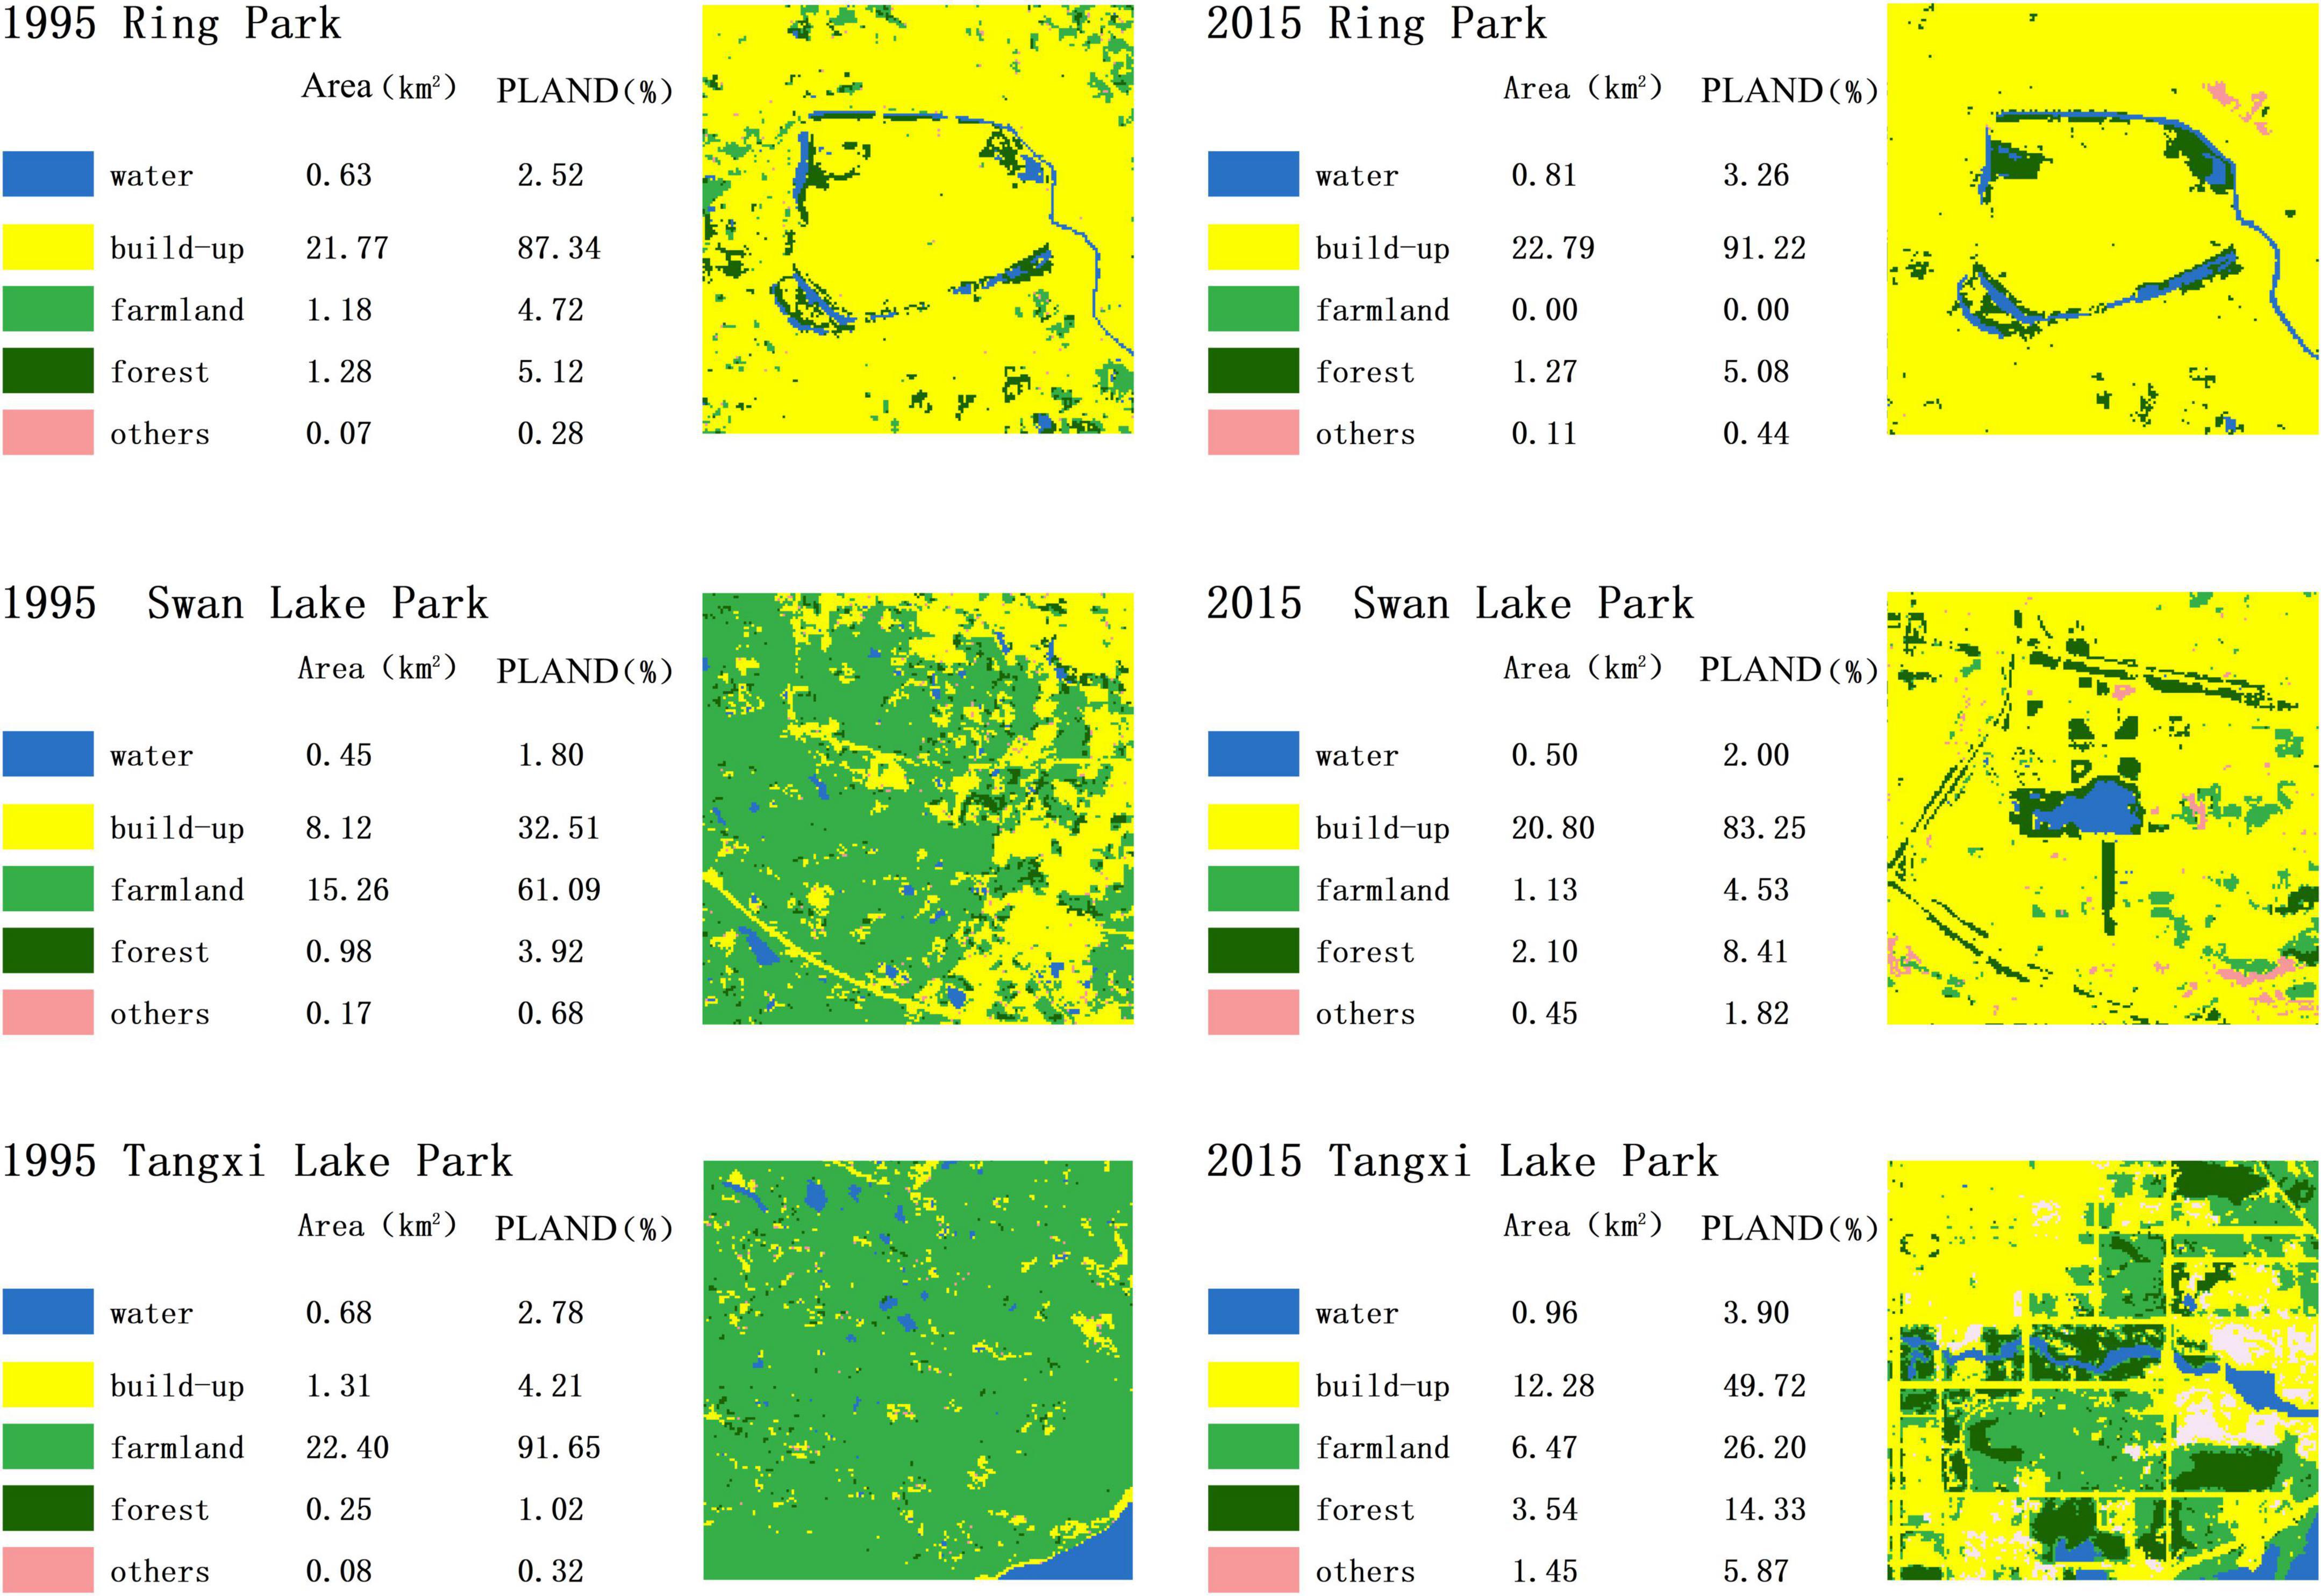
The distribution of land-cover in the three UFZs in 1995 and 2005 is shown in Figure 6. The common characteristics of the three UFZs changes are the transfer-out of farmland and the transfer-in of built-up land, and the newer the region, the more intense the changes.
In the Ring Park area, the increase rate of water is 28.57%. For farmland changed greatly, with the proportion dropped to 0%, and forest slightly reduced by 0.78%, the overall green area decreased by 1.01 km2, with a reduction rate of 32.69%. While the built-up in the Ring Park area increased by 1.02 km2 from 1995 to 2015, with an increase rate of 4.69%. The primary land-use of both Swan Lake Park and Tangxi Lake Park areas was farmland in 1995, with the proportion of 61.09 and 90.61%. But they reduced greatly, and the reduction rate reached 92.60 and 71.12%, respectively. Both water and forest in these two areas increased, with the increase rate of water less than 50% and the increase rate of forest more than 1.5 times. In particular, Tangxi Lake Park area saw a 13-fold increase in forest growth. By 2015, the largest area in these two new development areas had become built-up, which increased by 1.56 times in Swan Lake Park area and 8.37 times in Tangxi Lake Park area.
As UGS decreased, build-up increased. However, in the old district, the increase rate of build-up was only 4.69%, while the decrease rate of UGS was 32.68%, and the decrease of UGS was mainly represented by the decrease of farmland. In the new development areas, the average increase of build-up was nearly as high as 5 times, and the reduction rate of UGS was 65.32%, showing a trend of decreasing farmland and increasing forest. Each site represents an opportunity to explore planning methods to protect the current UGS from future urbanization and landscape change or at least to make changes to the UGS planning with a more robust understanding of the implications across spatiotemporal and landscape pattern analysis to avoid unforeseen negative consequences.
Park-level spatial variations
Spatial distribution of urban parks
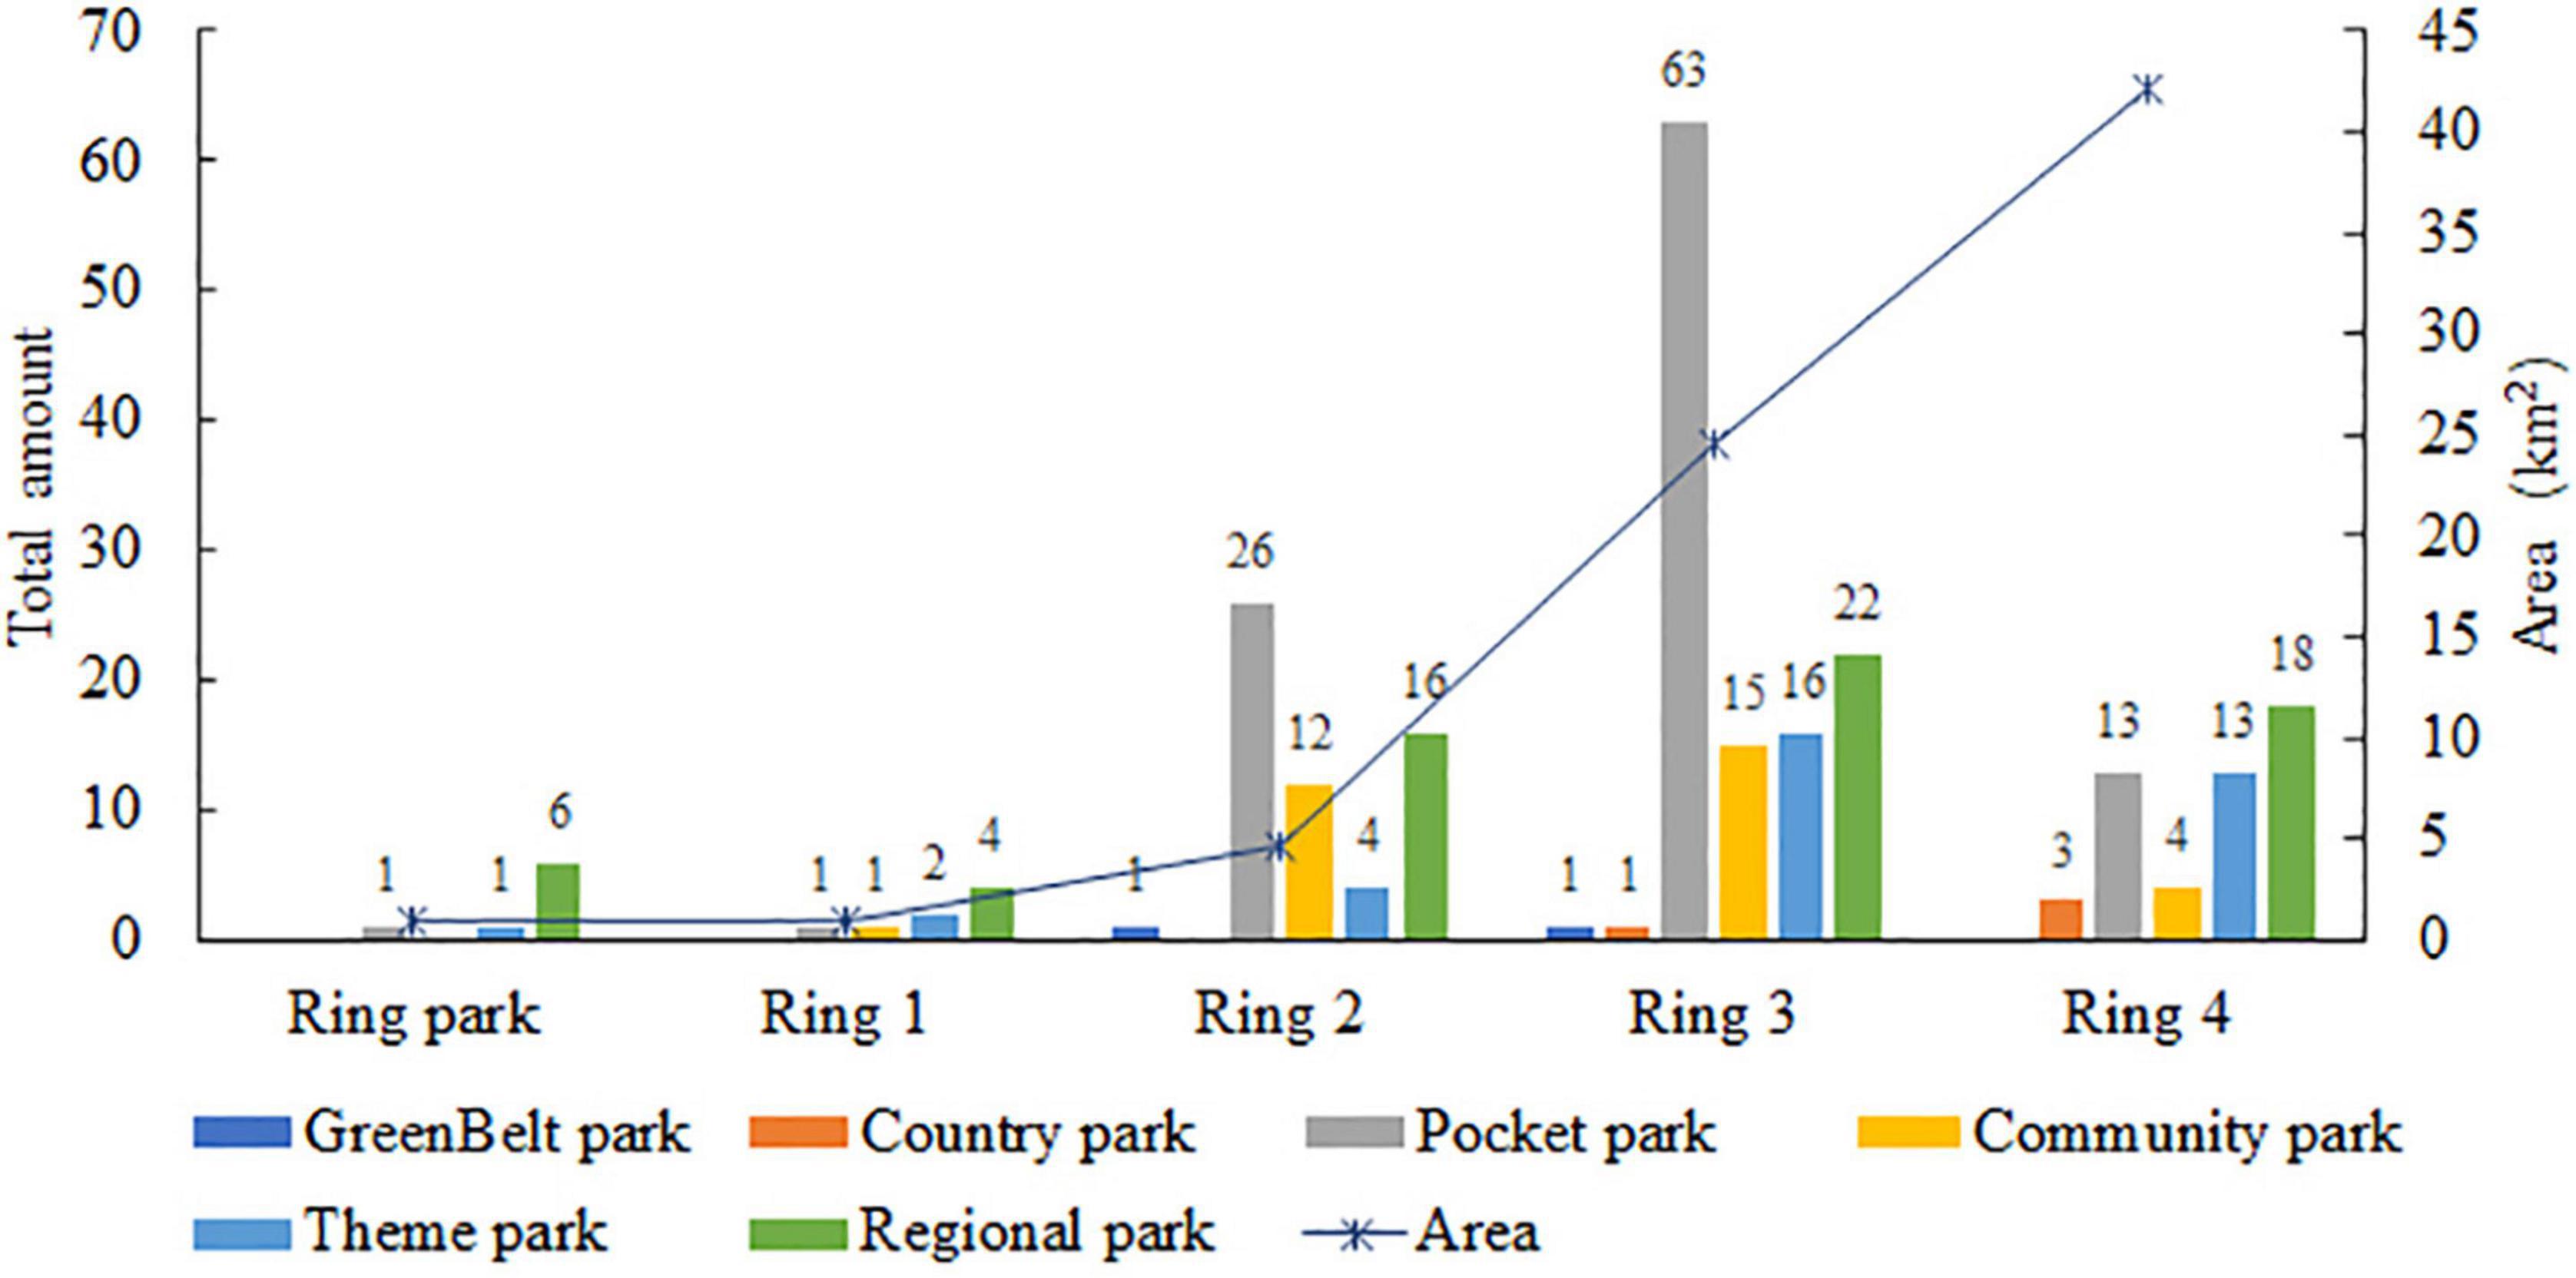
The spatial distribution of the different types of parks is shown in Figure 7A, and the area and number statistics of various parks are shown in Figure 8. The distribution of parks in the central urban area was uneven, and the types of parks in each ring varied significantly. From Ring Park to Ring 4, the number and area of urban parks are increasing. There were 244 parks with a total area of 73.35 km2. The regional park occupies the largest proportion of the area among all types, with a total area of 55.39 km2, accounting for 75.51%. There were 66 parks in total, mainly distributed in Rings 2, 3, and 4, with 16, 22, and 18 parks, respectively. The theme park land covers an area of 10.12 km2 with 36 parks, including 29 parks distributed in Rings 3 and 4. The pocket park is small, only 4.41 km2, but it has the largest number among all types, with a total of 104, and 63 of which are distributed in Ring 3; some are distributed along the road network. The Country park and Community park areas are similar, at 1.83 and 1.37 km2, respectively. However, the Country park area is mainly distributed in Rings 3 and 4. The Community park area is mainly distributed in Rings 2 and 3. The GreenBelt Park land covers an area of only 0.22 km2, with one in Ring 2 and one in Ring 3.
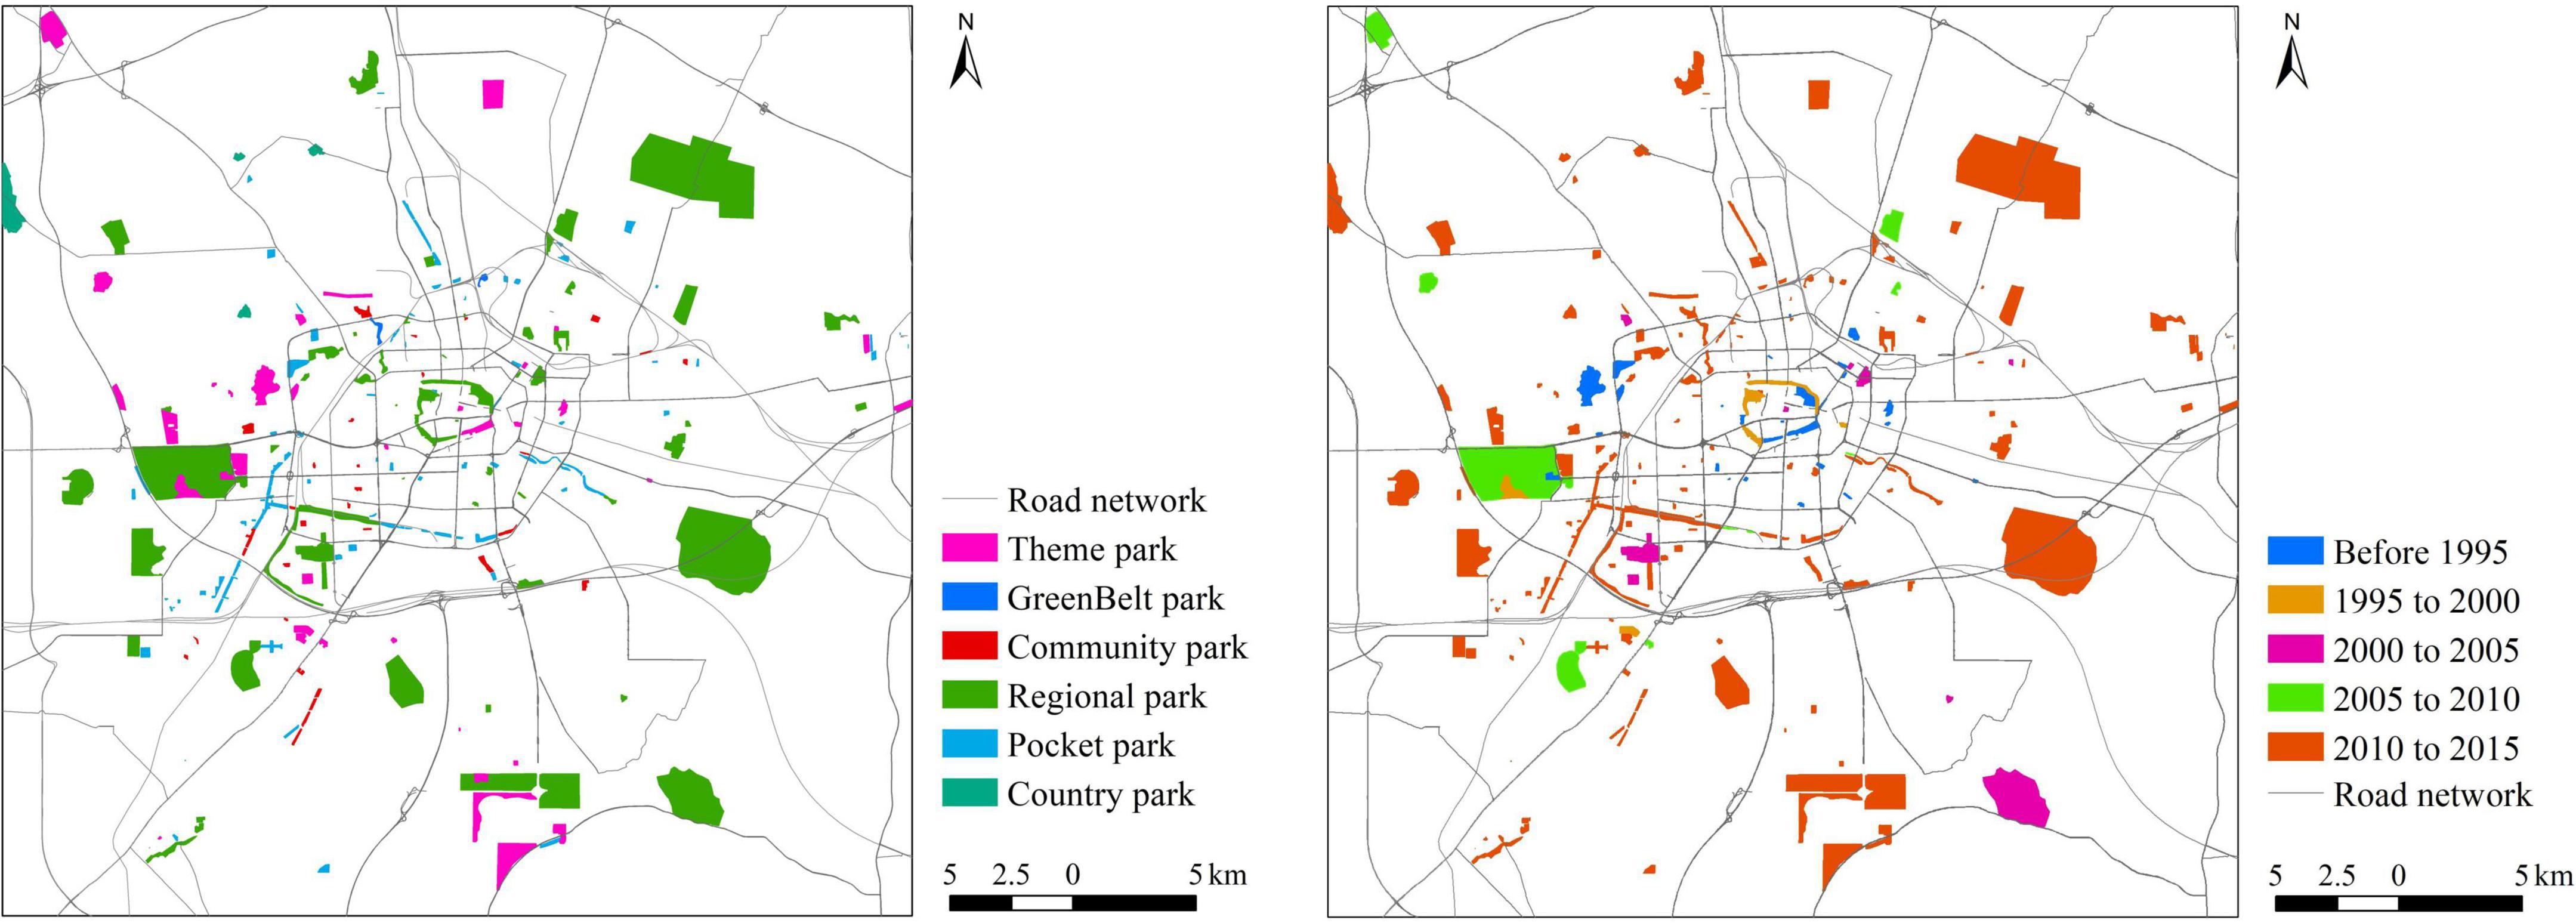
Figure 7. Distribution map of parks: (A) Distribution of various types of parks. (B) Historical distribution of parks.
Historical development of urban parks
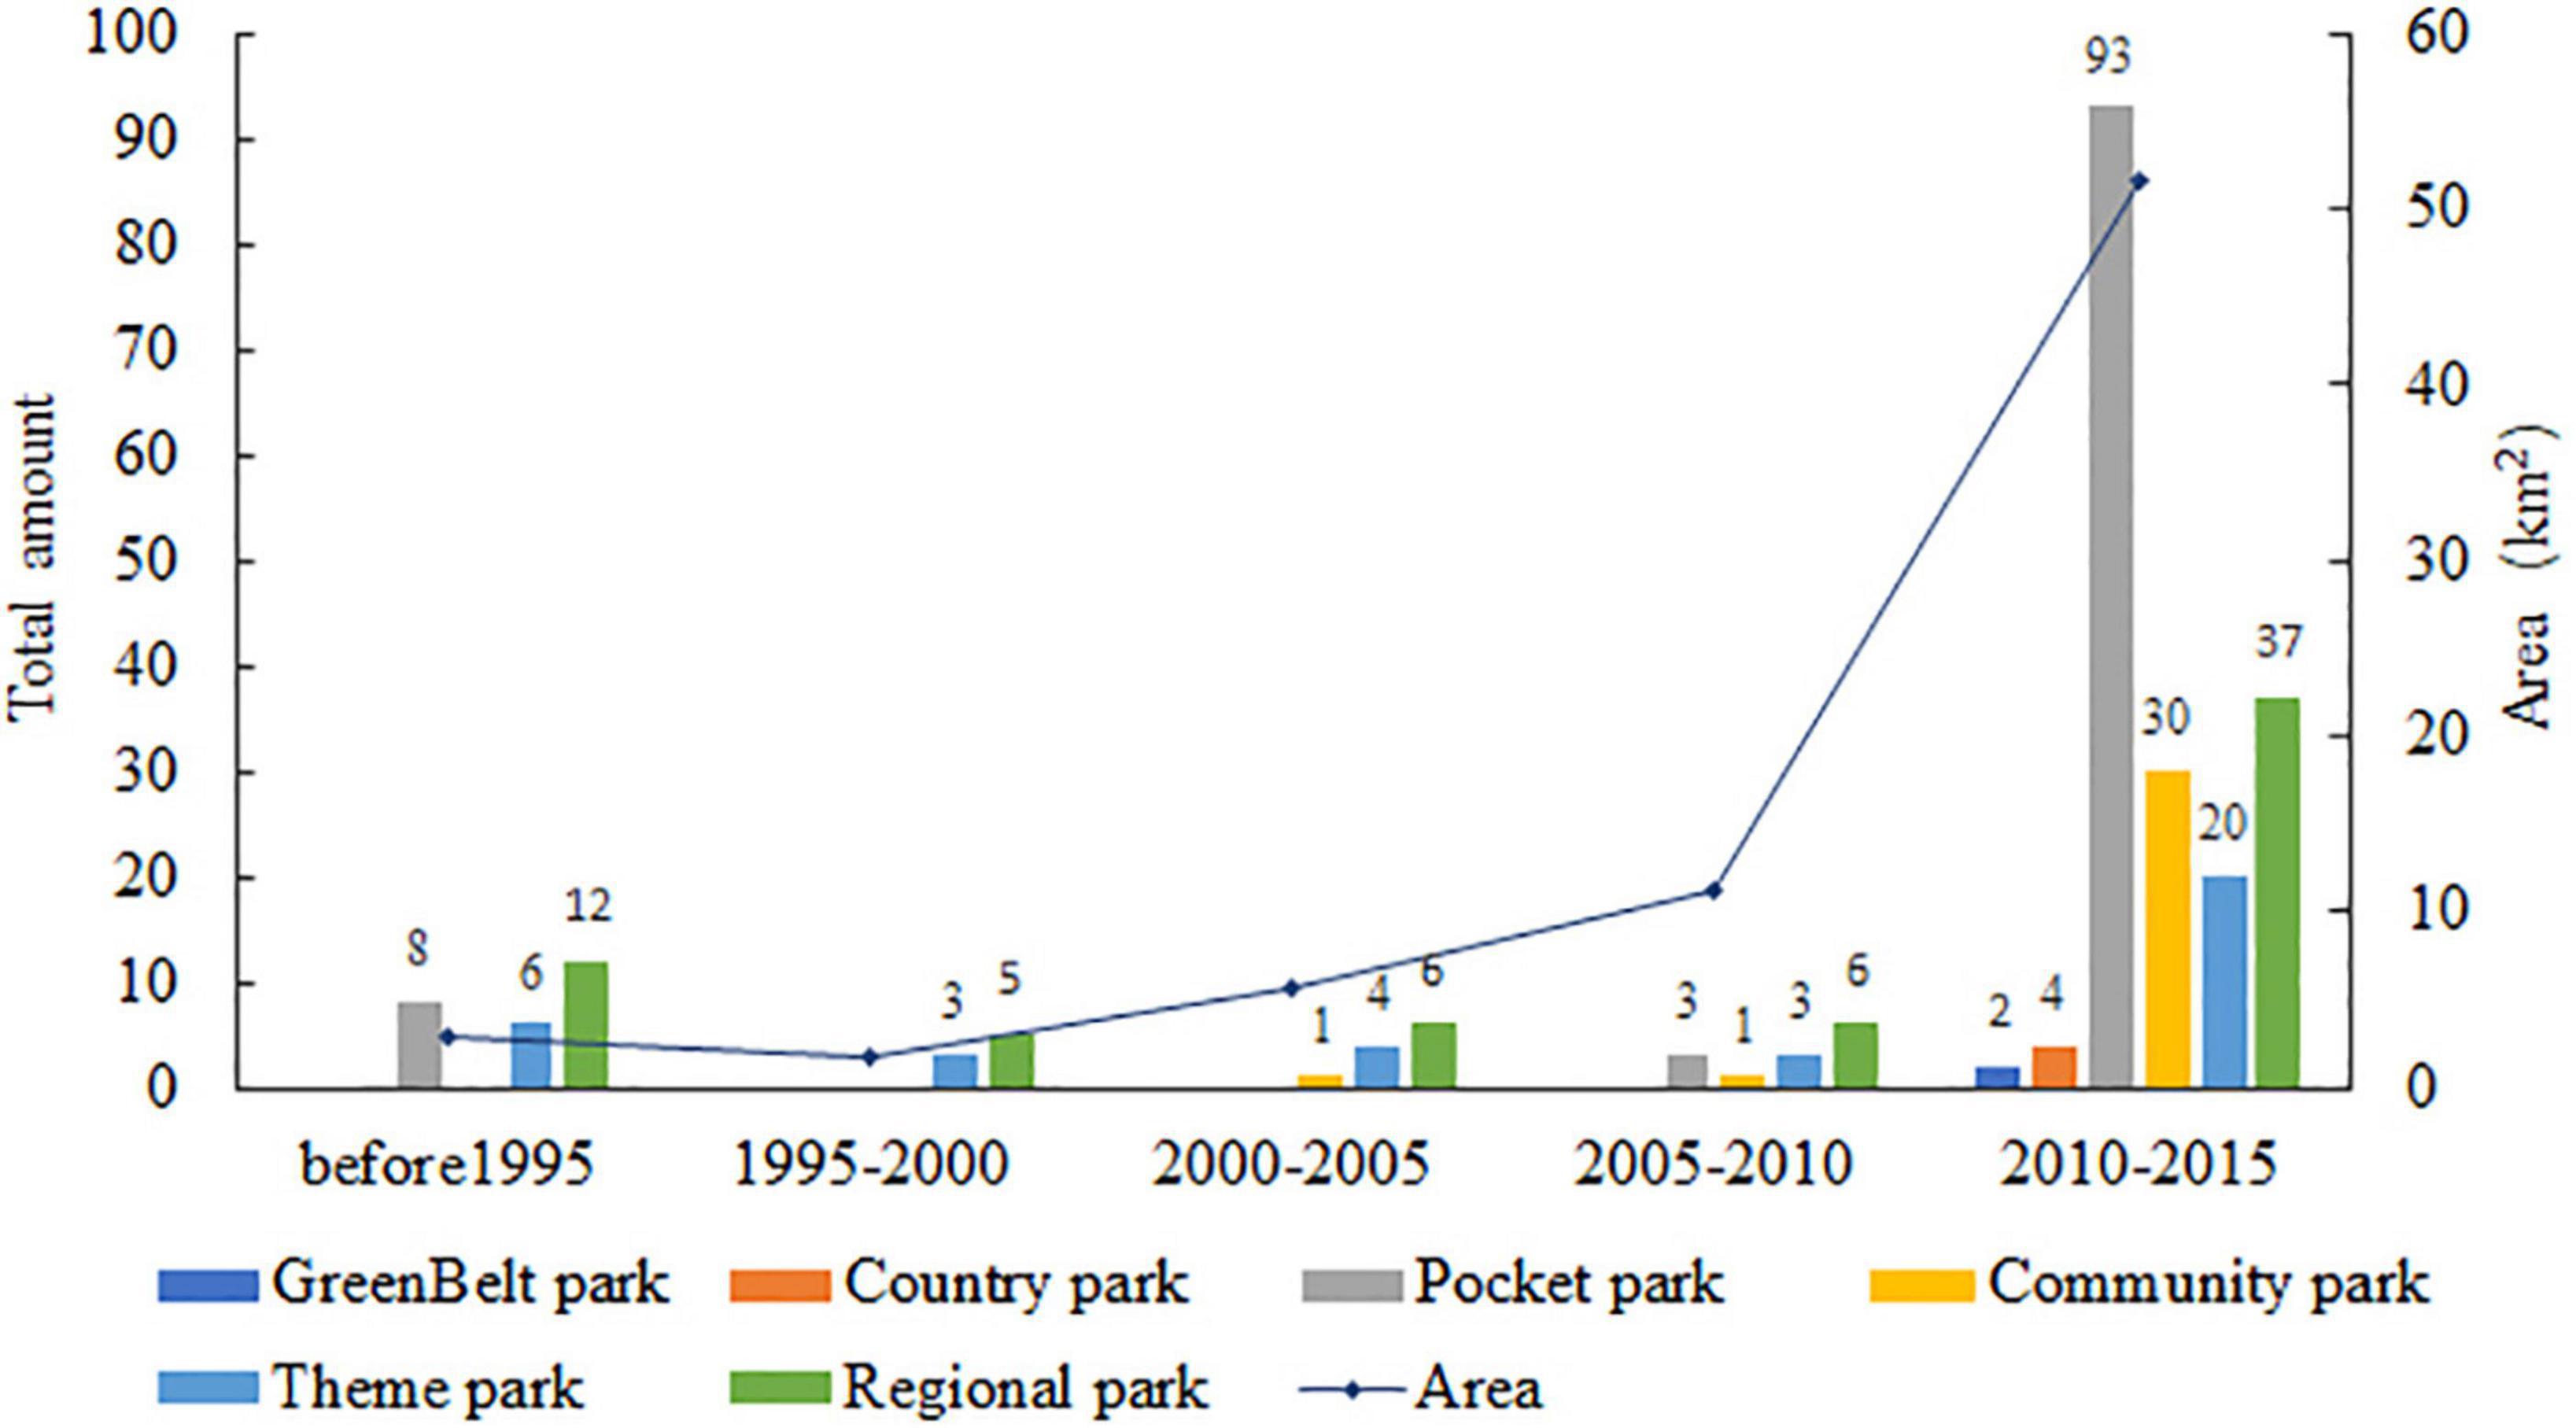
The historical distribution map of parks is shown in Figure 7B, and the construction of different types of parks during different periods of urbanization is shown in Figure 9. With the development of urbanization, park construction in urban areas has shown an upward trend in Hefei. The change in urban parks gradually expanded from the center to the periphery, and the type of park gradually changed from single to rich. Before 1995, the park area was only 2.93 km2, consisting mainly of six theme parks, 12 regional parks, and eight pocket parks, with areas of 1.68, 0.71, and 0.54 km2, respectively. From 1995 to 2015, the construction area and types of parks increased. During 1995–2000 and 2000–2005, the main types of parks increased to seven theme parks and 11 regional parks, with an area of 1.10 and 6.31 km2, respectively. From 2005 to 2010, the types of parks began to diversify, adding four theme parks, six regional parks, three pocket parks, and one community park. From 2010–2015, park construction entered its heyday; a total of 186 parks were added, 93 of which were pocket parks. The total construction area of the urban park was 51.67 km2 from 2010 to 2015, with regional parks accounting for 67.72% of the total area.
Services of urban parks
The service status of urban parks in different rings is shown in Table 3. The proportion of urban park areas is highest in the Ring Park area and lowest in Ring 4, while the other ring areas have similar proportions. The GDP, proportion of residential land, and population density are much higher in the center three ring areas than in the two ring areas; however, the park area per person ratio has the opposite trend, indicating that the area with high residential density lacks parks. Notably, because of the existence of Ring Park in the old downtown area of Hefei, the park area per person value is higher than in the Rings 1 and 2 areas.
Landscape pattern evolution of urban parks
As shown in Figure 10, the 3 km × 3 km fishnet cell analysis of the urban park landscape pattern showed noticeable spatial heterogeneity.
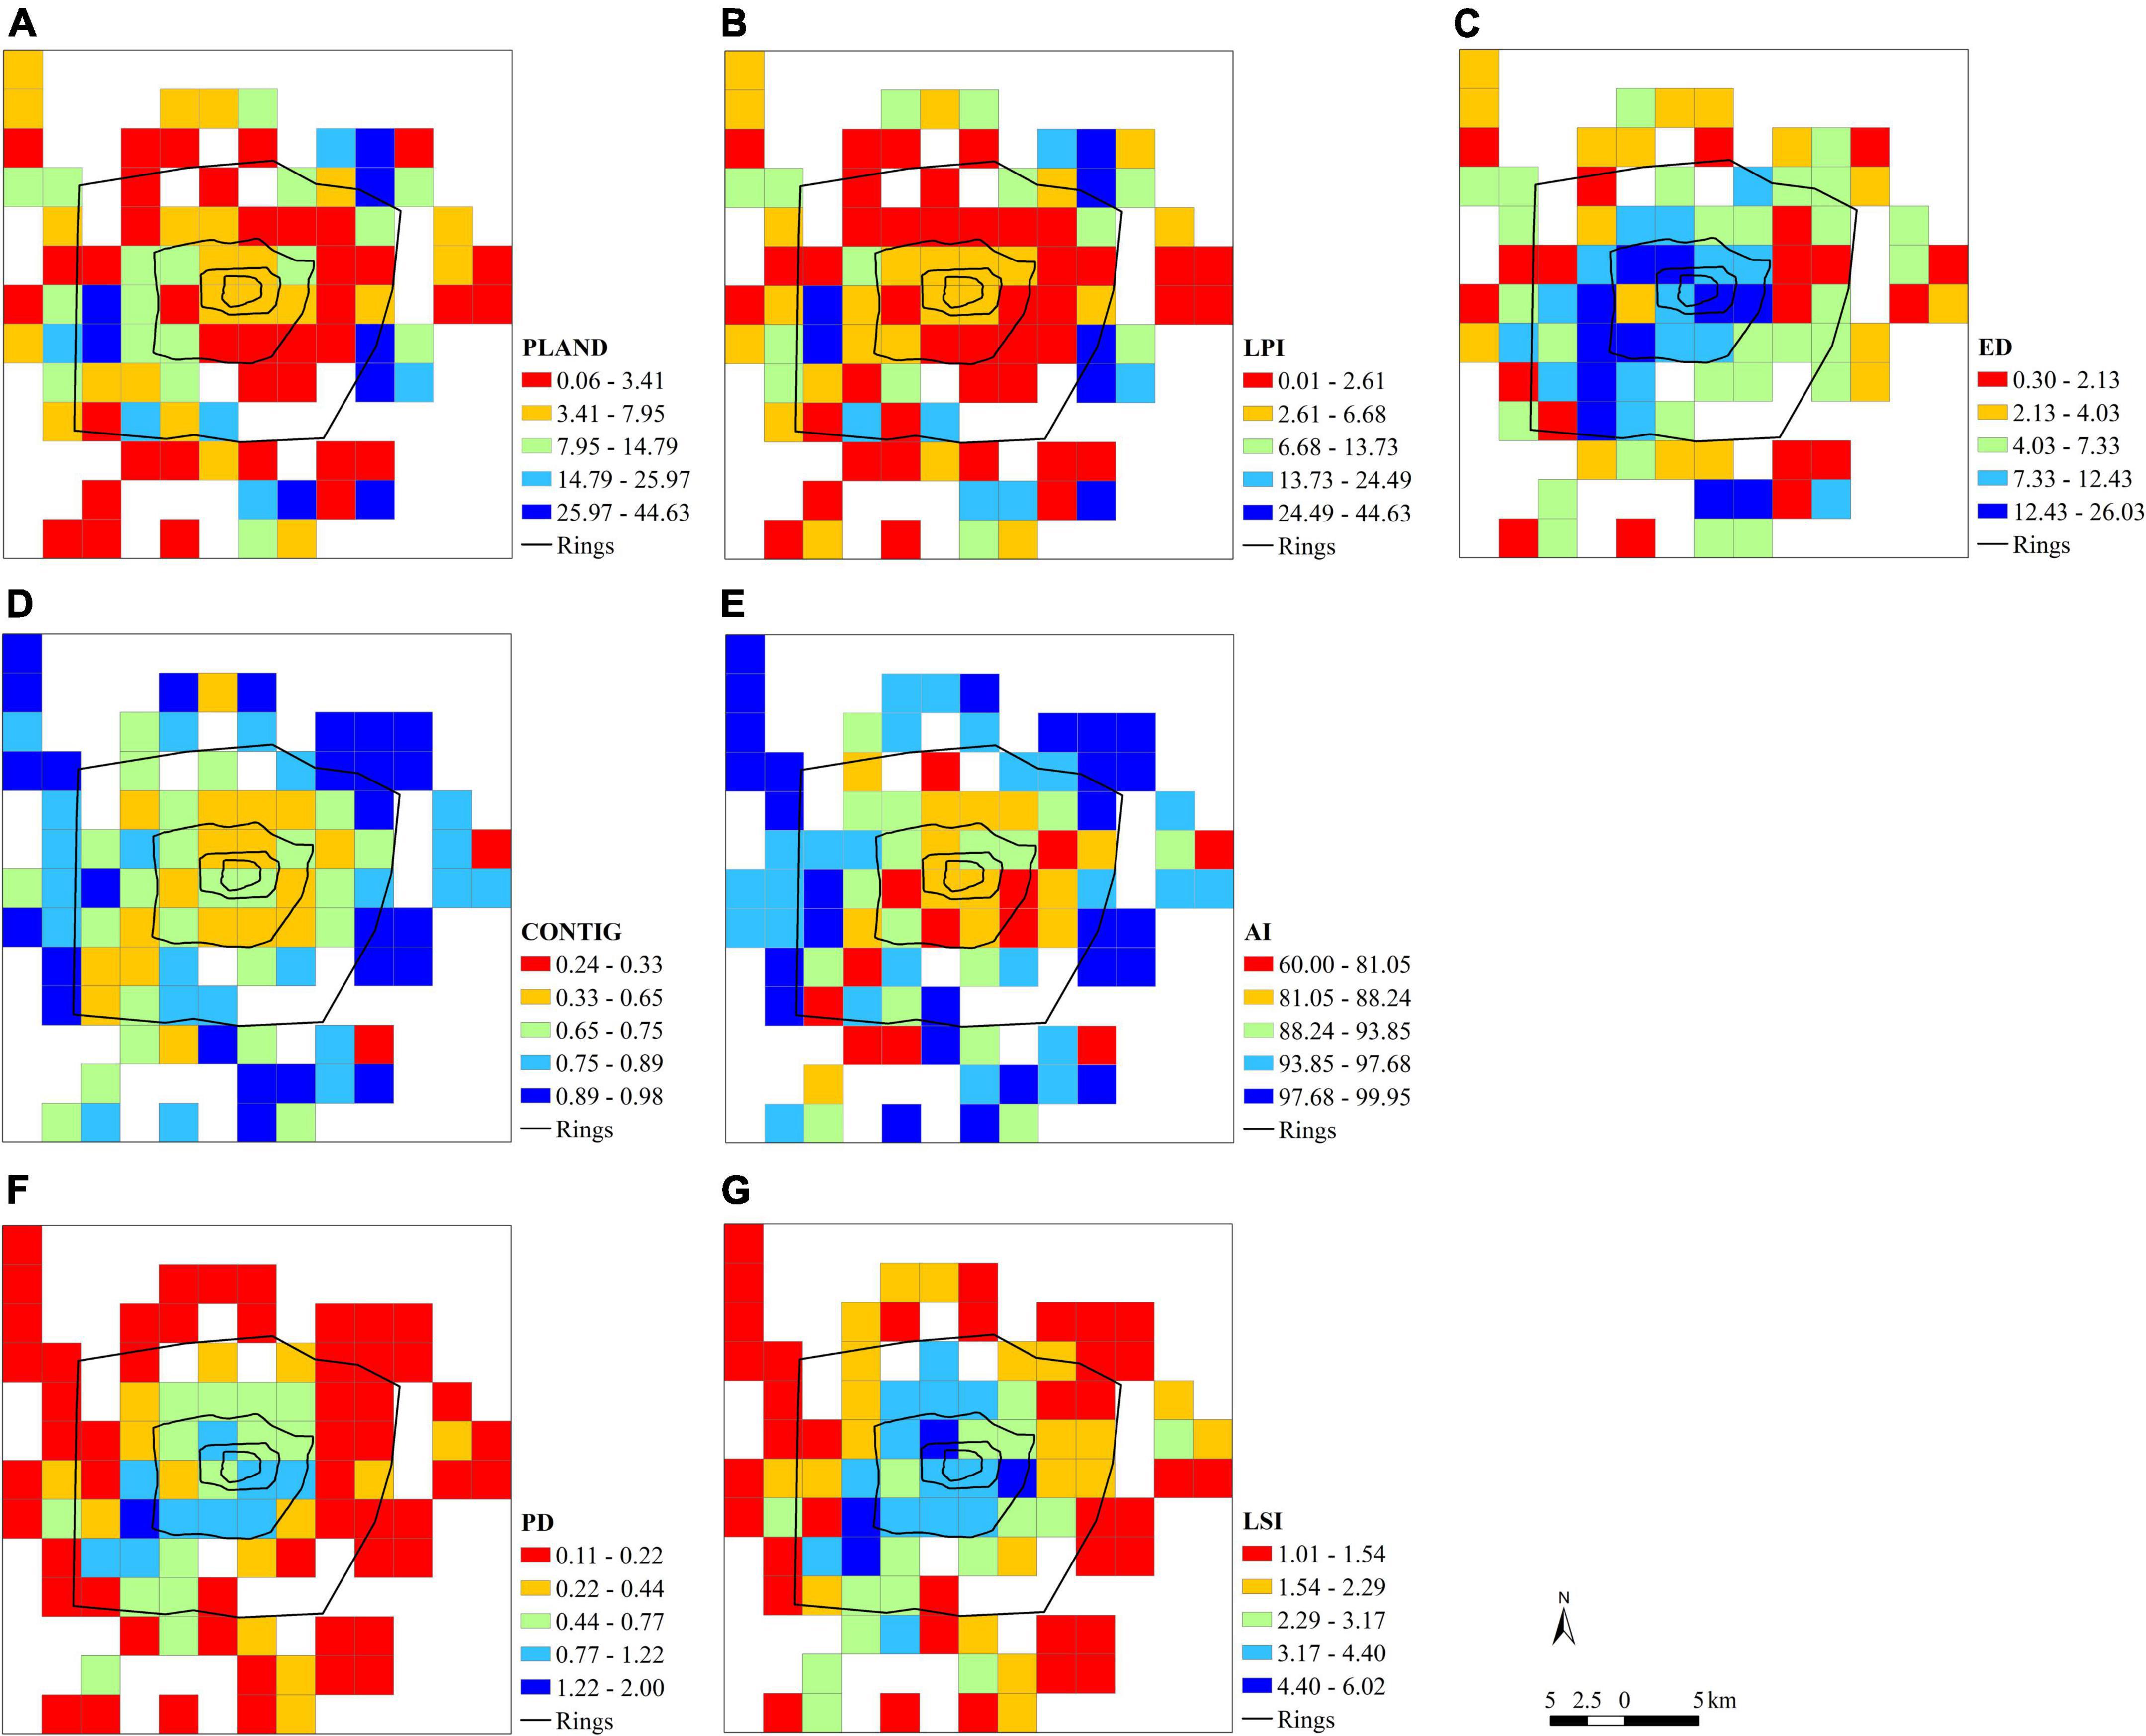
Figure 10. Spatial distribution of parks landscape metrics. (A–G) PLAND, LPI, ED, CONTIG, AI, PD, and LSI, respectively.
For area-edge metrics, the spatial distribution of PLAND and LPI in the inner city is low in the center and high in the periphery, whereas ED is the opposite. The results showed that the proportion of urban parks and the largest patch in the peripheral region were higher than that in the central region, while the park edge length in the central region was higher.
For shape metrics, the spatial distribution of CONTIG in the central area was lower than that in the periphery, while the spatial distribution of LSI was the opposite, indicating that the urban parks in the peripheral area have higher adjacency than those in the central area; moreover, the parks in the central area have higher dispersion than those in the peripheral area. However, we also see that individual peripheral areas have low park adjacency, even lower than central areas.
For aggregation metrics, the spatial distribution of PD is high in the center area and low in the periphery, whereas the spatial distribution of AI is the opposite. This indicates that the distribution of urban parks in the central area is relatively fragmented, whereas that in the peripheral area is relatively aggregated.
Discussion
Knowledge of the spatiotemporal dynamics of green space in a city provides essential information for fostering an appropriate balance between urban development and environmental protection and helps improve urban greening and planning. Applications at different scales are discussed separately as follows:
Applications for green space planning at the city-level
Similar to many other large cities around the world reported in previous studies (Li et al., 2013, 2019; Liu et al., 2016), urbanization increased the fragmentation and configurational complexity of the urban landscape in Hefei. The analysis of landscape dynamics and the transition matrix from the Greater Hefei city perspective can be described as a classic land-use change from agriculture to built-up land, which has been discussed in other research papers on Hefei (Zhang et al., 2013; Liu et al., 2019; Li et al., 2020). Although the “Basic Farmland Protection Policy” is a national policy to implement strict measures to protect farmland, given urban development trends in Hefei, several new development areas will appear in the next 5–10 years (Hefei Natural Resources and Planning Bureau, 2022), the pattern of loss and fragmentation of green space, particularly in agricultural areas, is perhaps inevitable and unstoppable. To meet the demand for construction land and protect regional ecosystem services, it is better to implement a more effective protection of green spaces. Meanwhile, from the perspective of urban socio-economic development, the areas where farmland already has serious fragmentation and is surrounded by land-use change may be allowed to convert to built-up land or other land-uses. Thus, “one size fits all” approach to develop and manage green spaces is unlikely to work.
Hence, it is urgent to identify hotspots of disappeared green spaces and unstable areas for the sustained development of the city. For example, to prevent the fragmentation of green space, it is important to explore large and connected green patches and provide planning guidance regarding specific locations to protect them from land-use change. To seek more opportunities to build ecological green corridors within a certain range (e.g., 200–1,000 m) from rivers and greenways, such as the Nanfeihe Ecological Corridor and Jianghuai Watershed Forest Corridor, connecting UGS with hills, scenic spots, and wetlands.
For a long time, green space planning existed as an attachment plan for China’s urban planning work, meaning that green space planning has not been merged sufficiently into the current urban planning system and is influenced by green space planning implementation in the city. Taking only some indicators such as per capita public green areas and urban greening coverage cannot reflect the real situation of the green space and is difficult to fulfill in the process of UGS construction.
Finally, UGS planning must set up reasonable goals between urban development and natural environment protection, establish the optimal integration of city layout and natural landscapes, and make wise use of existing natural factors, such as forests, rivers, hills, lakes, and open spaces, to create a better living environment.
Applications for green space planning at the inner-city level
In the past few decades, inner cities have undergone extremely rapid urbanization with population explosions and economic growth in many large cities in China; the same happened in Hefei.
At the inner-city scale, the total percentage of UGS changes in Hefei revealed a significant decline in green space from 1995 to 2015, implying a limited supply of land for UGS development in the future. These findings are similar to those of other compact cities (Xu et al., 2011; Ye et al., 2018; Sun et al., 2019; Liu et al., 2021) facing the same problems of dense urban construction, human activities, and limited area for green space development.
This study demonstrated that concentric analysis is a useful method for characterizing the spatiotemporal variations of UGS (Zhou and Wang, 2011), helping us determine that the ring method has become an important restricted boundary for city development. Over the last 20 years, Hefei has changed from fan-shaped urban patterns to concentric-zone urban land-use patterns in the Hefei metropolitan region.
At the UFZs, the overall percentage of green space in the old site was much lower than that in the new development area, implying that new districts have a greater advantage in green space development.
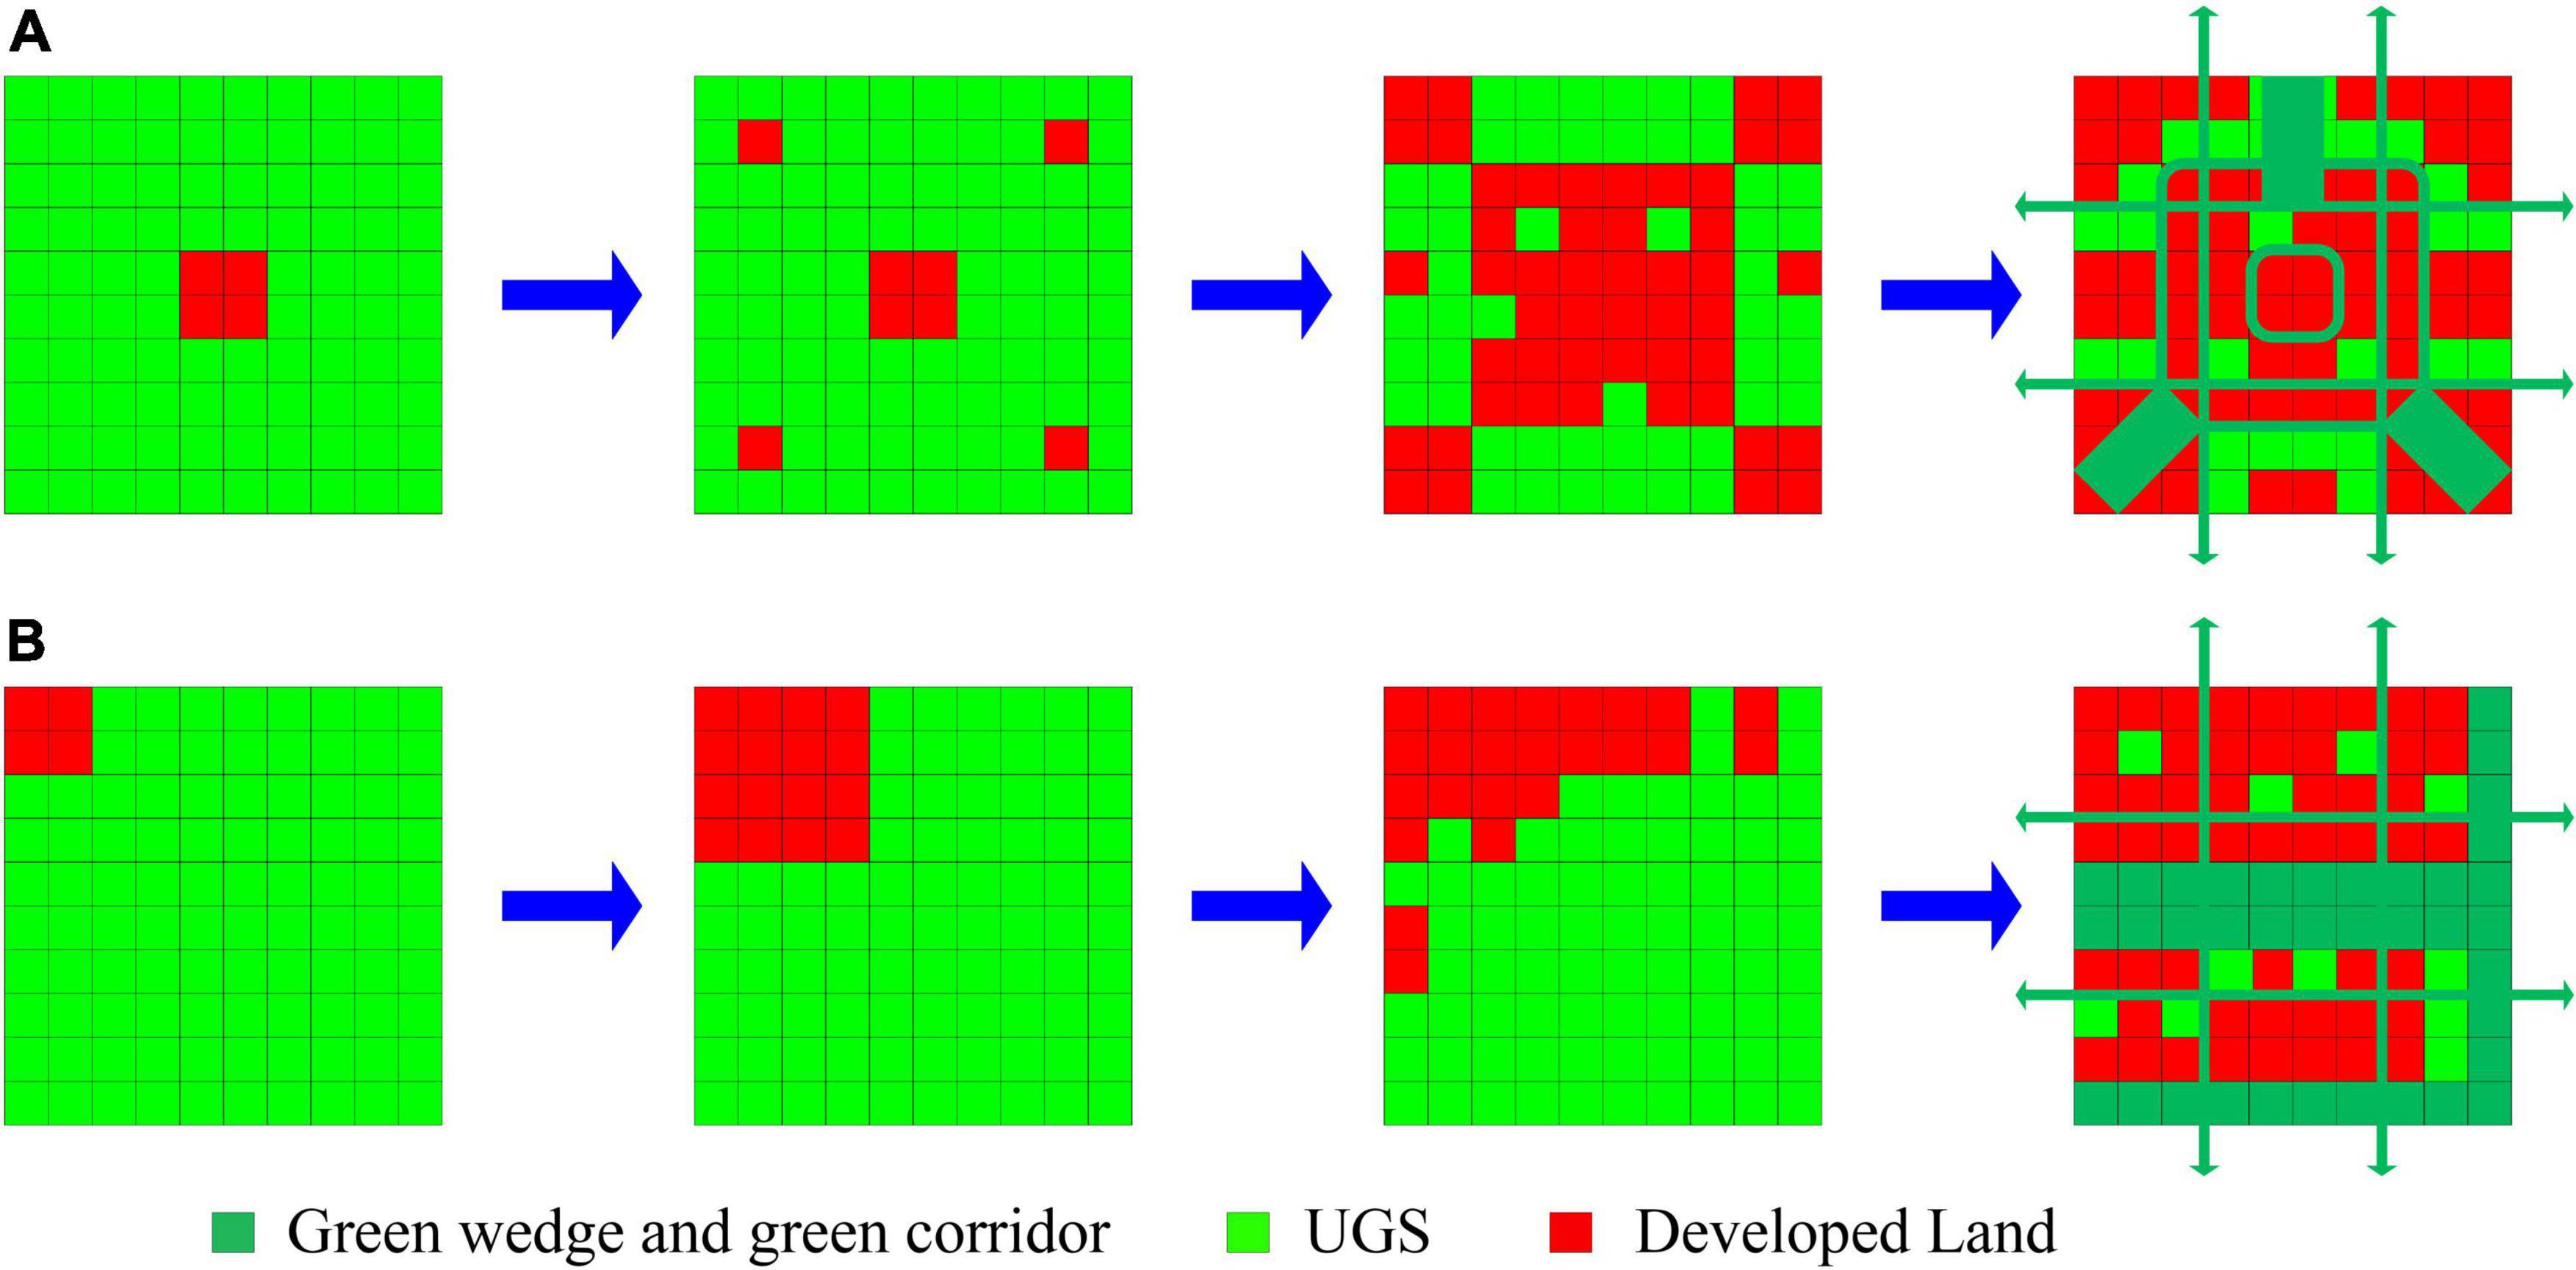
Different developmental activities have significant effects on the evolution of UGS (Figure 11). In the old urban area, with limited land, dense construction, and population, uneven UGS distribution is often the result, and green space can only be incorporated into suitable gaps within the constructed land. Sufficient use of corner and vacant land and other leftover land to develop small patches of UGS should be emphasized. At the same time, the protection of large patches with high connectivity is also significant.
The impact on the urban ecology should also be highlighted. Additionally, UGS needs to be increased through urban renewal to construct a multivariate functional green space system, develop a three-dimensional space implementation technical innovation such as roof and vertical greening to reduce the unevenness of the UGS configuration, and increase the vitality of UGS. Fragmented habitats lead to serious ecological problems; thus, protecting larger patches is important for protecting biological diversity (Miller et al., 2015; Yang et al., 2022). New developing areas play an important role in protecting large green patches. The planning of new development areas needs to first consider the principle of ecological priority and ensure the spatial distribution and quality of UGS, which has also been emphasized in other research on China’s new urban land development (Long et al., 2014; He et al., 2022). However, both government and urban planners embrace the importance of implementing proper spatial patterns of UGS, and transformation to a “city in the forest” may be realized.
Applications for green space planning at the park level
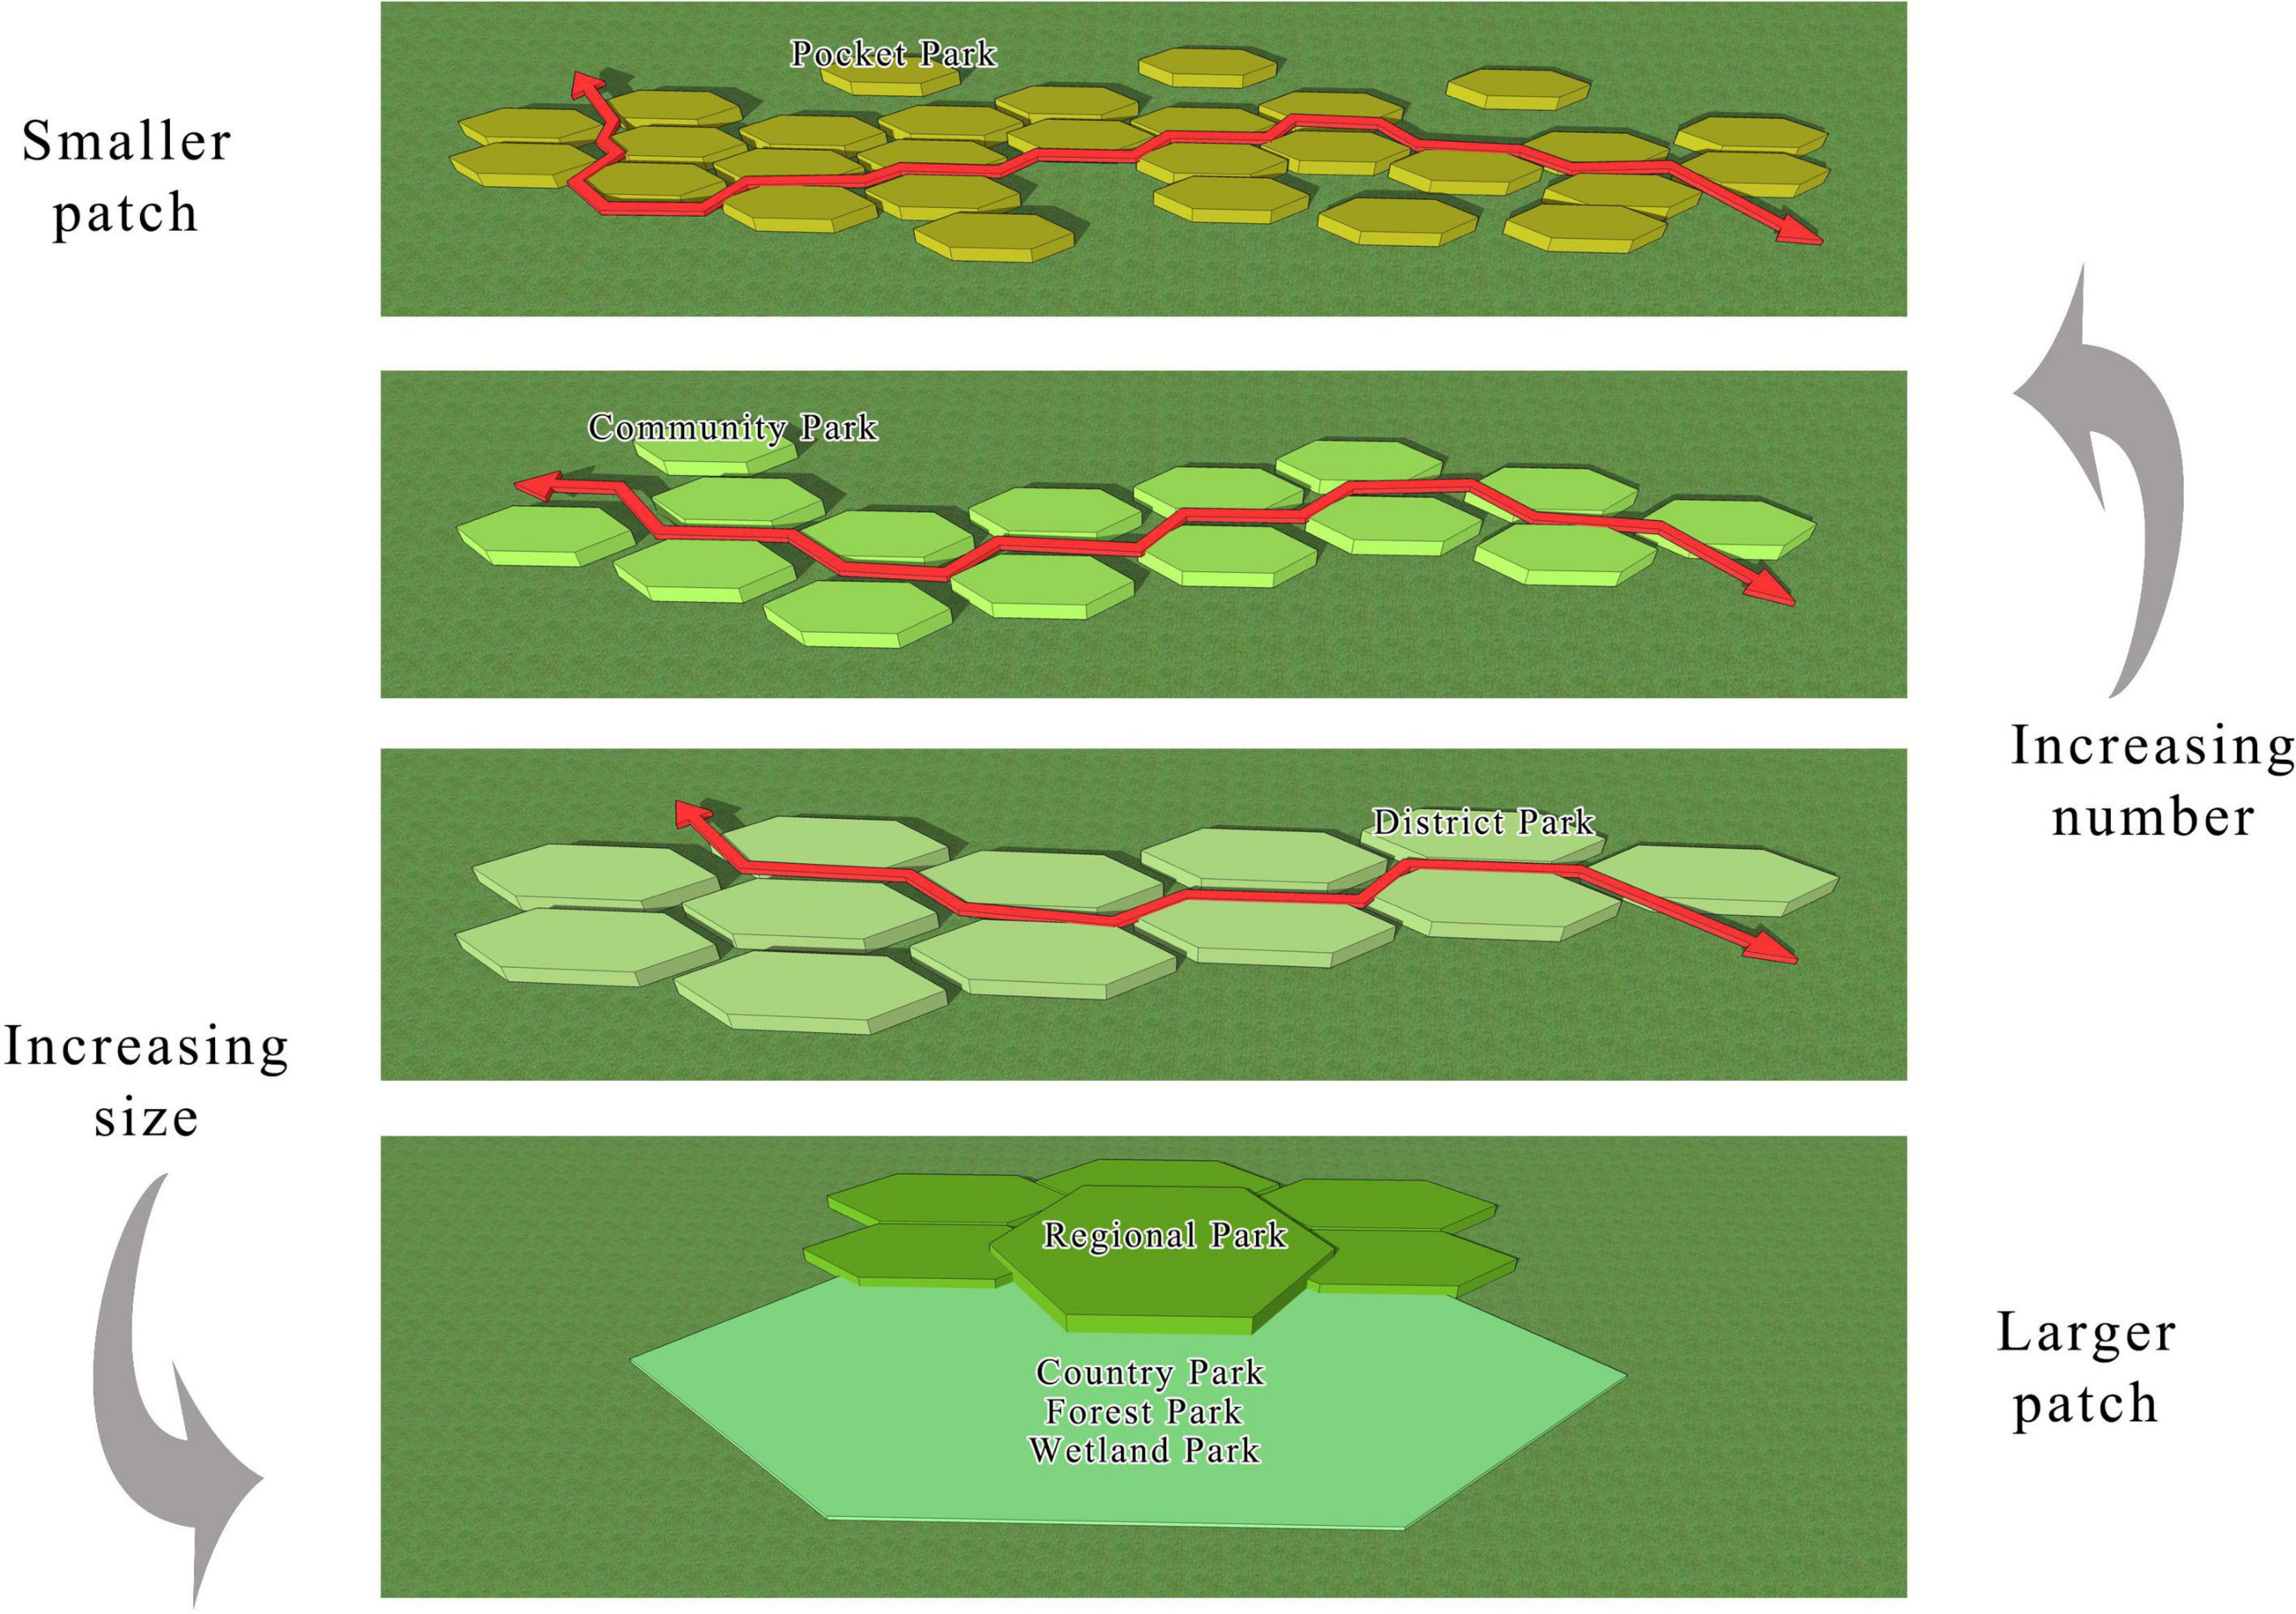
Urban parks provide a wide range of advantages to enhance the wellbeing of residents, such as mental and physical health and social benefits (Ullah et al., 2020). Therefore, understanding the spatiotemporal patterns of urban parks is beneficial for improving urban park planning and management. The evolution trends of the park system are summarized in Figure 12. Increasing the size of parks could help enhance biological diversity, mitigate heat islands, and provide wildlife habitats (Yang et al., 2021). However, there were only three parks in the study area that exceeded 5 km2. In the future, the construction of large patches such as country parks, wetland parks, and forestry parks will be difficult because of limited land resources. It is important to reserve large amounts of ecological land from a long-term plan. On the other hand, increasing the number of small patches of community and pocket parks could provide more opportunities for people to contact nature and improve the livability of cities at the local scale (Li et al., 2015; Wu et al., 2021). Furthermore, small parks play an important role in providing various ecosystem services comparable to large green spaces (Strohbach et al., 2013; Peschardt et al., 2016; AmayaEspinel et al., 2019).
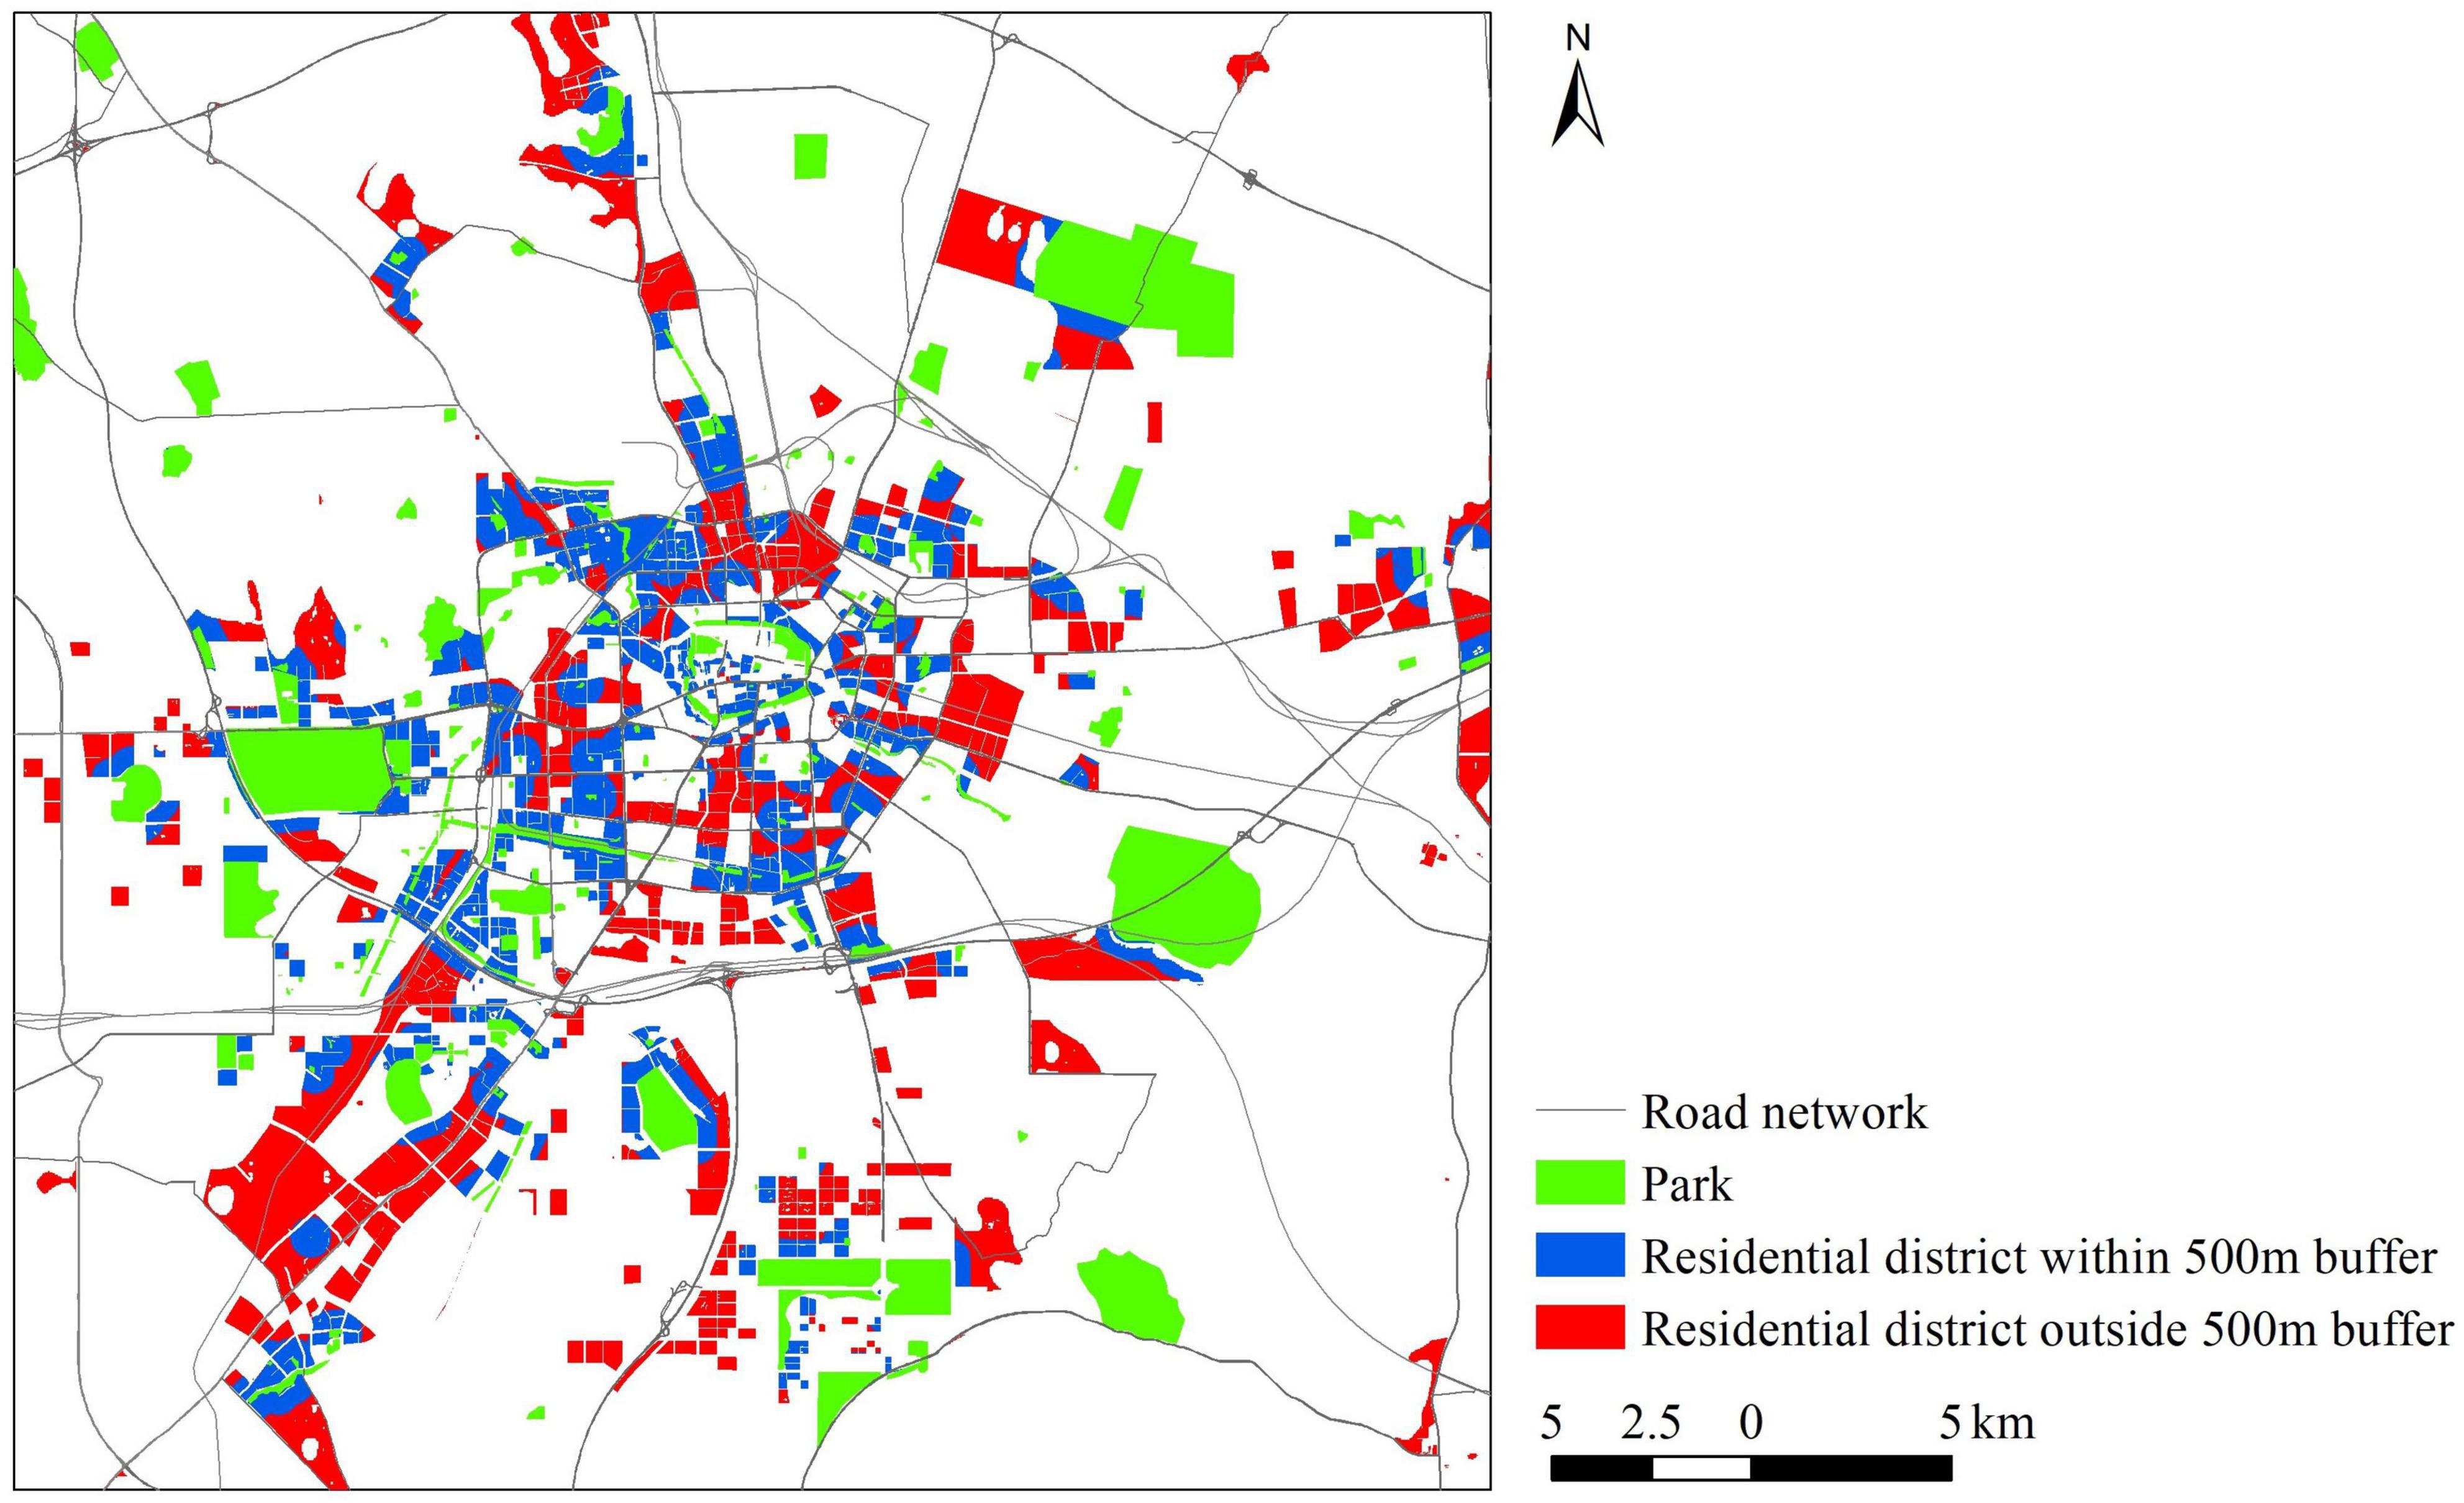
Although the quality of UGS in Hefei significantly improved from 1995 to 2015, the spatial allocation of UGS needs to be further optimized. First, in the old downtown area, except for the ring park, there were very few parks on the first-ring roads. Considering the limited land resources in such areas, it is necessary to develop pocket parks at the corners, between blocks, and in pedestrian areas. In the process of urban renewal, more vacant lands and some villages in the urban area should first be considered for conversion to parks. Second, the new development area needs to consider the quantity, spatial distribution, and quality of UGS. For example, it is important to maintain large green patches, creating the park as large as possible, while maintaining connections with the natural area to maximize ecological benefits. Thus, the number of community parks is insufficient to meet the daily needs of residents. China government has set the target of “seeing the green area in 300 meters, and seeing the parks in 500 m.” However, based on the 500-m buffer analysis (Figure 13), there is only 44.74% of the residential area in the 500-m buffer of the parks. Thus, there is still a long way to go to achieve this goal in Hefei City. During the COVID-19 pandemic, restrictions on movement, social gatherings, and the closure of indoor recreational places resulted in a higher demand for urban parks and outdoor green spaces, especially community parks and pocket parks (Geng et al., 2021). Thus, it is important to reasonably increase small-sized parks to improve the future living environments of urban areas.
The results from different scales of green space spatiotemporal dynamics showed that each stratum has a different development law, and the overall management plan has the advantage of integrating these strata through the allocation of resources for planning and management. The planning of UGS at each scale should take place in two time horizons: short and long term. Long-term planning is the establishment of overall goals and objectives for the development of UGS, and short-term planning focuses on current planning issues. Feedback from short-term planning and management of UGS will also affect long-term planning. Notably, plant diversity and spatiotemporal changes in the city are an important part of the short-term planning of UGS and should be given more attention in future studies.
Conclusion
In this paper, the spatiotemporal dynamics of green spaces are discussed at three spatial scales; we arrived at the following conclusions:
At the city level, the land-cover pattern of Hefei City has changed significantly over the past 20 years, largely because of rapid urbanization. The green space losses in Hefei occurred mainly in areas around existing urban areas and along the transportation corridors, similar to the classic concentric zone urban development phenomenon of spreading out the newly developed urban area from the fringe of existing urban areas to outside peri-urban areas in other cities in China during the recent decade (Shi et al., 2012; Zhang et al., 2019).
At the inner-outer ring level, the main characteristics of land-use change are transfer-out of farmland and the transfer-in of built-up areas. The percentage of green space decreased from the city core to the edge, and the subtypes of green space presented different changes in various ring roads. The dynamic changes were the most significant in Rings 2 and 3. The green space area in the old downtown area was much lower than that in the new districts. The results demonstrate the usefulness of concentric analyses in characterizing landscape variation in concentric development from cities. The quantification of the spatial variation of green space patterns and the understanding of the different function zone landscape changes over time are essential for guiding future urban greening planning to ensure a sustainable green city.
At the park level, the distribution of parks in urban areas is uneven, and the types of parks in each ring vary significantly. From the perspective of urban development in space and time, the area of park construction shows an upward trend with urbanization. The change in urban parks gradually expanded from the center to the periphery, and the type of park gradually changed from single to rich. However, there are significant differences in the park and residential areas in different rings and noticeable spatial heterogeneity in the landscape patterns of urban parks. Urbanization and related policies are the main factors that influence the spatiotemporal dynamics of urban parks.
These results highlight that green space patterns are influenced by different spatial scales and urbanization stages. From the perspective of the temporal and spatial evolution of green spaces, this paper puts forward some suggestions for building Hefei as an ecological city with harmony between humans and nature, offering insights for other cities that have experienced rapid expansion similar to Hefei.
Data availability statement
The raw data supporting the conclusions of this article will be made available by the authors, without undue reservation.
Author contributions
Y-YL: conceptualization, writing, data processing and analysis, review and editing, and funding acquisition. B-TR: data collection and curation. Y-SC and L-CH: methodology and conceptualization. C-GS: writing, methodology, statistical analysis, visualization, review and editing, and funding acquisition. All authors contributed to the article and approved the submitted version.
Funding
This research was funded by the National Nature Science Foundation of China (41901347 and 32071831), the Natural Science Foundation of Colleges and Universities in Anhui Province (KJ2019A0199), the Humanities and Social Sciences Research Project for Youth Scholars of the Ministry of Education (Research on the Evolution Mechanism and Restoration Path of Urban Green Space from the Perspective of Territorial Ecological Restoration), and the Guangdong Basic and Applied Basic Research Foundation (2020A1515010562).
Conflict of Interest
C-GS was employed by the company Technology Innovation Co., Ltd.
The remaining authors declare that the research was conducted in the absence of any commercial or financial relationships that could be construed as a potential conflict of interest.
Publisher’s note
All claims expressed in this article are solely those of the authors and do not necessarily represent those of their affiliated organizations, or those of the publisher, the editors and the reviewers. Any product that may be evaluated in this article, or claim that may be made by its manufacturer, is not guaranteed or endorsed by the publisher.
Footnotes
References
AmayaEspinel, J. D., Hostetler, M., Henríquez, C., and Bonacic, C. (2019). The influence of building density on Neotropical bird communities found in small urban parks. Landsc. Urban Plan. 190:103578. doi: 10.1016/j.landurbplan.2019.05.009
Byomkesh, T., Nakagoshi, N., and Dewan, A. M. (2012). Urbanization and green space dynamics in Greater Dhaka Bangladesh. Landsc. Ecol. Eng. 8, 45–58. doi: 10.1007/s11355-010-0147-7
Chang, Q., Liu, X., Wu, J., and He, P. (2015). MSPA-based urban green infrastructure planning and management approach for urban sustainability: Case study of Longgang in China. J. Urban Plan. Dev. 141:A5014006. doi: 10.1061/(ASCE)UP.1943-5444.0000247
Chen, C., Bi, L., and Zhu, K. (2021). Study on Spatial-Temporal Change of Urban Green Space in Yangtze River Economic Belt and Its Driving Mechanism. Int. J. Environ. Res. Public Health 18:12498. doi: 10.3390/ijerph182312498
Chen, M., Gong, Y., Lu, D., and Ye, C. (2019). Build a people-oriented urbanization: China’s new-type urbanization dream and Anhui model. Land Use Pol. 80, 1–9. doi: 10.1016/j.landusepol.2018.09.031
Chi, W., Jia, J., Pan, T., Jin, L., and Bai, X. (2020). Multi-Scale Analysis of Green Space for Human Settlement Sustainability in Urban Areas of the Inner Mongolia Plateau. Chin. Sustainability 12:6783. doi: 10.3390/su12176783
Da, A., Mmjb, C., Ar, B., Ra, D., Dsas, D., and Ik, D. (2020). Re-framing urban green spaces planning for flood protection through socio-ecological resilience in Bandung City Indonesia. Cities 101:102710. doi: 10.1016/j.cities.2020.102710
Ehbrecht, M., Schall, P., Ammer, C., Fischer, M., and Seidel, D. (2019). Effects of structural heterogeneity on the diurnal temperature range in temperate forest ecosystems. For. Ecol. Manage. 432, 860–867. doi: 10.1016/j.foreco.2018.10.008
Ehrenfeld, J. G. (2000). Evaluating wetlands within an urban context. Urban Ecosyst. 4, 69–85. doi: 10.1023/A:1009543920370
Escobedo, F. J., Kroeger, T., and Wagner, J. E. (2011). Urban forests and pollution mitigation: Analyzing ecosystem services and disservices. Environ. Pollut. 159, 2078–2087. doi: 10.1016/j.envpol.2011.01.010
Fan, Y., Zhu, X., He, Z., Zhang, S., Gao, J., Chen, F., et al. (2017). Urban expansion assessment in Huaihe River Basin, China, from 1998 to 2013 using remote sensing data. J. Sens. 2017:92812 doi: 10.1155/2017/9281201
Fineschi, S., and Loreto, F. (2020). A Survey of Multiple Interactions Between Plants and the Urban Environment. Front. For. Glob. Change 3:30. doi: 10.3389/ffgc.2020.00030
Geng, D. C., Innes, J., Wu, W., and Wang, G. (2021). Impacts of COVID-19 pandemic on urban park visitation: A global analysis. J. For. Res. 32, 553–567. doi: 10.1007/s11676-020-01249-w
Guan, D., Li, H., Inohae, T., Su, W., and Hokao, K. (2011). Modeling urban land use change by the integration of cellular automaton and Markov mode. Ecol. Model. 222, 3761–3772. doi: 10.1016/j.ecolmodel.2011.09.009
Haaland, C., and van den Bosch, C. K. (2015). Challenges and strategies for urban green-space planning in cities undergoing densification: A review. Urban For. Urban Green. 14, 760–771. doi: 10.1016/j.ufug.2015.07.009
He, B., Huang, D., Kong, B., Liu, K., Zhou, C., Sun, L., et al. (2022). Spatial Variations in Vegetation Greening in 439 Chinese Cities From 2001 to 2020 Based on Moderate Resolution Imaging Spectroradiometer Enhanced Vegetation Index Data. Front. Ecol. Evol. 10:859542. doi: 10.3389/fevo.2022.859542
Hefei Municipal Government (2012). Urban Master Planning of Hefei (2011–2020). Hefei: Hefei Municipal Government.
Hefei Natural Resources and Planning Bureau (2022). Territorial Spatial Planning of Hefei city (2021-2035). Hefei: Hefei natural resources and Planning Bureau.
Hernández-Moreno, Á, and Reyes-Paecke, S. (2018). The effects of urban expansion on green infrastructure along an extended latitudinal gradient (23° S–45° S) in Chile over the last thirty years. Land. Use Pol. 79, 725–733. doi: 10.1016/j.landusepol.2018.09.008
Huang, H., Yang, H., Chen, Y., Chen, T., Bai, L., and Peng, Z.-R. (2021). Urban green space optimization based on a climate health risk appraisal—A case study of Beijing city China. Urban For. Urban Green. 62:127154. doi: 10.1016/j.ufug.2021.127154
Huang, Q., Li, M., Liu, Y., Hu, W., Liu, M., Chen, Z., et al. (2013). Using construction expansion regulation zones to manage urban growth in Hefei City China. J. Urban Plan. Dev. 139, 62–69. doi: 10.1061/(ASCE)UP.1943-5444.0000135
Huang, S. L., Wang, S. H., and Budd, W. W. (2009). Sprawl in taipei’s peri-urban zone: Responses to spatial planning and implications for adapting global environmental change. Landsc. Urban Plan. 90, 20–32. doi: 10.1016/j.landurbplan.2008.10.010
Hüse, B., Szabo, S., Deák, B., and Tóthmérész, B. (2016). Mapping an ecological network of green habitat patches and their role in maintaining urban biodiversity in and around Debrecen city (Eastern Hungary). Land. Use Pol. 57, 574–581. doi: 10.1016/j.landusepol.2016.06.026
Kanniah, K. D. (2017). Quantifying green cover change for sustainable urban planning: A case of Kuala Lumpur Malaysia. Urban For. Urban Green. 27, 287–304. doi: 10.1016/j.ufug.2017.08.016
Ke, X., Men, H., Zhou, T., Li, Z., and Zhu, F. (2021). Variance of the impact of urban green space on the urban heat island effect among different urban functional zones: A case study in Wuhan. Urban For. Urban Green. 62:127159. doi: 10.1016/j.ufug.2021.127159
Kong, F., and Nakagoshi, N. (2006). Spatial-temporal gradient analysis of urban green spaces in Jinan China. Landsc. Urban Plan. 78, 147–164. doi: 10.1016/j.landurbplan.2005.07.006
Li, F., Zheng, W., Wang, Y., Liang, J., Xie, S., Guo, S., et al. (2019). Urban green space fragmentation and urbanization: A spatiotemporal perspective. Forests 10:333. doi: 10.3390/f10040333
Li, J., Li, C., Zhu, F., Song, C., and Wu, J. (2013). Spatiotemporal pattern of urbanization in Shanghai China between 1989 and 2005. Landsc. Ecol. 28, 1545–1565. doi: 10.1007/s10980-013-9901-1
Li, W., Bai, Y., Zhou, W., Han, C., and Han, L. (2015). Land use significantly affects the distribution of urban green space: Case study of Shanghai. China. J. Urban Plan. Dev. 141:A4014001. doi: 10.1061/(ASCE)UP.1943-5444.0000246
Li, Y. Y., Liu, Y., Ranagalage, M., Zhang, H., and Zhou, R. (2020). Examining land use/land cover change and the summertime surface urban heat island effect in fast-growing greater Hefei, China: Implications for sustainable land development. ISPRS Int. J. Geo Inf. 9:568. doi: 10.3390/ijgi9100568
Liu, S., Zhang, X., Feng, Y., Xie, H., Jiang, L., and Lei, Z. (2021). Spatiotemporal dynamics of urban green space influenced by rapid urbanization and land use policies in Shanghai. Forests 12:476. doi: 10.3390/f12040476
Liu, W., Zhao, H., Sun, S., Xu, X., Huang, T., and Zhu, J. (2022). Green Space Cooling Effect and Contribution to Mitigate Heat Island Effect of Surrounding Communities in Beijing Metropolitan Area. Front. Public Health 10:870403. doi: 10.3389/fpubh.2022.870403
Liu, Y., Li, L., Chen, L., Cheng, L., Zhou, X., Cui, Y., et al. (2019). Urban growth simulation in different scenarios using the SLEUTH model: A case study of Hefei. East China. PLoS One 14:e0224998. doi: 10.1371/journal.pone.0224998
Liu, Z., He, C., and Wu, J. (2016). The relationship between habitat loss and fragmentation during urbanization: An empirical evaluation from 16 world cities. PLoS One 11:e0154613. doi: 10.1371/journal.pone.0154613
Long, H., Liu, Y., Hou, X., Li, T., and Li, Y. (2014). Effects of land use transitions due to rapid urbanization on ecosystem services: Implications for urban planning in the new developing area of China. Habitat Int. 44, 536–544. doi: 10.1016/j.habitatint.2014.10.011
Lopez, E., Bocco, G., Mendoza, M., and Duhau, E. (2001). Predicting land-cover and land-use change in the urban fringe: A case in Morelia city. Mexico. Landsc. Urban Plan. 55, 271–285. doi: 10.1016/S0169-2046(01)00160-8
Luck, M., and Wu, J. (2002). A gradient analysis of urban landscape pattern: A case study from the Phoenix metropolitan region Arizona, USA. Landsc. Ecol. 17, 327–339. doi: 10.1023/A:1020512723753
Masoudi, M., and Tan, P. Y. (2019). Multi-year comparison of the effects of spatial pattern of urban green spaces on urban land surface temperature. Landsc. Urban Plan. 184, 44–58. doi: 10.1016/j.landurbplan.2018.10.023
McBride, J. R. (2008). A method for Characterizing urban forest composition and structure for landscape architects and urban planners. Arboric. Urban For. 34, 359–365. doi: 10.48044/jauf.2008.049
McGarigal, K., Cushman, S., and Ene, E. (2012). FRAGSTATS v4: Spatial Pattern Analysis Program for Categorical and Continuous Maps. Amherst: University of Massachusetts.
Miller, M. D. (2012). The impacts of Atlanta’s urban sprawl on forest cover and fragmentation. Appl. Geogr. 34, 171–179. doi: 10.1016/j.apgeog.2011.11.010
Miller, R. W., Hauer, R. J., and Werner, L. P. (2015). Urban forestry: Planning and Managing Urban Greenspaces. Waveland: Waveland press
Momm-Schult, S. I., Piper, J., Denaldi, R., Freitas, S. R., Fonseca, M. D. L. P., and Oliveira, V. E. D. (2013). Integration of urban and environmental policies in the metropolitan area of São Paulo and in Greater London: The value of establishing and protecting green open spaces. Int. J. Urban Sustain. Dev. 5, 89–104. doi: 10.1080/19463138.2013.777671
Mu, B., Liu, C., Tian, G., Xu, Y., Zhang, Y., Mayer, A. L., et al. (2020). Conceptual planning of urban–rural green space from a multidimensional perspective: A case study of Zhengzhou. China. Sustainability 12:2863. doi: 10.3390/su12072863
Pauleit, S., Ambrose-Oji, B., Andersson, E., Anton, B., Buijs, A., Haase, D., et al. (2019). Advancing urban green infrastructure in Europe: Outcomes and reflections from the GREEN SURGE project. Urban For. Urban Green. 40, 4–16. doi: 10.1016/j.ufug.2018.10.006
Peschardt, K. K., Stigsdotter, U. K., and Schipperrijn, J. (2016). Identifying Features of Pocket Parks that May Be Related to Health Promoting Use. Landsc. Res. 41, 79–94. doi: 10.1080/01426397.2014.894006
Portillo-Quintero, C. A., Sanchez, A. M., Valbuena, C. A., Gonzalez, Y. Y., and Larreal, J. T. (2012). Forest cover and deforestation patterns in the Northern Andes (Lake Maracaibo Basin): A synoptic assessment using MODIS and Landsat imagery. Appl. Geogr. 35, 152–163. doi: 10.1016/j.apgeog.2012.06.015
Qian, Y., Zhou, W., Li, W., and Han, L. (2015). Understanding the dynamic of greenspace in the urbanized area of Beijing based on high resolution satellite images. Urban For. Urban Green. 14, 39–47. doi: 10.1016/j.ufug.2014.11.006
Samanta, S., Pal, D., and Palsamanta, B. (2018). Flood susceptibility analysis through remote sensing, GIS and frequency ratio mode. Appl. Water Sci. 8:66 doi: 10.1007/s13201-018-0710-1
Shahtahmassebi, A. R., Li, C., Fan, Y., Wu, Y., Lin, Y., Gan, M., et al. (2021). Remote sensing of urban green spaces: A review. Urban For. Urban Green. 57:126946. doi: 10.1016/j.ufug.2020.126946
Shi, W., Liu, Y., and Shi, X. (2017). Development of quantitative methods for detecting climate contributions to boundary shifts in farming-pastoral ecotone of northern China. J. Geogr. Sci. 27, 1059–1071. doi: 10.1007/s11442-017-1421-5
Shi, Y., Sun, X., Zhu, X., Li, Y., and Mei, L. (2012). Characterizing growth types and analyzing growth density distribution in response to urban growth patterns in peri-urban areas of Lianyungang City. Landsc. Urban Plan. 105, 425–433. doi: 10.1016/j.landurbplan.2012.01.017
Strohbach, M. W., Lerman, S. B., and Warren, P. S. (2013). Are small greening areas enhancing bird diversity? Insights from community-driven greening projects in Boston. Lands. Urban Plan. 114, 69–79. doi: 10.1016/j.landurbplan.2013.02.007
Sun, C., Lin, T., Zhao, Q., Li, X., Ye, H., Zhang, G., et al. (2019). Spatial pattern of urban green spaces in a long-term compact urbanization process—a case study in China. Ecol. Indic. 96, 111–119. doi: 10.1016/j.ecolind.2017.09.043
Tang, H., Liu, W., and Yun, W. (2018). Spatiotemporal dynamics of green spaces in the Beijing–Tianjin–Hebei region in the past 20 years. Sustainability 10:2949. doi: 10.3390/su10082949
Ullah, H., Wan, W., Haidery, S. A., Khan, N. U., Ebrahimpour, Z., and Muzahid, A. A. M. (2020). Spatiotemporal patterns of visitors in urban green parks by mining social media big data based upon WHO reports. IEEE Access 8, 39197–39211. doi: 10.1109/ACCESS.2020.2973177
United Nations (2018). Revision of World Urbanization Prospects. Available online at: https://www.un.org/development/desa/publications/2018-revision-of-world urbanization-prospects.html (accessed on 20 November 2018)
Woldesemayat, E., and Genovese, P. (2021). Monitoring Urban Expansion and Urban Green Spaces Change in Addis Ababa: Directional and Zonal Analysis Integrated with Landscape Expansion Index. Forests 12:389. doi: 10.3390/f12040389
Wu, C., Li, J., Wang, C., Song, C., Chen, Y., Finka, M., et al. (2019a). Understanding the relationship between urban blue infrastructure and land surface temperature. Sci. Total Environ. 694:133742. doi: 10.1016/j.scitotenv.2019.133742
Wu, C., Li, J., Wang, C., Song, C., Haase, D., Breuste, J., et al. (2021). Estimating the Cooling Effect of Pocket Green Space in High Density Urban Areas in Shanghai China. Front. Environ. Sci. 9:657969. doi: 10.3389/fenvs.2021.657969
Wu, Z., Chen, R., Meadows, M. E., Sengupta, D., and Xu, D. (2019b). Changing urban green spaces in Shanghai: Trends, drivers and policy implications. Land. Use Pol. 87:104080. doi: 10.1016/j.landusepol.2019.104080
Xiao, J., Watanbe, T., Lu, X., Chand, M., Umarhadi, D., Chen, X., et al. (2021). Integrating land use/land cover change with change in functional zones? boundary of the East Dongting Lake National Nature Reserve, China. Phys. Chem. Earth 126:103041 doi: 10.1016/j.pce.2021.103041
Xu, X., Duan, X., Sun, H., and Sun, Q. (2011). Green space changes and planning in the capital region of China. Environ. Manage. 47, 456–467. doi: 10.1007/s00267-011-9626-3
Yang, B., and Lee, D. (2021). Planning Strategy for the Reduction of Runoff Using Urban Green Space. Sustainability 13:2238. doi: 10.3390/su13042238
Yang, J., Luo, X., Lu, S., Yang, Y., and Yang, J. (2022). Effects of compositional and configurational heterogeneity of the urban matrix on the species richness of woody plants in urban remnant forest patches. Landsc. Ecol. 37, 619–632. doi: 10.1007/s10980-021-01368-7
Yang, J., McBride, J., Zhou, J., and Sun, Z. (2005). The urban forest in Beijing and its role in air pollution reduction. Urban For. Urban Green. 3, 65–78. doi: 10.1016/j.ufug.2004.09.001
Yang, Z., Fang, C., Li, G., and Mu, X. (2021). Integrating multiple semantics data to assess the dynamic change of urban green space in Beijing China. Int. J. Appl. Earth Obs. Geoinf. 103:102479. doi: 10.1016/j.jag.2021.102479
Ye, C., Hu, L., and Li, M. (2018). Urban green space accessibility changes in a high-density city: A case study of Macau from 2010 to 2015. J. Transp. Geogr. 66, 106–115. doi: 10.1016/j.jtrangeo.2017.11.009
Yu, Z., Wang, Y., Deng, J., Shen, Z., Wang, K., Zhu, J., et al. (2017). Dynamics of hierarchical urban green space patches and implications for management policy. Sensors 17:1304. doi: 10.3390/s17061304
Zhang, L., Liu, Y., Jing, Y., and Zhang, Y. (2022). How Does Quota-Oriented Land Use Planning Affect Urban Expansion? A Spatial Analysis of 280 Chinese Cities. Land 11:528. doi: 10.3390/land11040528
Zhang, L., Wang, Z., and Da, L. (2019). Spatial characteristics of urban green space: A case study of Shanghai. China. Appl. Ecol. Environ. Res. 17, 1799–1815. doi: 10.15666/aeer/1702_17991815
Zhang, X., Fang, C., Wang, Z., and Ma, H. (2013). Urban construction land suitability evaluation based on improved multi-criteria evaluation based on GIS (MCE-GIS): Case of New Hefei City. China. Chin. Geogr. Sci. 23, 740–753. doi: 10.1007/s11769-013-0609-6
Zhao, P. (2010). Sustainable urban expansion and transportation in a growing megacity: Consequences of urban sprawl for mobility on the urban fringe of Beijing. Habitat Int. 34, 236–243. doi: 10.1016/j.habitatint.2009.09.008
Keywords: green space, spatiotemporal dynamics, park, urban planning, scale, urbanization
Citation: Li Y-Y, Ren B-T, Chen Y-S, Huang L-C and Sun C-G (2022) Multiscale spatiotemporal dynamics analysis of urban green space: Implications for green space planning in the rapid urbanizing Hefei City, China. Front. Ecol. Evol. 10:998111. doi: 10.3389/fevo.2022.998111
Received: 19 July 2022; Accepted: 11 August 2022;
Published: 29 August 2022.
Edited by:
Hua-Feng Wang, Hainan University, ChinaCopyright © 2022 Li, Ren, Chen, Huang and Sun. This is an open-access article distributed under the terms of the Creative Commons Attribution License (CC BY). The use, distribution or reproduction in other forums is permitted, provided the original author(s) and the copyright owner(s) are credited and that the original publication in this journal is cited, in accordance with accepted academic practice. No use, distribution or reproduction is permitted which does not comply with these terms.
*Correspondence: Cai-Ge Sun, Y2dzdW5AbS5zY251LmVkdS5jbg==
 Ying-Ying Li
 Bao-Ting Ren1