 Dan Qiao
 Han Liu
 Desheng Zhang
 Tao Xu
 Yu Gan
94% of researchers rate our articles as excellent or good
Learn more about the work of our research integrity team to safeguard the quality of each article we publish.
Find out more
ORIGINAL RESEARCH article
Front. Ecol. Evol. , 10 November 2022
Sec. Conservation and Restoration Ecology
Volume 10 - 2022 | https://doi.org/10.3389/fevo.2022.983553
This article is part of the Research Topic Insights in Conservation and Restoration Ecology: 2022 View all 7 articles
The rubber expansion in Asian countries has led to various environmental problems. To smoothly promote the ecological restoration programs, an essential premise is that the local government must consider public attitude and understand the public willingness to pay (WTP) for the programs. In this study, we employ an integrated contingent valuation (ICV) survey to evaluate the citizen’s WTP of implementing rubber plantation ecological restoration (RPER) programs in Hainan, China. Considering three types of the respondents’ WTP data (interval truncated, merged, and point data), we adopt the Point and Interval Data (PID) model to estimate the determinants of WTP and calculate the non-market value with the comparison of the Tobit model. Results show that the mean value of WTP for the RPER program is 178 yuan per year, and the total non-market value throughout the province is worth approximately 1.839 billion yuan per year after controlling the regional differences. We also find that the respondents’ WTP has a significant regional difference, in which Danzhou has the highest WTP, followed by Haikou, Wanning, and Sanya. Age has a significant negative effect on the WTP for the restoration program, whereas the factors such as education, family burden, income, and residents’ environmental knowledge have a significant positive effect. Our findings add to the evidence that using improved estimation methods can generate diverse results, where neglecting the bias caused by the usual interval data model would lead to downward biased estimates.
Rubber expansion has been continued in developing Asian countries since the 1960s, where it has been proven to cause severe ecological problems such as weakened climate-moderating capacity, biodiversity loss, and soil erosion in those planting areas (Ahrends et al., 2015; Blagodatsky et al., 2016). The problems are more prominent in China since the country is the world’s fifth natural rubber-producing country, with the total planting area of rubber trees increasing by 248.3%, from 300,000 ha in 1985 to 745,000 ha in 2020 (Food and Agriculture Organization, 2022). The rubber-producing areas in China include Hainan, Yunnan, Guangxi, Guangdong, and Fujian. As China’s major rubber-producing area, Hainan accounts for more than 45% of China’s total rubber production, with 20 percent of the land covered by natural rubber plantations1. Although the development of the natural rubber industry in Hainan has increased farmers’ income and reduced poverty (Liu et al., 2013; Zhao et al., 2015; Song et al., 2018), however, the rapid expansion of natural rubber plantations in recent years has dramatically changed the tropical rainforest ecosystem and land use patterns, posing a significant challenge to the local ecological environment (Guo et al., 2006; Li et al., 2013; Lan et al., 2018). Studies have shown that the expansion of natural rubber cultivation in Hainan has led to a decline in biodiversity and weakened the climate regulation function of tropical rainforest ecosystems, with an increase in temperature and a decrease in relative humidity in local areas (Gao et al., 2012; Wigboldus et al., 2017; Sun et al., 2021; Chima et al., 2022; Cui et al., 2022; Lan et al., 2022). It has also been pointed out that the transformation of tropical rainforests to rubber forests has changed the soil structure and properties, leading to a decrease in soil and water conservation capacity and soil fertility (Zhang and Xue, 2013; Diao et al., 2016; Qi et al., 2021).
Under these circumstances, the Chinese government is implementing the rubber plantation ecological restoration (RPER) programs as a practical solution. As environmental damage can lead to serious natural disasters, the Chinese government began to focus on ecological restoration, enacting laws and introducing restoration projects to restore the ecology, which can be traced back to the 1970s, especially in important restoration areas such as forests, grasslands, and wetlands.2 The RPER program aims to build environment-friendly rubber plantations, establish a system of ecological, economic, and social benefits for the rubber industry, and realize the sustainable development of the industry. Environment-friendly rubber plantations have changed the planting structure of monoculture rubber plantations, and helped to increase the plant diversity in the region and improve the species diversity in the system, which can also improve the soil, enhance soil fertility and soil and water conservation capacity, and stabilize the ecosystem (Gan et al., 2021; Qiao et al., 2022). In addition, environmentally friendly rubber plantations can provide a complex planting pattern, i.e., farmers can plant cash crops with higher benefits under rubber trees. Therefore, it helps to improve the replanting index and production efficiency, create higher economic benefits for farmers and help them to overcome poverty (Gan et al., 2021). The RPER programs in this paper can effectively promote the transformation and upgrade of rubber plantations, which is a stable and green solution for improving the environmental conditions, enriching biodiversity, and enhancing the ecological function of rubber plantations (Gan et al., 2021; Qiao et al., 2022). However, the recent government-led restoration programs have not been promoted effectively due to the limited funding and technology and the influence of relevant policies, and regulations. To ensure the smooth implementation of the ecological restoration programs and the public’s consciousness of environmental responsibility, it is necessary for the government to consider the public attitude since the efficient implementation of restoration programs requires multiple stakeholders’ participation (Couix and Gonzalo-Turpin, 2015; Min et al., 2018; Wu et al., 2020; Yao et al., 2020).
Based on the externality theory, carrying out ecological restoration activities can generate obvious external and social-ecological value pursued by the external beneficiaries, which are positive externalities. It has been widely proved by scholars in the study of resource and environmental economics (Meade, 1973; Brock and Xepapadeas, 2010). Hence, the non-market value generated by the RPER programs, or in other words, the willingness to pay (WTP) of external beneficiaries (e.g., urban residents) needs to be analyzed when the government implements ecological restoration policies and measures. The reason people pay for the external benefits of RPER programs is that the implementation of these programs improves ecosystem services and functions, which in turn brings ecological benefits to the local population. These ecological benefits include not only direct use values, such as good climate conditions and beautiful landscapes and other products that can be directly consumed, but also non-use values that is not directly related to people’s production and livelihoods, such as the choice value and gift value to future generations (Brown et al., 2007; Sousa et al., 2019; Otrachshenko et al., 2022).
Scholars commonly employ the Stated Preference method (SP) to acquire the public’s willingness to accept (WTA) or WTP and to calculate the non-market value of natural resources and the environment, in which this method helps policymakers understand public preferences and enable them to make decisions in allocating natural resources (Chaikumbung et al., 2016). SP mainly includes Choice Experiment (CE) and Contingent Valuation (CV; Adamowicz et al., 1998; De Groot et al., 2012). Compared with the choice experiments method, CV has the advantage of simple operation and the experimental process is easier to be understood by respondents (Hanley et al., 1998; Zhu et al., 2019), and it can also significantly save research costs. Existing studies related to these methods have been broadly used in many fields, including cultural, environmental, health, transportation, and other issues (Carson, 2012; Qiu et al., 2020; He and Zhang, 2021; Vasquez and Trudeau, 2022). The CV survey asks questions that help to reveal the economic tradeoff each person would make concerning the value of goods or services. However, this method has some long-standing issues like hypothetical response bias and embedding problems, leading to an overstatement of the valuation results (Whittington, 2002; Hausman, 2012). For example, as the CV survey’s core issue, the choice of the elicitation formats directly determines the estimation of the valuation function, which can affect the accuracy of WTP evaluation (Cameron and Quiggin, 1994). In addition, it is assumed that the estimation of the model is based on unreasonable assumptions. In this case, the respondents’ WTP is likely to be underestimated, leading to biased results in assessing non-market benefits (Solomon and Johnson, 2009). Therefore, assessing the non-market value of the RPER programs using a CV survey needs to consider potential difficulties that may arise during the study.
The above studies have laid the analytical foundation for this study, but there is still room for improvement. Given the importance of RPER for the sustainable development of China, the current work aims to examine the WTP of residents in Hainan Province for RPER and calculate the non-market value of the RPER program. The evaluation results may help to provide policy recommendations for policymakers and important practical implications for the promotion of the RPER program. We first use an integrated contingent valuation (ICV) to measure the WTP of respondents through a field survey, use the PID model to analyze the influencing factors of WTP, and obtain the non-market value of the RPER program based on the population size of Hainan. We expect to make the following contributions to existing studies to reduce bias in the program’s WTP estimates. Firstly, according to the respondents’ response mode and bid value, we made a more reasonable assumption of the respondents’ real WTP range to estimate the results, implementing a more accurate assessment for WTP estimation. Secondly, in the valuation function modeling, apart from controlling the essential economic characteristic of the respondents, we also included residents’ environmental perception and regional differences as the essential determinants of the respondents’ WTP to obtain more accurate coefficients of the estimation variables. Moreover, in terms of survey methodology, we combine the open-ended (OE) and payment cards (PCs) heuristic forms as an ICV survey to design the questionnaire and obtain respondents’ t WTP, which can effectively reduce the answering difficulty and the starting point problems (Lienhoop and MacMillan, 2007; Lindhjem and Navrud, 2011).
In this study, we applied the CV survey, which is widely employed in assessing the economic value of non-market goods (Carson, 2000). Based on the random utility theory, the researcher can design the CV survey to reveal each person’s monetary tradeoff concerning the value of goods or services (Whittington, 2002).
The choice of the elicitation formats, which directly determines the estimation of the valuation functions related to the respondents’ WTP, is the core issue in the CV survey. At present, the primary elicitation formats are classified into open-ended (OE), payment cards (PCs), and bonded, which all have their advantages and disadvantages and will generate different types of WTP data (the comparison of those three formats is shown in Table 1). Specifically, the OE approach sets no limits on the maximum bid and asks the respondent to state their exact WTP. The PCs elicitation formats list a series of bids for respondents to circle, with the highest bid representing the respondents’ maximum WTP. The bonded approaches are closed elicitation formats and provide respondents a bid value and ask them whether or not they are willing to pay it. The respondents will be offered a higher bid value if they are eager to accept the initial bid value, and the bidding process will not stop until the respondents refuse to accept the given bid. From the perspective of applicability, closed elicitation formats only require respondents to answer “yes” or “no” to pay or accept default payments, which simulates the decision-making process in market transactions and enhances the credibility of the survey data to a certain extent. However, this approach only derives limited information, and the actual implementation of questionnaires is complex (Cameron and Quiggin, 1994). OP and PC elicitation formats are simple, direct, and widely applied in CV surveys. However, in practical applications, both elicitation formats face impediments. For example, the OP questionnaire may be challenging for respondents to answer. In contrast, although they significantly reduced the difficulty of answering, the PCs tend to cause a deviation from the starting point problem (Solomon and Johnson, 2009).
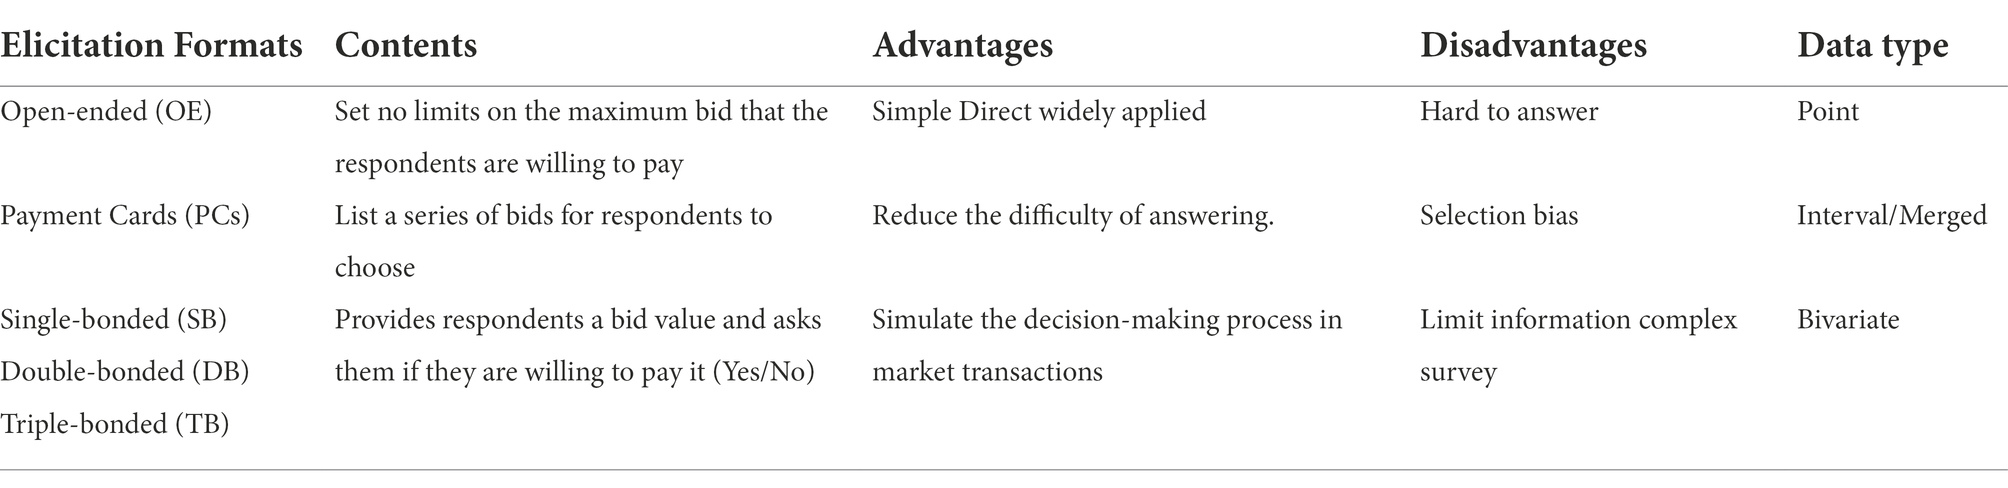
Table 1. The comparison of the primary CV survey’s elicitation format.
To approach the unbiased WTP in our valuation study, we combine the OE and PCs elicitation formats as an ICV survey to investigate the respondents’ WTP. The previous research that combined the payment cards with follow-up questions was often done to elicit point estimates at the right tail of the WTP distribution. When the circled payment bid of the card is the highest one, the ICV survey then asked the respondents to state their exact WTP or to indicate whether the circled bid relates to their actual WTP (Lienhoop and MacMillan, 2007; Lindhjem and Navrud, 2011). However, due to the survey process, the respondents will answer the PCs formats first and state their exact WTP only if their circled payment bid is the highest, which may fail to reduce the deviation that PCs formats caused. Unlike the previous ICV survey design, in our ICV survey, respondents can answer the OE formats or the PCs formats by themselves, which can alleviate the answering difficulty and the starting point problem.
Consequently, the results from the ICV survey generate three types of WTP data: interval, merged, and point data. Firstly, when respondents are presented with a series of ordered bids in the PCs formats, the individual’s WTP is supposed to lie somewhere between the circled bid and the next bid in the card (interval data). Secondly, If the highest payment is circled, the WTP is assumed to be above the highest bid (merged data). In addition, when respondents answer the OE formats, the individual’s WTP is supposed to be their exact state value (point data). The usual parametric approach to estimate the valuation function with the WTP as the dependent variable is the “interval data model,” e.g., the Tobit model (Cameron and Huppert, 1989; Mahieu et al., 2012). However, suppose the model estimation has been made according to the prior assumptions. In that case, the respondents’ WTP is likely to be underestimated, thus caused in the deviation of benefit valuation. We employ the PID model to estimate the valuation function to deal with the mixed data type generated from the ICV survey. The PID model can be used instead of the interval data model, which has been adopted in many fields of economics when a mixture of data is observed (Daniels and Rospabe, 2005).
We applied the ICV survey to estimate the non-market value of the RPER programs. Designing the ICV survey questionnaire was constructing the virtual market scenario for “ecological products.” In this paper, the quantification framework of the valuation of the non-market goods in our ICV survey is illustrated in Figure 1. Starting with the environmental problems in the extended area of natural rubber plantations, we designed the ICV survey targeting at quantitative evaluation of non-market value generated from the RPER programs. The survey described the RPER programs as an “ecological product,” created a virtual market for respondents, and guided them to make a payment decision in the hypothetical market. Consequently, based on the estimation results of the PID model, the expectation of the WTP and the total non-market value has been calculated.
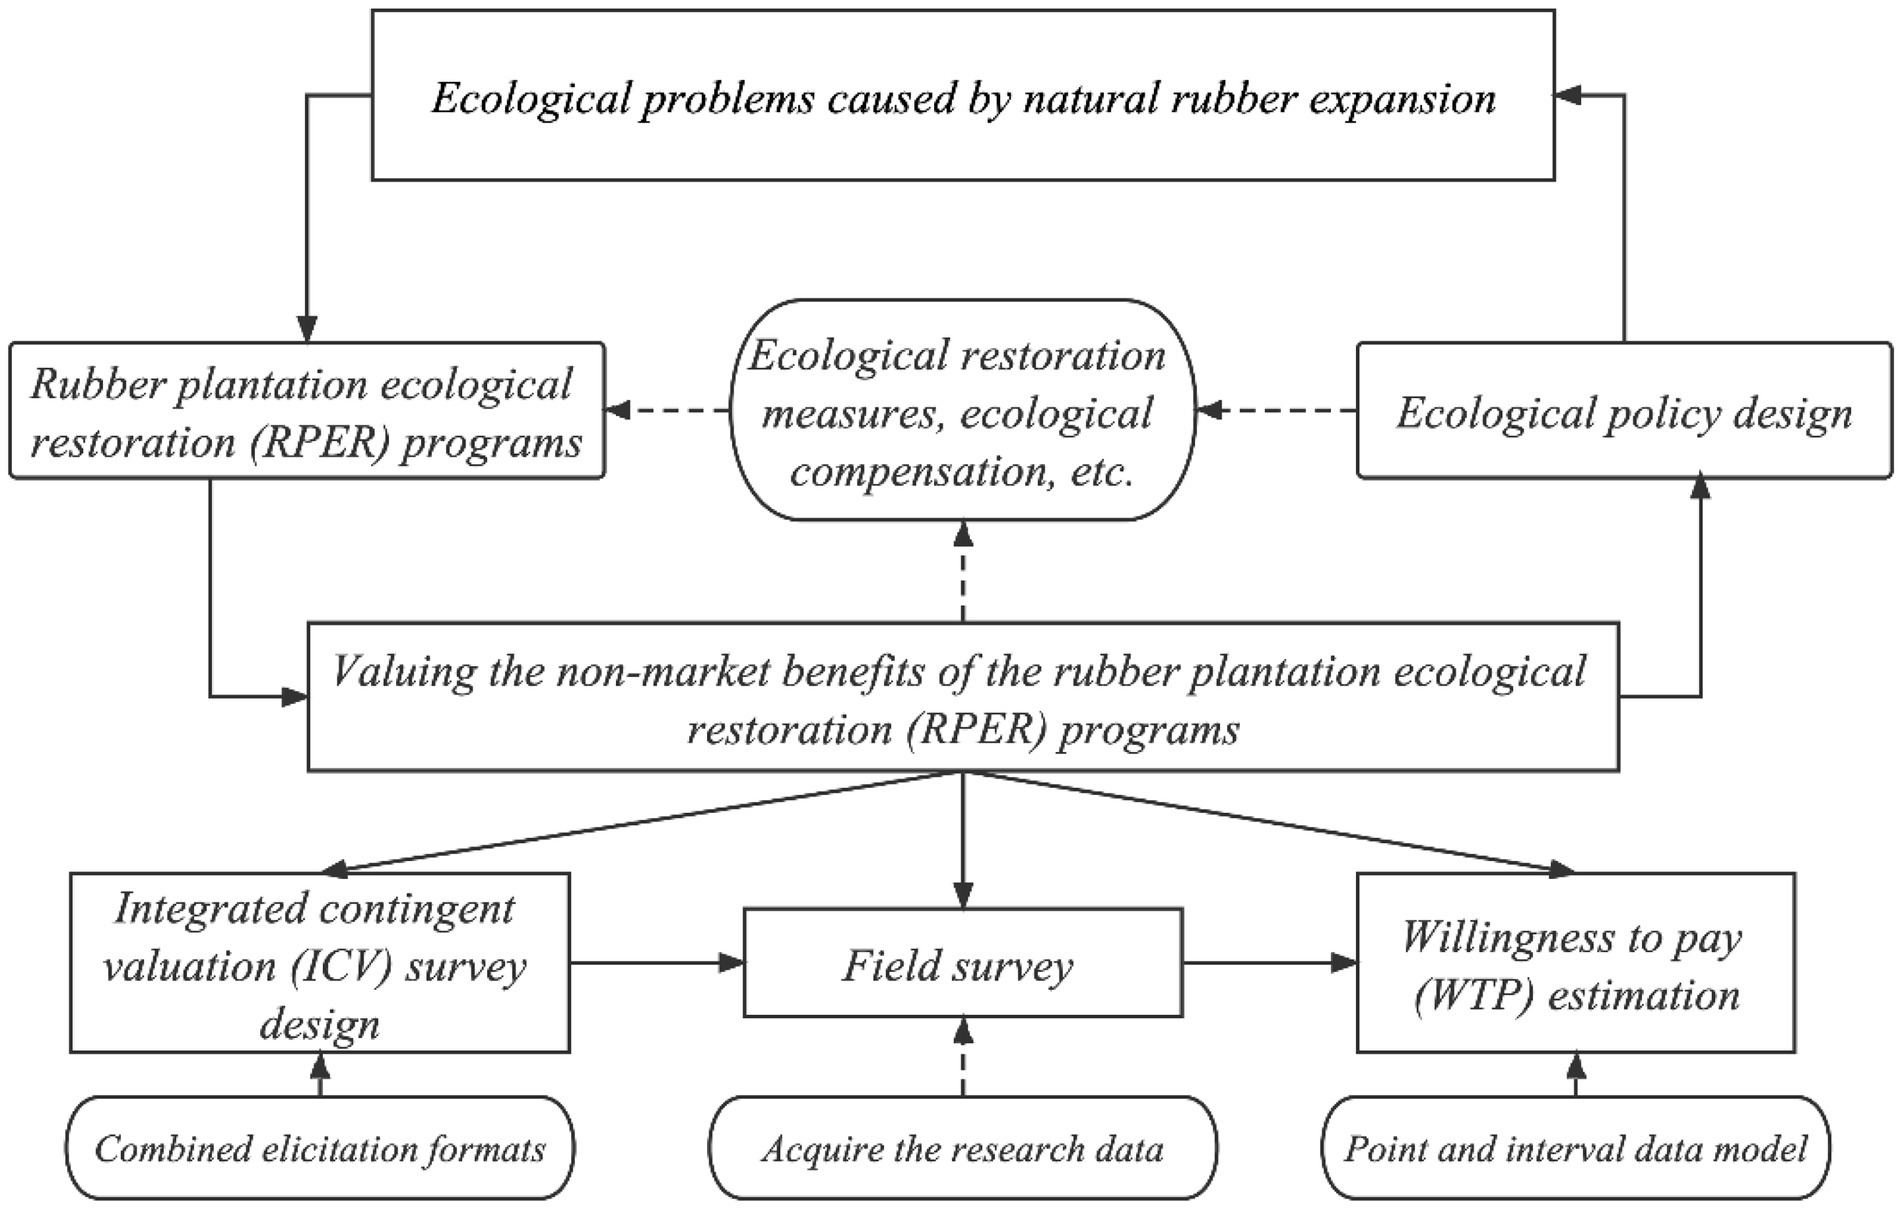
Figure 1. Non-market Benefit Evaluation RPER Programs Based on ICV survey.
Accordingly, we designed the ICV survey questionnaire in four parts. The first part was the design of the guiding language (script) for the questionnaire. Whittington (2002) proposed that the main reason for the poor application effect of the value assessment method in numerous developing countries was that the actual management of questionnaires and the value assessment scenario were not reasonably established. The practical design of the questionnaire aided in establishing the value assessment scenario and improving the accuracy of the WTP (Carson, 2012). In our ICV questionnaire’s script, we introduced the details of the ecological and environmental problems caused by the production of natural rubber (current level of environmental quality) and the virtual commodity of “RPER programs” (item of interest to respondents) to the respondents, which help them understood the background information of the questionnaire. Specifically, we introduced essential information regarding the natural rubber industry in Hainan, such as the importance of the industry and planting area, to ensure that the respondents would have a preliminary understanding of the relevant information on the natural rubber industry before the WTP survey.
In the second part, we provided respondents with the following virtual market scenarios: “In RPER programs, rubber plantations will differ from traditional plantations by treating rubber trees as part of a complex ecosystem with multiple species, multiple layers of plants, and a sound biological environment. This change can improve biodiversity and the ecological functions of rubber plantations. However, promoting PRER programs are expensive and may require your family to pay fees (equivalent to buying ecological and environmental products). Please consider your family’s actual circumstances and decide whether you are willing to participate in this program. If the answer is yes, all the fees you pay will be used for RPER programs. Please indicate the maximum amount you are willing to pay.” To ensure that each respondent was faced with a consistent hypothetical market scenario in the field survey, the above contents were directly reflected in the ICV questionnaire. The researcher must have explained in detail according to the specifications through the survey training.
The third part was the survey of the respondents’ WTP for the RPER programs. Firstly, the respondents were simultaneously provided with the open-ended and the payment card questionnaire. The above two kinds of elicitation formats appear in the questionnaire together. Respondents can choose one of the two ways to answer according to their preferences or actual situations. If respondents can state their WTP clearly, they could fill in the open-ended questions with specific values, and if they have trouble saying the exact WTP but only know a broad range, they can pick the pre-given values from the payment card. Consequently, the respondents could answer the open-ended questions by themselves or select the bid value from the payment card. To determine the payment card value, We designed the PCs options according to Solomon and Johnson (2009) and Sardana (2019). Based on the preliminary online survey results, we roughly estimated the scope of respondents’ WTP for RPER programs and determined the specific amounts to put on the PCs (“0, 5, 10, …, 900, 1,000, more than CNY 1000″). In addition, to ensure that the surveys are viewed as a “take-it-or-leave-it” offer, and that the payment mechanism is coercive and consequential, we referred to the practice of Carson et al. (2014), informed the respondents that their responses would influence the agency’s final decision, and all the money they pay can be used for ecological restoration measures, and the expected restoration goals can be achieved.
The fourth part was the follow-up question. Several studies had shown that individual characteristics and wealth could effectively influence the public’s WTP, so we included questions about gender, ethnic group, age, education level, income, and family status in the follow-up survey. In addition, we considered that the public’s environmental perception was a critical driving factor of their pro-environmental behaviors (Paço and Lavrador, 2017; Melindi-Ghidi et al., 2020). For instance, we found that some respondents believed rubber plantations are “green” and “environmentally friendly” during the survey. They even thought that government should reward rubber-planting farmers for growing carbon sinks in their rubber tree-planting activities; thus, the influence of the public’s awareness and knowledge on their WTP needed to be considered in the study (Gan et al., 2021). Therefore, we also added questions about the respondents’ environmental perceptions.
If the influence of relevant variables such as essential characteristics of respondents is not considered, then the expected value of WTP can be calculated by the following equation:
where E (WTP) represents the expected value of WTP, Bi is the ith payment scale selected by the respondents, Pi is the probability of respondents choosing the ith payment amount, and K is the number of pay scales.
The estimation of E (WTP) according to Eq. (1) is based mainly on the assumption that the WTP* of the respondents is equal to their bid value Bi. Under this assumption, if the respondents can indicate the payment amount by themselves, then the two equations do not estimate a deviation in E (WTP). However, most respondents could not state the pay scale by payment card. For example, when respondent i checks the bid value Bli, Bli does not necessarily mean “respondents’ WTP* equals Bli.” The reason is that the ICV survey questionnaire asks the respondents the amount that they pay “the most,” so the respondents’ WTP* is likely to be between Bli and the next adjacent bid value, Bui. In this study, the equation is Bli < Bui. As the respondents cannot accept Bui, they eventually select a smaller Bli. Subsequently, when Bli < WTP* ≤ Bui, the E (WTP) estimated by Eqs. (1) and (3) are likely a smaller result. Given this condition, Mahieu et al. (2012) proposed the PID model, making more reasonable assumptions about WTP*. The WTP data derived through open and payment card elicitation formats combine with three types: interval truncated, merged, and point data. Based on the PID model, the WTP* distribution of the interviewees in this study may be in the following manner:
Firstly, if respondents circle the bid value Bli in the payment card except for the highest bid value Bmax, then we can assume that Bli < WTP* ≤ Bui as follows:
Secondly, If respondents circle Bmax, the highest bid value in the payment card, then we can assume that Bmax < WTP* as follows:
Thirdly, if respondents fill in a certain pay scale Bi by themselves, then we can assume that WTP* = Bi is as follows:
In Eqs. (2) and (3), follows the standard normal distribution, represents the cumulative distribution of the standard normal distribution, represents the probability density function of the general normal distribution, and represents the probability density function of the standard normal distribution. To obtain estimators of and , this study constructs the logarithmic likelihood function equation with the inclusion of Eq. (2)–(4) as follows:
In Eq. (5), , and are indicative variables, and the value equal to 1 when the WTP* of the interviewee conforms to Eqs. (2)–(4), respectively; otherwise, the value is 0. The first part of the Eq. (5) corresponds to the interval truncation observation value, the second part to the right merged observation value, and the third part to the point observation value. Thus, the PID model should be used in estimation. Finally, the maximum likelihood estimation is used to obtain . In general, when respondents select the pay scale, they are influenced by their own characteristics, such as gender, age, education level, family burden, income, and environment knowledge. Therefore, few scholars have used the linear regression model to estimate the relationship between WTP and the essential characteristics of respondents, and then calculated the expected value of WTP, E (WTP) as follows (Loomis, 2000):
In Eq. (6), WTP* represents the real WTP of the interviewees, xi is the vector of essential characteristic variables of the interviewees, is the vector of the coefficient to be evaluated, and is a random disturbance term that follows a normal distribution with a mean of 0 and a standard deviation of. In Eq. (4), represents the estimator of coefficient and represents the mean of the characteristic variable.
In this study, we choose Hainan province as our study area, which is China’s main natural rubber production area. Since the 1950s, in response to Western countries’ blockade of China’s rubber resources, the Chinese government had established state-owned farms to develop the natural rubber planting industry (Chen et al., 2016). After decades of development, in 2020, the natural rubber planting area was 519,184 hectares in Hainan Province, with an output of 336,634 tons, accounting for over 40% of China’s total crude rubber production.3
The rapid expansion of natural rubber cultivation in the province changed the ecological function of the original tropical rain forest and caused an irreversible impact on the regional environmental environment (Zhai et al., 2012). The climate regulation function of the ecosystem was weakened when the rubber forests’ replacement occurred, which also caused the loss of biodiversity and a decline in species richness. Aside from fluctuating regional land-use features, natural rubber planting also hurts the soil ecosystem of rubber forests. Rubber forests have poor soil nutrient retention benefits, and pesticides, such as glyphosate and paraquat, aggravate the damage to the soil ecology of these forests (Xiao et al., 2014).
The data used in the study came from a household survey conducted in July 2019 in Hainan Province, China. We collected data via stratified random sampling. First, we randomly selected four cities: Haikou (northern Hainan Island), Sanya (southern), Danzhou (central), and Wanning (southern; for details, see the study area in Figure 2). Then, we selected residents of different districts of each city through random sampling. Specifically, the samples included 181 households in the Xiuying, Qiongshan, Meilan, and Longhua Districts of Haikou; 115 households in the Jiyang, Haitang, and Tianya Districts of Sanya; 104 households in Danzhou; and 121 households in Wanning (Danzhou and Wanning are cities at the county level and do not have districts). Thus, we randomly selected households based on the subdistricts of two towns and surveyed 521 households. For the survey, we used a structured questionnaire prepared in Chinese. The data collected by the questionnaire included residents’ socioeconomic characteristics, knowledge and awareness of environmental change, understanding of RPER programs, and willingness to participate. Before the survey, we provided professional training to all investigators to guarantee consistency in interview methods and coverage and minimize the errors caused by the subjective opinions of the investigators. We then conducted a preliminary test on the questionnaire through an online survey in June 2019 and modified the questionnaire based on the test. Finally, we performed face-to-face interviews with the sampled residents in the study area in July 2019. In order to make sure that all the respondents have been acknowledged with sufficient and consistent information, we pre-trained the investigators on how to provide the respondents with basic information about the environmental problems caused by the rubber plantations in Hainan and the possible ecological, economic, and social benefits that the RPER program may generate. This helped the respondents to understand the background of the RPER program and the environmental impacts of rubber plantations, allowing them to give truthful and objective responses based on their perceptions.
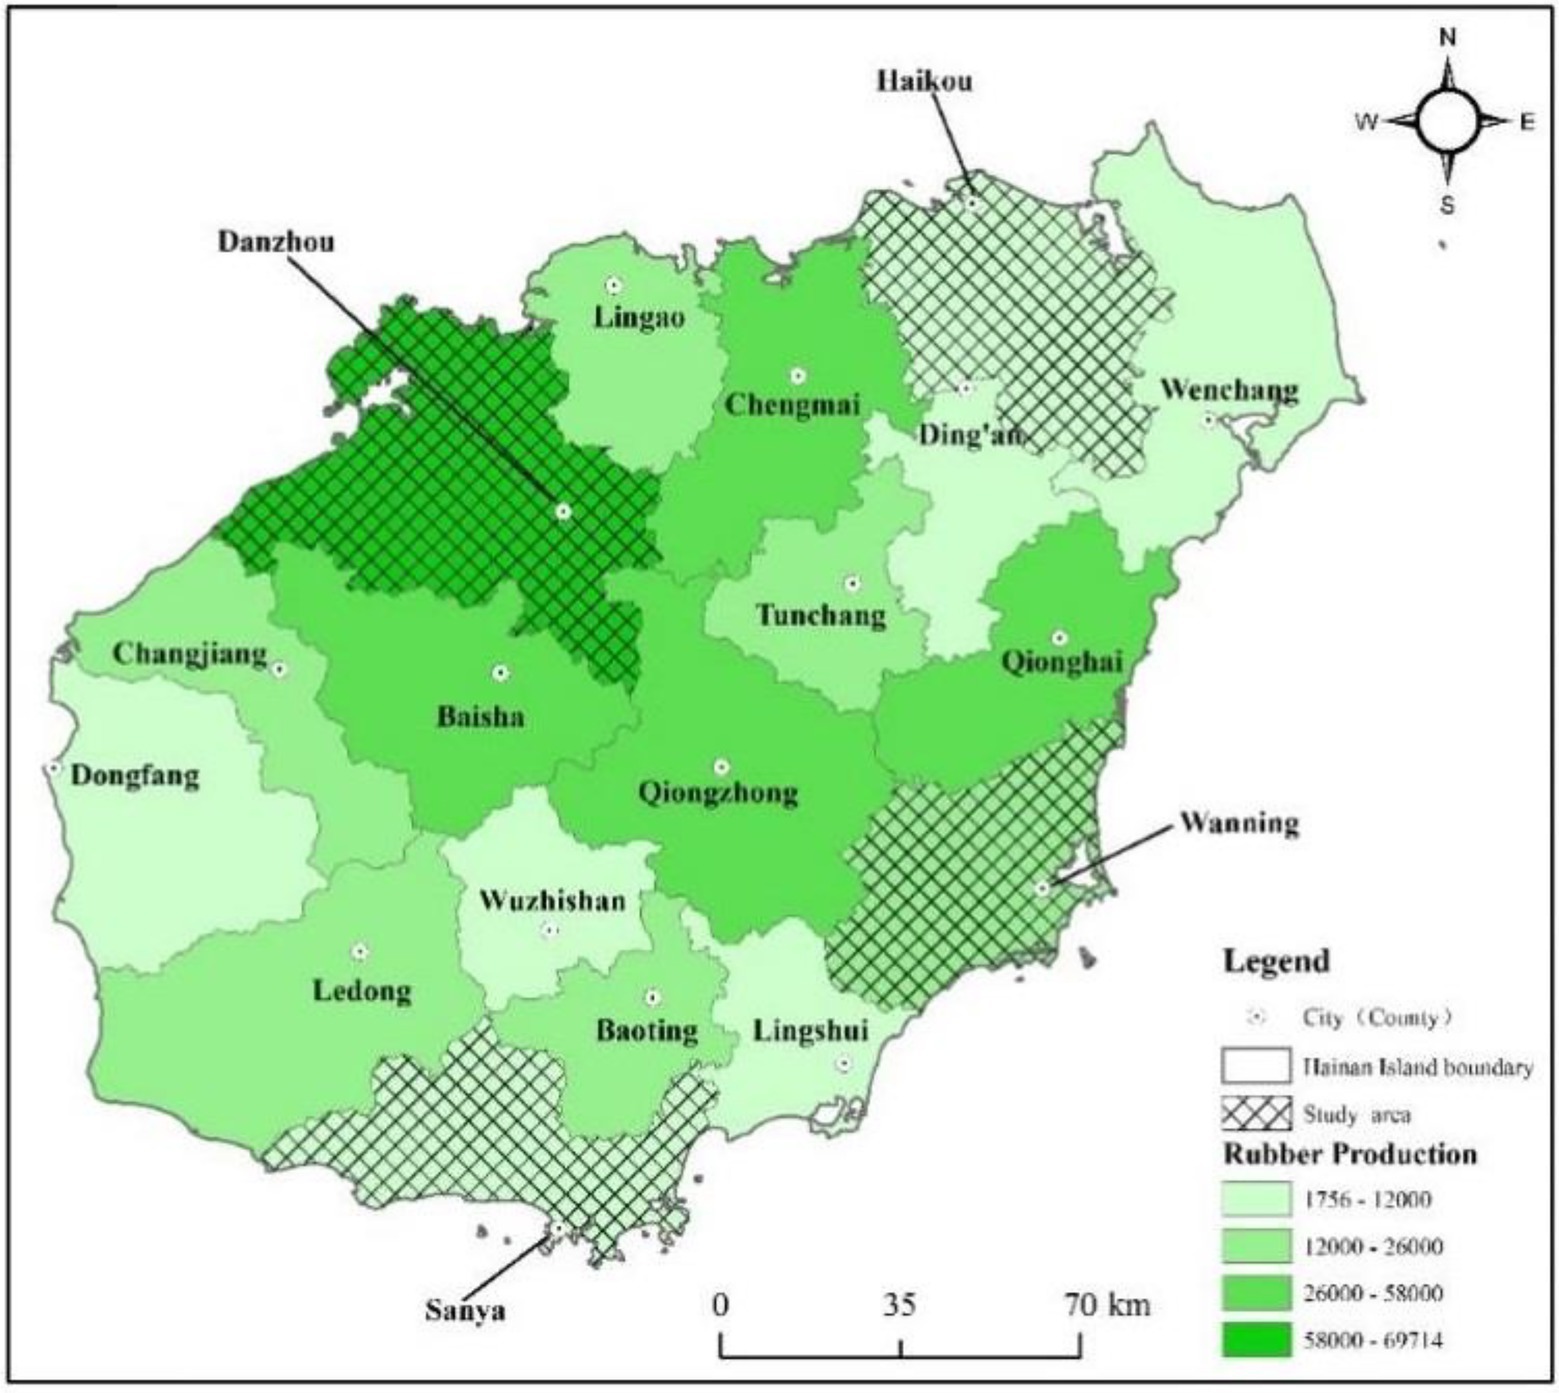
Figure 2. The study area.
The sample description statistics are presented in Table 2. Referring to existing studies, we select gender, age, education level, local or foreign residents, family burden, and income as the essential characteristic variables in this study (Estrada and De Vera, 2018; Blare et al., 2019; Xu et al., 2020; Shi et al., 2021). Age and education level are important factors impacting respondents’ WTP for ecological service products. In this study, the household head’s ages and education years are used to measure these two indicators. The income and family burden can reflect the wealth status of the households. The annual income of the respondents and the ratio between the number of non-working-age and working-age populations are used to measure these two indicators. As illustrated in the descriptive statistical results, the average age of the respondents is approximately 32.80 years old. The majority of the respondents are males (56%), the intermediate education level is around 12.65 years, and the proportion of residents (47.6%) is relatively small. The per capita income of the respondents is approximately CNY 88,000, which is consistent with the per-capita annual disposable income in the Hainan Province, and the average family burden is 0.97.
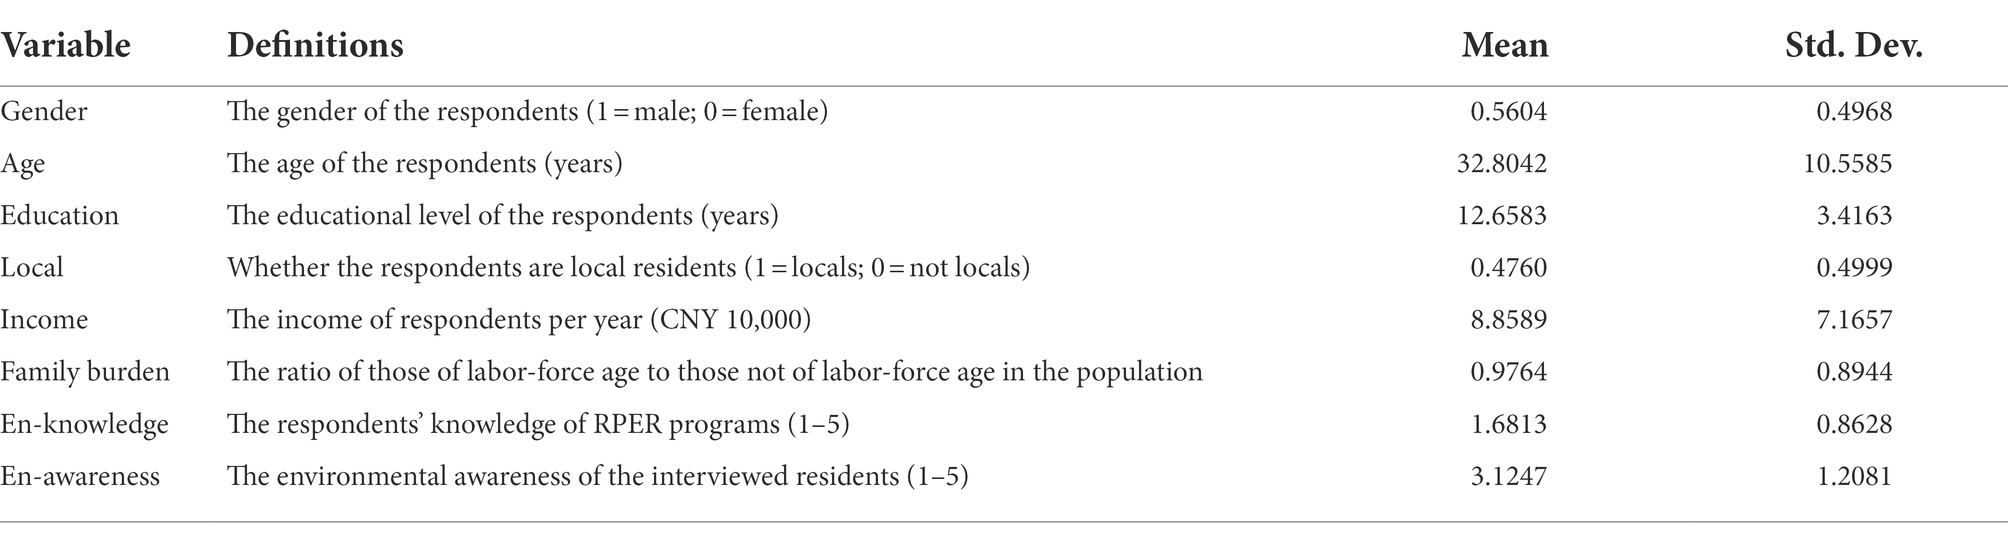
Table 2. Descriptive statistics.
We also include the respondents’ environmental perception variables, such as environmental awareness and environmental knowledge. Environmental awareness refers to whether residents are aware of the environmental problems caused by natural rubber plantations, which can be measured with the following question: “Do you agree that rubber plantations hurt Hainan’s ecosystem?” The respondents are asked to choose from the following options: 5 = strongly agree, 4 = agree, 3 = uncertain or unsure, 2 = disagree, and 1 = strongly disagree. The respondents’ average environmental awareness is 3.125, with a standard deviation of 1.208. Environmental knowledge reflects residents’ understanding of ecological production, such as the RPER programs’ mechanisms for preventing biodiversity reduction and controlling soil erosion. To measure it, we ask respondents the following question: “Do you know about some RPER programs that have been implemented and how they work?” The response options included the following: 5 = very much, 4 = much, 3 = average, 2 = a little, and 1 = hardly any. The statistical results indicate that the average environmental knowledge is 1.681, with a standard deviation of 0.862.
Table 3 illustrates the distribution of 521 respondents’ WTP. The bid value selected by the respondents in the PCs approach is the interval value classified as “low” and “high.” Since the respondents who selected the payment card value of 1,000 may have a real WTP higher than 1,000 (i.e., the “high value” is unknown), the “low value” of the WTP of the respondents is collected in this table. WTP data are obtained through the ICV survey, and the corresponding WTP assumptions can be divided into three different types: First, the participants’ own stated payment criteria are point data, and the real WTP* and probability distribution account for 79.85% of the total data (with 416 observations). Second, the payment scale selected by respondents from the payment card is the interval value, and the real WTP* and probability distribution account for 18.04% of the total (with 94 observations). Third, the highest payment scale selected by respondents from the payment card is the right merged data, and the real WTP* and probability distribution account for 2.11% of the total (with 11 observations).
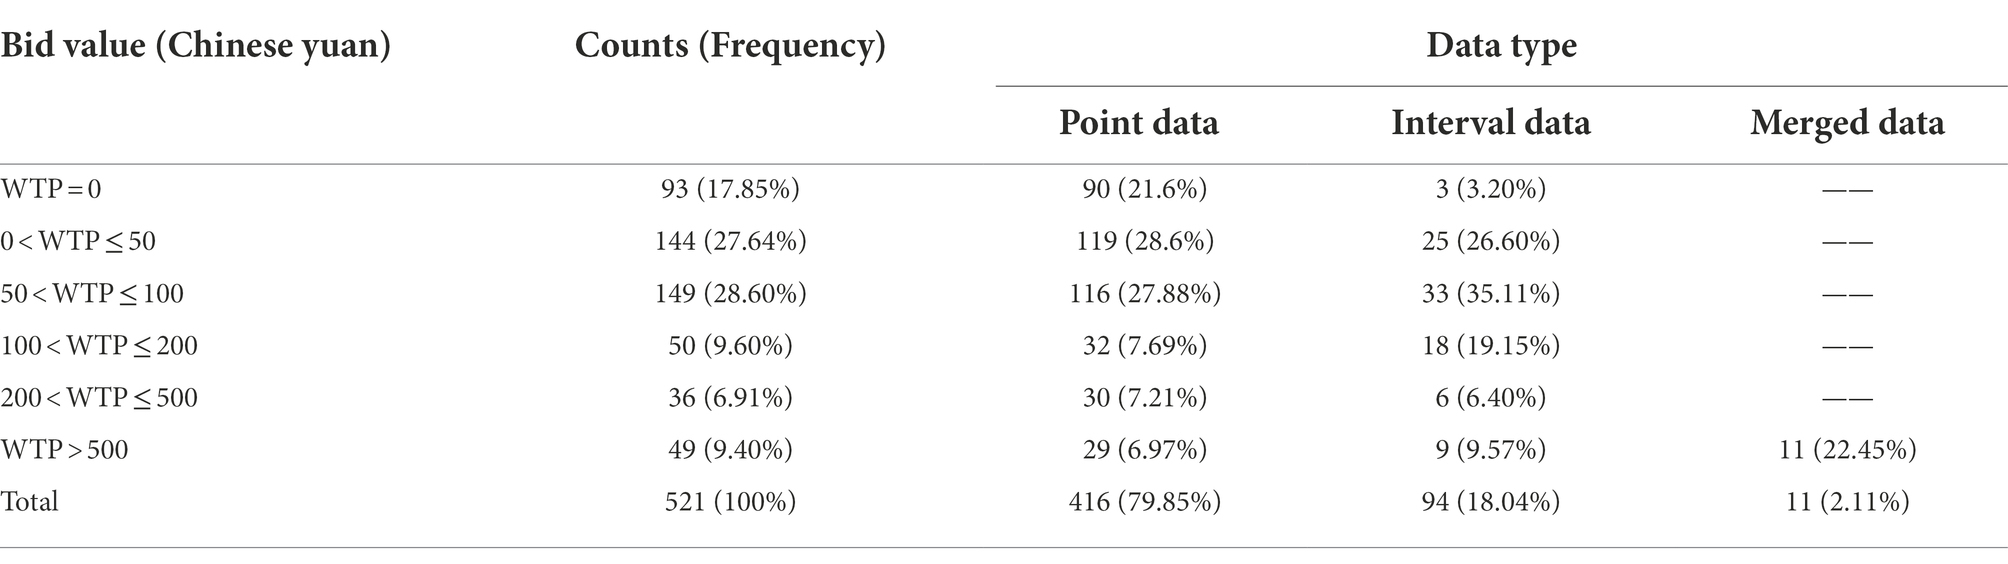
Table 3. Willingness to pay (WTP) distribution.
In this paper, we employed the PID model to analyze the factors influencing residents’ WTP for the RPER programs, and we also used the Tobit model as the baseline model for comparison. The results from the Tobit and PID models are illustrated in Table 4 separately. Column 1 and column 4 examines the benchmark effect of individuals’ characteristics on residents’ WTP, Column 2 and column 5 adds environmental awareness and knowledge to examine the impact of ecological perception on residents’ WTP, column 3 and column 6 adds the regional fixed effect to control the WTP difference between areas. The Wald chi-square tests in columns 1 to 6 are statistically significant at the 1% level, indicating an overall good degree of fit.
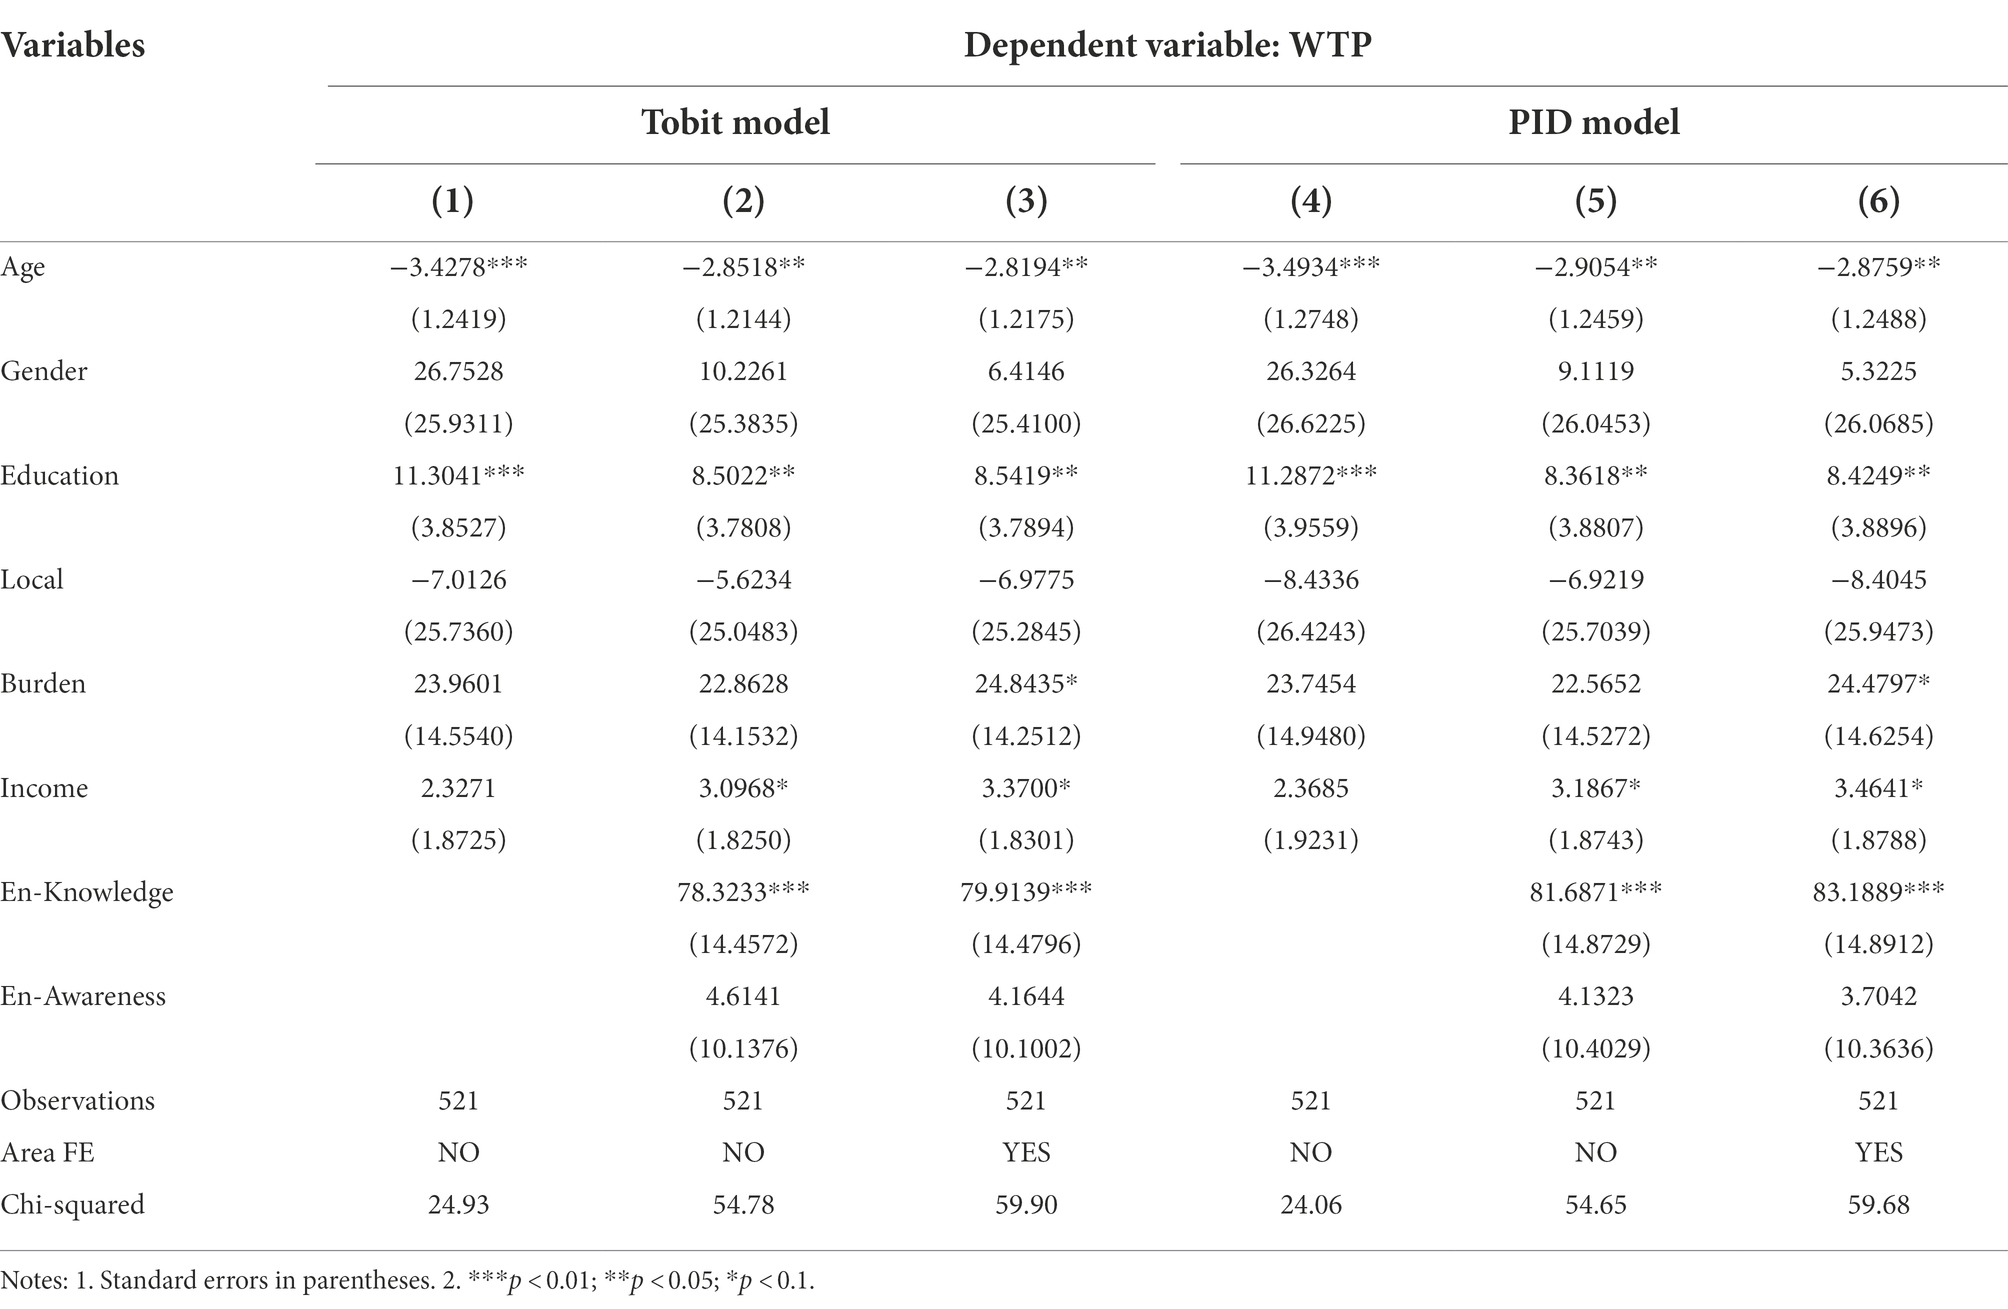
Table 4. Estimation results of the valuation function.
Table 4 presents the estimated results, and the influencing factors of respondents’ WTP have been analyzed. The results show that the differences in the estimations are not very substantial between the Tobit model and the PID model. Firstly, among the individual’s characteristic effects, columns 1 to 6 show that the respondents’ age significantly negatively impacts their WTP, which means the older the respondents are, the less money they are willing to pay. As older people have limited access to information, their access to environmental knowledge is insufficient and the quality of information is limited as well. Compared to the young population, the elder’s environmental awareness and information processing skills are relatively weaker. Additionally, the education level has a significantly positive effect on WTP, indicating that the respondents with high education levels have a heightened awareness of the importance of protecting the environment and are more inclined to pay for the RPER programs. The respondents’ gender and local (whether they are local residents) have no significant WTP effects. In columns 2 and 5, after controlling the residents’ environmental perception, the respondents’ income has positively and significantly affected their WTP, indicating that people with a stable income have a high WTP in ecological restoration actions. Secondly, columns 2 and 5 show the effect of environmental perception on residents’ WTP after adding environmental perception variables. The results show that respondents’ environmental knowledge has a significantly positive impact on WTP. In contrast, the respondents’ environmental awareness has no significant effect, which indicates that when residents are more knowledgeable about RPER programs, they are more willing to pay for the RPER programs. Finally, columns 3 and 6 show the main estimation results by adding the regional fixed effect to control the area’s WTP difference. After that, the coefficients of the variables have a slight difference, and the results remain stable, except for the resident’s burden has a positive effect on WTP (at the 10% level), which means that respondents with a sufficient family labor force have a high WTP in ecological restoration actions.
Based on the estimation results of the valuation function, we then calculate the expected WTP of the respondents for the RPER programs. Table 5 reports the calculation results of the Tobit and PID models separately. According to the estimation results, the expected value estimated by the PID model is 178 yuan per year per person, which is slightly higher than the Tobit model (174 yuan per person). Since the PID model is more accurate in its assumptions about respondents’ real WTP, the results estimated using the PID model are higher than those of the original Tobit model. Therefore, although there are minor differences in estimation results between the two models, the results still indicate that the interval model may underestimate the respondent’s WTP, and it might be a safe strategy to use the PID model in ICV studies.

Table 5. The calculation result of the individual’s WTP.
Due to different economic and environmental conditions, the residents’ WTP may have high heterogeneity in different areas. We analyze the regional difference in the respondents’ WTP as shown in Table 6. Table 6 reports the WTP of respondents in the four regions, indicating a wide variation. The residents who live in Danzhou have the highest WTP (with 209.3971 yuan per year on average), followed by the residents who live in Haikou (with 190.3794 yuan per yuan on average). Additionally, residents who live in Wanning are willing to pay 166.487 yuan per year for the RPER programs. In contrast, the residents who live in Sanya have the lowest WTP (with 144.5259 yuan per year on average).
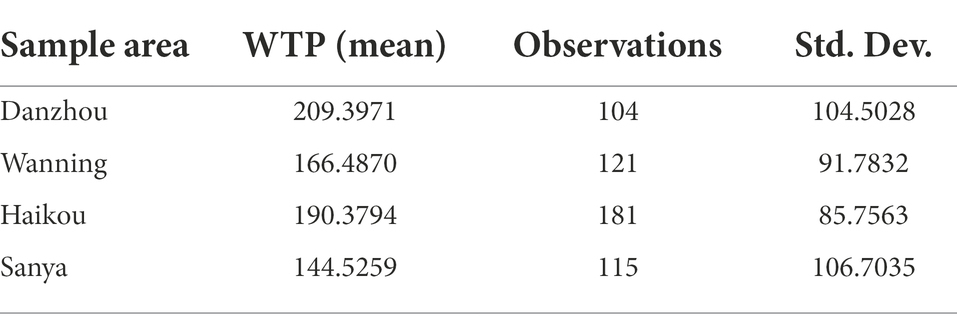
Table 6. Regional difference of the individual’s WTP.
Figure 3 shows the rubber planting area, rubber production, GDP, and WTP of the four cities, indicating heterogeneity in economic development and rubber plantation conditions within the study areas. Firstly, Danzhou has the highest rubber tree production in planting and output; rubber has become the primary local industry closely related to residents’ daily lives. Therefore, the residents of Danzhou experience more environmental problems due to rubber planting and being familiar with rubber plantations. They are more inclined to pay for the RPER programs. Secondly, although rubber planting is not a major industry in Haikou which is the capital city of Hainan Province with the highest level of education, urbanization, and economic development, contributing over 30% of the provincial GDP, Haikou residents are likely to be more exposed to promotional materials and information on ecosystem conservation due to its geographical advantage. As a result, they are more willing to pay for the RPER programs. In addition, the Sanya and the Wanning do not have the same economic development level as Haikou, nor are they the main natural rubber-producing area like Danzhou. Therefore, the residents in Sanya and Wanning have a relatively low WTP for RPER programs.
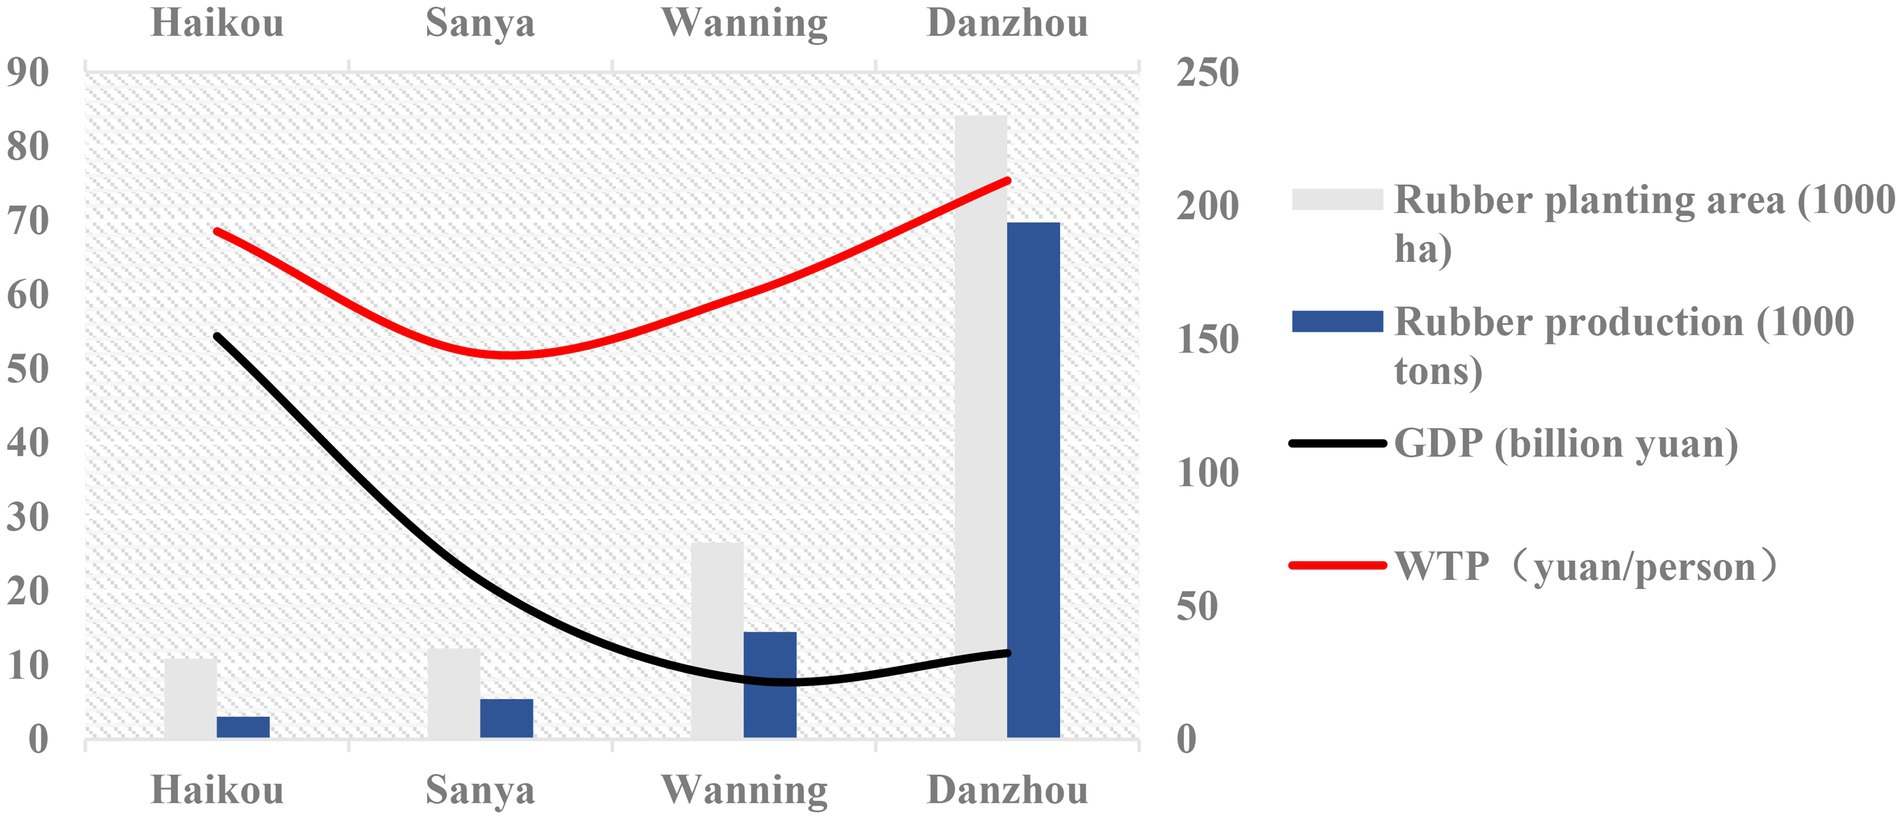
Figure 3. The WTP, rubber output, and GDP of the study area. The rubber output and GDP data are collected from the Hainan Statistical Yearbook (2019).
After calculating the expected value of respondents’ WTP, we can estimate the total non-market benefit of the RPER programs in Hainan Province. As mentioned in section 4.3, substantial differences exist in residents’ WTP for the RPER programs between the different areas in Hainan Province. Hence, to acquire more accurate results on WTP, the total non-market value of the RPER programs in Hainan Province needs to consider the regional difference. We divide 18 cities (counties) of Hainan Province into three groups based on the rubber planting and economic development conditions in those areas. Therefore, according to each group’s population and average respondents’ WTP, we can calculate the total non-market benefit of RPER programs in Hainan Province. Table 7 shows the grouping results and WTP.

Table 7. Grouping results and WTP of cities and counties in Hainan Province.
Figure 4 shows the rubber output, planting area, and GDP of all regions in Hainan Province. We divide the groups based on the following rules: firstly, the rubber planting area and output of Danzhou, Baisha, Qiongzhong, Chengmai, Tunchang, Qionghai, and Ledong are above the average level. Hence, we classify those seven areas as the main rubber-producing area into group A, and assume that the residents who live in those areas are willing to pay 209.3971 yuan per year (the WTP estimated by people who live in Danzhou in Table 7) for the RPER programs. Secondly, we classify Haikou as the highest economic development city into group C, with the residents who live there are willing to pay 190.3794 yuan per year. Finally, the rubber planting area and output of Wanning, Baoting, Lingao, Ding’an, Wuzhishan, Changjiang, Dongfang, Wenchang, Lingshui, Sanya are below average, and those areas’ economic development level is similar. Therefore, we classify those 10 areas into group B, and assume that residents who live in those areas are willing to pay 155.5065 yuan per year for the RPER programs, the same as the residents who live in Wanning.
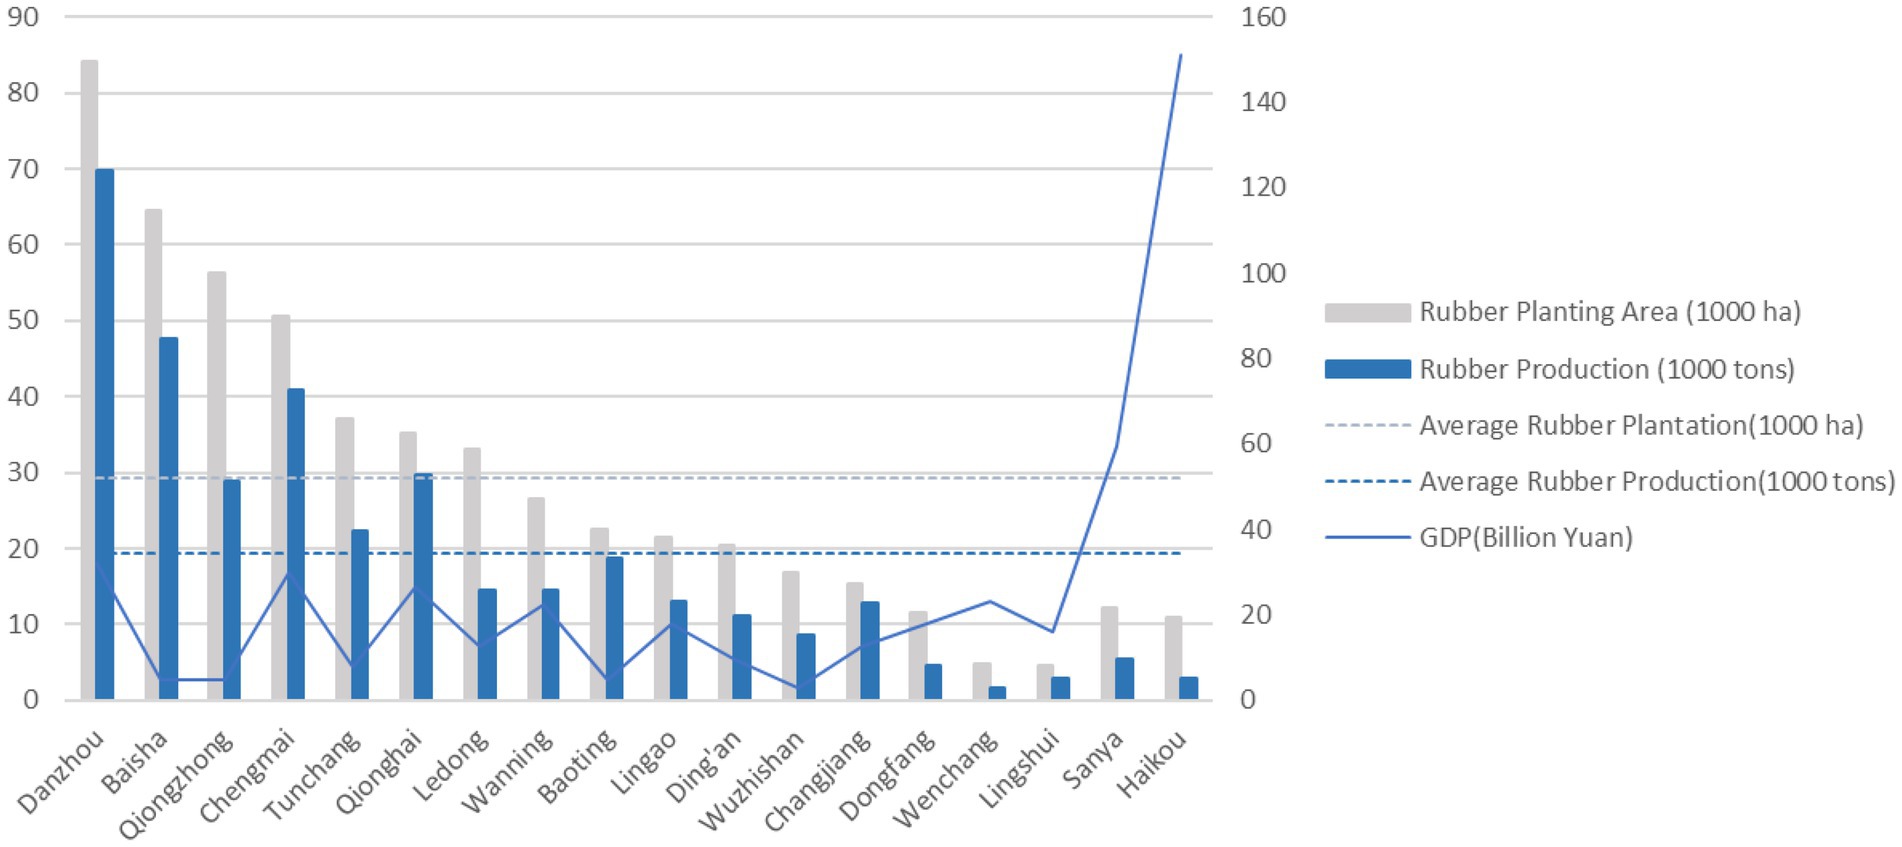
Figure 4. The rubber output, planting area, and GDP of all regions in Hainan. The rubber output and GDP data are collected from the Hainan Statistical Yearbook (2019).
After the classification, we calculate the total non-market benefits of the RPER programs in Hainan Province. Table 8 reports the calculation results. It indicates that the total non-market benefits of the RPER programs in Hainan are 1.839 billion yuan per year when considering the regional differences, which is higher than the calculation results with no consideration of the regional difference (with 1.807 billion yuan per year).
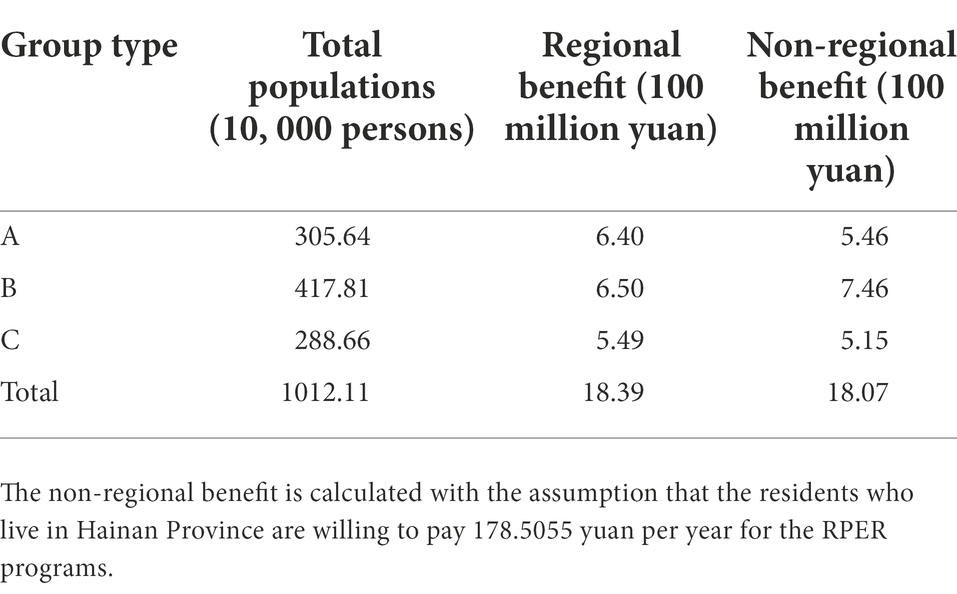
Table 8. The calculation result of the total non-market benefits of the Hainan Province.
The large area of natural rubber forest reduces the ecological services and functions of the original tropical rainforest ecosystem in Hainan and causes ecological and environmental problems, such as soil erosion, loss of biodiversity, and weakened climate regulation (Liu et al., 2016; Chakraborty et al., 2018). As mentioned in the introduction above, the RPER programs can effectively promote the transformation and upgrading of rubber plantation areas, which is an important initiative to improve the ecological environment, improve biodiversity and enhance the ecological function of rubber plantations. However, due to limited capital and technology, as well as the limitations of policies and regulations, RPER programs in China are still in the preliminary exploration stage and have not been effectively promoted (Gan et al., 2021). According to the externality theory, the RPER program can generate significant non-market values that happen to be preferred by external beneficiaries. This paper’s findings will help policymakers internalize the external benefits of the RPER program using policy tools such as taxes and subsidies to establish a rational ecological compensation mechanism. Policymakers can compensate environmentally friendly rubber plantations appropriately to achieve benefit adjustment and welfare equilibrium.
Besides, in our estimation results, we found that elderly respondents were willing to pay less. The possible reason for this is that older residents have more limited access to environmental knowledge and insufficient information quality, thus leading to their lower level of environmental awareness. This implies that, for older residents, policymakers can strengthen the publicity of ecological and environmental protection knowledge through newspapers, and television, which may help them to enhance their ecological awareness level and increase their WTP. Additionally, our results also show that residents with higher levels of education are more willing to pay higher amounts. Therefore, policymakers should allocate more resources to the construction of education infrastructure, which may increase the local community’s average education level and improve the residents’ WTP for the restoration programs. Moreover, we find that the respondents’ environmental knowledge plays an important role in enhancing their WTP. Therefore, policymakers should pay attention to environmental knowledge and awareness in ecological restoration programs. They should promptly inform the public about the implementation background, targets, operational mechanisms, and expected effects of such programs so that residents can access sufficient information about them.
In addition, the main contributions of this study are the following three points. Firstly, we used the ICV questionnaire method, which combines open-ended (OE) and payment cards (PCs). This method avoids the complex operation of closed-ended questionnaires and reduces the loss of information caused by respondents answering “yes” or “no” only. At the same time, this method avoids the problems of difficulty in answering a single open-ended questionnaire and starting point bias, and reduces the difficulty of answering the questionnaire. Secondly, according to the respondent’s questionnaire response style and bid value type, this study made more reasonable assumptions about the respondents’ WTP value domain. In addition, the PID model was used to assess the WTP more accurately and reduce the assessment bias. Finally, in addition to controlling for the essential economic characteristics of respondents, this paper also considers their environmental perceptions and regional differences as important factors affecting respondents’ WTP to obtain more accurate model estimation coefficients.
Furthermore, the following limitations of this study exist and need to be discussed in depth in the follow-up study. Firstly, the ICV survey research design needs to investigate the payment range, respondent characteristics, and sample size settings. Meanwhile, the choice experiments method can measure the attribute value of the assessed objects and is more acceptable to the respondents, which can effectively reduce information bias and survey bias, compared to the value assessment method. Secondly, due to differences in the regional economy, income, and consumption habits, different respondents have heterogeneity in the analysis of influencing factors of respondents’ WTP, affecting the analysis results. Therefore, sample heterogeneity can be considered in the latter study, and panel data can be used for further research to reduce the time and individual fixed effects. Third, based on this study’s external benefit measurement results, future studies can use the benefit transfer method to assess the external benefits of the eco-environmental service programs of the RPER. This method obtains the corresponding results from non-research sites at a low cost. Specifically, benefits transfer in non-research cities and counties in the province can be considered to enhance the accuracy of the results. In addition, the study can also consider benefit transfer outside the province by referring to Cui et al. (2021). For example, the benefits transfer method can assess the RPER program’s external benefits in Yunnan Province, China.
This study applied an ICV survey to assess the non-market value and analyze the determinants of implementing RPER programs in Hainan Province, China. Given the reasonable assumption of the respondents’ real WTP range, the PID model was employed for estimation. The results show that the mean value of WTP for the RPER program’s construction is 178 yuan per year, and the total non-market value throughout the province is worth approximately 1.839 billion yuan per year after controlling the regional differences. The per capita disposable income of Hainan residents is about 30,000 Yuan, and our calculated WTP accounts for about 6‰ of the above income, which is relatively affordable and reasonable.4 Also, based on our estimates and the various areas of natural rubber plantations in Hainan Province, the external benefits of implementing RPER programs were RMB 3,542 / ha. This value may serve as a reference for the design of ecological compensation standards in the future. In addition, individuals’ characteristics such as age, education level, family burden, income, and the residents’ environmental knowledge significantly impact the WTP for the restoration programs. We find that using the improved estimation methods can generate diverged results, and neglecting the bias caused by the usual interval data model would lead to downward biased estimates.
The estimation results of the non-market value demonstrate that the RPER programs do not merely comprise the traditional economic function but also have enormous social and ecological non-market value. Based on the results above, we further recommend the following suggestions to improve the level of public acceptance of RPER programs in China:
Firstly, our calculation results show that implementing RPER programs can bring about considerable social benefits. Still, Hainan Province has not established an ecological compensation mechanism for natural rubber plantations, one of the critical issues that policymakers must focus on in the future. Because, for natural rubber farmers, if there is not enough economic compensation, it is difficult for them to take ecological protection actions spontaneously.
Secondly, the policymakers should understand that public acceptance plays an essential role in implementing RPER programs, they should establish mechanisms to improve the transparency of RPER governance and gain public support. For example, they can design effective compensation mechanisms with the policy tool, such as taxes and subsidies for those residents who earn or lose economic value caused by the RPER programs. Hence, the residents who receive compensation can be motivated to participate in the programs.
Thirdly, given the unbalanced regional development in China, the government should not promote the same policies of RPER programs on a national scale. To ensure the smooth implementation of RPER programs, the government should use grading governance that considers the economic development and rubber plantation conditions within the corresponding regions.
Fourthly, the residents’ ecological perception, such as environmental awareness and knowledge, must be considered when the government wants to maximize the public’s potential support for RPER programs. For example, the government can elevate public awareness by strengthening its official social media or holding consultations to answer the public’s doubts.
The original contributions presented in the study are included in the article/supplementary material, further inquiries can be directed to the corresponding author/s.
Ethical review and approval was not required for the study on human participants in accordance with the local legislation and institutional requirements. The patients/participants provided their written informed consent to participate in this study.
DQ and YG initiated the research concept and framework. DQ, HL, and YG led the data collection. HL conducted data analysis and model results. DQ wrote the first draft of the manuscript. DZ and TX contributed to language control and revised the manuscript. All authors contributed to the article and approved the submitted version.
This study was supported by the National Natural Science Foundation of China (No. 72003054 and 72103052), Humanities and Social Sciences Program of the Ministry of Education (No. 19XJC790011), Hainan Provincial Natural Science Foundation of China (No. 722RC630 and 720RC576), National Natural Rubber Industry Technical System Industrial Economic Position (No. CARS-33), and Natural Rubber Industry Operation Early-warning System Construction Project (No. 18220015).
The authors declare that the research was conducted in the absence of any commercial or financial relationships that could be construed as a potential conflict of interest.
All claims expressed in this article are solely those of the authors and do not necessarily represent those of their affiliated organizations, or those of the publisher, the editors and the reviewers. Any product that may be evaluated in this article, or claim that may be made by its manufacturer, is not guaranteed or endorsed by the publisher.
WTP, Willingness to pay; CV, Contingent valuation; ICV, Integrated contingent valuation; RPER, Rubber plantation ecological restoration; PID, Point and interval data model; OE, Open-ended; PCs, Payment cards.
1. ^Source: 2018 Chinese Statistical Yearbook.
2. ^Source: http://www.xasw.gov.cn/info/1010/4878.htm
3. ^Source: https://www.catas.cn/contents/10/173418.html
4. ^Source: https://www.hainan.gov.cn/hainan/ndsj/202202/1860b21aed354a63a38111a0d28bf9ad.shtml
Adamowicz, W., Boxall, P., Williams, M., and Louviere, J. (1998). Stated preference approaches for measuring passive use values: choice experiments and contingent valuation. Am. J. Agric. Econ. 80, 64–75. doi: 10.2307/3180269
Ahrends, A., Hollingsworth, P. M., Ziegler, A. D., Fox, J. M., Chen, H., Su, Y., et al. (2015). Current trends of rubber plantation expansion may threaten biodiversity and livelihoods. Glob. Environ. Chang. 34, 48–58. doi: 10.1016/j.gloenvcha.2015.06.002
Blagodatsky, S., Xu, J., and Cadisch, G. (2016). Carbon balance of rubber (Hevea brasiliensis) plantations: a review of uncertainties at plot, landscape and production level. Agric. Ecosyst. Environ. 221, 8–19. doi: 10.1016/j.agee.2016.01.025
Blare, T., Donovan, J., and del Pozo, C. (2019). Estimates of the willingness to pay for locally grown tree fruits in Cusco, Peru. Renew. Agric. Food Sys. 34, 50–61. doi: 10.1017/S1742170517000333
Brock, W., and Xepapadeas, A. (2010). Pattern formation, spatial externalities and regulation in coupled economic–ecological systems. J. Environ. Econ. Manag. 59, 149–164. doi: 10.1016/j.jeem.2009.07.003
Brown, T. C., Bergstrom, J. C., and Loomis, J. B. (2007). Defining, valuing, and providing ecosystem goods and services. Nat. Resour. J., 47 329–376.
Cameron, T. A., and Huppert, D. D. (1989). OLS versus ML estimation of non-market resource values with payment card interval data. J. Environ. Econ. Manag. 17, 230–246. doi: 10.1016/0095-0696(89)90018-1
Cameron, T. A., and Quiggin, J. (1994). Estimation using contingent valuation data from a “dichotomous choice with follow-up” questionnaire. J. Environ. Econ. Manag. 27, 218–234. doi: 10.1006/jeem.1994.1035
Carson, R. T. (2000). Contingent valuation: a User’s guide. Environ. Sci. Technol. 34, 1413–1418. doi: 10.1021/es990728j
Carson, R. T. (2012). Contingent valuation: a practical alternative when prices aren’t available. J. Econ. Perspect. 26, 27–42. doi: 10.1257/jep.26.4.27
Carson, R. T., Groves, T., and List, J. A. (2014). Consequentiality: a theoretical and experimental exploration of a single binary choice. J. Assoc. Environ. Resour. Econ. 1, 171–207. doi: 10.1086/676450
Chaikumbung, M., Doucouliagos, H., and Scarborough, H. (2016). The economic value of wetlands in developing countries: a meta-regression analysis. Ecol. Econ. 124, 164–174. doi: 10.1016/j.ecolecon.2016.01.022
Chakraborty, K., Sudhakar, S., Sarma, K. K., Raju, P. L. N., and Das, A. K. (2018). Recognizing the rapid expansion of rubber plantation–a threat to native forest in parts of Northeast India. Curr. Sci. 114, 207–213. doi: 10.18520/cs/v114/i01/207-213
Chen, B., Li, X., Xiao, X., Zhao, B., Dong, J., Kou, W., et al. (2016). Mapping tropical forests and deciduous rubber plantations in Hainan Island, China by integrating PALSAR 25-m and multi-temporal Landsat images. Int. J. Appl. Earth Obs. Geoinf. 50, 117–130. doi: 10.1016/j.jag.2016.03.011
Chima, U. D., Qi, D., Wu, Z., Lan, G., and Chen, L. (2022). Diversity, interspecific interaction and abundance of undergrowth in monocultures and integrated Systems of Natural Rubber Plantation in Danzhou, southern China. J. For. Environ. Sci. 38, 75–89. doi: 10.7747/JFES.2022.38.2.75
Couix, N., and Gonzalo-Turpin, H. (2015). Towards a land management approach to ecological restoration to encourage stakeholder participation. Land Use Policy 46, 155–162. doi: 10.1016/j.landusepol.2015.01.025
Cui, W., Liu, J., Jia, J., and Wang, P. (2021). Terrestrial ecological restoration in China: identifying advances and gaps. Environ. Sci. Eur. 33, 1–14. doi: 10.1186/s12302-021-00563-2
Cui, W., Xiong, Q., Zheng, Y., Zhao, J., Nie, T., Wu, L., et al. (2022). A study on the vulnerability of the gross primary production of rubber plantations to regional short-term flash drought over Hainan Island. Forests 13:893. doi: 10.3390/f13060893
Daniels, R. C., and Rospabe, S. (2005). Estimating an earnings function from coarsened data by an interval censored regression procedure. Stud. Econ. Econ. 29, 29–46. doi: 10.10520/EJC21399
De Groot, R., Brander, L., Van Der Ploeg, S., Costanza, R., Bernard, F., Braat, L., et al. (2012). Global estimates of the value of ecosystems and their services in monetary units. Ecosyst. Serv. 1, 50–61. doi: 10.1016/j.ecoser.2012.07.005
Diao, J., Li, J., and Liu, X. (2016). Estimating of economic and social contribution and ecological loss for rubber plantation in Yunnan Province. Ecol. Econ. 32, 203–207.
Estrada, J., and De Vera, I. (2018). Socio-economic characteristics and willingness to pay for a clean air by the different sectors in the northeastern Pangasinan Airshed. South. Asian J. Sci. Tech. 3, 1–9.
Food and Agriculture Organization (2022). FAOSTAT. https://www.fao.org/faostat/zh/#search/rubber (Accessed March 12, 2022).
Gan, Y., Xu, T., Xu, N., Xu, J., and Qiao, D. (2021). How environmental awareness and knowledge affect urban residents’ willingness to participate in rubber plantation ecological restoration programs: evidence from Hainan, China. Sustainability 13:1852. doi: 10.3390/su13041852
Gao, T., Shen, L., and Liu, L. (2012). The impacts of rubber plantation on society, economy and eco-environment in Jinghong City. Resour. Sci. 34, 1200–1206.
Guo, Z., Zhang, Y., Deegen, P., and Uibrig, H. (2006). Economic analyses of rubber and tea plantations and rubber-tea intercropping in Hainan, China. Agro. Sys. 66, 117–127. doi: 10.1007/s10457-005-4676-2
Hanley, N., MacMillan, D., Wright, R. E., Bullock, C., Simpson, I., Parsisson, D., et al. (1998). Contingent valuation versus choice experiments: estimating the benefits of environmentally sensitive areas in Scotland. J. Agric. Econ. 49, 1–15. doi: 10.1111/j.1477-9552.1998.tb01248.x
Hausman, J. (2012). Contingent valuation: from dubious to hopeless. J. Econ. Perspect. 26, 43–56. doi: 10.1257/jep.26.4.43
He, J., and Zhang, B. (2021). Current air pollution and willingness to pay for better air quality: revisiting the temporal reliability of the contingent valuation method. Environ. Resour. Econ. 79, 135–168. doi: 10.1007/s10640-021-00556-y
Lan, G., Li, Y., Lesueur, D., Wu, Z., and Xie, G. (2018). Seasonal changes impact soil bacterial communities in a rubber plantation on Hainan Island, China. Sci. Total Environ. 626, 826–834. doi: 10.1016/j.scitotenv.2018.01.147
Lan, G., Yang, C., Wu, Z., Sun, R., Chen, B., and Zhang, X. (2022). Network complexity of rubber plantations is lower than tropical forests for soil bacteria but not for fungi. Soil 8, 149–161. doi: 10.5194/soil-8-149-2022
Li, S., Zou, F., Zhang, Q., and Sheldon, F. H. (2013). Species richness and guild composition in rubber plantations compared to secondary Forest on Hainan Island, China. Agrofor. Syst. 87, 1117–1128. doi: 10.1007/s10457-013-9624-y
Lienhoop, N., and MacMillan, D. (2007). Valuing wilderness in Iceland: estimation of WTA and WTP using the market stall approach to contingent valuation. Land Use Policy 24, 289–295. doi: 10.1016/j.landusepol.2005.07.001
Lindhjem, H., and Navrud, S. (2011). Are internet surveys an alternative to face-to-face interviews in contingent valuation? Ecol. Econ. 70, 1628–1637. doi: 10.1016/j.ecolecon.2011.04.002
Liu, X., Feng, Z., Jiang, L., Li, P., Liao, C., Yang, Y., et al. (2013). Rubber plantation and its relationship with topographical factors in the border region of China, Laos and Myanmar. J. Geogr. Sci. 23, 1019–1040. doi: 10.1007/s11442-013-1060-4
Liu, C., Guénard, B., Blanchard, B., Peng, Y. Q., and Economo, E. P. (2016). Reorganization of taxonomic, functional, and phylogenetic ant biodiversity after conversion to rubber plantation. Ecol. Monogr. 86, 215–227. doi: 10.1890/15-1464.1
Loomis, J. B. (2000). Environmental valuation techniques in water resource decision making. Journal of Water Resources Planning and Management, 126, 339–344.
Mahieu, P.-A., Riera, P., and Giergiczny, M. (2012). Determinants of willingness-to-pay for water pollution abatement: a point and interval data payment card application. J. Environ. Manag. 108, 49–53. doi: 10.1016/j.jenvman.2012.04.036
Meade, J. E. (1973). The theory of economic externalities: The control of environmental pollution and similar social costs. Vol. 2. United States Brill Archive.
Melindi-Ghidi, P., Dedeurwaerdere, T., and Fabbri, G. (2020). Using environmental knowledge brokers to promote deep green Agri-environment measures. Ecol. Econ. 176:106722. doi: 10.1016/j.ecolecon.2020.106722
Min, S., Bai, J., Huangan, J., and Waibel, H. (2018). Willingness of smallholder rubber farmers to participate in ecosystem protection: Effects of household wealth and environmental awareness. EForest Policy and Economics, 87:70–84. doi: 10.1016/j.forpol.2017.11.009
Otrachshenko, V., Tyurina, E., and Nagapetyan, A. (2022). The economic value of the Glass Beach: contingent valuation and life satisfaction approaches. Ecol. Econ. 198:107466. doi: 10.1016/j.ecolecon.2022.107466
Paço, A., and Lavrador, T. (2017). Environmental knowledge and attitudes and Behaviours towards energy consumption. J. Environ. Manag. 197, 384–392. doi: 10.1016/j.jenvman.2017.03.100
Qi, D., Lan, G., Chen, B., Sun, R., Xie, G., and Wu, Z. (2021). Review of ecological function of rubber plantation ecosystem. J. Biol. 38, 102–105. doi: 10.3969/j.issn.2095-1736.2021.01.102 (in Chinese)
Qiao, D., Li, W., Zhang, D., Yan, Y., and Xu, T. (2022). How do You want to restore?--assessing the public preferences and social benefits of ecological restoration for natural rubber plantation in China. Front. Environ. Sci. 10:823778. doi: 10.3389/fenvs.2022.823778
Qiu, R. T. R., Park, J., Li, S., and Song, H. (2020). Social costs of tourism during the COVID-19 pandemic. Ann. Tour. Res. 84:102994. doi: 10.1016/j.annals.2020.102994
Sardana, K. (2019). Tourists’ willingness to pay for restoration of traditional agro-forest ecosystems providing biodiversity: evidence from India. Ecol. Econ. 159, 362–372. doi: 10.1016/j.ecolecon.2018.12.015
Shi, Y., Li, C., and Zhao, M. (2021). Herders' aversion to wildlife population increases in grassland ecosystem conservation: evidence from a choice experiment study. Global Eco. Conser. 30:e01777. doi: 10.1016/j.gecco.2021.e01777
Solomon, B. D., and Johnson, N. H. (2009). Valuing climate protection through willingness to pay for biomass ethanol. Ecol. Econ. 68, 2137–2144. doi: 10.1016/j.ecolecon.2009.02.010
Song, Z., Yang, H., Tian, Y., Yang, Z., Yan, X., Yu, D., et al. (2018). Comparison of bird diversity between environment-friendly eco-rubber plantation and rubber pure Forest. For. Invent. Plan. 43, 47–52+67. doi: 10.3969/j.issn.1671-3168.2018.03.009
Sousa, S., Botelho, A., Pinto, L. M. C., and Valente, M. (2019). How relevant are non-use values and perceptions in economic valuations? The Case of Hydropower Plants. Energies 12:2986. doi: 10.3390/en12152986
Sun, R., Lan, G., Yang, C., Wu, Z., Chen, B., and Fraedrich, K. (2021). Effects of tropical rainforest conversion to rubber plantation on soil quality in Hainan Island, China. Biogeosci. Discuss., 1, 44–107.
Vasquez, W. F., and Trudeau, J. M. (2022). Willingness to give amid pandemics: a contingent valuation of anticipated nongovernmental immunization programs. Int. J. Health Eco. Manag. 22, 53–68. doi: 10.1007/s10754-021-09309-2
Whittington, D. (2002). Improving the performance of contingent valuation studies in developing countries. Environ. Resour. Econ. 22, 323–367. doi: 10.1023/A:1015575517927
Wigboldus, S., Hammond, J., Xu, J., Yi, Z. F., He, J., Klerkx, L., et al. (2017). Scaling green rubber cultivation in Southwest China—an integrative analysis of stakeholder perspectives. Sci. Total Environ. 580, 1475–1482. doi: 10.1016/j.scitotenv.2016.12.126
Wu, L., Ma, T., Bian, Y., Li, S., and Yi, Z. (2020). Improvement of regional environmental quality: government environmental governance and public participation. Sci. Total Environ. 717:137265. doi: 10.1016/j.scitotenv.2020.137265
Xiao, H. F., Tian, Y. H., Zhou, H. P., Ai, X. S., Yang, X. D., and Schaefer, D. A. (2014). Intensive rubber cultivation degrades soil nematode communities in Xishuangbanna, Southwest China. Soil Biol. Biochem. 76, 161–169. doi: 10.1016/j.soilbio.2014.05.012
Xu, T., Ni, Q., Yao, L. Y., Qiao, D., and Zhao, M. J. (2020). Public preference analysis and social benefits evaluation of River Basin ecological restoration: application of the choice experiments for the Shiyang River, China. Discret. Dyn. Nat. Soc. 2020, 1–12. doi: 10.1155/2020/1345054
Yao, X., He, J., and Bao, C. (2020). Public participation modes in China’s environmental impact assessment process: an analytical framework based on participation extent and conflict level. Environ. Impact Assess. Rev. 84:106400. doi: 10.1016/j.eiar.2020.106400
Zhai, D. L., Cannon, C. H., Slik, J. F., Zhang, C. P., and Dai, Z. C. (2012). Rubber and pulp plantations represent a double threat to Hainan’s natural tropical forests. Journal of Environmental Management 96, 64–73. doi: 10.1016/j.jenvman.2011.10.011
Zhang, J., and Xue, D. (2013). The impacts of rubber plantation on the eco-environment in Xishuangbanna of Yunan Province. Chin. Popul. Resour. Environ. 23, 304–307.
Zhao, N., Wang, Z., Xu, M., Zhou, X., and Zhang, C. (2015). Influence of rubber cultivation on the Auatic ecology of the Naban River. J. Tsinghua Univ. (Sci. Tech.) 55, 1296–1302. doi: 10.16511/j.cnki.qhdxxb.2015.24.005
Keywords: integrated contingent valuation, willingness to pay, RPER programs, point and interval data model, non-market value, nature rubber
Citation: Qiao D, Liu H, Zhang D, Xu T and Gan Y (2022) Chasing the unbiased willingness to pay: Using an integrated contingent valuation survey in estimating the non-market value of rubber plantation ecological restoration programs in China. Front. Ecol. Evol. 10:983553. doi: 10.3389/fevo.2022.983553
Edited by:
Ashutosh Kumar Singh, National Botanical Research Institute (CSIR), IndiaReviewed by:
Shuyao Wu, Shandong University, ChinaCopyright © 2022 Qiao, Liu, Zhang, Xu and Gan. This is an open-access article distributed under the terms of the Creative Commons Attribution License (CC BY). The use, distribution or reproduction in other forums is permitted, provided the original author(s) and the copyright owner(s) are credited and that the original publication in this journal is cited, in accordance with accepted academic practice. No use, distribution or reproduction is permitted which does not comply with these terms.
*Correspondence: Yu Gan, eXVnYW5Aemp1LmVkdS5jbg==
Disclaimer: All claims expressed in this article are solely those of the authors and do not necessarily represent those of their affiliated organizations, or those of the publisher, the editors and the reviewers. Any product that may be evaluated in this article or claim that may be made by its manufacturer is not guaranteed or endorsed by the publisher.
Research integrity at Frontiers
Learn more about the work of our research integrity team to safeguard the quality of each article we publish.