- 1Department of Biological Sciences, Texas Tech University, Lubbock, TX, United States
- 2Department of Natural Resources Management, Texas Tech University, Lubbock, TX, United States
Premise: We investigated whether phylogenetic conservatism can improve the performance of seed germinability prediction models. Previous studies in tallgrass prairie and alpine meadow revealed that seed morphological traits demonstrate phylogenetic conservatism. We hypothesized that phylogenetic conservatism in seed traits could help predict the seed germinability, under the assumption that seed traits contain phylogenetic signals.
Methods: We measured seed germination percentage and seed morphological traits (seed mass, seed height, and seed surface area) on 34 native species from shortgrass prairie in North America. We supplemented these data with similar data from the literature on 11 more species. We calculated the robustness of the phylogenetic signal of each trait to the number of species sampled. We also compressed the phylogenetic distance matrix to a two-dimensional space, and applied the Akaike information criterion to evaluate the effects of phylogeny on seed germinability prediction models.
Key results: We found weak but significant phylogenetic signals in seed mass and seed height in the full data set. These phylogenetic signals were not able to improve seed germinability prediction model performance among shortgrass prairie species. Our robustness tests of phylogenetic signals using random sub-sampling showed that the detection rate of phylogenetic signals in seed mass was increased along with the expansion of species pool, and nearly 100% at 40 species. However, the detection rate of phylogenetic signals in seed height was constantly low, around 20%.
Conclusion: When the phylogenetic signals are weak, the phylogenetic position does not improve germinability prediction model performance. Therefore, phylogenetic signals detected during a single species pool calculation may not accurately reflect the phylogenetic conservatism of the trait in a plant community. We suggest testing for robustness of phylogenetic signals using random sub-sampling tests.
Introduction
The need for ecological restoration is constantly increasing. For example, the September 2014 United Nations Climate Summit suggested the need for 350 million hectares to be restored worldwide by 2030 (Bonn Challenge, https://www.bonnchallenge.org/). Tremendous numbers of native species will be needed to meet this need. Most ecological restoration projects select only a small number of species out of the community species list to conduct ecological restoration (Kiehl et al., 2010). Given the low numbers of species selected for any specific restoration project, maximizing the benefit from selected species is key. Thus, ensuring that the selected species have high final germination percentages is a high priority because seed germination ranks as one of the top restoration challenges (Larson et al., 2015). Therefore, lab assessment formulas to narrow down the restoration species list could aid species selection in many restoration projects.
Seed dormancy regulates seed germination but is complicated and hard to predict. In over 90% of species, seeds dry and start primary dormancy by the time of harvest (Finch and Leubner-Metzger, 2006; Subbiah et al., 2019). After dispersal, seeds can have secondary dormancy, a shallow physiological dormancy which is broken by responses to environmental cues (Finch and Leubner-Metzger, 2006). Multiple categorical seed dormancy types are widely represented in plant species, including morphological dormancy (MD), physical dormancy (PY), physiological dormancy (PD), and morphophysiological dormancy (MPD; Baskin and Baskin, 1998). Physiological dormancy is thought to be the ancestral state of seed dormancy and also serves as the diversification hub for different dormancy types (Willis et al., 2014). Considering the complexity of dormancy stages and the lengthy experiments needed to distinguish these types (Finch and Leubner-Metzger, 2006), it is desirable to predict seed germinability success through other related traits.
Low germination rate hinders restoration and, given limited resources, managers desire to only include species with predictably high germination rates. Several seed traits are related to seed germination and might serve as more easily measured predictors of final germination percentage. In general, mass is a good indicator of seed germination, as small seeds tend to germinate faster (Westoby et al., 2002; Barak et al., 2018), while large seeds can stay dormant longer and produce stronger seedlings after germination (Leishman et al., 2000; Westoby et al., 2002). The rationale behind this phenomenon is related to nutrition stored in the seed under either a “larger-seed-later-deployment” interpretation (Ganade and Westoby, 1999; Leishman et al., 2000; Kidson and Westoby, 2000) or “cotyledon functional morphology” hypothesis (Hladik and Miquel, 1990; Kitajima, 1996a,b). Furthermore, seed size and seed shape are also traits influencing seed germination by stimulating or delaying seed germination through wind, water, or animal dispersal (Howe and Smallwood, 1982). Large seeds generally have advantages for dispersal related to entrapment strategies, such as net trapping, surface tension, and wake trapping (Jager et al., 2019), especially for wind-dispersed species (Zhu et al., 2019). Specifically, seed morphological traits influence both seed primary dispersal (seed departure from parent plants) and secondary wind dispersal (seed lifting off the ground by wind power; Zhu et al., 2019). Primary dispersal is mainly driven by dispersal height and terminal falling velocity, which are influenced by seed morphology (Sheldon and Burrows, 1973; Jongejans and Telenius, 2001). Secondary dispersal distance strongly depends on the lift-off velocity, which is influenced by seed height and seed surface area (van Tooren, 1988; Schurr et al., 2005; Zhu et al., 2022). There are many other seed physiological traits associated with seed germination that are not commonly tested, such as base water potential, cardinal temperature, thermal time and hydrothermal time for germination (Bradford, 2002; Hardegree et al., 2013).
Seed germination trials are time consuming, therefore, predicting germinability for species without conducting such trials could benefit restoration. Seed morphology traits are potential predictors of germination rate. If dormancy and lack thereof are evolutionarily conserved, then it may be possible to predict seed germination rate of unmeasured species based on the rates of closely related taxa. A phylogenetic tree models the inferred evolutionary branching history of a group of taxa (Baum and Smith, 2013). A phylogenetically conserved trait will tend to be most similar among species close together on the phylogenetic tree. The common test for such phylogenetic signals is Blomberg’s K (Blomberg et al., 2003, Revell et al., 2008), but it is also possible to include all pairwise phylogenetic distances among taxa in linear models through the method of phylogenetic residuals (Revell, 2010). Phylogenetic trait conservatism is common across many traits and clades (Bu et al., 2016; Barak et al., 2018; Duncan et al., 2019). Adding phylogenetic residuals to the generalized least square model can take the evolution of unmeasured traits into account and improve the prediction model’s accuracy. This work has two major goals. The first goal is to test whether adding phylogenetic information among species (presented by x-y coordinates transferred from phylogenetic tree topology) can improve predictions of germination rate based on seed morphology. Adding phylogenetic information might improve predictions if the germination rate shows a phylogenetic signal or if the seed morphology effect on germination rate interacts with phylogeny. There is precedent for using phylogeny for this purpose: In a study of species native to tallgrass prairie, Barak et al. (2018) confirmed that adding the phylogenetic residual improved the accuracy of the seed germinability prediction model due to the phylogenetic conservatism in both seed germination and morphological traits. However, because phylogenetic tools are unfamiliar and inaccessible to restoration practitioners and due to a historical separation between evolutionary biology and applied ecology, phylogenetic methods have not been broadly applied to restoration practice (Hipp et al., 2015).
The second major goal of this work is to determine how the size of a sample of taxa from an ecological community influences the power to detect phylogenetic signals in traits. The sample size and combination of given species influence tree topology and branch length during phylogenetic signal calculation. In empirical examples, the detection of phylogenetic signals is strongly related with the number of species included, with 20 or more species usually considered sufficient for estimation of Blomberg’s K (Blomberg et al., 2003). However, in phylogenetic comparative analysis aimed at answering evolutionary questions, the combination of species is commonly fixed. For applied restoration use, the practitioner will need to measure traits on some sample of species from a particular community. By examining how this sample of taxa influences the calculation of Blomberg’s K, we aim to provide guidelines for estimating the robustness of this calculation.
To address these two major goals and test the potential role of phylogeny for improving restoration practice, we asked four research questions: (1) Do seed traits and seed final germination percentages exhibit phylogenetic signals? (2) Among seed traits, which one is the best predictor of seed final germination percentage? (3) Does including phylogenetic residuals improve the seed germinability prediction? (4) Do the sampling size and species composition influence phylogenetic conservatism detection in shortgrass prairie species?
Materials and methods
To determine the relationship between seed germinability and seed morphological traits, we measured seed germination percentage, seed mass, seed height, and seed surface area in 45 species which are native to the shortgrass prairie of North America (Table 1; Figure 1). All of our raw data and calculations were demonstrated in our interactive Shiny Application (Figure 2; https://chenyanniii.shinyapps.io/Phylo_Compar_Traits/).
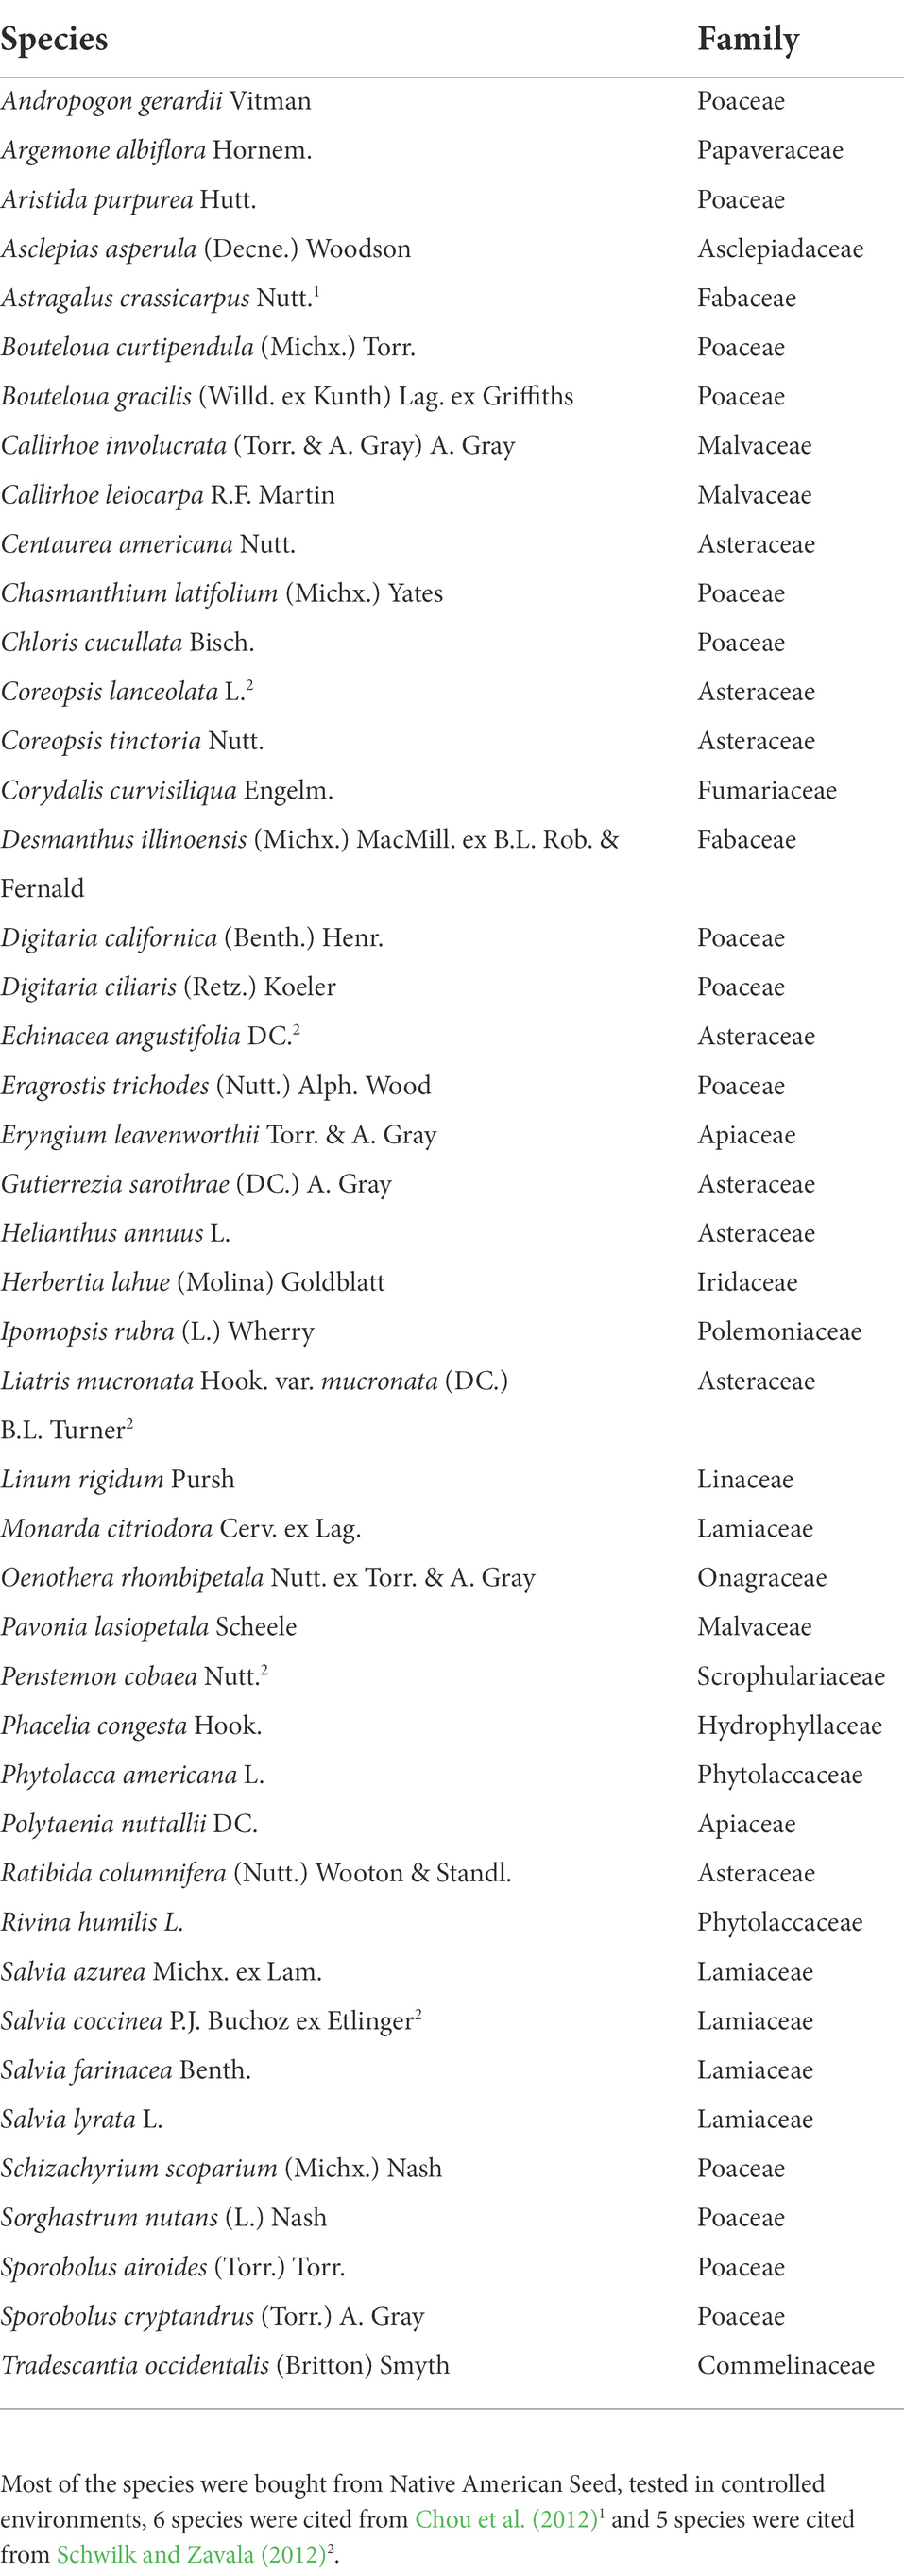
Table 1. Forty-five native species were selected in this study, which are commonly involved in restoration practice and range management in shortgrass prairie.
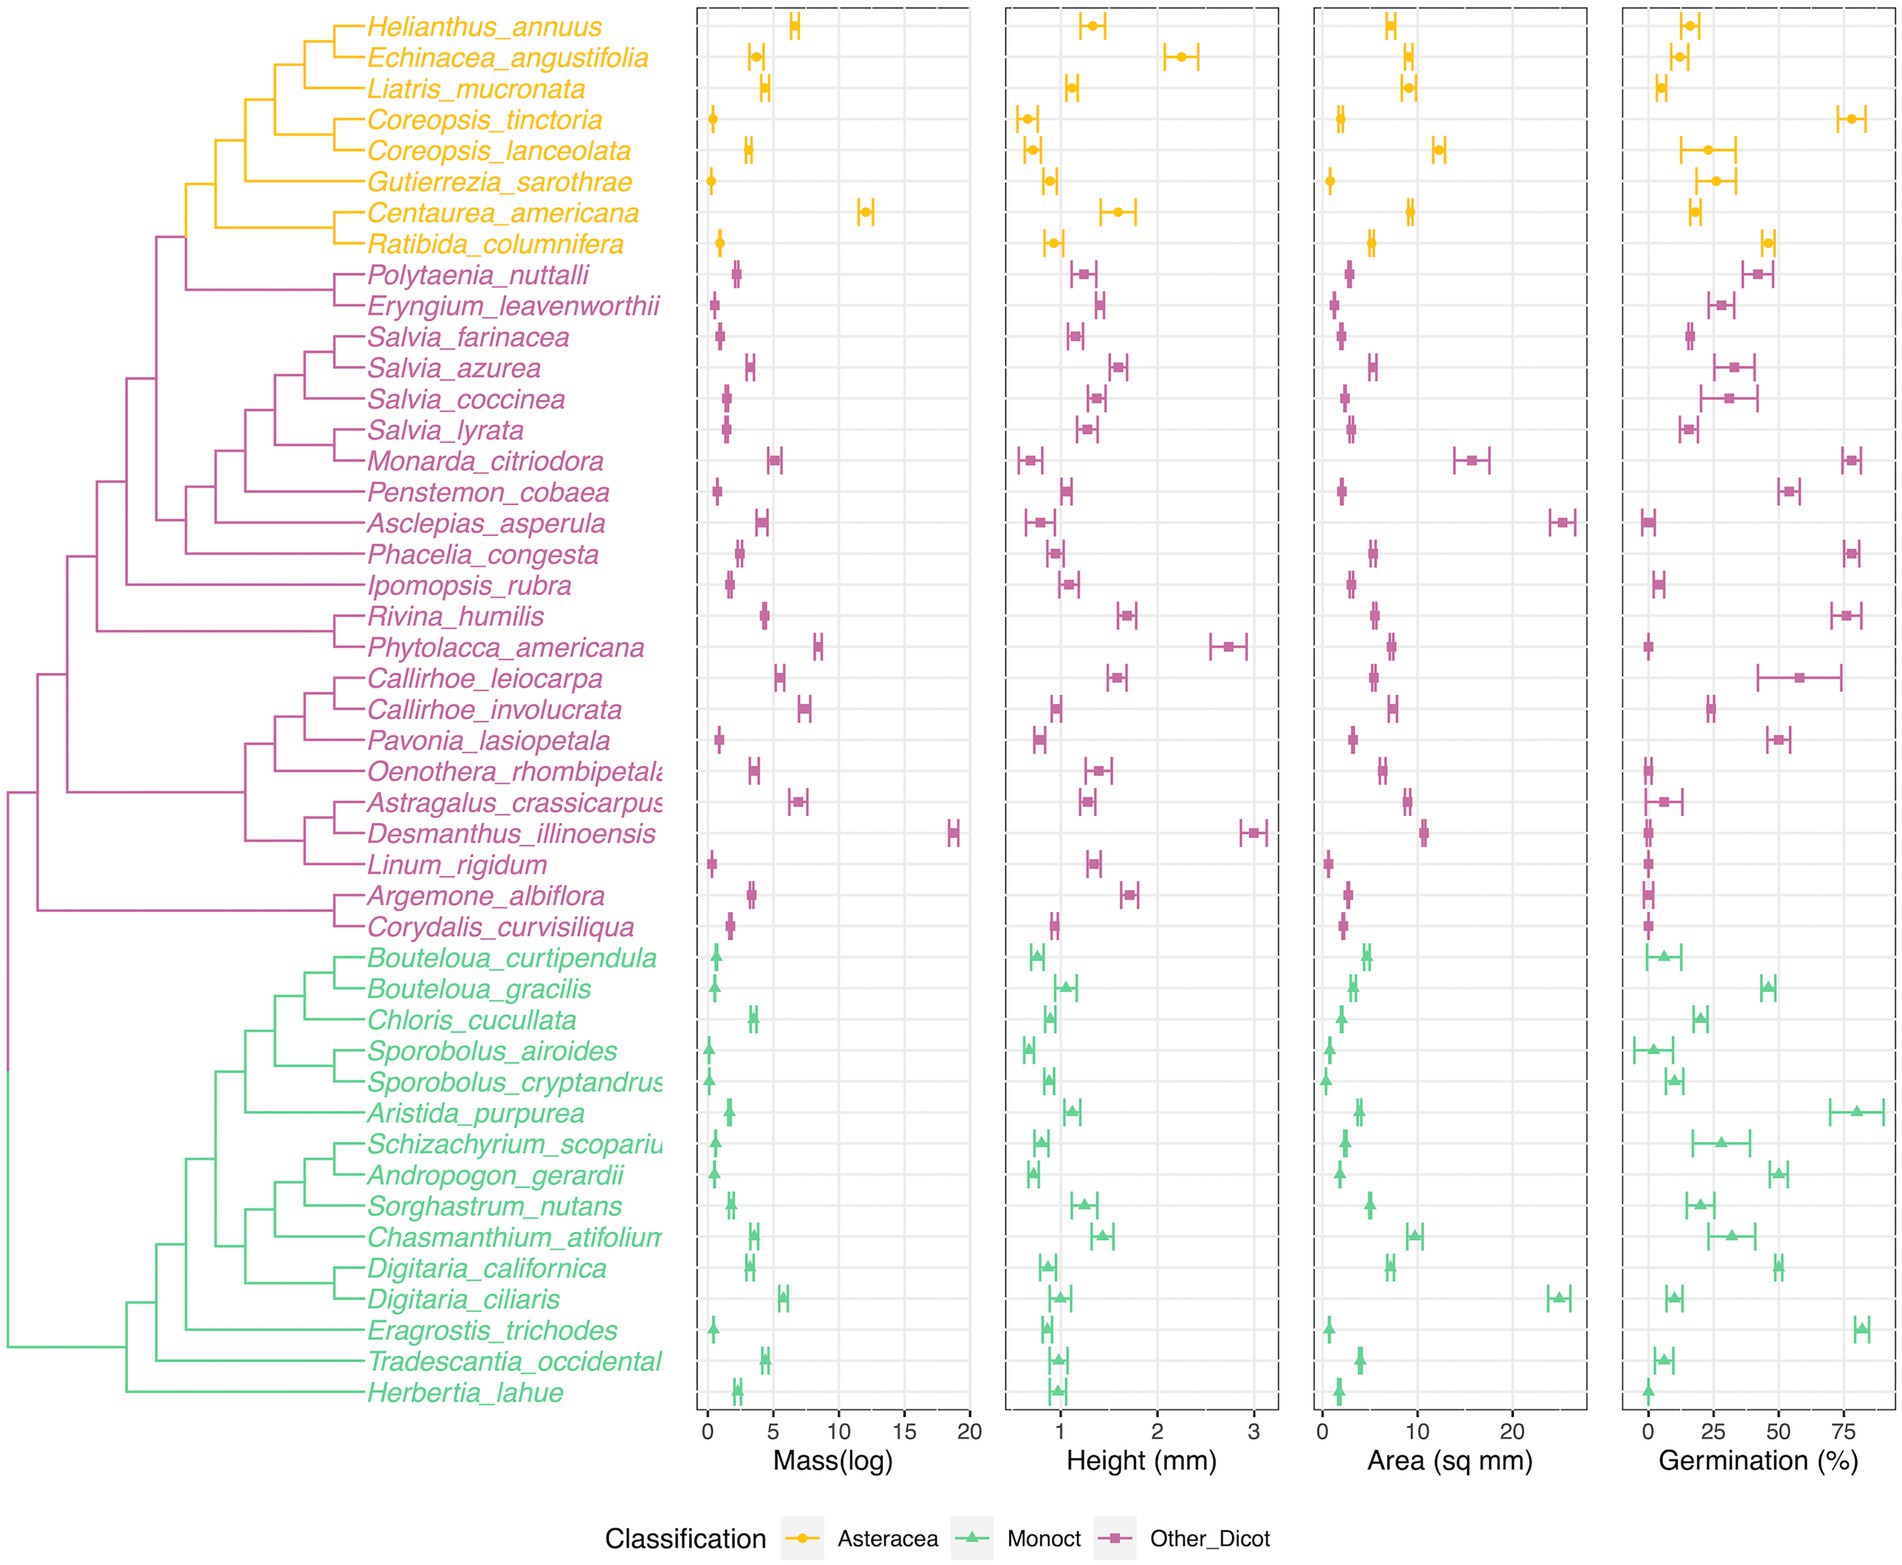
Figure 1. Phylogenetic tree of species and species seed traits values (seed mass, seed height) distribution along the phylogenetic tree. Phylogenetic tree was generated from the pruned Zanne et al. tree (Zanne et al. 2014), including 15 species (Astragalus crassicarpus, Argemone albiflora, Asclepias Asperula, Callirhoe leiocarpa, Centaurea americana, Chasmanthium tifolium, Corydalis curvisiliqua, Digitaria californica, Eragrostis trichodes, Herbertia lahue, Linum rigidum, Pavonia lasiopetala, Polytaenia nuttallii, Tradescantia occidentalis, Liatris mucronata) were placed within under the same genus/family. The center of each plot is the mean value, the other two lines are −/+ standard errors. The colors were coded corresponding to the grouping of phylogenetic positions (Figure 3).
Seed germination percentage and morphological traits measurements
Seed germination percentage was obtained from two sources: our own germination trials and previous publications. In all cases, we defined “germination percentage” as the maximum final germination percentage obtained. The germination trials followed a simple germination protocol without cold stratification or other attempts to break dormancy, which simulated minimum requirements for restoration projects. This simple protocol is essentially a measurement of lack of dormancy assuming the tested seeds were full viable. For 34 of the 45 species, we conducted new germination trials. Our new germination trials were trying to simulate the scenario that practitioners want to find some easy to use native species. Because the experiment is trying to simulate the scenario in which practitioners are attempting to find easy to use native species, we bought seeds from a local restoration seed vendor (Native American Seed), and chose species for which they offered local seed sources (and recorded the seed source), with seeds that were harvested less than 6 years ago. When seeds arrived, we stored the seeds in a dry and dark place at room temperature (20°C) until experiments started. Although it’s possible that some species may exhibit dormancy, we did not use any dormancy breaking treatment, in order to simulate simple restoration practice. For the germination experiment, we used triple replicated germination trials: disposable petri dishes with lids were placed in germination chambers (20°C day and night, with 15 and 9 h day night shift). Inside a petri dish a piece of filter paper was placed to observe auto-claved water to keep the seeds moist. We checked the water sufficiency every day. In each germination trial we split a total of 50 seeds of each species into 5 petri dishes. Since our study used commercial seeds and focused on species dormancy status, we assumed our seeds will either be dormant or start germination within a month. Our observations during experiments proved this assumption. The seeds generally started germinating within 10 days or stayed dormant through the whole germination trial. Our germination trials ran until 1 week after the last seed germinated. Most of the seed germination trials finished within a month, and all the trials finished within 2 months. Three independent trials happened in July 2019, September 2019, and November 2019. For the remaining 11 species, we used final germination percentages reported in two published studies (Chou et al., 2012; Schwilk and Zavala, 2012). These two studies were originally designed for detecting smoke effects on shortgrass prairie species, but we used the control treatment data only which provided conditions similar to those in our trials (20–25°C, 12–16 h illumination).
We measured seed mass using an electronic balance (Sartorius Analytical Balance LA 230P, 0.1 mg readability) in lab conditions with 10 replicates of 100 seeds each per species. For species in which we could not obtain 100 seeds, we used 30 seeds per replicate.
We measured seed surface area and seed height through digital image processing with 10 replicates. The seed surface was defined by the two largest orthogonal axes, the height was defined as the third axis. We calculated the seed surface area by digital image of the maximum surface area of seeds and imaged under a stereomicroscope at 400 magnification. We transformed the images to 8-bit (black and white) and calculated the surface area using the “analyze particle” function in ImageJ (Schindelin et al., 2012). We also recorded the seeds’ heights calculated by the z-stack image function and NIS-Element BR 4.60.00 software.
Species phylogenetic information
We generated a phylogenetic tree of all study species using two methods: pruning existing phylogeny (Zanne et al., 2014) and binding non-existing tips to the phylogeny based on their taxonomic information. The phylogeny (Zanne et al., 2014) we used in this study was a time-calibrated maximum-likelihood-based phylogenetic tree, built with seven genes (18S rDNA, 26S rDNA, ITS, matK, rbcL, atpB, and trnL-F) downloaded from GenBank. First, we confirmed that every genus in our study was on the Zanne phylogeny. Second, we created a function to prune species which were not on the tree, and we also swapped the species under the same genus if the exact species was not on the tree (see the function of func_prun_replac on https://github.com/chenyanniii/Traits4 repo for more detail). The results showed that 30 species on the tree and 15 missing species (Argemone albiflora, Asclepias asperula, Astragalus crassicarpus, Callirhoe leiocarpa, Centaurea americana, Chasmanthium latifolium, Corydalis curvisiliqua, Digitaria californica, Eragrostis trichodes, Herbertia lahue, Liatris mucronata, Linum rigidum, Pavonia lasiopetala, Polytaenia nuttallii, and Tradescantia occidentalis). After applying func_prun_replac, 13 of 15 species were placed based in their genus and only two species (Callirhoe leiocarpa and Digitaria californica) were missing. Thus, we added the missing species (Callirhoe leiocarpa and Digitaria californica) as sister tips to Callirhoe involucrate and Digitaria ciliaris under the same genus assuming that phylogenetic relationships were consistent with their taxonomic grouping. Our final tree contained all species was a dichotomous tree (Figure 1).
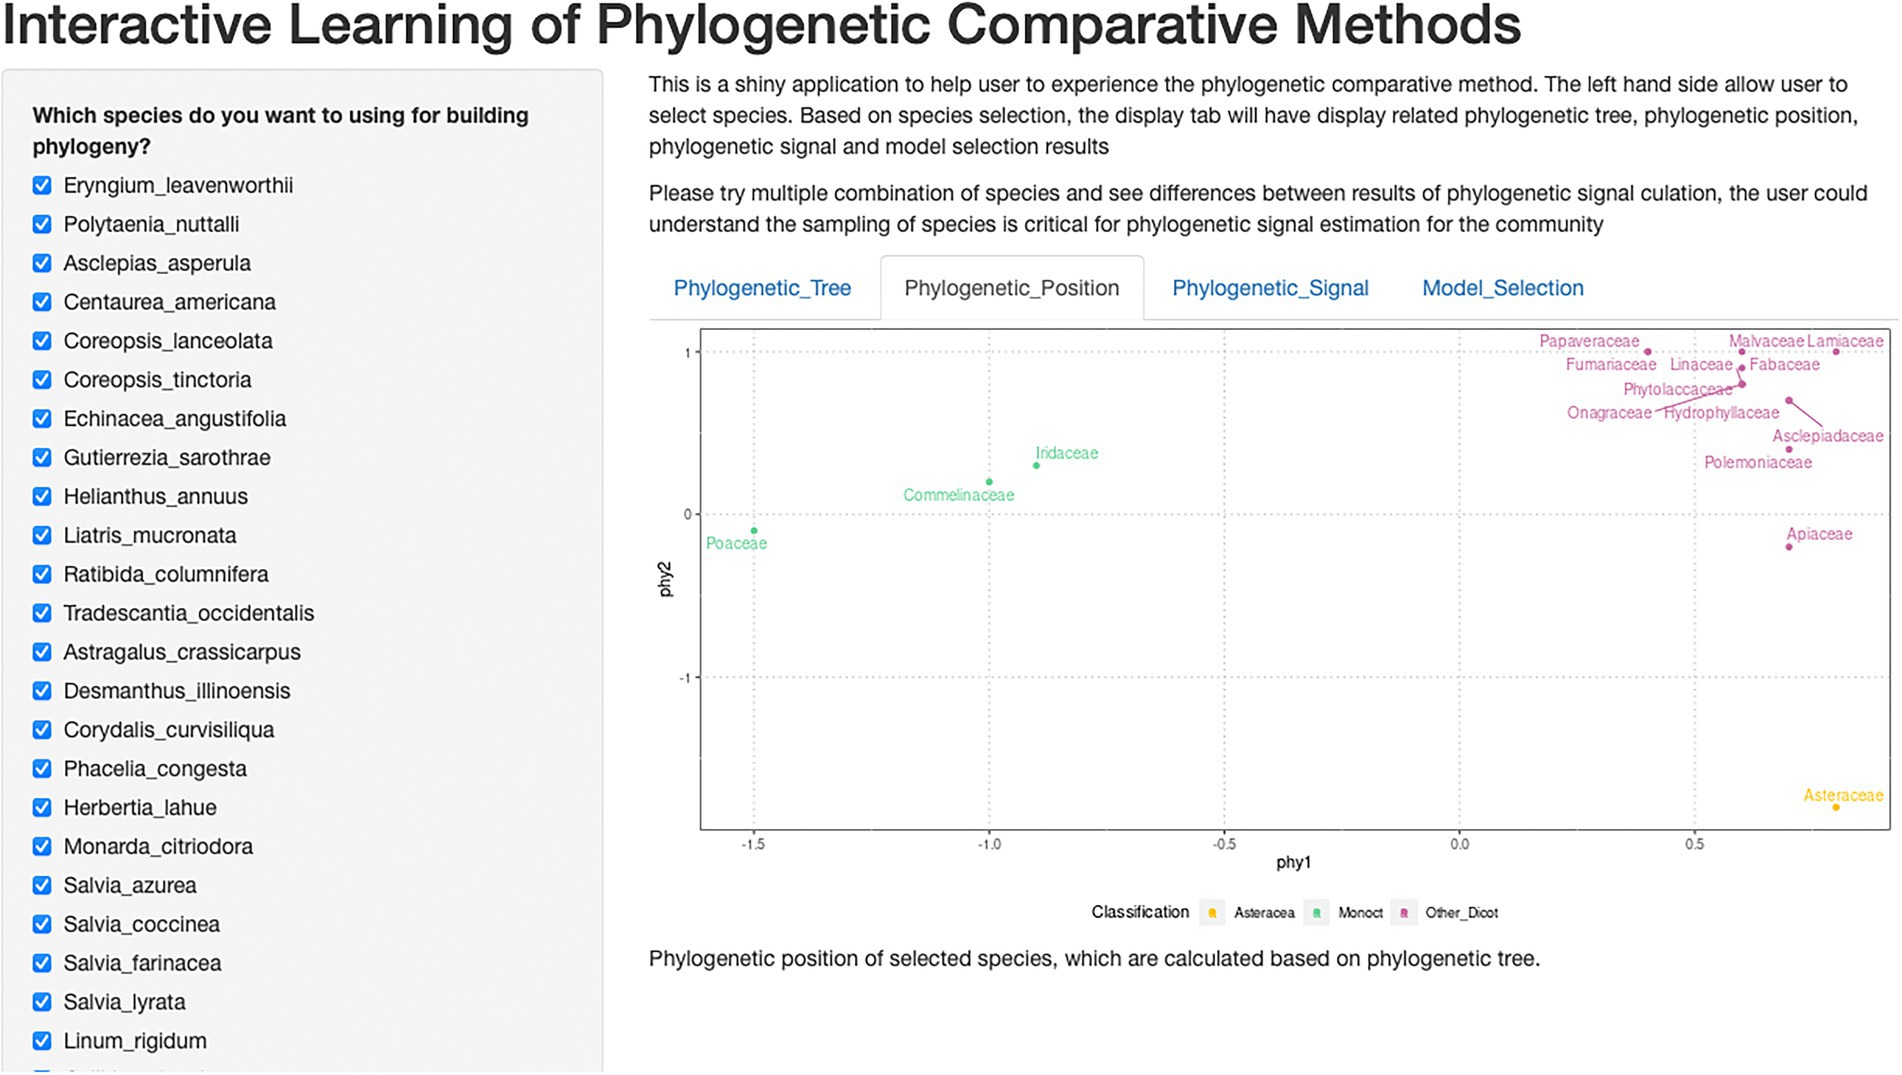
Figure 2. Shiny application of interactive learning of phylogenetic comparative methods. This is a screenshot of the shiny application. The checkbox of species could be used to choose different combinations of species and explore its impact on phylogenetic signals.
To incorporate phylogenetic relatedness in the general linear models, we represented the phylogeny by all pairwise phylogenetic distances across taxa. We converted the pairwise distance matrix to points distributed in a two-dimensional coordinate system, using nonmetric multidimensional scaling (NMDS; isoMDS function in the package MASS, Venables and Ripley, 2002). We evaluated phylogenetic signals for individual traits as Blomberg’s K (Blomberg et al., 2003) using the phylosig function in the phytools R package (Revell, 2012). We tested for phylogenetic signal using a randomization test (phylosig function) that compared the measured value of Blomberg’s K against a distribution of K calculated when trait values were randomized across the tips of the phylogeny.
Germinability prediction model selection
To generate and evaluate generalized linear models, we applied backward stepwise model comparison based on the Akaike information criterion (Akaike, 1998) using the AICc function in the AICcmodavg package (Mazerolle, 2020). We also used seed germination percentage, three seed morphological traits (seed mass, seed height and seed surface area) and phylogenetic positions to generate a global general linear model. Then, we used AIC to correct for small sample sizes (AICc) and evaluate the fitness of models. We standardized all input parameters to the mean of zero to produce standardized coefficients between parameters for numeric reasons in fitting. We also tested correlation among morphological traits (seed mass, seed height and seed surface area). All original data and scripts that we used to calculate phylogenetic signals, phylogenetic residuals, and seed germinability prediction models are available on GitHub website (https://github.com/chenyanniii/Traits4, DOI: 10.5281/zenodo.6609175).
Random sub-sampling of different species pool size
To estimate the minimum species pool size for obtaining a stable phylogenetic signal, we created 31 different species pool subsets, from 10 species to 40 species. For each pool size, we randomly withdrew 100 times at each pool size species from the whole species pool, thus generating 100 sub-pools of each species pool size by random sub-sampling. The phylogenetic signals of each sub-pool were calculated for their Blomberg’s K and related p value. We analyzed the relationship between sample size and detection rate of phylogenetic signals was analyzed to evaluate the effect of sample size to estimated phylogenetic signals in traits.
Shiny application
Shiny is a web framework for displaying data. Shiny is a good data processing demonstration tool, an interactive way for users to experience how different input and procedure affect output. We designed our shiny application to import with our full dataset and display data analysis and results. Users can see our full dataset result (as default), or interactively calculate all parameters for any sub-pools using checkboxes of species (Figure 2).
Results
In this study, we used 45 commonly selected restoration species to explore the phylogenetic distance among shortgrass prairie species by pruning unnecessary species and adding desired species to the existing phylogenetic tree of flowering plants (Figure 1).
Seed final germination percentage and morphological traits measurements
When examining species’ trait value with the phylogenetic tree (Figure 1), we found the phylogenetic patterns in seed mass, seed height, seed surface area and seed germination rate were varied. We were not able to germinate eight species (Figure 1, Argemone albiflora, Callirhoe leiocarpa, Corydalis curvisiliqua, Herbertia lahue, Oenothera rhombipetala, Pavonia lasiopetala, Phytolacca americana, and Polytaenia nuttallii). Eragrostis trichodes had the highest final germination percentage, 82%. For seed mass, Sporobolus airoides had the lightest weight per seed, 0.0945 ± 0.0083 mg per seed; the heaviest seed was Pavonia lasiopetala, 18.75 ± 0.3487 mg per seed. The seed height measurement ranged from 0.658 ± 0.1051 (Coreopsis tinctoria) to 2.995 ± 0.1334 mm (Pavonia lasiopetala); and the seed surface areas ranged from 0.361 ± 0.0083 (Sporobolus cryptandrus) to 25.258 ± 1.322 (Polytaenia nuttallii) mm2 (Figure 1).
Species phylogenetic information
We used nonmetric multidimensional scaling (NMDS) to compress the phylogenetic distance matrix to a two-dimensional space, with a pressure of 17.86. Our results showed that 45 species were grouped into three clusters: Monocot, Asteraceae and eudicots-except Asteraceae (Figure 3). NMDS compressed phy1 (x-axis) corresponded to separating monocot and eudicots, while the phy2 (y-axis) separated Asteraceae from other families.
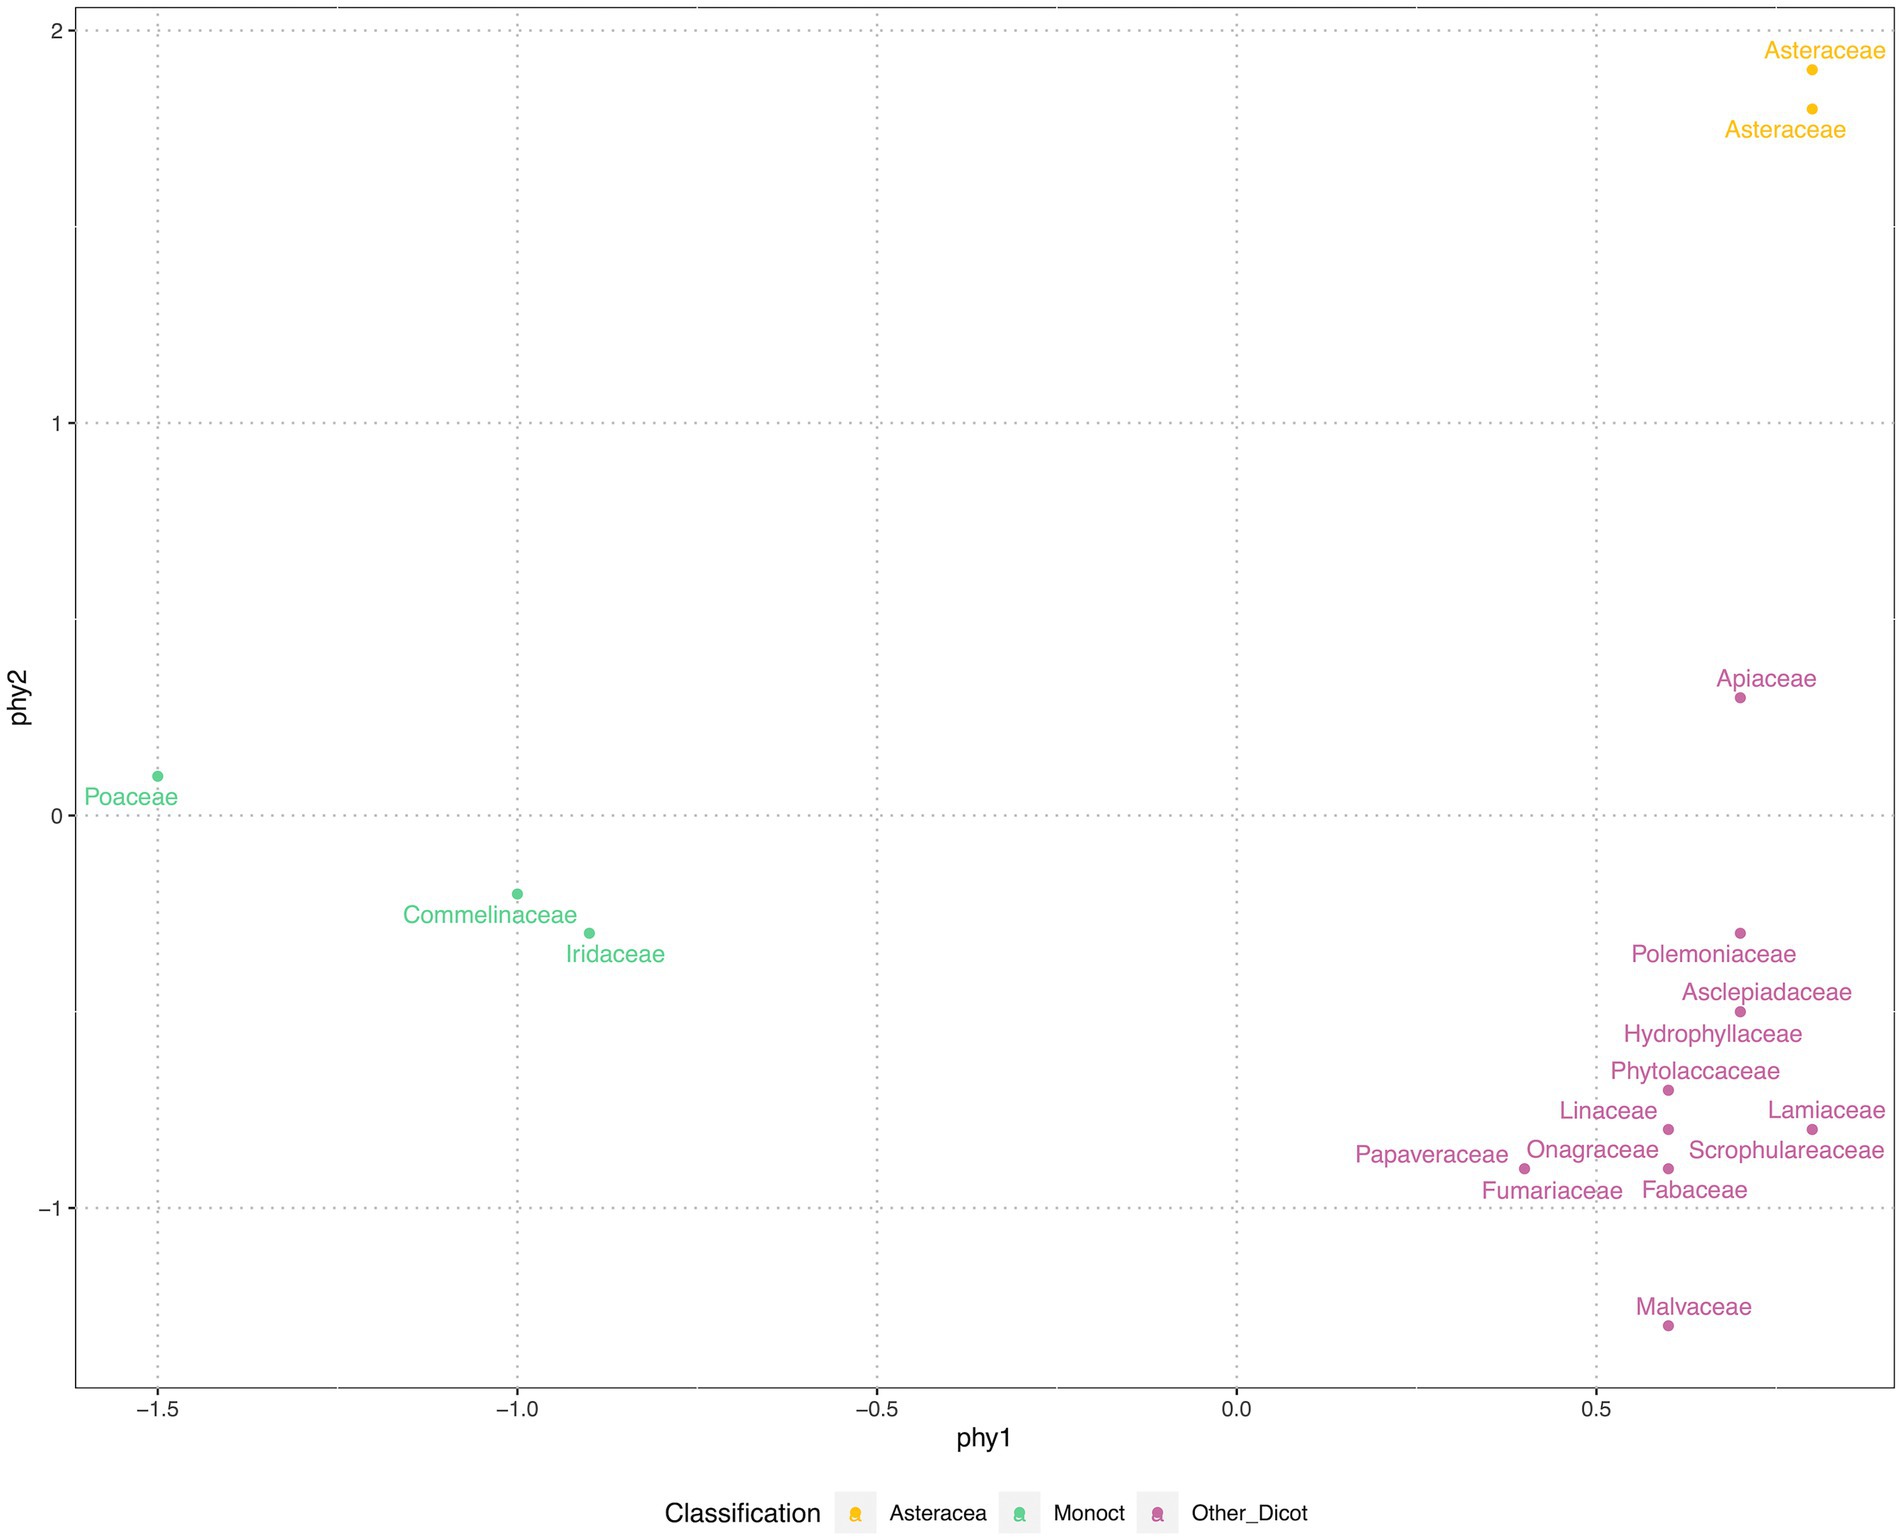
Figure 3. Phylogenetic position of 45 species, represented by family, were clustered in three groups. The phylogenetic positions were generated from paired-wise distances of species on the phylogenetic tree (see Figure 1). The nonmetric multidimensional scale (NMDS) was applied, at the stress of 17.86, displayed in two axes. For the convenience of display the phylogenetic positions were grouped and color coded by vision.
Our measurements of phylogenetic signals, Blomberg’s K (using species shuffling method), were low for all four seed traits, indicating a departure from signal under strict Brownian motion and suggesting that these traits are evolutionarily labile. Although Blomberg’s K were low, indicating a weak phylogenetic signal, we found significant phylogenetic signals for seed mass (K = 0.07, p = 0.01) and seed height (K = 0.05, p = 0.05).
Germinability prediction model selection
The full set of models built from morphological traits and phylogenetic information were evaluated using adjusted AIC (AICc). The AICc values range from 129.9 to 139.4. The best prediction model is using seed height to predict seed germination (AICc = 129.9), slightly better than the model using seed mass to predict germination (AICc = 130.5). The models with low AICc values were clustered by using one morphological trait as a predictor or the combination of two morphological traits. This indicated that morphological traits out-perform phylogenetic distance in predicting seed germination. Pearson correlation coefficient analysis revealed a strong correlation between seed mass and seed height (r = 0.66, p < 0.01); a medium correlation between seed mass and seed surface area (r = 0.49, p < 0.01); no correlation was detected between seed height and seed surface area (Table 2).
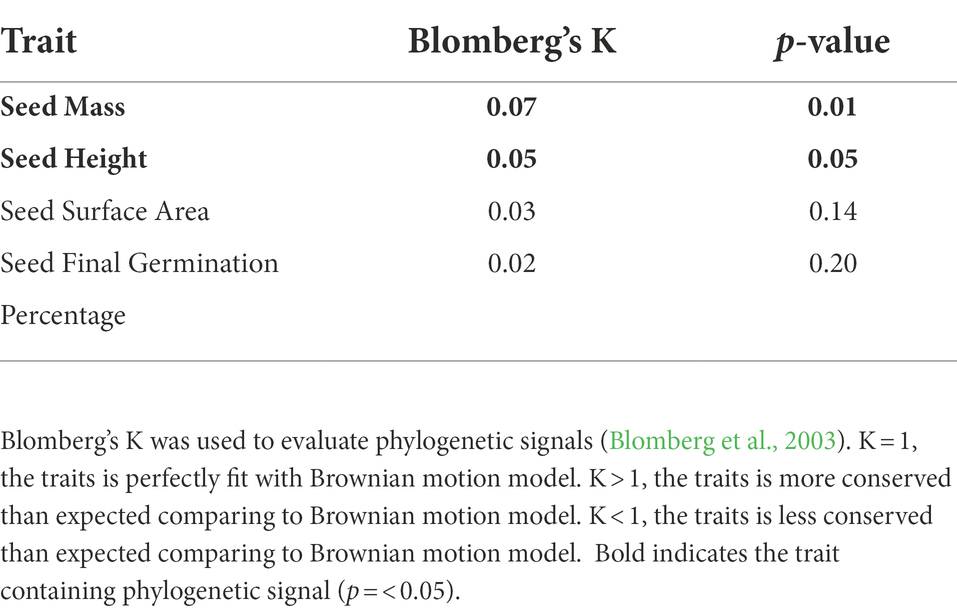
Table 2. Phylogenetic signal was tested in seed morphological traits and overall seed final germination percentage.
Random sub-sampling of different species pool size
We calculated phylogenetic signals of morphological traits (seed mass, seed height, and seed surface area) and seed germination rate of all 3,100 sub-pools. All Blomberg’s K values were between 0 and 1 in all phylogenetic signal calculations, except 9 of them were larger than 1. In general, phylogenetic signals distributed widely at small species pool sizes, and became less varied while increasing species pool sizes (Figure 4). For seed height, seed surface area, and seed germination, the probability of detecting phylogenetic signals were consistently low regardless of the species pool size. This was true even for seed height, for which we detected a significant phylogenetic signal in our full dataset. In contrast, the probability of detecting the phylogenetic signal of seed mass increased with species pool size (Figure 5).
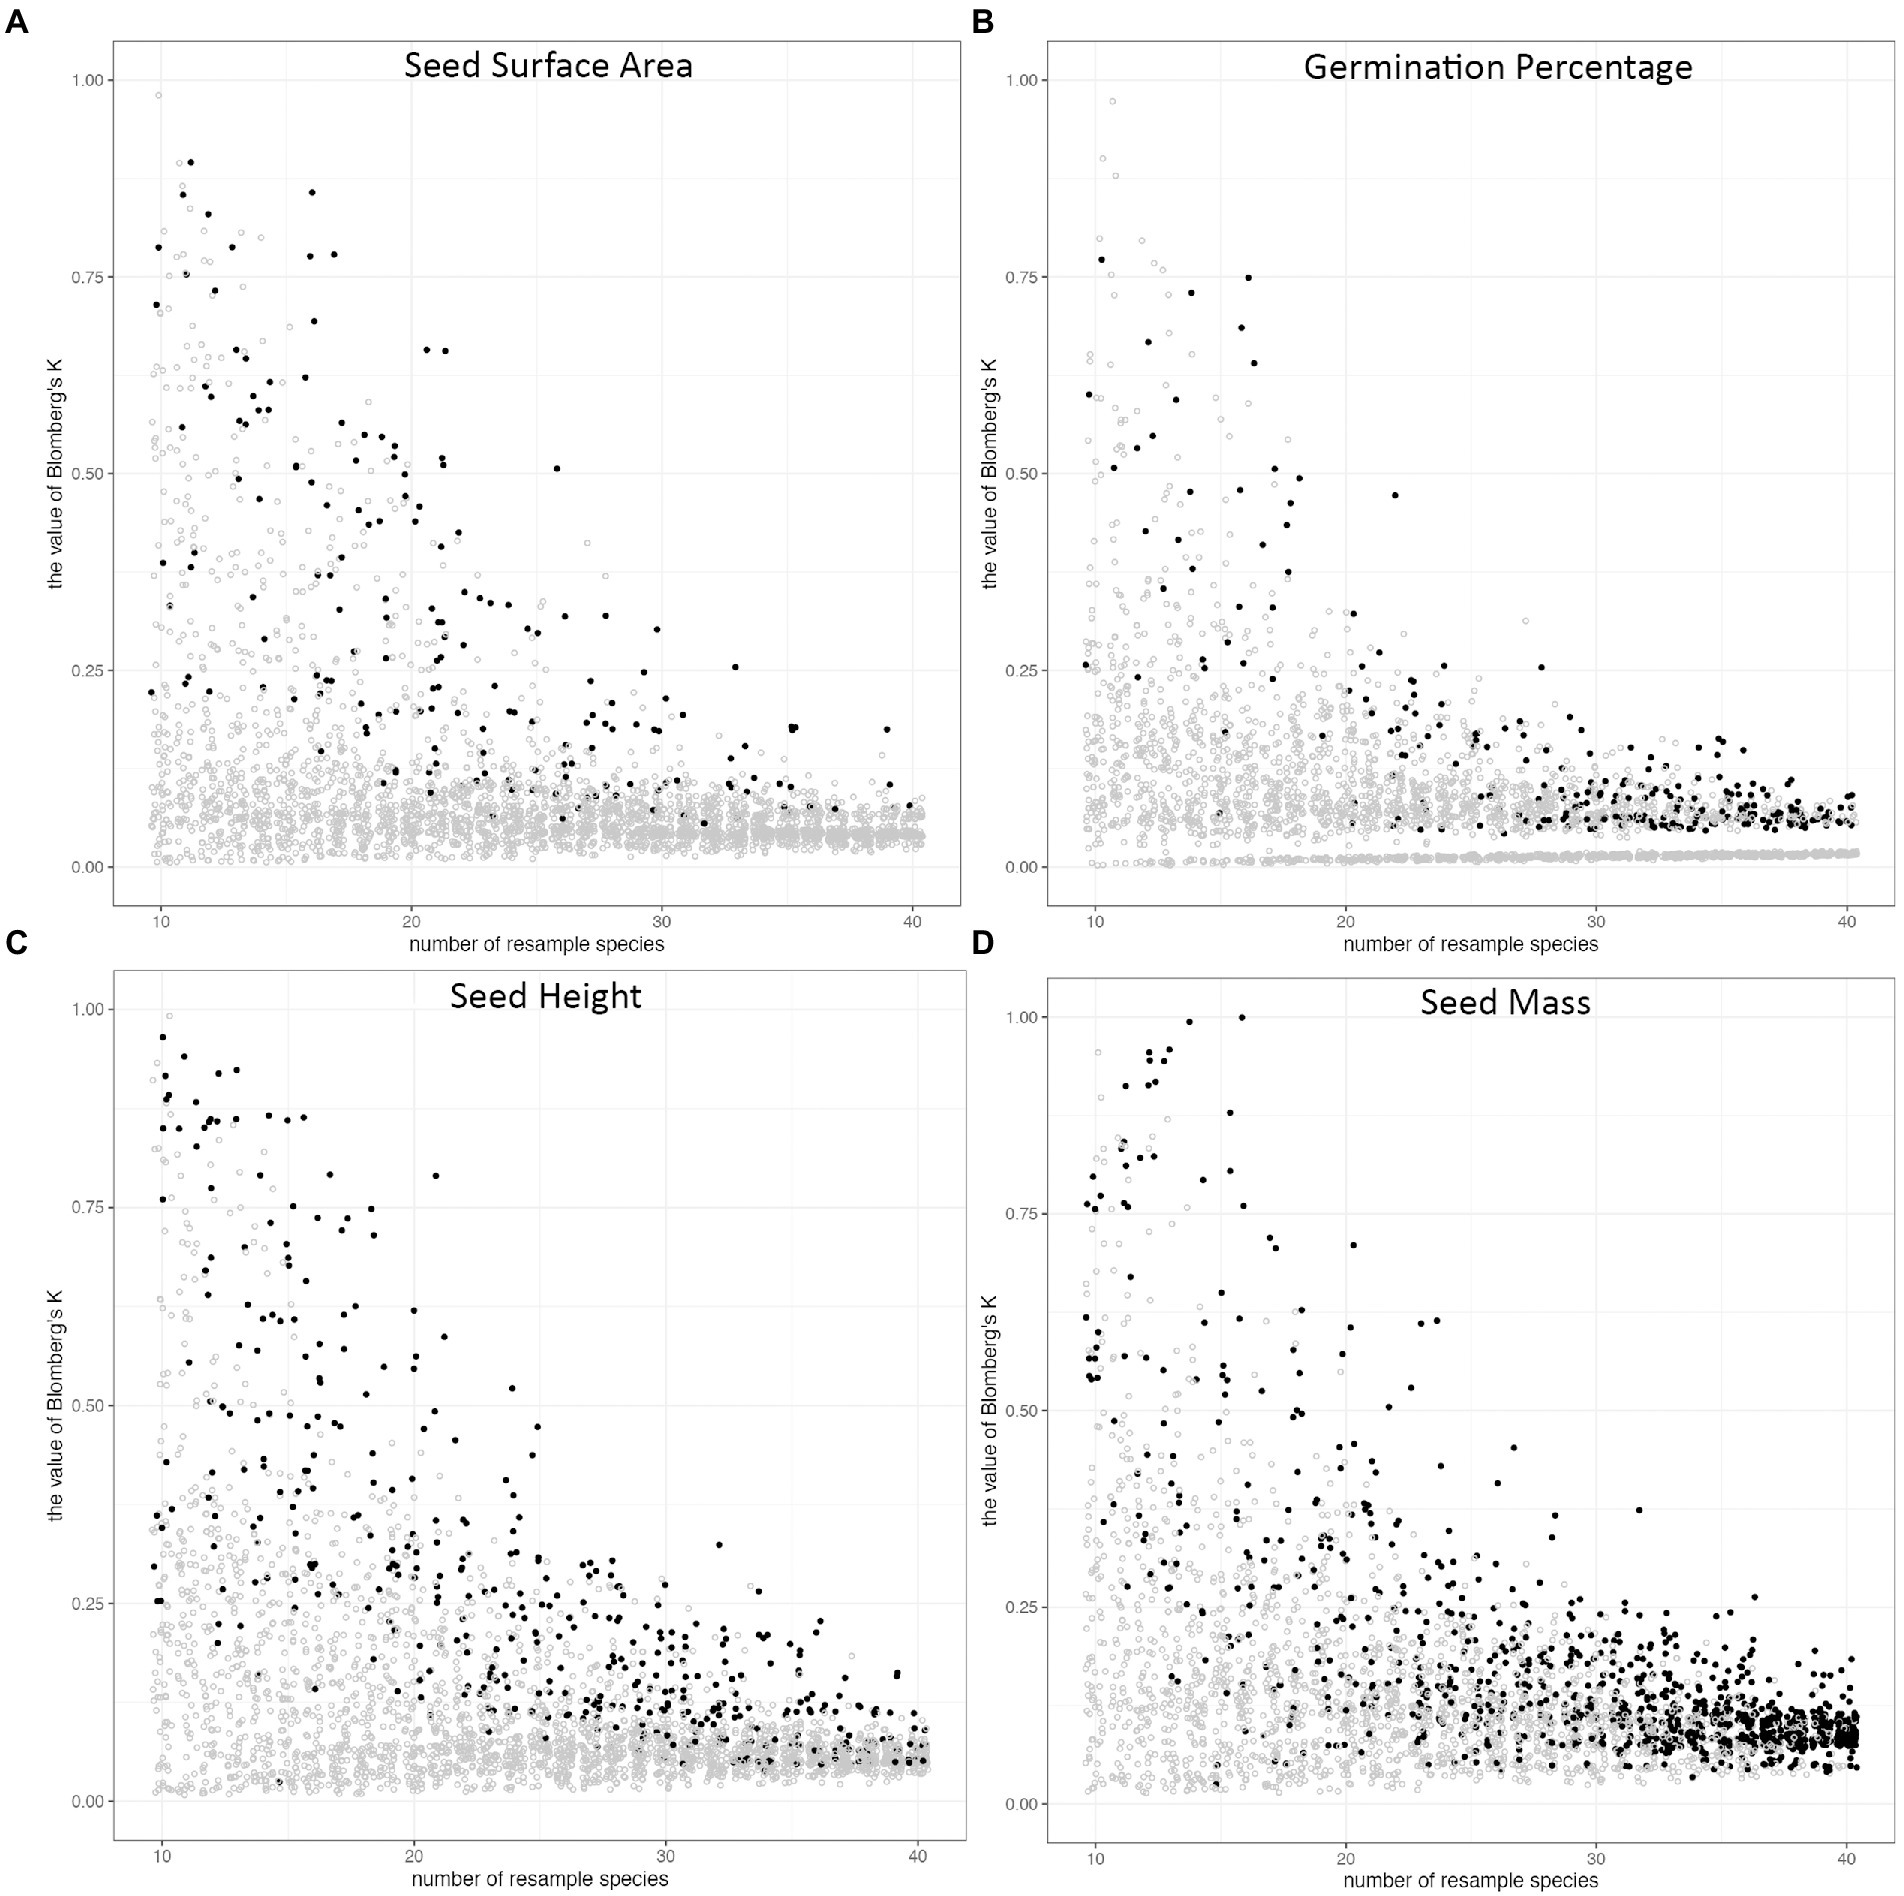
Figure 4. The distribution of Blomberg’s K along the size of the species pool in random subsampling tests. The species were resampled 100 times from 10 species to 40 species, and phylogenetic signal (Blomberg’s K) was calculated for each trait, 3100 times for each trait. Phylogenetic signals of (A) seed surface area, (B) germination percentage, (C) seed height, (D) seed mass. The dots represent the Blomberg’s K value of each resampling pool. The color of dots indicates the p-value of Blomberg’s K (p < = 0.05, black; p > 0.05, grey).
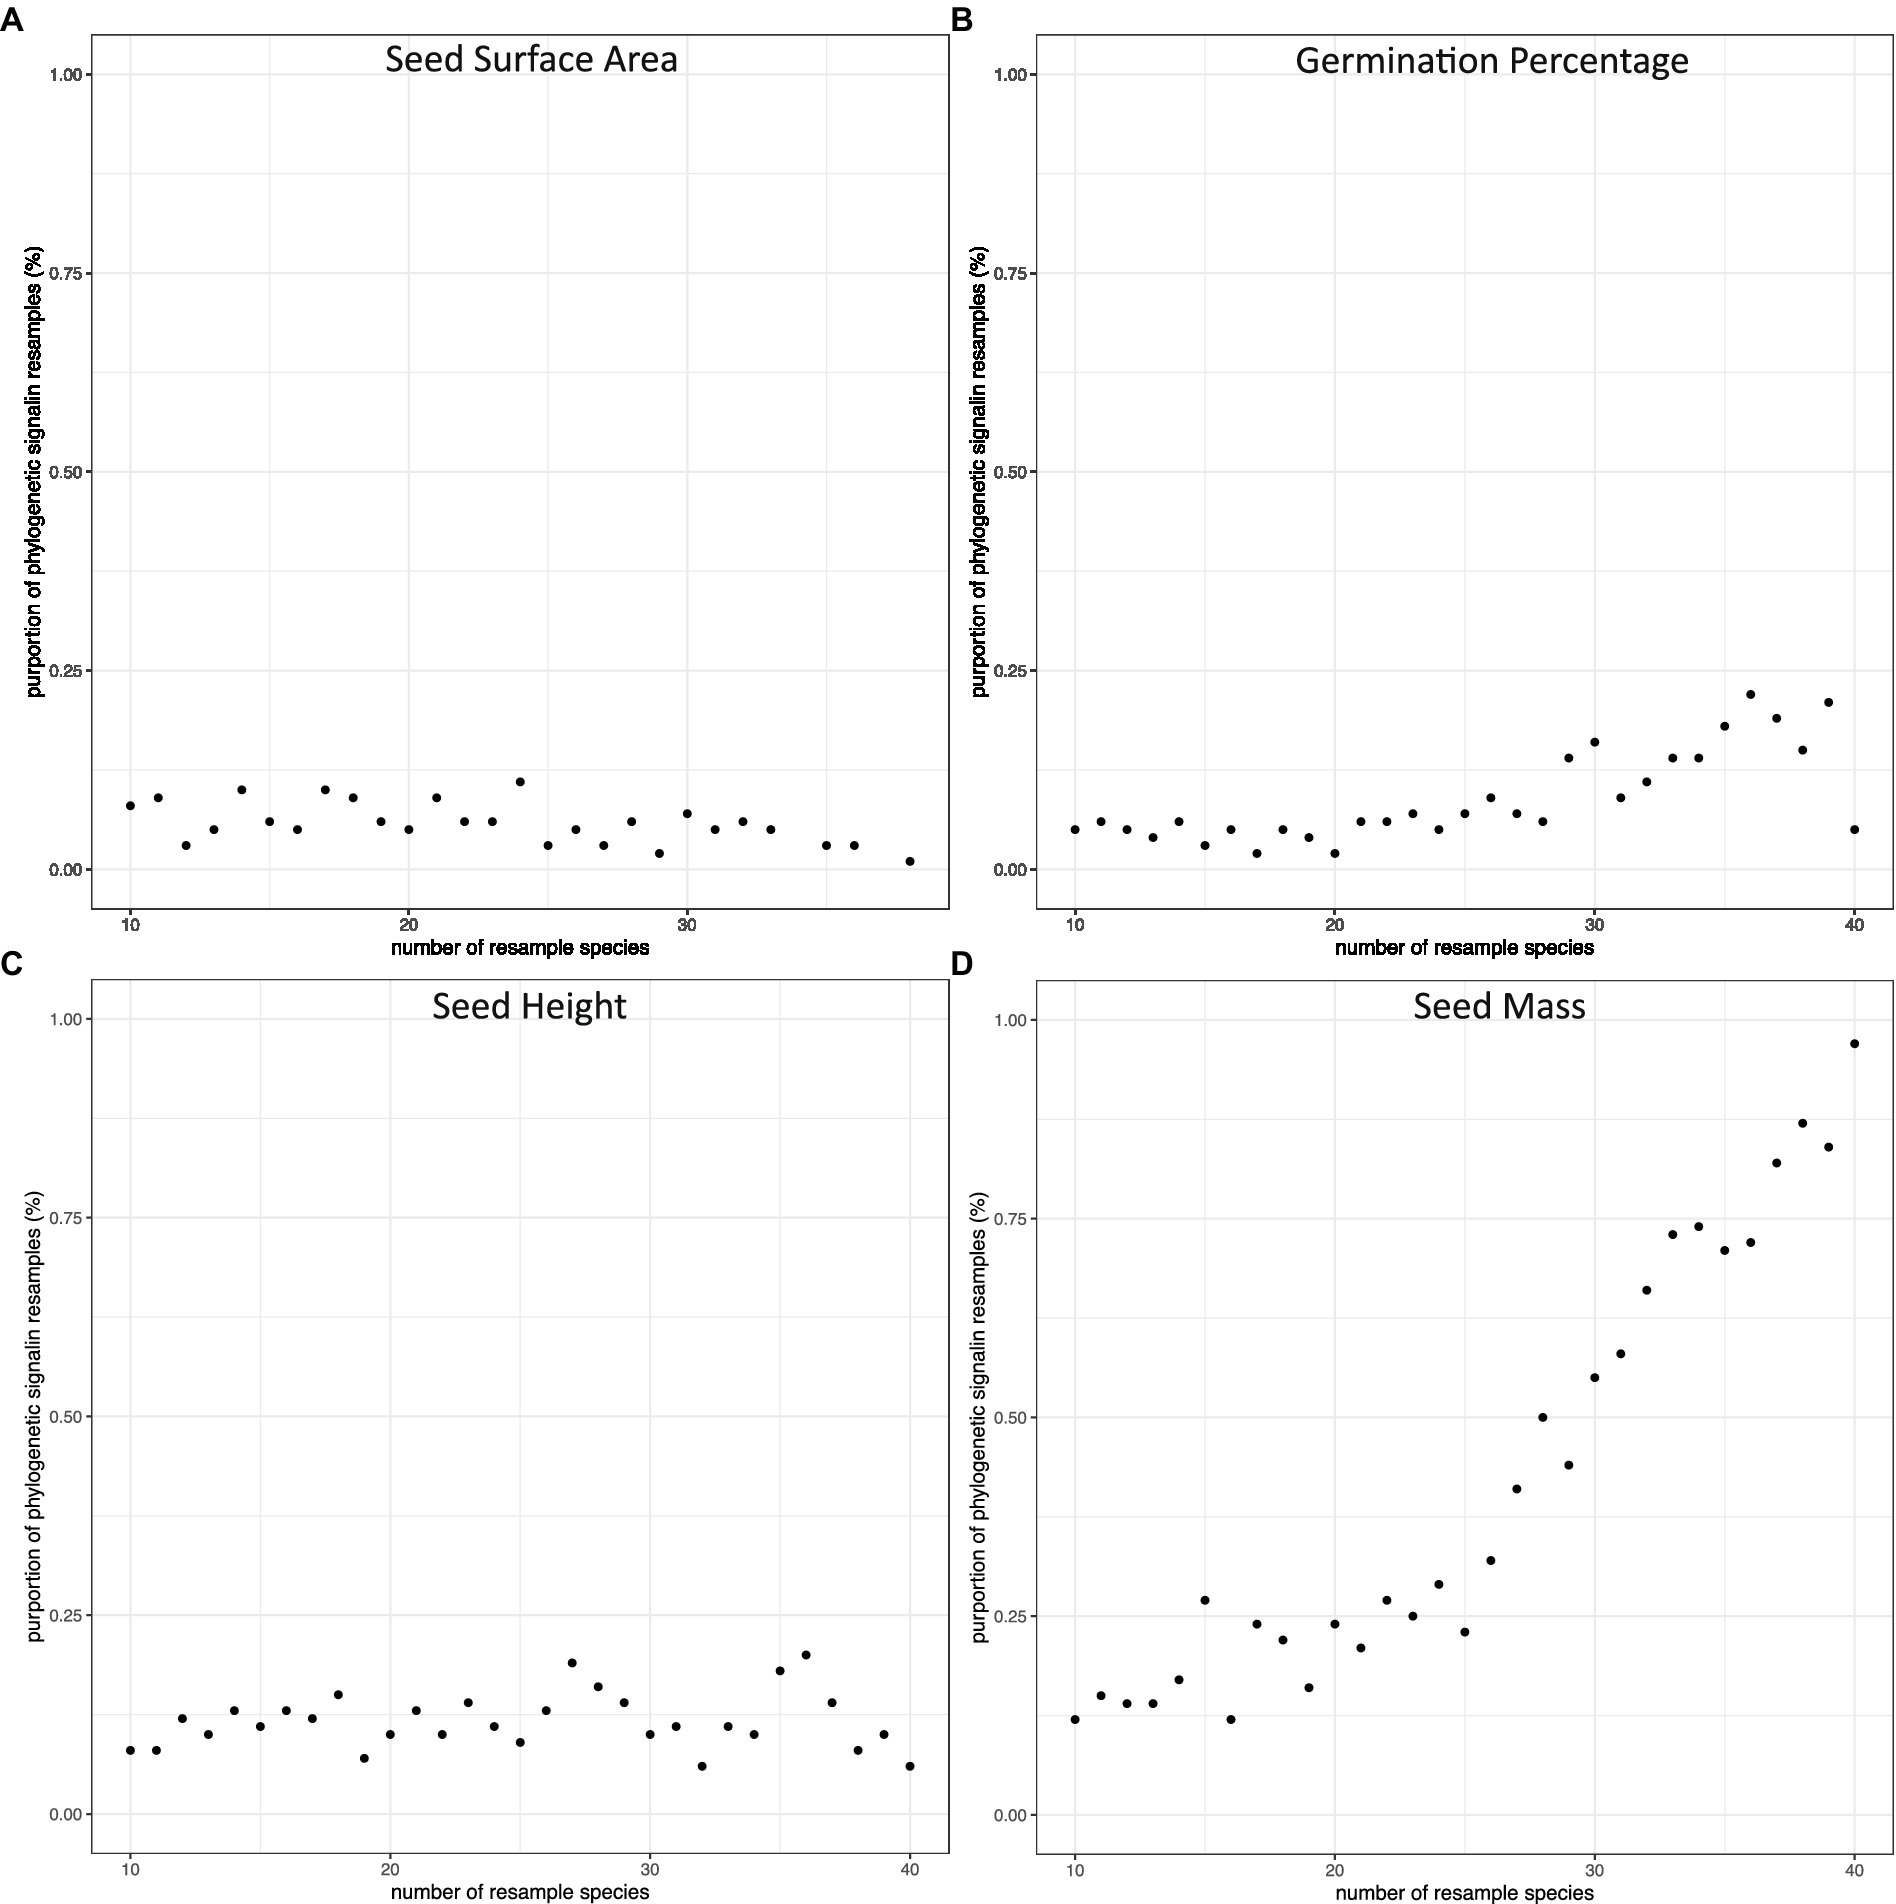
Figure 5. The proportion of subsamples with significant phylogenetic signals along the change of number of species in species pools. The species were resampled 100 times from 10 species to 40 species. The dots represent the proportion of Blomberg’s K value (p =< 0.05) in each resampling pool: (A) seed surface area, (B) germination percentage, (C) seed height, (D) seed mass.
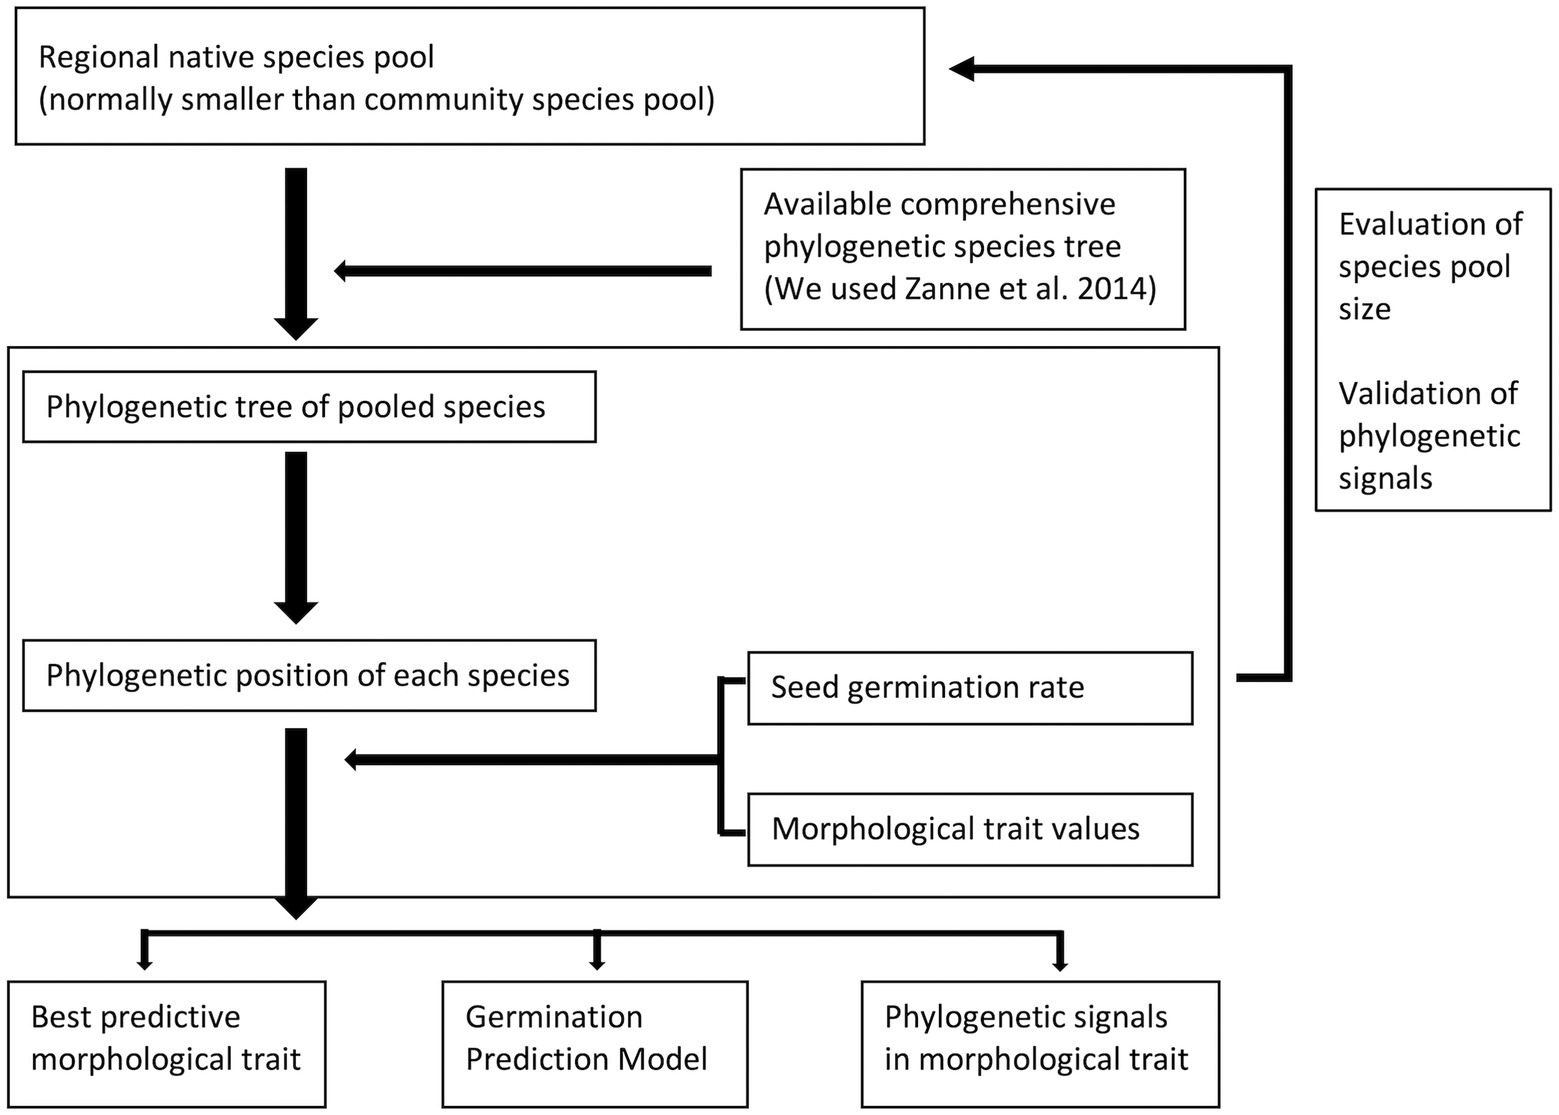
Figure 6. General protocol for generating a germinability prediction model with phylogenetic information for a plant community. This model needs a pool species with phylogenetic information, morphological data and germination data to build. It will be able to explore the germination pattern of the community.
Discussion
Aiming to verify the usefulness of trait conservatism in restoration seed selection, we measured seed traits, ran seed germination tests, calculated phylogenetic signals in seed traits, and presented the phylogenetic residual in seed germinability prediction models. We quantified weak phylogenetic signals in seed mass and seed height, but we found no phylogenetic signal in seed surface area nor in seed final germination percentage. In those traits that did exhibit phylogenetic signals, the signals were weak: closely related species were more similar than expected under species shuffling, but more different in their trait values than expected under Brownian motion.
Phylogenetic tree
The phylogenetic tree of 45 commonly selected species in shortgrass prairie ecological restoration was clustered in Poaceae within monocots and were relatively clustered in Asteraceae and Lamiaceae within eudicots (Figure 3), which reflects that the species composition may be clustered in shortgrass prairie. The phylogenetic comparative methods displayed trait values indicated that the closely related species had similar trait values in seed mass and seed height, but not in seed germination (Figure 1). The NMDS compressing phylogenetic distance into two-dimensions shows three distinct clusters (Figure 3). The results showed that shortgrass prairie families were grouped into 3 clusters: one monocot group and two eudicot groups (Asteraceae and others, Figure 3). Meanwhile the tallgrass prairie species (Barak et al., 2018) were grouped into 4 clusters: one monocot group, three eudicot groups (Asteraceae, Fabaceae, and others).
Our development of the Shiny application demonstrated: (1) the procedure of pruning the synthetic phylogenetic tree (Zanne et al., 2014) to the desired species tree. (2) the calculation of compressing phylogenetic distance into two-dimensions. The interactive demonstration allows users to select all or a portion of desired species and understand the effect of species selection on phylogenetic calculation.
Phylogenetic signal in traits
Phylogenetic signal indicates that closely related species have more similar trait value than expected under species shuffling across tips of a phylogeny. We found significant phylogenetic signals in seed mass and seed height, but no such signals in seed surface area nor in seed final germination percentage. Although germination traits are not specific or constant in each species (but vary in space and time), since we chose seeds from the same eco-region, our results are able to represent our region and still allow generalization when considering germinability predictions. Generally, seed mass is phylogenetically conserved in sample taxas from different ecosystems (tallgrass prairie, Barak et al., 2018; alpine grassland, Bu et al., 2016; globally, Westoby et al., 2002). In our set of taxa, we found a weak but significant pattern. Seed mass often predicts energy and nutrient provisioning (Westoby et al., 2002), which increases seed germination rates and stress tolerance (Leishman et al., 2000; Moles, 2018). This assumes, however, that mass is primarily the embryo and nutrients. It is possible for a large portion of the seed mass to be seed defense structures (i.e., seed coat).
We used seed height and seed surface area as proxies for seed dispersal syndrome, because these dimensions influence primary wind dispersal (seed departure from mother plants, Sheldon and Burrows, 1973; Jongejans and Telenius, 2001) and secondary wind dispersal (seed lifting off ground by wind power, van Tooren, 1988; Schurr et al., 2005; Zhu et al., 2022). Primary dispersal is mainly related to dispersal height and terminal falling velocity, which is influenced by seed morphology (Sheldon and Burrows, 1973; Jongejans and Telenius, 2001). Secondary dispersal distance strongly depends on the lift-off velocity, which is influenced by seed height and the planform area of a seed exposed to airflow (van Tooren, 1988; Schurr et al., 2005; Zhu et al., 2022). Classically, seed shape was measured by the roundness or closeness of a seed to specific shape, such as ellipse or cardioid (Cervantes et al., 2016) and linked with seed persistence in soil seed bank (Moles et al., 2000; Laughlin, 2014). Some recent studies link seed morphological shape with evolutionary constraint and selective pressure of seeds and its potential relationship with seed germination (Bu et al., 2016; Barak et al., 2018). In our study, seed mass and seed height were positively correlated. We found a weak pattern of phylogenetic trait conservatism in two traits, but this signal did not aid in improving seed germinability prediction models.
Seed germination is a complex phenomenon. Our measure of total germination was, in effect, a dormancy proxy: high germination rates indicated a lack of dormancy in our research. Our experiment did not include any dormancy breaking retreatments, only supplying light and water during experiments to simulate practitioners’ low effort practices. Seed germination can be influenced by abiotic factors, such as wetland species germination impacted by water level (Keddy, 1992); or arid zone woody species developing rapid germination in response to unpredictable rainfall (Duncan et al., 2019). Seed germination can also be influenced by biotic factors, such as small- and large-seeded species diverging in the species they associate with, regarding seed mass and understory light preference (Umaña et al., 2020). We did not detect a phylogenetic signal in germination rate indicating this trait is highly labile. This result was different from a similar study of tallgrass prairie species (Barak et al., 2018), where the authors found significant phylogenetic trait conservatism in germination percentage under control and gibberellic acid treatment, and including phylogeny improve time-to-germination (survival) model. However, the survival model (Barak et al., 2018) includes both germination time and pretreatment for germination rate and does not measure dormancy. Differing patterns in phylogenetic signal in germination rate of two prairie studies are reasonable, in consideration of environmental differences between two different ecosystems, and the germination experiment setting in two studies.
Germinability prediction model selection
The germinability predictive models with morphological data did not improve when adding phylogenetic information using the full dataset (Supplementary material). This means adding phylogenetic information to morphological measurements increased the complexity of models but did not increase the fitness of models. This is not surprising given that we found no phylogenetic signal in seed germination rate and only weak signals in two other traits.
Random sub-sampling of different species pool size
From the distribution of Blomberg’s K, we can tell the species sample size will greatly influence phylogenetic signal calculation (Blomberg et al., 2003). Our shortgrass prairie restoration species results showed that the phylogenetic signal would be less impacted by the species composition, and less varied with sufficient species, around 35 to 40 (Figure 4). This also indicates the 45 species we have in our study is sufficient.
In the full dataset (45 species), we were able to detect phylogenetic signals for both seed mass and seed height. However, the subsampling exploration method demonstrates that detecting a phylogenetic signal in seed height is a low probability event. On the other hand, our sub-sampling in seed mass showed that the probability of detecting a phylogenetic signal increased along with the increase in the number of species in the species pool. The Blomberg’s K value is stable at 40 species, which could indicate that if researchers or practitioners have over 40 species sub-sampling of shortgrass prairie restoration species, their studies should be able to detect phylogenetic signals. The random sampling methods to verify sample size method could apply in sampling species to estimate phylogenetic conservatism in plant communities.
Shiny application
From the Shiny application, restoration practitioners could use interactive methods to explore our data and statistical analysis and results visualization. For readers who are first exposed to phylogenetic comparative methods, the interactive graphic user interface can lower the bar for exploring our data, as well as increase engagement. Our checkbox of species list allows users to design their composition of species, and to investigate the impact of species choice on phylogenetic signal and germinability prediction. Our Shiny application was published on GitHub website (https://github.com/chenyanniii/Traits_Shiny, DOI: 10.5281/zenodo.6609191) and on shinyapps.io.1
Comparison between tallgrass prairie and shortgrass prairie studies
Seed germination is a complex physiological phenomenon that could be studied for its optimization using dormancy breaking treatments (Barak et al., 2018), as well as could be a dormancy proxy, such as high germination rates indicated a lack of dormancy in our research. Our research can be contrasted with a similar tallgrass prairie study (Barak et al., 2018), in which: (1) the phylogenetic signals of germination were detected in morphological traits and seed germination percentage; (2) phylogenetic information improves the seed germinability prediction model. We saw the potential of applying phylogenetic information in ecological restoration, so we tested the phylogenetic application in simply restoration setting: (1) We selected regional appropriated seed sources from a local restoration vendor. (2) We estimated dormancy in seed sources by running germination trails without any dormancy breaking treatment to approximate the conditions preferred by restoration practitioners. (3) We tested our results against null models: confirming our confidence in sample size, examining the robustness of our conclusion while ensuring we can generalize results for the whole shortgrass prairie plant community. Our unique restoration scenario of shortgrass prairie showed a few advancements of knowledge. First, only seed mass and seed height detected phylogenetic signals in 45 species. The phylogenetic signal in seed mass is well preserved and can be generalized to estimate the phylogenetic signal for the shortgrass prairie plant community. On the opposite, detecting a phylogenetic signal in seed height is a low chance event that the phylogenetic signal in 45 species should not be generalized to estimate the phylogenetic signal for the shortgrass prairie plant community. Second, estimating phylogenetic signals for a plant community needs a larger sample size than a single fixed group. The shortgrass prairie plant community needs at around 40 species for detecting a general pattern (Figures 4 and 5), which is twice of the 20 species assumption in a fixed species comparative study (Blomberg et al., 2003).
Conclusion and future studies
Overall, we have demonstrated that the phylogenetic signal calculation can be influenced by size and composition of seed pool. We recommend running a sub-sampling test to verify the sufficiency of species and phylogenetic conservatism in traits for a community study, and we proposed a general protocol for implementing phylogenetic conservatism in plant community restoration (Figure 6). Our Shiny application is on GitHub website2 and on shinyapps.io,3 using an interactive way to demonstrate how species composition directly impacts the phylogenetic signal calculation.
Our work demonstrated that some morphological traits have phylogenetic signal in shortgrass prarie (North America), although our subsampling found this to be robust to sample size only for seed mass. Yet our study could not detect the benefit of adding phylogenetic information using morphological traits to predict seed germinability (without dormancy breaking treatments). The inconsistent role of phylogeny in different ecosystems needs further exploration, especially taking advantage of large standard databases of seed traits and the tree of life.
Data availability statement
The datasets presented in this study can be found in online repositories. The names of the repository/repositories and accession number(s) can be found at: https://zenodo.org/record/6609175#.Yr3ovi-B3fY, 6609175.
Author contributions
YC and MJ: study conception and design. YC: data collection, data analysis and figures, and first draft of manuscript. DS and RC: experimental facilities. MJ: funding for supplies. All authors contributed to interpretation of results and revising the manuscript. All authors contributed to the article and approved the submitted version.
Acknowledgments
We thank Zhang Lab at Texas Tech University (TTU) for laboratory support. We are grateful for the support from Texas Tech Graduate Writing Center and two reviewers to help us improve the quality of writing. Our funding was provided by the TTU Graduate School Research Award (YC) and TTU College of Arts and Sciences (MJ).
Conflict of interest
The authors declare that the research was conducted in the absence of any commercial or financial relationships that could be construed as a potential conflict of interest.
Publisher’s note
All claims expressed in this article are solely those of the authors and do not necessarily represent those of their affiliated organizations, or those of the publisher, the editors and the reviewers. Any product that may be evaluated in this article, or claim that may be made by its manufacturer, is not guaranteed or endorsed by the publisher.
Supplementary material
The Supplementary material for this article can be found online at: https://www.frontiersin.org/articles/10.3389/fevo.2022.983192/full#supplementary-material
Footnotes
1. ^https://chenyanniii.shinyapps.io/Phylo_Compar_Traits/
2. ^https://github.com/chenyanniii/Traits_Shiny,DOI:10.5281/zenodo.6609191
References
Agrawal, A. A. (2007). Macroevolution of plant defense strategies. Trends Ecol. Evol. 22, 103–109. doi: 10.1016/j.tree.2006.10.012
Akaike, H. (1998). “Information theory and an extension of the maximum likelihood principle” in Selected papers of Hirotugu Akaike. eds. E. Parzen, K. Tanabe, and G. Kitagawa (New York, NY: Springer New York)
Barak, R. S., Lichtenberger, T. M., Wellman-Houde, A., Kramer, A. T., and Larkin, D. J. (2018). Cracking the case: seed traits and phylogeny predict time to germination in prairie restoration species. Ecol. Evol. 8, 5551–5562. doi: 10.1002/ece3.4083
Baskin, C. C., and Baskin, J. M. (1998). Seeds: Ecology, biogeography, and evolution of dormancy and germination. San Diego, California: Academic press.
Baum, D. A., and Smith, S. D. (2013). Tree thinking: An introduction to phylogenetic biology. Roberts Greenwood Village (CO).
Blomberg, S. P., Garland, T. Jr., and Ives, A. R. (2003). Testing for phylogenetic signal in comparative data: behavioral traits are more labile. Evolution 57, 717–745. doi: 10.1111/j.0014-3820.2003.tb00285.x
Bradford, K. J. (2002). Applications of hydrothermal time to quantifying and modeling seed germination and dormancy. Weed Sci. 50, 248–260. doi: 10.1614/0043-1745(2002)050[0248:AOHTTQ]2.0.CO;2
Bu, H.-Y., Wang, X.-J., Zhou, X.-H., Qi, W., Liu, K., Ge, W. J., et al. (2016). The ecological and evolutionary significance of seed shape and volume for the germination of 383 species on the eastern Qinghai-Tibet plateau. Folia Geobot. 51, 333–341. doi: 10.1007/s12224-016-9271-y
Cervantes, E., Martín, J. J., and Saadaoui, E. (2016). Updated methods for seed shape analysis. Scientifica 2016:5691825.
Chou, Y.-F., Cox, R. D., and Wester, D. B. (2012). Smoke water and heat shock influence germination of shortgrass prairie species. Rangel. Ecol. Manag. 65, 260–267. doi: 10.2111/REM-D-11-00093.1
Duncan, C., Schultz, N., Lewandrowski, W., Good, M. K., and Cook, S. (2019). Lower dormancy with rapid germination is an important strategy for seeds in an arid zone with unpredictable rainfall. PLoS One 14:e0218421. doi: 10.1371/journal.pone.0218421
Finch-Savage, W. E., and Leubner-Metzger, G. (2006). Seed dormancy and the control of germination. New Phytol. 171, 501–523. doi: 10.1111/j.1469-8137.2006.01787.x
Ganade, G., and Westoby, M. (1999). Seed mass and the evolution of early-seedling Etiolation. Am. Nat. 154, 469–480. doi: 10.1086/303245
Garamszegi, L. Z. (2014). “Uncertainties due to within-species variation in comparative studies: measurement errors and statistical weights” in Modern phylogenetic comparative methods and their application in evolutionary biology: Concepts and practice. ed. L. Z. Garamszegi (Berlin, Heidelberg: Springer Berlin Heidelberg)
Hardegree, S. P., Moffet, C. A., Flerchinger, G. N., Cho, J., Roundy, B. A., Jones, T. A., et al. (2013). Hydrothermal assessment of temporal variability in seedbed microclimate. Rangel. Ecol. Manag. 66, 127–135. doi: 10.2111/REM-D-11-00074.1
Hipp, A. L., Larkin, D. J., Barak, R. S., Bowles, M. L., Cadotte, M. W., Jacobi, S. K., et al. (2015). Phylogeny in the service of ecological restoration. Am. J. Bot. 102, 647–648. doi: 10.3732/ajb.1500119
Hladik, A., and Miquel, S. (1990). Seedling types and plant establishment in an African rain forest. Reprod. Eco. Ttrop. For. Plants 7:1990.
Howe, H. F., and Smallwood, J. (1982). Ecology of seed dispersal. Annu. Rev. Ecol. Syst. 13, 201–228. doi: 10.1146/annurev.es.13.110182.001221
Jager, M., Kaphingst, B., Janse, E. L., Buisman, R., Rinzema, S. G. T., and Soons, M. B. (2019). Seed size regulates plant dispersal distances in flowing water. J. Ecol. 107, 307–317. doi: 10.1111/1365-2745.13054
Jongejans, E., and Telenius, A. (2001). Field experiments on seed dispersal by wind in ten umbelliferous species (Apiaceae). Plant Ecol. 152, 67–78. doi: 10.1023/A:1011467604469
Keddy, P. A. (1992). A pragmatic approach to functional ecology. Funct. Ecol. 6, 621–626. doi: 10.2307/2389954
Kidson, R., and Westoby, M. (2000). Seed mass and seedling dimensions in relation to seedling establishment. Oecologia 125, 11–17. doi: 10.1007/PL00008882
Kiehl, K., Kirmer, A., Donath, T. W., Rasran, L., and Hölzel, N. (2010). Species introduction in restoration projects – evaluation of different techniques for the establishment of semi-natural grasslands in central and northwestern Europe. Basic Appl. Ecol. 11, 285–299. doi: 10.1016/j.baae.2009.12.004
Kitajima, K. (1996a). “Ecophysiology of tropical tree seedlings” in Tropical Forest Plant Ecophysiology. eds. S. S. Mulkey, R. L. Chazdon, and A. P. Smith (Boston, MA: Springer US)
Kitajima, K. (1996b). “Cotyledon functional morphology, patterns of seed reserve utilization and regeneration niches of tropical tree seedlings,” in The ecology of tropical forest tree seedlings. ed. M. D. Swaine (Paris, Carnforth (England): UNESCO; Parthenon Pub. Group), 193–210.
Larson, J. E., Sheley, R. L., Hardegree, S. P., Doescher, P. S., and James, J. J. (2015). Seed and seedling traits affecting critical life stage transitions and recruitment outcomes in dryland grasses. J. Appl. Ecol. 52, 199–209. doi: 10.1111/1365-2664.12350
Laughlin, D. C. (2014). The intrinsic dimensionality of plant traits and its relevance to community assembly. J. Ecol. 102, 186–193. doi: 10.1111/1365-2745.12187
Leishman, M. R., Wright, I. J., Moles, A. T., and Westoby, M. (2000). The evolutionary ecology of seed size. Seeds 2, 31–57.
Mazerolle, MJ. (2020). AICcmodavg-package: model selection and multimodel inference based on (Q)AIC(c). Available at: https://rdrr.io/cran/AICcmodavg/man/AICcmodavg-package.html [Accessed April 30, 2022].
Moles, A. T. (2018). Being John Harper: using evolutionary ideas to improve understanding of global patterns in plant traits. J. Ecol. 106, 1–18. doi: 10.1111/1365-2745.12887
Moles, A. T., Hodson, D. W., and Webb, C. J. (2000). Seed size and shape and persistence in the soil in the New Zealand Flora. Oikos 89, 541–545. doi: 10.1034/j.1600-0706.2000.890313.x
Revell, L. J. (2010). Phylogenetic signal and linear regression on species data. Methods Ecol. Evol. 1, 319–329. doi: 10.1111/j.2041-210X.2010.00044.x
Revell, L. J. (2012). Phytools: an R package for phylogenetic comparative biology (and other things). Methods Ecol. Evol. 3, 217–223. doi: 10.1111/j.2041-210X.2011.00169.x
Revell, L. J., Harmon, L. J., and Collar, D. C. (2008). Phylogenetic signal, evolutionary process, and rate. Syst. Biol. 57, 591–601. doi: 10.1080/10635150802302427
Schindelin, J., Arganda-Carreras, I., Frise, E., Kaynig, V., Longair, M., Pietzsch, T., et al. (2012). Fiji: An Open-Source Platform for Biological-Image Analysis. Nat. Methods. 9, 676–682.
Schurr, F. M., Bond, W. J., Midgley, G. F., and Higgins, S. I. (2005). A mechanistic model for secondary seed dispersal by wind and its experimental validation. J. Ecol. 93, 1017–1028. doi: 10.1111/j.1365-2745.2005.01018.x
Schwilk, D. W., and Zavala, N. (2012). Germination response of grassland species to plant-derived smoke. J. Arid Environ. 79, 111–115. doi: 10.1016/j.jaridenv.2011.12.002
Sheldon, J. C., and Burrows, F. M. (1973). The dispersal effectiveness of the achene-Pappus units of selected compositae in steady winds with convection. New Phytol. 72, 665–675. doi: 10.1111/j.1469-8137.1973.tb04415.x
Subbiah, A., Ramdhani, S., Pammenter, N. W., Macdonald, A. H. H., and Sershen, (2019) Towards understanding the incidence and evolutionary history of seed recalcitrance: an analytical review. Pers. Plant Ecol. Evol. Syst. 37, 11–19. doi: 10.1016/j.ppees.2019.01.001
Tooren, BfVan. (1988). The fate of seeds after dispersal in chalk grassland: the role of the bryophyte layer. Oikos 53: 41–48, doi: 10.2307/3565661
Umaña, M. N., Arellano, G., Forero-Montaña, J., and Nytch, C. J. (2020). Large- and small-seeded species have contrasting functional neighborhoods in a subtropical forest. Ecosphere 11:314. doi: 10.1002/ecs2.3016
Westoby, M., Falster, D. S., Moles, A. T., Vesk, P. A., and Wright, I. J. (2002). Plant ecological strategies: some leading dimensions of variation between species. Annu. Rev. Ecol. Syst. 33, 125–159. doi: 10.1146/annurev.ecolsys.33.010802.150452
Willis, C. G., Baskin, C. C., Baskin, J. M., Auld, J. R., Venable, D. L., Cavender-Bares, J., et al. (2014). The evolution of seed dormancy: environmental cues, evolutionary hubs, and diversification of the seed plants. New Phytol. 203, 300–309. doi: 10.1111/nph.12782
Zanne, A. E., Tank, D. C., Cornwell, W. K., Eastman, J. M., Smith, S. A., FitzJohn, R. G., et al. (2014). Three keys to the radiation of angiosperms into freezing environments. Nature 506, 89–92. doi: 10.1038/nature12872
Zhu, J., Buchmann, C. M., and Schurr, F. M. (2022). Effects of seed morphology and orientation on secondary seed dispersal by wind. J. Plant Ecol. doi: 10.1093/jpe/rtac023
Zhu, J., Liu, M., Xin, Z., Liu, Z., and Schurr, F. M. (2019). A trade-off between primary and secondary seed dispersal by wind. Plant Ecol. 220, 541–552. doi: 10.1007/s11258-019-00934-z
Glossary
Keywords: ecological restoration, phylogenetic comparative method, seed germinability prediction, phylogenetic conservatism, phylogenetic signal
Citation: Chen Y, Schwilk DW, Cox RD and Johnson MG (2022) Including phylogenetic conservatism of shortgrass prairie restoration species does not improve species germinability prediction. Front. Ecol. Evol. 10:983192. doi: 10.3389/fevo.2022.983192
Edited by:
Isabel Marques, University of Lisbon, PortugalReviewed by:
João Paulo Ribeiro-Oliveira, Federal University of Uberlandia, BrazilDavid Draper, University of Lisbon, Portugal
Copyright © 2022 Chen, Schwilk, Cox and Johnson. This is an open-access article distributed under the terms of the Creative Commons Attribution License (CC BY). The use, distribution or reproduction in other forums is permitted, provided the original author(s) and the copyright owner(s) are credited and that the original publication in this journal is cited, in accordance with accepted academic practice. No use, distribution or reproduction is permitted which does not comply with these terms.
*Correspondence: Yanni Chen, eWFubmkuY2hlbkB0dHUuZWR1
†ORCID: Yanni Chen http://orcid.org/0000-0002-2996-9910
Robert D. Cox https://orcid.org/0000-0002-4005-1019
Matthew G. Johnson https://orcid.org/0000-0002-1958-6334
 Yanni Chen
 Dylan W. Schwilk1
 Robert D. Cox
 Matthew G. Johnson