 Yanpeng Gao1
 Chunyao Guo
 Ye Wei
95% of researchers rate our articles as excellent or good
Learn more about the work of our research integrity team to safeguard the quality of each article we publish.
Find out more
SYSTEMATIC REVIEW article
Front. Ecol. Evol. , 14 September 2022
Sec. Environmental Informatics and Remote Sensing
Volume 10 - 2022 | https://doi.org/10.3389/fevo.2022.975426
This article is part of the Research Topic Meta-Scenario Computation for Social-Geographical Sustainability View all 60 articles
Coordination and interaction among urbanization processes, efficient resource utilization, and ecological protection have emerged as key challenges for spatial development and protection of a territory. In this paper, we quantitatively determined the urbanization level and eco-efficiency by utilizing the entropy evaluation method and the SBM model with undesirable outputs, and then employed kernel density estimation, center movement method, and bivariate Moran's I index method to examine the spatial-temporal pattern as well as the interaction between the above two factors. This study provides a new framework for the measurement of urbanization and eco-efficiency and their interaction. The results of the study in the research area demonstrate that: (1) From 2013 to 2017, the urbanization level exhibited a steady increase from 0.2468 to 0.2789, while eco-efficiency depicted an N-shaped development trend before suffering an overall decline from 0.4364 to 0.3117; (2) the low-level units of urbanization level illustrated a strong convergence trend, and each unit possessed low eco-efficiency with weak spatial matching in general; (3) an ambiguous symbiosis exists between the center of gravity of movements of the two factors within each region; and (4) a global positive correlation was found between the urbanization level and eco-efficiency in Liaoning Province. The global Moran's I index first increased and then decreased.
Rapid urbanization has become a global phenomenon in recent decades, leading to several environmental problems such as the heat island effect, habitat degradation, congestion, and other challenges to human life (Ochoa et al., 2018). Against this backdrop, sustainable management, considering multiple aspects such as technology, economy, society, and environment, is on the agenda (Sheikhipour et al., 2018; Cohen-Shacham et al., 2019; United Nations, 2020). As an important indicator to measure the input-output mode of factors, the concept of eco-efficiency was first introduced by Schaltegger and Sturm (Schaltegger and Sturm, 1990), and since then, its connotation has been enriched by numerous international organizations and scholars (Weizsäcker et al., 1997; Schaltegger and Synnestvedt, 2002; Reith and Guirdy, 2003). Eco-efficiency is considered an important basis for measuring the quality of urban resource utilization and sustainable development capability from the perspective of resource and environmental input and economic output, to minimize the environmental impact and maximize the value impact (Prothero, 1999; Jollands et al., 2004). There is a complex interaction mechanism between eco-efficiency and urbanization (Wei and Ye, 2014; Luederitz et al., 2015; Hak et al., 2016). The urbanization process provides new input factors for urban production activities, and the efficient and reasonable utilization of input factors determines the urban eco-efficiency. At the same time, the level of eco-efficiency has positive feedback on the sustainability and efficiency of urbanization. At present, the urbanization process in China is in a transitional stage (Yang et al., 2019; He et al., 2022). Being a vital old industrial base in China, Liaoning Province faces several developmental challenges such as low-density spatial expansion and the contradiction between the supply and demand of resources, in tackling the dual pressure of socio-economic development and resources and environment (Yu et al., 2022). Counties are an integral component of the urban system in China and provide key support for the integrated development of urban and rural areas. Agricultural counties and districts are currently in a critical period of transformation and development and face problems such as insufficient urbanization development capacity and low long-term resource utilization. The conventional development model featuring high investment, high consumption, and high emission is unsustainable, and urbanization development where there is a fusion of optimal utilization of energy resources and effective protection of the ecological environment has become a necessary trend. Therefore, scientific measurement and an effective balance between the urbanization level and eco-efficiency of counties are of immense significance in achieving sustainable high-quality regional development and in optimizing the spatial development pattern of the country. The purpose of this study is to demonstrate a method to balance coordinated county urbanization development and ecological protection by analyzing the dynamic evolution process of urbanization and eco-efficiency and the time-space exchange relationship.
The term “urbanization” was first proposed by Serda in 1867 in “Introduction to Urbanization,” wherein urbanization was defined as the process of gathering rural populations in cities and towns. Subsequently, urbanization is generally defined as the process of growth in the proportion of a country's population living in urban areas, whereas, economists consider urbanization as a process of transformation from a rural economy to an urban economy (Fuchs and Pernia, 1987). In recent years, scholars have increasingly suggested that urbanization is not just a simple problem of population and economic agglomeration, but a comprehensive concept (He et al., 2017; Chen et al., 2022). In this context, a new type of urbanization that focuses on the coordinated development of population, land, economy, society and environment has attracted the attention of Chinese scholars (Zhang et al., 2022). Eco-efficiency was formally proposed by the World Business Council for Sustainable Development (WBCSD) (WBCSD, 1996), which is defined as the goods and services provided by enterprises that can meet the needs of human life and reduce the impact on ecology and resources. The Organization for Economic Cooperation and Development (Duggett, 1998) further expanded the scope of the concept of eco-efficiency, extending the subject to other organizations other than enterprises. Huppes et al. raised the eco-efficiency to the macro-level economic activities on the empirical relationship between environmental costs and environmental impacts (Huppes and Ishikawa, 2005). Research on eco-efficiency has gradually shifted from focusing on a certain industry to the macro level, that is, the research on the evolution of EE's cross-regional spatiotemporal patterns, mainly involving the national (Kounetas et al., 2021) and state scale (Grossman and Krueger, 1991).
The British scholar, Howard (2003), put forward the concept of an “idyllic city,” and pioneered research on the connection between urbanization and the environment. Since then, scholars around the world have conducted extensive research on this issue. Current studies on urbanization and eco-efficiency mainly focus on the following three aspects: Firstly, to characterize the relationship between urbanization and eco-efficiency, some scholars used an empirical approach, proposing that urbanization and eco-efficiency present a U-shape based on econometric theory, that is, the environmental Kuznets curve (EKC curve) (Grossman and Krueger, 1991), or N-shaped relationship (Bai et al., 2018). Secondly, scholars focused on the interaction between urbanization and eco-efficiency. Yao et al. (2021) analyzed the impact mechanisms of urbanization dimensions and the internal structure effect of each dimension on eco-efficiency using the Spatial Durbin model based on panel data from 30 provinces of China, from 2008 to 2017. The results demonstrate that local eco-efficiency exhibits a negative spatial effect on the surrounding areas, and population and ecological urbanization have significant positive impacts on local eco-efficiency, while social and spatial urbanization had significant negative impacts. Yue et al. (2020) constructed a spatial model to empirically analyze the effects of urbanization on eco-efficiency at the national level, and at four regional levels, observing an effect of spatial spillover in eco-efficiency, which was significant and positive for the whole country, except for the western region. The influence of urbanization on China's eco-efficiency exhibits a U-shaped curve. However, the trend exhibited an inverted U-shaped curve in the northeastern region. Thirdly, scholars conducted research on the coupling relationship between urbanization and eco-efficiency. Liu et al. (2021) evaluated and analyzed the spatial-temporal change trends of comprehensive urbanization level, energy eco-efficiency and their coupling coordination degree in 281 prefecture-level cities in China, from 2006 to 2016, showing that the coupling coordination degree manifested an increasing trend, which enabled China to move toward a high coordination level. Ren et al. (2022) analyzed the spatial correlation between urbanization efficiency and eco-efficiency by applying the spatial association model. Based on the relative development and spatial coupling models, the spatiotemporal coupling relationship was estimated, and it was found that the coupling relationship between the two is an N-type relationship. These studies mainly focus on macro-scales such as countries and urban agglomerations, but do not pay enough attention to micro-scales. When revealing the evolution law of urbanization and eco-efficiency, the dynamic migration of the two in space was ignored. When characterizing the spatial autocorrelation relationship between the two, the influence of one system on another system in space cannot be fully measured.
Although previous studies have described the time-series characteristics, impact mechanism, and coupling coordination relationship between urbanization and eco-efficiency, the research at the county scale is still insufficient, and the spatiotemporal synergistic relationship model between urbanization and eco-efficiency has not been established. Analysis of ecological macro issues from a micro perspective can help consider the particularity of eco-efficiency formation in different regions and conduct more rigorous exploration of spatial heterogeneity. Research on the temporal and spatial evolution trends and interactive synergies between eco-efficiency and urbanization can provide theoretical and policy references for balancing the two processes, transforming the development model of urbanization, and improving eco-efficiency utilization. To alleviate the predicament of county development, we first constructed an urbanization evaluation system and an eco-efficiency evaluation system suitable for agricultural counties utilizing available data, and second, we built a time-space interaction model for the dynamic evolution of urbanization and eco-efficiency, to demonstrate the sustainable development path of agricultural counties under the dual pressures of urbanization and eco-efficiency, in this paper. This study can also provide reference for the development of other regions and counties.
Located in the southern part of Northeast China, Liaoning Province has 14 provincial cities and 100 counties (county-level cities and districts) under its jurisdiction. By the end of 2021, the rate of urbanization of the province was 72.81%. In the process of long-term urbanization development, Liaoning Province is faced with problems such as high structural pollution pressure, unstable improvement of ecological environment quality, and a large number of arrears in environmental infrastructure. In 2016, the Implementation Opinions on Deepening the Construction of New Urbanization proposed to strengthen the weak links of counties and towns, promote the optimization of the province's urban structure, focus on the control of “urban diseases” and promote harmony between people and city development. After that, the 14th Five-Year Plan for Ecological Economic Development of Liaoning Province proposed that the structural, root and trend pressures of ecological environmental protection will generally remain in the 14th Five-Year Plan period, making it particularly important to quantify the level of urbanization development and the quality and stability of ecosystems in Liaoning Province. There are 81 agricultural counties and districts in Liaoning listed in the Liaoning Statistical Yearbook; considering the continuity, comparability, and availability of data as well as the adjustment of administrative area divisions, Yuanbao District, Zhenxing District, Wensheng District, Hongwei District, and Qianshan District were excluded in this study. Finally, the remaining 76 agricultural counties and districts in Liaoning Province were selected as the research units, with data from 2013 to 2017.
County-level administrative units (divided into municipal districts, counties, county-level cities, banners, forest districts, and special zones) are the most basic comprehensive administrative unit in China (referred to as “counties and districts” in this paper) connecting urban and rural areas and are important spatial carriers for coordinating the implementation of new urbanization and rural revitalization strategies. So far, there is no consensus in academic circles with respect to the concept of agricultural counties and districts. The agricultural counties and districts mentioned in this paper are selected from the list of agricultural counties and districts listed in the Statistical Yearbook of Liaoning Province, which includes 35 districts, 16 county-level cities, and 25 counties. In general, the level of economic development, pace of urbanization, and population density of a district is greater than that of a county-level city and that of a county. The economic base of agricultural counties and districts is dominated by agriculture, and the foundation of urbanization is relatively weak. In recent years, with the development of in-situ urbanization in agricultural counties and districts, the economic and social growth and ecological utilization of counties and districts have shown significant differences, and it is imperative to study the process and synergistic relationship between urbanization and eco-efficiency in agricultural counties and districts to explore the enhancement path of counties, to cope with ecological problems.
The statistical data used in this paper were derived from the Liaoning Statistical Yearbook (http://tjj.ln.gov.cn/tjsj/sjcx/ndsj/). In case of data missing for some years or regions, the statistical yearbook of each city in the corresponding year was used to supplement the same. If certain data were still missing, they were processed using the moving average method. The land use data were obtained from Landsat's China Land Cover Annual Dataset (CLCD) from 2013 to 2017, with a resolution of 30 m (http://doi.org/10.5281/zenodo.4417809).
Urbanization measurement needs to be considered holistically. Towns and cities have many components or “urban ingredients”— facilities, systems, and utilities, and the attributes that are desirable for an urban area to possess (Thomas, 2009; Van der Bruggen et al., 2010). Therefore, measuring the level of urbanization requires in-depth consideration, comprehension and balance of all urban elements, and appreciation for the local environment (Drakakis-Smith and Dixon, 1997; Enserink and Koppenjan, 2007; Liu et al., 2016). Based on the evaluation index system of the National New Urbanization Plan (2014–2020) and existing studies, we established an urbanization level measurement index system in this paper composed of the following five aspects: population, economy, land, society, and ecology (Table 1). The convergence of population to cities is the most typical process and result of urbanization. We choose proportion of urban population, proportion of non-agricultural industry employees and population density to represent the level of population urbanization. Urbanization is an inevitable result of economic development and the economic development level is a direct indicator that reflects the urbanization rate. The sub-system of economic urbanization mainly focuses on economic scale, residents' income level and industrial structure, in which the main indicators include GDP/capita and per capita disposable income of urban residents and proportion of added value of secondary and tertiary industries in GDP. Land elements are the carrier and basic conditions for promoting urbanization. The proportion of construction land and per capita road area are used to characterize land urbanization in this paper. The new urbanization adheres to the people-oriented approach, emphasizing the transformation of residents' lifestyles, the improvement of life quality, the acquisition of social recognition, and the full coverage and equalization of basic public services in the process of population citizenization. This paper uses public expenditure on science and education as a percentage of GDP, technical staff in medical and health institutions per thousand people, number of beds per thousand people in medical and health institutions, urban and rural endowment insurance coverage and internet broadband penetration rate to measure the impact of social development. Urbanization is increasingly emphasizing the concept of ecological civilization, advocating reducing disturbance and damage to nature during urban development. We choose domestic sewage treatment rate to measure ecological urbanization.
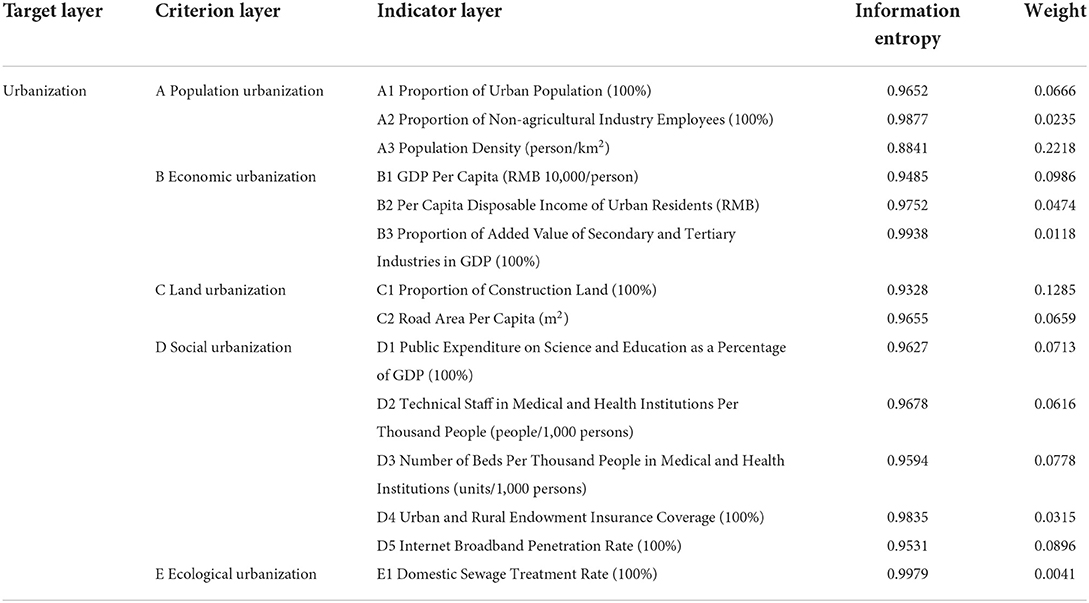
Table 1. Index system for measuring county urbanization level.
Eco-efficiency focuses on maximizing the economic value output by minimizing resource consumption and environmental pollution (Sadorsky, 2021). To ensure proper measurement of concurrent progress toward environmental sustainability and inclusive economic growth, eco-efficiency indicators should be assessed by combining indicators from two or more dimensions (Kuosmanen, 2005; Mickwitz et al., 2005). Referring to relevant literature, we comprehensively describe eco-efficiency from the perspective of input, expected output, and undesired output. Relevant indicators of social capital, energy and labor consumption, and natural resource are selected for the inputs. Social and economic output are mainly considered for the expected output, and the problem of environmental pollution is mainly considered for the undesired output, with pollutant discharge selected as the evaluation index. The combination of these three systems in one score satisfies the question of assessing the social development and environmental use trade-offs between domains of sustainability (Wursthorn et al., 2011; Bianchi et al., 2020; Kounetas et al., 2021). Furthermore, we established a county-level eco-efficiency evaluation index system that complies with scientific principles while keeping in mind efficacy (Table 2). When selecting resource input indicators, we selected social and natural resource indicators that are closely related to human production and life. Specifically, power input is measured by electricity consumption of the whole society, capital input is measured by total investment in fixed assets of the whole society, and land resource input is measured by construction land area and cultivated area, labor resource input is measured by industry practitioners. Regarding expected output indicators, consistent with the majority of scholars, general budgetary revenue of local finance and gross regional product were selected for measurement. Pollutant emissions are used to measure unexpected outputs, including industrial sulfur dioxide emissions, nitrogen oxide emissions and smoke (powder) dust emission.
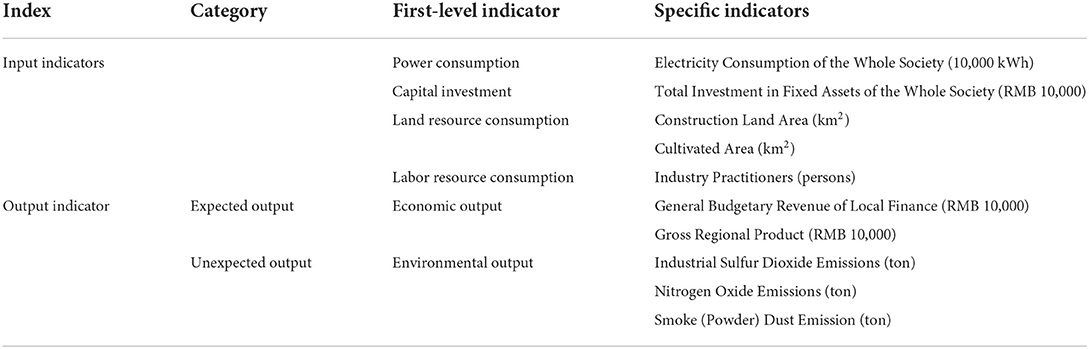
Table 2. County-level eco-efficiency evaluation index.
In this study, we scientifically measure and evaluate the dynamic evolution and synergistic relationship between urbanization and eco-efficiency in 76 agricultural counties and districts in Liaoning Province through the following methods and steps: (1) Construct an evaluation system for the urbanization level and eco-efficiency using the entropy evaluation method and the SBM model with undesirable outputs and complete the measurement calculation. (2) Measure the spatial-temporal evolution trend of urbanization and eco-efficiency using kernel density estimation curve and the gravity center transfer model to effectively measure the threshold distribution characteristics and direction characteristics. (3) Adopt bivariate Moran's I index to portray spatial-temporal interaction between county-level urbanization and eco-efficiency, describe the spatial aggregation and correlation of the two, and effectively resolve the endogeneity of variable data. Through the above methods, we clarify the development and evolution characteristics of county urbanization and eco-efficiency, as well as the dynamic and synergistic development ability of the two, to provide a theoretical basis to further balance the level of urban construction and eco-efficiency in the study area. The research methods and main contents are shown in Figure 1.
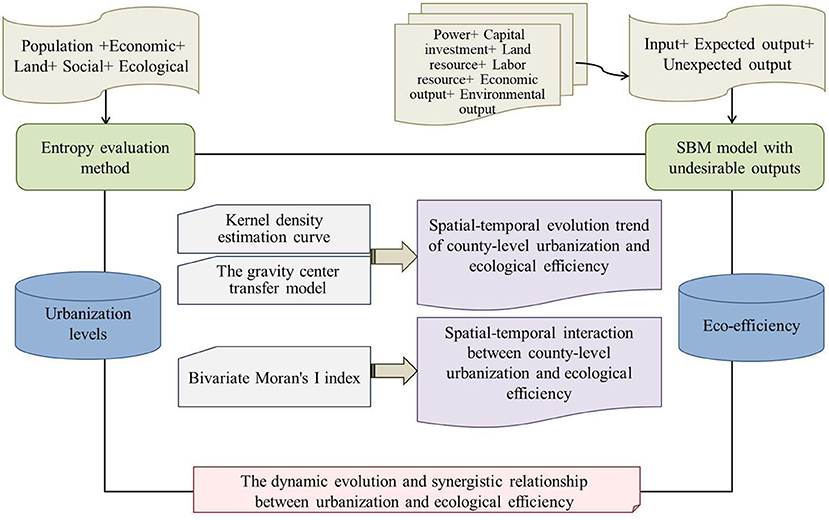
Figure 1. Method flow chart of the article.
The entropy method can profoundly reflect the utility value of the entropy value of the index information, and the index weight determined by it can effectively overcome subjectivity and has high reliability (Polesie et al., 2020). The entropy evaluation method deals with the utilization of information entropy to effectively transfer the information in accordance with the degree of discreteness of each indicator, which in turn helps to determine the weight of each indicator (Zhou and Zhou, 2015). Herein, we adopted the entropy evaluation method to measure the urbanization level; the calculation formula is as follows:
1. Data standardization
2. Calculating information entropy
3. Calculating the difference coefficient (information utility)
4. Calculating the weight of each indicator
5. Calculating comprehensive indicators
Most eco-efficiency measurement models choose “input + expected output + undesired output,” and the measurement methods mainly include data envelopment analysis including DEA model (Picazo-Tadeo et al., 2011; Yasmeen et al., 2020; Moutinho and Madaleno, 2021) and SBM mode (Li and Shi, 2014; Cecchini et al., 2018; Xu et al., 2020), and life cycle assessments (Avadí et al., 2014; Lorenzo-Toja et al., 2015; Beltrán-Estevea et al., 2017). As a systematic analysis method used to evaluate the relative efficiency of the same type of decision-making units based on various inputs and outputs, the data envelopment analysis is widely used to measure eco-efficiency. To solve the long-standing traditional issue of the DEA model being prone to relaxation of variables, Tone (Tone and Tsutsui, 2010, 2013) proposed a non-radial non-angular-based SBM model, which could effectively circumvent the deviation caused by the selection of radial and angular outputs and could also overcome the problem of input-output relaxation. Since multiple inputs and outputs need to be entered into the evaluation system when measuring the efficiency, Tone also upgraded the SBM model by considering the negative externalities of the environment, so that the relationship between the inputs and the outputs could be estimated meticulously. In this paper, the eco-efficiency was measured by employing the SBM model with unexpected output, non-orientation, and constant payoff to scale. The model is as follows:
In the formula: and stand for the redundant value of input and undesired output, respectively; the vector indicates the state of the desired output, which does not reach the maximum; the subscript j represents the jth DMU (Decision Making Unit). At the time of 0 < β* <1, the DMU is in an inefficient state, while an efficient state can be achieved by further optimizing the input or output. At the time of β*= 1, the DMU is in a relatively effective state and at that time, 0.
Kernel density estimation is a non-parametric estimation method that can describe the distribution state and distribution characteristics of random variables with a continuous probability density curve under the null hypothesis of a parametric model, as it can objectively and truly reflect the estimation; it is widely employed in measuring the regional differences of spatial elements (Minoiu and Reddy, 2014). In this paper, we employed kernel density estimation to describe the distribution state and distribution characteristics of random variables (Van Kerm, 2003). The calculation formula is as follows:
In the formula, h stands for the bandwidth, K represents the kernel function, and n is the number of elements covered in the circle, with point x as the center and bandwidth h as the radius. The nearest neighbor distance method was adopted to determine the bandwidth:
In the formula, dij stands for the distance between the points i and j, n is the total number of interest points, and k denotes the number of adjacent points around the interest point i.
The center of gravity model is an important analytical tool to study the spatial variation of factors in the process of regional development. The regional center of gravity is an index to measure the overall distribution of a certain attribute in the region and the movement of the center of gravity reflects the spatial trajectory of regional development (Zhao et al., 2020). In this paper, the center of gravity transfer model was adopted to determine the overall variation trend of the spatial distribution of variables (Liang et al., 2021). The formula of the barycentric coordinate solution model is as follows:
In the formula: x and y stand for the center of gravity longitude and latitude of a certain index for the total area, respectively; Xi and Yi represent the coordinates of the geographic center of gravity in the sub-area, respectively; i stands for the ith research unit, n stands for the total number of research units, and Mi for the weight of an index in the area.
The formula for solving the moving distance of the regional center is as follows:
In the formula: Ds−k stands for the moving distance of the center in two different years; and s and k represent the 2 years, respectively; Xs, Xs, Xk, Yk denote the longitude and latitude coordinates of the geographic location of the regional center in the sth year and the kth year, respectively; C represents the conversion rate between geographic coordinates and plane projection coordinates, which is generally a constant, 1°≈111.111 km; C×(Xs−Xk) and C × (Ys−Yk) stand for the absolute distance that the center of a certain element moves in terms of longitude and latitude from the kth year to the sth year, respectively.
Spatial autocorrelation analysis is commonly used to reveal whether the distribution of spatial variables and their adjacent regions have agglomeration. It includes two aspects—global spatial autocorrelation and local spatial autocorrelation (Wartenberg, 1985), which are represented by Moran's I and Local Moran's I indices (Batlle and van der Hoek, 2018). The bivariate Moran's I index is an improved version of the traditional Moran's I index (Kruger et al., 2017; Antczak, 2020). The global bivariate Moran's I index is used in this paper to test whether any spatial clustering and discrete features are present in the global range of the variable. The formula is as shown in Equation (12):
The local bivariate Moran's I index was adopted to examine the local anomalies and spatial agglomeration triggered by the spatial stagnation effect amongst the research units. The formula is as shown in Equation (13):
In the formula: stands for the observation value of the variable k on the space unit i, is the observation value of the variable l on the space unit j, and are the average observation values for the variables k and l, respectively, wij stands for the spatial weight matrix, and and stand for the variances of the observation values for the variables k and l, respectively.
In this paper, the natural discontinuity method was employed to divide the measured urbanization levels and eco-efficiency results into four grades, ranging from low to high. As shown in Figure 2, the urbanization level of agricultural counties and districts in Liaoning Province exhibited an overall upward trend from 2013 to 2017, while the average index rose from 0.2468 in 2013 to 0.2789 in 2017. In terms of the variation range, the level of urbanization first increased and then decreased, with 2014 being the turning point, and subsequently the urbanization process became stable. The highest value of urbanization was observed at the centers of Fuxin City and Tieling City, demonstrating a unique and prominent “siphon effect.” Furthermore, the two high-value centers came into being in Dalian City and Shenyang City, from where they diffused from inwards to outwards, thus forming high-value agglomeration areas with a striking driving effect of urbanization. In terms of spatial-temporal evolution characteristics, the urbanization level of the agricultural counties and districts in Liaoning Province depicted a positive shift from exclusively northeast–southwest strip development to overall regional development.
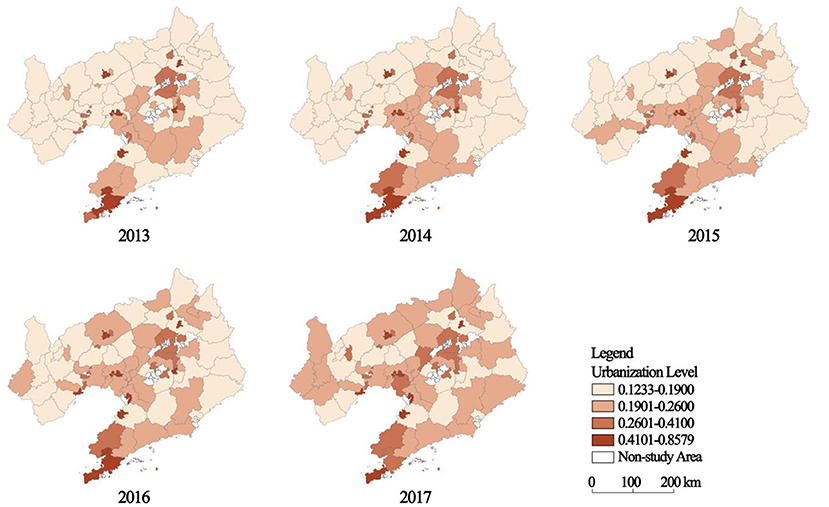
Figure 2. Spatial pattern of urbanization in agricultural counties and districts of Liaoning province (2013–2017).
The measurement results of eco-efficiency (Figure 3) show that the eco-efficiency of agricultural counties and districts in Liaoning Province demonstrates an N-shaped development curve (Kuznets curve), with the years 2014 and 2016 being the inflection points and subsequently undergoing an overall reduction. The average value declined from 0.4364 in 2013 to 0.3117 in 2017, reflecting poor stability of eco-efficiency. The southern Liaoning region presented relatively better eco-efficiency, but still endured depletion to some extent owing to urbanization development. The eco-efficiency of the western Liaoning region fell behind. The eco-efficiency of the central, eastern, and northern parts of Liaoning thrived during the initial period, but then suffered a declining trend with each year, with only certain regions recuperating. In a nutshell, the urbanization level and eco-efficiency of Liaoning Province portrayed a reverse development trend in terms of time, and even the spatial pattern of the two was characterized by an identical imbalance.
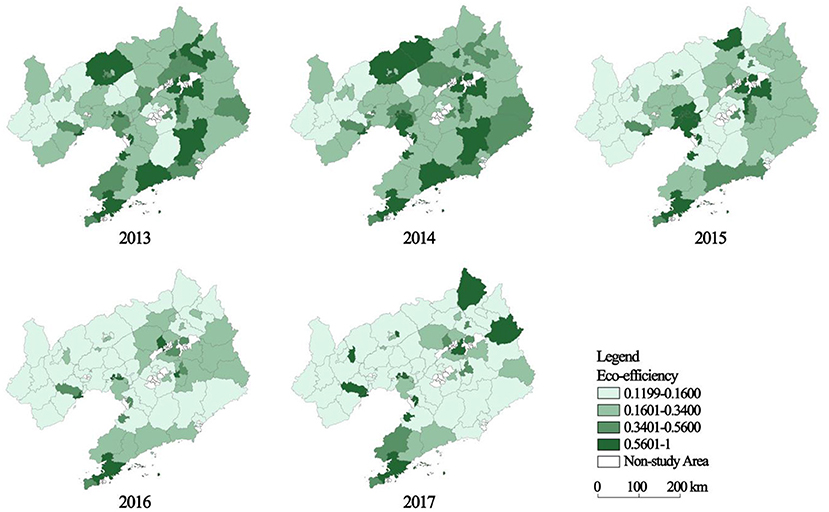
Figure 3. Spatial pattern of eco-efficiency in agricultural counties and districts of Liaoning province (2013–2017).
In this paper, the kernel density estimation curve was implemented to evaluate the quantitative change characteristics of the values of the two factors on the time scale (Figure 4); the results reveal that: (1) During the research period, the urbanization level distribution curve of the agricultural counties and districts in Liaoning Province shifted to the right on the whole, indicating that the urbanization level was on the rise; the wave crest was sharp and the height first decreased and then increased, suggesting that no decline occurred in the difference in the urbanization level between counties and districts; a prominent diffusion phenomenon followed by striking agglomerated development was observed within the region. All the curves over the years exhibited the characteristics of right-trailing, indicating that the number of units with higher urbanization level were still small, whereas the low-value units possessed a remarkable convergence trend. (2) The increase and decrease in the eco-efficiency distribution curve varied considerably, and the peak shape and tailing of the curve also differed greatly, signifying that the eco-efficiency of each unit failed to assume a highly correlated spatial matching; the distribution curve showed a “right-left-right” movement trend, with the year 2016 as the node. The eco-efficiency of agricultural counties and districts in Liaoning province first increased, then decreased, and then increased again. The ecological utilization level first decreased and then increased slightly, but it still failed to reach the previous level. The eco-efficiency curve over the years presented characteristics of double peaks, and the two peaks were at both the ends, which implied severe polarization of eco-efficiency. The highest peak on the left side shows that the eco-efficiency of each unit was still lower, by and large. The peak location showed an “upward-downward” trend, and the curve transformed from a wide front to a sharp peak and then mitigated, suggesting that the difference in county-level eco-efficiency was constantly widening, before being curbed to some extent.
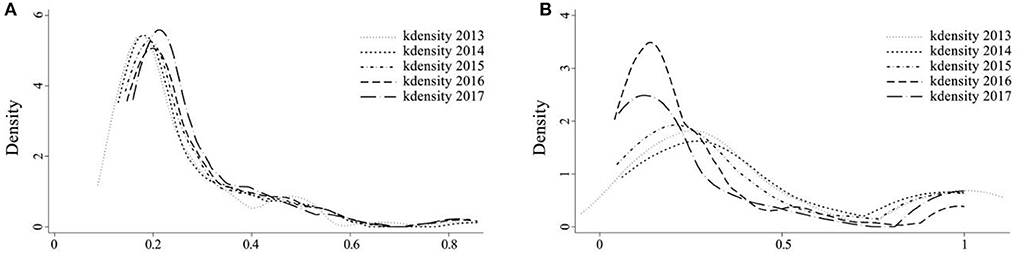
Figure 4. Kernel density curve of urbanization level and eco-efficiency of agricultural counties and districts in Liaoning province (2013–2017). (A) Urbanization levels. (B) Eco-efficiency.
To manifest the varying trends of urbanization and eco-efficiency at different spatial scales, the center transfer model was adopted to characterize the spatial evolution trajectories of urbanization and eco-efficiency. The calculation results are shown in Table 3 and Figure 5. The center of county-level urbanization in Liaoning Province demonstrated a relatively smooth movement, and the center of eco-efficiency presented a substantial movement, with a larger difference in the moving trend between various regions. At the provincial level, the urbanization development of Liaoning Province portrayed a “southwest–northeast” movement during the study period, and the center was positioned in Tai'an County and Panshan County in the central part of Liaoning. The total distance covered by the movement was 13.65 km, with an average movement rate of 3.41 km/a. The eco-efficiency presented a “southwest–northwest” movement, with the center positioned in Liaoyang County, and gradually shifting to Haicheng City. The total distance covered by the movement was 49.14 km, with an average movement rate of 12.28 km/a, and the variation rate depicted an overall increasing trend. No remarkable synergy was observed between the variation rate and the direction of the two centers.
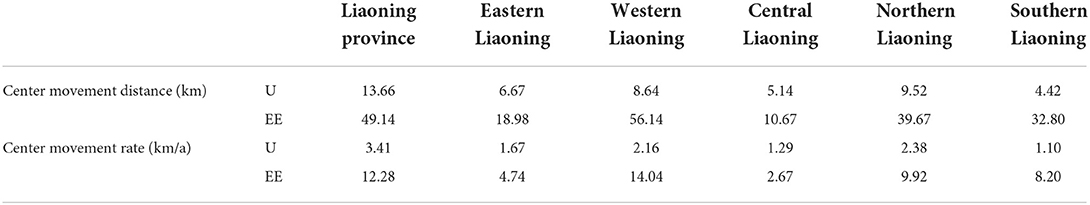
Table 3. Movement distance and rate of urbanization (U) and eco-efficiency (EE) of centers of agricultural counties and districts in Liaoning province (2013–2017).
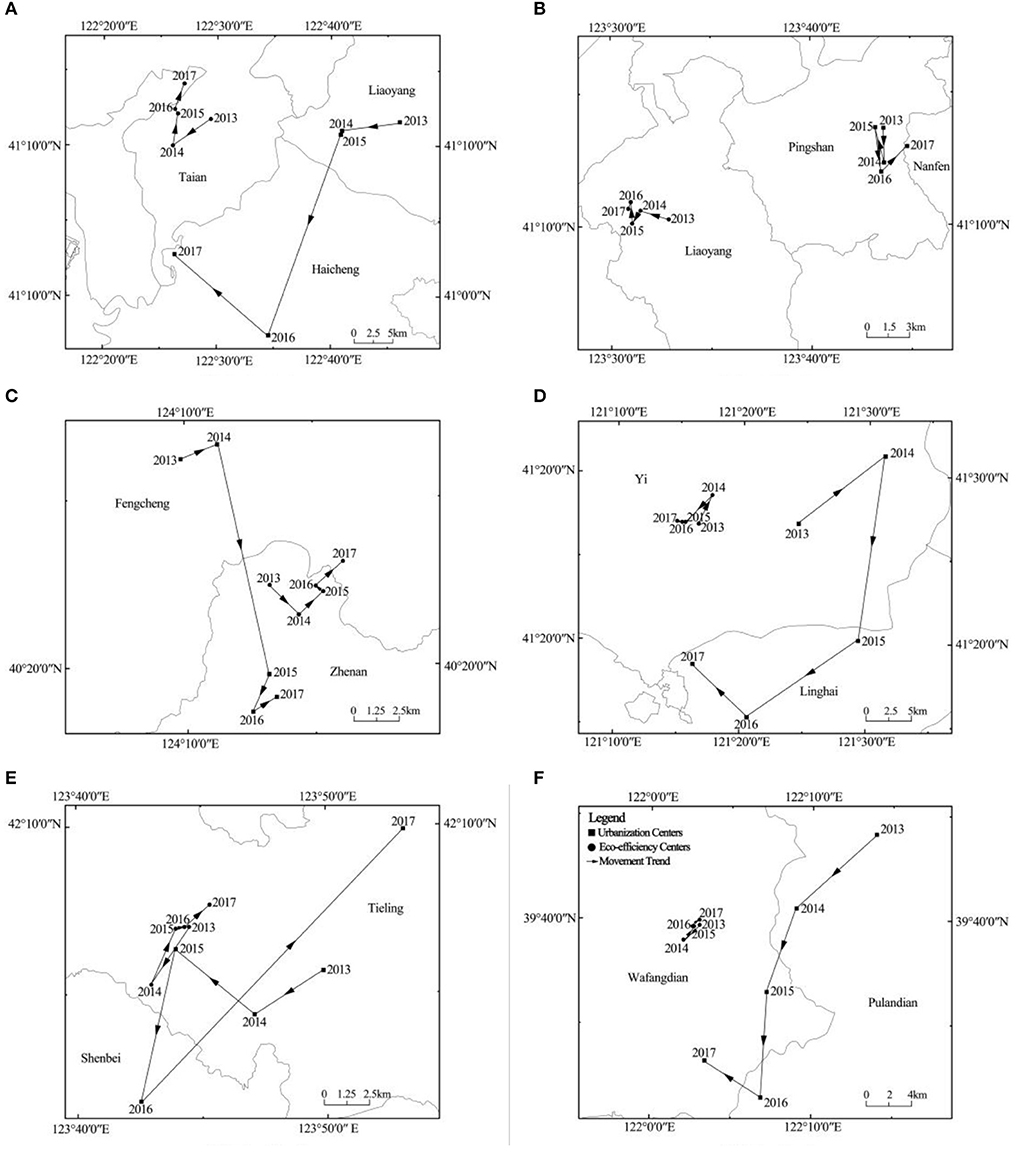
Figure 5. Movement trend of urbanization and eco-efficiency centers of agricultural counties and districts in Liaoning province (2013–2017). (A) Liaoning province. (B) Central Liaoning. (C) Eastern Liaoning. (D) Western Liaoning. (E) Northern Liaoning. (F) Southern Liaoning.
The center change characteristics of urbanization level and eco-efficiency in different regions are as follows: (1) The urbanization center of the eastern Liaoning region moved along the “southeast–northeast” direction, with slight fluctuations and a stable moving rate; the eco-efficiency center moved southwards on the whole, and the movement rate tended to be stable after a considerable change in 2014. The two behaved relatively similarly in terms of the center location, movement rate, and movement direction. (2) Urbanization in the western Liaoning region occurred at a steady pace and the movement rate declined with each year, whereas, there was a slight change in the location of the center. The center of eco-efficiency moved southwards, with weak stability of the moving rate. A significant spatial change was observed in the development of eco-efficiency. In addition, an increase was witnessed in the spatial difference of the development center between the two factors. (3) The center location of urbanization and eco-efficiency in central Liaoning suffered a slight change, but both the factors illustrated prominent spatial stability during the development phase. (4) The urbanization center of the northern Liaoning region moved northwards overall, undergoing stable changes; the center of eco-efficiency first moved southwards and then shifted northwards, with the variation speed accelerating constantly. (5) The urbanization center of the southern Liaoning region moved slightly around the same place but mostly remained fixed. The center of eco-efficiency moved southwards overall, and enjoyed considerable changes in 2014, with only stable changes in all the other years.
By and large, at the provincial and the regional level, Liaoning Province exhibited a relatively stable urbanization process and a relatively robust urbanization spatial pattern. No remarkable trend was observed in the movement of the urbanization center in each region. The urbanization migration distance and rate ranking of the different regions are attributable to the regional urbanization construction base. The better the foundation of urbanization development, the more stable is the movement trend. The eco-efficiency presented significant movement changes, with an unbalanced movement direction and rate among the regions. Except for the eastern and the central Liaoning regions, the center of eco-efficiency showed significant dynamic changes in all the other regions of the province. Generally, Liaoning was labeled with poor stability in eco-efficiency development, weak trend of agglomeration development across the province, shortage of proper guidance and specifications for eco-efficiency development, and prominent development randomness and variability. In terms of the coordinated development of urbanization and eco-efficiency, there was some insufficient correlation between the variations in the center of the two within specific regions, and insignificant overlapping and synchronization of the variations in the center of the two, within specific regions.
In this paper, urbanization is considered as the first variable and eco-efficiency as the second variable (urbanization-eco-efficiency), while it is the vice-versa (eco-efficiency-urbanization) when calculating the two-variable global Moran's I index. The calculation results are shown in Table 4. The results reveal that a positive spatial correlation exists between the urbanization level and eco-efficiency of Liaoning Province, which indicates that a positive correlation exists between the urbanization level and the eco-efficiency of the surrounding areas as well as between the eco-efficiency and the urbanization of the surrounding areas. The Moran's I index of “urbanization-eco-efficiency” exceeded the Moran's I index of “eco-efficiency-urbanization” in 2014, signifying that the impact of eco-efficiency on the urbanization of the surrounding areas was eventually greater than the impact of urbanization on the eco-efficiency of the surrounding areas. Both the Moran indices demonstrated an “up-down” trend, suggesting that the cluster development or stagnant development capability of the two factors first increased and then decreased.
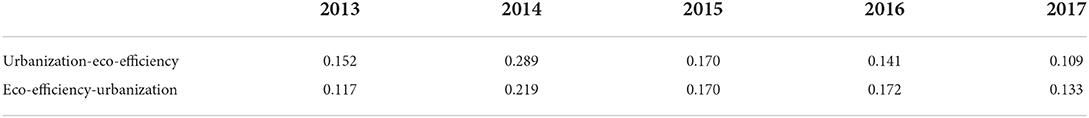
Table 4. Changes in bivariate Moran's I index of agricultural counties and districts in Liaoning province over the years.
The calculation results of the local Moran's I index of urbanization-eco-efficiency (Figure 6A) reveal that: (1) On the whole, the research units presented a certain number of abnormal agglomeration characteristics, with the LL agglomeration forming the primary type. (2) In terms of space, LL agglomeration areas emerged adjacent to each other in the western Liaoning region, which was characterized with backward urbanization development, relatively extensive and inefficient development of the surrounding areas, and inadequate emphasis on eco-efficiency utilization; furthermore, small-scale HH agglomeration areas formed in the central and southern Liaoning regions, which focused on input-output efficiency and interaction between urbanization level and eco-efficiency of the surrounding areas during the course of rapid urbanization; HL agglomeration areas emerged in the western, central, and southern Liaoning regions, which were labeled with prominent urbanization agglomeration effect and negative development externalities. In the process of urban development, such areas are likely to capture development resources of surrounding areas. The LH agglomeration areas emerged in the central and eastern part of the province, which were characterized with relatively backward urbanization development and refined ecological protection in the development process. (3) From the perspective of time series variations, the number and distribution pattern of each abnormal agglomeration type of urbanization-eco-efficiency remained stable overall. LL type gradually moved from the western Liaoning region along the southeastern direction, and HH type shifted from the central Liaoning region to the southern part, while the number of HL and LH areas reduced.
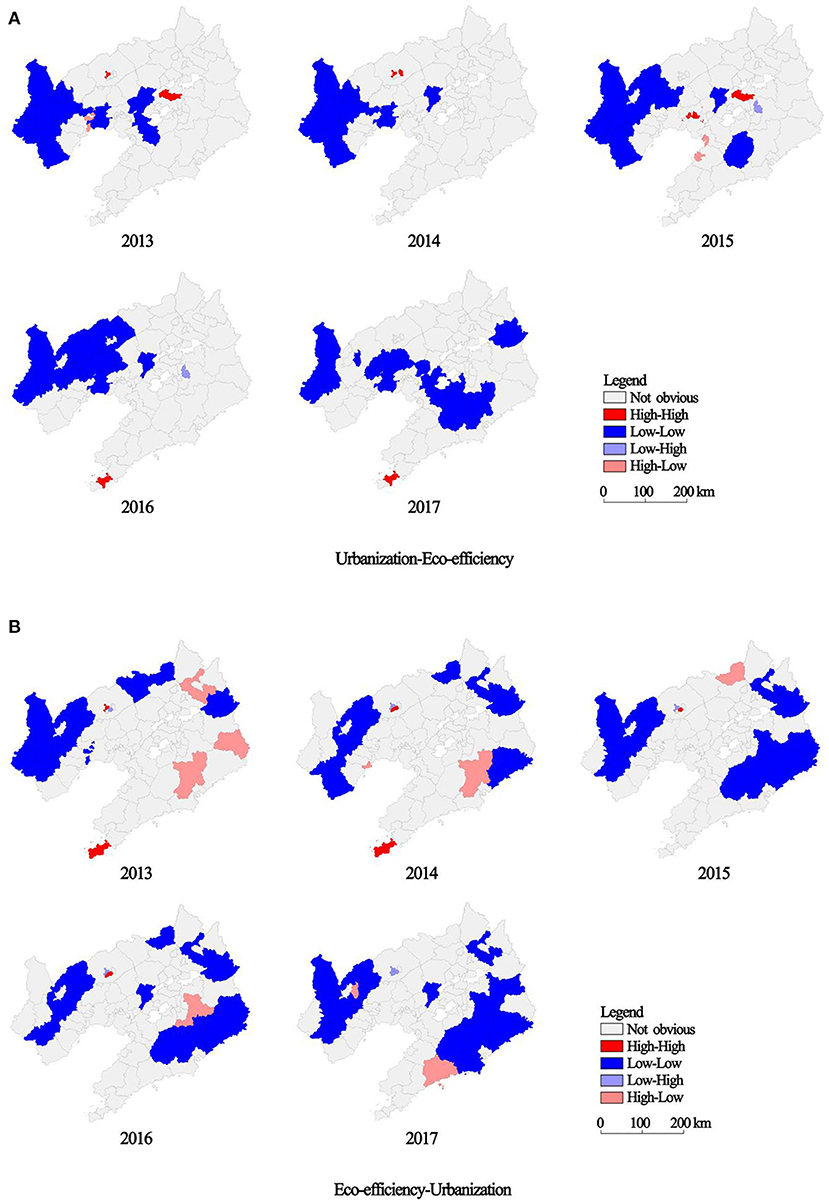
Figure 6. LISA agglomerations of urbanization and eco-efficiency of agricultural counties and districts in Liaoning province (2013–2017). (A) Urbanization-eco-efficiency. (B) Eco-efficiency-urbanization.
The calculation results of local Moran's I index of eco-efficiency-urbanization suggest that (Figure 6B): (1) The impact of eco-efficiency in Liaoning Province on the urbanization level of the surrounding areas was predominantly generated by the LL and HL agglomeration types. (2) From the perspective of space, the LL agglomeration areas were basically distributed in the western, northern, and eastern parts of Liaoning Province along the topographical characteristics, featuring low input-output ratio of economic and ecological development, and the relatively backward urbanization development of their surrounding areas; local HL agglomeration areas emerged in the eastern and the northern parts of Liaoning Province, which enjoyed a superior level of eco-efficiency than the urbanization development level of their surrounding areas; the concentrated HH and LH areas were formed adjacent to each other in the northwest Liaoning region, and eventually transformed into the LH type, demonstrating that these areas experienced higher agglomerated urbanization development, and were likely to deplete eco-efficiency in exchange for the urbanization development of their surrounding areas; HH agglomeration areas formed in the southern Liaoning region and subsequently exhibited poor development performance, establishing that the high level of eco-efficiency in such areas weakened the urbanization development of their surrounding areas. (3) From the perspective of time series variations, the spatial pattern of the LL areas remained stable; a drop was witnessed in the number of HH and HL types of research units, and high eco-efficiency promoted weaker urbanization development in the surrounding areas. An increase was observed in the number of LH-type areas, where the situation of promoting urbanization development of the surrounding areas while ignoring eco-efficiency grew increasingly severe during the study period.
The level of urbanization in agricultural counties and districts in Liaoning Province during the study period has been increasing and gradually moving toward region-wide development, which coincides with China's acceleration into a new stage of urbanization transformation and development that focuses on improving quality after the issuance of the National New Urbanization Plan (2014–2020) by the State Council and the Central Committee of the Communist Party of China in 2014. This has caused the agglomeration capacity of central cities to become increasingly prominent and surrounding counties and districts have gradually formed a new growth pole for coordinated regional development. Eco-efficiency has generally decreased and become less stable during the study period. Urbanization has promoted the non-agricultural transformation of industries and resources, but the new economic and social development model has brought about “urban diseases” such as environmental pollution and imbalance in the input and output of energy flow. Eco-efficiency has an N-shaped structure with inflection points in 2014 and 2016, which may be a response to the strategic decision of “vigorously promoting the construction of ecological civilization” proposed at the 18th National Congress of the Communist Party of China in 2012 and the General Plan for the Reform of the Ecological Civilization System issued by the State Council and the Central Committee of the Communist Party of China in 2015. However, due to the immaturity of China's internal structural system and operational processes, as well as environmental debt, the positive impact of ecological use transformation in counties and regions is still not obvious (Yao et al., 2021).
Different from the results of previous studies, in this paper, we propose that the temporal development of eco-efficiency and urbanization in the study area is not synchronized, and the coupling coordination between the two is in the shape of an inverted U, suggesting that coordinated development of urbanization and eco-efficiency has not yet occurred in the study area. And there is a disconnect between the pursuit of urban construction and ecological protection in the development of agricultural counties and districts. The spatial heterogeneity of urbanization and eco-efficiency agglomeration development in the counties and districts is strong, but generally speaking, the low-urbanization level and eco-efficiency development areas under the dual pressure of the two are obvious. The development of urbanization has a positive impact on the eco-efficiency of the surrounding areas, and the optimization of eco-efficiency has an overall positive impact on the improvement of urbanization in the surrounding areas. However, the negative effects of urbanization spread to neighboring counties, forming a “pollution refuge effect,” and the phenomenon of maintaining eco-efficiency at the expense of surrounding urbanization development still exists. The ability to coordinate and integrate regional urbanization development and eco-efficiency still needs to be further strengthened.
Owing to the limitation of some objective factors, this study still has some shortcomings. Firstly, the social statistical data used in this paper may contain certain arbitrary fluctuations attributable to different statistical calibers, which may lead to certain errors in the calculation results. Secondly, in view of the limited availability and continuity of the data, this paper may lack a certain level of accuracy and comprehensiveness in determining the evaluation years and indicators. The inclusion of the panel data into longer time series and broader indicator system may also be challenging for subsequent studies.
Based on the panel data of 76 county-level units in Liaoning Province, we describe the spatial-temporal evolution trends and interaction characteristics of the urbanization level and eco-efficiency of agricultural counties and districts in Liaoning Province, in this paper. The main conclusions drawn are as follows:
(1) From 2013 to 2017, the average value of urbanization of agricultural counties and districts in Liaoning Province gradually climbed from 0.2468 to 0.2789, and the urbanization process switched from strip development to regional development, entirely. The eco-efficiency of agricultural counties and districts in Liaoning Province exhibited an N-shaped development trend and declined from 0.4364 to 0.3117. Eco-efficiency was relatively better in the southern Liaoning region but was underdeveloped in the western Liaoning region. Eco-efficiency of the other regions in the province had a good foundation but was badly deteriorated due to urbanization development. Overall, the urbanization level and eco-efficiency of agricultural counties and districts in Liaoning Province portrayed a reverse development trend, and the spatial pattern of the two also showed similar unbalanced characteristics.
(2) From 2013 to 2017, no reduction was seen in the urbanization difference among the agricultural counties and districts in Liaoning Province. There were certain diffusion characteristics, followed by the evident agglomerated development within the region. Most of the research units were low-level units and demonstrated a remarkable convergence trend. After experiencing a fluctuating decrease, the eco-efficiency slightly increased but failed to reach the previous elevated level. Severe polarization of eco-efficiency was observed, and the value of each unit was generally low. The difference in the county-level eco-efficiency was curtailed to some extent before it continued to increase again.
(3) From 2013 to 2017, the center of urbanization in Liaoning Province moved in the “southwest–northeast” direction, with an average movement rate of 3.41 km/a, and the moving trend was stable. The center of eco-efficiency moved in the “southwest–northwest” direction, with an average movement rate of 12.28 km/a, and the overall variation rate increased. There was insufficient correlation between the changes in the center of the two factors in various regions, and insignificant synchronization in changes in the movement of the center of the two, within each region.
(4) From 2013 to 2017, there was a global positive correlation between the urbanization level and eco-efficiency in Liaoning Province, which exhibited an inverted “U” shaped development trend, with the year 2014 as the inflection point. The global Moran's I index of “urbanization-eco-efficiency” rose from 0.152 in 2013 to 0.289 in 2014 and then continued to drop to 0.109 in 2017. The global Moran's I index of “eco-efficiency-urbanization” increased from 0.117 in 2013 to 0.219 in 2014, and then reduced to 0.133 in 2017. The local autocorrelation of “urbanization-eco-efficiency” was dominated by the LL agglomeration type, which was adjacently distributed in the western region and subsequently shifted to the southeastern region. The southern region gradually replaced the central region to form the HH agglomeration areas, and the HL and LH agglomeration areas were minimal in number and declined gradually. “Eco-efficiency-urbanization” agglomeration areas primarily belonged to the LL and HL types. LL agglomeration areas were distributed in the western, northern, and eastern parts of Liaoning Province with a stable spatial pattern. A gradual decrease was observed in the number of HL and HH agglomeration areas, while a surge was witnessed in the number of LH agglomeration areas.
The results herein have important reference values for ecological construction and sustainable development and can effectively help guide regional managers in regional planning and policy formulation, as well as provide reference for other regions to conduct interactive research on urbanization and eco-efficiency. This paper draws the following inspirations for the development of the county: (1) Establish a comprehensive evaluation system for the urbanization level and ecological environment, and dynamically monitor the process of urbanization and eco-efficiency. (2) Continue to follow the path of sustainable development, optimize resource allocation, and improve the coordination and interaction between regional construction and ecological utilization. (3) Fully consider the spatial spillover effects of urbanization and eco-efficiency, and build regional integration, planning docking, and policy coordination mechanisms, and cross-regional ecological compensation mechanisms.
The raw data supporting the conclusions of this article will be made available by the authors, without undue reservation.
YG: data curation and investigation. CG: data curation, writing—original draft, and writing—review and editing. YW: conceptualization, formal analysis, and supervision. All authors contributed to the article and approved the submitted version.
The authors declare that the research was conducted in the absence of any commercial or financial relationships that could be construed as a potential conflict of interest.
All claims expressed in this article are solely those of the authors and do not necessarily represent those of their affiliated organizations, or those of the publisher, the editors and the reviewers. Any product that may be evaluated in this article, or claim that may be made by its manufacturer, is not guaranteed or endorsed by the publisher.
Antczak, E. (2020). Regional patterns in dumping sites in poland - analysis in context of the new “sustainable” waste policy. Polish J. Environ. Stud. 29, 1037–1049. doi: 10.15244/pjoes/108484
Avadí, Á., Vázquez-Rowe, I., and Fréon, P. (2014). Eco-efficiency assessment of the peruvian anchoveta steel and wooden fleets using the LCA+DEA framework. J. Clean. Prod. 70, 118–131. doi: 10.1016/j.jclepro.2014.01.047
Bai, Y., Deng, X., Jiang, S., Zhang, Q., and Wang, Z. (2018). Exploring the relationship between urbanization and urban eco-efficiency, evidence from prefecture-level cities in China. J. Clean. Prod. 195, 487–1496. doi: 10.1016/j.jclepro.2017.11.115
Batlle, J. R. M., and van der Hoek, Y. (2018). Clusters of high abundance of plants detected from local indicators of spatial association (LISA) in a semi-deciduous tropical forest. PLoS ONE 13, e208780. doi: 10.1371/journal.pone.0208780
Beltrán-Estevea, M., Reig-Martínez, E., and Estruch-Guitart, V. (2017). Assessing eco efficiency, a metafrontier directional distance function approach using life cycle analysis. Environ. Impact Assess. Rev. 63, 116–127. doi: 10.1016/j.eiar.2017.01.001
Bianchi, M., del Valle, I., and Tapia, C. (2020). Measuring eco-efficiency in European regions, evidence from a territorial perspective. J. Clean. Prod. 276, 123246. doi: 10.1016/j.jclepro.2020.123246
Cecchini, L., Venanzi, S., Pierri, A., and Chiorri, M. (2018). Environmental efficiency analysis and estimation of CO2 abatement costs in dairy cattle farms in Umbria (Italy), a SBM-DEA model with undesirable output. J. Clean. Prod. 197, 895–907. doi: 10.1016/j.jclepro.2018.06.165
Chen, Y., Yang, J., Yang, R., Xiao, X., and Xia, J. (2022). Contribution of urban functional zones to the spatial distribution of urban thermal environment. Build. Environ. 216, 109000. doi: 10.1016/j.buildenv.2022.109000
Cohen-Shacham, E., Andrade, A., Dalton, J., Dudley, N., Jones, M., Kumar, C., et al. (2019). Core principles for successfully implementing and upscaling nature-based solutions. Environ. Sci. Policy 98, 20–29. doi: 10.1016/j.envsci.2019.04.014
Drakakis-Smith, D., and Dixon, C. (1997). Sustainable uribanization in Vietnam. Geoforum 28, 21–38. doi: 10.1016/S0016-7185(97)85525-X
Duggett, M. (1998). Organisation for economic cooperation and development. Piblic Administr. 76, 189–190.
Enserink, B., and Koppenjan, J. (2007). Public participation in China, sustainable urbanization and governance. Manage. Environ. Q. 18, 459–474. doi: 10.1108/14777830710753848
Fuchs, R. J., and Pernia, E. M. (1987). Urbanization and Urban Policies in Pacific Asia. Boulder; London, Westview Press.
Grossman, G. M., and Krueger, A. B. (1991). Environmental impacts of a North American free trade agreement. National Bureau of Economic Research Working Paper, Cambridge, Vol. 3914, 1–57.
Hak, T., Janoušková, S., and Moldan, B. (2016). Sustainable development goals, a need for relevant indicators. Ecol. Indic. 60, 565–573. doi: 10.1016/j.ecolind.2015.08.003
He, F., Yang, J., Zhang, Y., Sun, D., Wang, L., Xiao, X., et al. (2022). Offshore Island Connection Line, a new perspective of coastal urban development boundary simulation and multi-scenario prediction. GIScience Remote Sens. 59, 801–821. doi: 10.1080/15481603.2022.2071056
He, J., Wang, S., Liu, Y., Ma, H., and Liu, Q. (2017). Examining the relationship between urbanization and the eco-environment using a coupling analysis, case study of Shanghai, China. Ecol. Ind. 77, 185–193. doi: 10.1016/j.ecolind.2017.01.017
Howard, E. (2003). Garden cities of to-morrow. Organ. Environ. 16, 98–107. doi: 10.1177/1086026602250259
Huppes, G., and Ishikawa, M. (2005). A framework for quantified eco-efficiency analysis. J. Indus. Ecol. 9, 25–41. doi: 10.1162/108819805775247882
Jollands, N., Lermit, J., and Patterson, M. (2004). Aggregate eco-efficiency indices for New Zealand-a principal components analysis. J. Environ. Manage. 73, 293–305. doi: 10.1016/j.jenvman.2004.07.002
Kounetas, K. E., Polemis, M. L., and Tzeremes, N. G. (2021). Measurement of eco-efficiency and convergence, evidence from a non-parametric frontier analysis. Eur. J. Oper. Res. 291, 365–378. doi: 10.1016/j.ejor.2020.09.024
Kruger, R. V., Nunes, P. A., and Bourscheidt, D. M. (2017). Programa Bolsa Família e o mercado de trabalho no Paraná em 2010. Econ. Sociedad Territorio 17, 777–808. doi: 10.22136/est2017926
Kuosmanen, T. (2005). Measurement and analysis of eco-efficiency, an economist's perspective. J. Ind. Ecol. 9, 15–18. doi: 10.1162/108819805775248025
Li, H., and Shi, J. (2014). Energy efficiency analysis on Chinese industrial sectors, an improved Super-SBM model with undesirable outputs. J. Clean. Prod. 65, 97–107. doi: 10.1016/j.jclepro.2013.09.035
Liang, L., Chen, M., Luo, X., and Xian, Y. (2021). Changes pattern in the population and economic gravity centers since the Reform and Opening up in China: The widening gaps between the South and North. J. Clean. Prod. 310:127379. doi: 10.1016/j.jclepro.2021.127379
Liu, S., Zhang, P., Wang, Z., Liu, W., and Tan, J. (2016). Measuring the sustainable urbanization potential of cities in Northeast China. J. Geogr. Sci. 26, 549–567. doi: 10.1007/s11442-016-1285-0
Liu, W., Zhan, J. Y., Zhao, F., Wei, X. Q., and Zhang, F. (2021). Exploring the coupling relationship between urbanization and energy eco-efficiency, a case study of 281 prefecture-level cities in China. Sustain. Cities Soc.64, 102563. doi: 10.1016/j.scs.2020.102563
Lorenzo-Toja, Y., Vázquez-Rowe, I., Chenel, S., Marín-Navarro, D., Moreira, M. T., and Feijoo, G. (2015). Eco-efficiency analysis of Spanish WWTPs using the LCA + DEA method. Water Res. 68, 651–666. doi: 10.1016/j.watres.2014.10.040
Luederitz, C., Brink, E., Gralla, F., Hermelingmeier, V., Meyer, M., Niven, L., et al. (2015). A review of urban ecosystem services, six key challenges for future research. Ecosyst. Serv. 14, 98–112. doi: 10.1016/j.ecoser.2015.05.001
Mickwitz, P., Melanen, M., Rosenström, U., and Seppala, J. (2005). Regional eco-efficiency indicators - a participatory approach. J. Clean. Prod. 14, 1603–1611. doi: 10.1016/j.jclepro.2005.05.025
Minoiu, C., and Reddy, S. G. (2014). Kernel density estimation on grouped data, the case of poverty assessment. J. Econ. Inequal. 12, 163–189. doi: 10.1007/s10888-012-9220-9
Moutinho, V., and Madaleno, M. (2021). A two-stage DEA model to evaluate the technical eco-efficiency indicator in the EU countries. Int. J. Environ. Res. Public Health. 18, 3038. doi: 10.3390/ijerph18063038
Ochoa, J. J., Tan, Y., Qian, Q. K., Shen, L., and Moreno, E. L. (2018). Learning from best practices in sustainable urbanization. Habitat Int. 78, 83–95. doi: 10.1016/j.habitatint.2018.05.013
Picazo-Tadeo, A. J., Gómez-Limón, J. A., and Reig-Martínez, E. (2011). Assessing farming eco-efficiency, a data envelopment analysis approach. J. Environ. Manage. 92, 1154–1164. doi: 10.1016/j.jenvman.2010.11.025
Polesie, S., Gillstedt, M., Kittler, H., Lallas, A., Tschandl, P., Zalaudek, I., and Paoli, J. (2020). Attitudes towards artificial intelligence within dermatology, an international online survey. Br. J. Dermatol. 7, 160–161. doi: 10.1111/bjd.18875
Prothero, A. (1999). Eco-efficiency, The Business Link to Sustainable Development, Emerald Group Publishing Limited, Vol. 8, 119–120.
Reith, C., and Guirdy, M. (2003). Eco-efficiency analysis of an agricultural research complex. J. Environ. Manage. 68, 219–229. doi: 10.1016/S0301-4797(02)00161-5
Ren, Y., Bai, Y., Liu, Y., Wang, J., Zhang, F., and Wang, Z. (2022). Conflict or coordination? Analysis of spatio-temporal coupling relationship between urbanization and eco-efficiency, a case study of urban Agglomerations in the Yellow River Basin, China. Land 11, 882. doi: 10.3390/land11060882
Sadorsky, P. (2021). Eco-efficiency for the G18, trends and future outlook. Sustainability 13, 11196. doi: 10.3390/su132011196
Schaltegger, S., and Synnestvedt, T. (2002). The link between 'green' and economic success, environmental management as the crucial trigger between environmental and economic performance. J. Environ. Manage. 65, 339–346. doi: 10.1006/jema.2002.0555
Sheikhipour, B., Javadi, S., and Banihabib, M. E. (2018). A hybrid multiple criteria decision-making model for the sustainable management of aquifers. Environ. Earth Sci. 77, 1–16. doi: 10.1007/s12665-018-7894-4
Thomas, S. (2009). Urbanization as a driver of change. In, Gospodini A, Brebbia CA, editors. Sustainable City V, Urban Regeneration and Sustainability. WIT Transactions On Ecology and the Environment, WIT PRESS/COMPUTATIONAL MECHANICS PUBLICATIONS, Vol. 117, 95–104.
Tone, K., and Tsutsui, M. (2010). Dynamic DEA, a slacks-based measure approach. Omega 38, 145–156. doi: 10.1016/j.omega.2009.07.003
Tone, K., and Tsutsui, M. (2013). Dynamic DEA with network structure, a slacks-based measure approach. Omega 42, 124–131. doi: 10.1016/j.omega.2013.04.002
Van der Bruggen, B., Borghgraef, K., and Vinckier, C. (2010). Causes of water supply problems in urbanised regions in developing countries. Water Resour Manage. 24, 1885–1902. doi: 10.1007/s11269-009-9529-8
Van Kerm, P. (2003). Adaptive kernel density estimation. Stata J. 3, 148–156. doi: 10.1177/1536867X0300300204
Wartenberg, D. (1985). Multivariate spatial correlation, a method for exploratory geographical analysis. Geogr. Anal. 17, 263–283. doi: 10.1111/j.1538-4632.1985.tb00849.x
WBCSD (1996) Eco-Efficient Leadership for Improved Economic and Environmental Performance, Geneva, 3–16.
Wei, Y. D., and Ye, X. (2014). Urbanization, urban land expansion and environmental change in China. Stoch. Environ. Res. Risk Assess. 28, 757–765. doi: 10.1007/s00477-013-0840-9
Weizsäcker, v. E. U., Lovins, A., and Lovins, H. (1997). Factor Four, Doubling Wealth - Halving Resource Use. London, Earthscan.
Wursthorn, S., Poganietz, W. R., and Schebek, L. (2011). Economic-environmental monitoring indicators for European countries, a disaggregated sector-based approach for monitoring eco-efficiency. Ecol. Econ. 70, 487–496. doi: 10.1016/j.ecolecon.2010.09.033
Xu, K., Bossink, B., and Chen, Q. (2020). Efficiency evaluation of regional sustainable innovation in China, a slack-based measure (SBM) model with undesirable outputs. Sustainability 12, 31. doi: 10.3390/su12010031
Yang, J., Guo, A., Li, Y., Zhang, Y., and Li, X. (2019). Simulation of landscape spatial layout evolution in rural-urban fringe areas, a case study of Ganjingzi District. GIScience Remote Sens. 56, 388–405. doi: 10.1080/15481603.2018.1533680
Yao, J., Xu, P., and Huang, Z. (2021). Impact of urbanization on ecological efficiency in China, an empirical analysis based on provincial panel data. Ecol. Indic. 129, 107827. doi: 10.1016/j.ecolind.2021.107827
Yasmeen, H., Tan, Q., Zameer, H., Tan, J., and Nawaz, K. (2020). Exploring the impact of technological innovation, environmental regulations and urbanization on ecological efficiency of China in the context of COP21. J. Environ. Manage. 274, 111210. doi: 10.1016/j.jenvman.2020.111210
Yu, W., Yang, J., Sun, D., Yu, H., Yao, Y., Xiao, X., et al. (2022). Spatial-temporal patterns of network structure of human settlements competitiveness in resource-based urban agglomerations. Front. Environ. Sci. 10, 893876. doi: 10.3389/fenvs.2022.893876
Yue, L., Xue, D., Draz, M. U., Ahmad, F., Li, J., Shahzad, F., and Ali, S. (2020). The double-edged sword of urbanization and its nexus with eco-efficiency in China. Int. J. Environ. Res. Public Health 17, 446. doi: 10.3390/ijerph17020446
Zhang, H., Chen, M., and Liang, C. (2022). Urbanization of county in China, spatial patterns and influencing factors. J. Geograph. Sci. 32, 1241–1260. doi: 10.1007/s11442-022-1995-4
Zhao, H., Liu, Y., and Lindley, S. (2020). Change, mechanism, and response of pollutant discharge pattern resulting from manufacturing industrial transfer, a case study of the Pan-Yangtze River Delta, China. J. Clean. Prod. 224, 118587. doi: 10.1016/j.jclepro.2019.118587
Keywords: interaction and synergy, spatial-temporal evolution, urbanization, Liaoning Province in China, eco-efficiency
Citation: Gao Y, Guo C and Wei Y (2022) Study on the dynamic evolution and synergistic relationship between urbanization and eco-efficiency through the selection of 76 agricultural counties and districts in Liaoning province as research units. Front. Ecol. Evol. 10:975426. doi: 10.3389/fevo.2022.975426
Received: 22 June 2022; Accepted: 25 August 2022;
Published: 14 September 2022.
Edited by:
Bing Xue, Institute of Applied Ecology (CAS), ChinaReviewed by:
Bo Fu, Chinese Academy of Sciences (CAS), ChinaCopyright © 2022 Gao, Guo and Wei. This is an open-access article distributed under the terms of the Creative Commons Attribution License (CC BY). The use, distribution or reproduction in other forums is permitted, provided the original author(s) and the copyright owner(s) are credited and that the original publication in this journal is cited, in accordance with accepted academic practice. No use, distribution or reproduction is permitted which does not comply with these terms.
*Correspondence: Chunyao Guo, MjAwMTQyNF9Ac3R1Lm5ldS5lZHUuY24=
Disclaimer: All claims expressed in this article are solely those of the authors and do not necessarily represent those of their affiliated organizations, or those of the publisher, the editors and the reviewers. Any product that may be evaluated in this article or claim that may be made by its manufacturer is not guaranteed or endorsed by the publisher.
Research integrity at Frontiers
Learn more about the work of our research integrity team to safeguard the quality of each article we publish.