 JiaXuan Li
 Peng Zhang
- State Key Laboratory of Biocontrol, School of Life Sciences, Sun Yat-sen University, Guangzhou, China
Resolving intractable phylogenetic relationships often requires simultaneously analyzing a large number of coding and non-coding orthologous loci. To gather both coding and non-coding data, traditional sequence capture methods require custom-designed commercial probes. Here, we present a cost-effective sequence capture method based on homemade probes, to capture thousands of coding and non-coding orthologous loci simultaneously, suitable for all organisms. This approach, called “FLc-Capture,” synthesizes biotinylated full-length cDNAs from mRNA as capture probes, eliminates the need for costly commercial probe design and synthesis. To demonstrate the utility of FLc-Capture, we prepared full-length cDNA probes from mRNA extracted from a common colubrid snake. We performed capture experiments with these homemade cDNA probes and successfully obtained thousands of coding and non-coding genomic loci from 24 Colubridae species and 12 distantly related snake species of other families. The average capture specificity of FLc-Capture across all tested snake species is 35%, similar to the previously published EecSeq method. We constructed two phylogenomic data sets, one including 1,075 coding loci (∼817,000 bp) and the other including 1,948 non-coding loci (∼1,114,000 bp), to study the phylogeny of Colubridae. Both data sets yielded highly similar and well-resolved trees, with 85% of nodes having >95% bootstrap support. Our experimental tests show that FLc-Capture is a flexible, fast, and cost-effective sequence capture approach for simultaneously gathering coding and non-coding phylogenomic data sets to study intractable phylogenetic questions. We hope that this method will serve as a new data collection tool for evolutionary biologists working in the era of phylogenomics.
Introduction
Phylogenomics (using genome-scale data sets for phylogenetic inference) has greatly improved our ability to resolve difficult phylogenetic questions (Mclean et al., 2019; Cai et al., 2021). This strategy is promising and has been variously applied to study the phylogeny of a number of recalcitrant clades across the Tree of Life, such as mammals (e.g., Song et al., 2012), fishes (e.g., Hughes et al., 2018) and land plants (e.g., Wickett et al., 2014). Nevertheless, some recent studies have also pointed out an important issue in phylogenomic practice that different types of phylogenomic data (coding and non-coding) will influence phylogenetic inference and show different performance for resolving difficult phylogenetic questions (Jarvis et al., 2014; Chen et al., 2017; Reddy et al., 2017; Alda et al., 2021). Therefore, a single large data set may not always be enough to resolve difficult phylogenetic questions. It will be very helpful to analyze both coding and non-coding phylogenomic data sets simultaneously when studying intractable phylogenetic problems.
Whole-genome shotgun (WGS) sequencing is the simplest way to obtain coding and non-coding phylogenomic data simultaneously, but it is still cost-prohibitive to sequence dozens or hundreds of full genomes despite the rapid progress of sequencing technology (Breinholt et al., 2018; Olofsson et al., 2019). In fact, because phylogenomic studies do not need fully-assembled genomes but only phylogenetically informative loci, low-coverage WGS sequencing is generally sufficient to meet the basic requirements for phylogenomic studies (Allen et al., 2017; Zhang F. et al., 2019). Until now, there are three main approaches for extracting phylogenetically informative loci from low-coverage WGS data. The first approach, called “automated Target Restricted Assembly Method (aTRAM),” assembles WGS data into predefined targeted regions by selecting reads with iterative BLAST searches (Allen et al., 2017). This method has been demonstrated to be able to extract over a thousand loci from 5–10 × coverage WGS data of sucking lice (genome size 100–150 M). However, this method is more suitable for species with small genomes, because iterative BLAST searches will be too computationally intensive with large data. The second approach directly extracts phylogenomic data (coding and non-coding) from low-coverage WGS data by assembling entire genomes (Hughes and Teeling, 2018; Allio et al., 2019; Zhang F. et al., 2019). Zhang F. et al. (2019) showed that, for species with small genomes (0.1–1 G), 10–20 × coverage WGS data are sufficient to extract hundreds to thousands of phylogenetic loci. However, this method is also not suitable for organisms with large genomes (>1 G) because de novo genome assembly is highly difficult under this situation. The third approach does not extract phylogenomic loci by assembling but extracts single nucleotide polymorphisms (SNPs) from low-coverage WGS data by mapping reads to reference genomes. Olofsson et al. (2019) used this strategy to study the phylogeny of the olives that have relatively large genomes (∼1.5 G). The shortcoming of this method is that it requires annotated reference genomes and tends to perform relatively poorly across highly divergent lineages. Currently, although low-coverage WGS sequencing has shown great promise in constructing phylogenomic data sets, it is still somewhat challenging to apply it in organisms with large genomes.
Two sequencing methods perform better than genome shotgun sequencing in generating phylogenomic data from species with large genome: transcriptome sequencing (Morozova et al., 2009; Wang et al., 2009) and sequence capture (Gnirke et al., 2009; Lemmon and Lemmon, 2013; Glenn and Faircloth, 2016; Jones and Good, 2016; Andermann et al., 2020). The target of transcriptome sequencing is the expressed mRNAs whose size does not vary significantly, no matter how large the genome is. Because mRNAs contain both open reading frames (ORFs) and untranslated regions (3′ UTR and 5′ UTR), transcriptome sequencing can enable researchers to obtain a large amount of coding and non-coding sequences simultaneously (Oakley et al., 2012; Misof et al., 2014; Garrison et al., 2016). However, transcriptome sequencing requires fresh or properly stored tissues to provide high-quality RNA, which often limits the number of taxa included in such phylogenomic studies (Lemmon and Lemmon, 2013; McCormack et al., 2013). Sequence capture uses biotinylated probes to selectively enrich the target regions from the genome of interest. It allows researchers to attain higher sequencing depth over a predefined subset of the genome under a given cost, particularly helpful to species with large genomes (McCartney-Melstad et al., 2016). An advantage of sequence capture is that it does not require high-quality DNA samples and can handle highly degraded DNAs extracted from old museum specimens (e.g., Guschanski et al., 2013; Blaimer et al., 2016). This property can greatly increase the sampling number of taxa in a phylogenomic study. Moreover, sequence capture is very flexible. Different capture methods have been developed and used for various purposes, such as ultra-conserved element (UCE) sequencing (Faircloth et al., 2012) to collect non-coding sequences, anchored hybrid enrichment (AHE) (Lemmon et al., 2012) and exon capture (Albert et al., 2007; Ng et al., 2009; Bi et al., 2012) to collect coding sequences, and a combination of AHE and UCE to collect coding and non-coding sequences simultaneously (Singhal et al., 2017). However, most current sequence capture methods require the researcher to have prior genomic information for probe design and then to synthesize the probes through commercial companies. For non-model species, probe design is often difficult due to a lack of genome information. Also, the cost of using commercial probes will be high when a research project has hundreds of samples or more, probably reaching several thousands of dollars.
Recently, Puritz and Lotterhos (2018) have demonstrated that cDNA fragments can be used as capture probes to capture coding sequences from genomes. Using cDNAs from reverse transcription of mRNAs as probes to capture genome sequences can avoid using commercial probes, thus greatly reducing the cost of experiments. The method of Puritz and Lotterhos (EecSeq) uses randomly fragmented cDNAs as probes, mainly focuses on capturing coding regions. Their experiment design and bioinformatic pipeline basically revolve around how to obtain exonic SNPs. In fact, full-length cDNA sequences consist of coding ORFs and non-coding UTRs. If both ORFs and UTRs are considered in the cDNA probe preparation, genomic DNA of both coding and non-coding regions can be captured and sequenced simultaneously. The direct use of full-length cDNAs as probes for sequence capture can produce transcriptome-level data and skips the step of probe design, making it particularly suitable for non-model organisms lacking genomic information. Moreover, it allows investigators to simultaneously obtain coding and non-coding phylogenomic data, and thus will be helpful to study difficult phylogenetic questions.
With over 2,000 species, Colubridae is the largest snake family and includes about two-thirds of all living snake species. It is a rapid radiation lineage and has a relatively large genome (mean genome size: ∼2 G1). The higher-level phylogeny of Colubridae (mainly relationships among subfamilies) has historically proven difficult to resolve. In recent years, some research teams have made considerable efforts to resolve deep interrelationships of colubrids and made significant progress (e.g., Pyron et al., 2011, 2013, 2014; Figueroa et al., 2016; Zheng and Wiens, 2016; Zaher et al., 2019; Burbrink et al., 2020; Li et al., 2020). Although these studies have differed substantially in the sampling of genes and taxa, it seems to be clear that the use of more data tends to improve the resolution of the resulting phylogeny and provide strong support for most of nodes in Colubridae phylogeny within subfamilies. However, for a few nodes, even using about four hundred of AHE loci (mostly coding), phylogenomic inference still failed to provide strong support for them (Burbrink et al., 2020), suggesting that only using a single type of phylogenomic data set may not be sufficient to resolve the question. Until now, the higher-level relationships of Colubridae, particularly the interrelationships among different subfamilies, is still contentious. This question provides a good studying case for demonstrating the utility of the FLc-Capture method for generating genome-scale coding and non-coding data sets to resolve difficult phylogenetic questions.
In this study, we present a modified sequence capture method based on homemade cDNA probes, called “full-length cDNA capture sequencing” (FLc-Capture). It is a universal, flexible, and cost-effective sequence capture method that works for all organism groups. The most distinctive feature of this method is the use of the SMART technology (Clontech Inc.) to synthesize full-length cDNAs and then create biotinylated probes from cDNAs. The specially designed bioinformatics analysis scheme enables users to extract a large number of genomic loci (both coding and non-coding) from the capture data without any genome knowledge of the taxa being investigated. To demonstrate the utility of the FLc-Capture method, we used it to study the phylogeny of the family Colubridae (Serpentes: Caenophidia), a rapid radiation lineage with large genomes (∼2 G). We successfully obtained hundreds to thousands of coding and non-coding genomic loci from dozens of colubrid and distantly related outgroup snake species from the FLc-Capture data. These coding and non-coding phylogenomic data were able to generate a robust phylogeny of Colubridae and settle the long-debated relationships among subfamilies (e.g., Pyron et al., 2014; Zaher et al., 2019; Burbrink et al., 2020; Li et al., 2020). We hope the method presented in this study can provide a new high-throughput sequencing approach for studies seeking to resolve difficult phylogenetic questions.
Materials and methods
Experimental overview
Full-length cDNA-Capture sequencing is designed with two specific goals: (a) to eliminate the need for expensive capture probe synthesis and (b) to obtain genome-scale data of both coding and non-coding regions simultaneously. To this end, researchers should choose one common species readily available from their taxonomic group of interest to extract high-quality RNA and synthesize full-length cDNAs. These full-length cDNAs are then amplified by biotinylated primers to generate homemade probes for subsequent sequence capture experiments. The steps for probe preparation and sequence capture are visualized in Figure 1 and detail protocol for FLc-Capture sequencing is given in Supplementary Data Sheet 1.
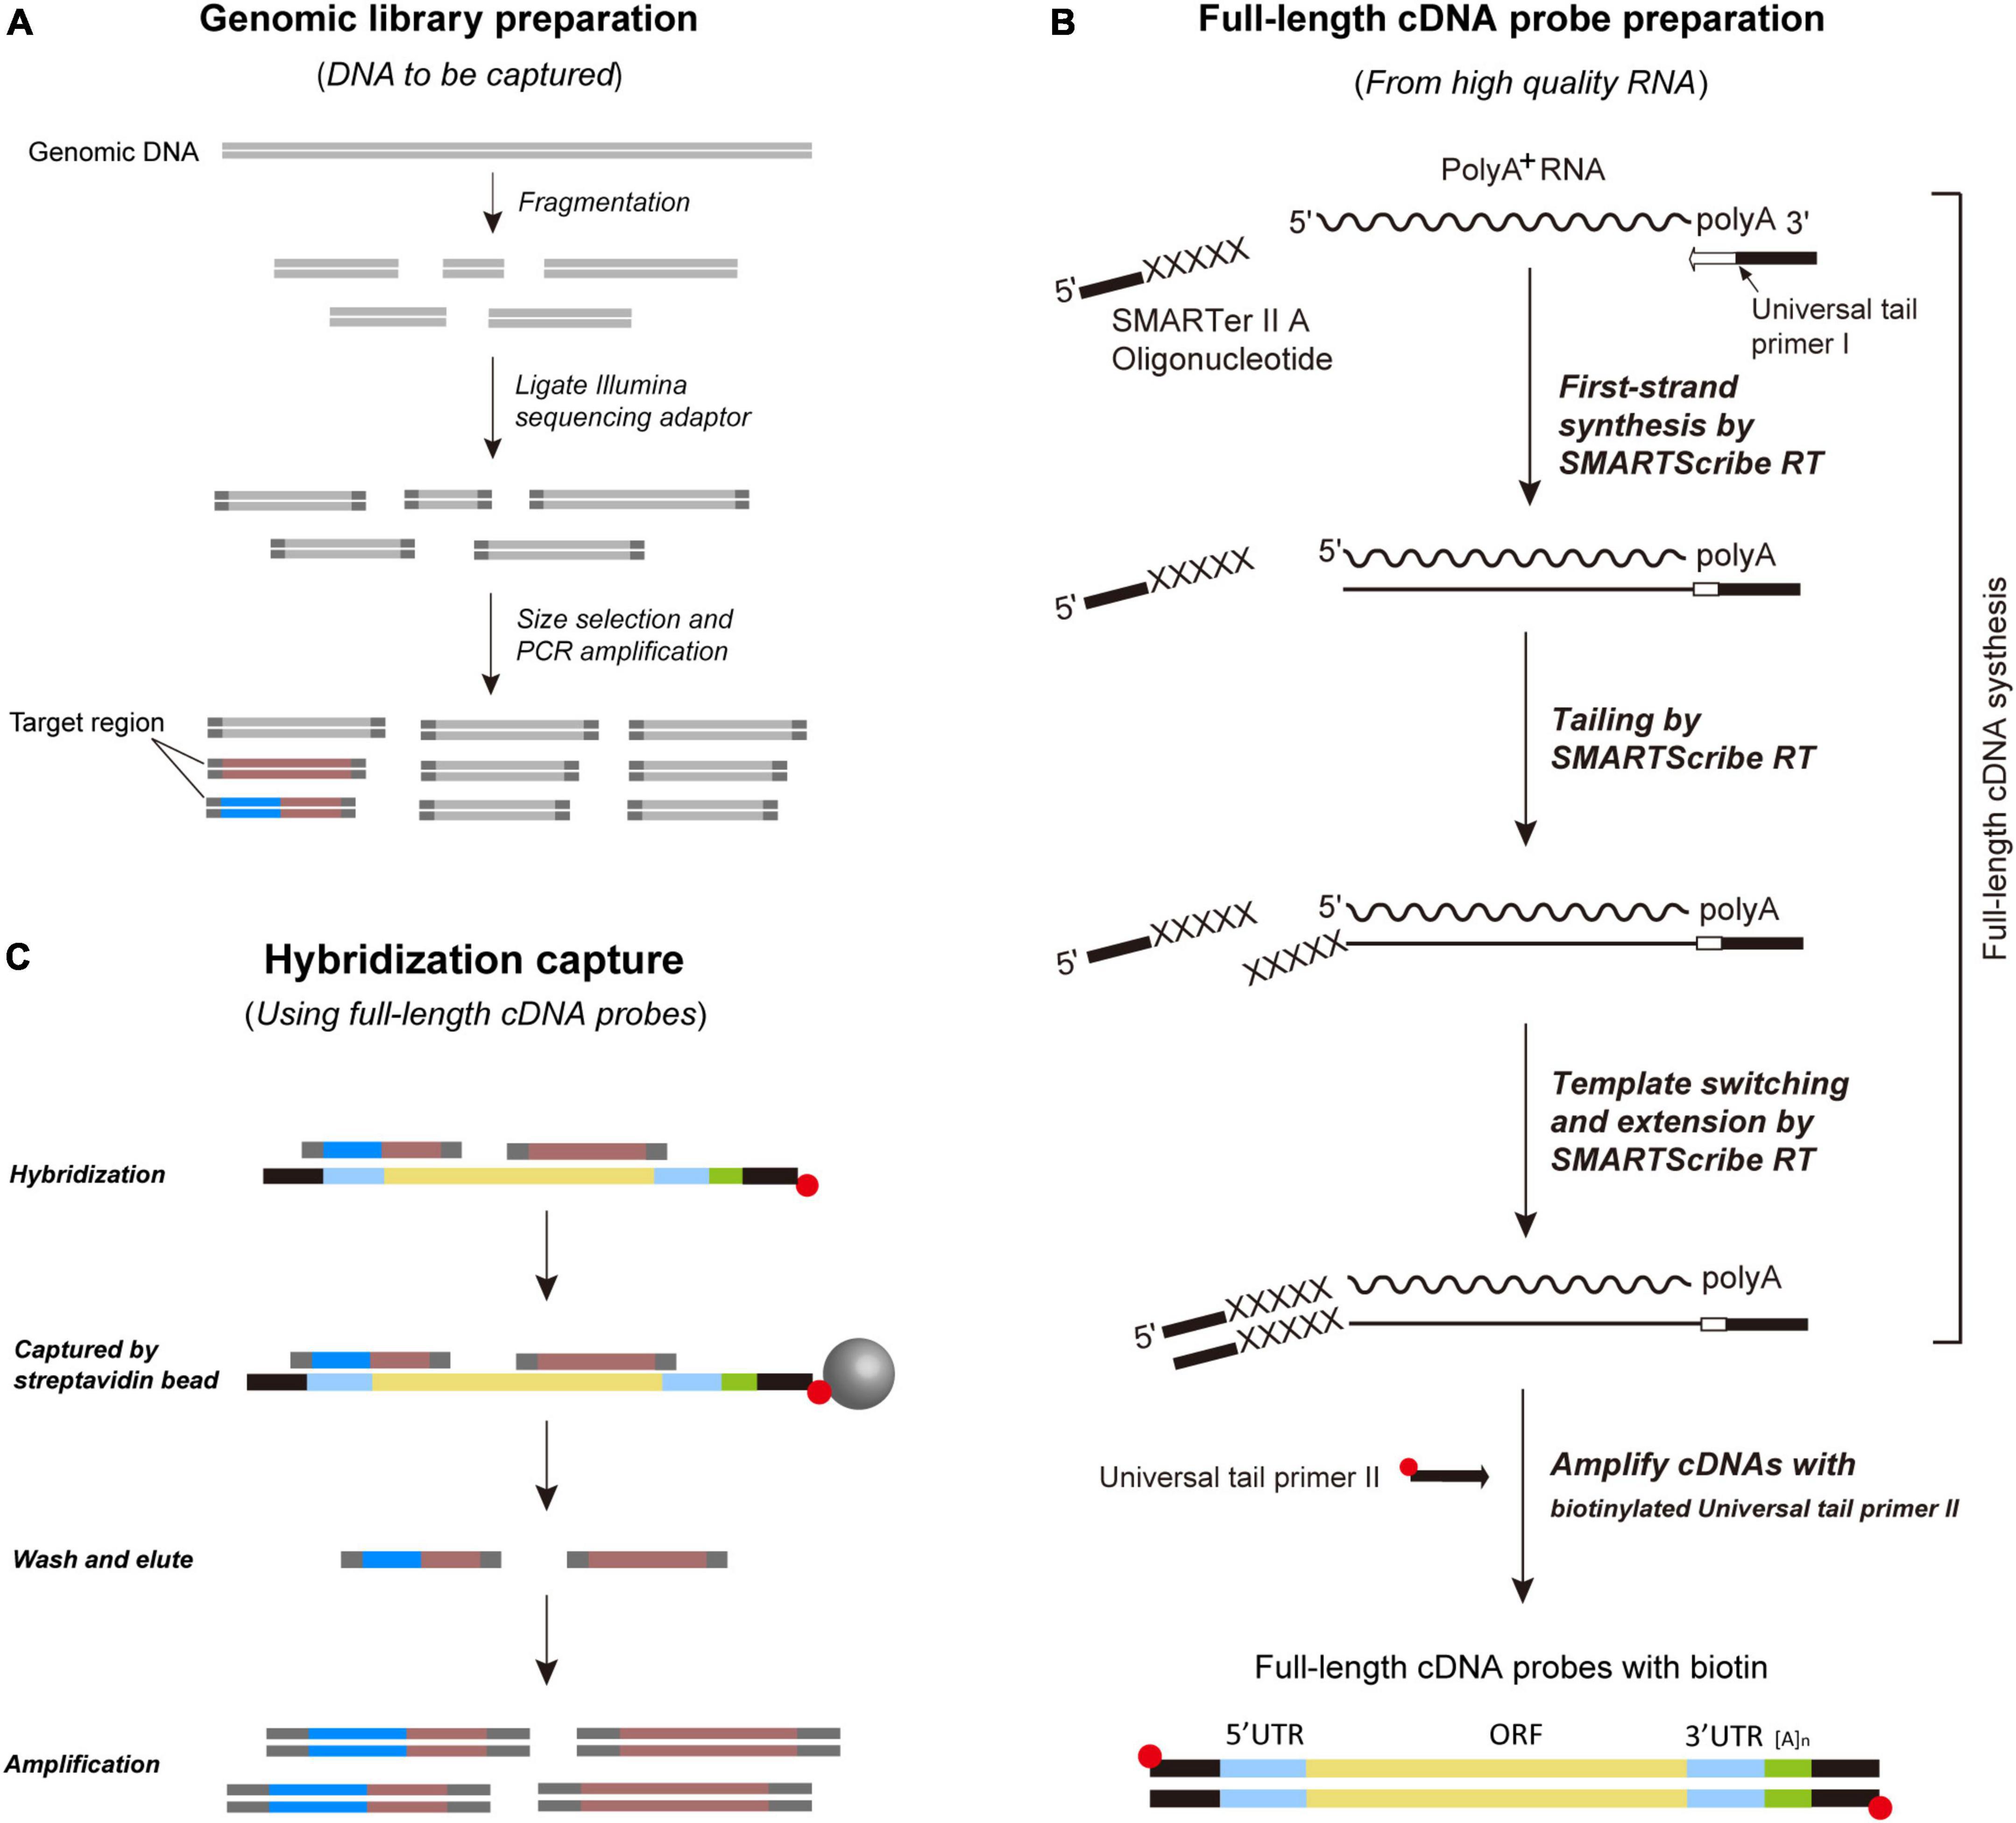
Figure 1. Schematic overview of the FLc-Capture sequencing method. (A) Prepare shotgun genomic DNA library. (B) Prepare full-length cDNA probes from high-quality RNA using SMARTer™ PCR cDNA Synthesis Kit (Clontech Inc.). The full-length cDNA probes contain both UTR and ORF regions. (C) Hybridize the probes to the shotgun genomic library. Both coding and non-coding loci bind to the cDNA probes.
Taxon sampling, DNA extraction, and library preparation
Based on the latest phylogeny of Colubridae (Li et al., 2020), we sampled 25 colubrid species (including one probe species, see below) representing 25 genera, seven subfamilies (Dipsadinae, Pseudoxenodontinae, Natricinae, Sibynophiinae, Calamariinae, Ahaetuliinae, Colubrinae) and 12 distantly related outgroup snake species from five families (Xenodermatidae, Pareatidae, Viperidae, Elapidae, Homalopsidae). The detailed information of these samples, such as taxonomy, collection locality, and voucher, is given in Table 1. Total genomic DNA was extracted from ethanol-preserved liver or muscle tissue of each sample using a TIANamp Genomic DNA Kit (Tiangen, Beijing). All DNA extracts were measured using an ND-2000 spectrophotometer and diluted to a concentration of 50 ng/μl with 1× TE. For each sample, 250 ng of its genomic DNA was randomly fragmented to 200–400 bp using NEBNext dsDNA Fragmentase (NEB). The fragmented DNA was purified with AMpure XP beads (Beckman Coulter). The purified DNA was used for Illumina library preparation with NEBNext Ultra DNA Library Prep Kit (New England Biolabs) (Figure 1A). Each sample was labeled with a unique 8-bp index sequence. Three or four libraries were mixed into a pooled library at equal concentrations for subsequent hybridization capture.
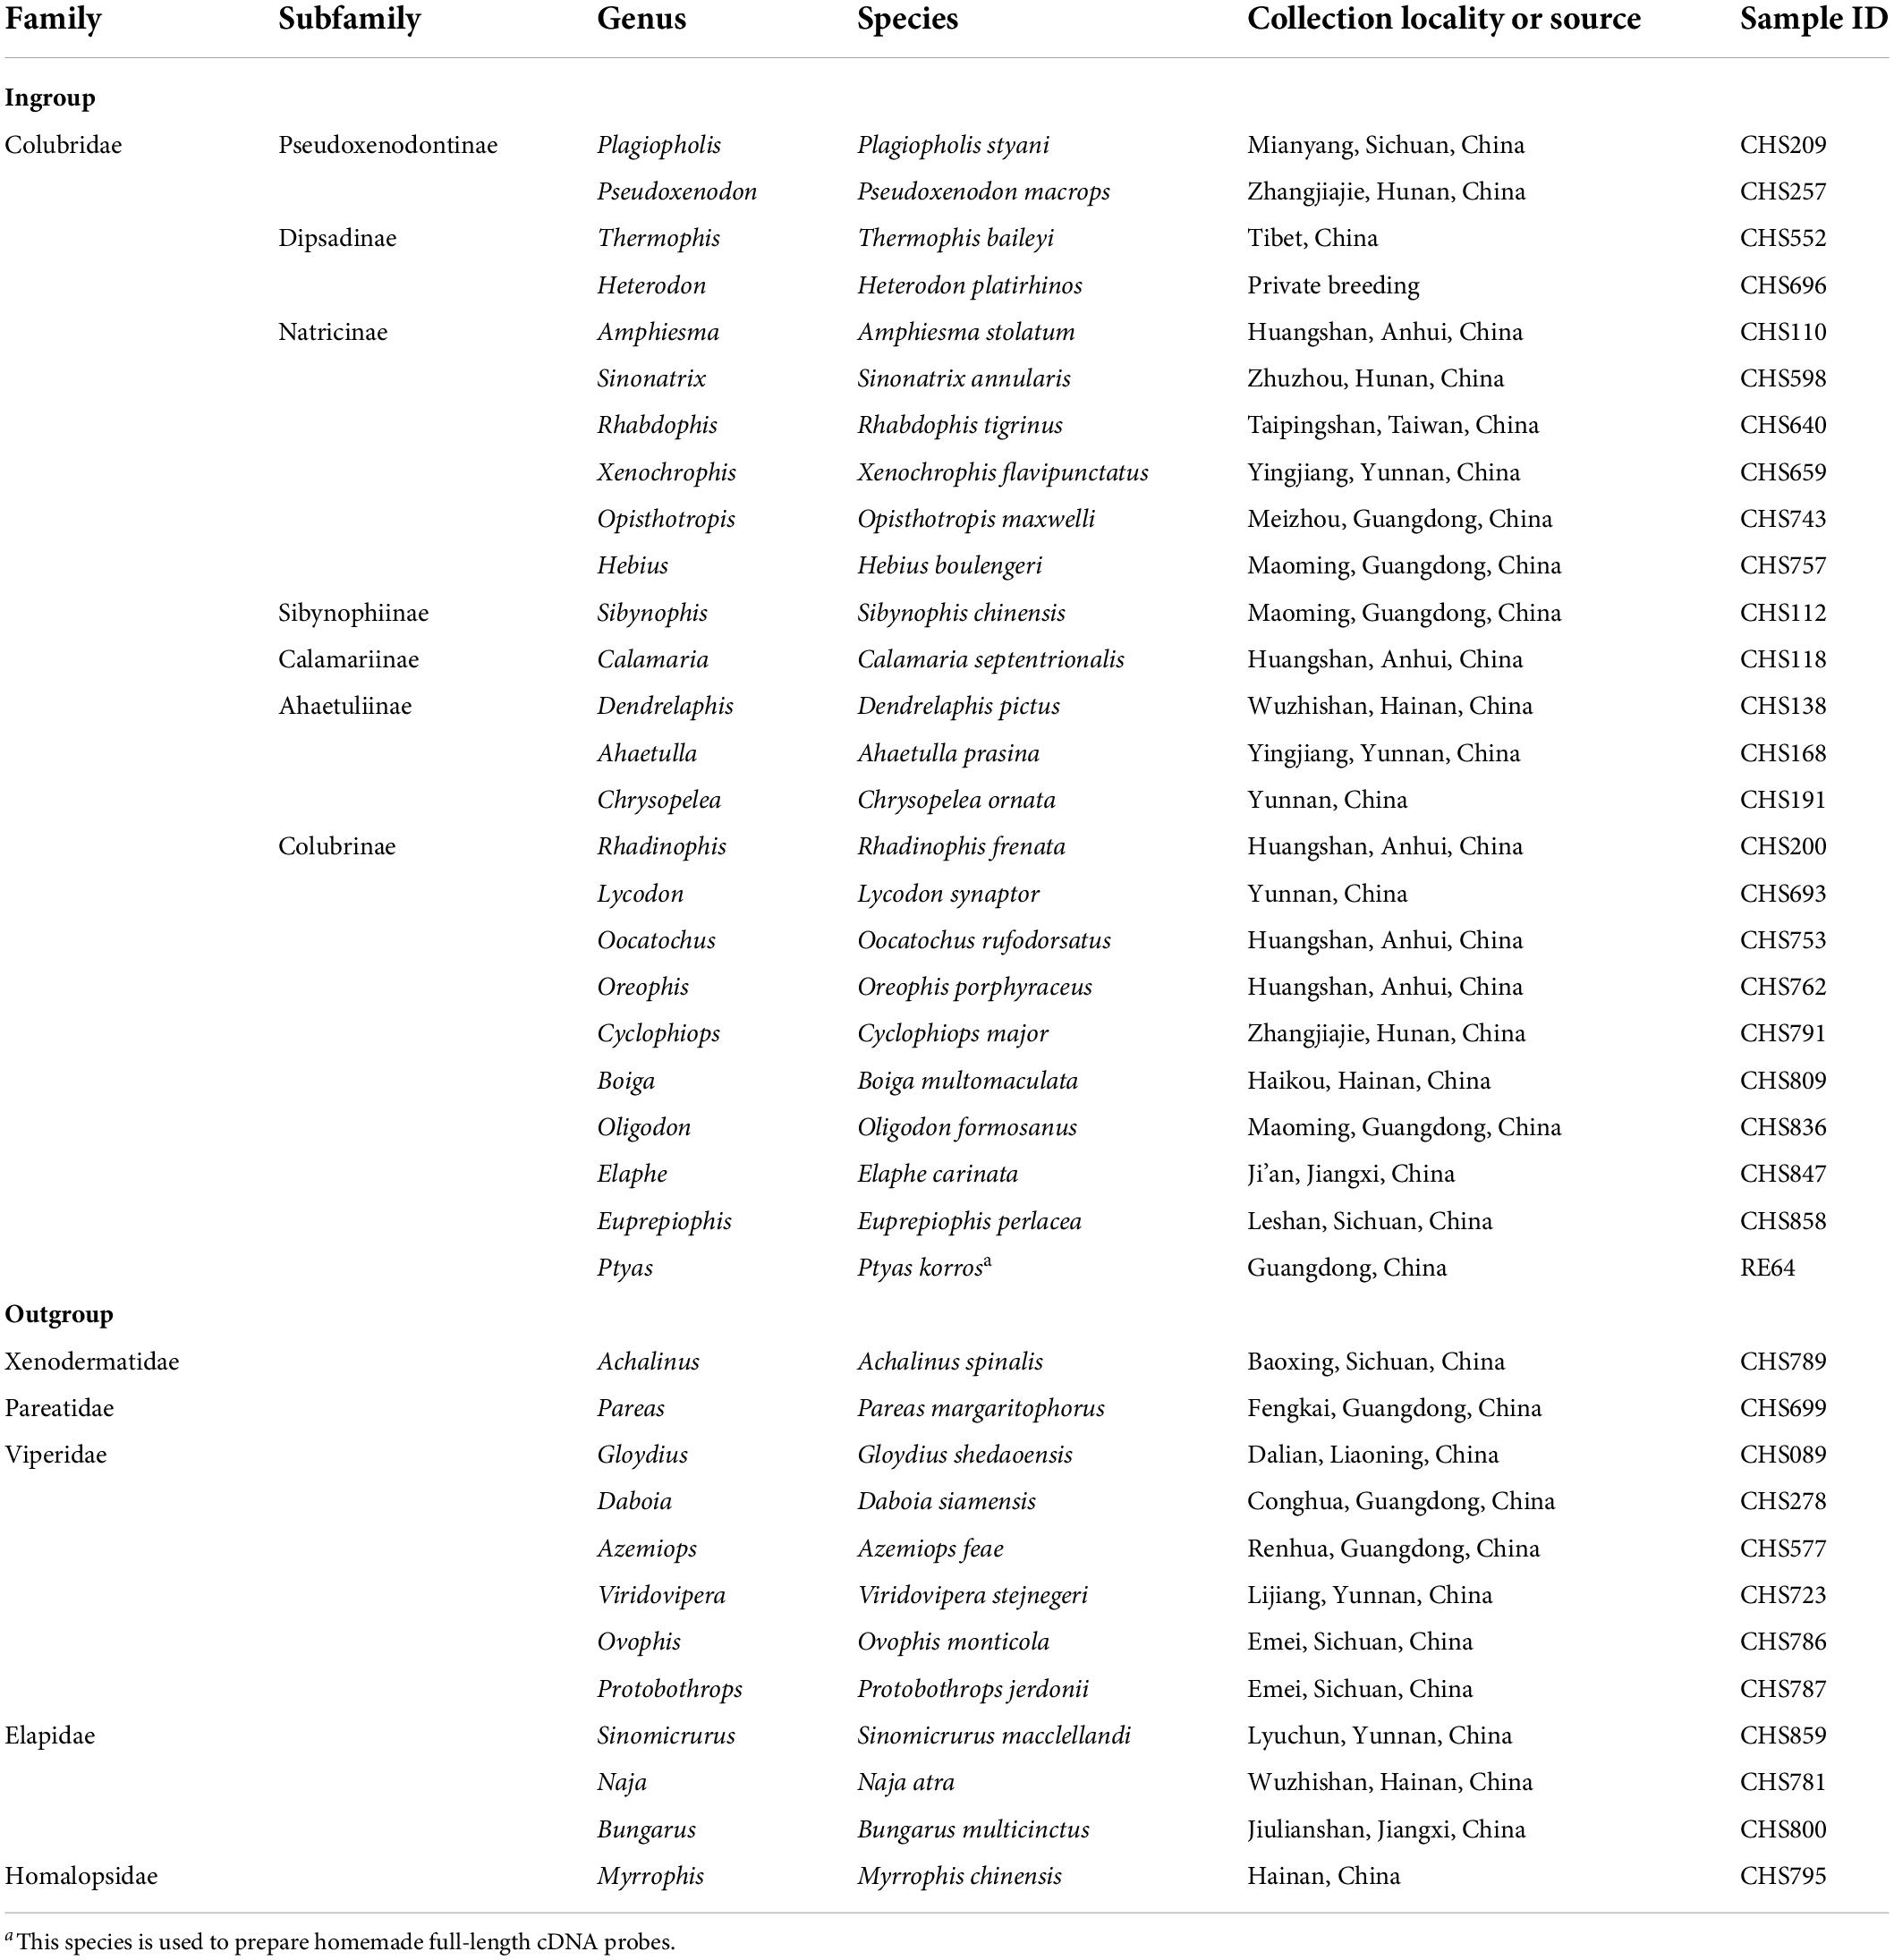
Table 1. List of all species used in this study.
Full-length cDNA probe preparation
The workflow of producing full-length cDNA probes is illustrated in Figure 1B. We extracted high-quality RNA from fresh liver tissue of Ptyas korros, a common colubrid species, using the RNA prep Pure Tissue Kit (Tiangen, Beijing). The quality of total RNA was assayed using an Agilent Bioanalyzer 2100 and the RNA integrity number (RIN) was greater than seven. The synthesis of full-length cDNAs was performed using SMARTer™ PCR cDNA Synthesis Kit (Clontech Inc.) based on the manufacturer’s protocols. Briefly, 4.5 μl of cDNA synthesis mixture containing 1 μg total RNA and 2.67 μM universal tail primer I (included in the kit) was incubated for 3 min at 72°C and 2 min at 42°C. The volume was then adjusted to 10 μl with the following reagents: 1 × First-Strand Buffer, 2.5 mM DTT, 1 mM dNTP Mix, 1.2 μM SMARTer II A Oligonucleotide (included in the kit), 0.25 μl RNase Inhibitor and 10 U SMARTScribe Reverse Transcriptase. Tailing, template switching, and extension were carried out for 90 min at 42°C. The reaction was terminated for 10 min at 72°C. The first-strand synthesis product was diluted with 40 μl 1 × TE, and used as templates for cDNA amplification. The SMART technology ensures that the synthesized cDNAs are in full-length, and both ends of the synthesized cDNAs contain universal tail sequences.
The synthesized first-strand cDNAs were amplified with a 5′-biotinylated primer (universal tail primer II; see Supplementary Data Sheet 1) to generate full-length cDNA probes (Figure 1B). The PCR reaction mixture contained 1.25 U HiFi Taq DNA Polymerase (TransGen, Beijing), 1 × HiFi PCR buffer, 0.2 mM dNTPs, 0.24 μM of universal tail primer II and 1 μl diluted first-strand cDNA synthesis product in a total volume of 100 μl. The thermal cycling program is as follows: an initial denaturation for 1 min at 95°C followed by 19 cycles of 15 s at 95°C, 30 s at 65°C, 6 min at 68°C. The amplification product was purified by AMpure XP beads and checked on a 1.2% TAE agarose gel. After that, the purified amplification product (full-length cDNA probes) was measured using an ND-2000 spectrophotometer and diluted to a concentration of 50 ng/μl with 1 × TE. We did not normalize our full-length cDNA probes to decrease the abundance of the highly expressed cDNAs, but used them directly for subsequent capture experiments.
Hybridization capture and sequencing
For each capture reaction, 500 ng of mixed DNA libraries and 200 ng of cDNA probes were used. In order to increase the capture efficiency, we used a touch-down hybridization program: after denaturation at 94°C for 5 min, the hybridization started from 65°C decreased by 5°C every 6 h and ended at 45°C, for a total duration of 30 h. The hybridized DNA fragments were captured with streptavidin magnetic beads (Dynabeads MyOne bead, Life Technologies). The beads were washed to remove unhybridized DNAs and eluted with 30 μl of 1 × TE to release the captured DNA fragments. The captured libraries were amplified with Illumina P5 and P7 universal primers. Finally, the captured libraries of different capture experiments were pooled at equal concentrations and sequenced on three lanes of Illumina HiSeq X-ten with paired-end 150-bp mode (∼387 G of total data). The workflow of the hybridization capture experiment is shown in Figure 1C.
Bioinformatic workflow
Building up reference open reading frame and UTR sets
To provide reference sequence sets for subsequently captured data analysis, the cDNA probes are sequenced. Briefly, 100 ng of the cDNA probes were used to construct a sequencing library following the same procedure as genomic library preparation. The probe library was sequenced on an Illumina HiSeq X-ten sequencer using paired-end 150-bp mode. The raw reads were first filtered to remove adapter sequences and low-quality nucleotides by using Trimmomatic version 0.36 (Bolger et al., 2014) and FastQC.2 Clean reads were assembled into transcripts using TRINITY r20140717 with default parameters (Grabherr et al., 2011). The obtained transcripts were filtered with CD-HIT-EST version 4.6.5 (Fu et al., 2012) to reduce redundancy (95% similarity cutoff). The sequencing depths for filtered transcripts were calculated by SAMtools version 1.4.1 (Li et al., 2009). Only transcripts with an average sequencing depth ≥ 5×, length ≥ 200 bp were retained. TransDecoder, a program in the TRINITY package, was used to determine the open reading frame (ORF) for each transcript. Based on the position of the ORF, each transcript can be annotated to 5’ UTR (untranslated region), coding region, and 3’ UTR. The translated protein sequences of the predicted ORFs were searched by BLASTP [NCBI BLAST + version 2.6.0, Boratyn et al. (2013)] against the human proteomes with an e-value threshold of 1E-10. Only transcripts that have BLASTP hits were retained to focus on known vertebrate transcripts. Finally, all ORFs of length > 300 bp and UTRs of length > 100 bp were extracted using a custom Python script to build two reference sets (ORF and UTR) for the subsequent captured data analysis (Figure 2A).
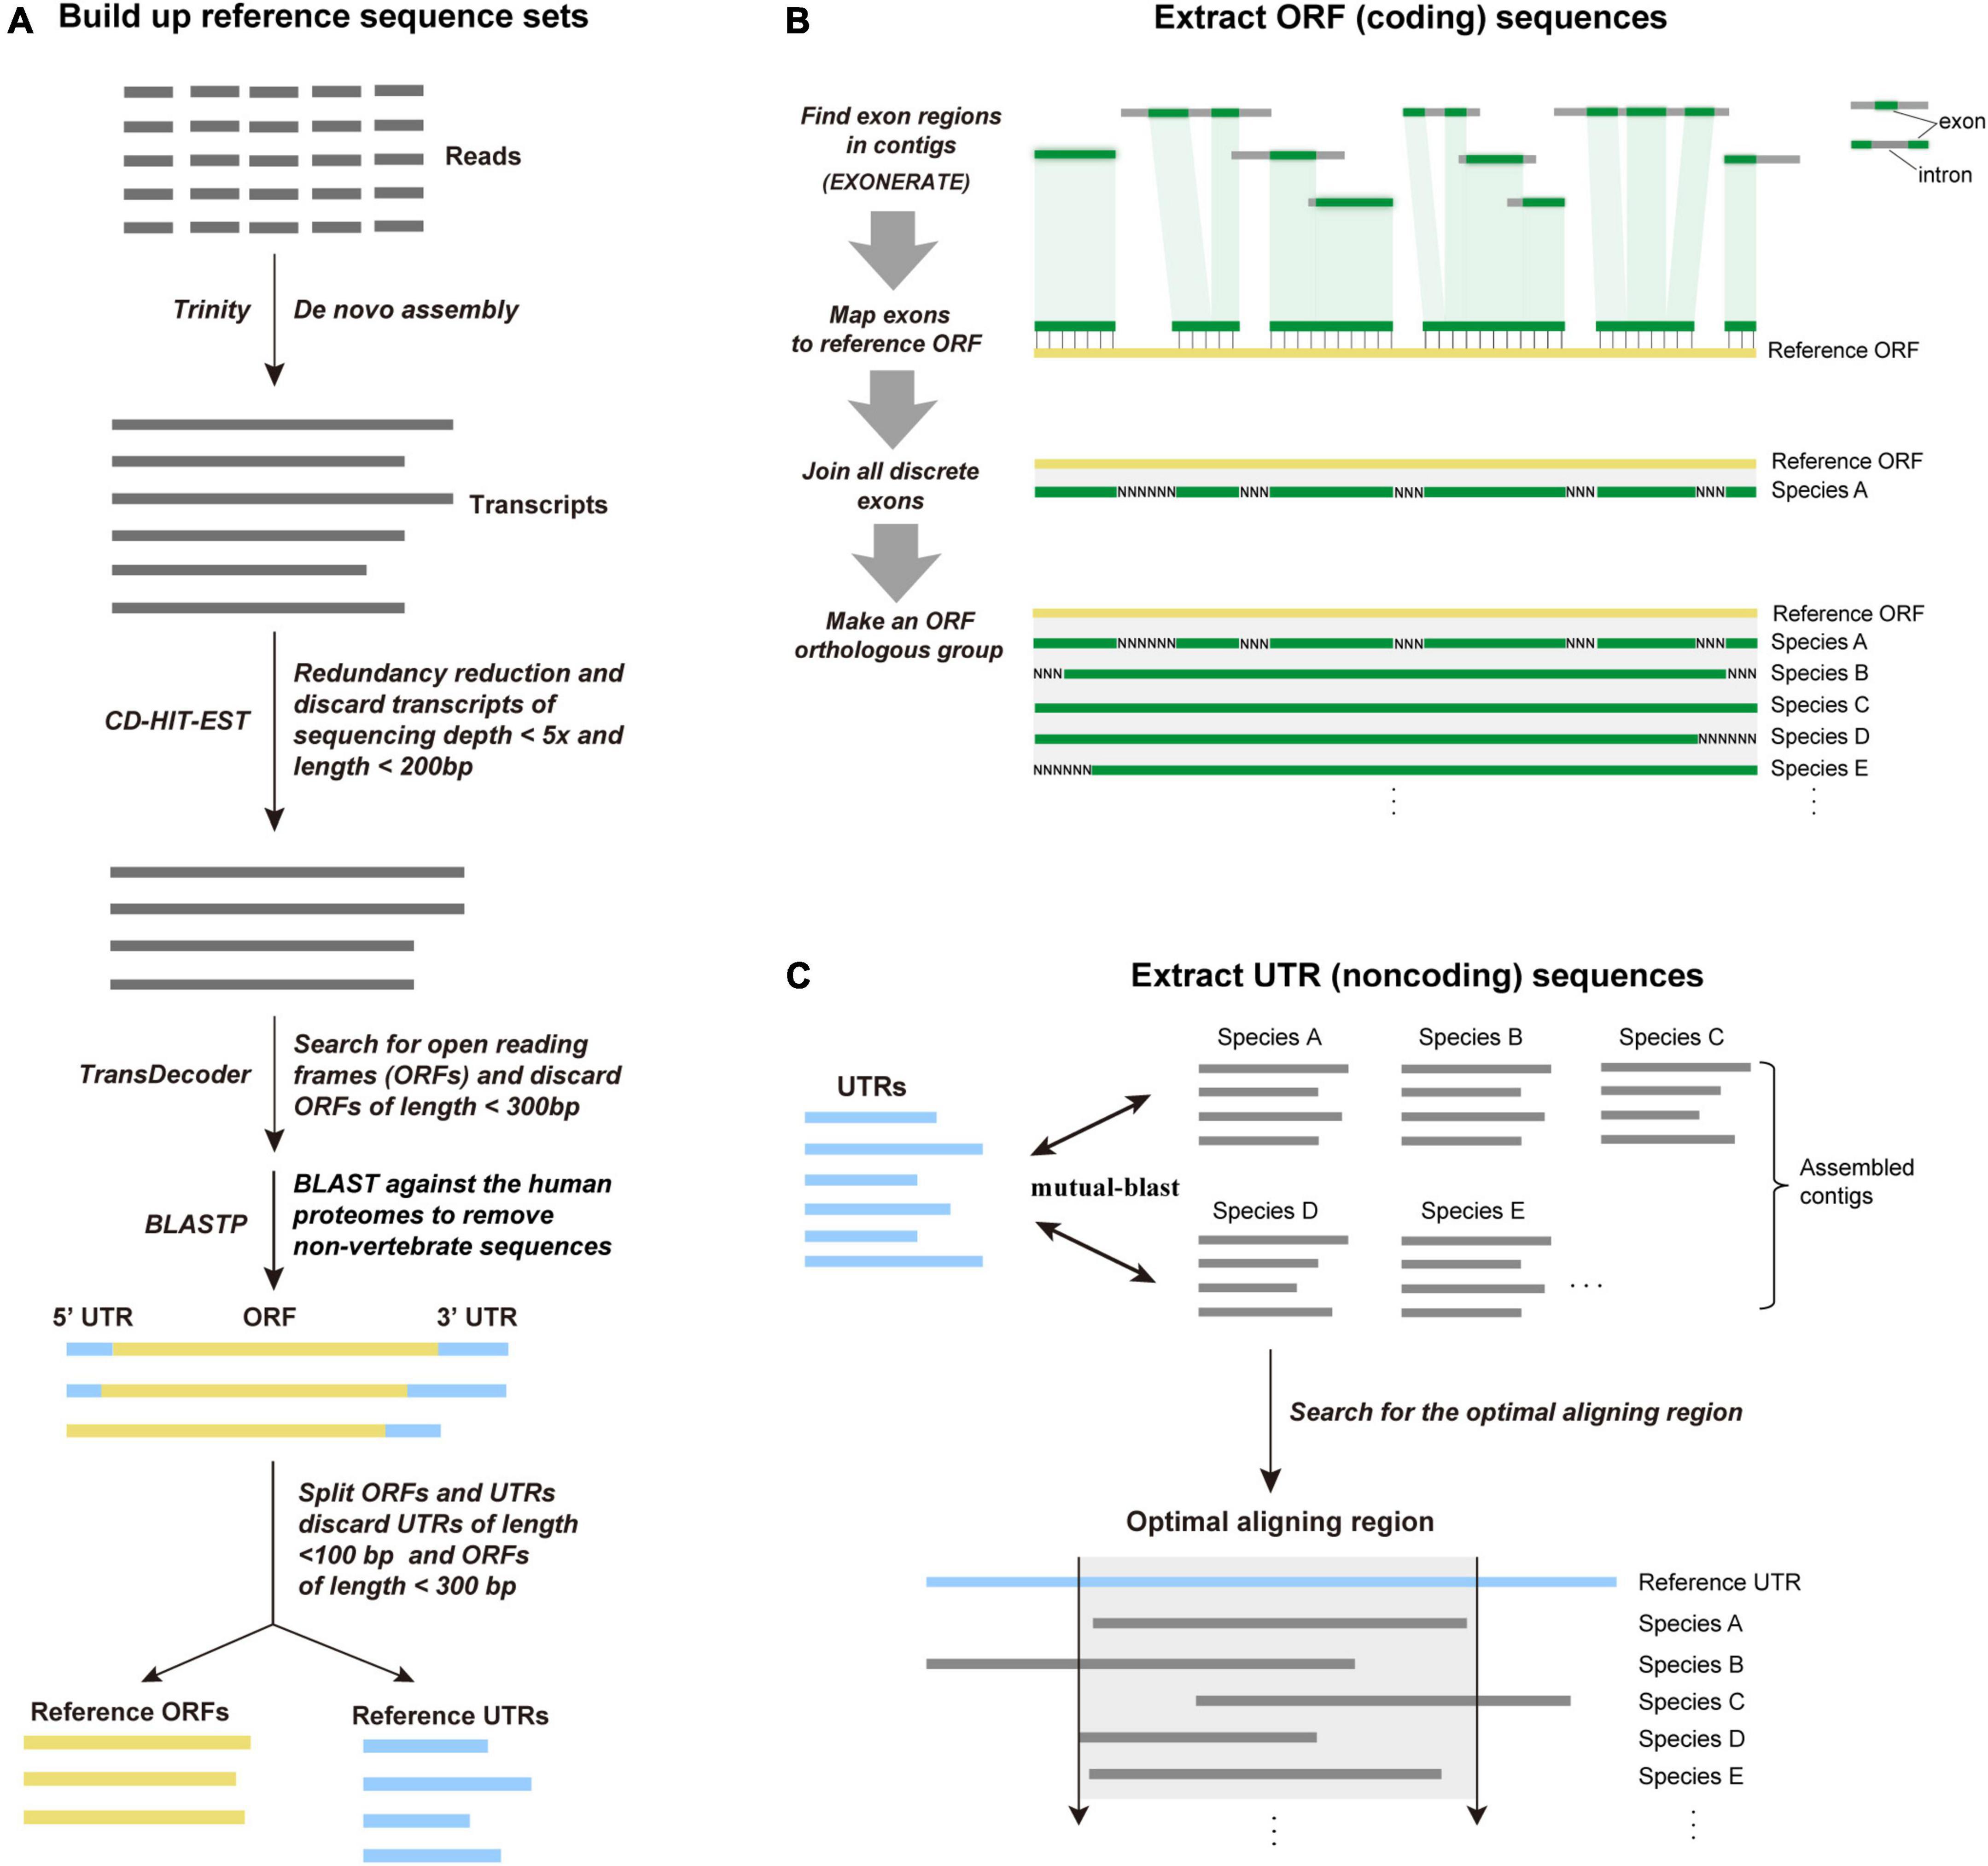
Figure 2. Details of the FLc-Capture data processing. (A) Creating reference ORF and UTR sets by sequencing the cDNA probes. (B) Extracting ORF (coding) sequences. First, FLc-Capture assembles reads into contigs, and identifies exons from contigs using EXONERATE based on the reference ORF sets. The identified exons are then mapped onto the reference ORF sequences to make the orthologous ORF sequences, based on the position information resulted from the EXONERATE searches. (C) Extracting UTR (non-coding) sequences. Based on the reference UTRs, FLc-Capture uses a mutual best-hit (MBH) strategy to identify orthologous UTR sequences and truncate the sequences according to the optimal aligning region.
Sequence capture data analysis
Sequence capture reads were sorted into each species by the 8-bp species index. The raw reads of each species were filtered to remove adapter sequences and low-quality nucleotides. To accelerate assembly and save computing resources, we down-sampled reads over high-depth areas at an average depth of 20× by normalization using BBNORM.SH [BBTools, Bushnell (2014)]. The normalized read data were then de novo assembled using the SPAdes version 3.8.1 genome assembler (Bankevich et al., 2012), using an auto K-mer mode (–cov-cutoff auto). Only contigs longer than 200 bp were retained. The retained contigs were further filtered with CD-HIT-EST to reduce redundancy (95% similarity cutoff). Finally, the contigs were BLASTed against the reference ORF and UTR sets to remove non-target sequences, thus reduce the computational intensity of the subsequent analyses.
Extract open reading frame (coding) sequences
Each of the reference ORF sequences is typically composed of multiple exons. In the genome, these exons are interrupted by introns. To extract the coding sequence corresponding to the entire reference ORF, we need to correctly identify exons from the assembled contigs and stitch these identified exons into a complete ORF sequence. We adopted a bioinformatics pipeline called “exon mapping” to fulfill this purpose. For each reference ORF, we used EXONERATE version 2.2.0 (Slater and Birney, 2005) to locate its relevant exons from the filtered contigs based on its translated protein sequence. The identified exons were then mapped onto the reference ORF to make an orthologous ORF sequence (missing regions were filled with N), based on the coordinate information from the EXONERATE searches. This exon mapping strategy makes the obtained coding sequences from each sample have the same length to the reference ORF, which reduces the difficulty of sequence aligning. The workflow of extracting the orthologous ORF sequence is illustrated in Figure 2B. The whole bioinformatics procedure is fulfilled by an in-house Python script “Extracting coding sequences.py.”
Extract UTR (non-coding) sequences
Unlike the ORF sequences that are fractured in the genome, UTR sequences are commonly continuous in the genome and a complete UTR sequence is likely located within a single assembled contig. Based on the reference UTRs, we used a mutual best-hit (MBH) strategy (program = BLASTN, e-value < 1e−10, identity > 70%) to extract UTR orthologous groups (OGs) from all samples. The 1:1 orthology is confirmed if one contig of a sampled species and one reference UTR sequence find each other as the best hit in the bidirectional BLAST. Within each UTR OGs, the extracted sequences are normally different in length, which often makes them difficult to align. We used a previously published Python script (Li et al., 2019) to determine the optimal aligning region for all sequences within a UTR OG. The script uses the mutual-BLAST results to determine the relative position of each sequence to the reference sequence and searches for the optimal upstream and downstream boundaries to trim the sequences. Here, we demand that at least 40% of all the species have data at both the upstream and downstream boundaries. The workflow of extracting the orthologous UTR sequence is illustrated in Figure 2C.
Phylogenetic analysis
All extracted ORF or UTR sequences with mean sequencing depth < 5 were discarded. The ORF OGs were already aligned at the extraction step (see Figure 2B). We used Gblocks version 0.91 (Castresana, 2000) under codon mode (-t = c) and half gaps allowed (-b5 = h) to refine the ORF alignments. The UTR OGs were aligned using the program SATé-II version 2.2.2 (Liu et al., 2012) with the “-auto” option. The resulting alignments were also refined using Gblocks with half gaps allowed (-b5 = h). To further reduce the possible errors in orthology assignment and alignment, we reconstructed a maximum-likelihood (ML) tree for every ORF or UTR alignment using RAxML v8.2.2 (Stamatakis, 2014) under GTR + GAMMA model. If a tree contained extremely long branches that accounted for >50% of the total tree length, the corresponding sequences were removed from the alignment. We kept only the alignments that were longer than 100 bp and contained more than seventeen species (at least ten colubrid species and one outgroup species). Gene trees for each refined ORF or UTR alignment were constructed using RAxML with the GTR + GAMMA model and 100 bootstrapping replicates (-f a option). To investigate the degree of incongruence among gene trees, we calculated the pairwise Robinson-Foulds distances (Robinson and Foulds, 1981) between gene trees using the python script of Gori et al. (2016). The tree-to-tree distances were visualized using multidimensional scaling (MDS) in R (Hillis et al., 2005).
The filtered ORF and UTR alignments were combined into two concatenated supermatrix, respectively, and subjected to ML analyses using RAxML. Because our data sets included thousands of genes, partitioning our data sets by genes was not possible. Therefore, the ORF data set was partitioned by three codon positions, and the UTR data set was unpartitioned. ML analyses for both data sets were performed with the GTR + GAMMA model. Branch support for the resulting phylogeny was evaluated with 500 rapid bootstrapping replicates implemented in RAxML.
Results
cDNA sequencing and the reference open reading frame and UTR sets
After data quality control, we obtained a total of 45 million clean 150-bp paired-end reads (∼ 6.8 G data) from cDNA sequencing. We assembled these reads using TRINITY and obtained a total of 31,841 cDNA sequences. After filtering by redundancy, sequencing depth (≥5×), and length (≥200 bp), a total of 26,409 cDNA sequences were retained. Among these sequences, 14,785 contained ORFs with a length greater than 300 bp. Of the protein sequences of these predicted ORFs, 8,429 have orthologous human proteins. Among these 8,429 cDNA sequences, 4,000 (47.6%) have both 5′ and 3′ UTRs, 3,909 (46.3%) contain 3′ UTR, 273 (3.2%) contain 5′ UTR and 247 (2.9%) contain only coding sequences. From these 8,429 cDNA sequences, we extracted a total number of 8,429 ORFs and 10,665 UTRs (3,391 5′ UTR and 7,274 3′ UTR) as reference sets. The length of the reference ORFs ranged from 300 to 14,325 bp, with an average of 1,225 bp; the length of the reference UTRs ranged from 100 to 7,694 bp, with an average of 716 bp. The total length of the reference ORFs and UTRs are ∼10,300 K and ∼7,600 K, respectively.
Full-length cDNA-capture sequencing results
For the 24 colubrid snake (Ptyas korros is not included because it is the probe species) and 12 outgroup snake samples, we obtained a total of 2,577 million quality-filtered 150-bp paired-end reads (∼387 G data) using the FLc-Capture sequencing, ∼10.7 G data per sample (range: 5.5–20.3 G). The numbers of assembled contigs for different samples ranged from 158,424 to 872,008. These contigs were searched against the reference ORF and UTR sets to generate orthologous ORF and UTR sequences for each sample (see Section “Materials and methods”). On average, for the 8,429 ORF and 10,665 UTR targets, we could obtain about 6,000 ORF and 5,900 UTR sequences from the ingroup species, and about 5,000 ORF and 4,600 UTR sequences from the outgroup species that are more distantly related to the probe species (Table 2). When the recovery rate is calculated by genes, the recovery rates of ORF (67%) are generally higher than those of UTR (51%) (Figure 3A). However, when the recovery rate is calculated by nucleotides, the recovery success of UTR (44%) are, on the contrary, higher than those of ORF (32%) (Figure 3B), indicating that the recovered sequences of UTRs are more integrated than those of ORFs across reference sequences.
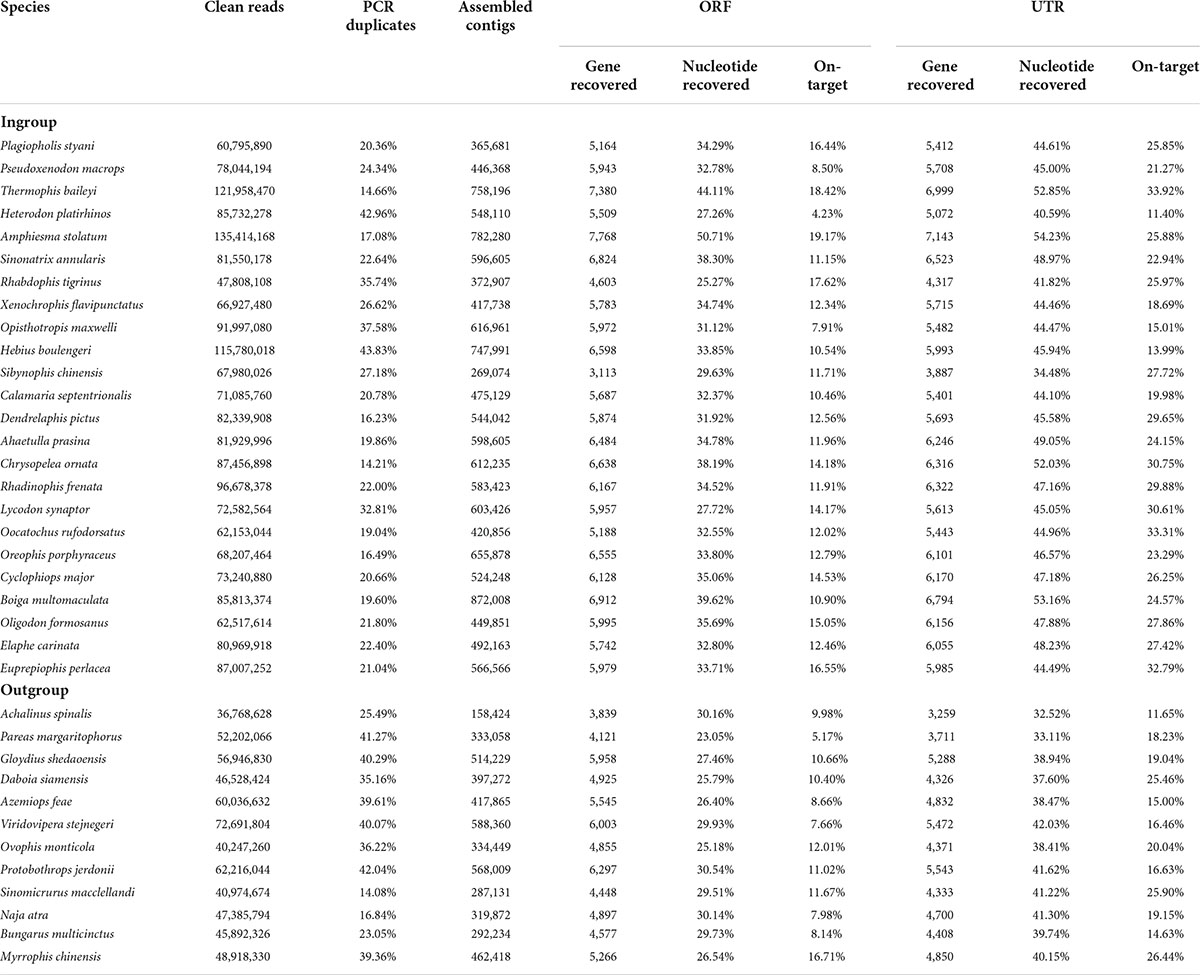
Table 2. Capture and sequencing results and detailed information from the bioinformatic pipeline for each sample.
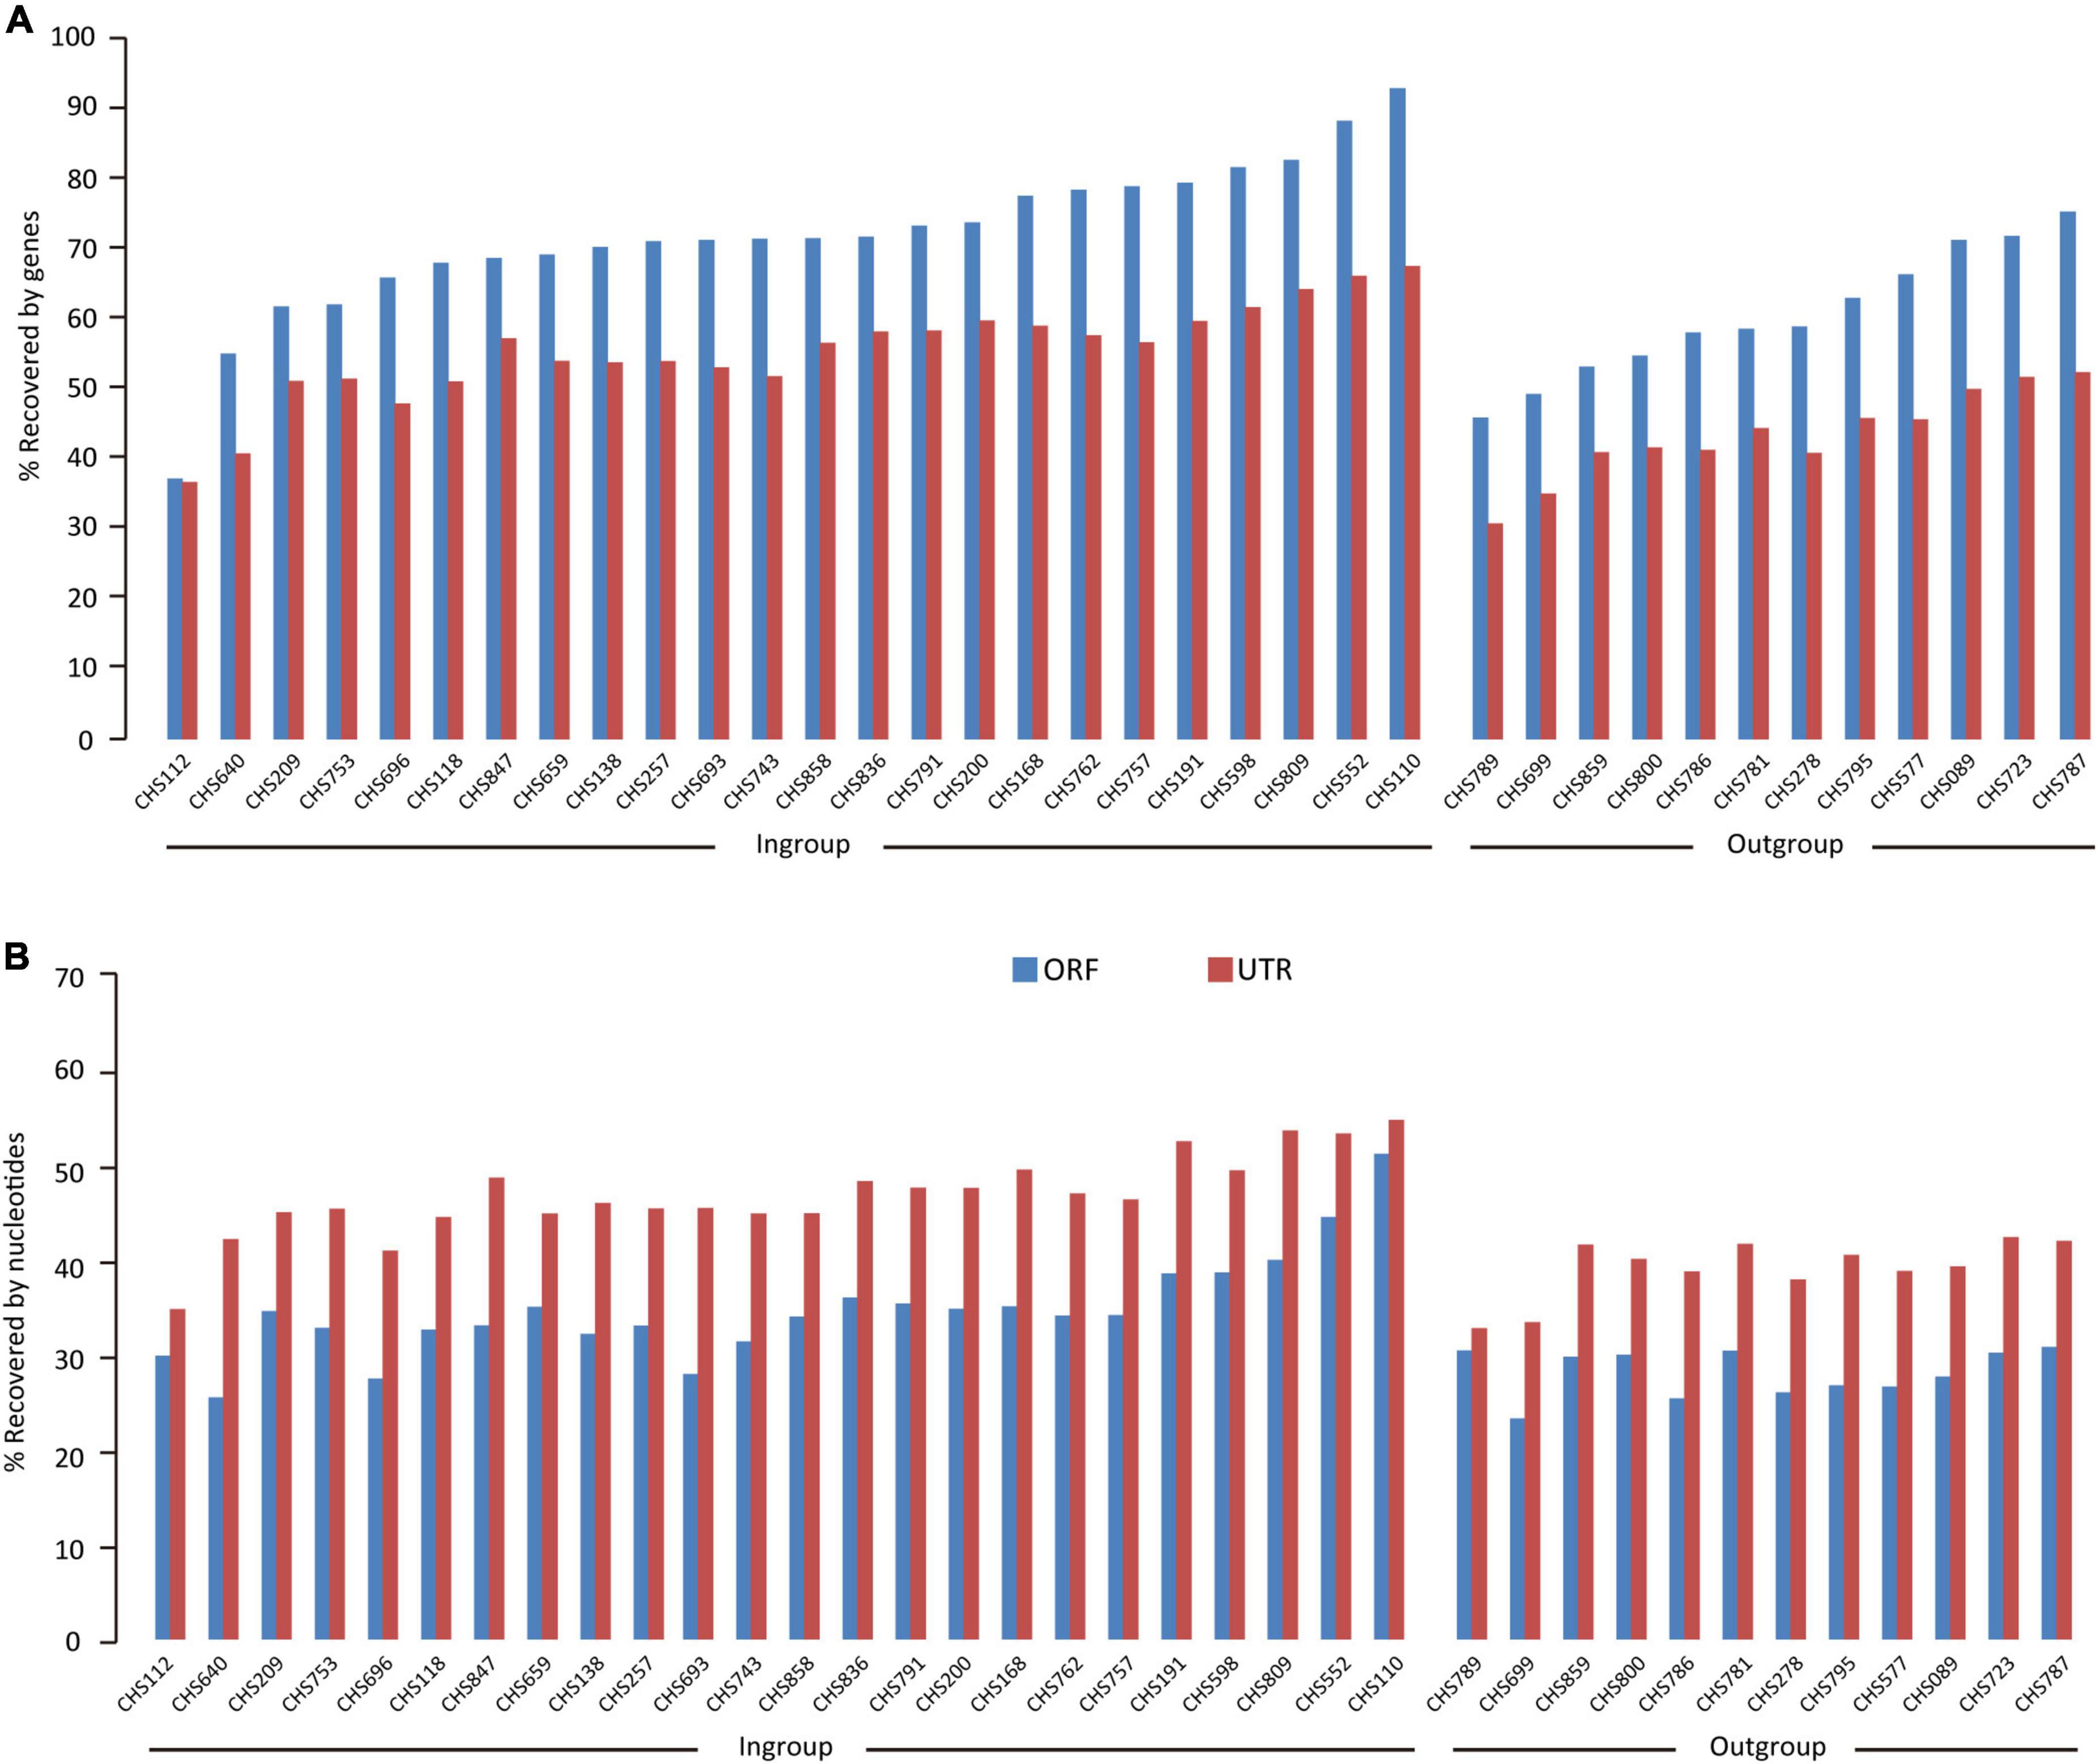
Figure 3. The results of extracting UTR and ORF sequences from the FLc-Capture data for the ingroup Colubridae species and the outgroup species. Bars show (A) gene recovery rates (B) nucleotide recovery rates.
We then explored capture specificity, the percentage of reads that can be aligned to target sequences (on-target) across all samples in our experiment (Table 2). The average on-target value of UTRs of all samples (23%) is higher than that of ORFs (12%) (Table 2), indicating that UTR sequences are more easily captured, possibly because they are physically continuous in genomes. However, the fluctuation of the on-target value of UTRs among samples (square deviation = 6.19, n = 36) is higher than that of ORFs (square deviation = 3.44, n = 36), suggesting that the capture efficiency of UTR sequences may be more sensitive to genetic distance. We found that the capture specificity of both ORF and UTR from a sample is negatively related to its genetic distance to the probe species, and the regression slope of UTR (coefficient = -204.39) is much smaller than that of ORF (coefficient = -64.04) (Figure 4A). These results showed that the capture specificity of UTR decreases more rapidly than that of ORF with the increase of genetic distance from the probe species, in line with that non-coding sequences (UTR) evolve more rapidly than coding sequences (ORF).
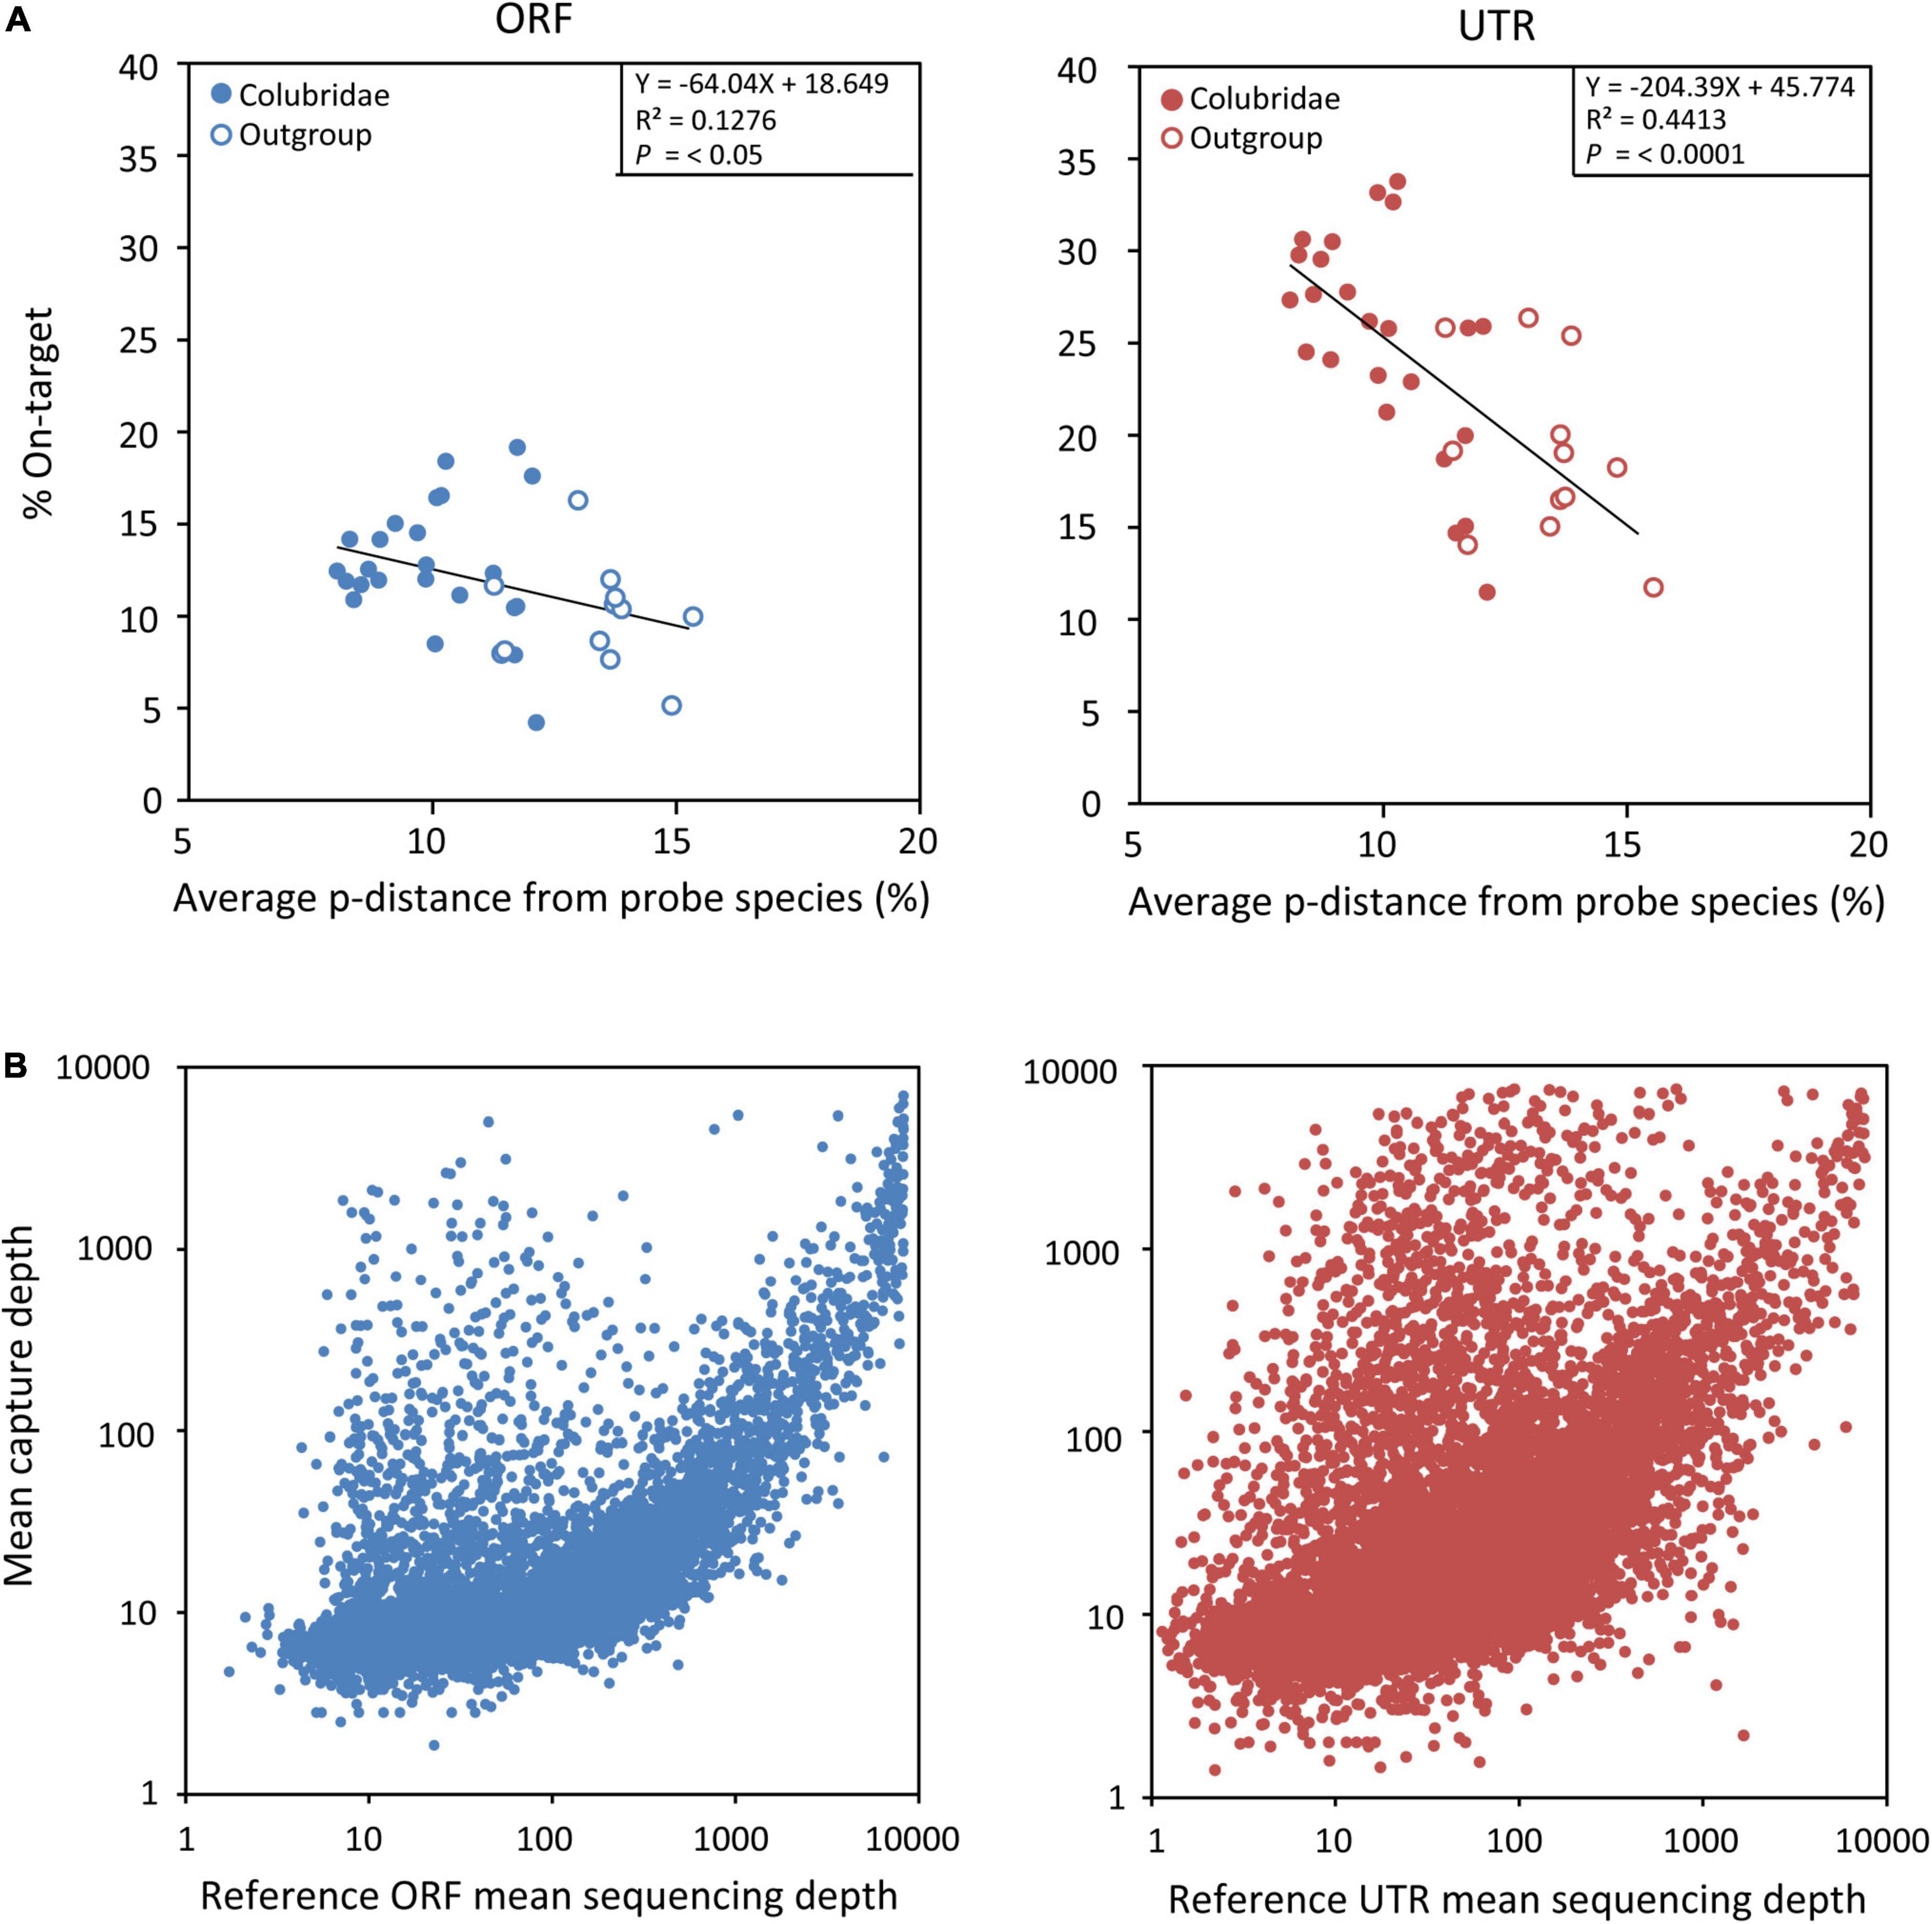
Figure 4. (A) Plots of linear regressions of capture specificity (on-target) across all samples in FLc-Capture experiments (blue = ORF, red = UTR), using the average pairwise distance from probe species as the independent variable. (B) Relationship between the mean capture depth of each target and the abundance of its corresponding probe (blue = ORF, red = UTR).
In our experiment, we did not perform normalization treatment for our full-length cDNA probes to reduce the abundance of highly expressed transcripts. We thus wanted to know whether our capture experiment was dominated by those highly abundant cDNA probes. We found that, to some extent, the mean capture depth of each target did appear to be related to the abundance of its probe (Figure 4B). But there were also many ORF and UTR sequences with high capture depth (>1,000) while their corresponding probes were not abundant (<100) (Figure 4B). So the relationship between the capture depth of one target and the abundance of its probe was not absolute. These results indicated that unnormalized cDNA probes do not significantly affect the ability of our method to capture those target sequences corresponding to low-expressed transcripts.
Detailed statistics of the sequencing, contig assembly, gene recovery, nucleotide recovery, and capture specificity for each sample are summarized in Table 2. On the whole, the FLc-Capture method can simultaneously obtain thousands of coding and non-coding sequences from both the ingroup and outgroup samples, which indicates that our experimental design using homemade full-length cDNA probes to capture both genomic coding and non-coding regions is successful.
The open reading frame and UTR data sets and the Colubridae phylogeny
A total of 1,075 ORFs and 1,948 UTRs have passed our filtering criteria (mean sequencing depth > 5 and containing at least 17 taxa) and can be used for phylogenetic analysis. A summary of data characteristics for ORFs and UTRs, including length, taxa occupancy, GC content (the average GC content at the third codon position for each ORF and average full GC content for each UTR), percentage of missing data, is given in Supplementary Data Sheet 1. The lengths of ORF alignments range from 168 to 9,063 bp (average = 760 bp) and the lengths of UTR alignments range from 107 to 3,011 bp (average = 572 bp) (Figure 5A). In general, the UTRs have lower mean GC content and lower GC content variation (among genes and among species) than the ORFs (Figure 5B). The UTR alignments have a higher pairwise distance than the ORF alignments, consistent with the expectation that non-coding sequences evolve more rapidly than coding sequences (Figure 5C). Multidimensional scaling plots of the RF-distance among genes (Figure 5D) indicated that the ORF gene trees were more similar to each other than the UTR gene trees, but the phylogenetic signals among the ORFs or UTRs were overall rather congruent.
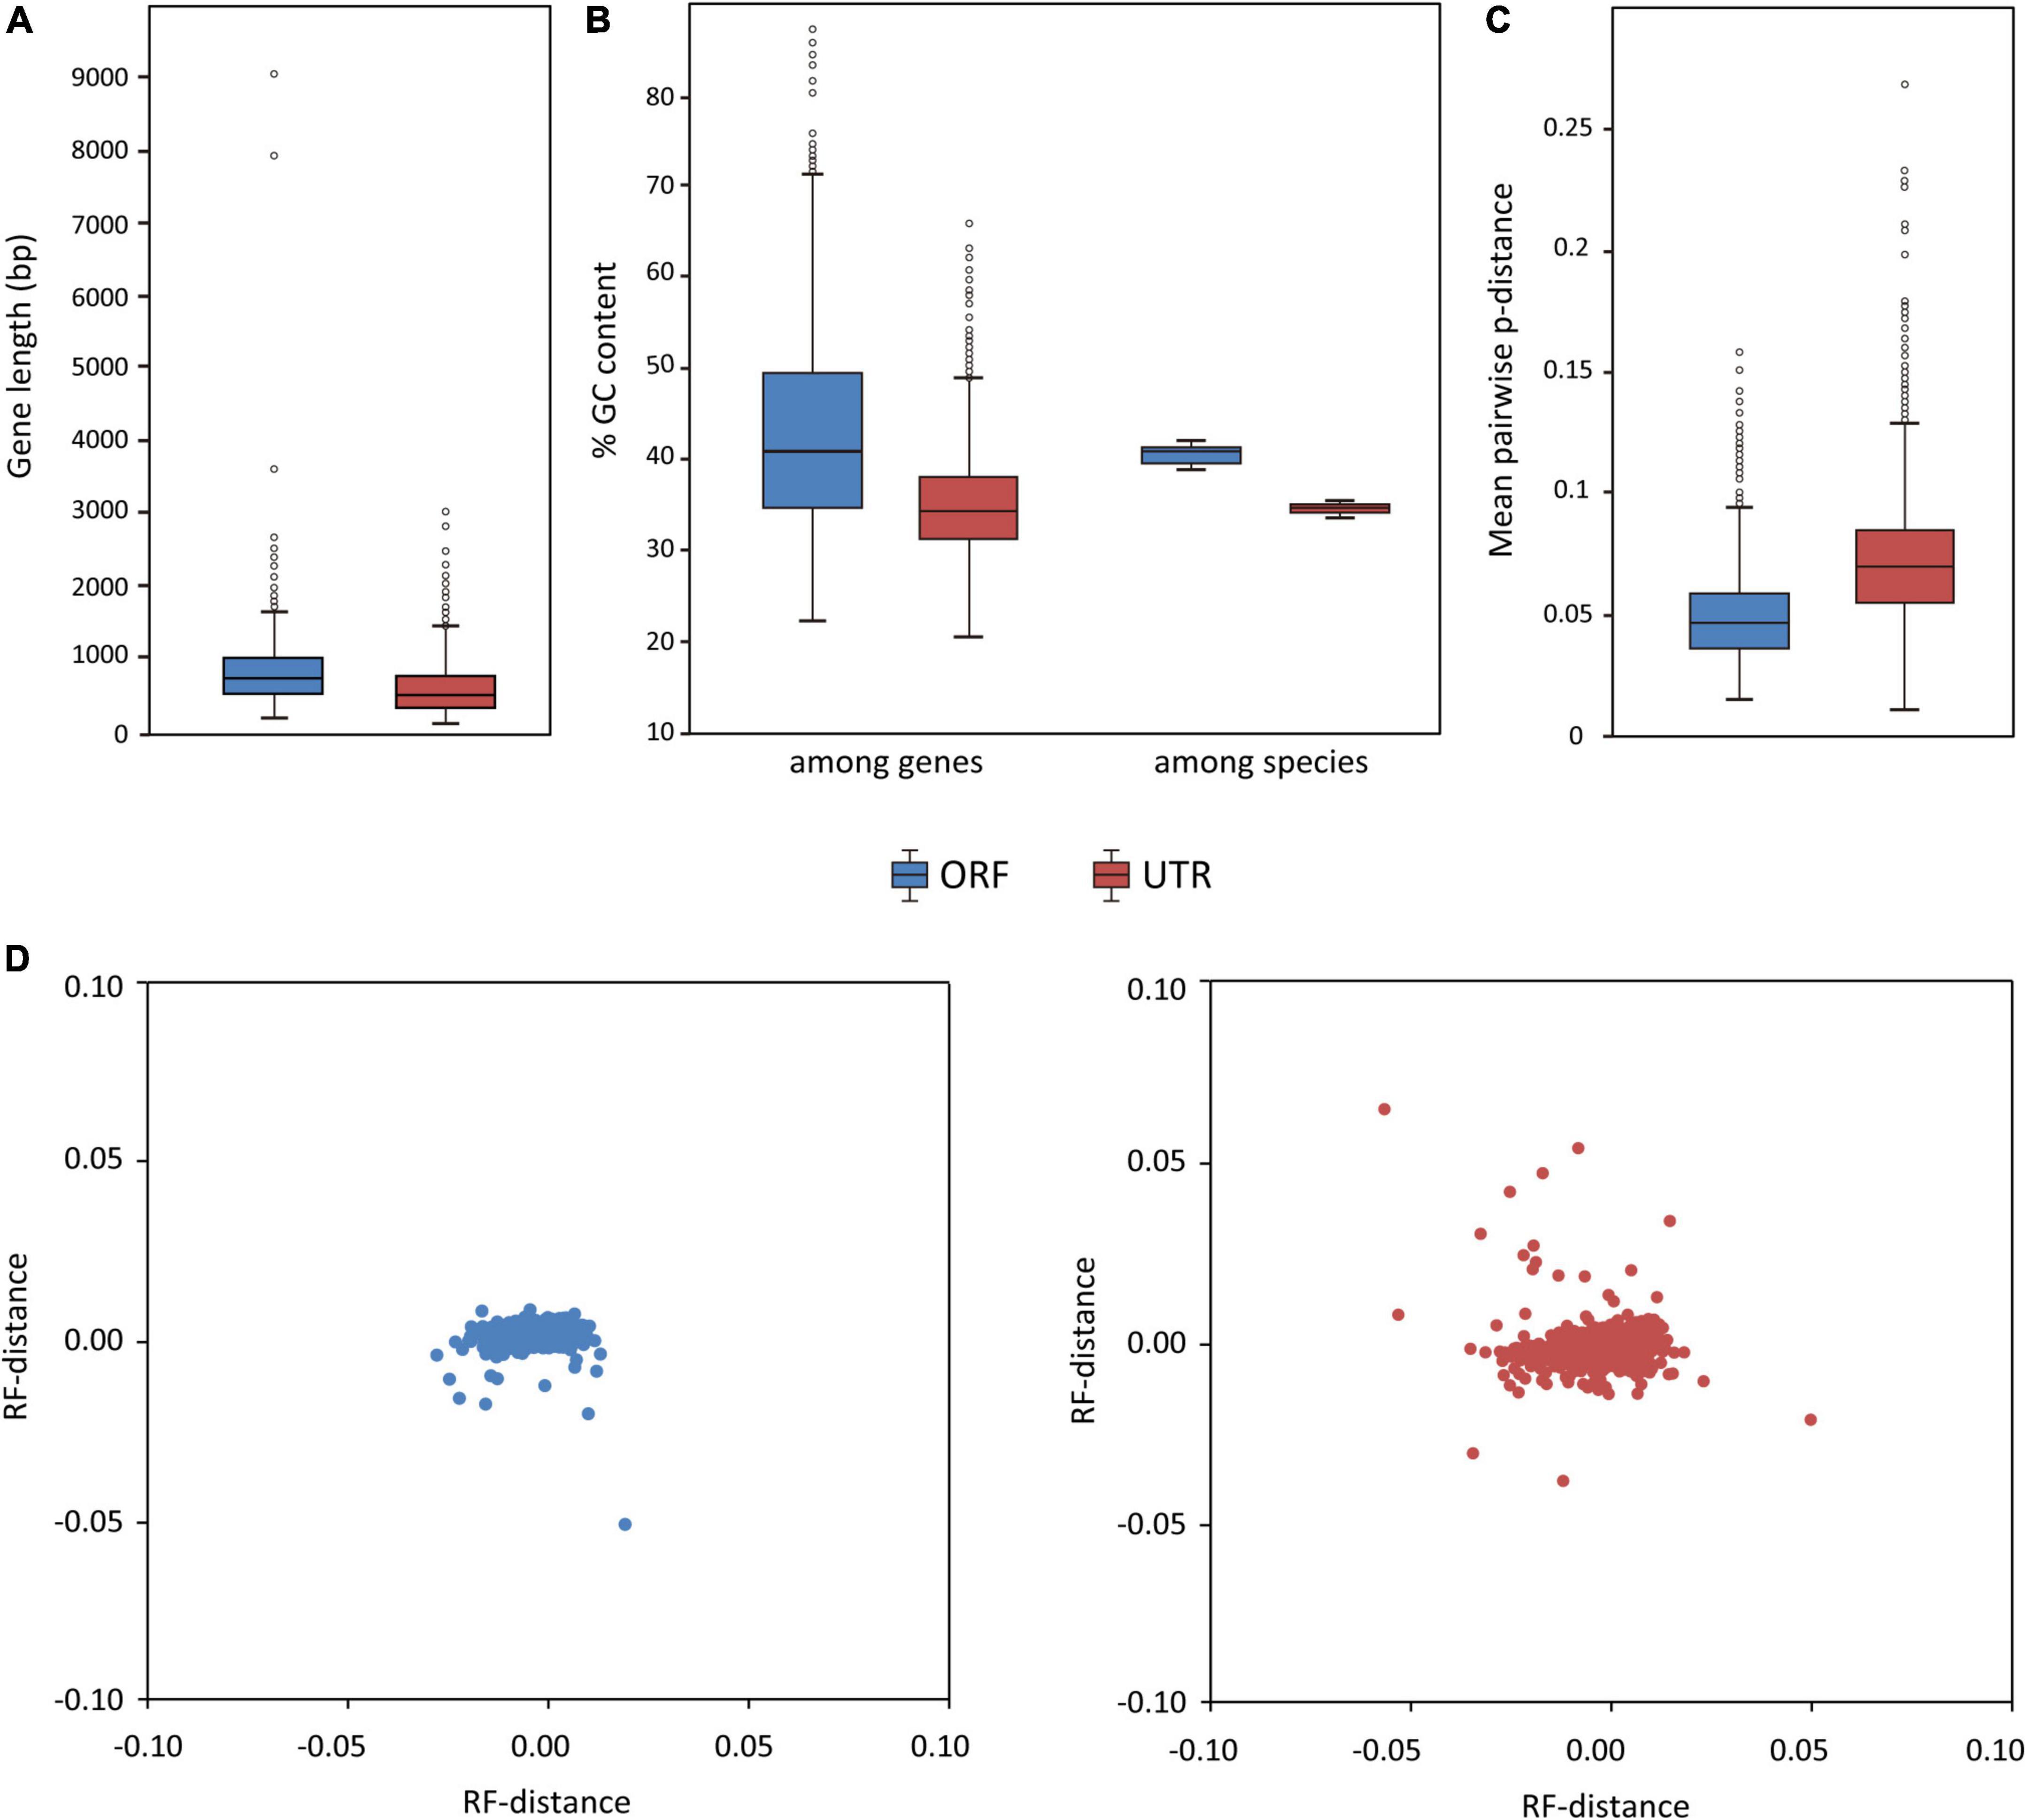
Figure 5. Characteristics of the ORF and UTR data sets (blue = ORF, red = UTR). Boxplots show (A) distribution of locus length (bp), (B) distribution of GC content (among genes and among species), and (C) distribution of the evolutionary rates of the loci (measured by the mean pairwise distance of each locus). (D) Visualization of ML tree space using multidimensional scaling plot of 1,075 ORF gene trees (left) and 1,948 UTR gene trees (right); each dot represents a tree inferred from one gene. Distances between dots represent Robinson–Foulds distances between gene trees.
The concatenated supermatrix of ORFs is 817,164 bp in length and 72.8% complete by characters, while that of UTRs is 1,114,278 bp in length and 78.2% complete by characters. The ML trees inferred from the ORF and UTR data sets are identical and well-resolved, with at least 85% of nodes having >95% bootstrap (BS) support (Figure 6). The backbone phylogeny among the snake families sampled in this study is congruent with that reported by previous studies (e.g., Pyron et al., 2014; Zheng and Wiens, 2016; Burbrink et al., 2020; Li et al., 2020). The monophyly of Colubridae is strongly supported (BS = 100%; Figure 6). Within the family Colubridae, we recovered three well-supported clades: (A) Dipsadinae and Pseudoxenodontinae, (B) Natricinae, and (C) [Sibynophiinae, (Calamariinae, [Ahaetuliinae, Colubrinae])], which is consistent with previous studies (e.g., Burbrink et al., 2020; Li et al., 2020). Clade A is the sister group of Clade C, and Clade B is the sister group of Clade A + Clade C. This relationship was strongly supported by the ORF data set (BS = 100%; Figure 6) and moderately supported by the UTR data set (BS = 74%; Figure 6).
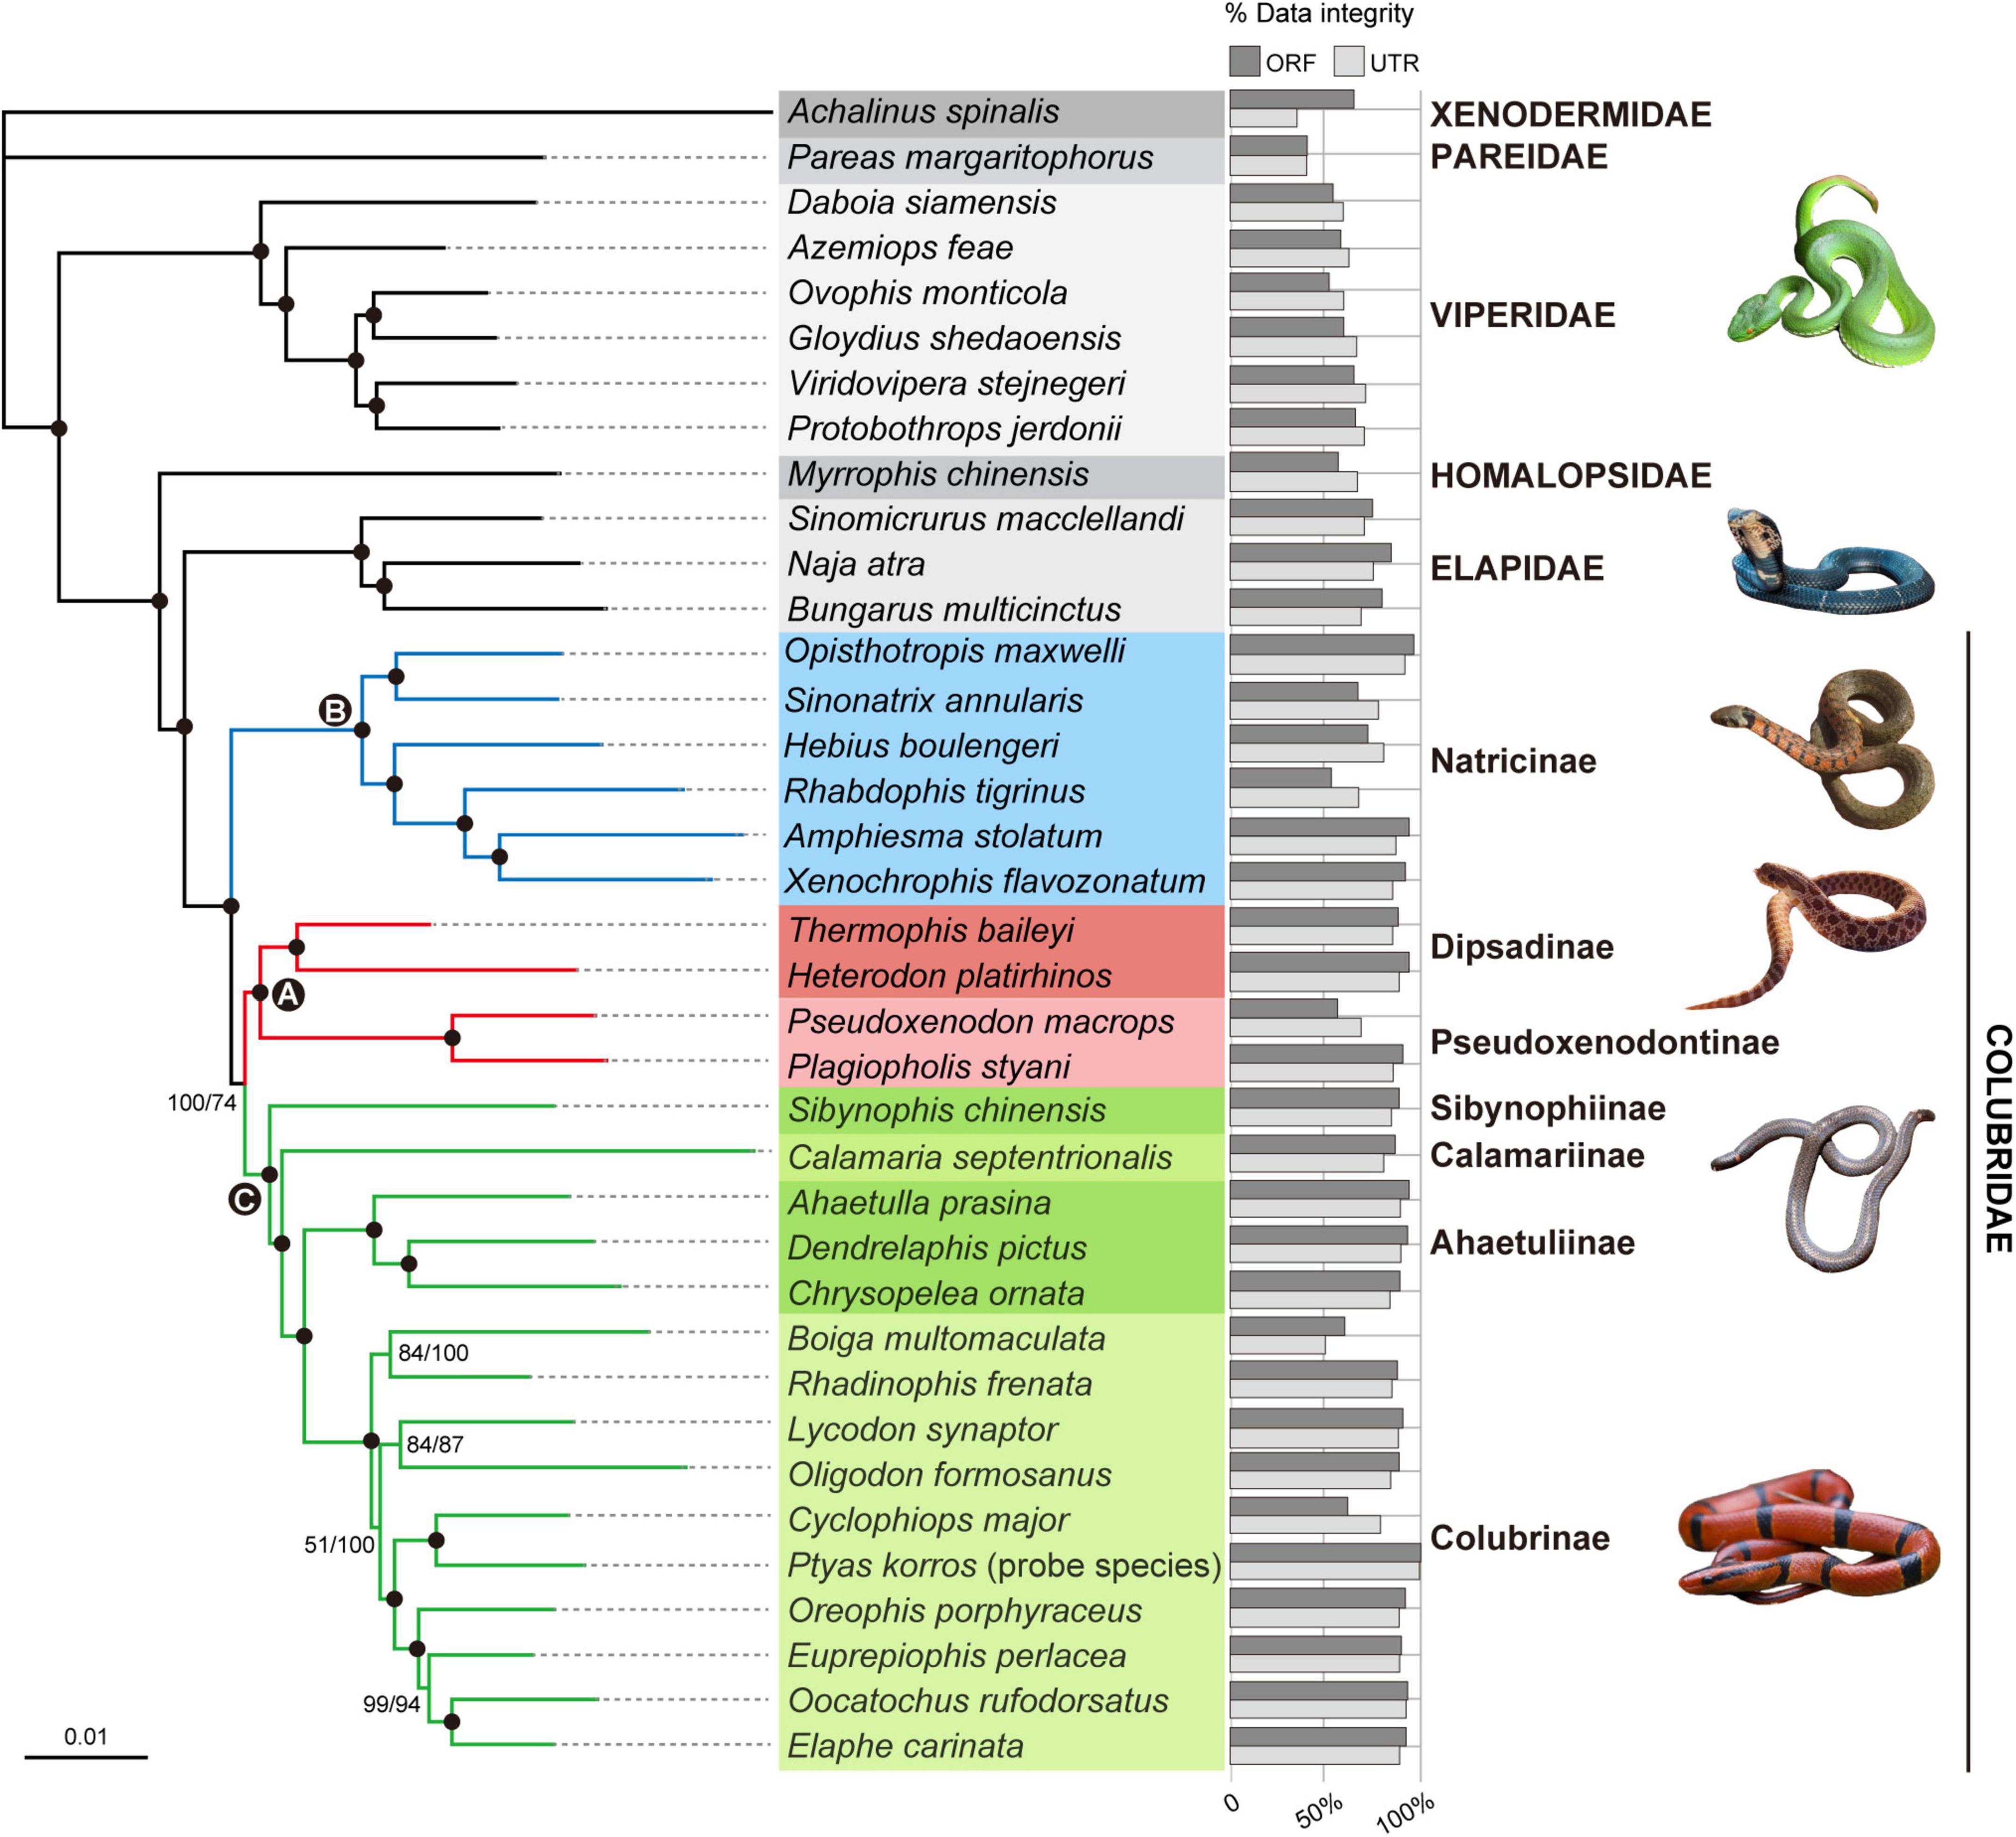
Figure 6. Phylogenetic relationships among the 25 Colubridae species (including the probe species Ptyas korros) and 12 outgroup species inferred from the ORF (1,075 ORFs; ∼817 K) and UTR (1,948 UTRs ∼1,114 K) data sets. The trees are inferred with RAxML, and the two data sets produce identical phylogeny. Branch support values are indicated beside nodes in order of ORF ML bootstrap and UTR ML bootstrap from left to right. The filled circles represent ML bootstrap support ≥95% (both ORF and UTR). The three hotly debated nodes (A–C) within the Colubridae family are indicated by filled circles with letters. The bars right to the species name represents the integrity of the data set for each species (calculated by loci).
Discussion
The originality of full-length FLc-Capture
The first distinctive originality of the FLc-Capture method is to use the SMART technology, which is widely adopted in cDNA cloning researches, to synthesize cDNA probes. The SMART technology guarantees that each of the synthesized cDNA is in full-length, consisting of ORF, 5’ UTR and 3’ UTR. This unique feature of the FLc-Capture probes allows researchers to enrich coding and non-coding sequences from genomes simultaneously. In our case of studying the Colubridae phylogeny, the final lengths of the ORF and UTR data sets are 817 and 1,114 K, respectively, relatively close, indicating that FLc-Capture can enrich both coding and non-coding sequences with similar efficiency.
Because cDNA sequences are discontinuous in genomes (interrupted by introns), the direct use of full-length cDNA probes to capture ORF and UTR regions from DNA libraries brings big challenges to data post-processing. Therefore, another originality of FLc-Capture is its unique data processing strategy. Considering ORF sequences are fractured in genomes and UTR sequences are usually continuous in genomes, FLc-Capture adopts two different ways to extract ORF and UTR sequences from capture data, respectively. For ORF, FLc-Capture first assembles reads to contigs, identifies exons from contigs, and then maps the identified exons onto the reference coding sequences. Our study demonstrated that this “exon mapping” strategy could extract coding sequences from genetically distant samples (∼15% divergence in our study) without the need for highly similar reference sequences. For UTR, because they are most likely each within a single assembled contig, FLc-Capture directly adopts a mutual best-hit (MBH) strategy to identify orthologous UTR sequences to the reference UTRs. Our case study showed that these two specially designed bioinformatics pipelines are effective, able to extract thousands of ORF and UTR sequences from both ingroup species and more distantly related outgroup species.
The merits of full-length cDNA-capture
The first advantage of the FLc-Capture method is that it saves both cost and time compared to commercially synthesized probe sets. Previous transcriptome-based capture studies normally used transcriptome data to design capture probes and ordered those probe sets from commercial companies (e.g., Bi et al., 2012; Bragg et al., 2016; Portik et al., 2016; Quek et al., 2020; Peakall et al., 2021; Hutter et al., 2022). The whole process to synthesize a custom probe kit typically takes several weeks and costs $2,400–$5,000, depending on the supplier (Peñalba et al., 2014). Although these commercial probes can be diluted for applying to more samples, the cost of using commercial probes would still be high when a research project has hundreds of samples or more, probably reaching several tens of thousands of dollars. In contrast, the primary initial investment for our method was the SMARTer PCR cDNA synthesis reagent (Clontech Inc.), which costs ∼$80 per reaction. Including the extraction of RNA, the probe preparation can be done within three days. In our lab, one SMARTer PCR cDNA synthesis reaction produces up to 100 μg of full-length cDNA probes when the input RNA is 1 μg. Such amount of cDNA probes is enough to handle at least 2,000 samples.
Full-length cDNA-capture has the merit of transcriptome sequencing while largely avoiding its shortcomings. Compared to transcriptome sequencing, FLc-Capture can produce transcriptome-level data (thousands of ORF and UTR sequences) with DNA samples. Researchers just need to collect one common species of their taxonomic group of interest for RNA extraction, prepare biotinylated full-length cDNA probes from RNA, and then use these probes to capture target regions from their DNA libraries. Except for the probe species used for RNA extraction, FLc-Capture has no strict requirements on the DNA quality of other samples, so highly degraded DNA extracted from old museum specimens can also be applied, which greatly increases the sampling number of taxa in a phylogenomic study.
In addition, FLc-Capture uses cDNA sequencing to provide reference sequences. This feature enables researchers to efficiently capture thousands of coding and non-coding sequences without knowing any genome knowledge of the taxa being investigated, especially suitable for non-model organisms. Unlike low-coverage WGS sequencing, which is more suitable for extracting phylogenomic data from small genome species (Allen et al., 2017; Zhang F. et al., 2019), FLc-Capture can efficiently collect coding and non-coding phylogenomic data from not only small genome species but also large genome species. These two features make the FLc-Capture method highly versatile and applicable for any organism groups.
Application suggestions for FLc-Capture
In our FLc-Capture experiment, we did not perform cDNA normalization to decrease the abundance of highly expressed transcripts, so the cDNA probe pools skewed toward highly expressed genes. However, our FLc-Capture result showed that the capture depth of the obtained ORF and UTR sequences is not fully related to the abundance of their cDNA probes (Figure 4B); and that using unnormalized cDNA probes is still able to capture thousands of coding and non-coding loci. To obtain more uniform capture coverage across high and low-expressed transcripts, Puritz and Lotterhos (2018) used duplex-specific nuclease (DSN) treatment to prepare normalized cDNA probes for exome capture. They found that RNA sequencing coverage and exome sequencing coverage was still highly correlated (capture coverage was higher for highly expressed genes) even using normalized cDNA probes. Therefore, it seems that cDNA normalization is not an indispensable step. For projects focusing on obtaining more phylogenetically informative loci for phylogenomic analysis, increasing the diversity of cDNA probes may be more effective than cDNA normalization. In such circumstances, we suggest pooling mRNAs extracted from multiple tissue types to create a high-diversity probe pool rather than using only liver mRNA as in our demonstration case.
Despite the demonstrated effectiveness of FLc-Capture in our snake case, one note should be considered before employing the method. Because the efficiency of sequence capture decreases with increased genetic distance between the probes and the targets, FLc-Capture might be less effective in large and highly divergent organism groups such as insects and other arthropods. In our demonstrating snake case, the maximal sequence difference between the probe species and outgroup species is about 15%. We finally recovered 65% of the target ORF loci and 35% of the target UTR loci from these outgroup species, respectively. This threshold value (15% genetic difference) can be used as a starting point for other researchers to determine the phylogenetic depth of their FLc-Capture experiments. It has been shown that using DNA mixtures pooled from different representative species to prepare homemade probes is an effective strategy for sequence capture across large phylogenetic scales (Zhang Y. et al., 2019). Therefore, if an investigator wants to apply the FLc-Capture method to a highly divergent organism group, it is possible to use several probe species that cover the entire phylogenetic span, mix their mRNAs to prepare a full-length cDNA probes, which can reduce the sequence divergence between probe and target. Of course, in such circumstances, the reference ORF and UTR sets should also be separated by different probe species, and the bioinformatics pipeline should be adjusted accordingly. This mixing strategy may allow for applying FLc-Capture across large phylogenetic scales but needs to be tested in the future.
Genome capture based on homemade probes
In recent years, a number of strategies have been proposed to prepare homemade capture probes for genome capture. According to the starting material used for probe preparation, these strategies can be divided into two major types. The first type of homemade probes is prepared from genomic DNA, such as whole-genome probes transcribed from genomic DNA libraries (WISC: Carpenter et al., 2013) and restriction site-associated DNA probes (HyRAD: Suchan et al., 2016; AFLP-Capture: Li et al., 2019). These genomic DNA derived probes normally contain thousands of anonymous genomic fragments that are highly variable, more suitable for sequence capture among closely related species or different individuals of a certain species. Typical applications of this type of homemade probes include ancient DNA analysis, phylogeography, and population genetics. The second type of homemade probes is prepared from mRNAs, such as fragmented cDNA probes generated from mRNAs (EecSeq: Puritz and Lotterhos, 2018), restriction site-associated cDNA probes (HyRAD-X: Schmid et al., 2017), and full-length cDNA probes (FLc-Capture: this study). The main difference between these cDNA probes lies in that the EecSeq and HyRAD-X probes use fragmented cDNA fragments while the FLc-Capture probes use full-length cDNAs (containing both coding ORF and non-coding UTR regions). The mRNA-derived cDNA probes target exonic genomic regions that are conserved thus more suitable for sequence capture among phylogenetically distant-related species for phylogenetic inference. Overall, compared to commercially synthesized probes, using homemade probes for genome capture is both cost-effective and flexible. Currently, the development of sequence capture methods based on homemade probes is still in its infancy. We would like to see more new methods arising in the near future to meet different research requirements.
Higher-level phylogeny of Colubridae
The family Colubridae are currently divided into eight subfamilies: Dipsadinae, Pseudoxenodontinae, Natricinae, Sibynophiinae, Calamariinae, Ahaetuliinae, Gratiinae, and Colubrinae. The phylogenetic relationships among these subfamilies have been unstable as recent molecular phylogenies often attain only low resolution and contradict each other (e.g., Pyron et al., 2011, 2013, 2014; Zheng and Wiens, 2016; Figueroa et al., 2016; Zaher et al., 2019; Burbrink et al., 2020; Li et al., 2020). In this study, we simultaneously used ∼1,000 coding ORFs and ∼1,800 non-coding UTRs to reconstruct the Colubridae phylogeny and our results provided a satisfactory resolution for the higher-level colubrid relationships (Figure 6). Both two types of data sets recovered identical and well-resolved phylogenetic trees. All subfamily-level nodes received robust support (BS = 100%) at least in one type of data set (Figure 6).
A few studies found that Pseudoxenodontinae was the sister group of Calamariinae (Pyron et al., 2013; Zheng and Wiens, 2016) but more studies recovered Pseudoxenodontinae as the sister group of Dipsadinae (Pyron et al., 2011, 2014; Figueroa et al., 2016; Zaher et al., 2019; Burbrink et al., 2020; Li et al., 2020). Our study supports the latter hypothesis: in our Colubridae tree, Dipsadinae and Pseudoxenodontinae are grouped together with strong support (Figure 6; BS = 100%). In our Colubridae tree, Sibynophiinae, Calamariinae, Ahaetuliinae, and Colubrinae form a highly supported clade and the relationships among them are [Sibynophiinae, (Calamariinae, [Ahaetuliinae, Colubrinae])] (Figure 6), which is consistent with many recent studies (Pyron et al., 2014; Zaher et al., 2019; Burbrink et al., 2020; Li et al., 2020). Due to sampling limitations, our study did not include the subfamily Gratiinae. Two previous phylogenomic studies found that Gratiinae is most likely the sister group of Colubrinae (Pyron et al., 2014; Burbrink et al., 2020), but their analyses did not include the subfamily Ahaetuliinae (the sister group of Colubrinae in our study). Therefore, the position of Gratiinae and Ahaetuliinae relative to Colubrinae remains to be further studied by phylogenomic analyses with more comprehensive taxon sampling.
Historically, one of the major problems in resolving the Colubridae phylogeny lies in the placement of the subfamily Natricinae. Zaher et al. (2019) and Li et al. (2020) used 15 genes and 96 genes (including both mitochondrial and nuclear loci), respectively, and found that Natricinae was the sister group of a clade containing Sibynophiinae, Calamariinae, Ahaetuliinae, and Colubrinae but both with only weak support (BS < 70%). Pyron et al. (2014) and Burbrink et al. (2020) used over 300 AHE loci and found Natricinae as the sister group of Dipsadinae and Pseudoxenodontinae, also without strong support (BS = 65% and PP = 0.88). Different from the above two hypotheses, we recovered that Natricinae is the sister group of all other subfamilies of Colubridae, and (Dipsadinae, Pseudoxenodontinae) is the sister group of (Sibynophiinae, Calamariinae, Ahaetuliinae, Colubrinae). This topology was favored by both the coding ORF and non-coding UTR data sets and received strong support from the ORF data set (BS = 100%, Figure 6). Although highly supported, our taxon sampling for some subfamilies is insufficient and lacks snake species of America, Africa and Europe. Therefore, the new subfamily-level relationships of Colubridae found in this study is still tentative and needs to be further tested with more complete taxon sampling of colubrids.
Conclusion
In this study, we demonstrated that the FLc-Capture method could efficiently capture and enrich a large number of coding and non-coding loci for non-model organisms without any prior genome information. The direct use of homemade full-length cDNA probes in FLc-Capture can skip the expensive commercial probe design and synthesis, significantly reducing experimental cost. FLc-Capture can generate transcriptome-level data just based on DNA samples, which facilitates including more number of taxa in a phylogenomic study. In summary, FLc-Capture holds substantial promise in phylogenomic researches as a universally applicable and cost-effective sequence capture method of simultaneously collecting genome-level coding and non-coding orthologous loci for any organism.
Data availability statement
The raw read data were deposited in NCBI SRA (accession numbers: PRJNA668136 and PRJNA668154). Python scripts, the concatenated data matrix, raw capture contigs, and the resulting phylogenetic trees were deposited in Figshare https://figshare.com/s/327da04a521c0e1abd96.
Ethics statement
Ethical review and approval was not required for the animal study because the snake tissue samples used in this study does not involve ethical issues.
Author contributions
PZ and DL designed the research. JXL performed the experiment and analyzed the data. All authors wrote the manuscript and approved the submitted version.
Funding
This work was supported by the National Natural Science Foundation of China (grant nos. 32170449, 32071611, and 31872205) and Guangdong Basic and Applied Basic Research Foundation (grant no. 2019A1515010729).
Acknowledgments
We thank Song Huang, Peng Guo, and YingYong Wang for sharing valuable snake samples with us.
Conflict of interest
The authors declare that the research was conducted in the absence of any commercial or financial relationships that could be construed as a potential conflict of interest.
Publisher’s note
All claims expressed in this article are solely those of the authors and do not necessarily represent those of their affiliated organizations, or those of the publisher, the editors and the reviewers. Any product that may be evaluated in this article, or claim that may be made by its manufacturer, is not guaranteed or endorsed by the publisher.
Supplementary material
The Supplementary Material for this article can be found online at: https://www.frontiersin.org/articles/10.3389/fevo.2022.969581/full#supplementary-material
Supplementary Data Sheet 1 | Detail protocol for full-length cDNA probe preparation and hybridization capture.
Supplementary Data Sheet 2 | A summary of data characteristics for ORFs and UTRs, including length, taxa occupancy, GC content, percentage of missing data.
Footnotes
References
Albert, T. J., Molla, M. N., Muzny, D. M., Nazareth, L., Wheeler, D., Song, X., et al. (2007). Direct selection of human genomic loci by microarray hybridization. Nat. Methods 4, 903–905. doi: 10.1038/nmeth1111
Alda, F., Ludt, W. B., Elías, D. J., McMahan, C. D., and Chakrabarty, P. (2021). Comparing ultraconserved elements and exons for phylogenomic analyses of middle American cichlids: when data agree to disagree. Genome Biol. Evol. 13:evab161. doi: 10.1093/gbe/evab161
Allen, J. M., Boyd, B., Nguyen, N. P., Vachaspati, P., Warnow, T., Huang, D. I., et al. (2017). Phylogenomics from whole genome sequences using aTRAM. Syst. Biol. 66, 786–798. doi: 10.1093/sysbio/syw105
Allio, R., Scornavacca, C., Nabholz, B., Clamens, A. L., Sperling, F. A., and Condamine, F. L. (2019). Whole genome shotgun phylogenomics resolves the pattern and timing of swallowtail butterfly evolution. Syst. Biol. 69, 38–60. doi: 10.1093/sysbio/syz030
Andermann, T., Torres Jiménez, M. F., Matos-Maraví, P., Batista, R., Blanco-Pastor, J. L., Gustafsson, A., et al. (2020). A guide to carrying out a phylogenomic target sequence capture project. Front. Genet. 10:1407. doi: 10.3389/fgene.2019.01407
Bankevich, A., Nurk, S., Antipov, D., Gurevich, A. A., Dvorkin, M., Kulikov, A. S., et al. (2012). SPAdes: a new genome assembly algorithm and its applications to single-cell sequencing. J. Comput. Biol. 19, 455–477. doi: 10.1089/cmb.2012.0021
Bi, K., Vanderpool, D., Singhal, S., Linderoth, T., Moritz, C., and Good, J. M. (2012). Transcriptome-based exon capture enables highly cost-effective comparative genomic data collection at moderate evolutionary scales. BMC Genom. 13:403. doi: 10.1186/1471-2164-13-403
Blaimer, B. B., Lloyd, M. W., Guillory, W. X., and Brady, S. G. (2016). Sequence capture and phylogenetic utility of genomic ultraconserved elements obtained from pinned insect specimens. PLoS One 11:e0161531. doi: 10.1371/journal.pone.0161531
Bolger, A. M., Lohse, M., and Usadel, B. (2014). Trimmomatic: a flexible trimmer for Illumina sequence data. Bioinformatics 30, 2114–2120. doi: 10.1093/bioinformatics/btu170
Boratyn, G. M., Camacho, C., Cooper, P. S., Coulouris, G., Fong, A., Ma, N., et al. (2013). BLAST: a more efficient report with usability improvements. Nucleic Acids Res. 41, W29–W31. doi: 10.1093/nar/gkt282
Bragg, J. G., Potter, S., Bi, K., and Moritz, C. (2016). Exon capture phylogenomics: efficacy across scales of divergence. Mol. Ecol. Resour. 16, 1059–1068. doi: 10.1111/1755-0998.12449
Breinholt, J. W., Earl, C., Lemmon, A. R., Lemmon, E. M., Xiao, L., and Kawahara, A. Y. (2018). Resolving relationships among the megadiverse butterflies and moths with a novel pipeline for anchored phylogenomics. Syst. Biol. 67, 78–93. doi: 10.1093/sysbio/syx048
Burbrink, F. T., Grazziotin, F. G., Pyron, R. A., Cundall, D., Donnellan, S., Irish, F., et al. (2020). Interrogating genomic-scale data for squamata (lizards, snakes, and amphisbaenians) shows no support for key traditional morphological relationships. Syst. Biol. 69, 502–520. doi: 10.1093/sysbio/syz062
Bushnell, B. (2014). BBtools. Available online at: https://sourceforge.net/projects/bbmap/
Cai, L., Xi, Z., Lemmon, E. M., Lemmon, A. R., Mast, A., Buddenhagen, C. E., et al. (2021). The perfect storm: gene tree estimation error, incomplete lineage sorting, and ancient gene flow explain the most recalcitrant ancient angiosperm clade, malpighiales. Syst. Biol. 70, 491–507. doi: 10.1093/sysbio/syaa083
Carpenter, M. L., Buenrostro, J. D., Valdiosera, C., Schroeder, H., Allentoft, M. E., Sikora, M., et al. (2013). Pulling out the 1%: whole-genome capture for the targeted enrichment of ancient DNA sequencing libraries. Am. J. Hum. Genet. 93, 852–864. doi: 10.1016/j.ajhg.2013.10.002
Castresana, J. (2000). Selection of conserved blocks from multiple alignments for their use in phylogenetic analysis. Mol. Biol. Evol. 17, 540–552. doi: 10.1093/oxfordjournals.molbev.a026334
Chen, M. Y., Liang, D., and Zhang, P. (2017). Phylogenomic resolution of the phylogeny of Laurasiatherian mammals: exploring phylogenetic signals within coding and noncoding sequences. Genome Biol. Evol. 9, 1998–2012. doi: 10.1093/gbe/evx147
Faircloth, B. C., McCormack, J. E., Crawford, N. G., Harvey, M. G., Brumfield, R. T., and Glenn, T. C. (2012). Ultraconserved elements anchor thousands of genetic markers spanning multiple evolutionary timescales. Syst. Biol. 61, 717–726. doi: 10.1093/sysbio/sys004
Figueroa, A., McKelvy, A. D., Grismer, L. L., Bell, C. D., and Lailvaux, S. P. (2016). A species-level phylogeny of extant snakes with description of a nw colubrid subfamily and genus. PLoS One 11:e0161070. doi: 10.1371/journal.pone.0161070
Fu, L., Niu, B., Zhu, Z., Wu, S., and Li, W. (2012). CD-HIT: accelerated for clustering the next-generation sequencing data. Bioinformatics 28, 3150–3152. doi: 10.1093/bioinformatics/bts565
Garrison, N. L., Rodriguez, J., Agnarsson, I., Coddington, J. A., Griswold, C. E., Hamilton, C. A., et al. (2016). Spider phylogenomics: untangling the spider tree of life. PeerJ 4:e1719. doi: 10.7717/peerj.1719
Glenn, T. C., and Faircloth, B. C. (2016). Capturing Darwin’s dream. Mol. Ecol. Resour. 16, 1051–1058. doi: 10.1111/1755-0998.12574
Gnirke, A., Melnikov, A., Maguire, J., Rogov, P., LeProust, E. M., Brockman, W., et al. (2009). Solution hybrid selection with ultra-long oligonucleotides for massively parallel targeted sequencing. Nat. Biotechnol. 27, 182–189. doi: 10.1038/nbt.1523
Gori, K., Suchan, T., Alvarez, N., Goldman, N., and Dessimoz, C. (2016). Clustering genes of common evolutionary history. Mol. Biol. Evol. 33, 1590–1605. doi: 10.1093/molbev/msw038
Grabherr, M. G., Haas, B. J., Yassour, M., Levin, J. Z., Thompson, D. A., Amit, I., et al. (2011). Full-length transcriptome assembly from RNA-Seq data without a reference genome. Nat. Biotechnol. 29, 644–652. doi: 10.1038/nbt.1883
Guschanski, K., Krause, J., Sawyer, S., Valente, L. M., Bailey, S., Finstermeier, K., et al. (2013). Next-generation museomics disentang one of the largest primate radiations. Syst. Biol. 62, 539–554. doi: 10.1093/sysbio/syt018
Hillis, D. M., Heath, T. A., and St John, K. (2005). Analysis and visualization of tree space. Syst. Biol. 54, 471–482. doi: 10.1080/10635150590946961
Hughes, G. M., and Teeling, E. C. (2018). AGILE: an assembled genome mining pipeline. Bioinformatics 35, 1252–1254. doi: 10.1093/bioinformatics/bty781
Hughes, L. C., Ortí, G., Huang, Y., Sun, Y., Baldwin, C. C., Thompson, A. W., et al. (2018). Comprehensive phylogeny of ray-finned fishes (Actinopterygii) based on transcriptomic and genomic data. Proc. Natl. Acad. Sci. U.S.A. 115, 6249–6254. doi: 10.1073/pnas.1719358115
Hutter, C. R., Cobb, K. A., Portik, D. M., Travers, S. L., Wood, P. L. Jr., and Brown, R. M. (2022). FrogCap: a modular sequence capture probe-set for phylogenomics and population genetics for all frogs, assessed across multiple phylogenetic scales. Mol. Ecol. Resour. 22, 1100–1119. doi: 10.1111/1755-0998.13517
Jarvis, E. D., Mirarab, S., Aberer, A. J., Li, B., Houde, P., Li, C., et al. (2014). Whole-genome analyses resolve early branches in the tree of life of modern birds. Science 346, 1320–1331. doi: 10.1126/science.1253451
Jones, M. R., and Good, J. M. (2016). Targeted capture in evolutionary and ecological genomics. Mol. Ecol. 25, 185–202. doi: 10.1111/mec.13304
Lemmon, A. R., Emme, S. A., and Lemmon, E. M. (2012). Anchored hybrid enrichment for massively high-throughput phylogenomics. Syst. Biol. 61, 727–744. doi: 10.1093/sysbio/sys049
Lemmon, E. M., and Lemmon, A. R. (2013). High-throughput genomic data in systematics and phylogenetics. Annu. Rev. Ecol. Evol. Syst. 44, 99–121. doi: 10.1146/annurev-ecolsys-110512-135822
Li, H., Handsaker, B., Wysoker, A., Fennell, T., Ruan, J., Homer, N., et al. (2009). The sequence alignment/map format and SAMtools. Bioinformatics 25, 2078–2079. doi: 10.1093/bioinformatics/btp352
Li, J., Liang, D., Wang, Y., Guo, P., Huang, S., and Zhang, P. (2020). A large-scale systematic framework of Chinese snakes based on a unified multilocus marker system. Mol. Phylogenet. Evol. 148:106807. doi: 10.1016/j.ympev.2020.106807
Li, J., Zeng, Z., Wang, Y., Liang, D., and Zhang, P. (2019). Sequence capture using AFLP-generated baits: a cost-effective method for high-throughput phylogenetic and phylogeographic analysis. Ecol. Evol. 9, 5925–5937. doi: 10.1002/ece3.5176
Liu, K., Warnow, T. J., Holder, M. T., Nelesen, S. M., Yu, J., Stamatakis, A. P., et al. (2012). SATe-II: very fast and accurate simultaneous estimation of multiple sequence alignments and phylogenetic trees. Syst. Biol. 61, 90–106. doi: 10.1093/sysbio/syr095
McCartney-Melstad, E., Mount, G. G., and Shaffer, H. B. (2016). Exon capture optimization in amphibians with large genomes. Mol. Ecol. Resour. 16, 1084–1094. doi: 10.1111/1755-0998.12538
McCormack, J. E., Hird, S. M., Zellmer, A. J., Carstens, B. C., and Brumfield, R. T. (2013). Applications of next-generation sequencing to phylogeography and phylogenetics. Mol. Phylogenet. Evol. 66, 526–538. doi: 10.1016/j.ympev.2011.12.007
Mclean, B. S., Bell, K. C., Allen, J. M., Helgen, K. M., and Cook, J. A. (2019). Impacts of inference method and data set filtering on phylogenomic resolution in a rapid radiation of ground squirrels (Xerinae: Marmotini). Syst. Biol. 68, 298–316. doi: 10.1093/sysbio/syy064
Misof, B., Liu, S., Meusemann, K., Peters, R. S., Donath, A., Mayer, C., et al. (2014). Phylogenomics resolves the timing and pattern of insect evolution. Science 346, 763–767. doi: 10.1126/science.1257570
Morozova, O., Hirst, M., and Marra, M. A. (2009). Applications of new sequencing technologies for transcriptome analysis. Annu. Rev. Genet. 10, 135–151. doi: 10.1146/annurev-genom-082908-145957
Ng, S. B., Turner, E. H., Robertson, P. D., Flygare, S. D., Bigham, A. W., Lee, C., et al. (2009). Targeted capture and massively parallel sequencing of 12 human exomes. Nature 461, 272–276. doi: 10.1038/nature08250
Oakley, T. H., Wolfe, J. M., Lindgren, A. R., and Zaharoff, A. K. (2012). Phylotranscriptomics to bring the understudied into the fold: monophyletic ostracoda, fossil placement and pancrustacean phylogeny. Mol. Biol. Evol. 30, 215–233. doi: 10.1093/molbev/mss216
Olofsson, J. K., Cantera, I., Paer, C. V. D., Hong-Wa, C., Zedane, L., Dunning, L. T., et al. (2019). Phylogenomics using low-depth whole genome sequencing: a case study with the olive tribe. Mol. Ecol. Resour. 19, 877–892. doi: 10.1111/1755-0998.13016
Peakall, R., Wong, D., Phillips, R. D., Ruibal, M., Eyles, R., Rodriguez-Delgado, C., et al. (2021). A multitiered sequence capture strategy spanning broad evolutionary scales: application for phylogenetic and phylogeographic studies of orchids. Mol. Ecol. Resour. 21, 1118–1140. doi: 10.1111/1755-0998.13327
Peñalba, J. V., Smith, L. L., Tonione, M. A., Sass, C., Hykin, S. M., Skipwith, P. L., et al. (2014). Sequence capture using PCR-generated probes: a cost-effective method of targeted high-throughput sequencing for nonmodel organisms. Mol. Ecol. Resour. 14, 1000–1010. doi: 10.1111/1755-0998.12249
Portik, D. M., Smith, L. L., and Bi, K. (2016). An evaluation of transcriptome-based exon capture for frog phylogenomics across multiple scales of divergence (Class: Amphibia, Order: Anura). Mol. Ecol. Resour. 16, 1069–1083. doi: 10.1111/1755-0998.12541
Puritz, J. B., and Lotterhos, K. E. (2018). Expressed exome capture sequencing: a method for cost-effective exome sequencing for all organisms. Mol. Ecol. Resour. 18, 1209–1222. doi: 10.1111/1755-0998.12905
Pyron, R. A., Burbrink, F. T., Colli, G. R., de Oca, A. N., Vitt, L. J., Kuczynski, C. A., et al. (2011). The phylogeny of advanced snakes (Colubroidea), with discovery of a new subfamily and comparison of support methods for likelihood trees. Mol. Phylogenet. Evol. 58, 329–342. doi: 10.1016/j.ympev.2010.11.006
Pyron, R. A., Burbrink, F. T., and Wiens, J. J. (2013). A phylogeny and revised classification of Squamata, including 4161 species of lizards and snakes. BMC Evol. Biol. 13:93. doi: 10.1186/1471-2148-13-93
Pyron, R. A., Hendry, C. R., Chou, V. M., Lemmon, E. M., Lemmo, A. R., and Burbrink, F. T. (2014). Effectiveness of phylogenomic data and coalescent species-tree methods for resolving difficult nodes in the phylogeny of advanced snakes (Serpentes: Caenophidia). Mol. Phylogenet. Evol. 81, 221–231. doi: 10.1016/j.ympev.2014.08.023
Quek, R. Z. B., Jain, S. S., Neo, M. L., Rouse, G. W., and Huang, D. W. (2020). Transcriptome-based target-enrichment baits for stony corals (Cnidaria: Anthozoa: Scleractinia). Mol. Ecol. Resour. 20, 807–818. doi: 10.1111/1755-0998.13150
Reddy, S., Kimball, R. T., Pandey, A., Hosner, P. A., Braun, M. J., Hackett, S. J., et al. (2017). Why do phylogenomic data sets yield conflicting trees? Data type influences the Avian tree of life more than taxon sampling. Syst. Biol. 66, 857–879. doi: 10.1093/sysbio/syx041
Robinson, D. F., and Foulds, L. R. (1981). Comparison of phylogenetic trees. Math. Biosci. 53, 131–147. doi: 10.1016/0025-5564(81)90043-2
Schmid, S., Genevest, R., Gobet, E., Suchan, T., Sperisen, C., Tinner, W., et al. (2017). HyRAD-X, a versatile method combining exome capture and RAD sequencing to extract genomic information from ancient DNA. Methods Ecol. Evol. 8, 1374–1388. doi: 10.1111/2041-210X.12785
Singhal, S., Grundler, M., Colli, G., and Rabosky, D. L. (2017). Squamate Conserved Loci (SqCL): a unified set of conserved loci for phylogenomics and population genetics of squamate reptiles. Mol. Ecol. Resour. 17, e12–e14. doi: 10.1111/1755-0998.12681
Slater, G. S. C., and Birney, E. (2005). Automated generation of heuristics for biological sequence comparison. BMC Bioinform. 6:31. doi: 10.1186/1471-2105-6-31
Song, S., Liu, L., Edwards, S. V., and Wu, S. (2012). Resolving conflict in eutherian mammal phylogeny using phylogenomics and the multispecies coalescent model. Proc. Natl. Acad. Sci. U.S.A. 109, 14942–14947. doi: 10.1073/pnas.1211733109
Stamatakis, A. (2014). RAxML version 8: a tool for phylogenetic analysis and post-analysis of large phylogenies. Bioinformatics 30, 1312–1313. doi: 10.1093/bioinformatics/btu033
Suchan, T., Pitteloud, C., Gerasimova, N. S., Kostikova, A., Schmid, S., Arrigo, N., et al. (2016). Hybridization capture using RAD probes (hyRAD), a new tool for performing genomic analyses on collection specimens. PLoS One 11:e0151651. doi: 10.1371/journal.pone.0151651
Wang, Z., Gerstein, M., and Snyder, M. (2009). RNA-seq: a revolutionary tool for transcriptomics. Nat. Rev. Genet. 10, 57–63. doi: 10.1038/nrg2484
Wickett, N. J., Mirarab, S., Nguyen, N., Warnow, T., Carpenter, E., Matasci, N., et al. (2014). Phylotranscriptomic analysis of the origin and early diversification of land plants. Proc. Natl. Acad. Sci. U.S.A. 111, E4859–E4868. doi: 10.1073/pnas.1323926111
Zaher, H., Murphy, R. W., Arredondo, J. C., Graboski, R., Machado-Filho, P. R., Mahlow, K., et al. (2019). Large-scale molecular phylogeny, morphology, divergence-time estimation, and the fossil record of advanced caenophidian snakes (Squamata: Serpentes). PLoS One 14:e0216148. doi: 10.1371/journal.pone.0216148
Zhang, F., Ding, Y., Zhu, C., Zhou, X., Orr, M. C., Scheu, S., et al. (2019). Phylogenomics from low-coverage whole-genome sequencing. Methods Ecol. Evol. 10, 507–517. doi: 10.1111/2041-210X.13145
Zhang, Y., Deng, S., Liang, D., and Zhang, P. (2019). Sequence capture across large phylogenetic scales by using pooled PCR–generated baits: a case study of Lepidoptera. Mol. Ecol. Resour. 19, 1037–1051. doi: 10.1111/1755-0998.13026
Keywords: high-throughput sequencing, sequence capture, transcriptome, snake, phylogeny
Citation: Li JX, Liang D and Zhang P (2022) Simultaneously collecting coding and non-coding phylogenomic data using homemade full-length cDNA probes, tested by resolving the high-level relationships of Colubridae. Front. Ecol. Evol. 10:969581. doi: 10.3389/fevo.2022.969581
Received: 15 June 2022; Accepted: 01 August 2022;
Published: 23 August 2022.
Edited by:
Diego San Mauro, Complutense University of Madrid, SpainReviewed by:
David Vieites, Spanish National Research Council (CSIC), SpainAlex Figueroa, University of New Orleans, United States
Copyright © 2022 Li, Liang and Zhang. This is an open-access article distributed under the terms of the Creative Commons Attribution License (CC BY). The use, distribution or reproduction in other forums is permitted, provided the original author(s) and the copyright owner(s) are credited and that the original publication in this journal is cited, in accordance with accepted academic practice. No use, distribution or reproduction is permitted which does not comply with these terms.
*Correspondence: Peng Zhang, emhhbmdwMzVAbWFpbC5zeXN1LmVkdS5jbg==