- School of Business Administration, Dongbei University of Finance and Economics, Dalian, China
In order to explore how the marine economy can realize the new growth point of economic development, this study puts forward a research method based on the internal mechanism and path of the new growth point of marine economic development. This method recommends key technical problems and solutions based on the research method of the internal mechanism and path of developing new growth points, amphibious science that further integrates, ecological, and socialized theory and application and explores the internal mechanism and path of how the marine economy realizes the new growth points of economic development. The research shows that the research on the internal mechanism and path of developing new growth points has increased the marine economy by nearly 45%, deeply analyzes the internal relationship between coastal economic growth and marine pollution, the close relationship between marine resources development and marine economic growth, and briefly summarizes the marine economic growth path against the background of the adjustment and change of marine industrial structure.
Introduction
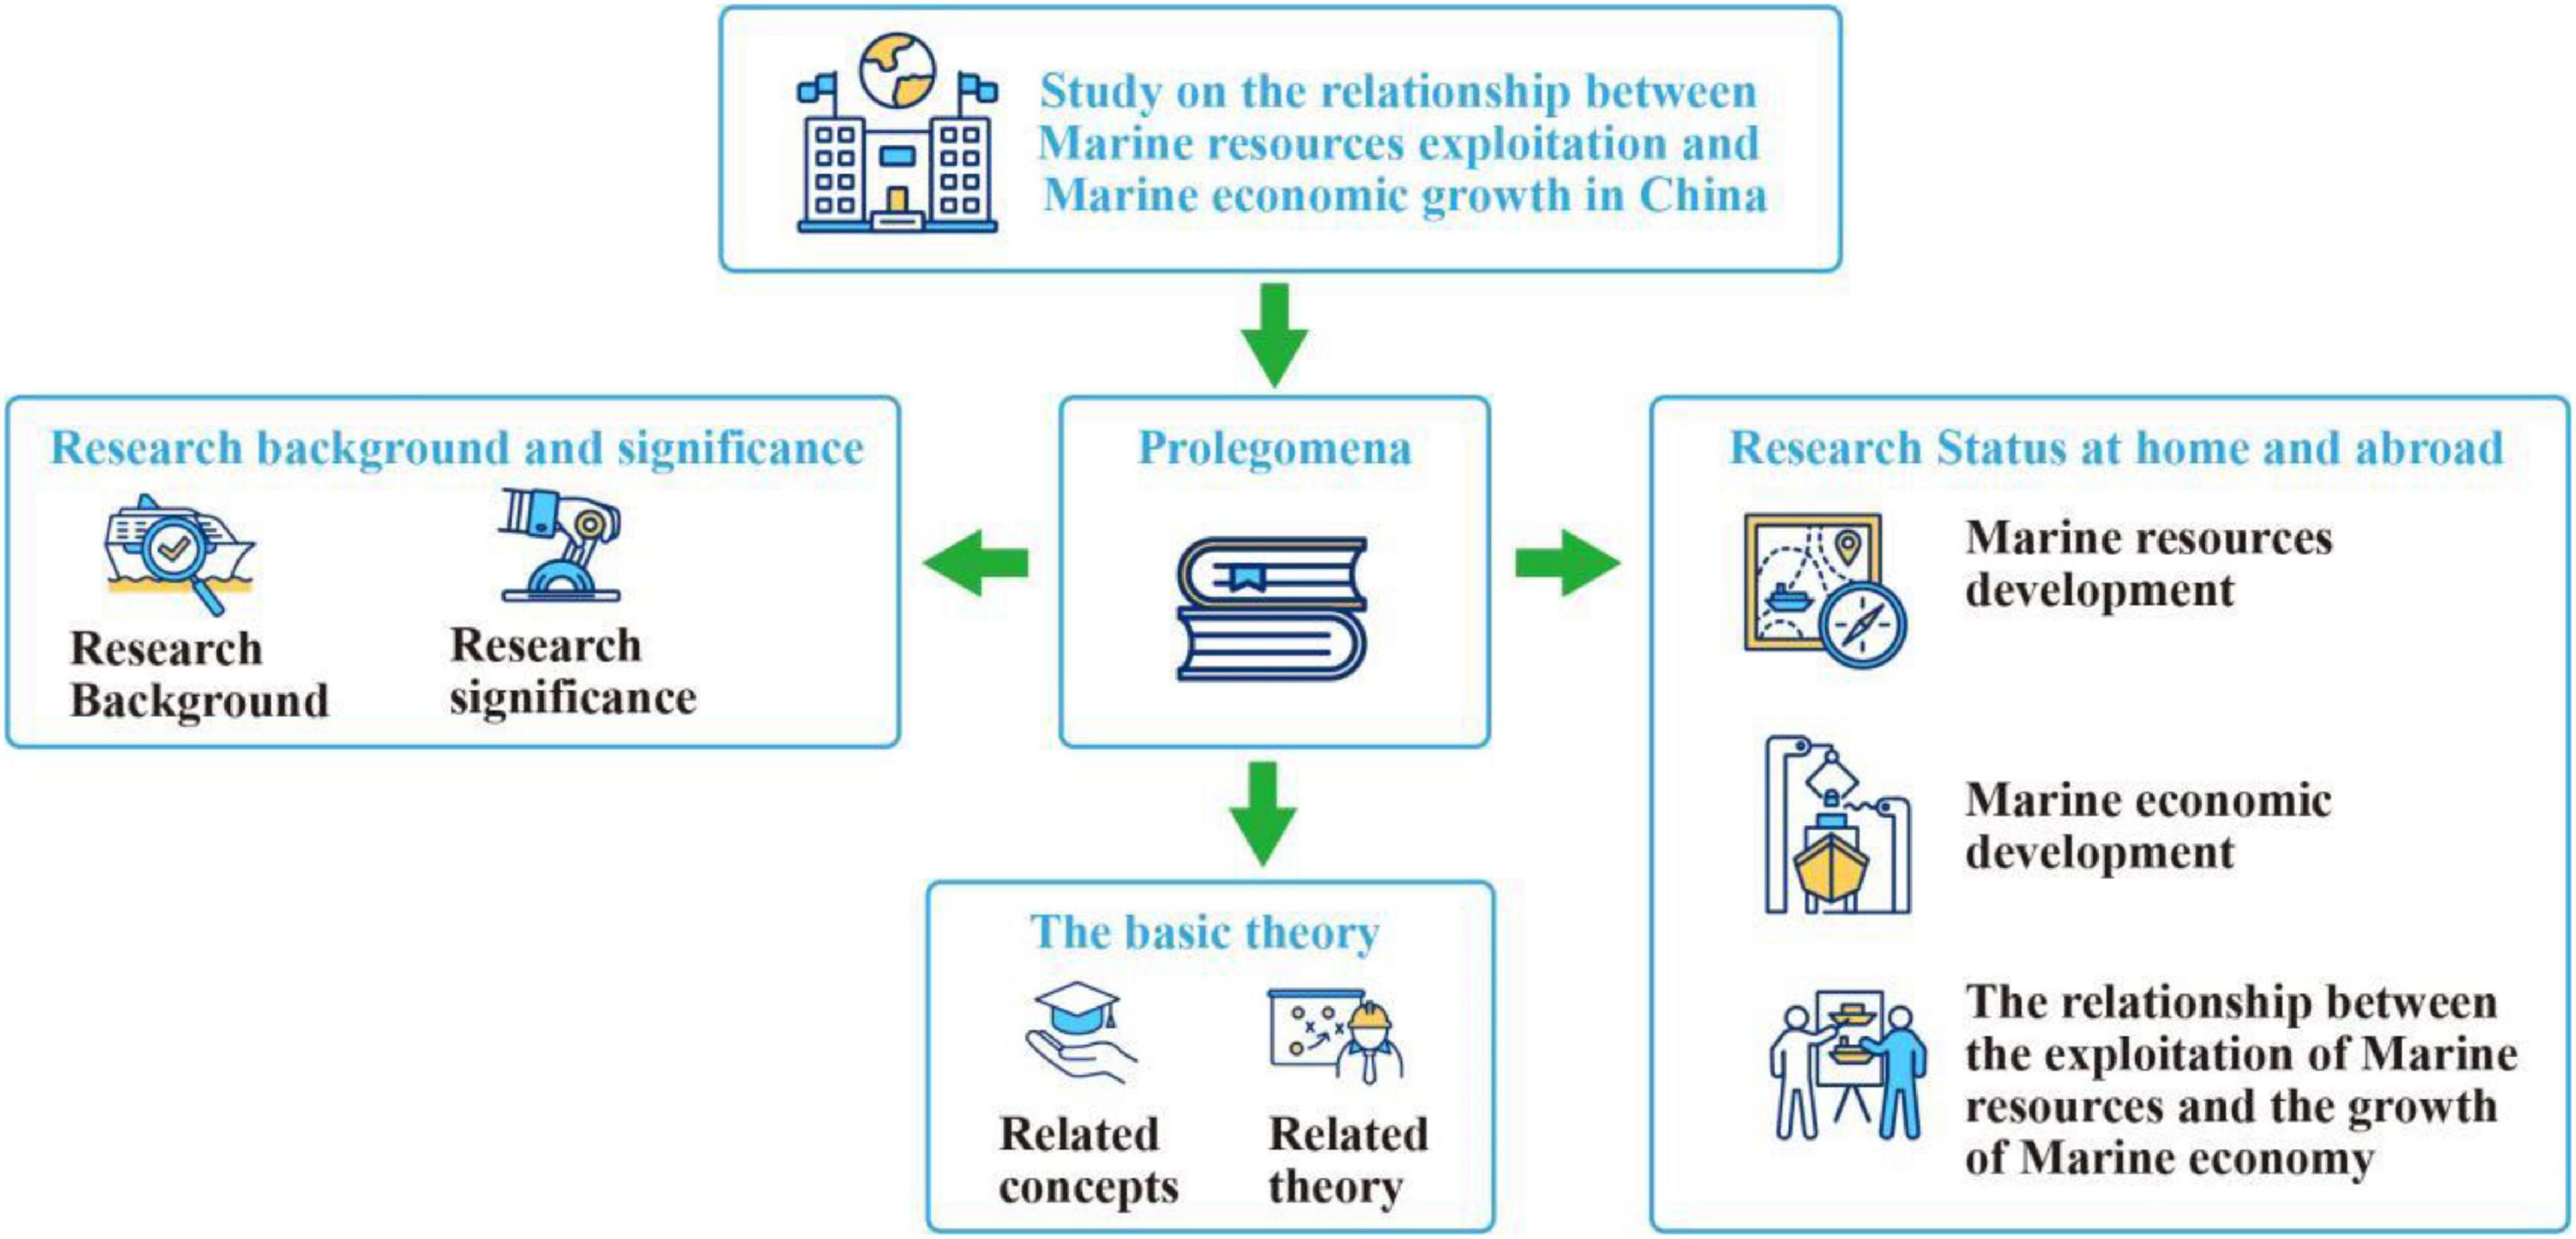
The 21st century is the century of maritime trade, and the sea is a key concept for improving relations. Since entering the new century, my country has attached great importance to the development and construction of the shipping industry, and the shipping industry has gradually become one of the key points of domestic economic growth (Kirichenko and Smirnov, 2021). Behavioral and ecological science appeared in 1960 and has made great progress, making geographic decision-making and forecasting more realistic, thus making geographic research behavioral; with the emergence of global problems, geographic research has gradually formed an ecological trend. With the emergence of new technologies and new methods, geography will be an amphibious science that further integrates, ecological, and social theory and application on the basis of theory and quantification. And in view of the previous research foundation, the advantages and disadvantages of development, the development of modern geography should break the situation that has been formed for a long time, which is conducive to the penetration and intersection of geography and other disciplines, and absorbs the strengths of various disciplines and new theories and methods. From a systematic perspective, it studies the impact, adaptability, regulation and transformation of human beings on environmental changes, as well as the methodology for the study of human-land relationship regional systems. With the approval and continued implementation of carbon monoxide and carbon neutrality policies, there is an increased focus on improving community health and well-being. With the destruction of the coastal environment, frequent marine disasters, and marine climate change, the implementation of carbon neutralization strategy is very important. The essence of carbon neutralization is to continuously promote the innovation and transformation of industrial structure through institutional innovation and technological innovation, further optimize the energy structure, and gradually realize the purpose of carbon neutralization by changing the pattern of high carbon emission of traditional energy. However, the conclusions reached by the indicator systems constructed by scholars are not consistent at the same time. Under this background, the development of marine economy must identify new growth points, deeply integrate the objectives of carbon peaking and carbon neutralization policies, strengthen the innovation and upgrading of economic growth mode, and gradually realize the transformation of low-carbon economy in the marine field. The technical route is shown in Figure 1 (Krasnoyarova and Krotov, 2020).
Literature review
Marine economic development research is accompanied by marine development experience. As marine economic activity continues to grow, so does marine economic research (Li, 2022b). The research on “marine economy” and its development in the United States mainly shows the following characteristics: it has not formed a perfect theoretical system, and failed to investigate the relationship and interaction of marine economic activities from an overall perspective. There is less discussion on “marine economy,” and the researchers focus on the relevant research of Marine Industrial Economics (Wu and Zhou, 2021). Researchers pay more attention to the medium and micro level of marine economy, focusing on the phenomenon analysis of marine economy and the framework guidance of marine development. Therefore, they are more inclined to study the micro behavior and optimal decision-making with strong explanatory power on the causes of total amount phenomenon, and pay more attention to the research on marine economy and integrated management of coastal zone (Li, 2022a). The tendency to link the research of marine economy with government decision-making is particularly obvious in the 21st century. With the deepening of countries’ attention to marine rights and interests, more and more countries and regions try to occupy an advantageous position in the international marine competition by formulating marine development plans. Marine Economic Research in the 21st century has gradually shifted from spontaneous research to comprehensive academic behavior led by the government, and the research on Marine Spatial Planning and spatial differences is also more concentrated (Zhou et al., 2021).
Compared with the research in the United States, the research on the development of the marine industry in my country started relatively late. Some scientists first coined the term “marine industry.” Since then, my country’s marine industry research has gone through the following stages: the first stage of marine economic research (Tahirovi, 2020). At this stage, the discipline of marine industry has not been fully developed. Scientists often combine the study of the marine industry with the study of the terrestrial economy, while the study of the marine industry is still in its “nascent stage.” Most of the research focuses on the issues of traditional marine industry, and there is less theoretical research on marine industry, and more emphasis is placed on simple issues such as interpretation of marine industry, subject teaching and research concepts. In the embryonic stage of marine economy, timeliness research, theory and practice are relatively weak (He and Kusiak, 2017). Since 1990, with the rapid development of maritime science and technology in the world and the rapid development of my country’s shipping industry, people have attached great importance to the improvement of implementation opportunities and carried out research on the maritime industry. At the same time, in the stage of marine economic development, Chinese scholars conducted in-depth research on western economic ideas and methods, and began to try to apply land economic theory to marine economic research, and the basic framework of marine economic research began to take shape (Glazyrina and Latysheva, 2021). With the rapid development of modern marine science and technology, the main activities of China’s marine economy have gradually shifted from the traditional development and utilization of marine resources to the deep-seated and comprehensive development and utilization of marine resources relying on marine technology. The United States statistical data comes from the United States National Ocean Economic Monitoring System (ENOW), which is in charge of the NOAA (National Oceanic and Atmospheric Administration) Ocean Service Center, which has been in charge of the United States ocean economic statistics since 2005.” Access to United States marine economic data from 2005 to 2015 in the ENOW system. In addition, pay more attention to the research on the spatial layout and evolution of marine industry and the related propositions of the sustainable development of marine economy. Marine economics is no longer limited to the scope of Applied Economics, and relevant scholars have more integrated it with theoretical economics and resource and environmental economics (Li et al., 2021c).
Method
Comprehensive index level measurement of marine resources development
Measure method
Due to the large differences between provinces and regions in the calculation of the comprehensive index of marine resources development, in order to eliminate the influence of other invalid elements on the calculation results, first of all, unified and standardized data processing was carried out, and the processing formula is shown in Equation 1 and Equation 2:
Equation 1 is the standardized formula for positive indicators, and Equation 2 is the standardized formula for negative indicators. Comprehensively considering the natural attributes of marine resources, objective weighting method is selected for weighting (Teremetskyi et al., 2021). The specific weighting method is shown in Equation 3 and Equation 4:
The entropy of the i-th evaluation index is:
Where:
Then the entropy weight of the evaluation value object is shown in Equation 5:
Fuzzy relative membership model based on entropy weight
An indeterminate mathematical model of relative membership is introduced. Establish an evaluation matrix of relative membership degree of marine resources comprehensive development index based on uncertainty set configuration, and the comprehensive index of China’s marine resources development is comprehensively evaluated in combination with the entropy weight method. Let the fuzzy concept on the universe U, for any element u on U, u = u, u has the attraction property, the relative membership of A is μA(u), and the relative membership of A′ is , as shown in Equation 6 and Equation 7.
And:
The fuzzy variable set of universe U is F, as shown in Equation 8.
Where D is the relative difference function. As shown in Equation 9.
Relative difference function model. As shown in Equation 10.
Let the above equation be the attraction domain of V on the real axis, as shown in Equation 11.
The above equation is the interval of an upper and lower bound range containing x0(x0 ∈ X). x is the value of any point in the X interval, so when x falls to the right of point M, its relative difference function model is shown in Equation 12.
When x falls to the left of point M, the relative difference function model is shown in Equation 13.
When x falls outside the range area [c,d], as shown in Equation 14.
Where β is a non-negative index (usually 1), then as shown in Equation 15.
Therefore, when DA(u) is determined, the relative membership degree uA(u) can be solved according to Equation 15. On this basis, the weight w of each index is determined by entropy weight method, and establish an overall evaluation matrix, as shown in Equation 16 (Lee, 2020; Li et al., 2021b).
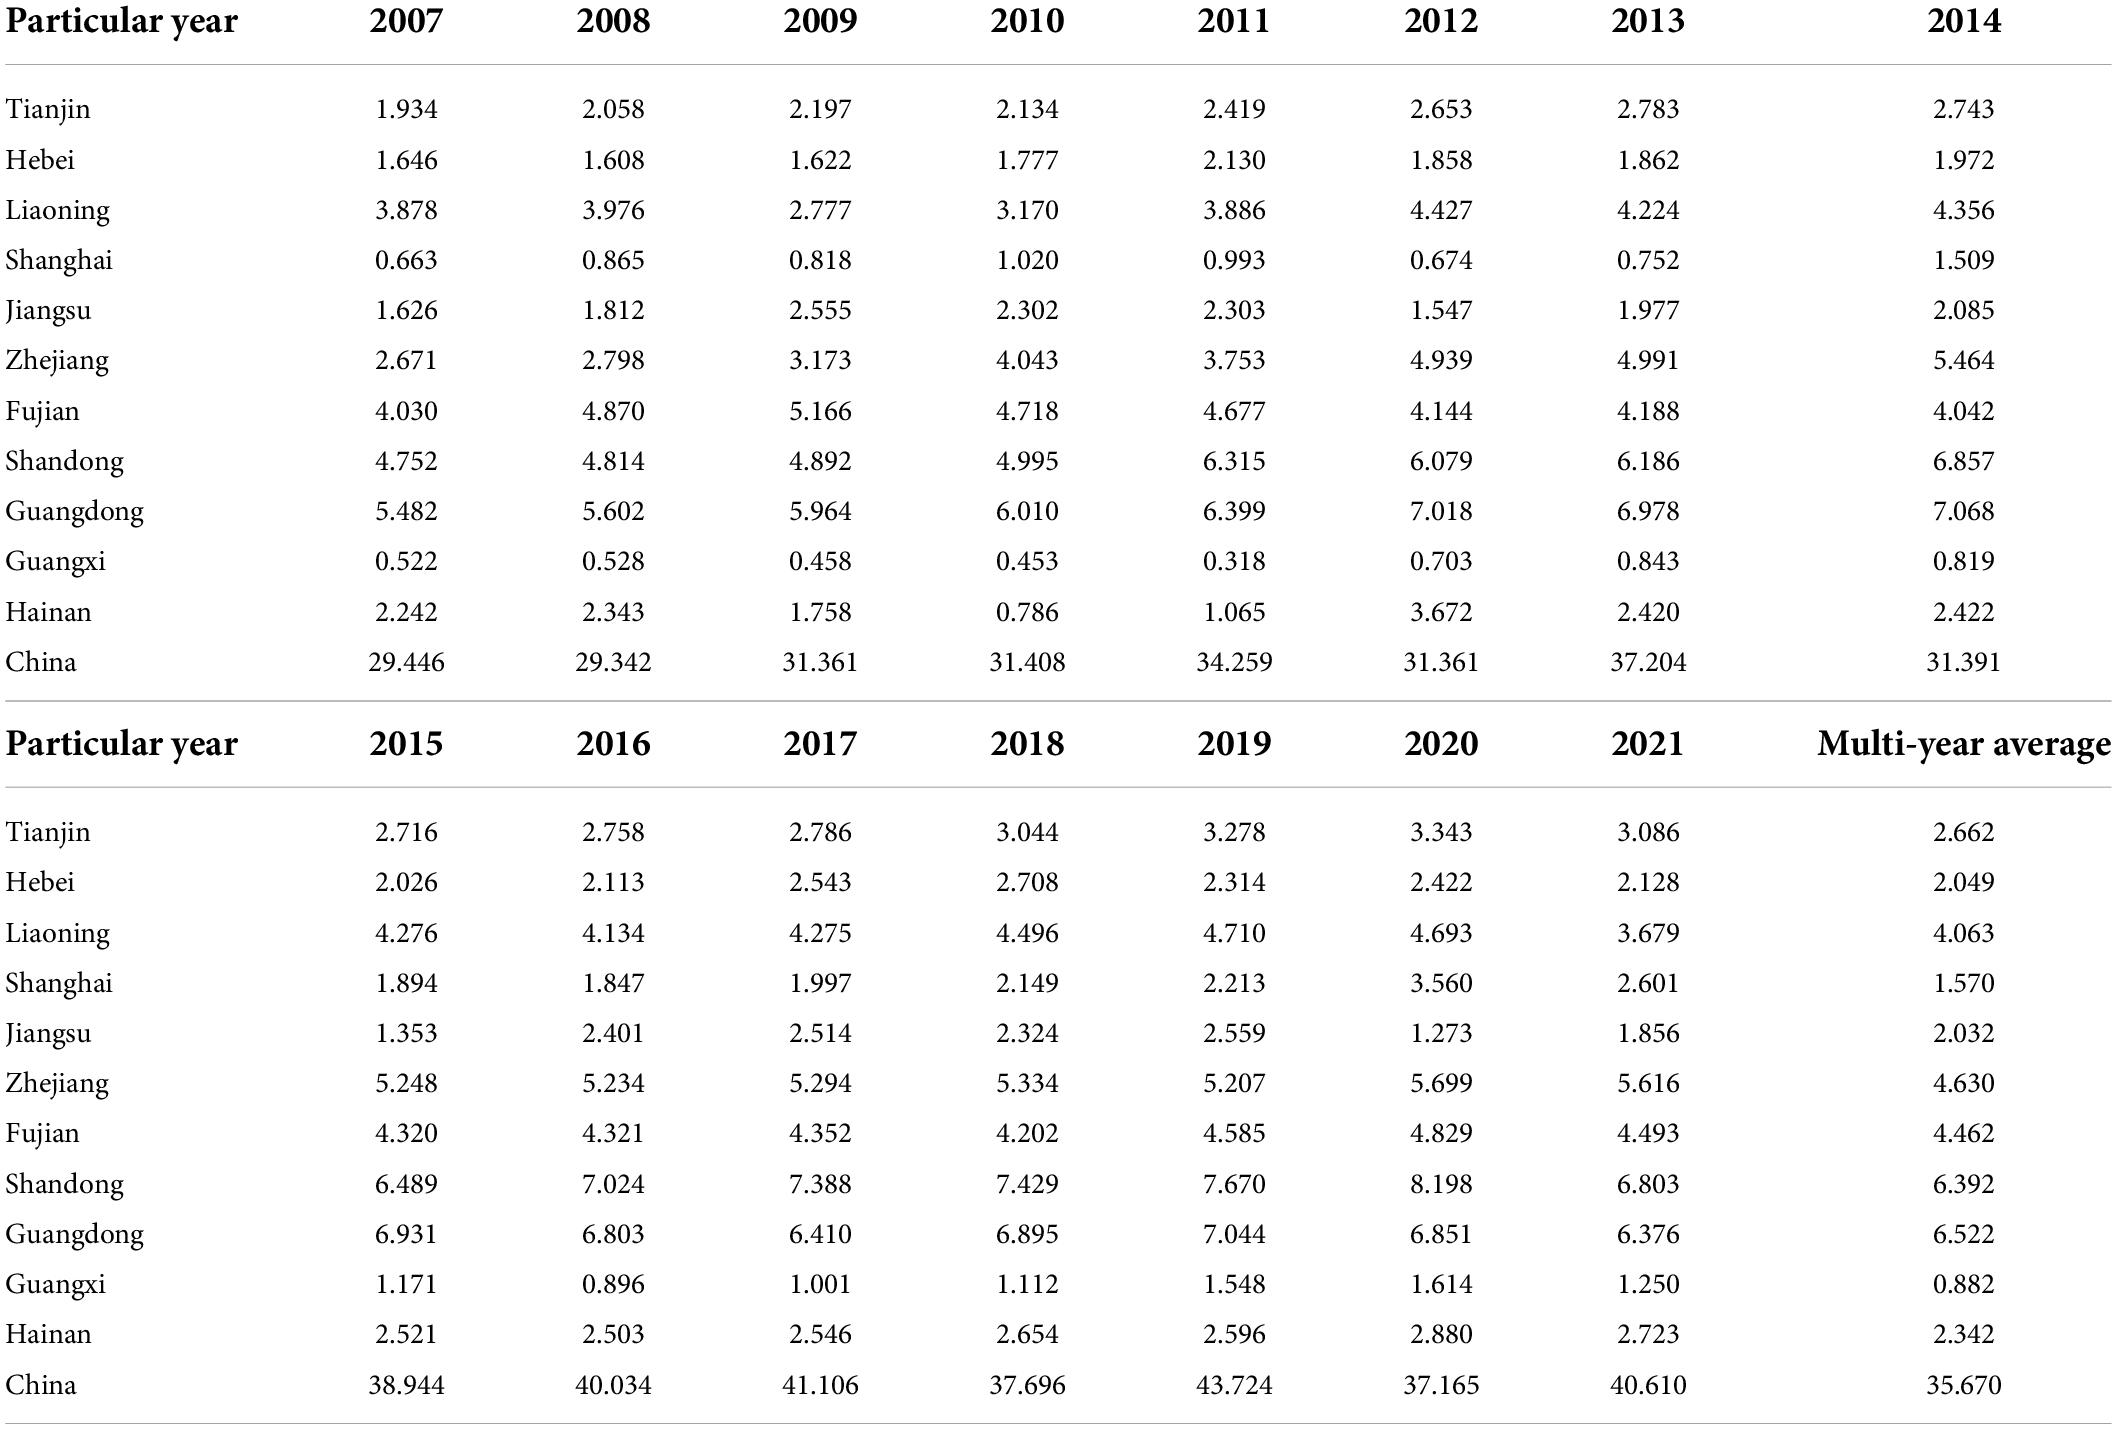
Using uncertain relative entropy-based member rankings, a comprehensive marine resource development index was calculated for 11 coastal provinces in China from 2007 to 2021, and the comprehensive index of marine resources development of various coastal provinces and regions in China is obtained (Table 1).
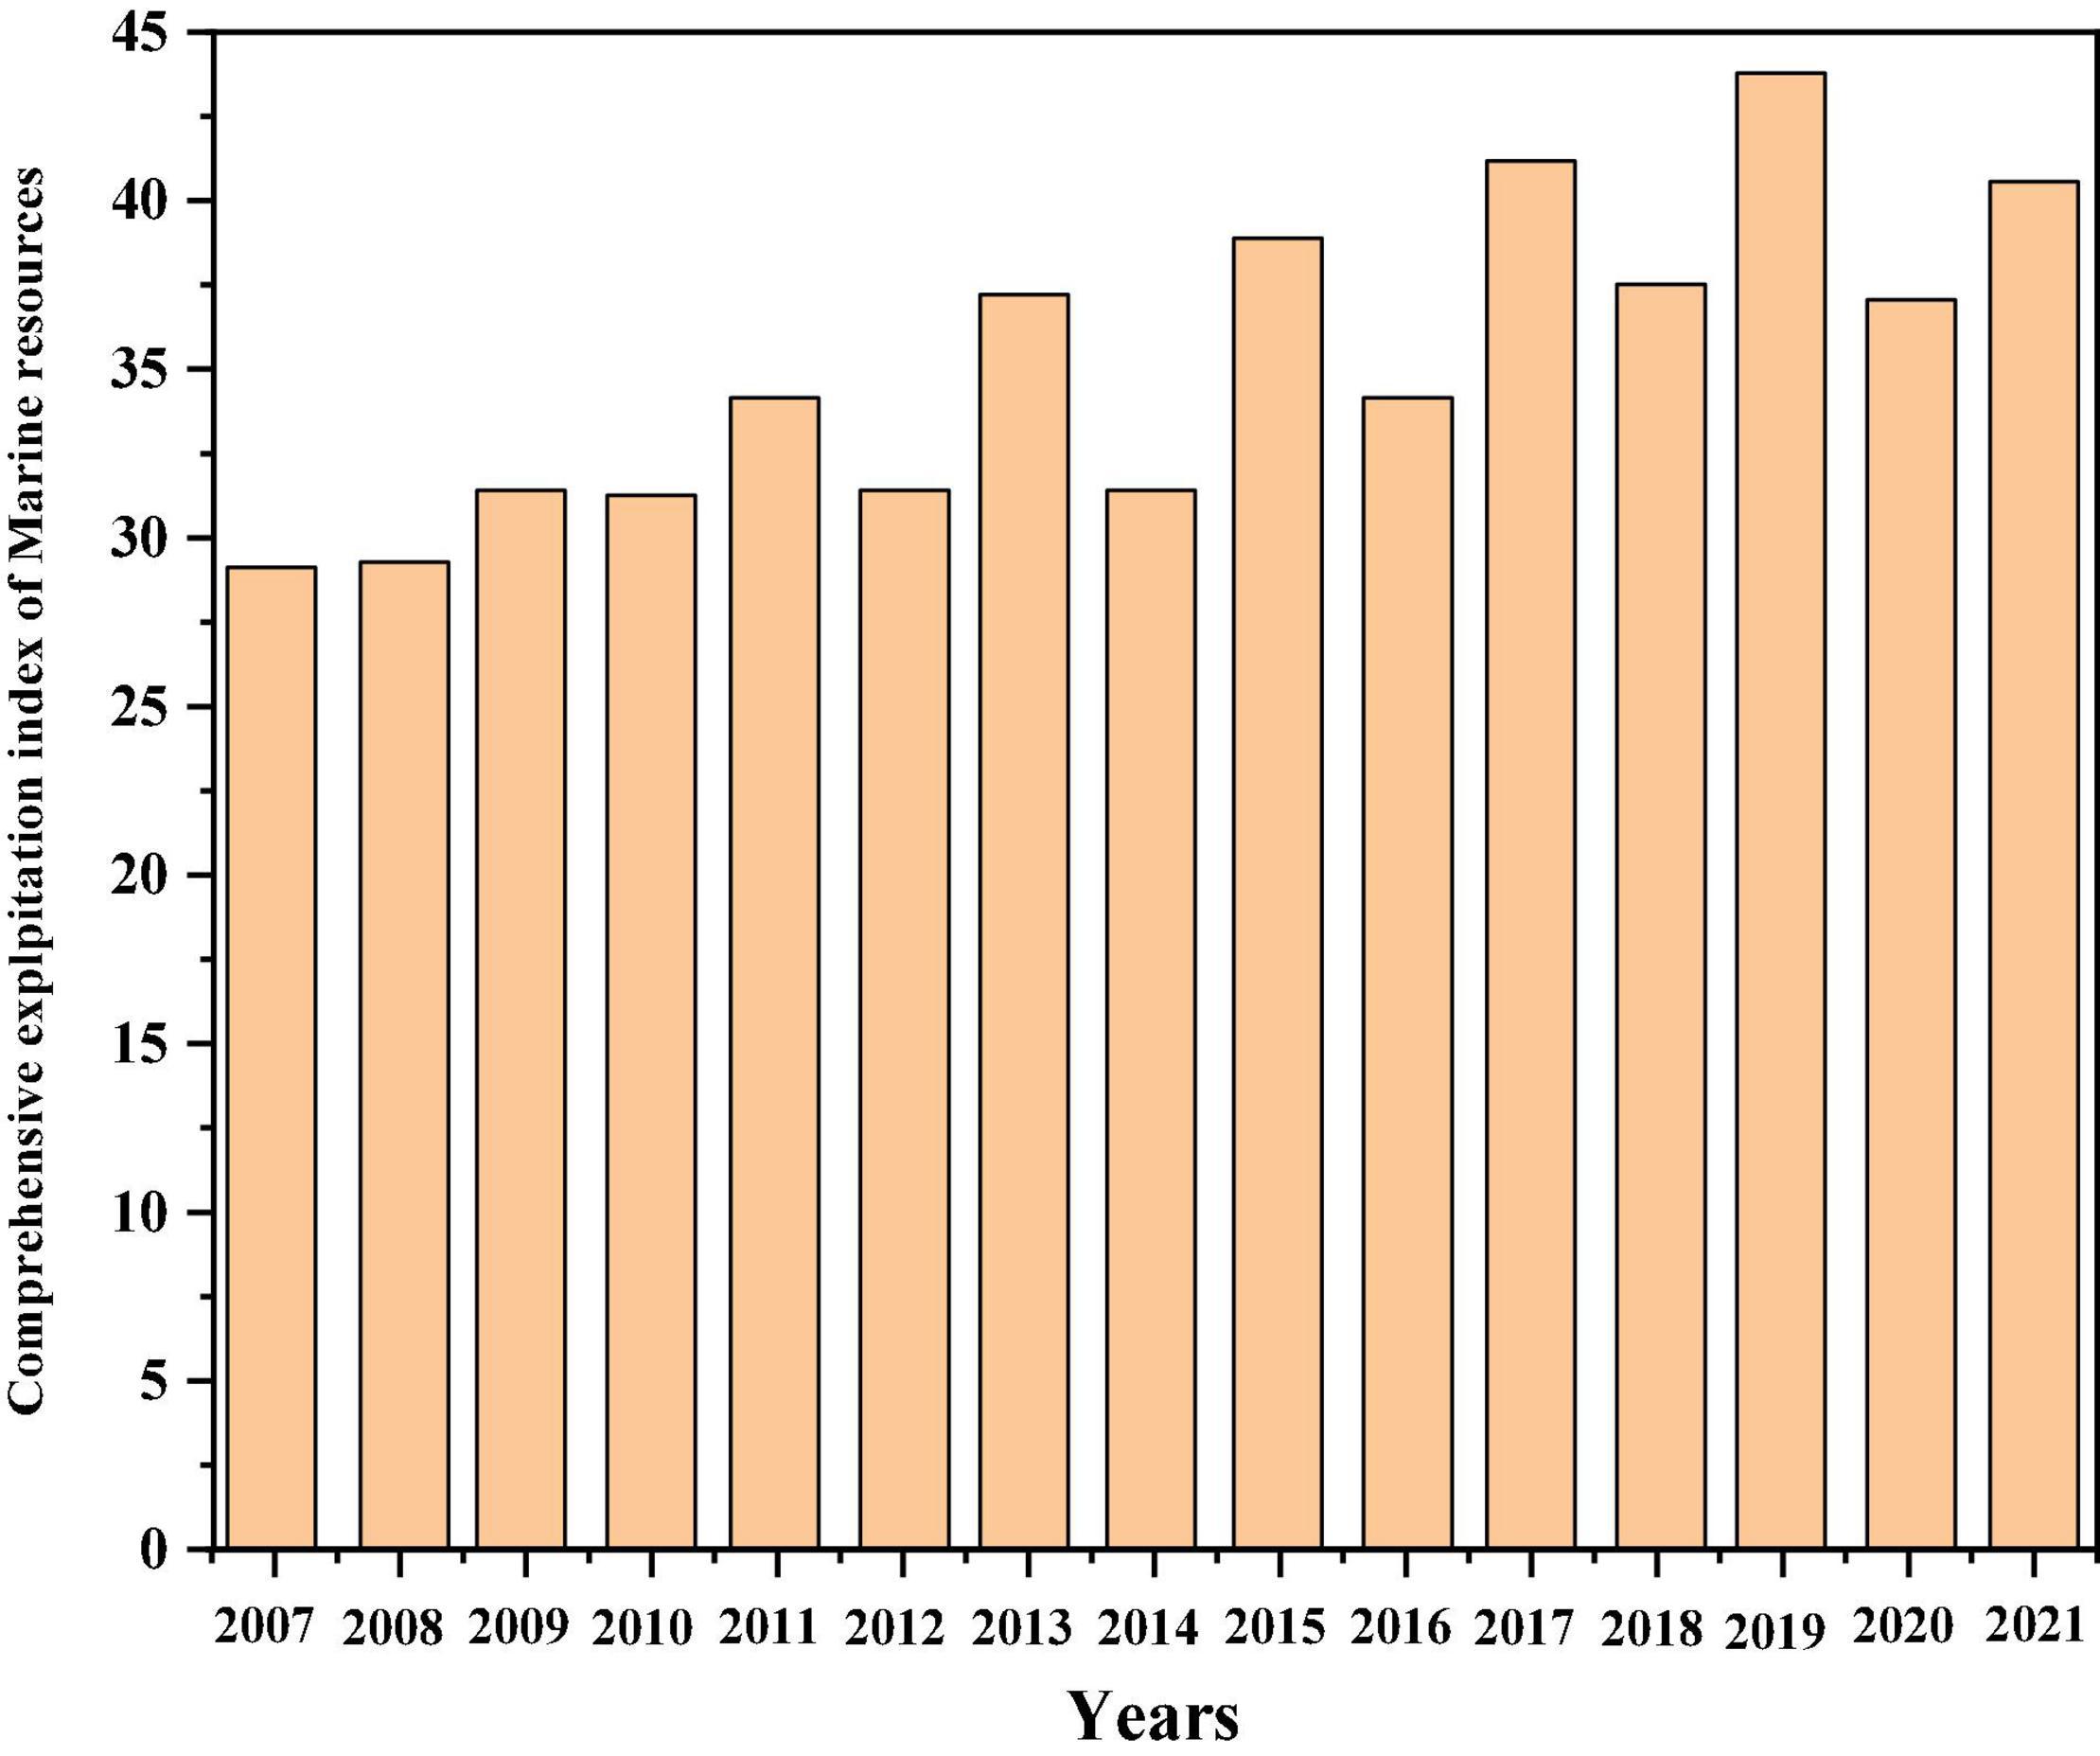
Modern geography includes not only physical geography and human geography, but also geographic information science; in its development, it not only strengthens the comprehensiveness within the discipline, but also actively penetrates and integrates with related disciplines. Due to the overlapping of geographical and ecological research objects, the similarity of research methods, and the similarity of research contents, these two disciplines are bound to be interrelated. Through the overall estimation of the development of marine resources in 11 coastal provinces in China from 2007 to 2021, including the development of marine resources in tidal zones in China from 2007 to 2021, the 2007–2021 marine resource development index can be obtained (Li et al., 2022; Figure 2).
Figure 2 shows that with the rapid growth of China’s marine economy, China’s marine resources will continue to deepen from 2007 to 2021, and the comprehensive index of marine resources development showed an obvious upward trend. Among them, from 2007 to 2011, the comprehensive growth index of my country’s marine resources increased from 29,446 to 34,259, showing a steady and slowing growth trend (Feng, 2022). From 2007 to 2017, China’s comprehensive index of marine resources development showed a fluctuating growth trend (Monares et al., 2020).
An empirical analysis of the relationship between marine resource development and marine economic development
Stationary test of sequence
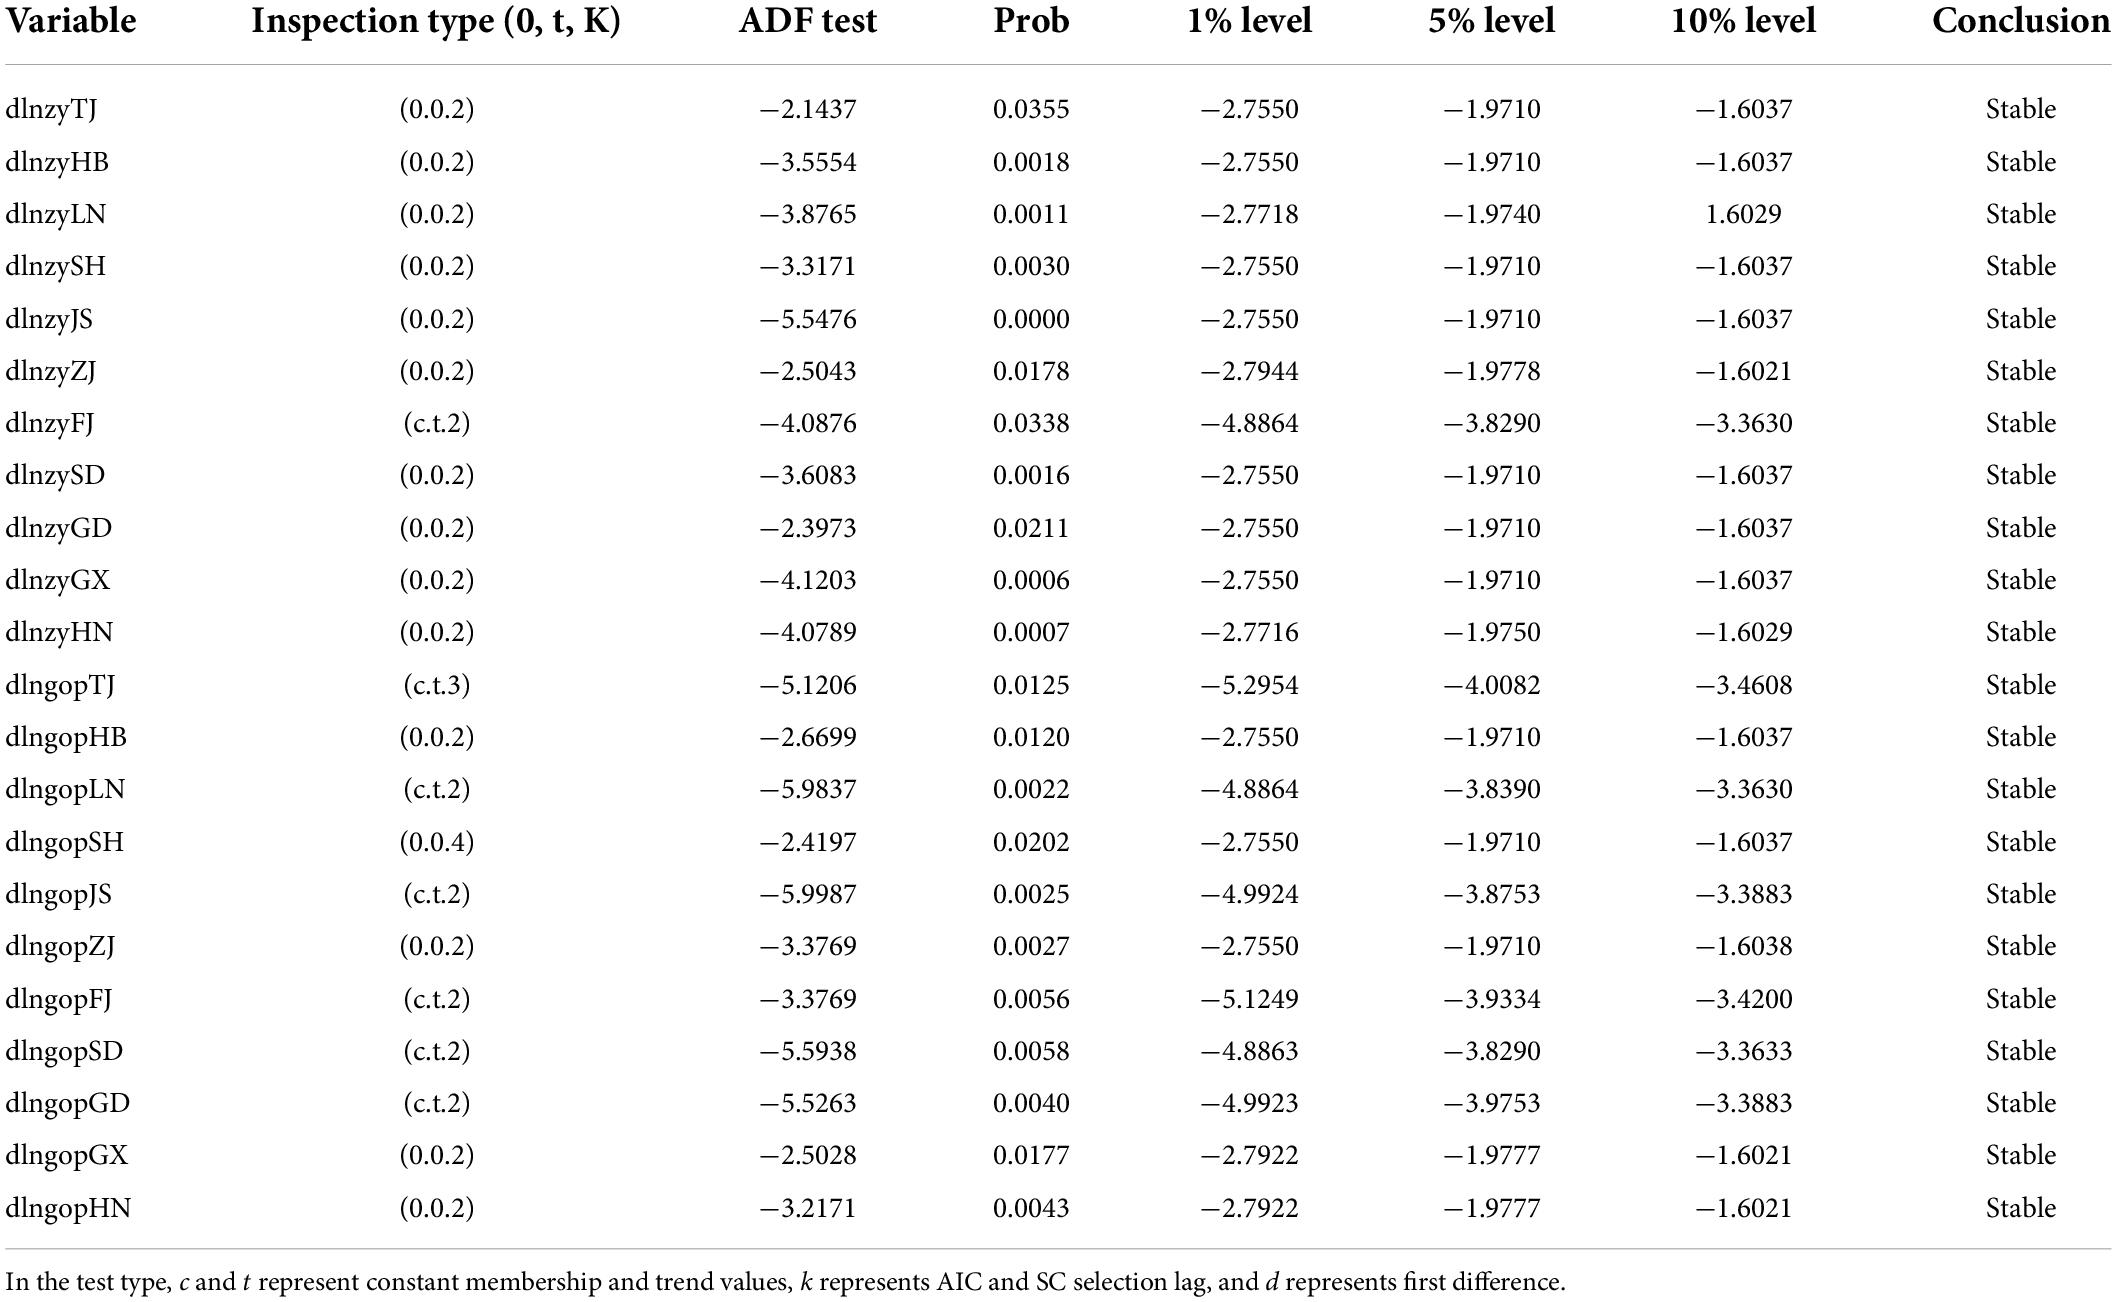
For the empirical analysis of the data, firstly, the stationarity test should be carried out for the intercepted data. If the time series tested does not have unit root, the series is stable, otherwise the time series data is an unstable series, and the results are shown in Table 2. The original assumption is rejected when the variables are in the first-order difference, that is, the variables become stationary series after the first-order difference (Table 2).
As mentioned above, the disturbance of the unit change of each variable to the whole system through its internal relationship and the comprehensive reflection of each variable to these disturbances cannot be expressed through cointegration analysis (Khan and Salam, 2020). Impulse response function can measure the response of an endogenous variable to error shock and reveal the dynamic changes of variable interaction in multiple time periods. Based on the comprehensive work on the VAR model, this study discusses the short-term relationship between the development of China’s marine industry and the development of the marine industry, and determines the time-delay relationship between the dynamic response differences (Cui et al., 2021). Therefore, the influence of the exploitation of marine resources on the development of the marine industry is gradually weakening. The responses of the two were markedly different. According to the fluctuation type of impulse response, coastal provinces can be divided into two categories: fluctuation response and smooth response. In view of the different fluctuation types of the impact of marine resources development on marine economic growth in China’s coastal areas, the formulation of marine resources development strategies in coastal provinces and regions should be focused (Li et al., 2021d).
Measuring the intrinsic relationship between economic growth and ocean pollution
From 2005 to 2021, the per capita GDP of 11 coastal provinces and cities in China shows that economic growth is an indicator to measure economic growth. At the same time, based on the big data of solid waste disposal and direct discharge of wastewater, calculating the growth amount describes the nature of marine pollution in China (Tian et al., 2021). Explain the changing nature of the relationship between economic development and marine pollution in coastal areas, the “economic growth and marine pollution” system in China’s coastal areas is established by using the nonlinear msmh (m) - var (P) model, including the “Ecot” system developed by solid waste development and industrial development and the “liquid Ecot” system developed by wastewater development and industrial development. Using the “two-stage” nonlinear Markov government transition model, the economic development government divides the government into “low-growth regime” and “high-growth regime,” and calculates the dynamics of government transition. The dynamic evolution of marine pollution changes and the relationship between changes has the characteristics of stages (Huang and Wang, 2021). The ADF test method is used to test the stability characteristics of time series. The results show that the economic growth rate and marine pollution rate are stable at the significant level of 1%. The nonlinear msmh (m) - var (P) model according to the AIC and SC information criteria was developed using the Guass software with two field numbers and one lag series.
Based on the analysis of the continuous exchange policy between economic growth and marine pollution in my country’s coastal areas, this study examines the relationship between “industrial development and marine pollution” under the background of “low growth” and “high growth.” A study of the relationship between economic development, marine pollution and Haiti. Table 3 shows the correlation coefficient between “economic growth and marine pollution” in different development regions. The analysis of the correlation coefficient of “economic growth and marine pollution” listed in Table 3 shows that when the “solid Ecot” system is in the “low growth area system,” the growth rate of industrial solid waste discharge is negatively correlated with the economic growth rate, while in the “high growth zone system,” the growth rate of industrial solid waste emission is positively correlated with the economic growth rate. When the “liquid-ecosystem” system is in the “low-growth area system,” the growth rate of a large amount of direct effluent is positively correlated with the economic growth rate, while it is negatively correlated with the “high-growth area system.” It can be seen that “sustainable health development” model, and an economic development phenomenon of “pollution for growth” between China’s coastal economic growth and marine ecological environment protection, and the internal relationship between China’s economic growth and marine pollution will change with the transfer of different regional states (Chen et al., 2022; Table 3).

Table 3. Correlation coefficients between economic growth rate and marine pollution rate in China’s coastal areas in different growth area systems from 2005 to 2021.
Sections “Results and analysis” and “Conclusion” describe the benefits of the regional characterization of “Economic Development and Marine Pollution.” The results show that combining the “economic growth and marine pollution” of “release development zone” and “high growth zone,” each subsystem has the advantage of controlling the old growth zone (Table 4).
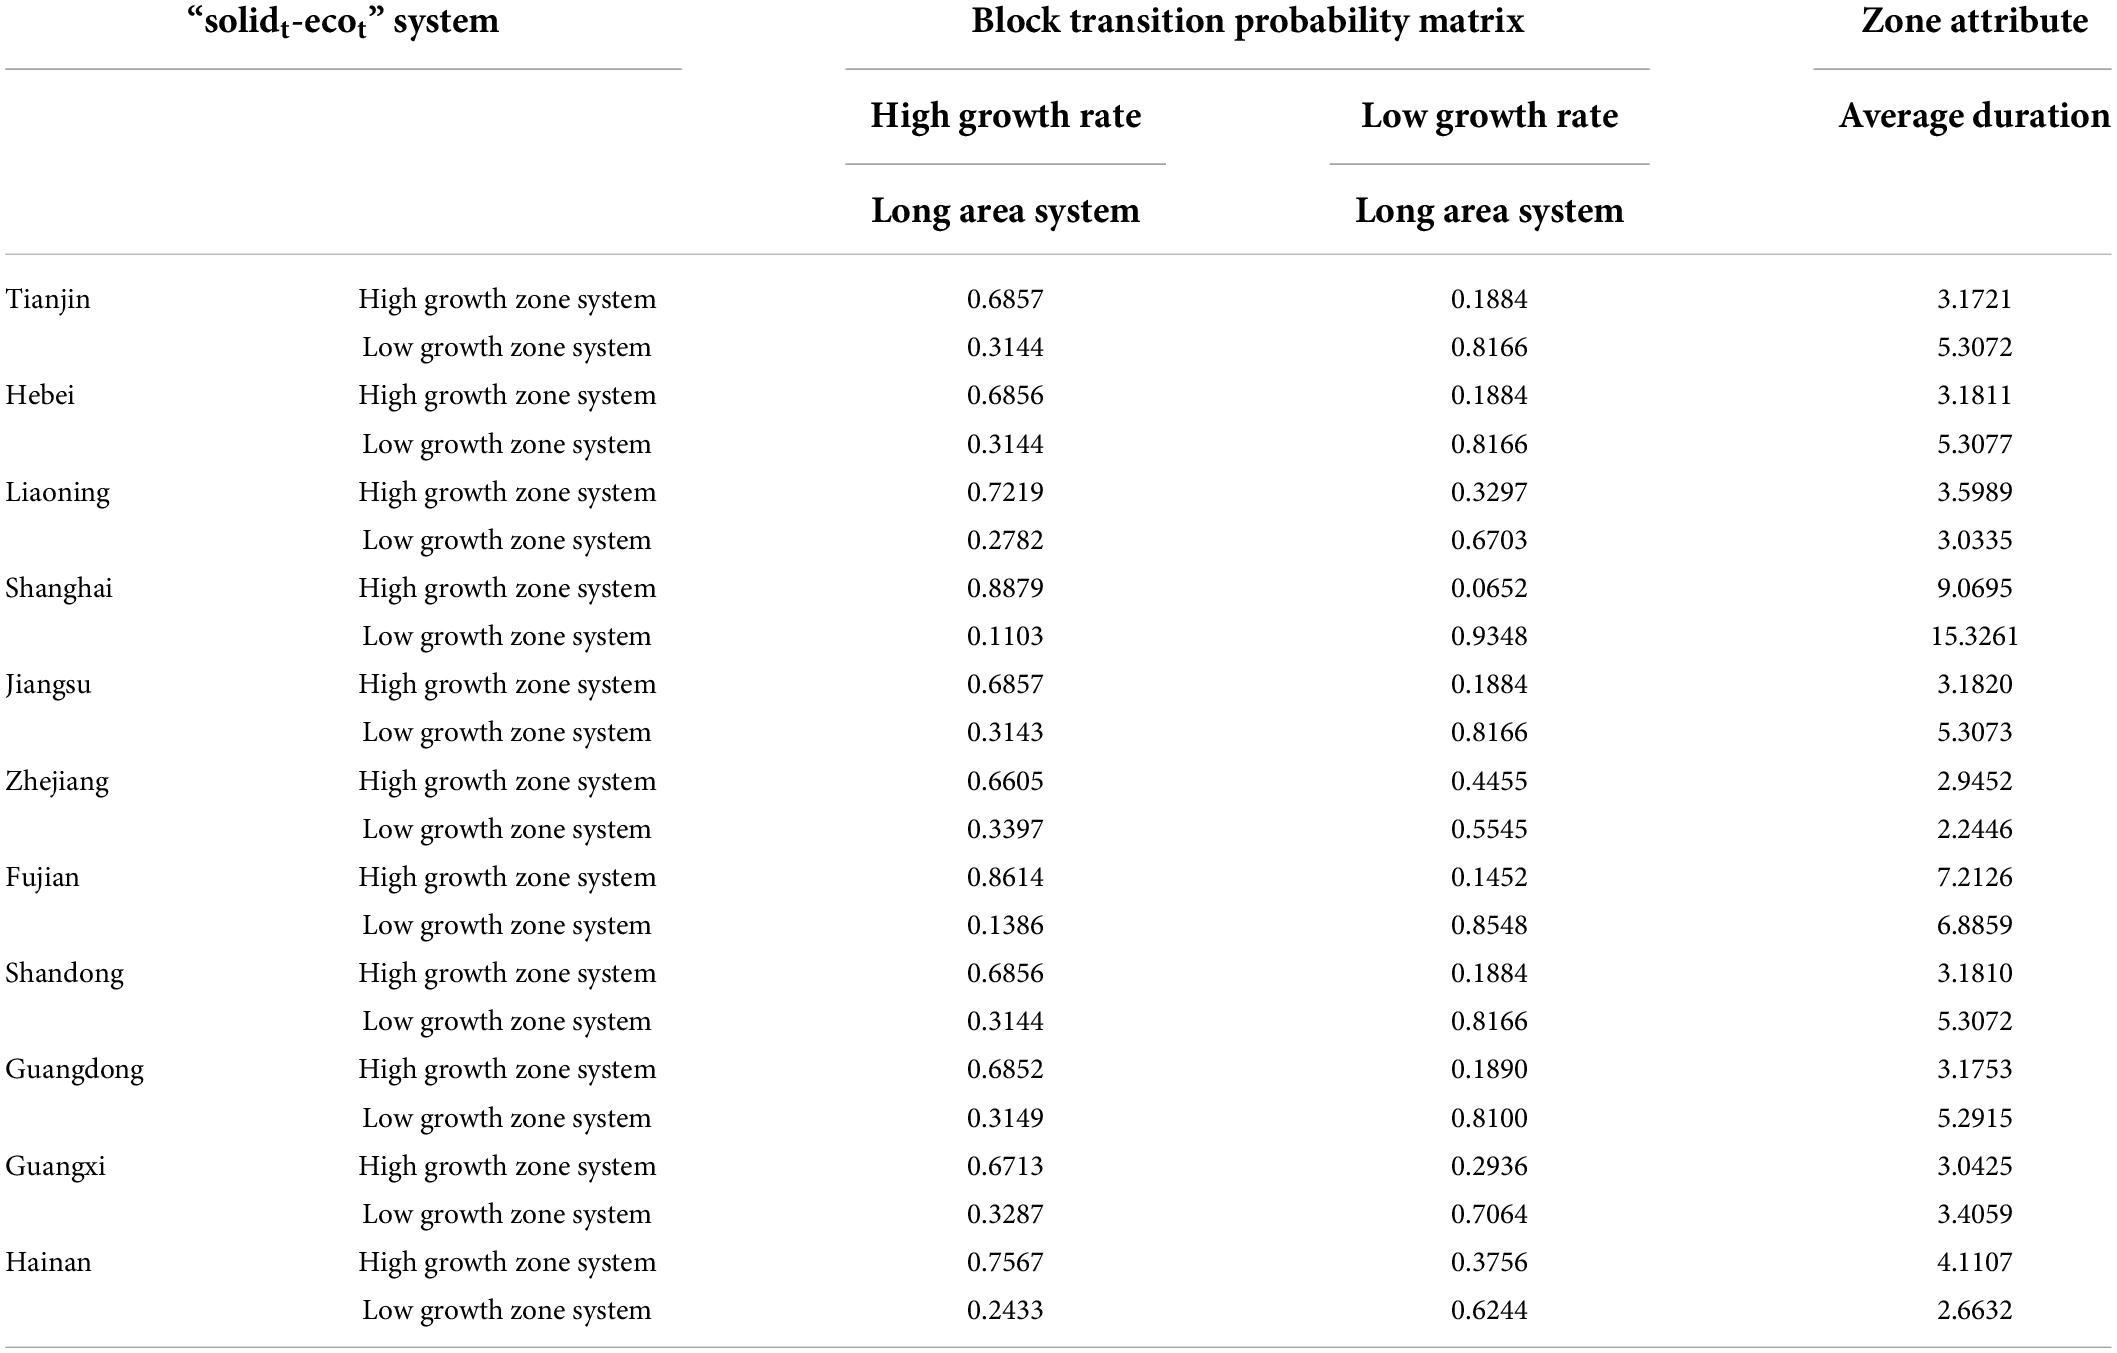
Table 4. Transition probability matrix and attributes of regional system of “solidt-ecot” system in China’s coastal areas from 2005 to 2021.
Table 4 lists the areas for evaluating the benefits of the Product Ecot system. In the “product ecology” system, China’s beaches are likely to be in the low-speed development zone system, indicating the stability of the development zone system. This suggests that waste disposal in coastal areas continues to be similar to previous studies as local economies continue to grow. Overall, the green industrial park development model strongly supported by China has improved the efficiency of centralized industrial solid waste treatment, enabling coastal areas to maintain stable economic growth maintain stable economic growth when reducing emissions. At the same time, the slow pace of recycling is one of the main reasons why China does not support continued coastal trade, despite the increase in waste recycling. Tianjin, Hebei, Shanghai, Jiangsu, Shandong, Guangdong, Guangxi and other coastal areas were 0.8116, 0.8116, 0.9348, 0.8116, 0.81810, 0.81810, 0.81810, 0.81810, 0.8116, 0.81810, respectively, and the more developed areas were sideways. The average probability is 0.8141, and the durations are 5.3072, 5.3077, 15.3261, 5.3072, 5.3072, 5.2915, 3.4059, and the average duration is 6.4647. This shows that these areas have generally reduced the economic growth related to the discharge of industrial solid waste and realized the interdependent development of economic growth and marine ecological environment. Liaoning, Zhejiang, Fujian, and Hainan had the advantage of controlling “regional growth,” which were 0.7219, 0.6605, 0.8614, and 0.7567, respectively, with an average incidence of 0.7501 and an average time of 4.4661. Liaoning Province is China’s former economic base, and some foods are convenient materials for China to develop heavy industry. The relatively extensive economic development model based on the input of production technology factors is the main reason why Liaoning Province is in the “high-speed growth zone system.” Industry is the backbone of Zhejiang Textile. Due to the limitation of coal and other energy sources, Zhejiang’s economic growth mainly relies on secondary energy production, resulting in the increasing emission of industrial solid waste. After Guangdong, Fujian can transfer to Guangdong mainly through small and medium-sized industries, only implement economic policies with relatively limited growth, and moderately reduce industrial pollution. Hainan is China’s only tropical island province. Due to the good development of real estate and tourism, the development of heavy industry is relatively limited, and traditional industries dominate (Liu et al., 2021; Table 5).
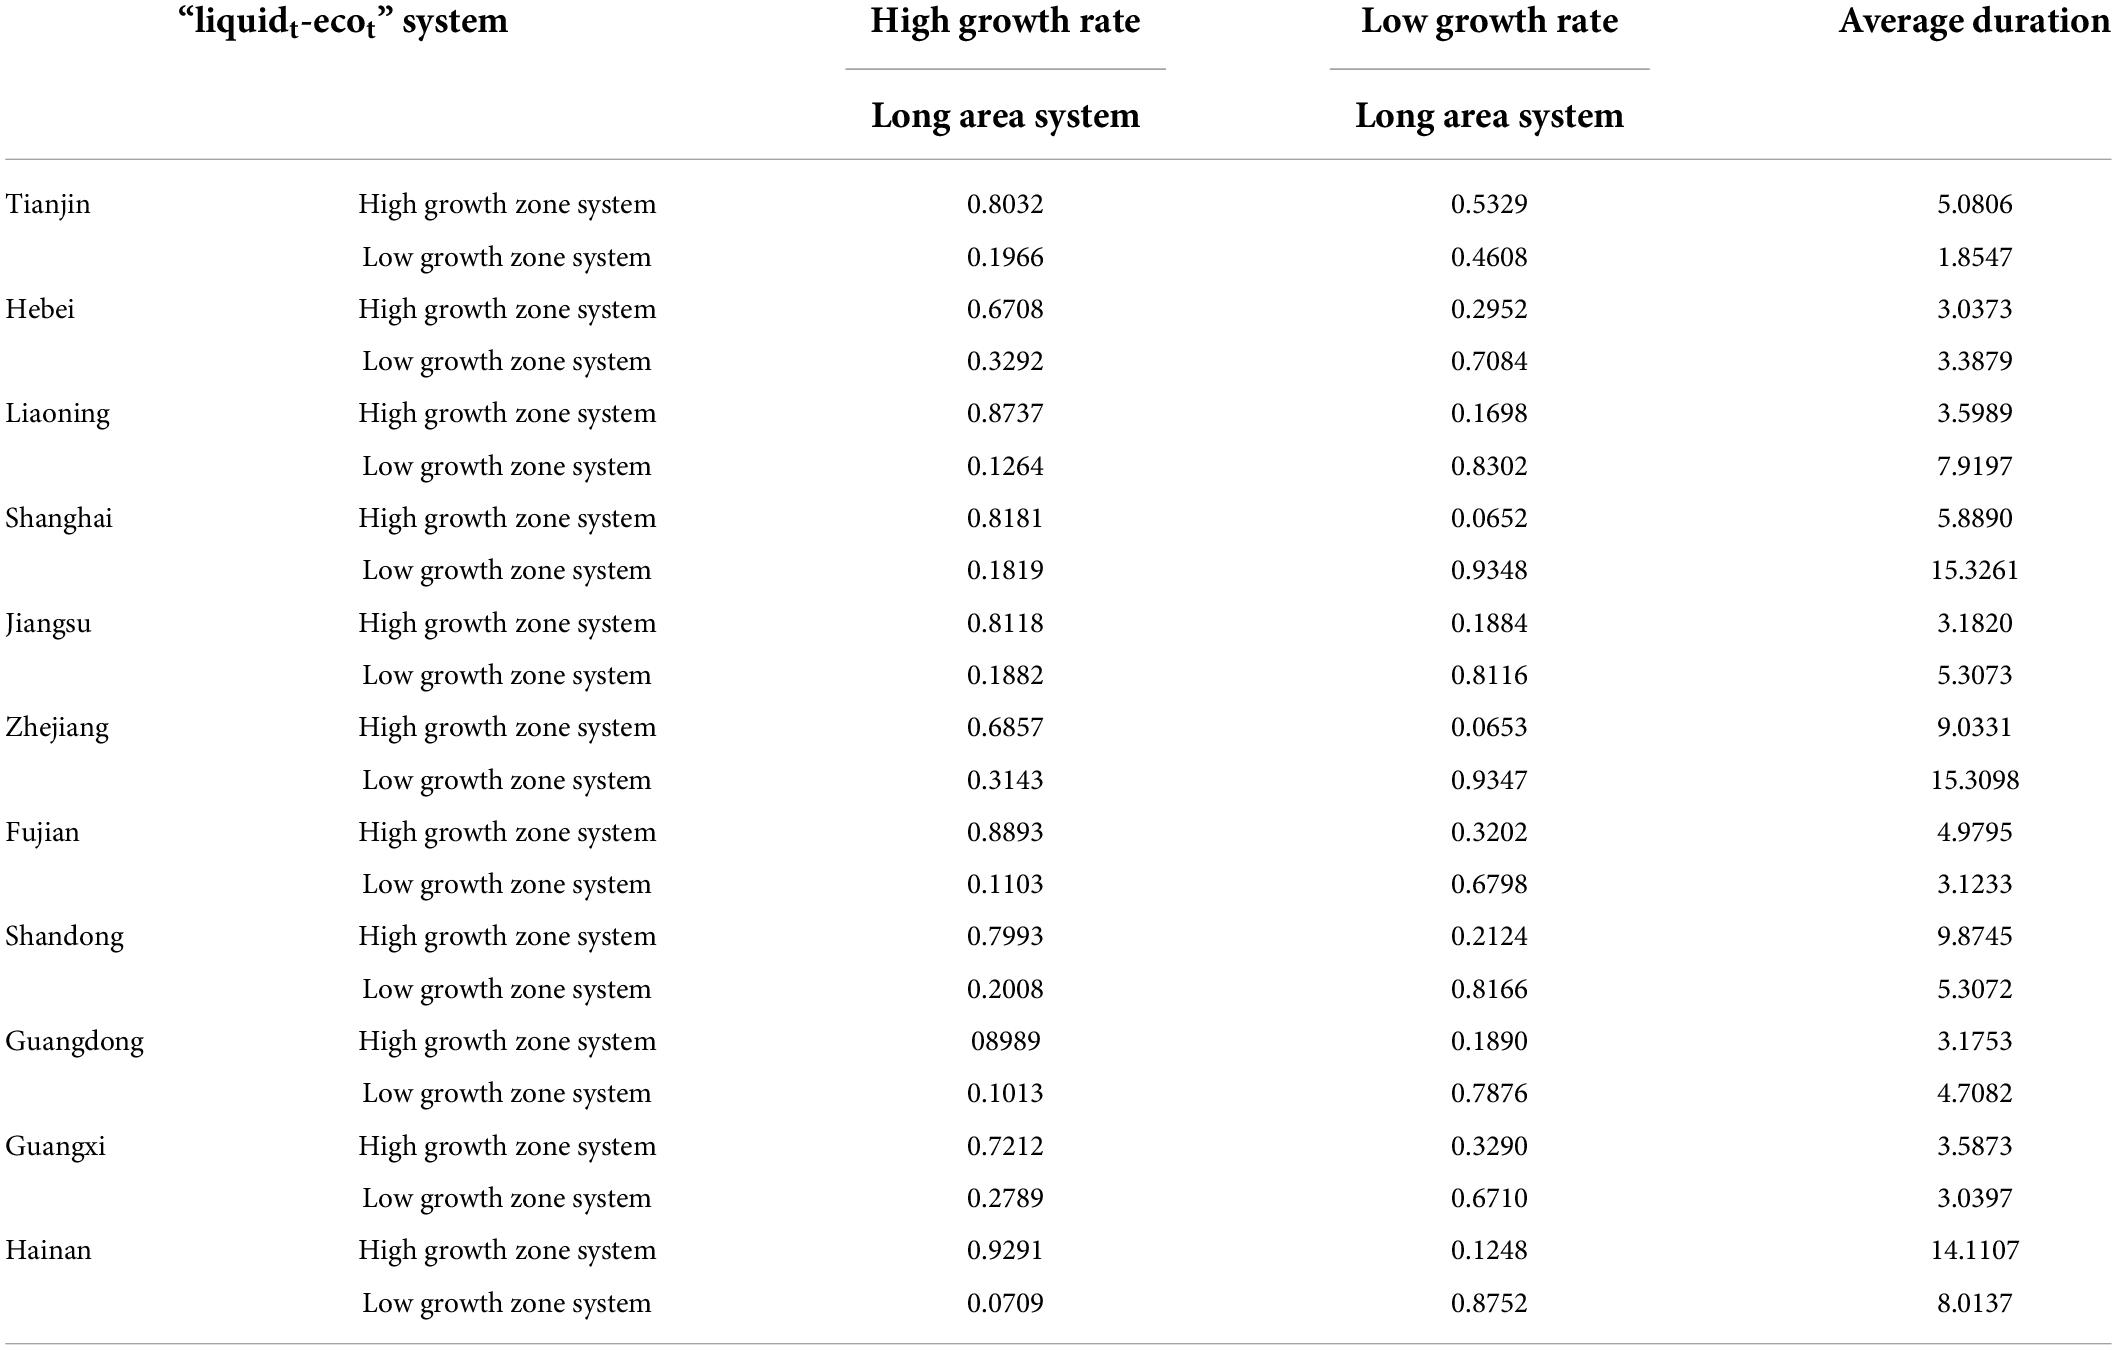
Table 5. Regional transition probability matrix and regional attributes of liquidt-ecot system in China’s coastal areas from 2005 to 2021.
Table 5 lists the areas for evaluating the advantages of the “Liquid Ecot” system. In a “liquid ecosystem” system, Chinese beaches are usually in developing areas. From the observation model in Table 5, it can be seen that under the background of the continuous development of the social economy of the tidal flats in my country, the wastewater is directly discharged into large groups, and the growth is accelerated. China’s coastal areas have seen the economic development results of “promoting growth through pollution.” The direct discharge of industrial wastewater has an important relationship with the growth type of the industry. All in all, the “liquid ecosystem” system has a high probability of being in a system in a high-speed growth area, indicating that the wastewater in the 11 coastal states and cities in my country is directly and massively discharged, that is, within the state. Increase as the industry improves. Under the background of the development of cities toward the sea, the pressure of coastal cities in the marine environment has gradually become an important part. The pollution of industrial wastewater to the marine environment has not been well contained, and the identification pressure still exists. Green growth of marine ecological environment (Liu et al., 2020). Looking at the development of several coastal areas, Hebei, Zhejiang, and Fujian have the potential to manage “low-speed growth areas,” 0.7048, 0.8116, and 0.9347, respectively, with an average result of 0.8170 and a time of 3.3878, 5.3073, and 15.3098, and the time between 8.0016. This shows that our coastal cities are reducing their direct discharge of wastewater into larger products, while China’s economy is growing slowly. However, provinces such as Tianjin, Liaoning, Shanghai, Jiangsu, Shandong, Guangdong, Guangxi, and Hainan are more likely to maintain the “high growth zone system,” respectively. The mean probability is 0.8320, and the durations are 5.0806, 7.9176, 5.4962, 5.3133, 4.9793, 9.8745, 3.5874, and 14.1048. The average duration was 7.0442. This shows that the industrial wastewater in 11 coastal provinces and cities in my country is immediately disposed of in large quantities, and the overall level of my country’s economic growth is on the rise. Tianjin, which borders Beijing, the capital of China, has long been the site of Beijing’s low-income industries and has been unable to accommodate population transfers. Population and economic growth lead to increased demand for water. Likewise, Shanghai, Jiangsu, Shandong, and Guangdong are the fastest growing regions in China. In 2019, the population densities of Shanghai, Jiangsu, Shandong, and Guangdong were 2,287,564 people/km2, 2,752,799 people/km2, 2,637,745 people/km2, and 641.12 people/km2, respectively. Demand for food and other necessities has increased. Therefore, with the influx of population and the development of industry, the amount of wastewater directly from the food, printing and dyeing industries has increased significantly. As mentioned above, based on the large-scale economic growth system of Liaoning Province’s factor input, the traditional industrial structure of Hainan Province, the main reason why the “economic growth and marine pollution” system is in the “high-growth area system” is. Relying on rich non-ferrous metal resources such as aluminum and tin, Guangxi has an industrial system dominated by heavy industry. However, the proportion of traditional industries in the industrial structure has reached 80%. Coupled with backward technology, the reduction of marine pollution is not obvious (Huang, 2015).
Results and analysis
Using remote sensing and GIS combined with model methods, an innovative study was carried out on the landscape dynamics, mechanisms and ecological effects of rapid urbanization in China’s developed regions. Representative work in the field of study. An important part of the application of a VAR model is to examine the relationship between different time periods and to determine why variability in one variation causes variation in other differences. The Granger causality test is a method of measuring differential causality. Its main idea is to see to what extent the current y can be explained by the past x, and whether adding the lag term of X can improve the degree of explanation. If the correlation between the two is significant in the statistical coefficient, it can be said that “Y is caused by X Granger.” The purpose of the Granger causality test is to test whether a market with one difference can enter another difference. If differences are affected by manipulation of other variables, they are said to have Granger causality. It should be noted that Granger causality is not true causality, but a dynamic correlation. If x is a Granger of Y it just means that case x can precede Y (Liu and Ahmadi, 2021).
The main idea of the impulse response function method is to use a time series model to analyze the relationship of power and consider how power affects the time transfer to many different things. His research often aims to determine the positive effects of mutational errors or patterns of interference on the body (Jayakumar et al., 2021).
Data source
Considering the availability and continuity of data, the actual marine GDP of Guangdong Province from 2006 to 2016 is selected to measure the marine economic growth, and the nominal marine GDP of each year is reduced by taking 2006 as the base period GDP deflator, with the symbol y and the unit of RMB 100 million (Li et al., 2021a). The change in the shipping industry model is characterized by the improvement of the shipping industry model, indicating that the shipping industry model is developing through development and service, and the symbol is X. Value added represents the percentage of marine tertiary industry. The intermediate level of added value of the shipping industry reflects the revision of the shipping industry model and measures whether the industry model develops in the direction of “service.”
Market selection is a key issue in developing VAR standards. The number of companies is large enough to capture all the features of the design, but also loses model independence due to the large size and must therefore be determined broadly. The VAR model is generated by the first order of magnitude difference between X and y, and the running time is passed through similar sample sampling test (LR), final prediction (FPE), AIC test data, SC test data and HQ test data. According to the test results in Table 6, the best lag period is 2, so the VaR (2) model is constructed.
Through Granger etiology experiments, this work identifies the impact of changes in offshore production patterns on the development of the shipping industry. The Granger causality test shows that accepting the hypothesis that “x is not G creates Y” and rejecting the theory that “Y is not G creating X” indicates that in the process of marine economic development, the marine industry model has changed. Granger did not influence the development of the shipping industry, but the development of the shipping industry promoted the development of the shipping industry model. Although the reform of the shipping industry model has not reached a high level, it does not mean that the development of the shipping industry will reverse. The development of the shipping industry can play an important role in promoting the development of the shipping industry. Although the Granger causality test can judge the causal relationship between maritime industry restructuring and maritime economic growth, further impulse response analysis is needed to understand the impact of maritime economic growth on maritime industry restructuring. The results are shown in Table 7.

Table 7. Granger causality test results of marine industrial structure change and marine economic development.
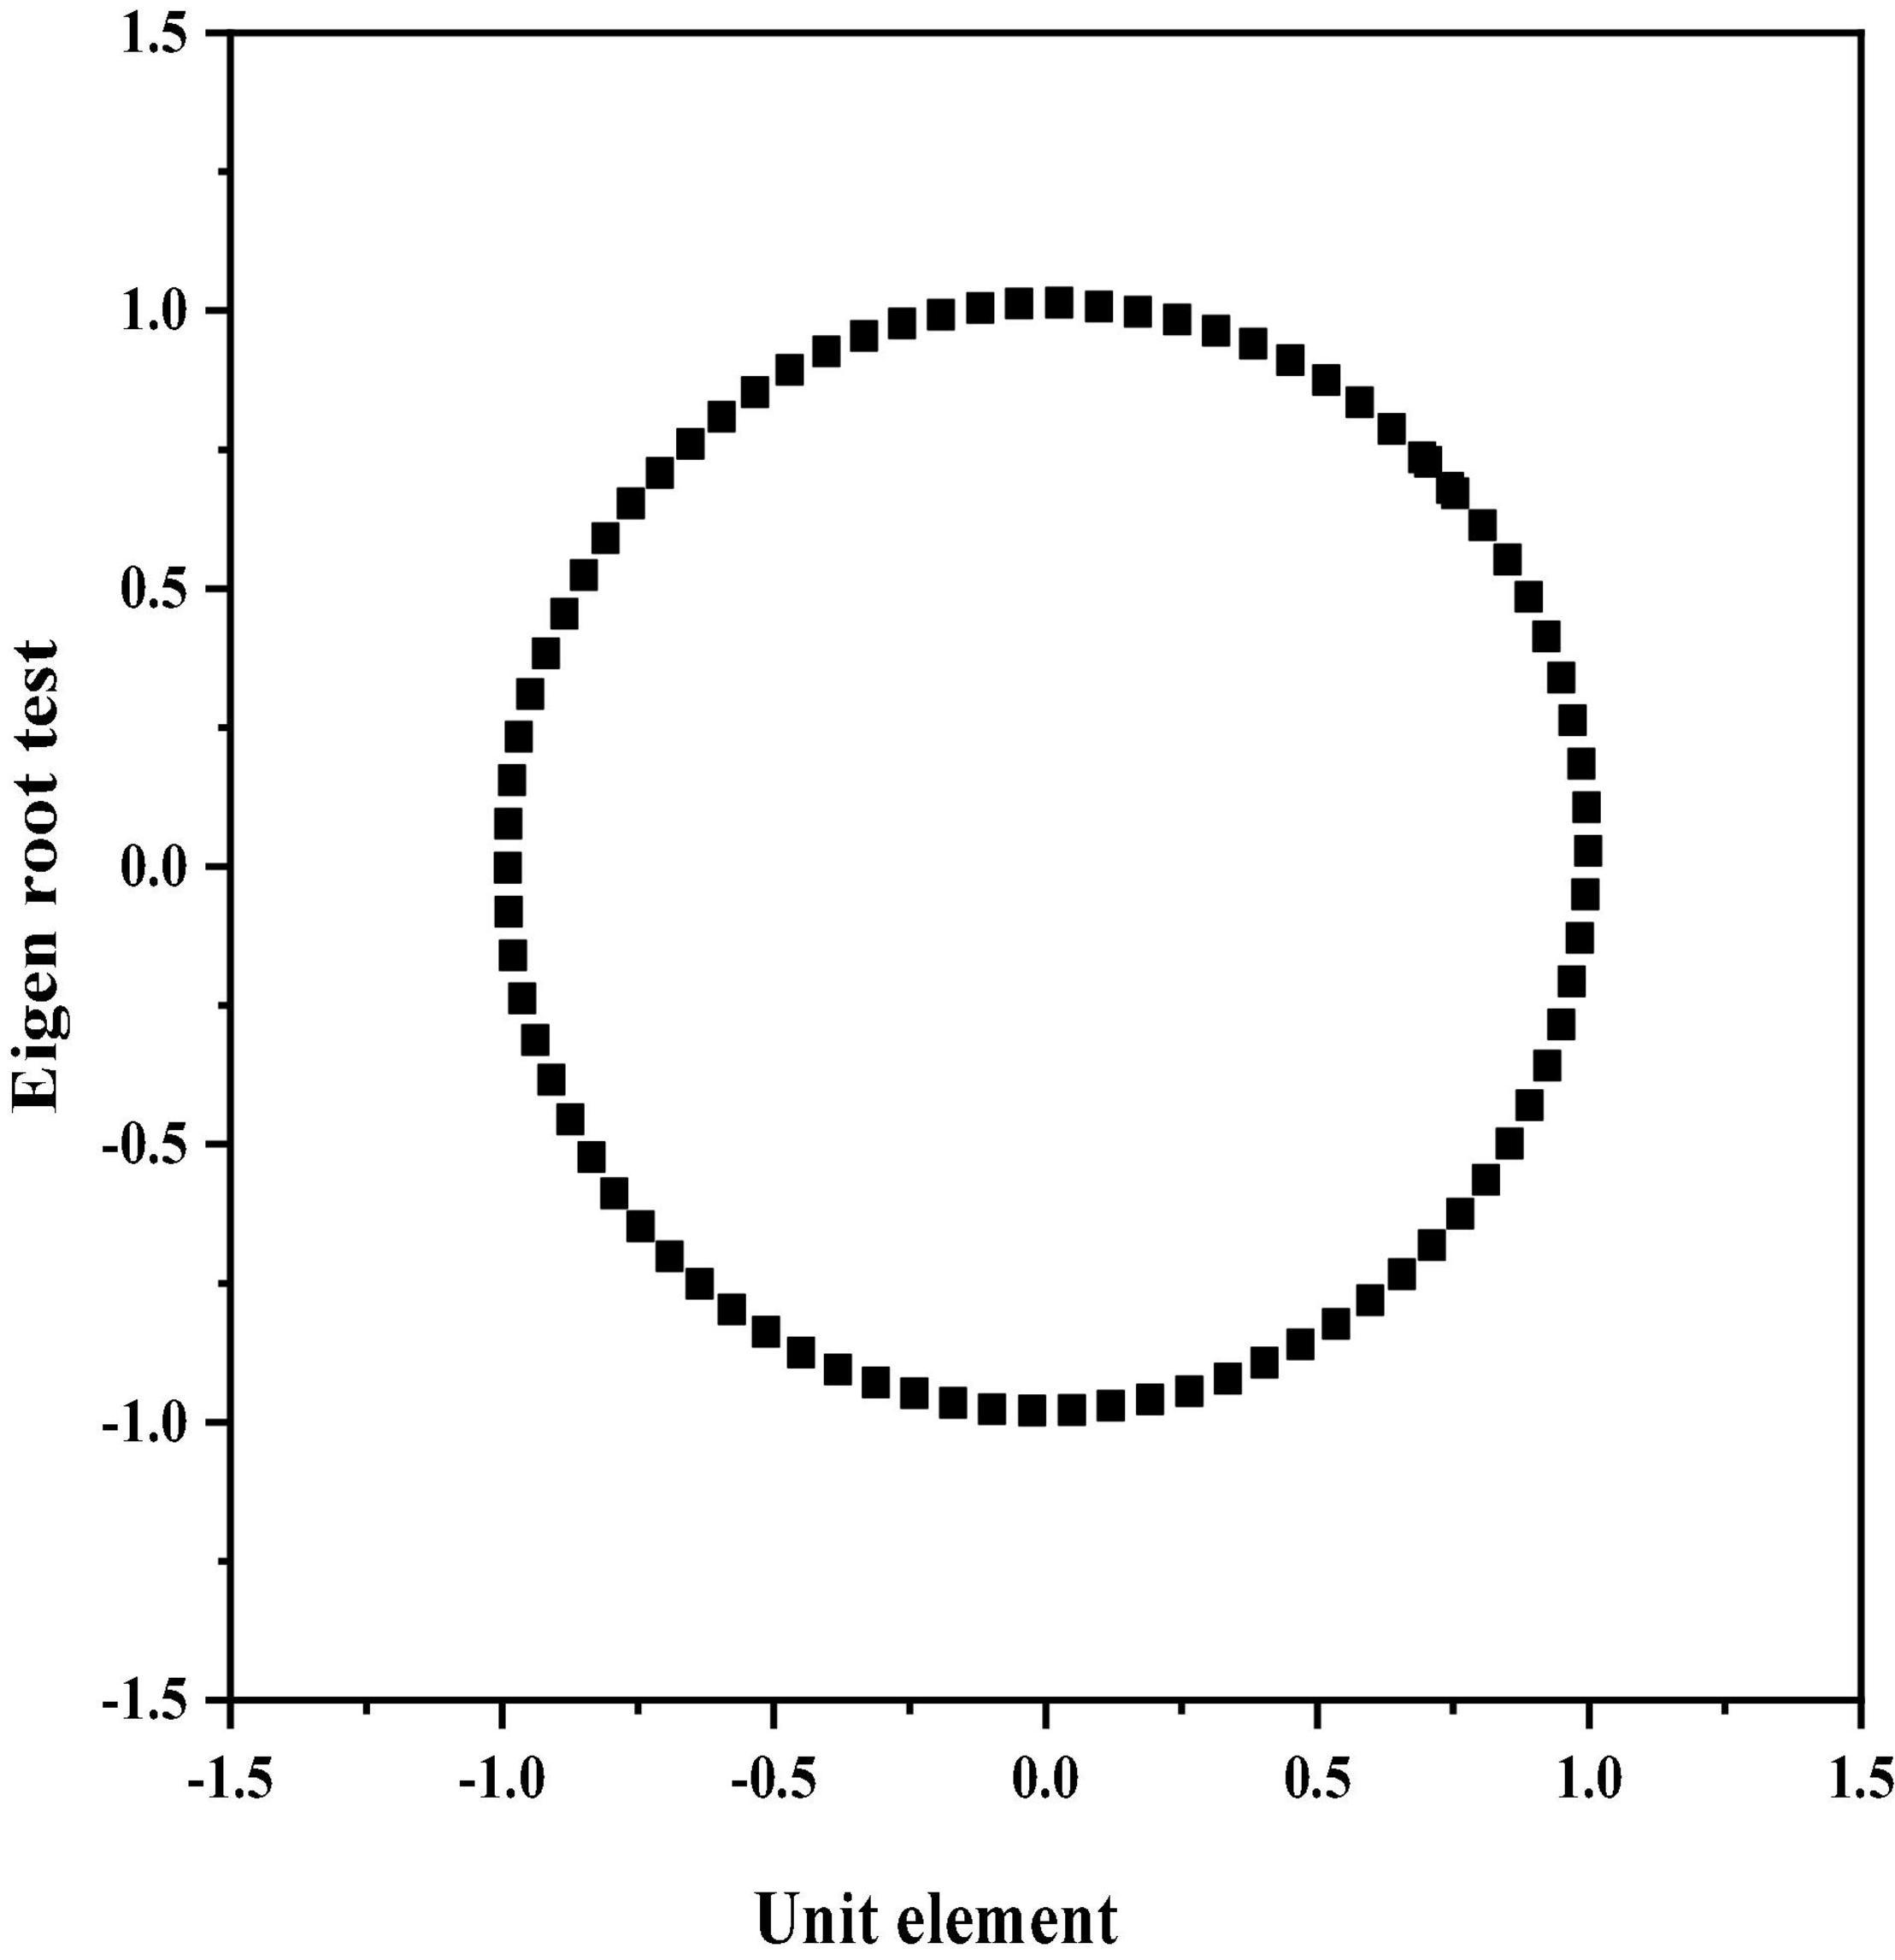
The eigenvalue test Ar shows that the inverse values of all eigenvalues of the VAR model are within the unit period, indicating that the model is stable and the impulse response can be tested in the next step (Figure 3).
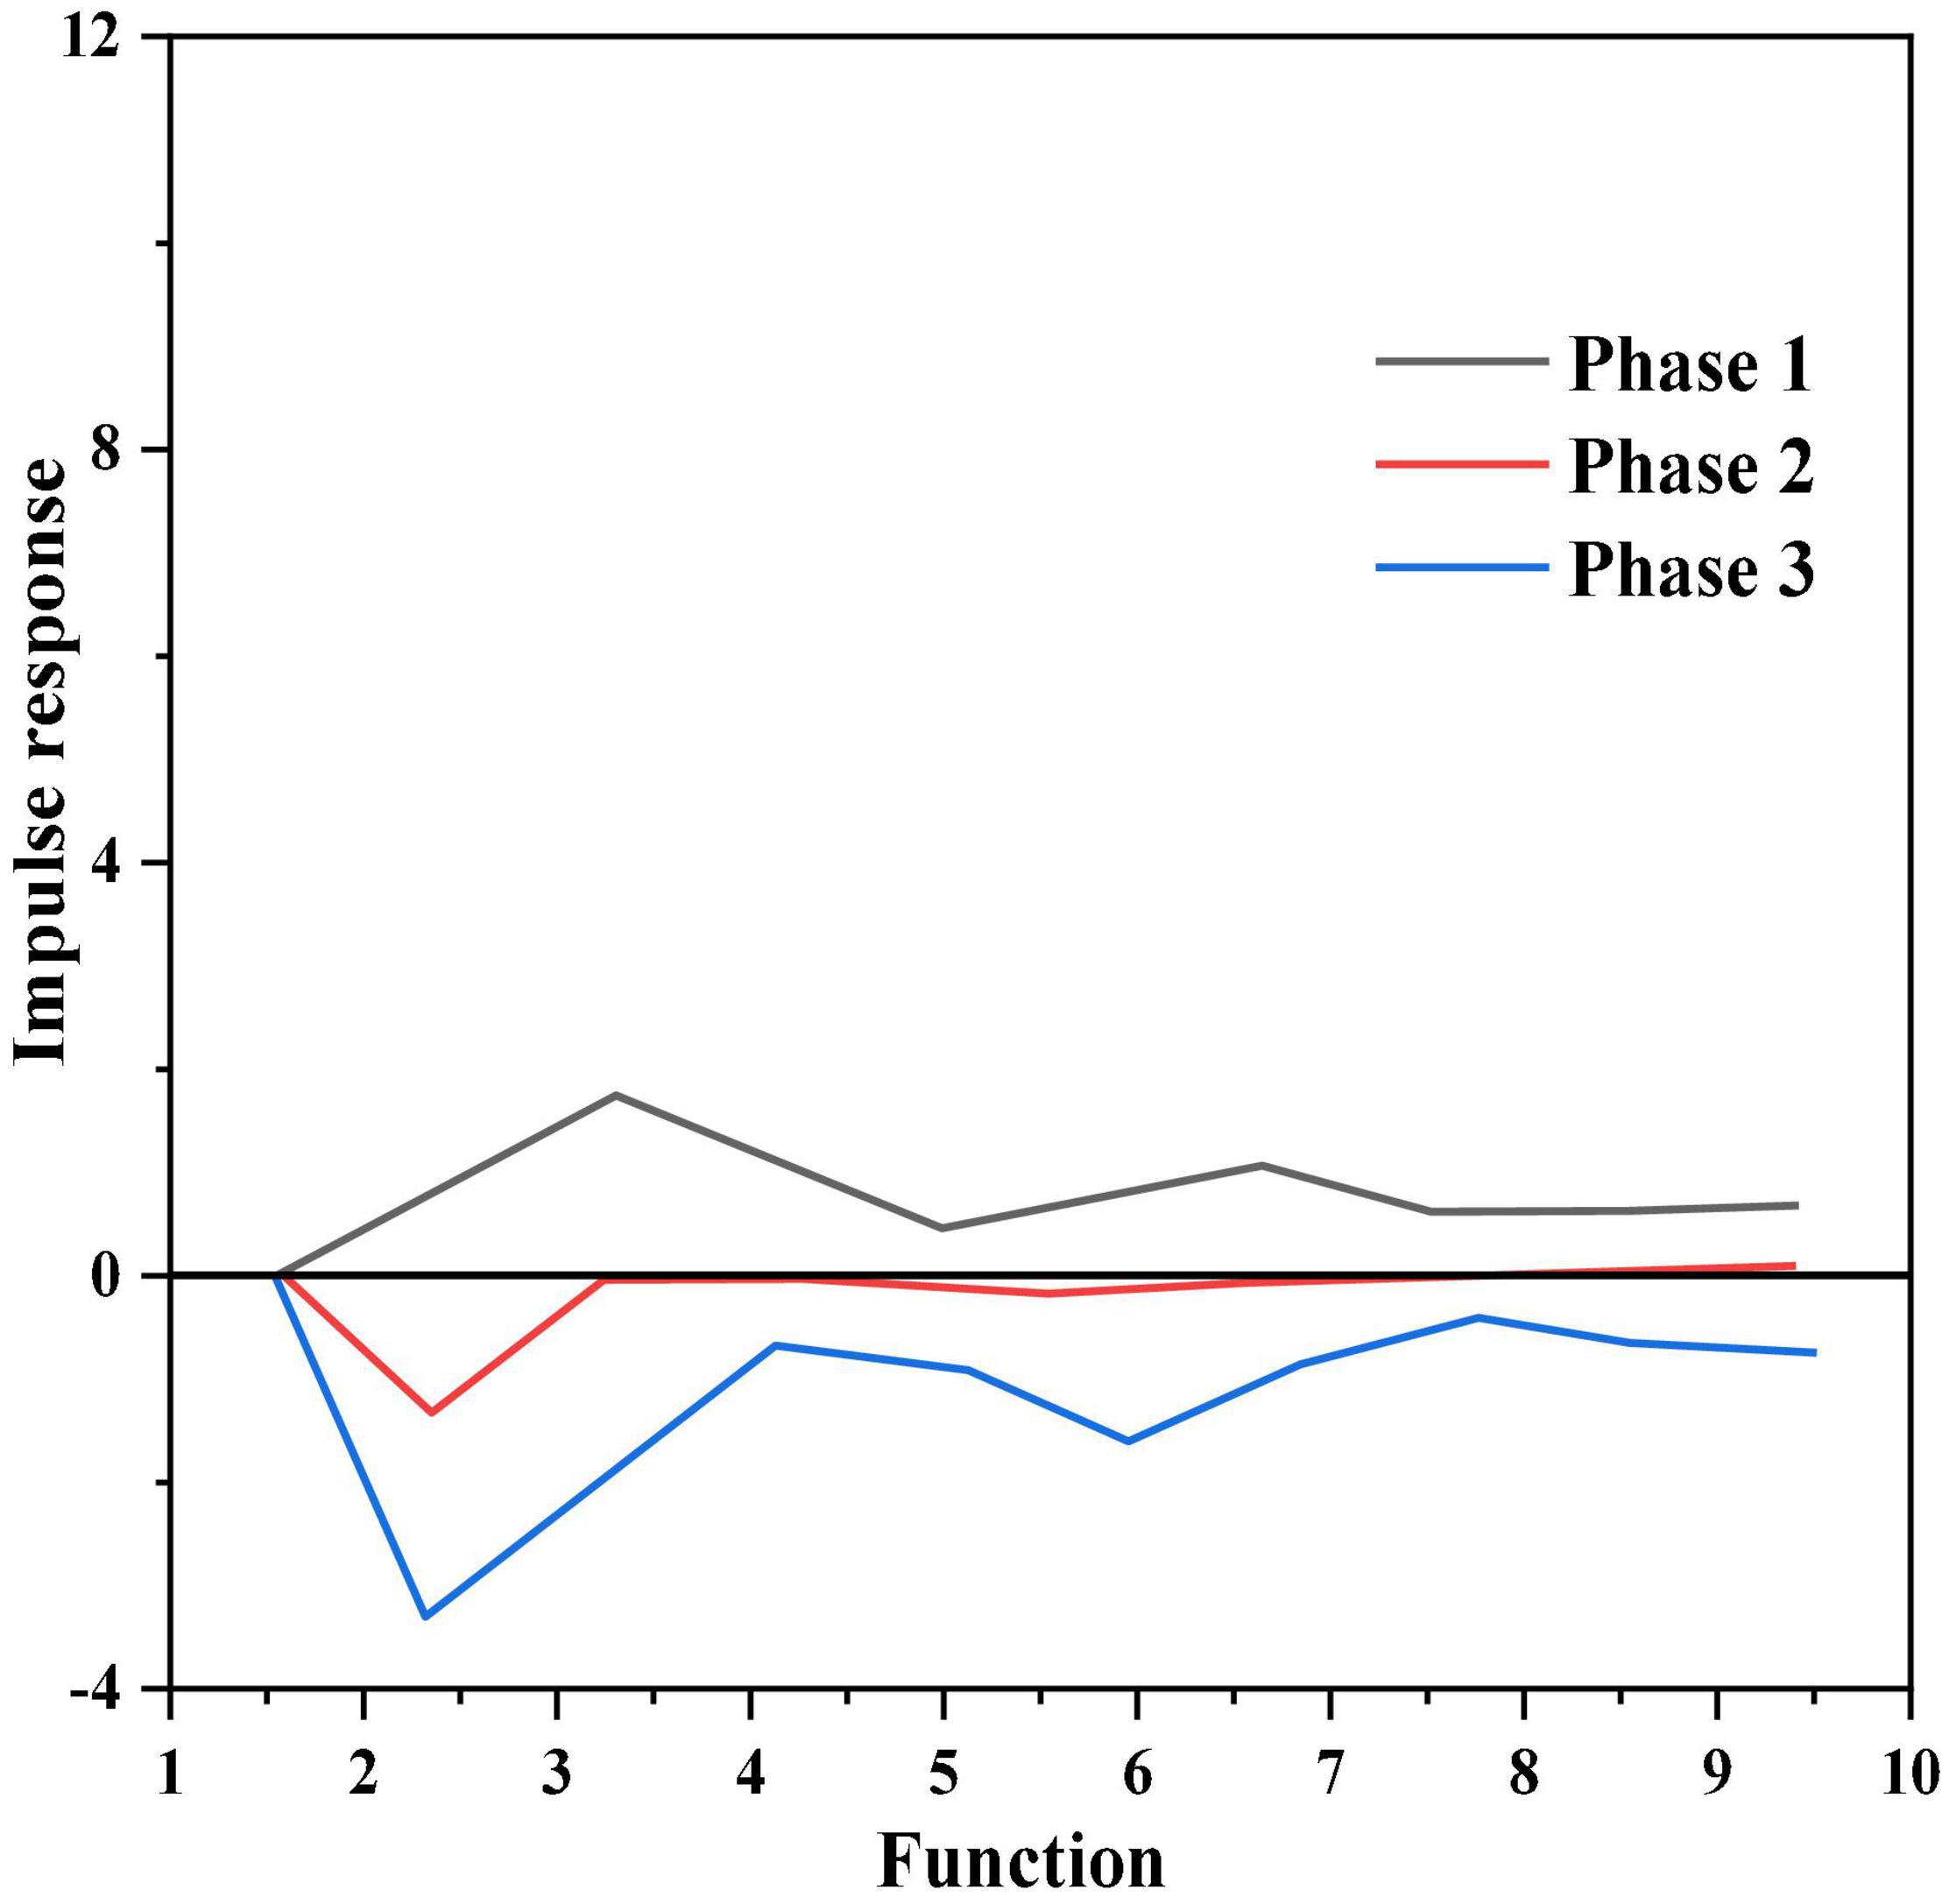
The impulse response function is used to measure the differential mode effect of the negative effect of the endogenous difference between the current and future values for each change. Endogenous variation in VAR models. Figures 4, 5 are graphs of the pulse function. The horizontal axis represents the number of deviations, the vertical axis represents the response rate, and the product line represents the fluctuation of the marine production design. The bottom is the reflected model, and the dashed line on each side represents twice the model error. Figure 4 shows the impulse response function of the ocean industry model’s impact on the ocean economy. As can be seen from Figure 4, after the impact of the random interruption of the typical unit deviation of the term marine economy, the marine industrial structure upgrade did not immediately respond to the current period. Downtrend until Phase 2, then uptrend. After the third stage, the volatility is negative and tends to stabilize. It shows that the marine industry structure was negatively affected by the development of marine economy in the early stage. With the continuous development of the marine economy, in the long run, the marine industry upgrading has little or even negative impact on the marine economy, and the marine industry structure upgrade has a stable demand for the marine economy.
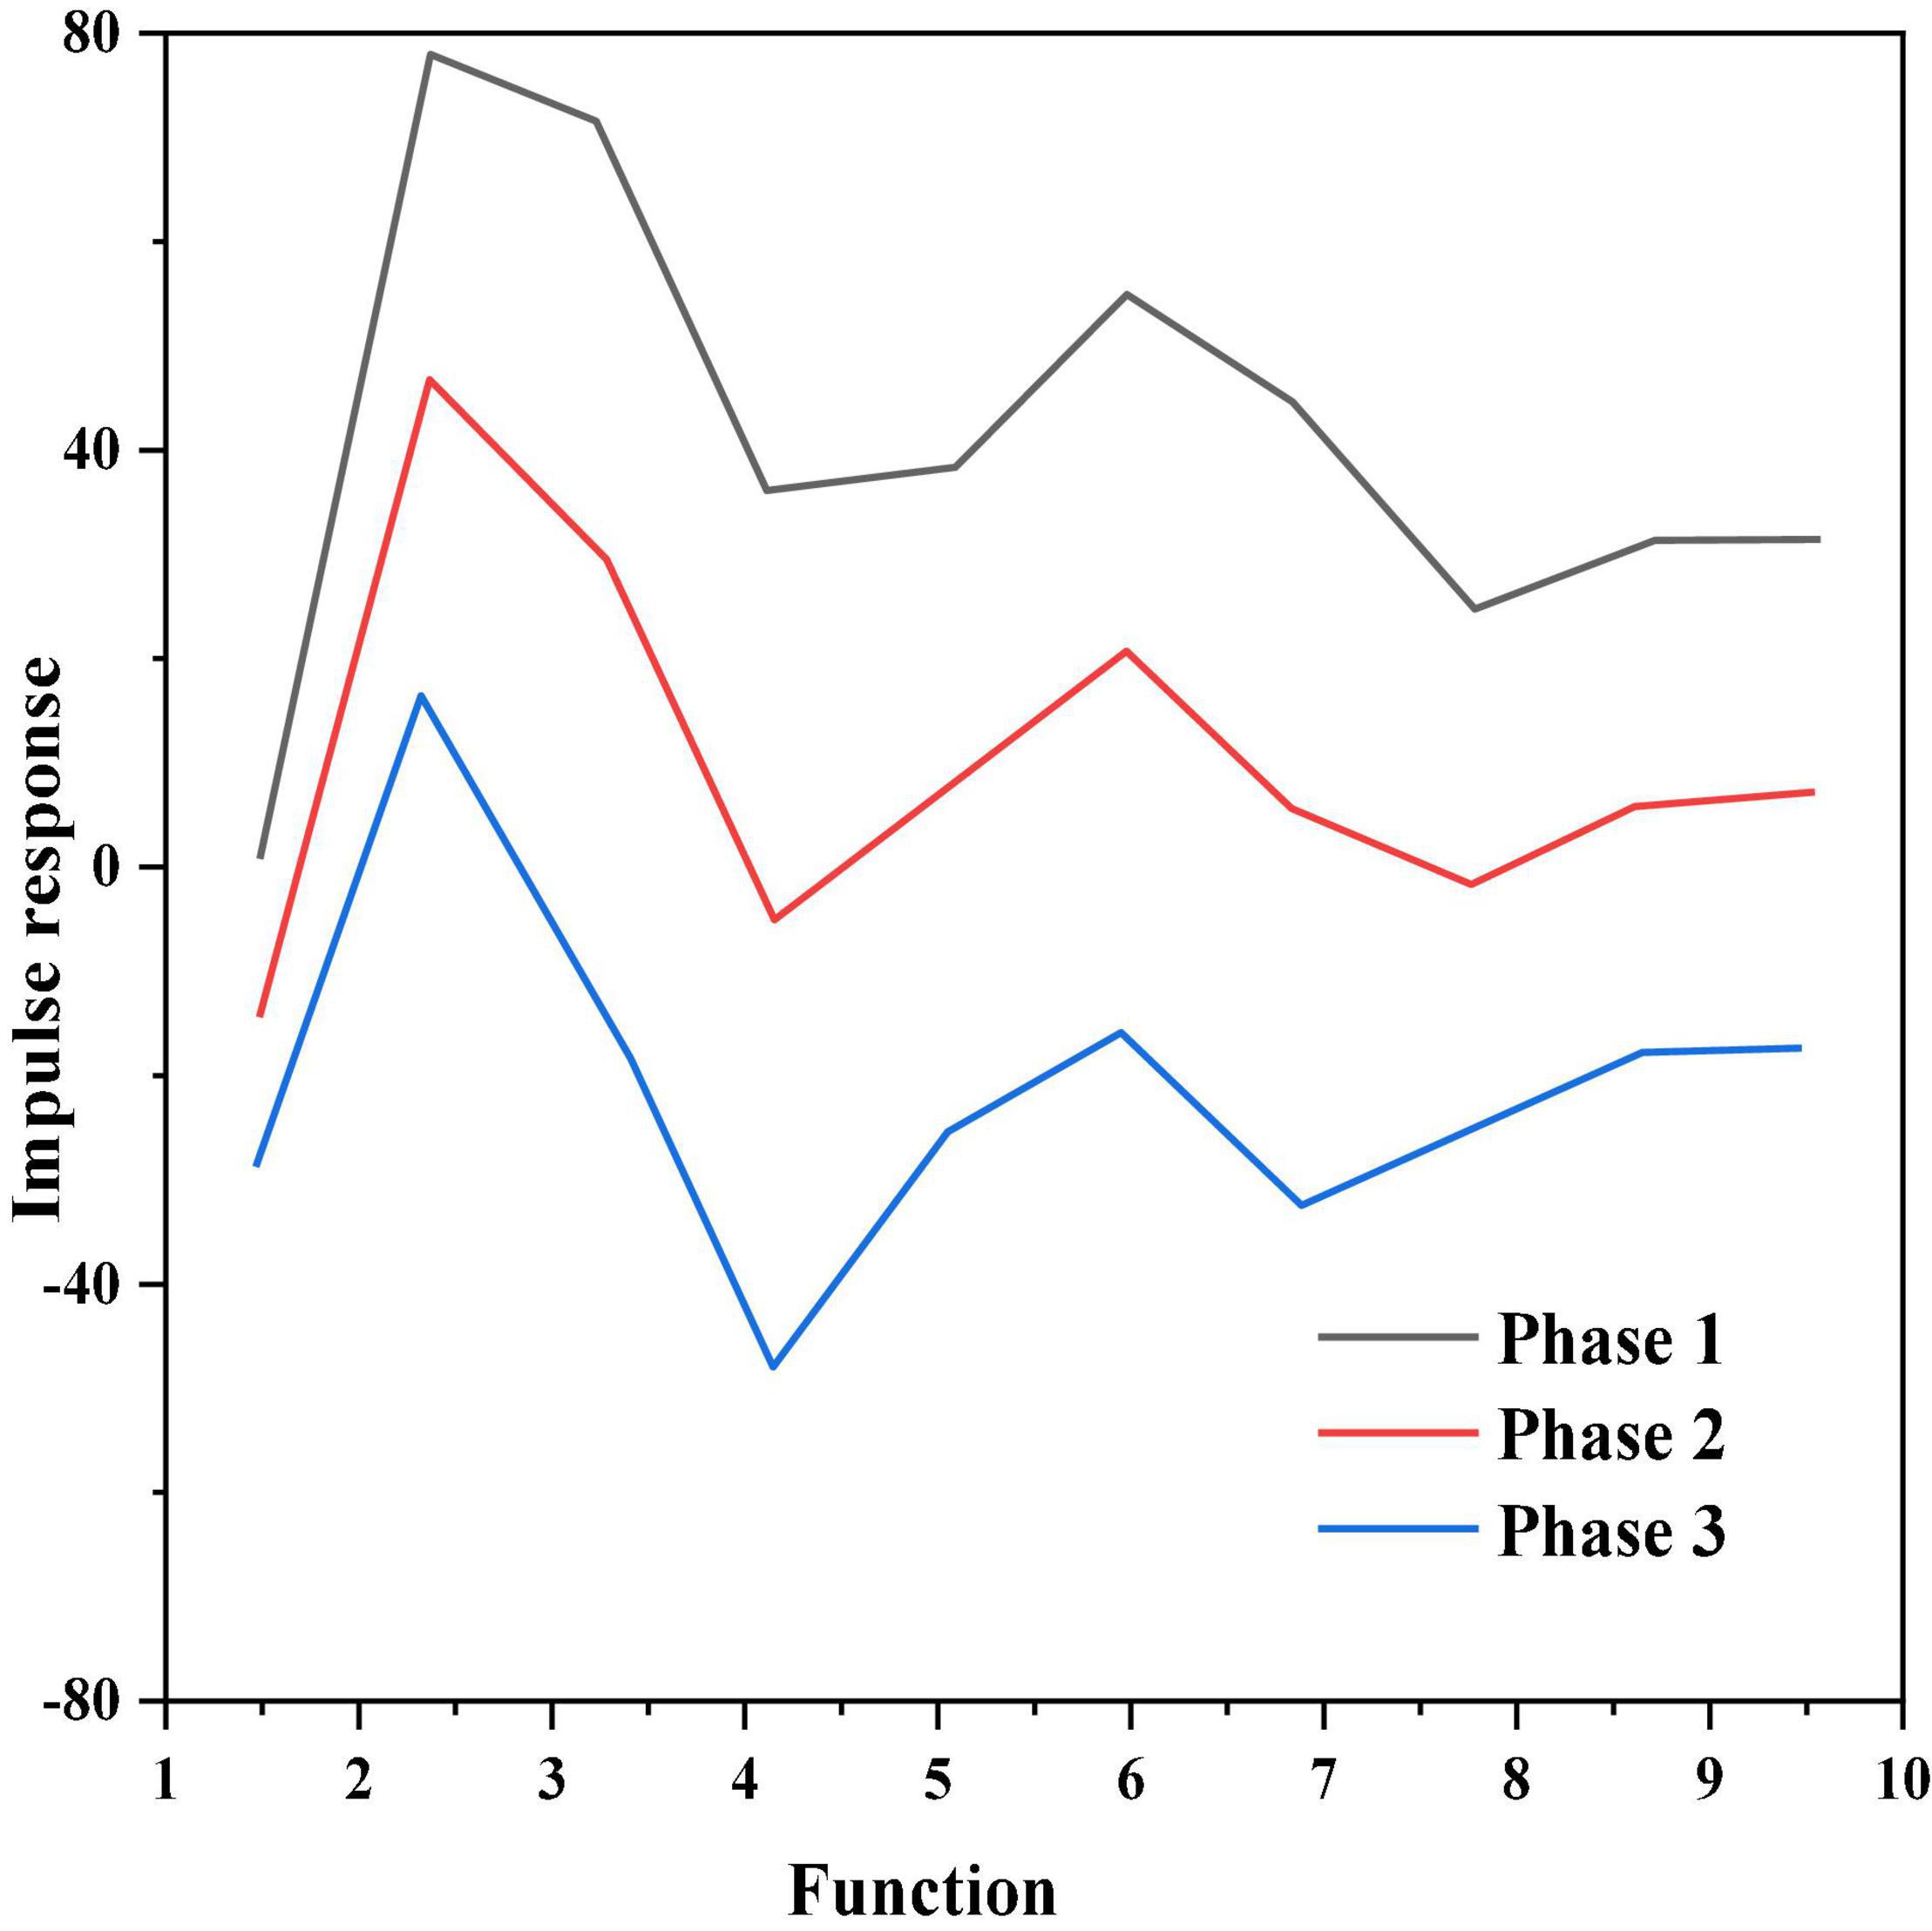
Figure 5. Impulse response function of marine economic growth to the disturbance of marine industrial structure.
Figure 5 shows the impulse response function of marine economic growth to the disturbance of marine industrial structure. It can be seen from Figure 4 that under the influence of the standard unit deviation of the random disturbance of the marine industrial structure, the current marine economic growth response is negative, and then shows an upward trend, and the decline reaches a peak in the second stage. and remain floating. It tends to be positive and stable after the 6th stage. The thrust response map shows that in the short term, the marine economic growth is affected by the upgrading of the marine industry structure, which is unstable and has many positive effects. In the long run, the upgrading of marine industrial structure will have a lasting and lasting positive attraction to the development of marine economy.
Conclusion
This study analyzes the relationship between shipping industry model and shipping industry development from multiple perspectives. In the short term, a one percent hit to the shipping industry will have a negative impact on the model of the shipping industry. If the model for the shipping industry is given a fractional percentage, the shipping industry is more or less volatile over the first five periods. In the long run, the structural upgrading of the shipping industry has little or no response to marine economic turmoil. After a certain impact of external conditions on the marine industrial structure, it will bring the same direction impact to the marine economy, and this impact has a significant promoting effect and long-lasting effect.
Generally speaking, in the 21st century, China attaches great importance to marine development, and the proportion of marine economic industry in China’s economy has increased year by year. However, the negative effects of rapid growth are amplified with further development. The marine environment, especially the coastal part, is deteriorating, the sea level of the coastal part is rising, and marine disasters and climate are positive feedback to each other, which has brought huge losses, including economy and personnel. According to this development trend, it will directly affect the further implementation of carbon peaking and carbon neutralization strategy. Carbon peaking and carbon neutralization are essentially important parts of sustainable development. Through technological innovation and institutional innovation, as well as diversified means such as industrial form transformation and large-scale adoption of new energy, optimize the energy structure, increase the low-carbon emission of new energy and reduce the high-carbon emission of traditional energy, so as to gradually achieve the goal of carbon peaking and carbon neutralization. Today, global climate change is inevitable, and the marine low-carbon industry is a weak direction of China. We should take it as the direction of breakthrough, strengthen the construction of scientific and technological “neck” technology breakthrough ability and industrial innovation ability, strive to create the competitive advantage of low-carbon technology, and accelerate the transformation of low-carbon economy in the marine field.
Therefore, when developing the marine economy and marine industry, we must focus on energy conservation and emission reduction, and use this as the main development method to implement in the highly developed and underdeveloped areas of our country. On the one hand, the developed regions have better conditions, which are relatively rapid in transformation and change. On the other hand, the long-term development of underdeveloped areas should also work in this direction. The development direction of the start is correct, and the development will get twice the result with half the effort. For typical coastal economic areas such as the Pearl River Delta, Yangtze River Delta, and Bohai Sea, we must ensure that the policies are implemented in place. Local governments should strive to promote low-carbon development, provide sufficient financial guarantee, minimize the pressure of industrial transformation in terms of Taxation and finance, let relevant enterprises recognize the real benefits and prospects brought by the transformation, and actively participate in the construction to form a virtuous circle. In this way, we can achieve the goal of carbon peak and carbon neutralization. The rationalization and evangelization of China’s marine industrial structure has a positive effect on my country’s marine economy. Through its cointegration equation, it can be seen that the rationalization of marine industrial structure and technology are the lasting power of economic growth. In the future, the development of disciplines will closely combine the frontiers of disciplines and national needs, and strengthen the construction of first-class disciplines. China’s unique natural geographical conditions and abundant animal and plant resources provide a broad platform for biogeography and ecological research. At the same time, a series of ecological and environmental problems caused by China’s rapid economic development have also brought urgent needs for ecological research and huge challenges.
Data availability statement
The original contributions presented in this study are included in the article/supplementary material, further inquiries can be directed to the corresponding author.
Author contributions
JZ contributed to the writing and performing surgeries. BL contributed to the data analysis and performing surgeries, article review, and intellectual concept of the article. Both authors contributed to the article and approved the submitted version.
Conflict of interest
The authors declare that the research was conducted in the absence of any commercial or financial relationships that could be construed as a potential conflict of interest.
Publisher’s note
All claims expressed in this article are solely those of the authors and do not necessarily represent those of their affiliated organizations, or those of the publisher, the editors and the reviewers. Any product that may be evaluated in this article, or claim that may be made by its manufacturer, is not guaranteed or endorsed by the publisher.
References
Chen, X., Hou, H., Wu, L., Huang, T., Mei, M., and Zhao, Y. (2022). Research on metal flow law and strengthening mechanism of cold extrusion internal thread. J. Braz. Soc. Mech. Sci. Eng. 44, 1–13. doi: 10.1007/s40430-022-03418-w
Cui, S., Pei, X., Jiang, Y., Wang, G., Fan, X., Yang, Q., et al. (2021). Liquefaction within a bedding fault: understanding the initiation and movement of the Daguangbao landslide triggered by the 2008 Wenchuan Earthquake (Ms = 8.0). Eng. Geol. 295:106455. doi: 10.1016/j.enggeo.2021.106455
Feng, S. (2022). Enterprise marketing strategy and path under the background of double cycle. Modern Econ. Manag. Forum 3, 123–129. doi: 10.32629/memf.v3i2.779
Glazyrina, I. P., and Latysheva, M. A. (2021). Lithium production as a reindustrialization factor for the eastern border regions of russia. Geogr. Nat. Resour. 42, 107–114. doi: 10.1134/S1875372821020049
He, Y., and Kusiak, A. (2017). Performance assessment of wind turbines: data-derived quantitative metrics. IEEE Trans. Sustain. Energy 9, 65–73. doi: 10.1109/TSTE.2017.2715061
Huang, R. (2015). Framework for a smart adult education environment. World Trans. Eng. Technol. Educ. 13, 637–641.
Huang, Y., and Wang, C. (2021). Research on the formation mechanism and influencing factors of competition policy in rtas. Am. J. Ind. Bus. Manag. 11, 215–231. doi: 10.4236/ajibm.2021.112014
Jayakumar, J., Chacko, S., and Ajay, P. (2021). Conceptual Implementation of Artificial Intelligent based E-Mobility Controller in smart city Environment. Wirel. Commun. Mob. Comput. 2021, 1–8. doi: 10.1155/2021/5325116
Khan, R., and Salam, M. A. (2020). Inadequecy of economic growth for economic development. Am. J. Econ. Bus. Manag. 3, 136–152.
Kirichenko, I. A., and Smirnov, A. V. (2021). Investment complex of russia: structural shifts. World New Econ. 14, 110–122. doi: 10.26794/2220-6469-2020-14-4-110-122
Krasnoyarova, B. A., and Krotov, A. V. (2020). Risks of strategic development of the central eurasian region in the context of modern challenges. Humanit. Vector 15, 131–141. doi: 10.21209/1996-7853-2020-15-2-131-141
Lee, Y. (2020). New general theory of economic development: innovative growth and distribution. Rev. Dev. Econ. 24, 402–423. doi: 10.1111/rode.12654
Li, H., Deng, J., Yuan, S., Feng, P., and Arachchige, D. (2021c). Monitoring and Identifying Wind Turbine Generator Bearing Faults using Deep Belief Network and EWMA Control Charts. Front. Energy Res. 9:799039. doi: 10.3389/fenrg.2021.799039
Li, H., Deng, J., Feng, P., Pu, C., Arachchige, D., and Cheng, Q. (2021b). Short-Term Nacelle Orientation Forecasting Using Bilinear Transformation and ICEEMDAN Framework. Front. Energy Res. 9:780928. doi: 10.3389/fenrg.2021.780928
Li, P., Geng, Y., and Du, M. (2021d). Research on the pitting mechanism of dispersion-strengthened high-strength steel under wet-dry cycling in a marine environment. J. Ocean Univ. China 20, 1459–1468. doi: 10.1007/s11802-021-4838-5
Li, G., Liu, F., Sharma, A., Khalaf, O. I., Alotaibi, Y., Alsufyani, A., et al. (2021a). Research on the natural language recognition method based on cluster analysis using neural network. Math. Prob. Eng. 2021, 1–13. doi: 10.1155/2021/9982305
Li, H. (2022b). SCADA Data based Wind Power Interval Prediction using LUBE-based Deep Residual Networks. Front. Energy Res. 10:920837. doi: 10.3389/fenrg.2022.920837
Li, H. (2022a). Short-term Wind Power Prediction via Spatial Temporal Analysis and Deep Residual Networks. Front. Energy Res. 10:920407. doi: 10.3389/fenrg.2022.920407
Li, H., He, Y., Xu, Q., Deng, J., Li, W., and Wei, Y. (2022). Detection and segmentation of loess landslides via satellite images: a two-phase framework. Landslides 19, 673–686. doi: 10.1007/s10346-021-01789-0
Liu, C., Lin, M., Rauf, H., and Shareef, S. (2021). Parameter simulation of multidimensional urban landscape design based on nonlinear theory. Nonlinear Eng. 10, 583–591. doi: 10.1515/nleng-2021-0049
Liu, Q., Cheng, N., He, Q., Chen, Y., and Zhan, Q. (2020). Meteorological conditions and their effects on the relationship between aerosol optical depth and macro-physical properties of warm clouds over shanghai based on modis. Atmos. Pollut. Res. 11, 1637–1644. doi: 10.1016/j.apr.2020.07.001
Liu, X., and Ahmadi, Z. (2021). H2O and H2S adsorption by assistance of a heterogeneous carbon boron nitrogen nanocage: computational study[J]. Main Group Chem. 21, 185–193. doi: 10.3233/MGC-210113
Monares, P., Liu, J. H., Santibanez, R., Bernardin, A., and Zhang, R. J. (2020). Accessing the role of trust profiles for the economic growth of societies: a stochastic rule-based simulation using the prisoner’s dilemma game. IEEE Trans. Comput. Soc. Syst. 7, 849–857. doi: 10.1109/TCSS.2020.2992039
Tahirovi, H. (2020). The importance of improving free trade in developing countries. Ekonomski Izazovi 9, 28–44. doi: 10.5937/EkoIzazov2017028T
Teremetskyi, V., Solyannik, K., Zakomorna, K., Poproshaieva, O., and Yakovchuk, Y. (2021). Fiscal decentralization of ukraine: search for new approaches for the development of local self-government. Financ. Credit Activity Prob. Theory Pract. 2, 180–189. doi: 10.18371/fcaptp.v2i37.229957
Tian, J., Xia, Q., and Wang, P. (2021). Comprehensive management and coordination mechanism of marine economy. Math. Prob. Eng. 2021, 1–9. doi: 10.1155/2021/1497335
Wu, Z., and Zhou, C. (2021). Construction of an intelligent processing platform for equestrian event information based on data fusion and data mining. J. Sensors 2021, 1–9. doi: 10.1155/2021/1869281
Keywords: marine economic development, internal mechanism, route, coastal economic growth, biogeography
Citation: Zhou J and Li B (2022) Research on the internal mechanism and path of the new growth point of marine biological economy. Front. Ecol. Evol. 10:966104. doi: 10.3389/fevo.2022.966104
Received: 10 June 2022; Accepted: 30 June 2022;
Published: 28 July 2022.
Edited by:
Yusen He, Grinnell College, United StatesReviewed by:
Yan Zhang, Tokyo University of Agriculture and Technology, JapanLi Ganxin, Yanshan University, China
Copyright © 2022 Zhou and Li. This is an open-access article distributed under the terms of the Creative Commons Attribution License (CC BY). The use, distribution or reproduction in other forums is permitted, provided the original author(s) and the copyright owner(s) are credited and that the original publication in this journal is cited, in accordance with accepted academic practice. No use, distribution or reproduction is permitted which does not comply with these terms.
*Correspondence: Bin Li, eGlhb3lvdXppMTIzMzY5QDEyNi5jb20=
 Jianlong Zhou
 Bin Li*