 Zhiqiang Wang1†
 Honghong Lyu
94% of researchers rate our articles as excellent or good
Learn more about the work of our research integrity team to safeguard the quality of each article we publish.
Find out more
ORIGINAL RESEARCH article
Front. Ecol. Evol., 29 July 2022
Sec. Environmental Informatics and Remote Sensing
Volume 10 - 2022 | https://doi.org/10.3389/fevo.2022.964936
This article is part of the Research TopicAdvanced Application of Deep Learning, Statistical Modelling, and Numerical Simulation on Geo-Environmental HazardsView all 59 articles
Co-pyrolysis of plastics and biomass can effectively improve the quality of bio-oil and solve the problem of plastic pollution. However, synergistic effect of co-pyrolysis on kinetics and the role of biomass H/Ceff in co-pyrolysis are still not conclusive. In this work, the co-pyrolysis synergistic effects of three different hydrogen-to-carbon ratio (H/Ceff) of biomass-rice husk (RH), sugarcane bagasse (SUG), and poplar wood (PW) with hydrogen-rich polypropylene (PP) were studied using a thermogravimetric method. The total synergy degree (φ) and the difference between experimental and theoretical weight losses (ΔW) were defined, and the activation energies of various experimental materials were calculated by the isoconversional method. The results showed that the addition of PP reduced the dependence of product species on biomass H/Ceff during co-pyrolysis. The synergistic effect of biomass and PP was related to biomass types, pyrolysis temperature, and mass ratio of biomass to PP. The mixture of SUG and PP showed positive synergistic effect at all mass ratios. Simultaneously, at the low temperature of pyrolysis, the synergistic effect is inhibited in all mixtures, which might be due to the melting of PP. Kinetic analysis showed that the activation energy could be reduced by 11.14–31.78% by co-pyrolysis with biomass and PP. A multi-step mechanism was observed in both the pyrolysis of a single sample and the co-pyrolysis of a mixture, according to Criado’s schematic analysis.
– Plastic reduced the dependence of product species on biomass H/Ceff during co- pyrolysis with biomass.
– All the mixtures showed a negative synergistic effect at the low temperature staged.
– A positive synergistic effect was observed at high temperatures (char yield is down).
– Plastic reduced the activation energy of the mixture.
– Pyrolysis had a multi-step reaction mechanism.
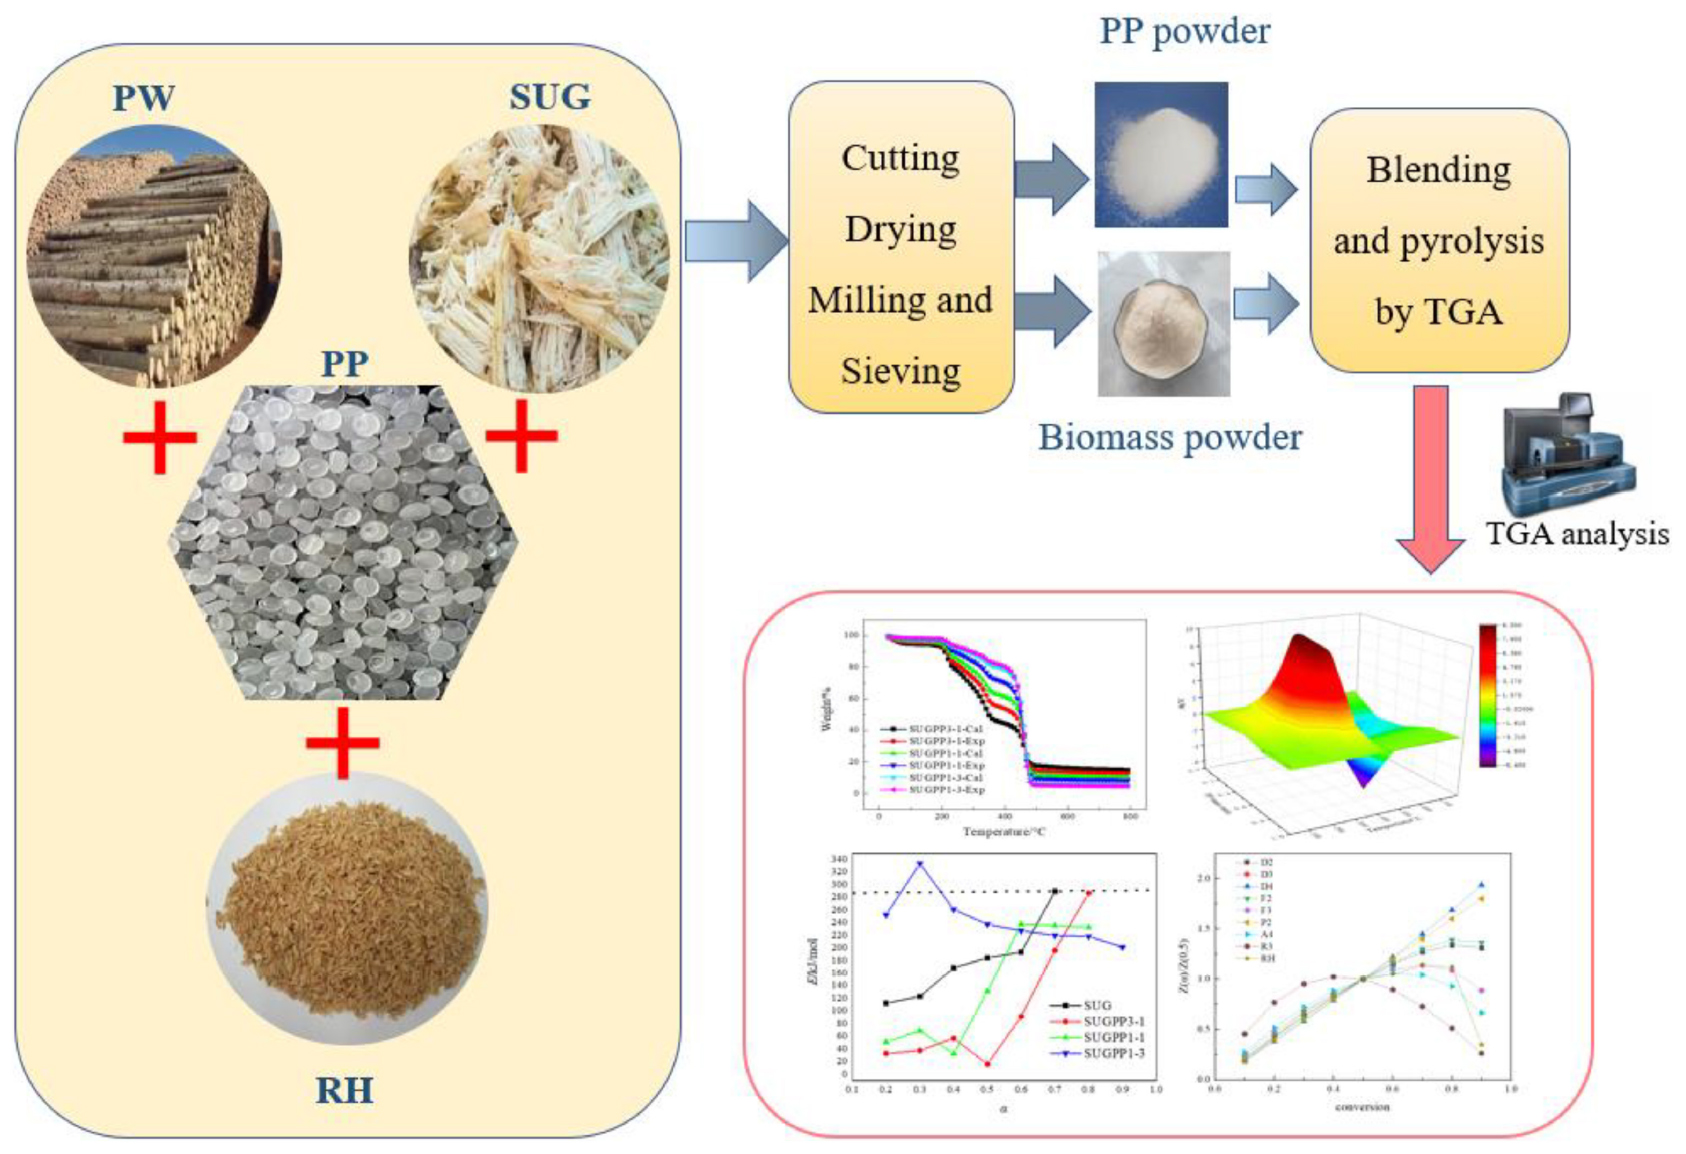
GRAPHICAL ABSTRACT. Plastic regulates its co-pyrolysis process with biomass.
Plastics play an important] role in our daily lives. It is reported that 400 million tons of plastic are produced every year (Geyer et al., 2017), of which only 5% of plastic packaging is recycled (Ncube et al., 2021). Fragmentation of plastic fragments caused by erosion leads to smaller plastic particles, namely secondary microplastics and nanoplastics, which have recently been detected in human blood (Abbasi et al., 2020). On the one hand, the recycling of plastics can solve the increasingly serious environmental pollution problem, on the other hand, it can recycle energy and alleviate the problem of energy shortage. There are many ways to treat plastics, including landfill, incineration, chemical decomposition, and thermal cracking (Cui et al., 2021). The pyrolysis of pure plastics can produce high-grade products, whose calorific value, density, viscosity, aniline point, pour point and other physical properties can be comparable with commercial gasoline and diesel (Sharuddin et al., 2016; Li et al., 2022). However, due to the high viscosity of melted or softened plastic, wax accumulation, coking formation, so that the system blockage, resulting in product yield and quality deterioration (Li et al., 2021a; Wang et al., 2021).
As an important renewable energy source, biomass is clean, pollution-free, environmentally friendly, and renewable, attracting the attention of scientific researchers worldwide. Co-pyrolysis of biomass and plastics can solve the problems of sticking and clogging equipment during the separate pyrolysis of plastics while converting biomass to biofuels (He and Kusiak, 2018; Atanda et al., 2020; Li et al., 2021b). The effective hydrogen-to-carbon ratio (H/Ceff) of pyrolysis feedstock has been highly related to the yield of aromatics and coke from pyrolysis products (Wang et al., 2019). However, the H/Ceff of most biomass is less than 0.3, which also explains the low yield of biomass pyrolysis oil and the high yield of coke (Ahmed et al., 2020). Therefore, the H/Ceff of biomass plays an important role in the process of pyrolysis and conversion to bio-energy, because it determines the generation of free radicals (e.g., hydroxyl and hydrogen radical), which promotes the cracking of aromatics and reduces the gas production rate (Alvarez et al., 2014). Since plastic is a kind of hydrogen-rich raw material, co-pyrolysis of biomass and hydrogen-rich plastic is a promising method to solve this problem. Anderson et al. (1995) proposed that plastics could be used as supplementary hydrogen sources in co-pyrolysis, which attracted extensive attention. Simultaneously, researchers are increasingly investigating the synergistic effect and mechanism for co-pyrolysis of raw materials. However, few studies have been reported on the synergistic effects of different H/Ceff biomass in co-pyrolysis.
Moreover, there are different conclusions about the synergistic or inhibitory effects of biomass and plastic co-pyrolysis. Some studies have shown that the co-pyrolysis of biomass and plastic has a positive synergistic effect (Brebu et al., 2010). However, some studies also show that the co-pyrolysis of biomass and hydrogen-rich raw materials has an inhibitory effect (Chen et al., 2012). Therefore, a synergistic effect of co-pyrolysis on volatile yield and kinetic characteristics has not been concluded (Xiu and Shahbazi, 2012; Abnisa and Wan Daud, 2014). Although many researchers have reported the synergistic effect during co-pyrolysis, the specific mechanism remains unclear due to the complex interaction between different raw materials and working conditions (Zheng et al., 2017; Tang et al., 2018; Wang et al., 2018). Therefore, the change of co-pyrolysis reaction kinetics with temperature and mixing ratio must be further explored to elucidate the co-pyrolysis process.
This study is an experimental verification paper. Through the pyrolysis of biomass and polypropylene, the influence of plastic addition amount on the co-pyrolysis process of biomass with different H/Ceff, and the synergistic law of co-pyrolysis of biomass with plastic with different H/Ceff are studied, three different H/Ceff biomass, i.e., rice husk (RH), sugarcane bagasse (SUG), and poplar wood (PW), were selected in this study. The change of their synergistic effect with temperature and biomass/PP mass ratio was investigated, and their interaction mechanism was revealed. It provides reference for reduce char production and guidance for improving pyrolysis oil and gas yield, thereby reducing energy input and coke yield. The following are the specific objectives of this study. (1) To study the effect of the addition of plastics on their co-pyrolysis process with different H/Ceff biomasses. (2) Based on the pyrolysis of biomass and PP, the synergistic effect of pyrolysis was revealed by calculating the difference between the experimental and calculated values. (3) Scanning electron microscopy (SEM) was used to investigate the surface structures of single substances and mixtures at 380°C (Reveal the mechanism). (4) The effect of co-pyrolysis on the activation energy of the mixture was studied by kinetic analysis (The activation energy is reduced during co-pyrolysis). (5) The mechanism of pyrolysis in each stage was verified by Criado’s Master Plot. The study provides theoretical guidance for reducing energy input and increasing the output of high value-added products during engineering pyrolysis.
Rice husk (RH), sugarcane bagasse (SUG), and poplar wood (PW) were selected as the biomass materials for this experimental study. Polypropylene (PP) was purchased from Shanghai Tengzhun Biological Co., Ltd. (Shanghai, China). All materials were rinsed, dried, ground, and sieved to obtain powder with size less than 100 mesh, to avoid differences in heat transfer between particles. The biomass powder was dried at 105°C for 12 h. Finally, all materials were vacuum-sealed for use.
The H/Ceff of the four raw materials was calculated according to Eq. (1). Industrial analysis was conducted according to ASTM standards (E1756-01, E872-82, and E1755-01). Table 1 shows the final and approximate analysis results and the calculated H/Ceff. The H/Ceff of PP was high, while the available hydrogen content of biomass material was low due to the high oxygen content.
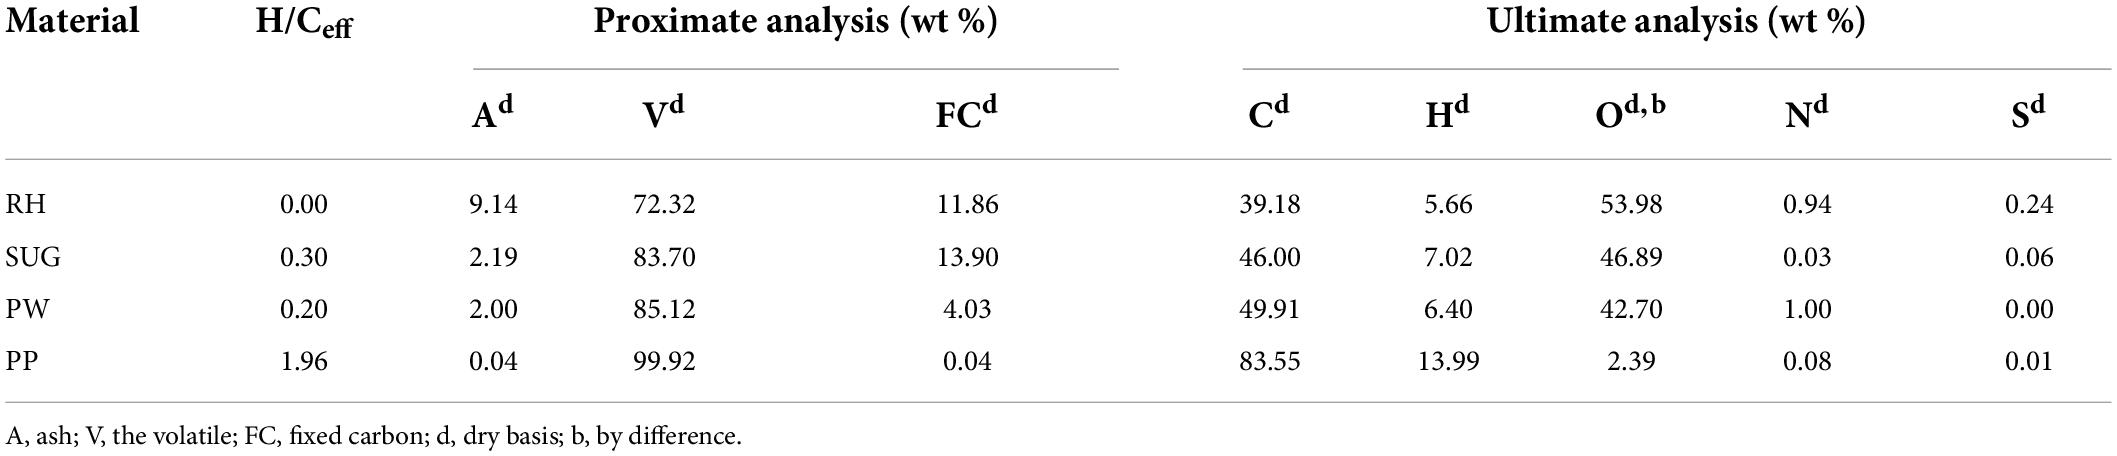
Table 1. Proximate and ultimate analysis of the raw materials.
The effective hydrogen index can be calculated as follows (Chen et al., 1988):
Thermogravimetric analysis (TGA) experiments were conducted using an SDT-Q600 (TA Instruments, United States) thermogravimetric analyzer. The morphological structures of co-pyrolysis char samples from RH, SUG, PW, and PP were explored by a JSM-6390 SEM (JEOL Ltd., United States).
The biomass powder was mechanically mixed (6 h) with PP powder to obtain different biomass to PP mass ratios (3:1, 1:1, and 1:3). The mixture was labeled as RHPP3-1, RHPP1-1, RHPP1-3, SUGPP3-1, and so on, based on the feedstock type and mass ratio. For comparison, RH, SUG, and PW were also pyrolyzed under identical experimental conditions. In particular, approximately 10 mg samples were uniformly placed in an alumina crucible and heated from 25 to 800°C at three heating rates (10, 20, and 30°C/min, respectively). The whole process was performed under nitrogen atmosphere at a flow rate of 100 mL/min. Three groups of repeated experiments were conducted on the mixed samples to ensure that the experimental errors were within a reasonable range.
To quantify the volatile release performance, the devolatilization index of the sample Di (Wu et al., 2014) was defined as follows:
The meanings of parameters are shown in Table 2, which can be obtained from TG (the mass of a substance changes with temperature) and DTG (DTG is the first differential curve of TG) curves (Weiping and Yinying, 2007). In addition, to evaluate the synergistic effect of co-pyrolysis of PP and biomass materials, the deviation (ΔW) between the experimental and the calculated values of the TG curve was used to estimate the synergistic effect (Park et al., 2010).
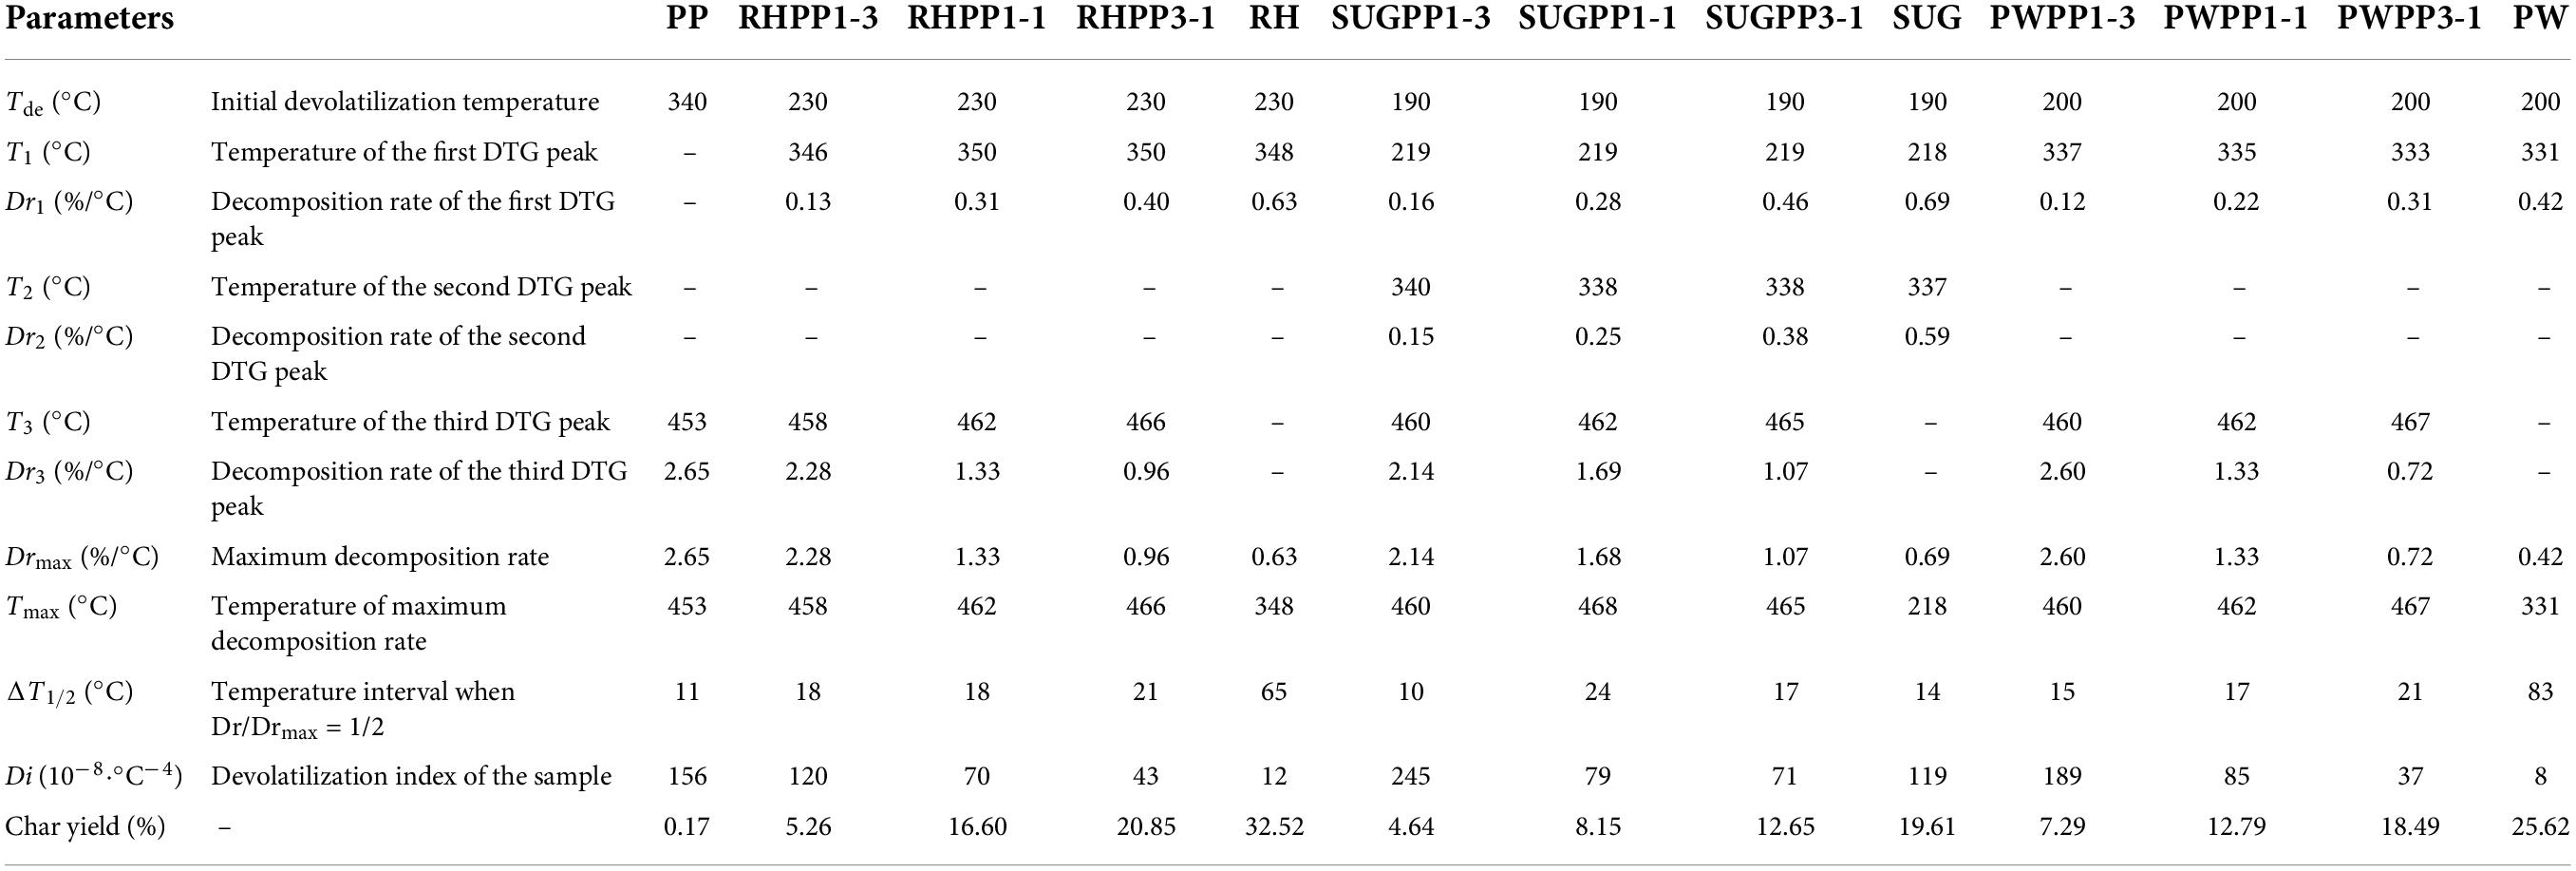
Table 2. Pyrolysis parameters of PP, biomass and their mixtures under a heating rate of 10°C/min.
Where WExperimental is the test value of TG curve of the mixture. The WCalculated was obtained from the summation of the TG curves of individual samples, which was calculated as follows:
Where XB and XP are the mixing ratios of biomass components and PP in the mixture, respectively; and WB and WP are the mass losses of the TG profile of a single sample under the same experimental conditions as the mixture.
The deviation between the experimental and the calculated values of coke was used to estimate the overall degree of synergistic effect, and it was calculated as follows:
Where CharExperimental is the residual mass after sample experiment. The CharCalculated is obtained from the summation of weight loss of individual samples.
Moreover, the correlation coefficient (r) of WExperimental and WCalculated can also be used to evaluate the synergistic effects, which is calculated as follows:
Where Cov is covariance. D is the variance and E is the expectation.
According to previous studies, the error caused by the reaction mechanism function is not considered when calculating the activation energy using the isoconversional method (Zhou et al., 2021). Therefore, the Flynn–Wall–Ozawa (FWO; Ozawa, 1965), Kissinger–Akahira–Sunose (KAS; Kissinger, 1957), and Starink (1996) methods were adopted in this study to calculate the activation energy of each experimental material, which can be expressed as:
Where β is the heating rate (K/min), Tα is the temperature corresponding to the conversion rate α(K), E is the activation energy (J/mol), R is the gas constant [8.314 J/(mol K)], and G(α) is the integration function of the reaction model. A is represents the pre-exponential factor (min–1). The value of ln(β/) and lnβ versus 1/T under constant α at several β can be obtained by linear regression, then the E at various a could be solved. Moreover, the activation energy under different heating rates β and the same conversion rate α can be calculated through linear regression of lnβ and 1/Tα.
The Master plot was used to evaluate reaction mechanism of RH, PW, SUG, PP, and their mixtures (Criado, 1978).
Criado’s master plot was generated by Eq. (11). The above equation is employed to generate the master plots equivalent to various solid-state reaction mechanism as mentioned in Table 3. In this equation, the term [f(α)G(α)/f(α)G(α)] will give a theoretical curve, which signifies the characteristics of each reaction mechanism. While, the term (Tα/T0.5)2× [(dα/dt)α/(dα/dt)0.5] will reduce to a curve obtained from experimental values. The conversion value α = 0.5 is selected as a reference value, at which, master plot from all the reaction mechanism and experimental curve will intersect to each other at the value of [Z (α)/Z (0.5)] = 1. The principal reaction mechanism for experimental value is decided by comparing the theoretical and experimental curves. The theoretical curve which is closest to the experimental curve is selected as reaction mechanism (Mishra et al., 2015; Dhyani et al., 2017; Li, 2022a,b).
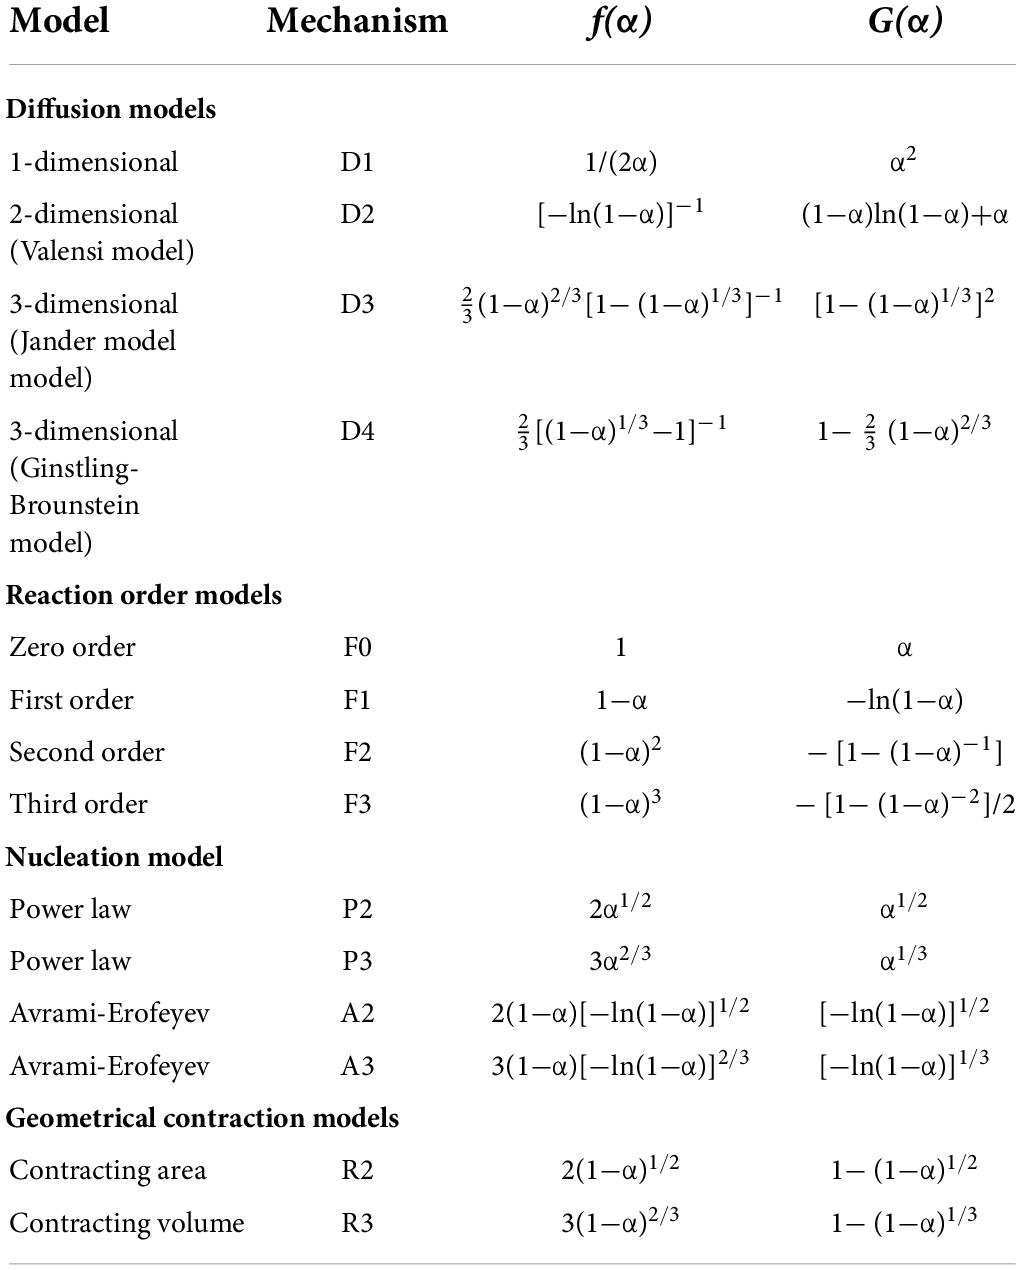
Table 3. Algebraic expression of different models for solid-state heterogeneous reactions.
Figure 1 shows the pyrolysis characteristics of RH, PW, SUG, and PP at 10°C/min, which exhibit significant differences. The initial decomposition temperature of PP was 340°C, and the pyrolysis was completed at 480°C. However, the pyrolysis temperature of biomass materials was generally low, because PP is more stable than biomass and PP requires a higher pyrolysis temperature (Burra and Gupta, 2018). The initial devolatilization temperatures of RH, PW, and SUG were 230, 200, and 190°C, respectively. The pyrolysis of RH, PW, and SUG was completed at 380°C, and the pyrolysis interval was larger than that of PP. This is primarily because biomass is composed of complex structures such as hemicellulose, cellulose, and lignin. In particular, lignin is more difficult to decompose, which widens the pyrolysis interval of biomass (Chen et al., 2020).
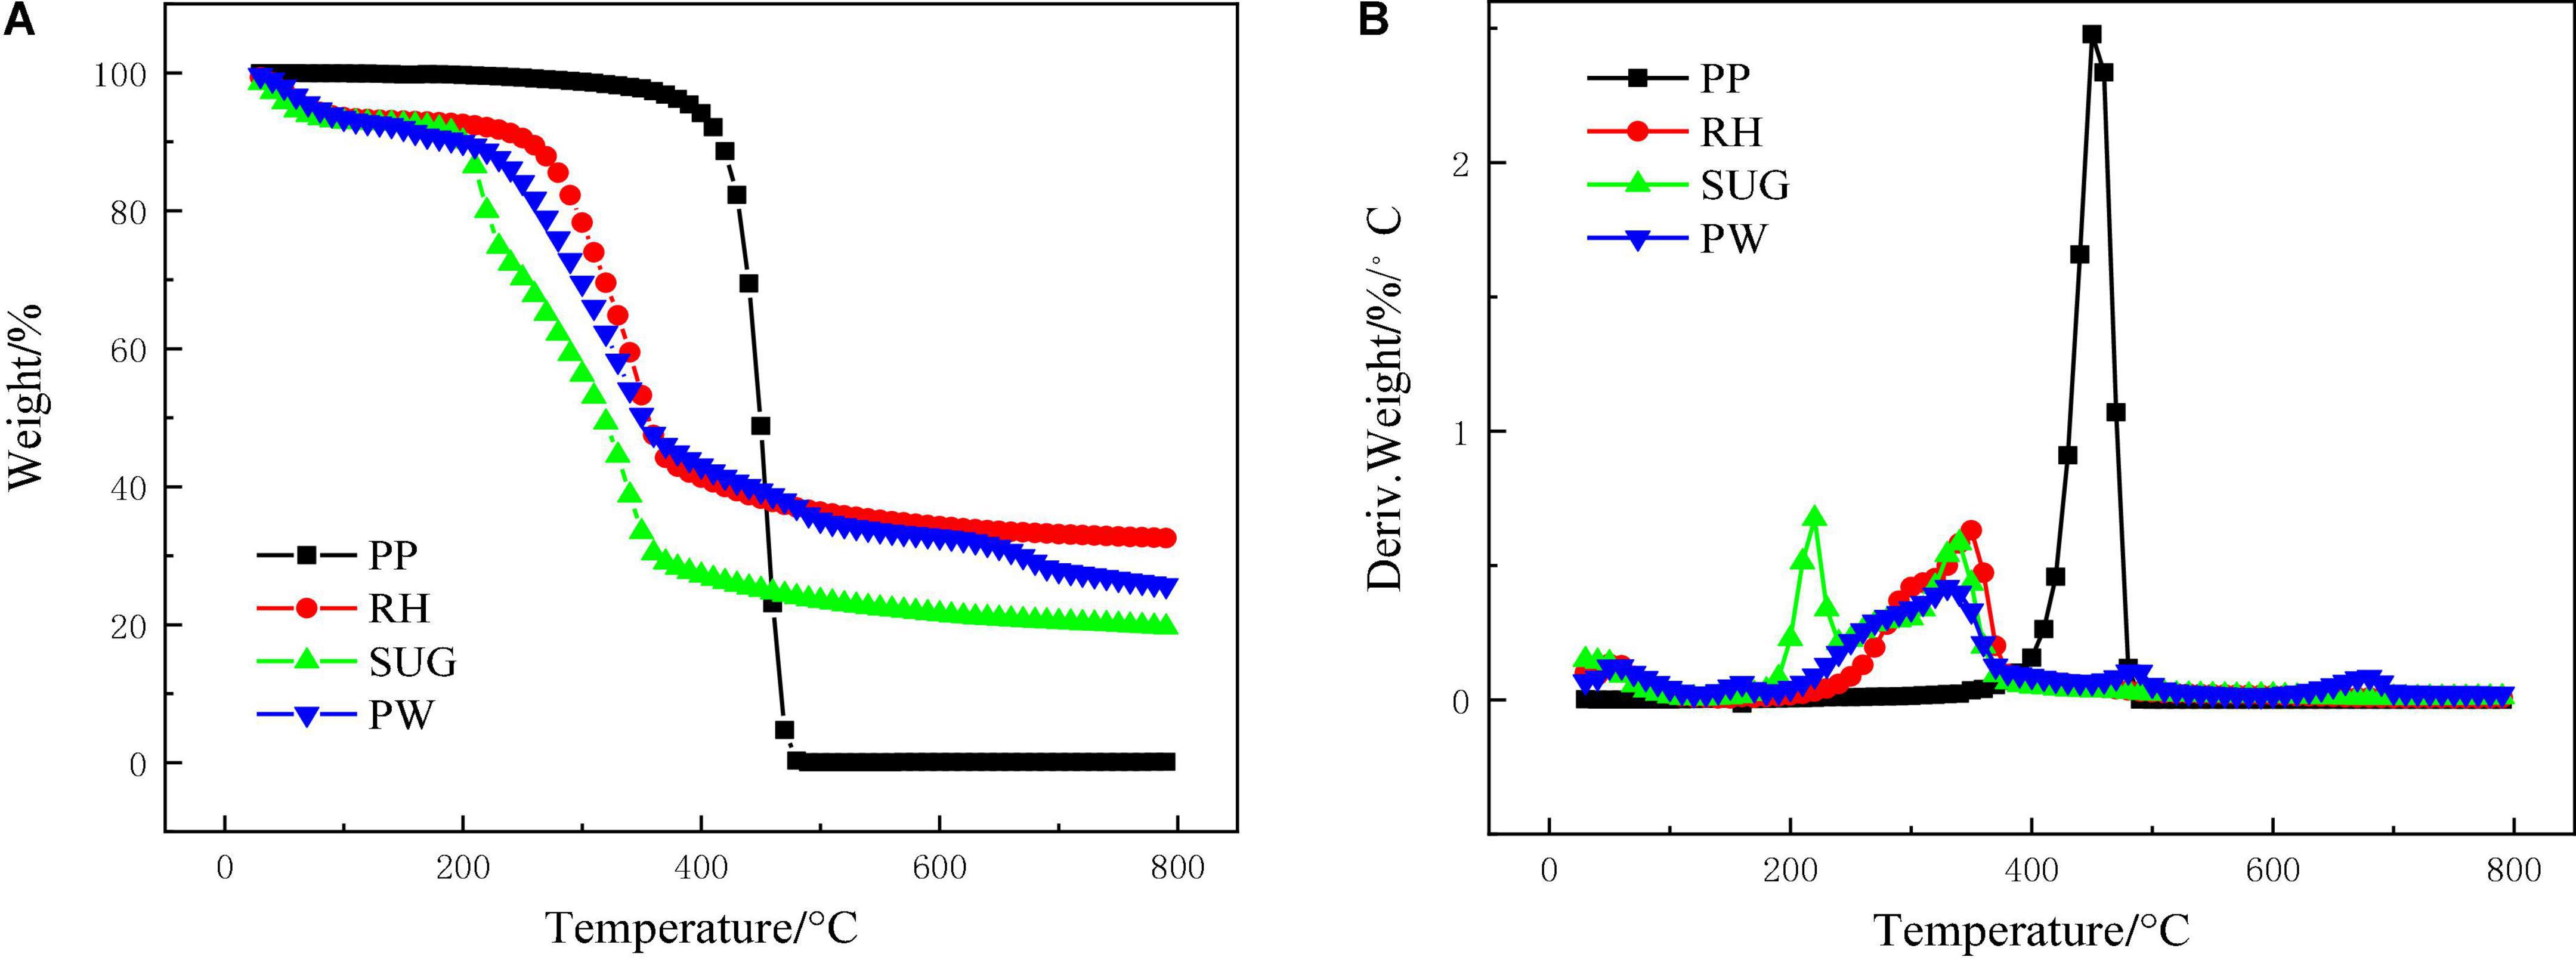
Figure 1. Pyrolysis characteristics of PP, RH, SUG, and PW with a heating rate of 10°C/min, (A) TG profiles and (B) DTG profiles.
Table 2 lists the characteristic parameters of RH, PW, SUG, and PP at 10°C/min. According to the DTG curves, RH has a maximum peak value of 0.63%/°C (Table 2) at 348°C, and a shoulder is observed in the range of 300–320°C, which is primarily due to the pyrolysis of hemicellulose and lignin in RH (Tsai et al., 2007). The corresponding char yield was 32.52%. PW showed a peak of 0.42%/°C at 331°C, and its pyrolysis rate decreased after 270°C, which was caused by the complete pyrolysis of hemicellulose. The corresponding char yield was 25.62%. The pyrolysis curve of SUG was distinct. Two peaks were observed in the DTG curve corresponding to 218°C, 0.69%/°C and 337°C, 0.59%/°C, and there are shoulders in the range of 280–310°C. A similar phenomenon was observed by Miranda et al. (2021). PP has a pyrolysis peak at 453°C with a peak value of 2.65%/°C. The final coke content was 0.17%, which is significantly lower than that of biomass materials (Wu et al., 2015). In addition, devolatilization index (Di) was used to evaluate the performance of volatile substance release (Wu et al., 2014). The higher the Di value, the more readily the volatiles were released. The Di of PP, RH, SUG, and PW were 156, 12, 119, and 8, respectively. The Di value of PP was significantly higher than that of biomass. Although the pyrolysis temperature of PP was high, the structure of PP was simple and the pyrolysis temperature range was very narrow (Han et al., 2014). This might account for the high Di value of PP. The reason for the high Di value of SUG is that it contains a large amount of sugar, which can be considerably decomposed at a lower temperature; therefore, the DTG pyrolysis curve of SUG has a pyrolysis peak at 210°C. The char yield of biomass decreased with the increase of H/Ceff from 32.52 and 25.62% of RH, PW and SUG to 19.65%, respectively.
Figures 2A,B illustrate the pyrolysis behavior of RH, PP, and their mixtures. The characteristic parameters of the mixtures are shown in Table 2. As shown in Figure 2A, with the increase of PP content, the semi-coke yields of RHPP3-1, RHPP1-1, and RHPP1-3 gradually decreased from 20.85 to 16.60% and 5.26%, respectively. The DTG curve showed that the previous maximum pyrolysis rate (the first peak) of the mixture decreased with increasing PP mass. The value of DTG decreased from 0.40%/°C of RHPP3-1 to 0.13%/°C of RHPP1-3. However, the second maximum pyrolysis rate (the second peak) increased with the increase in PP content, from 0.96%/°C of RHPP3-1 to 2.28%/°C of RHPP1-3. This indicated that the addition of PP increased the pyrolysis temperature of the mixture, but the volatile range of the pyrolysis products decreased. In addition, the Di value of the mixture of RH and PP increased from 43 to 120, indicating that the addition of PP improved the release of volatile substances.
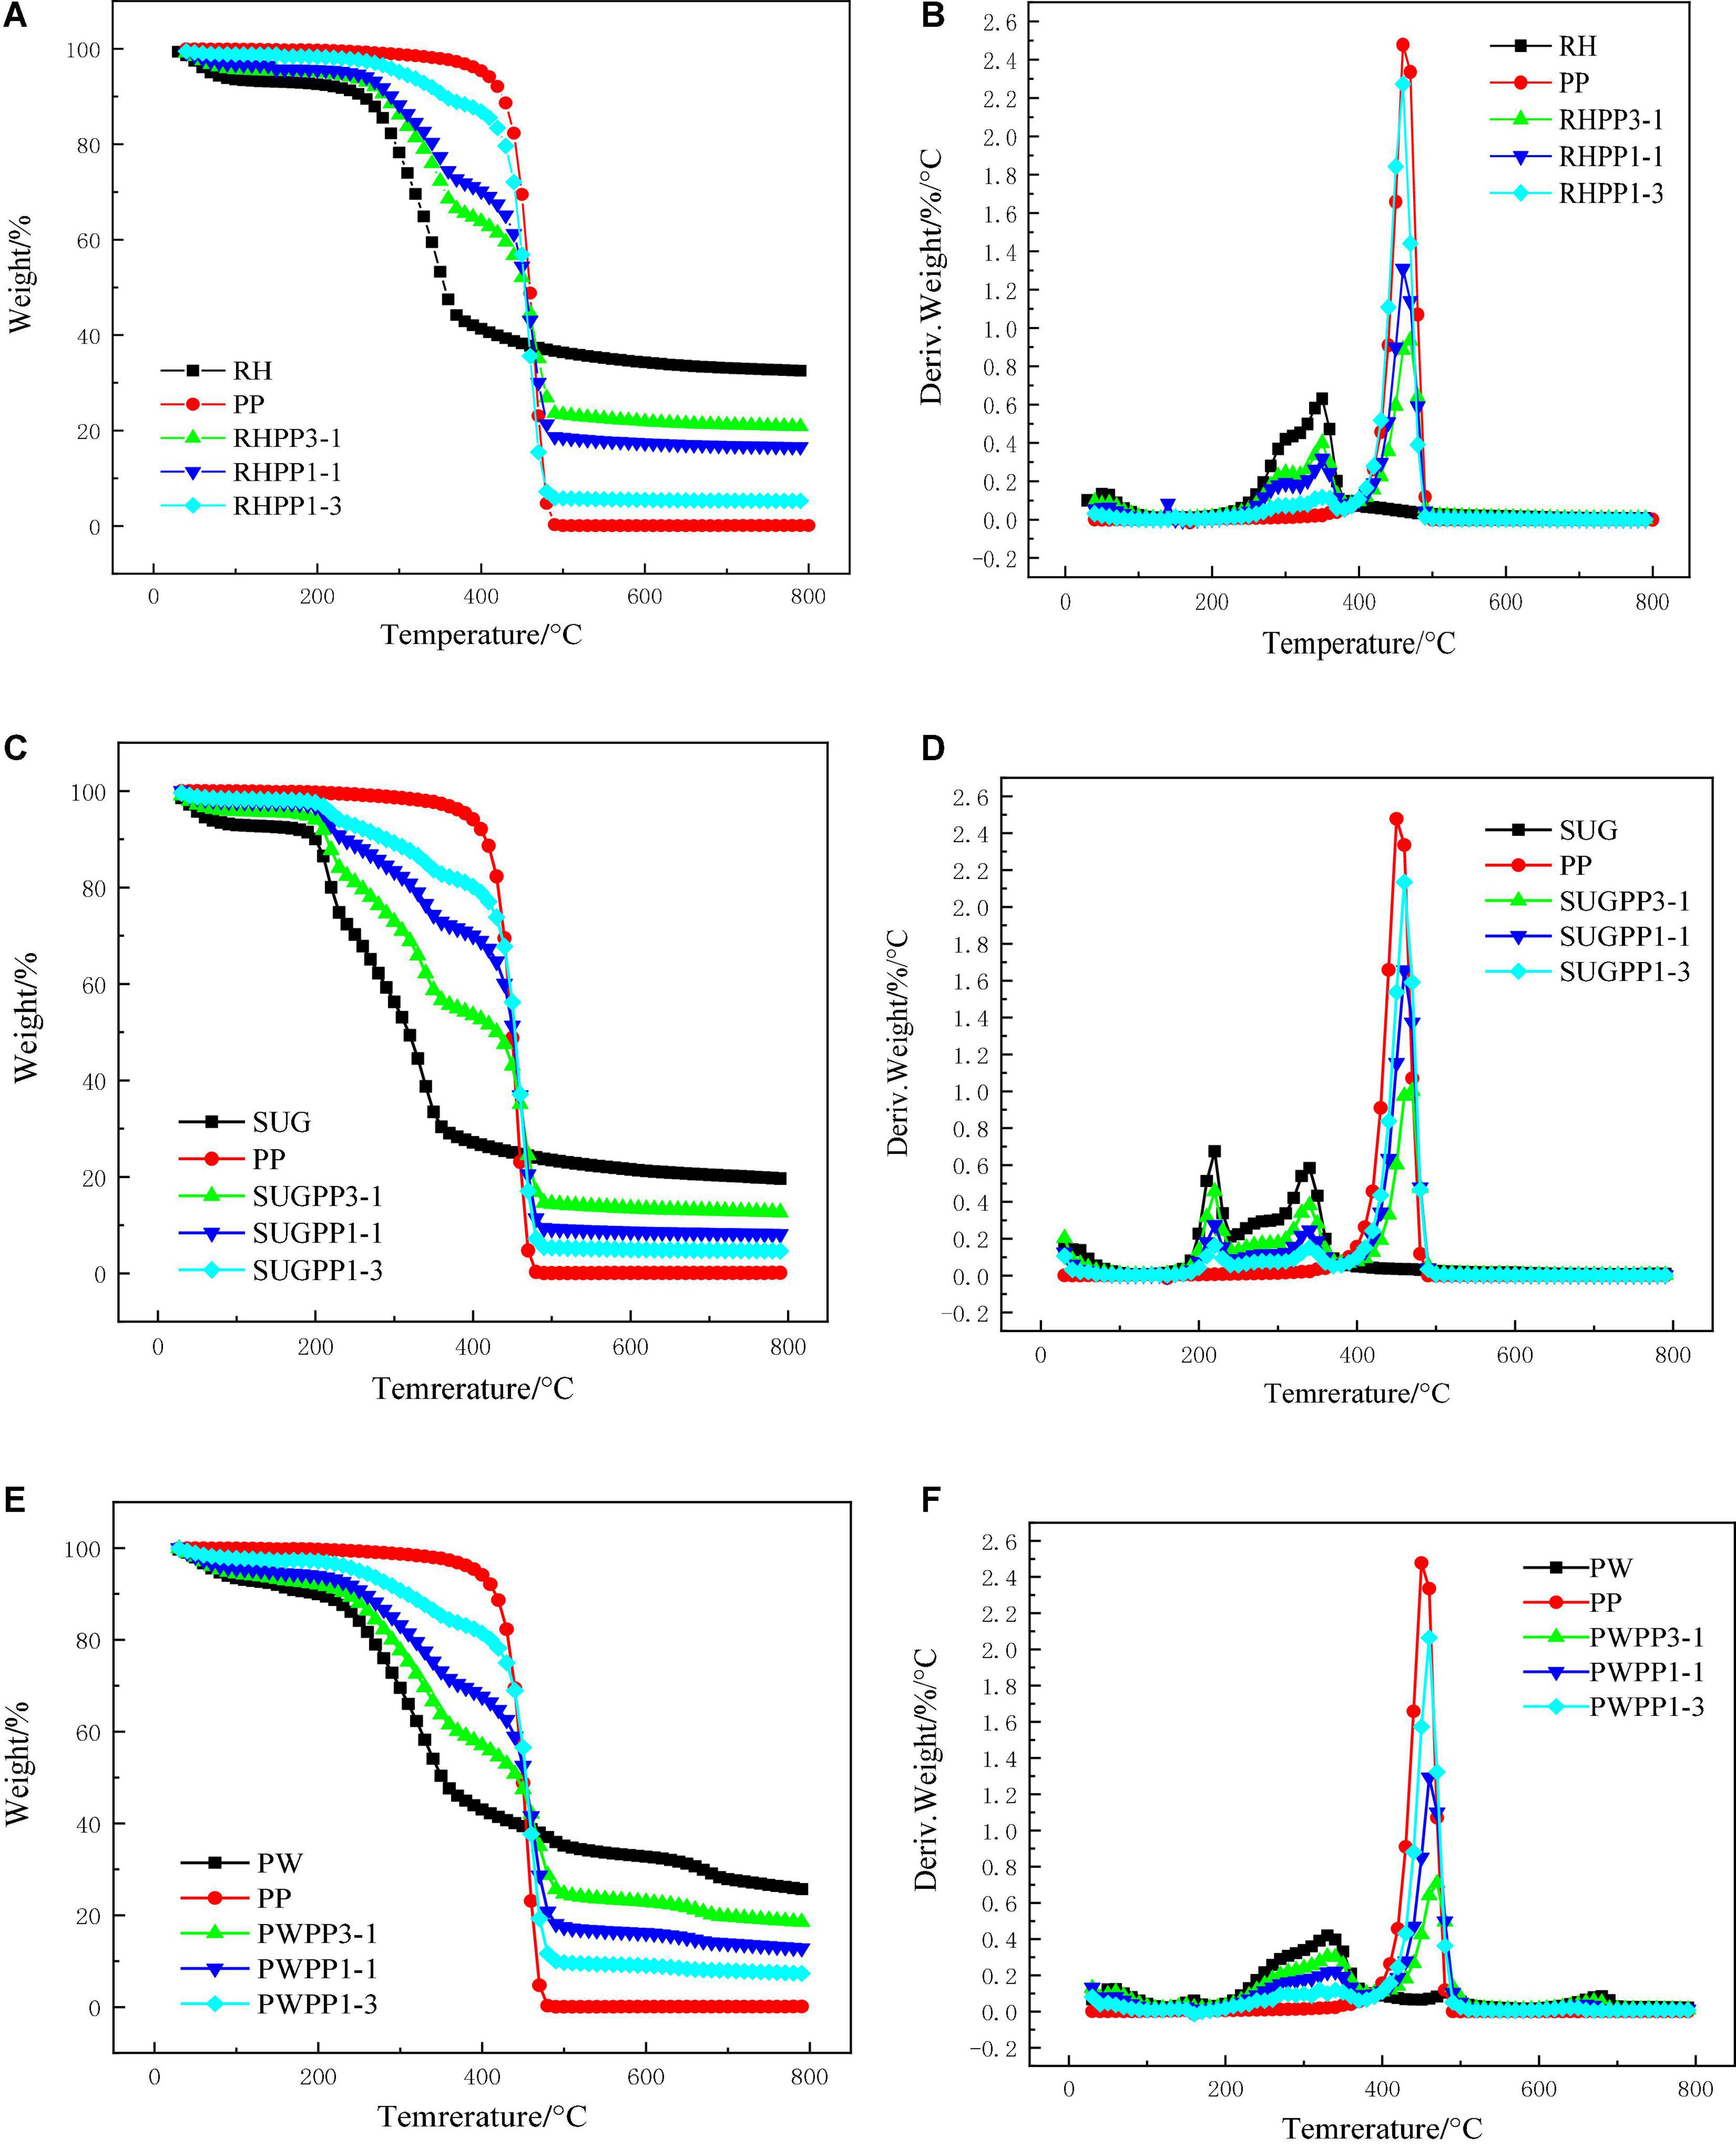
Figure 2. Pyrolysis characteristics of the PP, RH, SUG, PW, and their mixtures in various mass ratios in TGA with heating rate of 10°C/min, (A) TG profiles of RHPP, (B) DTG profiles of RHPP, (C) TG profiles of SUGPP, (D) DTG profiles of SUGPP, (E) TG profiles of PWPP, and (F) DTG profiles of PWPP.
The pyrolysis behavior of SUG and PP are shown in Figures 2C,D, and the characteristic parameters are listed in Table 2. The pyrolysis characteristics of SUG and PP were similar to those of RH and PP. The peak values of the first two pyrolysis peaks decreased with the increase of PP content, and the char yield also decreased. The char yields of SUGPP1-3, SUGPP1-1, and SUGPP1-3 were 12.65, 8.15, and 4.64%, respectively. From the DTG curve, the first and second peaks of SUGPP3-1 decreased from 0.46%/°C and 0.38%/°C to 0.16%/°C and 0.15%/°C, respectively. In contrast, the third peak showed the opposite pattern and increased from 1.07%/°C of SUGPP3-1 to 2.14%/°C of SUGPP1-3. The DTG curve shows that the pyrolysis peak temperature of the mixture was higher than that of PP, primarily because tar is generated when SUG is higher than 400°C, which leads to the increase of its pyrolysis temperature (Aboulkas et al., 2010). The devolatilization index (Di) of the mixture of SUG and PP increased from 71 to 245, which indicated that the addition of PP improved the release of volatile substances.
Figures 2E,F illustrate the pyrolysis behavior of PW, PP, and their mixtures. Its pyrolysis behavior was similar to that of SUG and PP. The TG curve shows that the pyrolysis interval of the mixture is wider than that of the pure substance. The yield of char decreased with the increase of PP content, and it decreased from 18.49% in PWPP3-1 to 7.29% in PWPP1-3. On the DTG curve, the first peak primarily indicates the pyrolysis behavior of PW (Aboulkas et al., 2010), and the peak value gradually decreased with the increase of PP content from 0.31%/°C of PWPP3-1 to 0.12%/°C of PWPP1-3. The second peak primarily exhibits the pyrolysis behavior of PP, and the peak value increased with the increase of PP mass ratio in the mixture from 0.72%/°C of PWPP3-1 to 2.60%/°C of PWPP1-3. The Di value of the mixture also increased from 37 to 189, indicating that the addition of PP improved the release of volatile substances.
The above observations revealed that the influence of the addition of three types of biomass to PP had approximately similar effects on the changes of co-pyrolysis parameters. However, the temperature range of each mixture was different, which was primarily because of the different compositions and contents (cellulose, hemicellulose, and lignin) of various biomass. Furthermore, because the specific volume of each biomass material varied considerably, this led to a difference in heat transfer and increased the changes in heat transfer during the pyrolysis process. The analysis of TGA curve shows that the char yield decreases after PP is added to the biomass, which also indicates that PP reduces the influence of biomass H/Ceff on the pyrolysis process and has positive significance for improving oil and gas production. According to each DTG curve, the pyrolysis peak of PP in the mixture was approximately 10°C higher than that of pure PP, indicating the existence of a synergistic effect between the biomass and PP. These interactions are further discussed in section “Synergistic effects.”
To evaluate the degree of synergistic effect between RH and PP, the experimental data were compared with the calculated data based on the weighted average of individual samples with residual ratios. The trends of WExperimental and WCalculated plotted against the PP mass ratios under 10°C/min are shown in Figures 3A,B. As shown in Figure 3A, the value of WExperimental was lower than that of WCalculated until 400°C, which implied that synergistic effects from RH and PP presented a negative effect on the pyrolysis process, with a lower volatile yield than the calculated value. As shown in Figure 3B, RHPP3-1 reached its maximum value at 380°C, with a difference of 9.12% (experimental analysis data, not shown). The reason for this phenomenon might be that PP melted and covered the surface of RH at 165°C to inhibit the volatilization of RH. This indicated that the presence of PP in the low temperature stage of pyrolysis had an inhibitory effect on the volatilization of RH. Figure 3B clearly shows that when the temperature is 470°C, the experimental weight loss of the other two groups of mixed materials, except the RHPP1-1 sample, was greater than the calculated weight loss, and the experimental residual carbon content of the two samples was less than the calculated value after the pyrolysis. This revealed that the two have a positive synergistic effect in the high-temperature stage. After the pyrolysis of the RHPP1-1 sample, the difference between the experimental and the calculated residual carbon contents was 0.28%, suggesting a weak inhibitory effect. Therefore, the synergistic effect of RH and PP during co-pyrolysis was related not only to temperature but also to their mass ratios. The r of WExperimental and WCalculated from RH and PP mixtures were 0.9934, 0.9998, and 0.9987 for a PP mass ratio of 25, 50, and 75%, respectively.
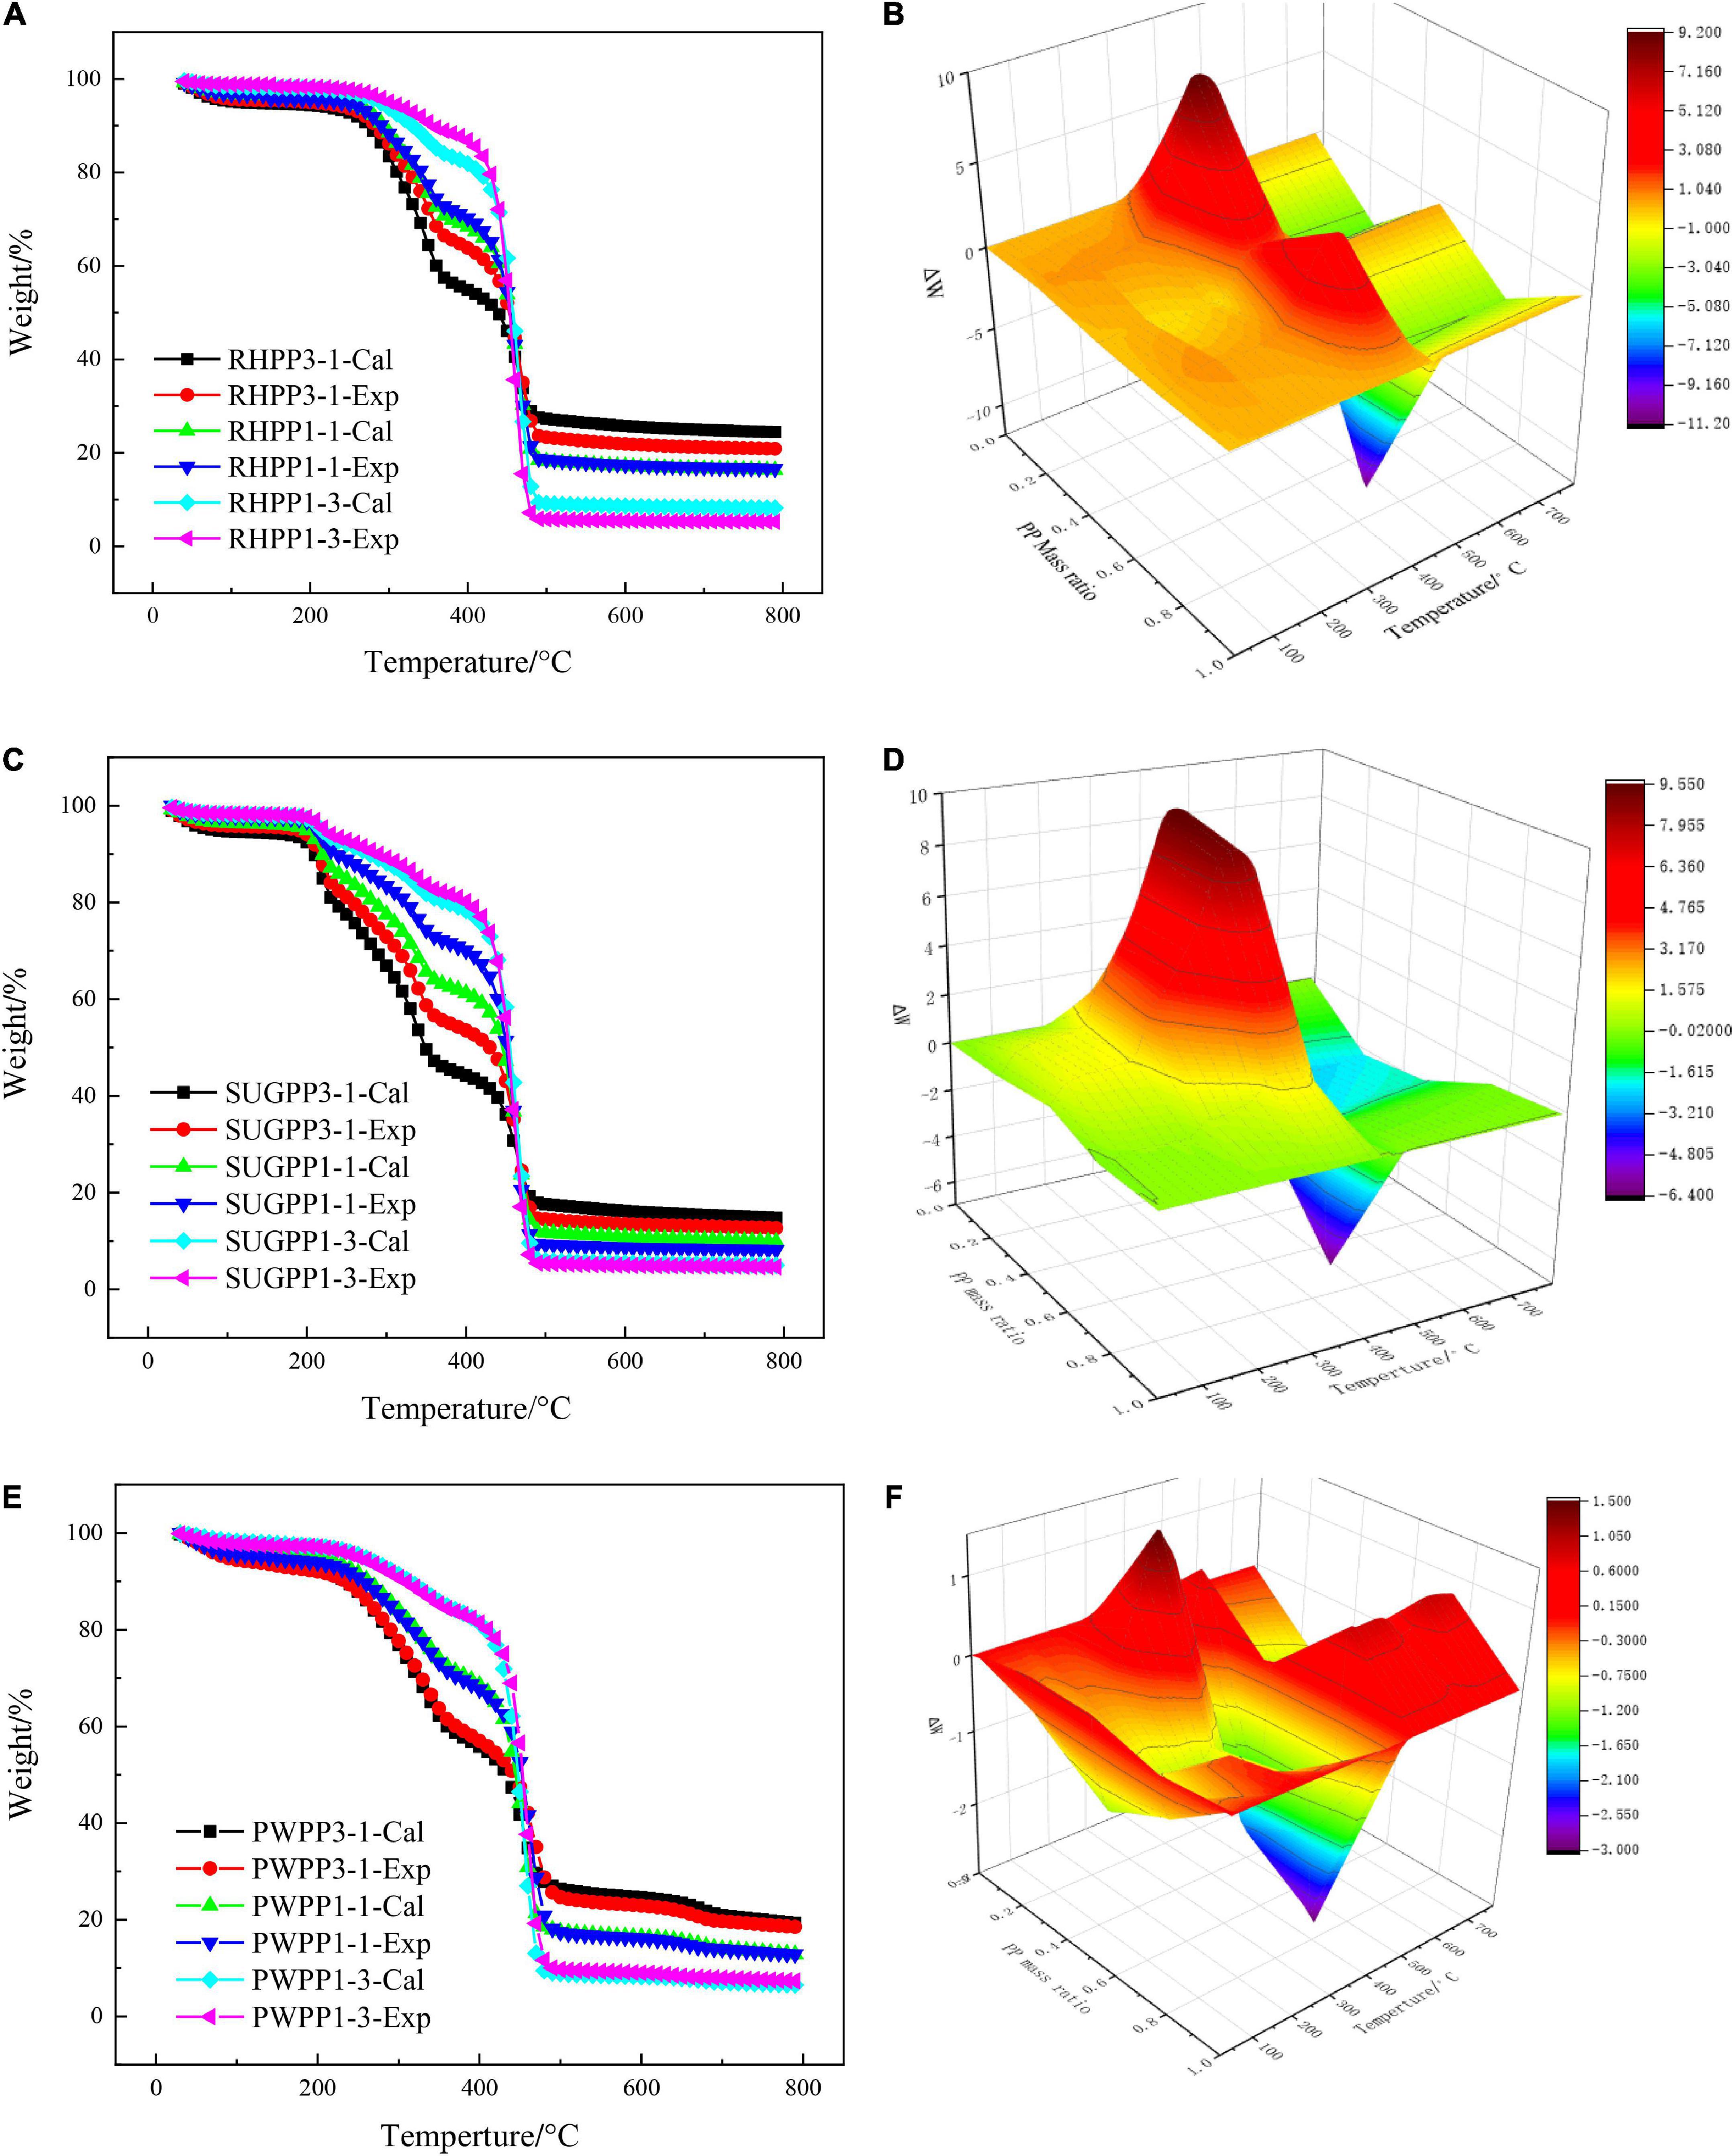
Figure 3. TG profiles comparison between the experimental and calculated value from the mixtures under 10°C/min, (A) RH and PP mixtures, (B) ΔW for RH blended with PP, (C) SUG and PP mixtures, (D) ΔW versus for SUG blended with PP, (E) PW and PP mixtures, and (F) ΔW for PW blended with PP.
Figures 3C,D show the WExperimental and WCalculated trends of SUG and PP mixtures under different PP mass ratios. The value of WExperimental was lower than that of the WCalculated under the three different PP mass ratios, which was similar to the pyrolysis of the RH and PP mixture in the low temperature zone (<400°C). At 370°C, the deviation of the SUGPP3-1 mixture reached the maximum absolute value of 9.54%, which indicates that the presence of PP during the pyrolysis of SUG inhibited the decomposition of SUG and reduced the volatile matter content. The reason for this trend might be the same as that for the RH and PP mixture, because PP melts and covers the surface of SUG at 165°C to inhibit the production of volatile matter. In the high-temperature zone (>470°C), the experimental residual carbon content after the pyrolysis of the other two groups of mixed materials, except the SUGPP1-3 sample, was less than the calculated residual carbon content. This showed that the two values had a positive synergistic effect in the high-temperature stage. This is similar to the conclusion of Chen et al. (2020) on the co-pyrolysis of cellulose and polypropylene. However, Figure 3D shows that the largest positive synergistic effect occurred in the SUGPP1-3 mixture at 470°C, where the deviation value was −6.34%. It is much higher than the other two mixtures (SUGPP1-1 and SUGPP3-1). However, the difference between experimental and calculated residual carbon content (ΔW) of SUGPP1-3 sample after pyrolysis is only −0.34%, which is much lower than that of the SUGPP3-1 (−2.10%) and SUGPP1-1 (−1.73%). The result indicates that there is a weak positive synergistic effect of SUGPP1-3 mixture, which is lower than the positive synergistic effect of the other two mixtures. It further shows that the change in the synergistic effect of the mixture does not up to the instantaneous values of ΔW, but a continuous process. The positive synergistic effect of SUGPP1-1 and SUGPP3-1 on PP and SUG during pyrolysis was stronger than that of SUGPP1-3, even though he instantaneous value was smaller than that of SUGPP1-3. The r of WExperimental and WCalculated from SUG and PP mixtures were 0.9937, 0.9969, and 0.9996 for PP mass ratios of 25, 50, and 75%, respectively.
The deviation curves of WExperimental and WCalculated under the three PW mass ratios are illustrated in Figures 3E,F. Figure 3E shows that the synergistic effect of the mixture of PW and PP is different from that of the first two (RHPP and SUGPP), and the synergistic effect of the mixture is weak. In the low temperature section of pyrolysis (<400°C), the PWPP3-1 mixture had a weak inhibitory effect, and the maximum deviation was 1.49% at 340°C, which was smaller than that of the RH-PP and SUB-PP mixtures. The mixture of PWPP1-1 and PWPP1-3 showed extremely weak promotion effects on the pyrolysis process. Figure 3F shows that the PWPP1-3 sample showed the largest positive synergy point at 460°C, and the promotion degree was 3.00%, which was also smaller than that for the other two biomass mixtures. In the high-temperature zone (>470°C), except for the PWPP3-1 mixture which showed a weaker promotion effect, the other two mixtures exhibited an inhibitory effect. Figure 4 shows that the pyrolysis gas of PWPP3-1 and PWPP1-3 mixtures had opposite phenomena, where the amount of pyrolysis gas from PWPP3-1 was higher than the calculated result and that from PWPP1-3 was smaller. This indicated that PWPP1-3 presented an overall positive synergy, while PWPP3-1 exhibited the opposite effect. The PWPP1-1 sample showed a weak inhibitory effect. The r of WExperimental and WCalculated increased from 0.9985 to 0.9989 as the PP mass ratio increased from 25 to 75%.
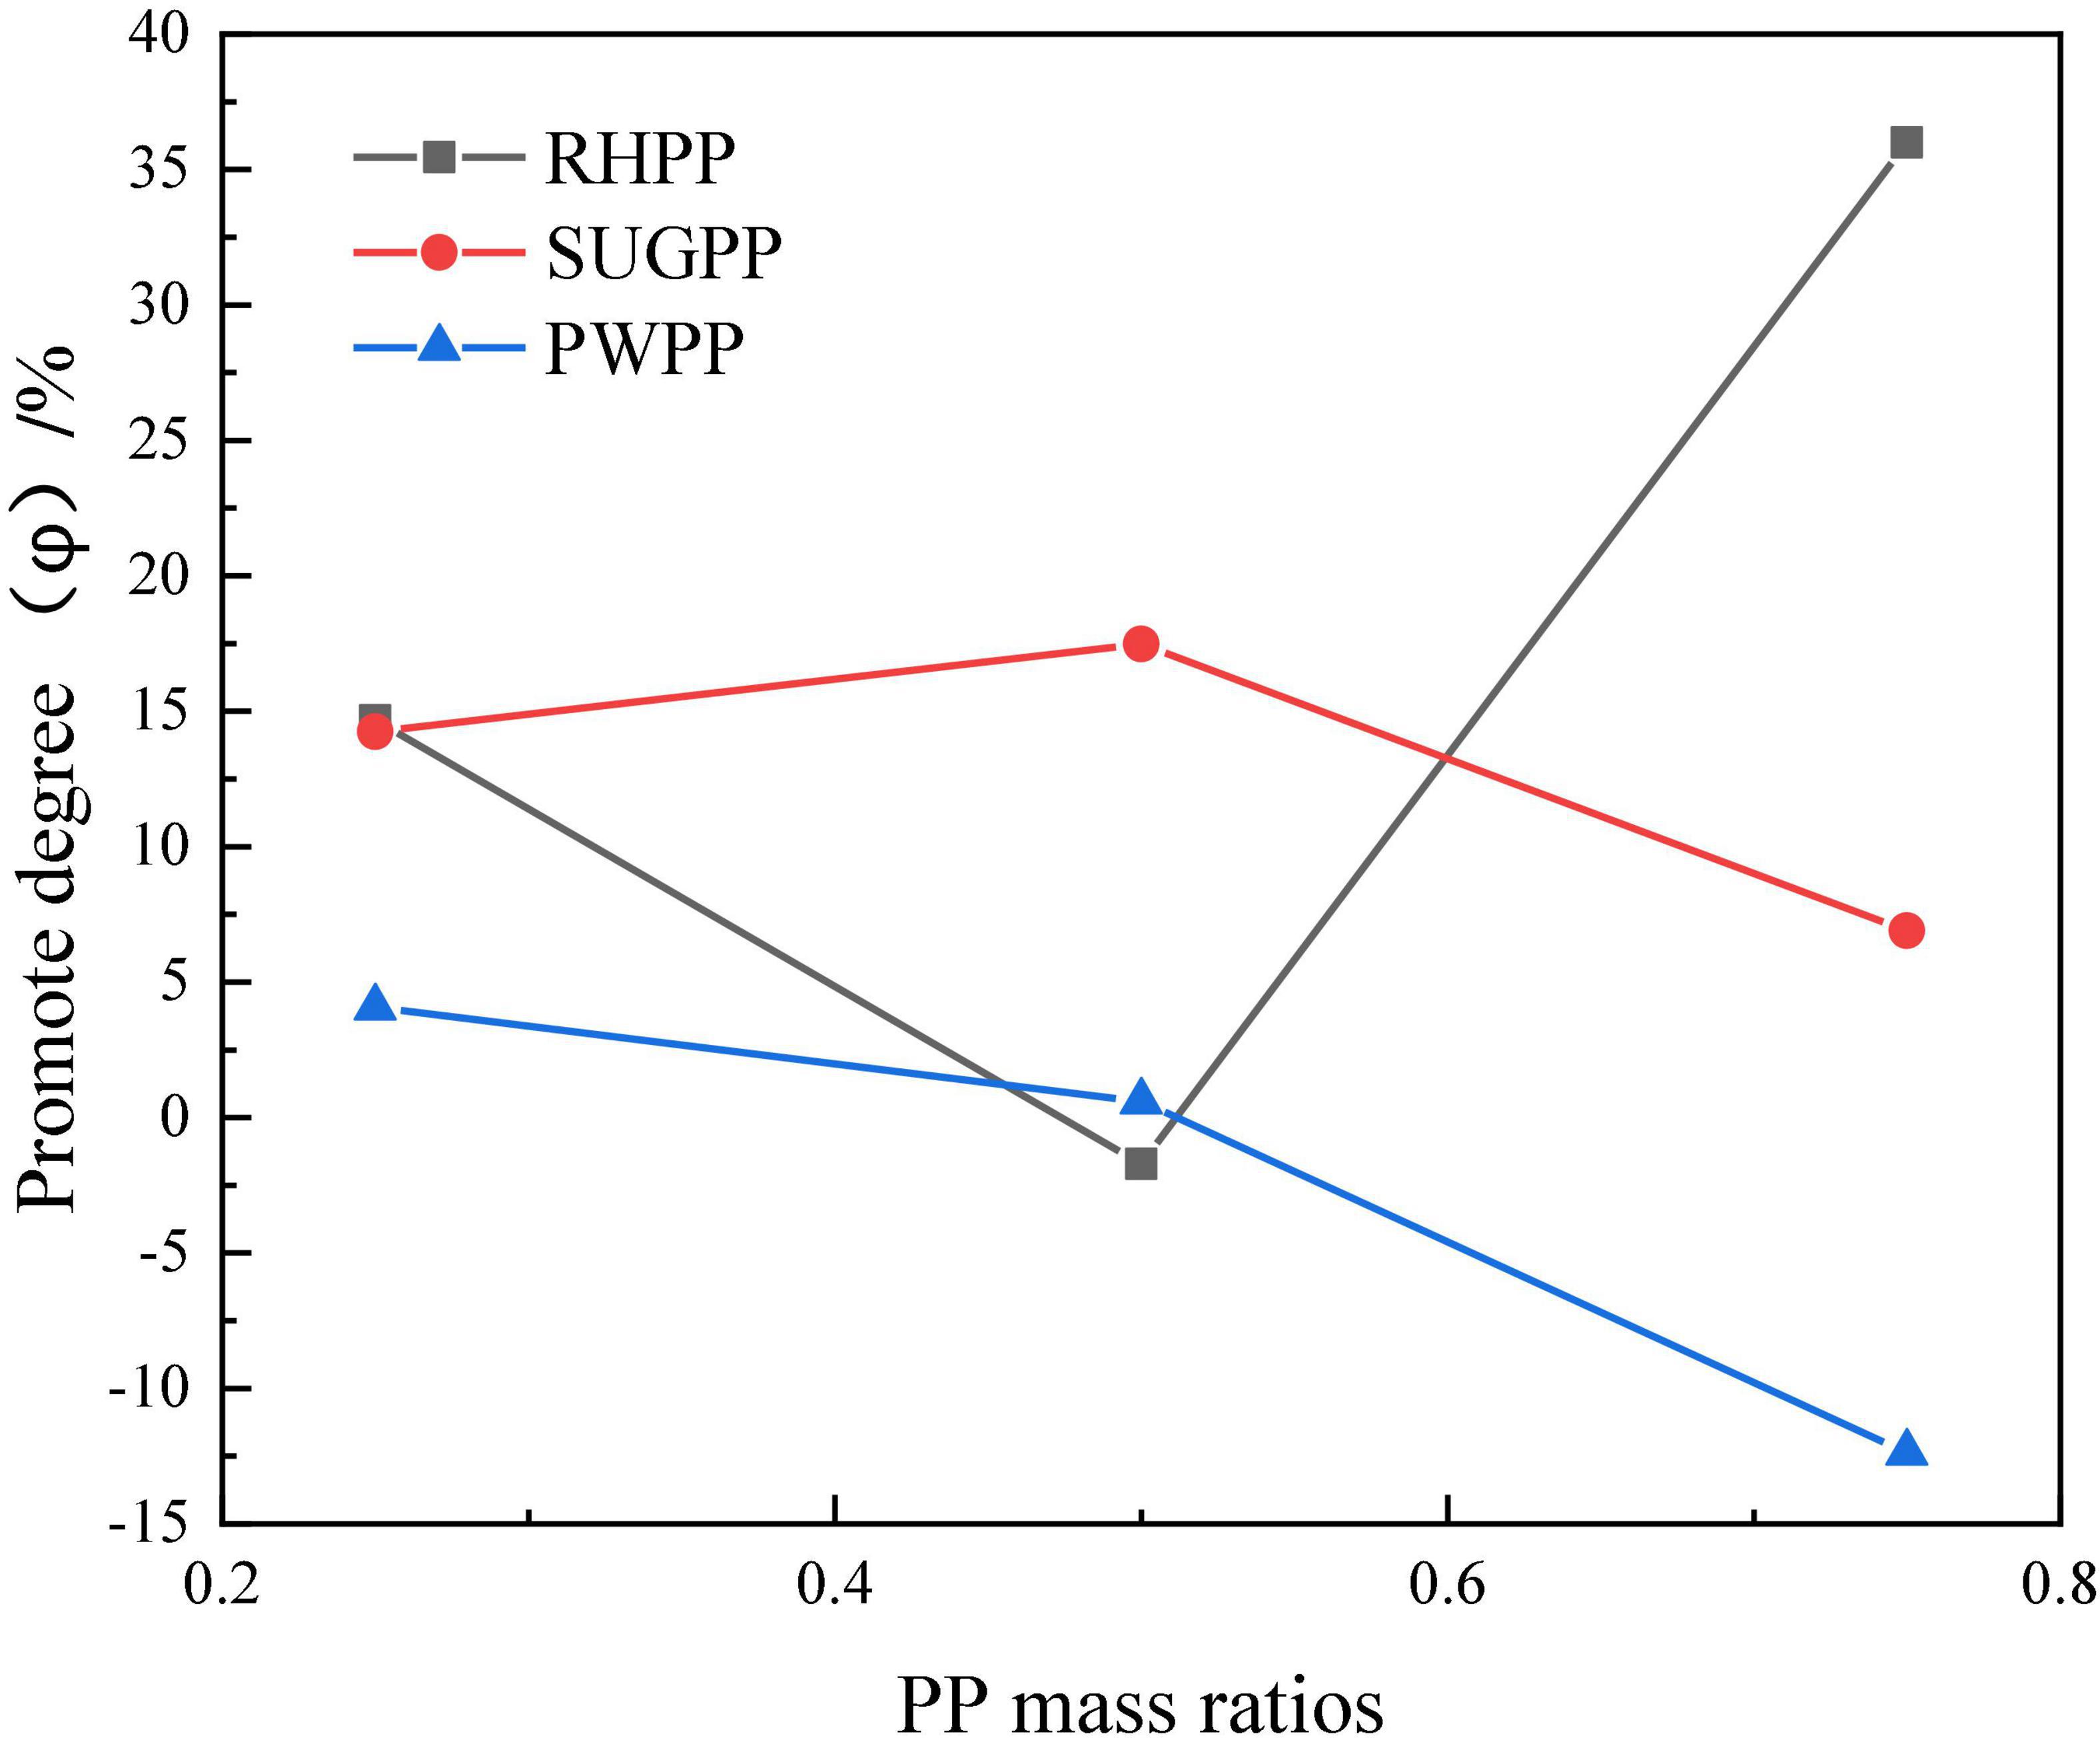
Figure 4. Deviations of char between experimental and calculated.
To further understand the overall synergistic effect of the three types of biomass and PP, the experimental and calculated values of carbon residue of the three types of biomass at different mass ratios were determined, as shown in Figure 4. For RHPP, the overall positive synergistic effect of RHPP1-3 sample was the highest, and the experimental value of residual carbon decreased by 36.00% from the calculated value. The degree of promotion of the pyrolysis process first decreased and then increased with the increase of PP mass ratio, a weak negative synergistic effect was observed in RHPP1-1, which is consistent with the previous conclusion (Figure 3B). The maximum positive synergistic effect of SUGPP appeared in the SP1-1 sample. At this time, the experimental value of residual carbon decreased by 17.49% compared with the calculated value. However, the largest positive synergistic effect of poplar and polypropylene co-pyrolysis occurred in WP3-1 sample, and the experimental value of residual carbon was only 4.06% less than the calculated value. Through the above analysis, it was found that the positive co-pyrolysis efficiency of rice husk and polypropylene during the co-pyrolysis of the three kinds of biomass and polypropylene was higher than that of the other two mixtures, so the co-pyrolysis synergistic effect of rice husk and polypropylene was the best when the mass ratio of rice husk and polypropylene was 3:1. As shown in Table 1, the H/Ceff of the three biomasses increased step-wise. However, Figure 4 reveals the absence of any evident relationship between the synergistic effect and the biomass H/Ceff. Therefore, the synergistic effect might be attributed to the content of the components (cellulose, hemicellulose, and lignin) that can form biomass, which requires further study.
According to the analysis of section “Synergistic effects,” the positive synergistic effect of the mixture is not evident at low temperature, because plastics only melt within this temperature range (Salvilla et al., 2020). The synergistic effect of the high-temperature co-pyrolysis of plastics and biomass was primarily due to the interaction of free radicals between the products. Co-pyrolysis causes the generation of secondary free radicals, which are involved in polymerization, hydrogen transfer, monomer formation, intermolecular hydrogenation, and vinyl isomerization reactions (Zhou et al., 2014). The synergy during biomass co-pyrolysis was primarily attributed to hydrogen radical transfer and alkaline earth metal catalysis (Soncini et al., 2013; Jeong et al., 2014; Ellis et al., 2015; Li et al., 2015). The PP melt formed before the PP pyrolysis peak in the pyrolysis temperature range of biomass provides an ideal H-donor platform for the decomposition of biomass (Burra and Gupta, 2018), and the basic metals in biomass facilitate catalysis. Therefore, without the addition of catalysts, the co-pyrolysis of PP and biomass can produce a synergistic effect. Figure 4 shows the total degree of synergy of various mixtures after the pyrolysis is completed.
To clarify the negative synergistic effect of the mixture at low temperatures, we conducted a SEM analysis on the surface of each experimental sample at 380°C, as shown in Figure 5. Because the biomass was decomposed at 380°C, but PP was in the melting state, this provided an opportunity to analyze the characteristics of the mixture. Figure 5 shows that the melt surface of PP was dense, whereas the surface of biomass material is rough, and coke is bound loosely to the surface. The semi-coke surface morphologies change from loose to compact phase with the increase of PP content, which is not conducive to the production of volatile matter (Salvilla et al., 2020). This phenomenon could explain the negative synergistic effect at low temperatures.
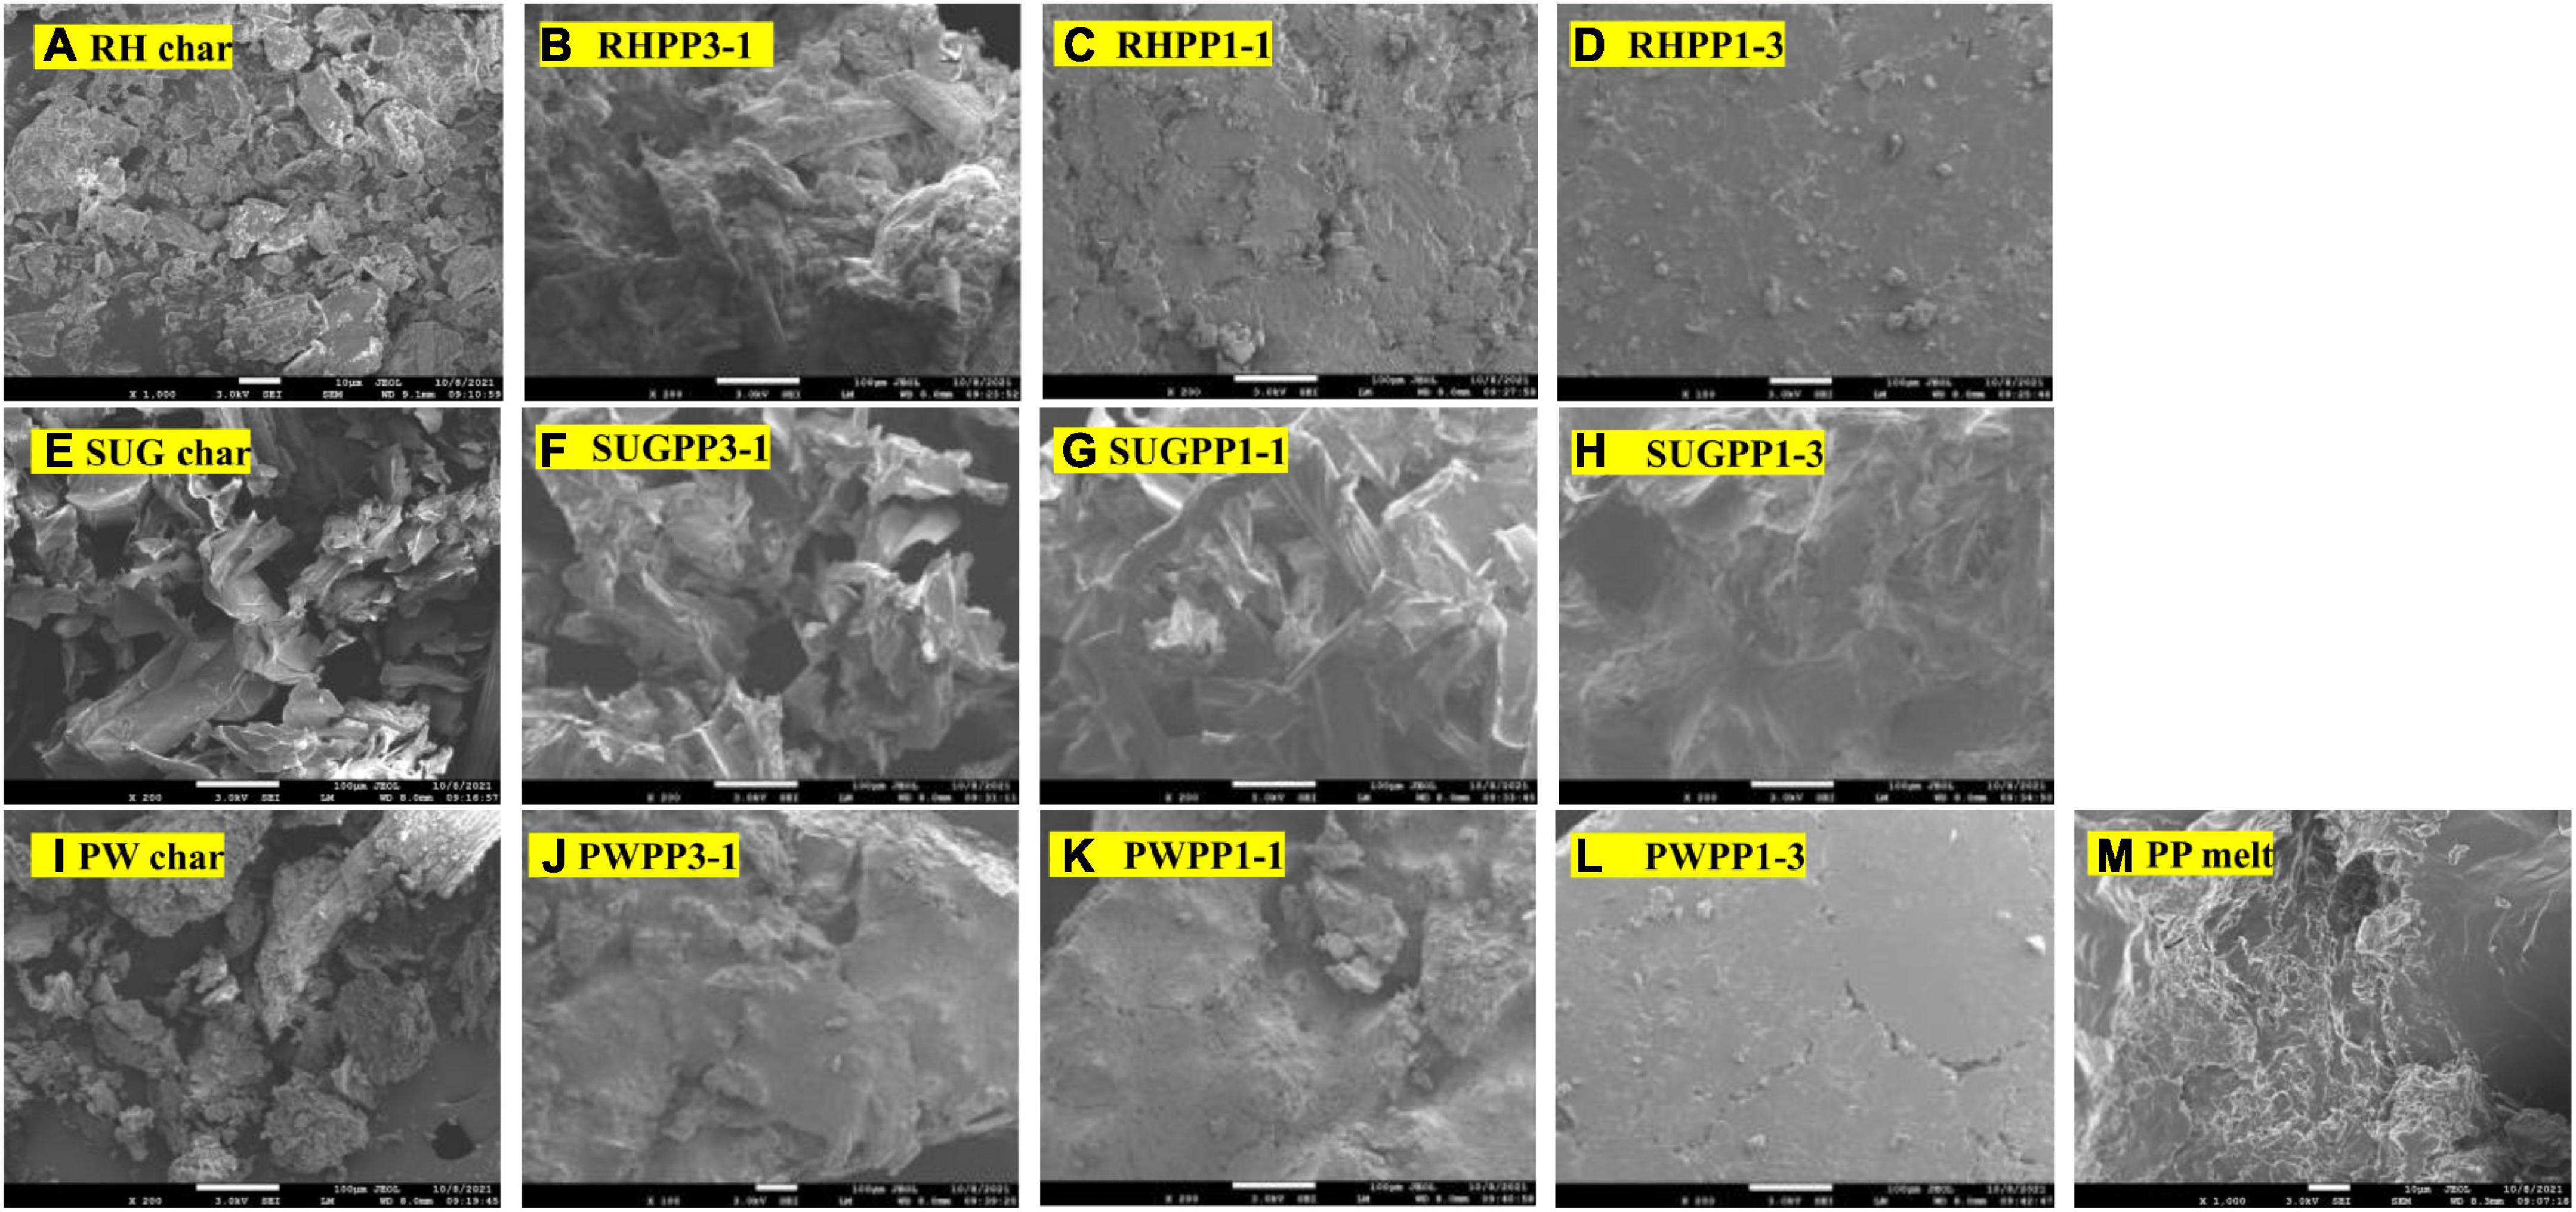
Figure 5. SEM analyses of the char samples and the co-pyrolysis melt under 380°C: (A) RH char, (E) SUG char, (I) PW char, (B) RHPP3-1, (C) RHPP1-1, (D) RHPP1-3, (F) SUGPP3-1, (G) SUGPP1-1, (H) SUGPP1-3, (J) PWPP3-1, (K) PWPP1-1, (L) PWPP1-3, and (M) PP.
Table 4 illustrates the kinetics parameters of biomass components calculated through the FWO, KAS, and Starink methods. The R2 of the average energy (E) estimated for a series of a values (0.20 ≤ a ≤ 0.90) occurred across a small area, indicating that the data fitted the curve satisfactorily. The E for PP was 286.09 kJ/mol via Coats–Redfern method, suggesting that the thermal degradation mechanism of PP was of the first-order type. Similar PP activation energies have been reported previously (Aboulkas et al., 2010). In addition, the activation energies of RH, SUG, and PW showed three different trends. The activation energy of RH showed a downward trend with the increase in the conversion rate α, and the three calculation methods (FWO, KAS, and Starink) were used to obtain the activation energies of 169.56, 162.44, and 162.73 kJ/mol, respectively. The activation energy of SUG showed an upward trend with the increase in α. The E for SUG were 179.68, 178.35, and 178.60 kJ/mol via the three methods, respectively. Moreover, the activation energy of PW showed a first increasing and then decreasing trend with the increase ln α. The average activation energies obtained by the three calculation methods were 180.26, 179.68, and 180.04 kJ/mol, respectively. Furthermore, the activation energy of RH was lower than that of the other two biomass feedstocks, and that of SUG was similar to PW.
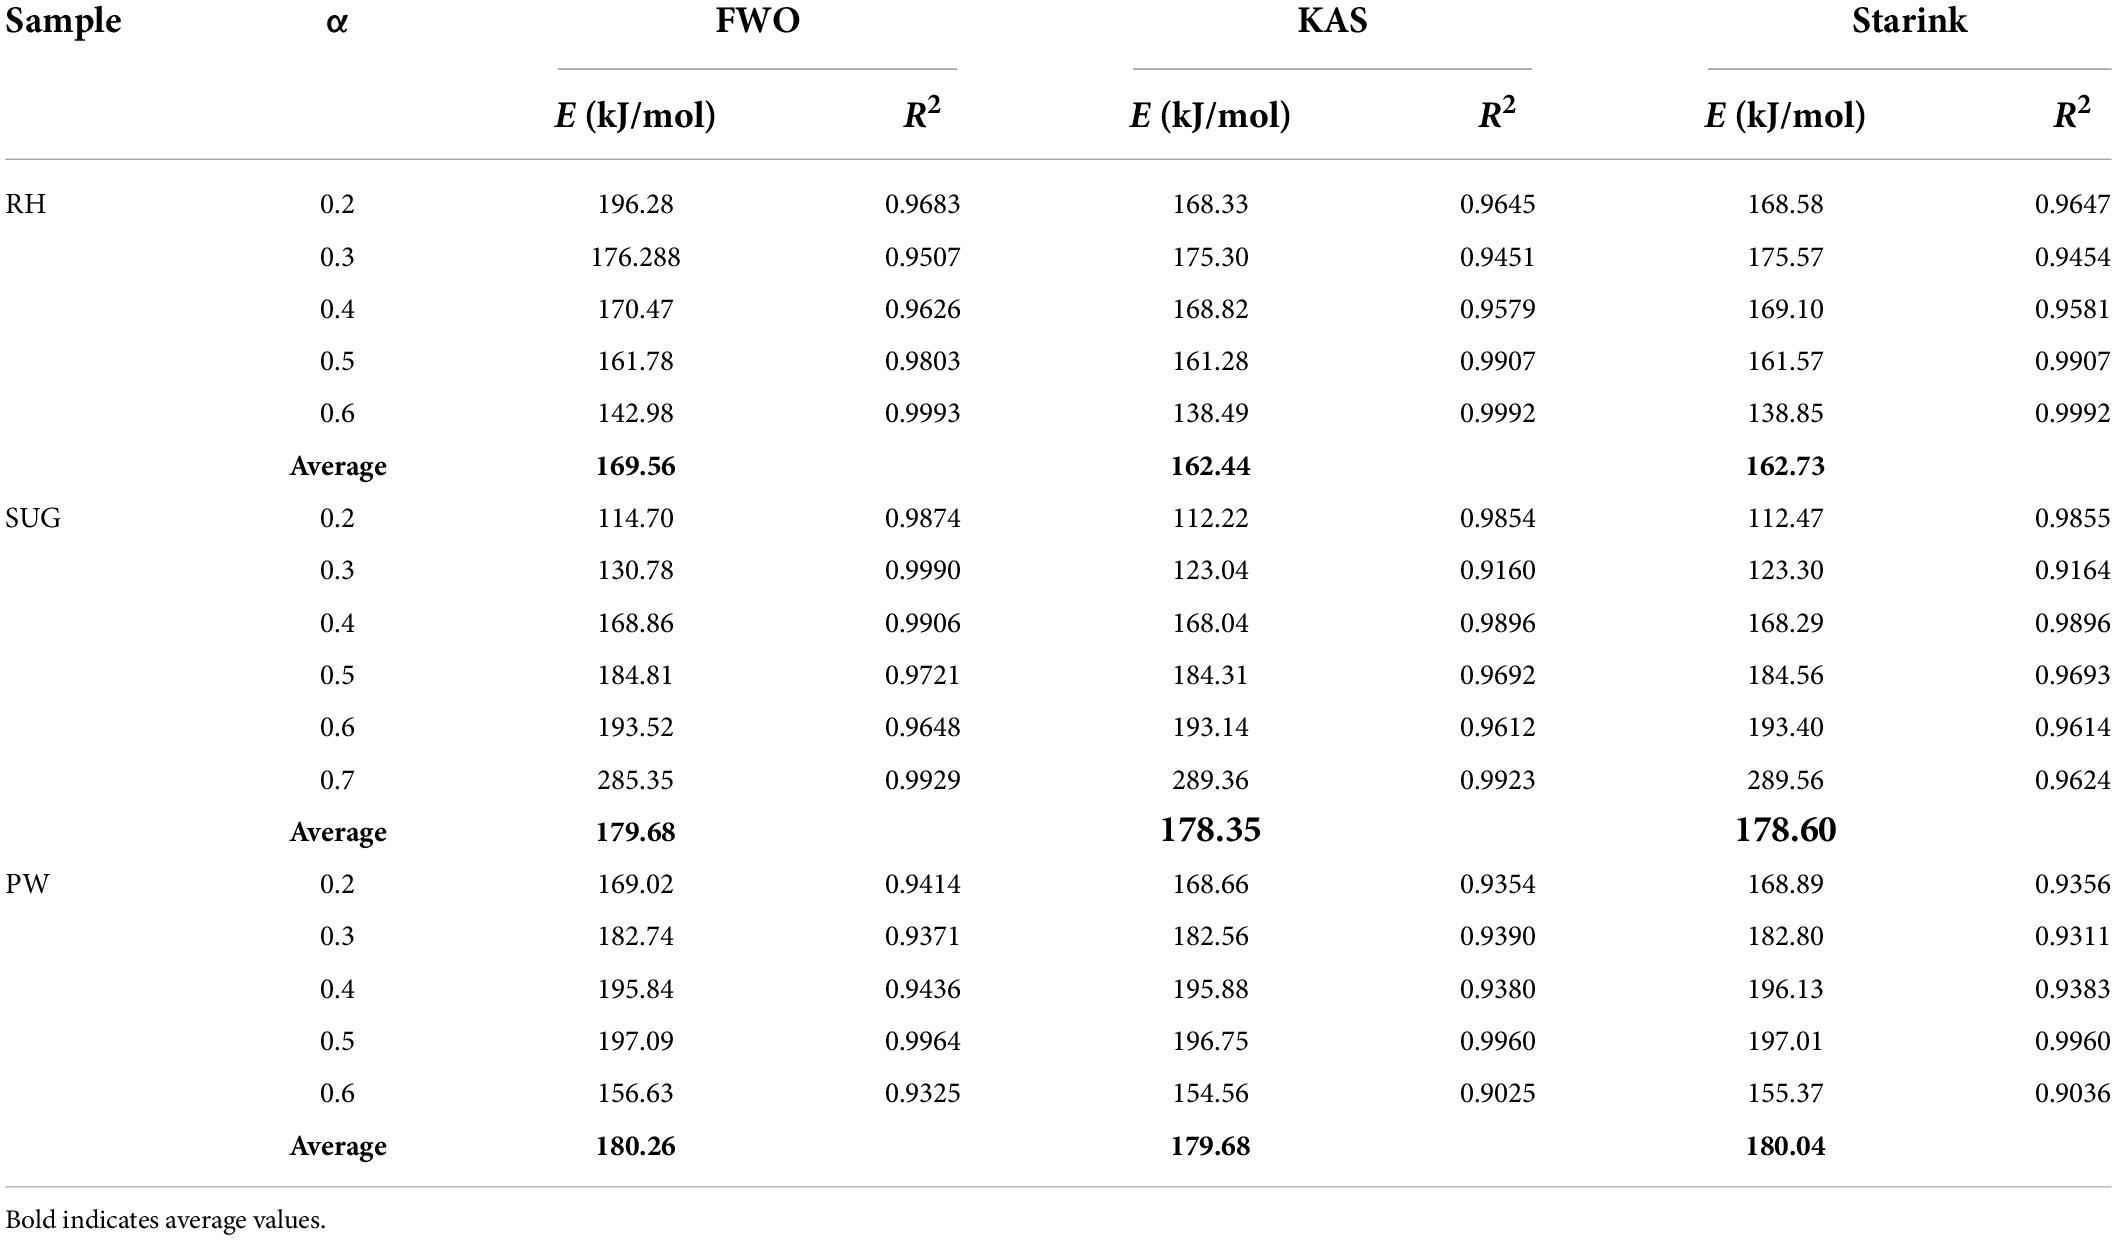
Table 4. Kinetics parameters of biomass solved by isoconversional methods.
Tables 5–7 show the values of E and r of RHPP, SUGPP, and PWPP. Additionally, the distribution of the activation energies for biomass blended with PP based on the Starink method was presented in Figure 6. The average E values of RHPP3-1, RHPP1-1, and RHPP1-3 were 309.39, 213.56, and 227.70 kJ/mol, respectively, based on the Starink method. Figure 6 shows that the mean value of E first increased as α increased from 0.2 to 0.5, and then sharply decreased to 200.07 kJ/mol for RHPP1-3. The other two mixtures showed a slower change trend with the change in α, and the values of E increased from 183.66 to 214.69 kJ/mol for RHPP1-1. However, for the mixture RHPP1-3, the E value showed a slow decrease trend, from 268.66 to 193.66 kJ/mol with the increase in α. The E values of RHPP1-3 mixture at α of 0.2, 0.3, 0.4, and 0.5 were higher than the activation energies of PP. This indicates the existence of a large inhibitory effect in the low temperature region, which is consistent with the previous conclusion (as shown in Figure 3B, ΔW > 0). Figure 6B shows that the E values of the SUGPP3-1 and SUGPP3-1 mixtures have similar characteristics. The E value gradually increased with the increase of α, and finally the activation energy values of the SUGPP3-1 mixture and PP were similar. The change trend of SUGPP1-3 was different from the first two mixtures, as it first increased and then decreased. The average activation energies of the three mixtures were 102.60, 141.41, and 244.04 kJ/mol, respectively, with the increase of the mass ratio of PP, which were all smaller than the activation energy of PP. As shown in Figure 6C, the activation energy value of the mixture of PWPP3-1 and PWPP1-1 increased with the increase of α, but PWPP1-3 exhibited the opposite trend. Similarly, the E values of the three mixtures were lower than the PP activation energy value. Notably, the E values of all the three mixtures except SUGPP3-1 and PWPP3-1 showed a downward trend with the increase in α, indicating that the positive synergistic effect of co-pyrolysis was enhanced when the conversion rate was higher.
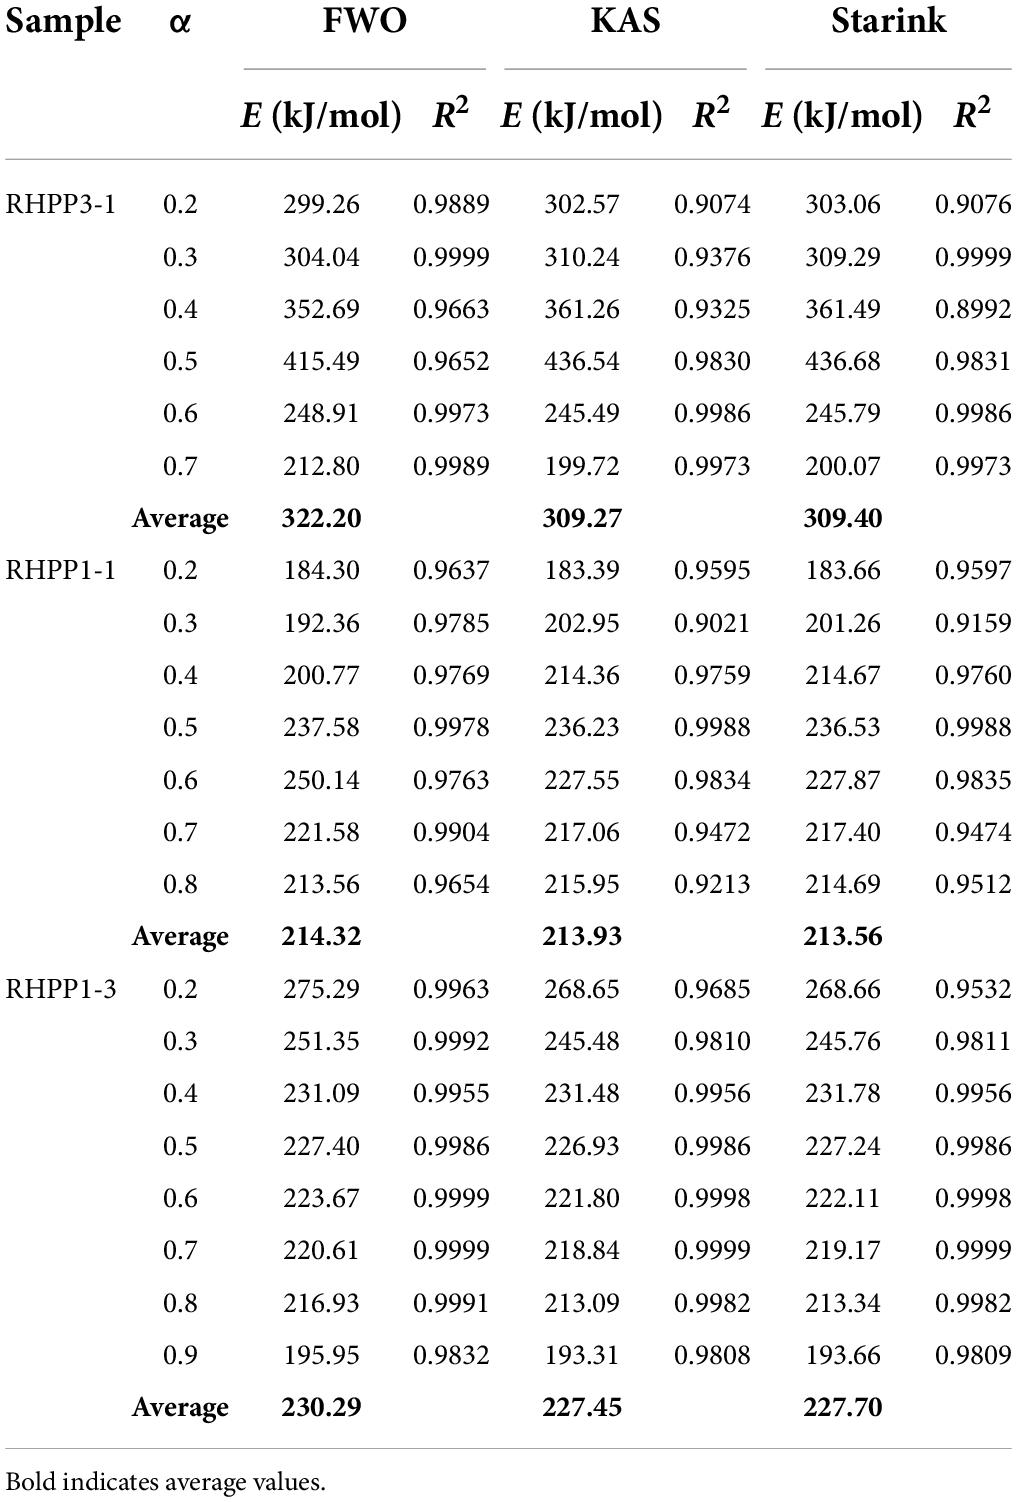
Table 5. Kinetics parameters of RH and PP mixtures solved by isoconversional methods.

Table 6. Kinetics parameters of SUG and PP mixtures solved by isoconversional methods.
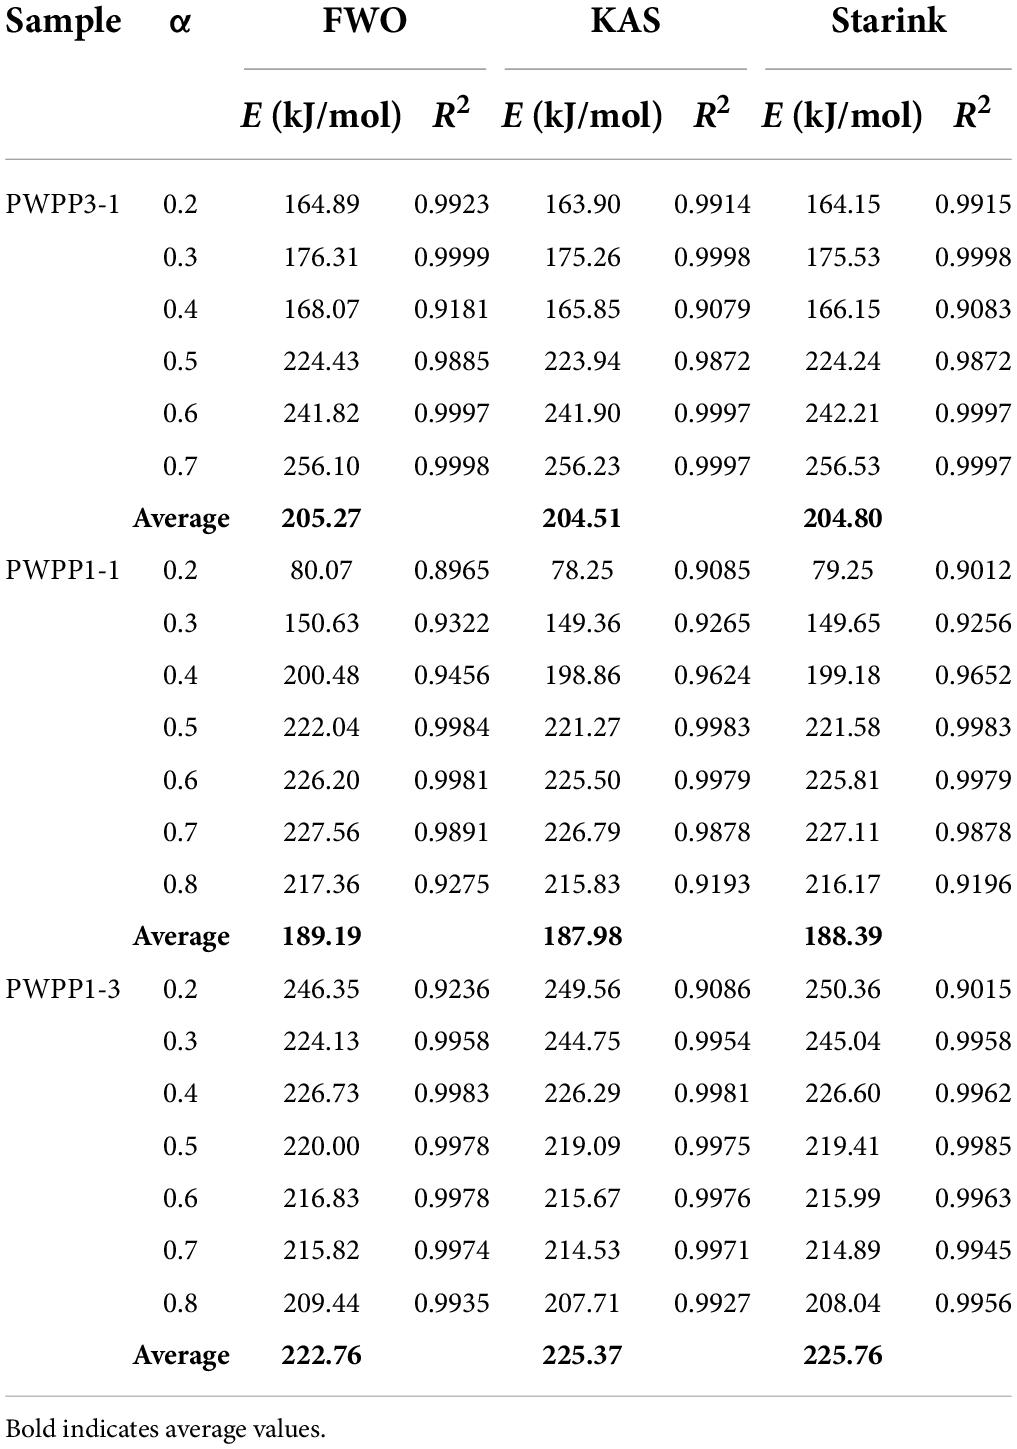
Table 7. Kinetics parameters of PW and PP mixtures solved by isoconversional methods.
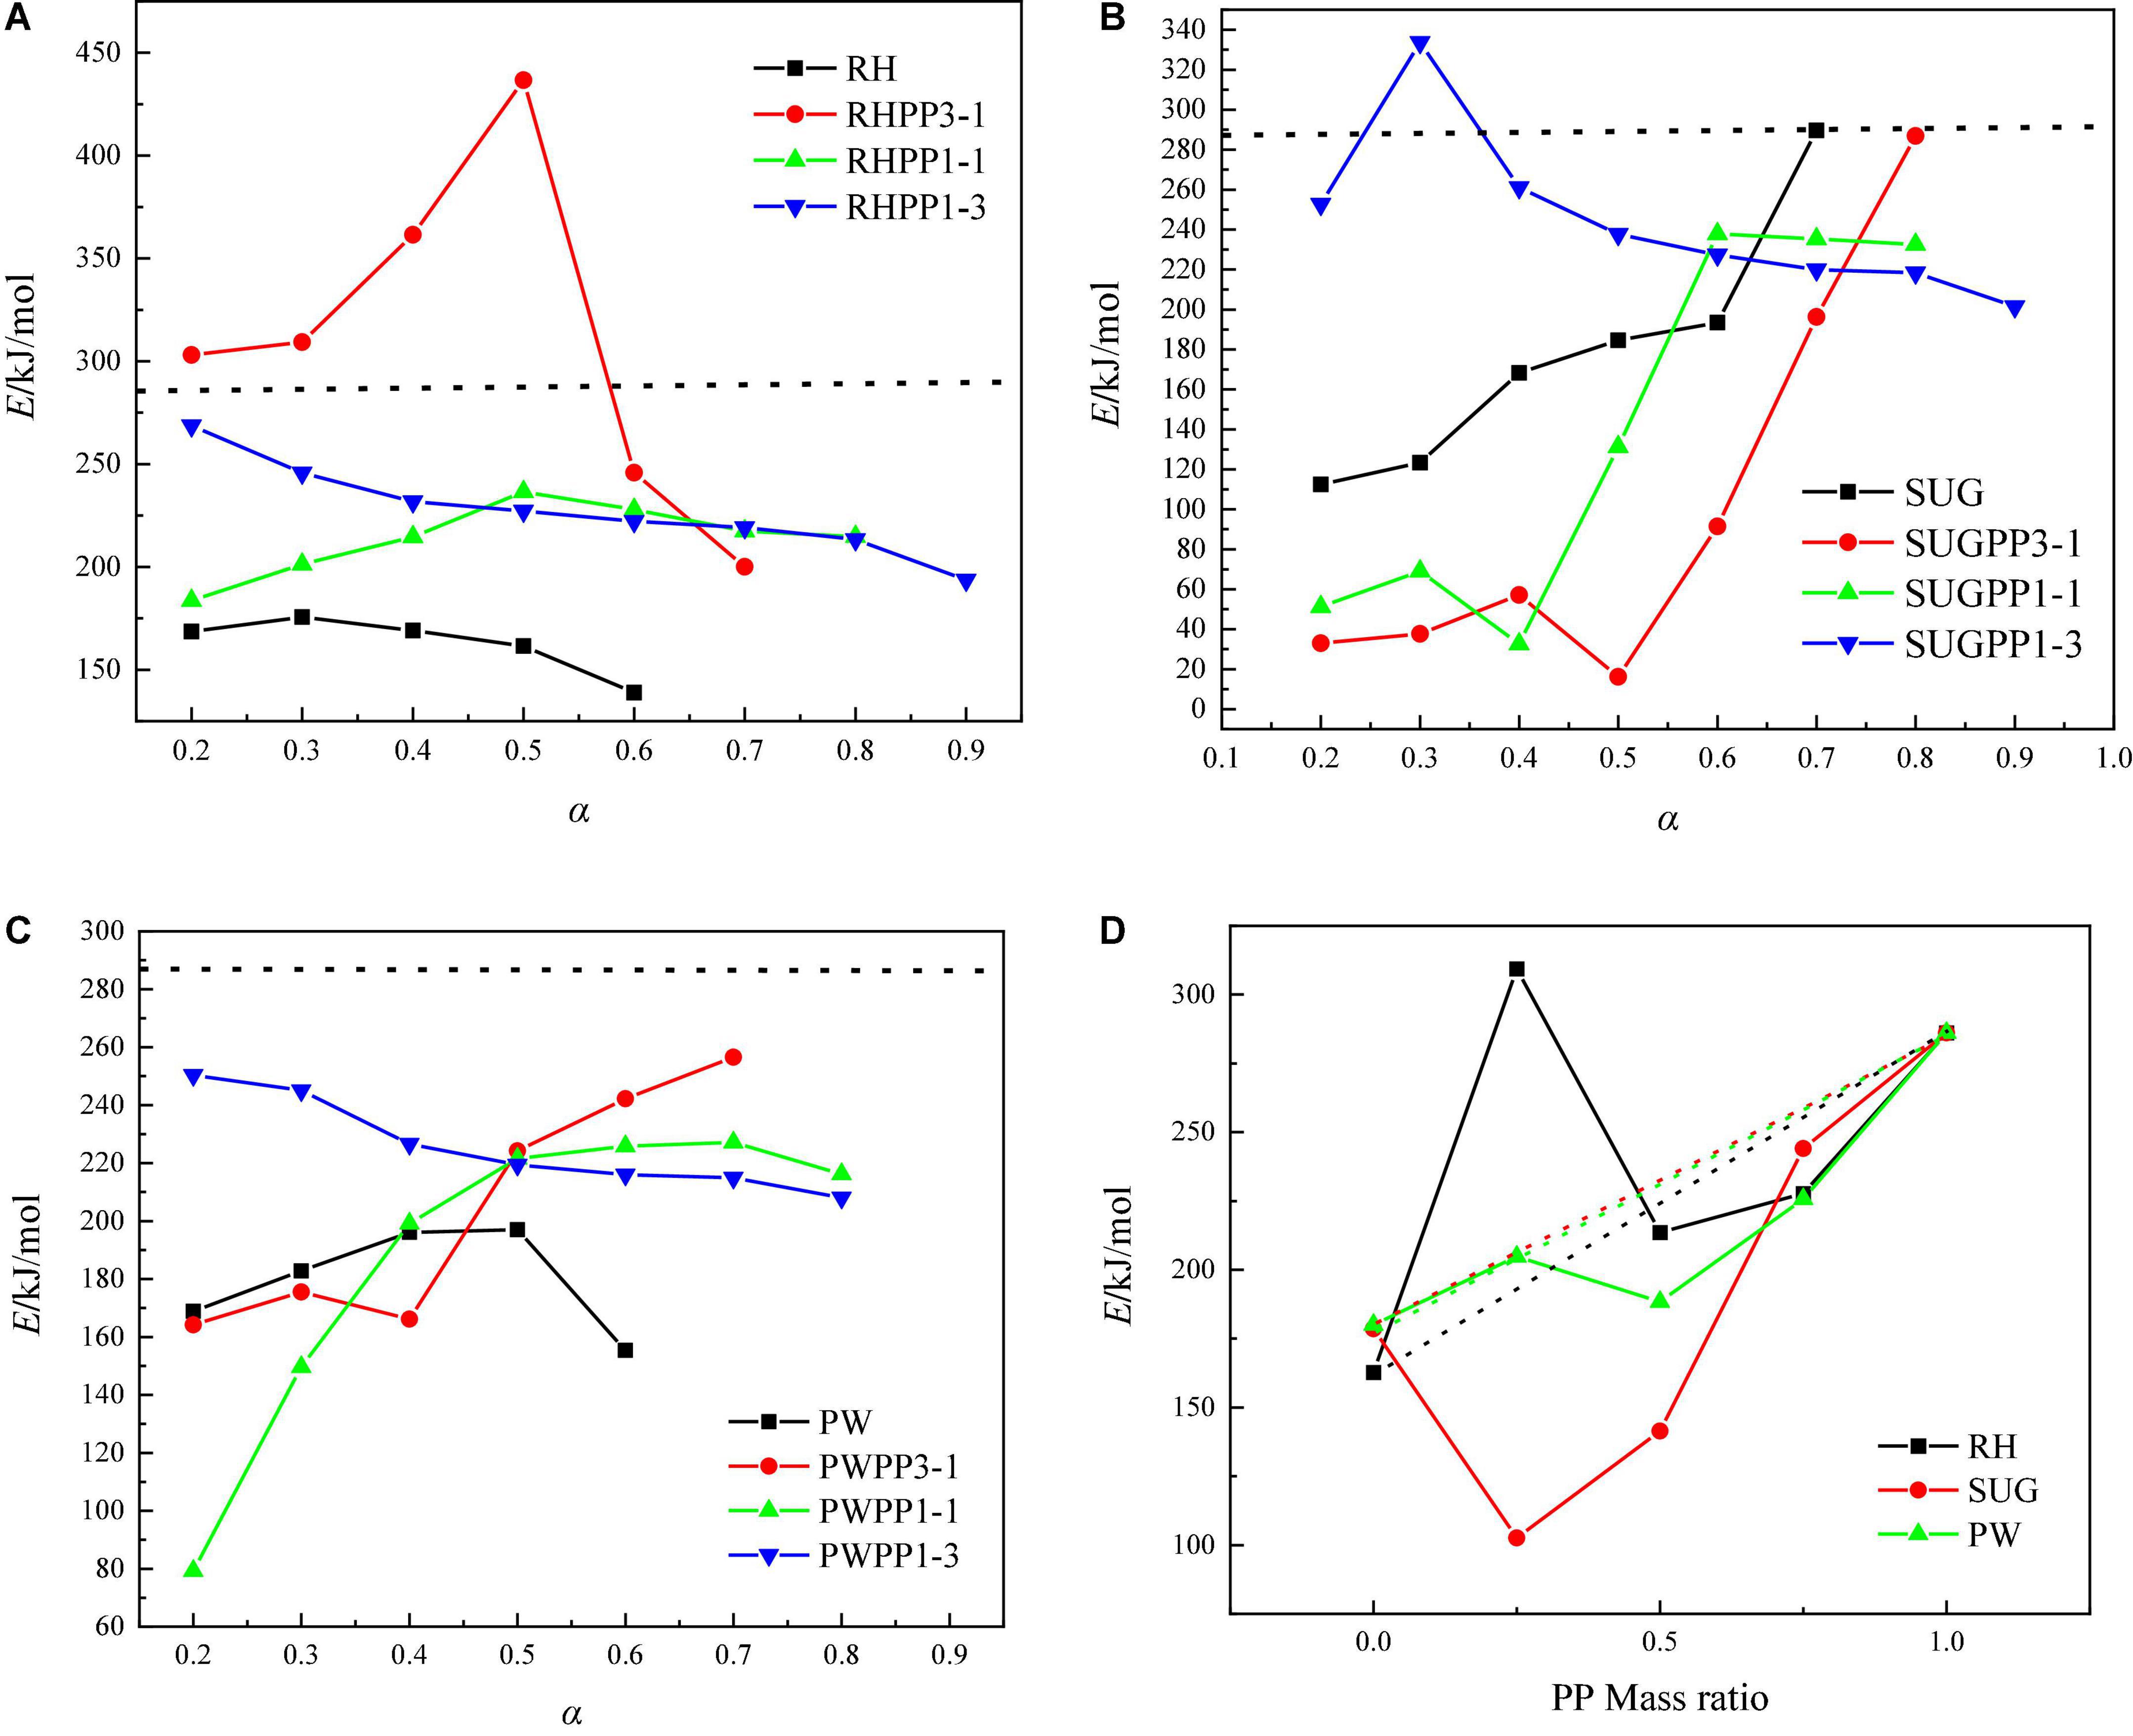
Figure 6. Variation profiles of E under various α for biomass with PP on Starink method, (A) RH and PP mixtures, (B) SUG and PP mixtures, (C) PW and PP mixtures, (D) average values of E versus biomass mass ratio (dotted lines were the predicted value of the average E based on the weighted average of the PP and biomass).
In addition, the oscillation of the E value may be related to the degree of the reaction process, particularly the structural change of the solid (Wu et al., 2014). During the pyrolysis process, the dissociation and polymerization of bonds are related to the softening of the carbonaceous structure and the changes in the solid structure caused by melting (Chabalala et al., 2011; Sonoyama and Hayashi, 2013). This study about non-additive volatile yield and average E during the non-catalytic pyrolysis of biomass and PP clarifies the synergistic uncertainty conclusion on the co-pyrolysis of biomass and PP. The formation mechanism and kinetic analysis of gas and tar products must be further studied. As practical biomass is used as experimental material in this study, it has the advantage of guiding significance to practical engineering, but it also has limitations to further reveal the synergistic effect. Therefore, it is necessary to further study the effects of biomass components (cellulose, hemicellulose, and lignin) on synergistic effects in the future.
The catalytic degradation of single or mixed samples is a process involving hundreds of complex reactions, which makes it difficult to predict the reaction mechanism. However, mathematical models have been developed to predict solid reaction mechanisms based on various approximations (Table 3; Poletto et al., 2012; Alam et al., 2021). Based on Criado’s method, Z-Master diagram was used to evaluate the mechanism of solid reaction. Z-master graph [(Z (α)/Z (0.5)] was constructed at 10°C/min (Figure 7). The theoretical curve obtained from Eq. (10) is compared with the experimental curve, and the reaction mechanism of single pyrolysis and co-pyrolysis of plastic and biomass mixtures is obtained.
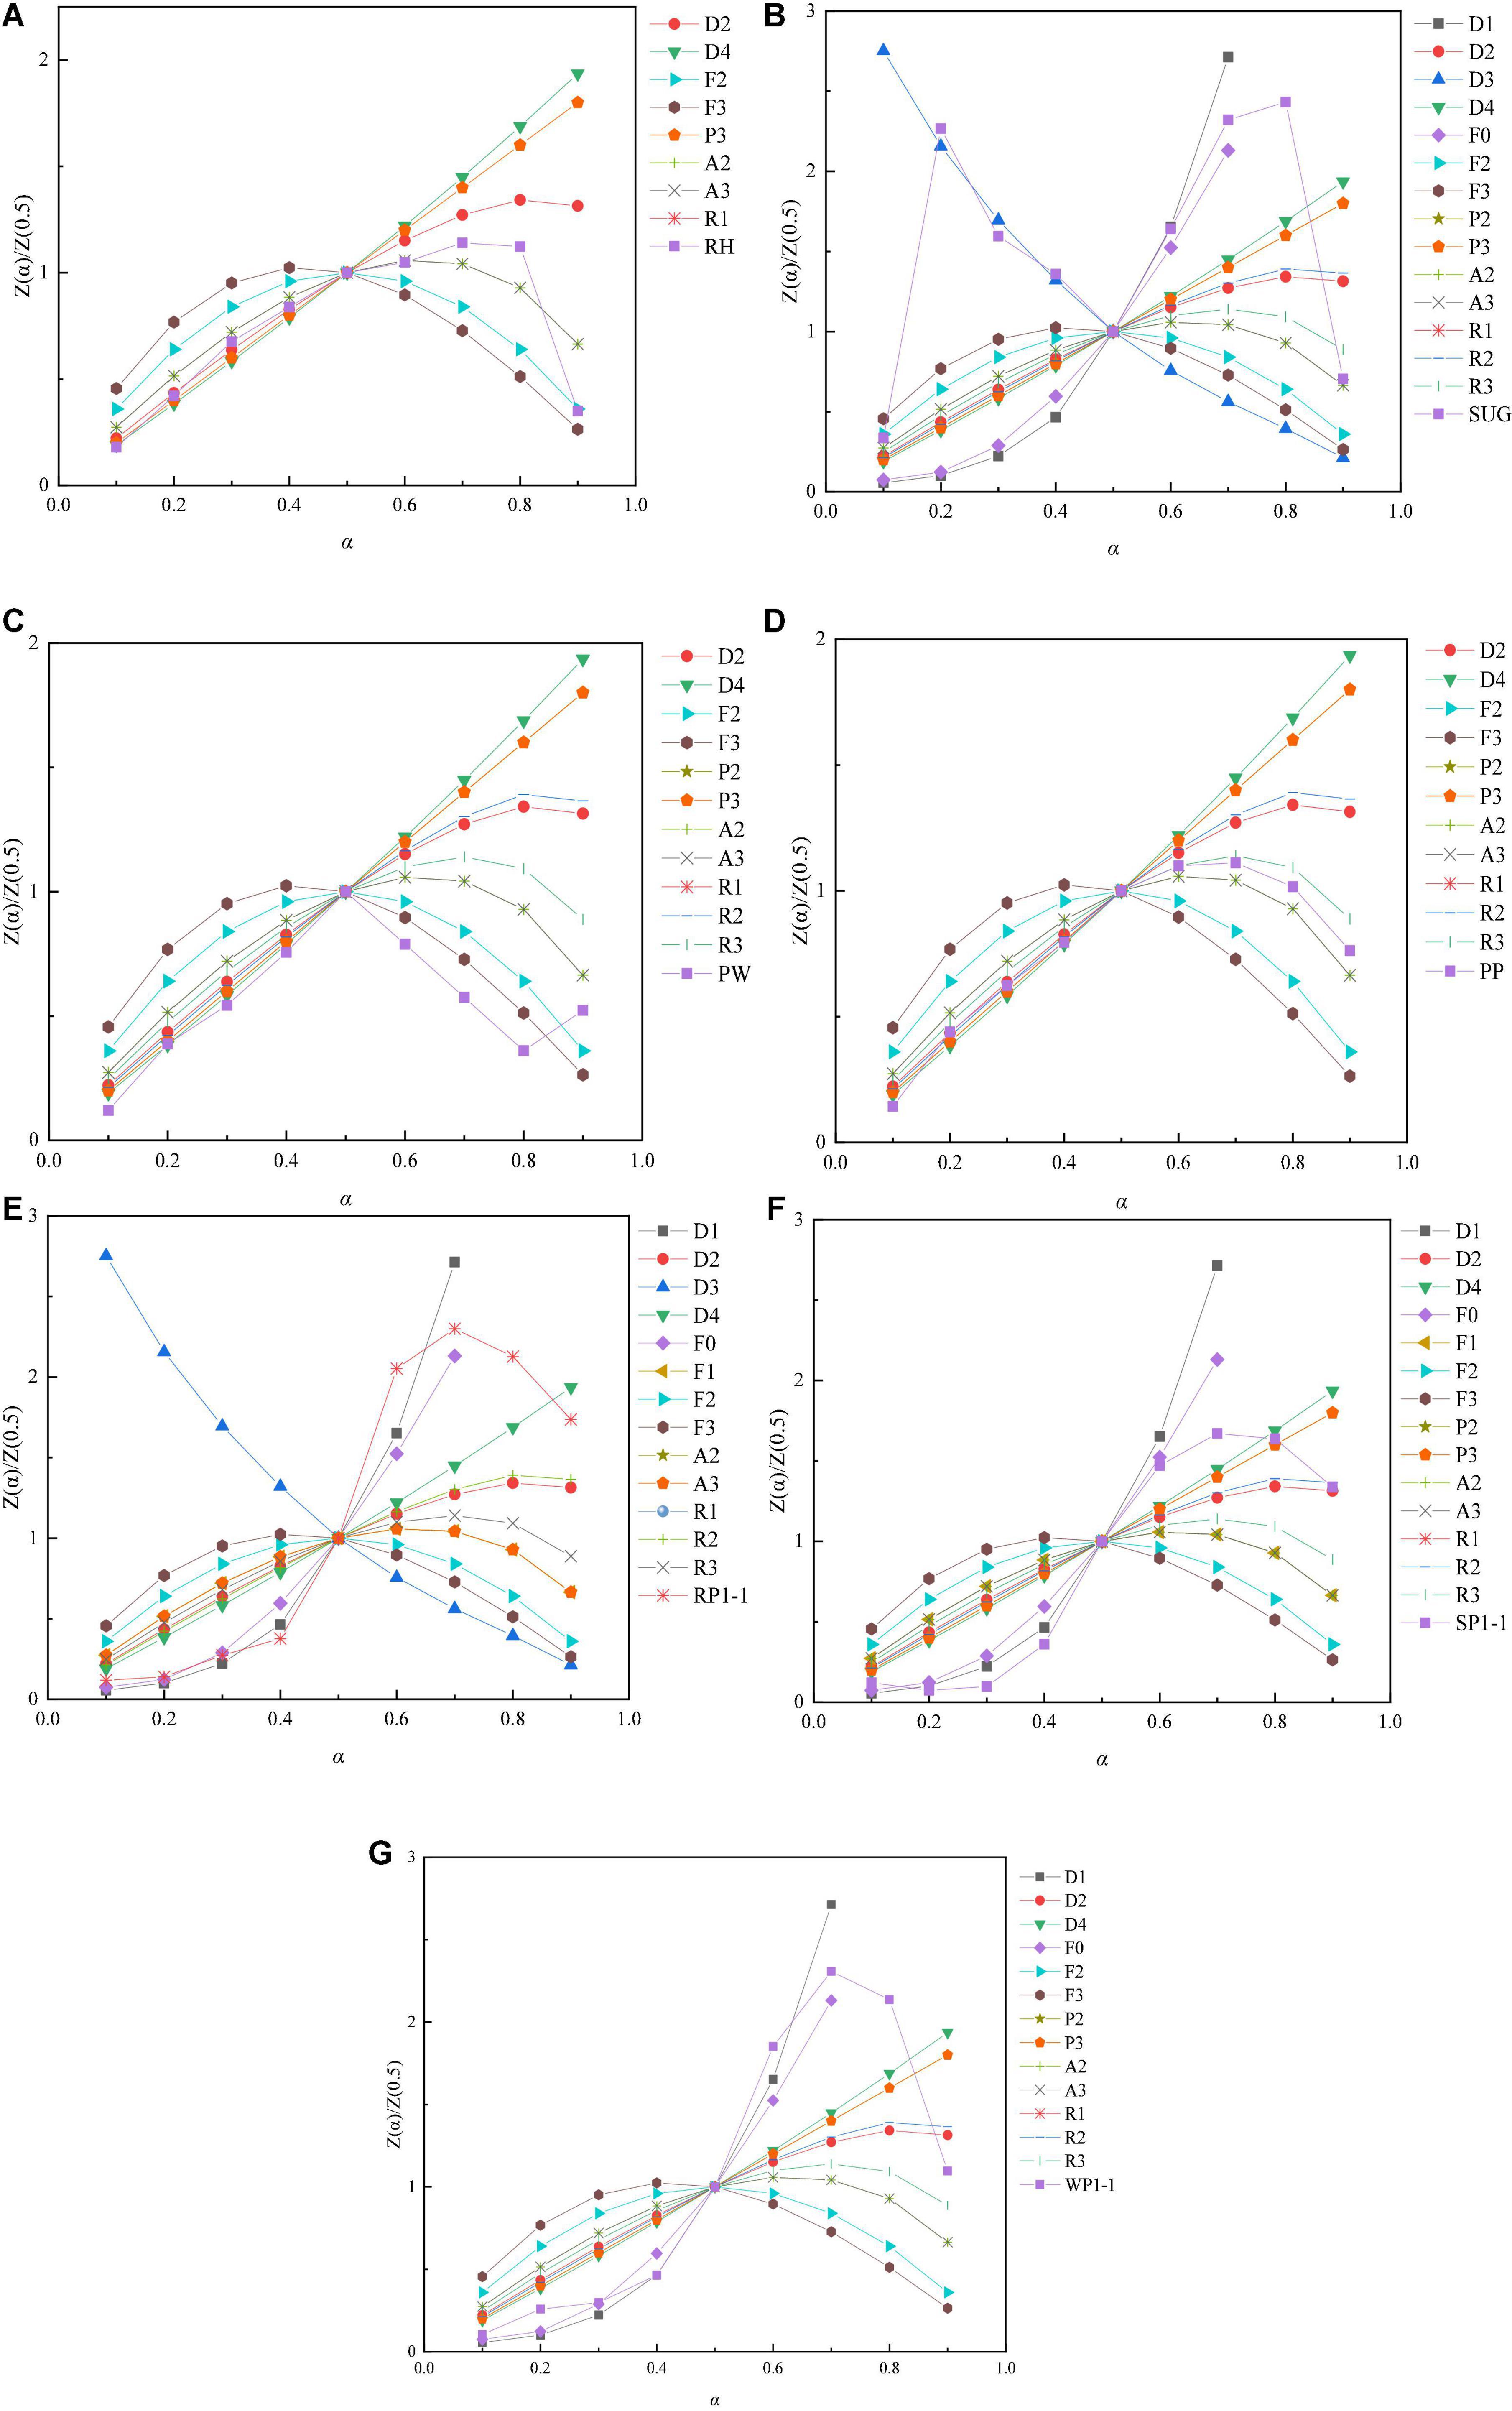
Figure 7. Theoretical and experimental plots for prediction of solid-state reaction mechanism by Criado method (Z-master plot): (A) RH, (B) SUG, (C) PW, (D) PP, (E) RP1-1, (F) SP1-1, and (G) WP1-1.
It can be seen from Figure 7A that RH conforms to 2-dimensional (Valensi model) (D2) when α < 0.5. When 0.5 < α < 0.6, the experimental curve is consistent with the theoretical curve A2/A3. When 0.6 < α < 0.8, it is closest to A2/A3 (with deviation). Diffusion models are presented at low conversion rate, Nucleation model is presented at high conversion rate. The reaction model of SUG is relatively complex. When 0.1 < α < 0.2, the experimental curve changes dramatically and the fitting degree is poor. The hypothesis is that bagasse is fluffy and has a large number of filament-like structures, resulting in poor heat transfer during pyrolysis. Therefore, the fitting degree is poor at the conversion rate. When 0.2 < α < 0.5, it is closest to 3-dimensional (Jander Model) (D3) model. When 0.5 < α < 0.6, the experimental curve is consistent with the theoretical curve D1. For SUG at α = 0.6–0.7, the experimental curve aligned with theoretical curve F0, demonstrating that the catalytic pyrolysis of SUG followed the zero-order solid-state reaction. When α > 0.7, the curve fitting is poor. Therefore, the pyrolysis of SUG underwent Diffusion models and zero-order solid-state reaction successively. The experimental curve for PW closely overlapped with the theoretical curve (D4) at α = 0.1–0.5 indicating that the thermal degradation of PW followed the 3-dimensional (Ginstling-Brounstein model) (D4) model (under Diffusion mechanism, Table 3). At higher conversions (0.5 < α < 0.8), it followed the trend of Third order reaction (R3). In the case of PP, the experimental curve closely overlapped with the theoretical curve (D2) at α = 0.1–0.5. When the conversion rate α > 0.5, the experimental curve is closest to the theoretical curve (R3), which conforms to the Contracting Volume model.
The experimental curves for the mixture show a very interesting phenomenon, with all three exhibiting similar shapes (S-shaped). In addition, at a low conversion rate (α < 0.5), the experimental curves of the three mixtures are close to the theoretical curve D1, which proves that the pyrolysis of biomass and polypropylene follows Diffusion models at a low conversion rate. This is consistent with our previous research. In section “Synergistic effects,” we found that the mixture at the ground conversion rate was caused by biomass pyrolysis. Previously, we found that biomass followed Diffusion models at the ground conversion rate during pyrolysis. When the mixture is at a higher conversion rate (α > 0.7), the experimental curve fits poorly with the theoretical curve because the reaction system is too complex. This is similar to the conclusion of Alam and Peela (2022) on the co-pyrolysis of bamboo sawdust and linear low-density polyethylene. The three mixtures showed different reaction mechanisms at (α = 0.6–0.7). It can be seen from Figures 7E,G that curves RP1-1 and WP1-1 are closest to 1-dimensional (D1).
According to Criado’s general diagram, individual and mixed samples follow a multi-step degradation mechanism. Biomass and polypropylene mainly present Diffusion models under low conversion rate. The reaction mechanism is different when the conversion rate is high. However, the pyrolysis mechanism of mixtures is relatively complex, but the three mixtures studied all show similar experimental curves, which also indicates that there is a certain synergistic effect between biomass and polypropylene co-pyrolysis.
The synergistic effects of co-pyrolysis of three different biomass and PP mixtures were studied. All three mixtures showed a negative synergistic effect in the low temperature stage, which might be because PP melts in the low temperature section, blocking the volatilization of biomass materials. In contrast, a positive synergistic effect was observed at high temperatures. The overall synergistic effect calculated by residual biochar showed that the positive synergistic efficiency reached 36.00% at a RH to PP mass ratio of 1:3. The maximum negative synergistic effect was 12.38% in the PWPP1-3 mixture. The results showed that the synergistic effect of biomass and PP was not only related to biomass species, but also to the pyrolysis temperature and the mass ratio of biomass to PP. Moreover, while studying the overall synergistic effect, the synergistic effect of three types of biomasses and PP was found to be unrelated to the H/Ceff of biomass, and the influencing synergistic effect was due to the biomass components (cellulose, hemicellulose, and lignin), which requires further study. Through the analysis of TGA curve, it is concluded that the addition of PP reduces the influence of biomass H/Ceff on pyrolysis oil and gas yield. The multistep degradation mechanism was followed by both individual and blended samples, as identified by Criado’s master plot. The co-pyrolysis of biomass and polypropylene has a synergistic effect. The pyrolysis products needed to be analyzed in the future work study to further clarify the synergistic effect of co-pyrolysis of plastic and biomass.
The raw data supporting the conclusions of this article will be made available by the authors, without undue reservation.
ZW and SA: methodology, data curation, and writing-original draft preparation. JZ and PS: methodology and investigation. HL and BS: writing-reviewing and editing, supervision, and funding acquisition. WK: writing-reviewing and editing and funding acquisition. All authors contributed to the article and approved the submitted version.
This work was supported by the National Natural Science Foundation of China (42177218 and 52100119), Young Elite Scientists Sponsorship Program by Tianjin (TJSQNTJ-2020-06), Joint Funds of the National Natural Science Foundation of China (U20A20302), Innovative Group Projects in Hebei Province (E2021202006), Hebei Outstanding Youth Science Foundation (D2019202453), Natural Science Foundation of Tianjin (20JCQNJC00940), Funding Projects for the Introduction of Overseas Students in Hebei Province (C20200502), Tianjin Technology Innovation Guidance Special Project (Fund) (20YDTPJC00440), China Postdoctoral Science Foundation (2019M660967), Key R&D Projects in Tianjin (19ZXSZSN00050 and 19ZXSZSN00070), Key R&D Projects in Hebei Province (20373701D), and Project of Great Transformation of Scientific and Technical Research in Hebei Province (21283701Z).
The authors declare that the research was conducted in the absence of any commercial or financial relationships that could be construed as a potential conflict of interest.
All claims expressed in this article are solely those of the authors and do not necessarily represent those of their affiliated organizations, or those of the publisher, the editors and the reviewers. Any product that may be evaluated in this article, or claim that may be made by its manufacturer, is not guaranteed or endorsed by the publisher.
Abbasi, S. A., Khalil, A. B., and Arslan, M. (2020). Extensive use of face masks during covid19 pandemic: (micro-)plastic pollution and potential health concerns in the Arabian Peninsula. Saudi J. Biol. Sci. 27, 3181–3186. doi: 10.1016/j.sjbs.2020.09.054
Abnisa, F., and Wan Daud, W. M. A. (2014). A review on co-pyrolysis of biomass: an optional technique to obtain a high-grade pyrolysis oil. Energy Convers. Manag. 87, 71–85.
Aboulkas, A., El Harfi, K., and El Bouadili, A. (2010). Thermal degradation behaviors of polyethylene and polypropylene. Part I: pyrolysis kinetics and mechanisms. Energy Convers. Manag. 51, 1363–1369.
Ahmed, M. H. M., Batalha, N., Mahmudul, H. M. D., Perkins, G., and Konarova, M. (2020). A review on advanced catalytic co-pyrolysis of biomass and hydrogen-rich feedstock: insights into synergistic effect, catalyst development and reaction mechanism. Bioresour. Technol. 310:123457. doi: 10.1016/j.biortech.2020.123457
Alam, M., and Peela, N. R. (2022). Catalytic co-pyrolysis of wet-torrefied bamboo sawdust and plastic over the zeolite HY: synergism and kinetics. J. Energy Institute 100, 76–88.
Alam, M., Rammohan, D., Bhavanam, A., and Peela, N. R. (2021). Wet torrefaction of bamboo saw dust and its co-pyrolysis with plastic. Fuel 285:119188.
Alvarez, J., Kumagai, S., Wu, C., Yoshioka, T., Bilbao, J., Olazar, M., et al. (2014). Hydrogen production from biomass and plastic mixtures by pyrolysis-gasification. Int. J. Hydrogen Energy 39, 10883–10891.
Anderson, L. L., Tuntawiroon, W., and Ding, W. B. (1995). Coliquefaction of coal and waste polymers. Coal Sci. Technol. 24, 1515–1518.
Atanda, L., Batalha, N., Stark, T., Tabulo, B., Perkins, G., Wang, Z., et al. (2020). Hybridization of ZSM-5 with spinel oxides for biomass vapour upgrading. ChemCatChem 12, 1403–1412.
Brebu, M., Ucar, S., Vasile, C., and Yanik, J. (2010). Co-pyrolysis of pine cone with synthetic polymers. 2010. Fuel 89, 1911–1918.
Burra, K. G., and Gupta, A. K. (2018). Kinetics of synergistic effects in co-pyrolysis of biomass with plastic wastes. Appl. Energy 220, 408–418.
Chabalala, V. P., Wagner, N., and Potgieter-Vermaak, S. (2011). Investigation into the evolution of char structure using raman spectroscopy in conjunction with coal petrography; part 1. Fuel Process. Technol. 92, 750–756.
Chen, C., Ma, X., and He, Y. (2012). Co-pyrolysis characteristics of microalgae chlorella vulgaris and coal through TGA. Bioresour. Technol. 117, 264–273. doi: 10.1016/j.biortech.2012.04.077
Chen, N. Y., Walsh, D. E., and Koenig, L. R. (1988). Fluidized-bed upgrading of wood pyrolysis liquids and related compounds. Pyrolysis Oils Biomass 24, 277–289.
Chen, R., Zhang, S., Cong, K., Li, Q., and Zhang, Y. (2020). Insight into synergistic effects of biomass-polypropylene co-pyrolysis using representative biomass constituents. Bioresour. Technol. 307:123243. doi: 10.1016/j.biortech.2020.123243
Criado, J. M. (1978). Kinetic analysis of dtg data from master curves. Thermochim. Acta 24, 186–189. doi: 10.1016/j.jenvman.2021.113253
Cui, S., Pei, X., Jiang, Y., Wang, G., Fan, X., Yang, Q., et al. (2021). Liquefaction within a bedding fault: understanding the initiation and movement of the daguangbao landslide triggered by the 2008 wenchuan earthquake (ms = 8.0). Eng. Geol. 295:106455.
Dhyani, V., Kumar, J., and Bhaskar, T. (2017). Thermal decomposition kinetics of sorghum straw via thermogravimetric analysis. Bioresour. Technol. 245, 1122–1129. doi: 10.1016/j.biortech.2017.08.189
Ellis, N., Masnadi, M. S., Roberts, D. G., Kochanek, M. A., and Ilyushechkin, A. Y. (2015). Mineral matter interactions during co-pyrolysis of coal and biomass and their impact on intrinsic char co-gasification reactivity. Chem. Eng. J. 279, 402–408.
Geyer, R., Jambeck, J. R., and Law, K. L. (2017). Production, use, and fate of all plastics ever made. Sci. Adv. 3:e1700782.
Han, B., Chen, Y., Wu, Y., Hua, D., Chen, Z., Feng, W., et al. (2014). Co-pyrolysis behaviors and kinetics of plastics–biomass blends through thermogravimetric analysis. J. Therm. Anal. Calorim. 115, 227–235.
He, Y., and Kusiak, A. (2018). Performance assessment of wind turbines: data-derived quantitative metrics. IEEE Trans. Sustain. Energy 9, 65–73.
Jeong, H. M., Seo, M. W., Jeong, S. M., Na, B. K., Yoon, S. J., Lee, J. G., et al. (2014). Pyrolysis kinetics of coking coal mixed with biomass under non-isothermal and isothermal conditions. Bioresour. Technol. 155, 442–445. doi: 10.1016/j.biortech.2014.01.005
Kissinger, H. E. (1957). Reaction kinetics in differential thermal analysis. Anal. Chem. 29, 1702–1706.
Li, H. (2022a). SCADA data based wind power interval prediction using lube-based deep residual networks. Front. Energy Res. 10:920837. doi: 10.3389/fenrg.2022.920837
Li, H. (2022b). Short-term wind power prediction via spatial temporal analysis and deep residual networks. Front. Energy Res. 10:920407. doi: 10.3389/fenrg.2022.920407
Li, H., Deng, J., Feng, P., Pu, C., Arachchige, D. D. K., and Cheng, Q. (2021a). Short-term nacelle orientation forecasting using bilinear transformation and iceemdan framework. Front. Energy Res. 9:780928. doi: 10.3389/fenrg.2021.780928
Li, H., Deng, J., Yuan, S., Feng, P., and Arachchige, D. D. K. (2021b). Monitoring and identifying wind turbine generator bearing faults using deep belief network and ewma control charts. Front. Energy Res. 9:799039. doi: 10.3389/fenrg.2021.799039
Li, H., He, Y., Xu, Q., Deng, J., Li, W., and Wei, Y. (2022). Detection and segmentation of loess landslides via satellite images: a two-phase framework. Landslides 19, 673–686.
Li, S., Chen, X., Liu, A., Wang, L., and Xu, G. (2015). Co-pyrolysis characteristic of biomass and bituminous coal. Bioresour. Technol. 179, 414–420.
Miranda, N. T., Motta, I. L., Filho, R. M., and Maciel, M. R. W. (2021). Sugarcane bagasse pyrolysis: a review of operating conditions and products properties. Renew. Sustain. Energy Rev. 149:111394.
Mishra, G., Kumar, J., and Bhaskar, T. (2015). Kinetic studies on the pyrolysis of pinewood. Bioresour. Technol. 182, 282–288.
Ncube, L. K., Ude, A. U., Ogunmuyiwa, E. N., Zulkifli, R., and Beas, I. N. (2021). An overview of plastic waste generation and management in food packaging industries. Recycling 6:12. doi: 10.1186/s12940-020-0572-5
Ozawa, T. (1965). A new method of analyzing thermogravimetric data. Bull. Chem. Soc. Jpn 38, 1881–1886.
Park, D. K., Kim, S. D., Lee, S. H., and Lee, J. G. (2010). Co-pyrolysis characteristics of sawdust and coal blend in tga and a fixed bed reactor. Bioresour. Technol. 101, 6151–6156. doi: 10.1016/j.biortech.2010.02.087
Poletto, M., Zattera, A. J., and Santana, R. M. C. (2012). Thermal decomposition of wood: kinetics and degradation mechanism. Bioresource. Technol. 126, 7–12.
Salvilla, J. N. V., Ofrasio, B. I. G., Rollon, A. P., Manegdeg, F. G., Abrca, R. R. M., and Luna, M. D. G. (2020). Synergistic co-pyrolysıs of polyolefin plastics with wood and agricultural wastes for biofuel production. Appl. Energy 279:115668.
Sharuddin, S. D. A., Abnisa, F., Daud, W., and Aroua, M. K. (2016). A review on pyrolysis of plastic wastes. Energy Convers. Manag. 115, 308–326.
Soncini, R. M., Means, N. C., and Weiland, N. T. (2013). Co-pyrolysis of low rank coals and biomass: Product distributions. Fuel 112, 74–82.
Sonoyama, N., and Hayashi, J. (2013). Characterisation of coal and biomass based on kinetic parameter distributions for pyrolysis. Fuel 114, 206–215.
Starink, M. J. (1996). A new method for the derivation of activation energies from experiments performed at constant heating rate. Thermochim. Acta 288, 97–104.
Tang, Y., Huang, Q., Sun, K., Chi, Y., and Yan, J. (2018). Co-pyrolysis characteristics and kinetic analysis of organic food waste and plastic. Bioresour. Technol. 249, 16–23. doi: 10.1016/j.biortech.2017.09.210
Tsai, W. T., Lee, M. K., and Chang, Y. M. (2007). Fast pyrolysis of rice husk: product yields and compositions. Bioresource. Technol. 98, 22–28.
Wang, M., Zhang, S. L., and Duan, P. G. (2019). Slow pyrolysis of biomass: effects of effective hydrogen-to-carbon atomic ratio of biomass and reaction atmospheres. Energy Sources Part A 1–14.
Wang, Y., Wu, Q., Duan, D., Zhang, Y., Ruan, R., Liu, Y., et al. (2018). Co-pyrolysis of microwave-assisted acid pretreated bamboo sawdust and soapstock. Bioresour. Technol. 265, 33–38. doi: 10.1016/j.biortech.2018.05.095
Wang, Z., Burra, K. G., Lei, T., and Gupta, A. K. (2021). Co-pyrolysis of waste plastic and solid biomass for synergistic production of biofuels and chemicals-a review. Progr. Energy Combust. Sci. 84:100899.
Weiping, Y., and Yinying, C. (2007). Interaction performance of co-pyrolysis of biomass mixture and coal of different rank. Proc. Chin. Soc. Electr. Eng. 27, 80–86.
Wu, X., Wu, Y., Wu, K., Chen, Y., Hu, H., and Yang, M. (2015). Study on pyrolytic kinetics and behavior: the co-pyrolysis of microalgae and polypropylene. Bioresour. Technol. 192, 522–528. doi: 10.1016/j.biortech.2015.06.029
Wu, Z., Wang, S., Zhao, J., Chen, L., and Meng, H. (2014). Thermal behavior and char structure evolution of bituminous coal blends with edible fungi residue during co-pyrolysis. Energy Fuels 28, 1792–1801.
Xiu, S., and Shahbazi, A. (2012). Bio-oil production and upgrading research: a review. Renew. Sustain. Energy Rev. 16, 4406–4414.
Zheng, Y., Zhang, Y., Xu, J., Li, X., and Xu, C. (2017). Co-pyrolysis behavior of fermentation residues with woody sawdust by thermogravimetric analysis and a vacuum reactor. Bioresour. Technol. 245, 449–455. doi: 10.1016/j.biortech.2017.07.168
Zhou, J., Wei, J., Yang, T., Zhang, P., Liu, F., and Chen, J. (2021). Seepage channel development in the crown pillar: insights from induced microseismicity. Int. J. Rock Mech. Mining Sci. 145:104851.
Keywords: co-pyrolysis, biomass, polypropylene, synergistic effect, kinetics
Citation: Wang Z, An S, Zhao J, Sun P, Lyu H, Kong W and Shen B (2022) Plastic regulates its co-pyrolysis process with biomass: Influencing factors, model calculations, and mechanisms. Front. Ecol. Evol. 10:964936. doi: 10.3389/fevo.2022.964936
Received: 09 June 2022; Accepted: 04 July 2022;
Published: 29 July 2022.
Edited by:
Yusen He, Grinnell College, United StatesCopyright © 2022 Wang, An, Zhao, Sun, Lyu, Kong and Shen. This is an open-access article distributed under the terms of the Creative Commons Attribution License (CC BY). The use, distribution or reproduction in other forums is permitted, provided the original author(s) and the copyright owner(s) are credited and that the original publication in this journal is cited, in accordance with accepted academic practice. No use, distribution or reproduction is permitted which does not comply with these terms.
*Correspondence: Honghong Lyu, aG9uZ2hvbmdseXVAaGVidXQuZWR1LmNu; Wenwen Kong, MjAxOTkxNEBoZWJ1dC5lZHUuY24=; Boxiong Shen, c2hlbmJ4QGhlYnV0LmVkdS5jbg==
†These authors have contributed equally to this work
Disclaimer: All claims expressed in this article are solely those of the authors and do not necessarily represent those of their affiliated organizations, or those of the publisher, the editors and the reviewers. Any product that may be evaluated in this article or claim that may be made by its manufacturer is not guaranteed or endorsed by the publisher.
Research integrity at Frontiers
Learn more about the work of our research integrity team to safeguard the quality of each article we publish.