 Jiaying Zhang
 Yang Song
 Jing Wang
94% of researchers rate our articles as excellent or good
Learn more about the work of our research integrity team to safeguard the quality of each article we publish.
Find out more
ORIGINAL RESEARCH article
Front. Ecol. Evol., 02 August 2022
Sec. Conservation and Restoration Ecology
Volume 10 - 2022 | https://doi.org/10.3389/fevo.2022.959329
This article is part of the Research TopicSolutions to High-Quality Development: Theories and Practices in Ecological AspectsView all 21 articles
As the largest artificial ecosystem on Earth, croplands not only secure the basic living materials for people but also provide ecological service values for human society. For croplands, ecosystem services have proven to be of great value and are closely linked to human activities and climate change. However, spatiotemporal patterns of cropland ecosystem services and their drivers still need to be further assessed quantitatively. In this study, we provided a comprehensive evaluation of ecosystem services across China's cropland ecosystems over the past two decades using gross ecosystem product (GEP) as a single metric of the monetary evaluation of final ecosystem services. The values of material services, regulating services, and cultural services were calculated to summarize the GEP value of cropland ecosystems in China. Our results showed that the multiyear mean value of GEP was 4.35 × 10⁷ million CNY. The value of regulating services reached 3.86 × 10⁷ million CNY, followed by material services of 4.76 × 10⁶ million CNY and cultural services of 1.16 × 10⁵ million CNY. GEP value was different among provinces, leading to a heterogeneous spatial pattern associated with population and cultivated area. Moreover, we analyzed the trends in the GEP value at the provincial and national scales. The results showed that the GEP value of China's cropland ecosystems has increased over the period. The values of the material, regulating, and cultural services have increased at a rate of (0.35 ± 0.01) × 106 million CNY a−1, (1.12 ± 0.10) × 106 million CNY a−1, and (0.002 ± 0.0002) × 106 million CNY a−1, respectively (P < 0.05). The majority of provinces had an increasing trend in GEP, yet some developed provinces, e.g., Beijing and Shanghai, showed a decreasing trend. Furthermore, we evaluated the impacts of social-economic and natural factors on changes in GEP. We found that rising prices for agricultural products and services boosted an increase in GEP. Meanwhile, the spatiotemporal patterns of GEP were also associated with the adjustments of planting area in each province. Overall, our findings highlight the importance of assessing spatiotemporal patterns of cropland ecosystem services for decision-makers.
China's economy has maintained a rapid growth rate over the past two decades (World Bank, 2020), yet the ensuing environmental problems are becoming one of the most serious threats to ecological sustainability and security (Intergovernmental Panel on Climate Change (IPCC), 2018; Feng et al., 2021). The balance between social and natural values plays an essential role in achieving sustainable development for every country (Polasky et al., 2019; Jiang et al., 2021). Economic development will inevitably cause changes in the internal structure of natural capital (Li et al., 2021). In recent years, the Chinese government has recognized the importance of addressing the goal of sustainable development by protecting and restoring ecosystems (Naustdalslid, 2014), as President Xi Jinping's theory that “lucid waters and lush mountains are invaluable assets.” More paths such as the development of ecological civilization are needed to harmonize the apparent contradiction between economic development and environmental protection (Ma and Wei, 2021; Ma et al., 2021). The Seventeenth Congress of the Communist Party of China pointed out the construction of an ecological civilization with Chinese characteristics. In the cropland ecosystem, it has faced the problems of soil erosion and land degradation by natural forces and human pollution such as excessive application of chemical fertilizers and burning of straw. One of the aims of ecological civilization is to solve these issues for realizing the sustainable development of agriculture (Fan, 2011; Zhang, 2012).
As the world's largest artificial ecosystem, the agro-ecosystem covers nearly 40% of the global terrestrial area (Food Agriculture Organization of the United Nations, 2020). As a country with a large population, China has to consider the relationships between food production, environmental degradation, and economic development in cropland ecosystems (van Vliet et al., 2017; Zheng et al., 2019). Resolving the conflict between social-economic development and the conservation of highly productive farmland is significant and has an impact on food security (Lambin and Meyfroidt, 2011). Numerous policies for cropland conservation have been implemented all over the world, such as the Farmland Protection Program (USA) and the Basic Law of Agriculture (Japan). Since the late 1990s, China has adopted a series of policies to protect croplands in order to ensure national food security (Yang and Li, 2000; Skinner et al., 2001). The cropland area is essential to ensure food security in China. In recent years, China's food production has been increasing, but it is still facing the challenge of multiple difficulties in stabilizing the quantity, improving the quality, and preserving the ecology of cropland (Ministry of Agriculture Rural Affairs, 2021). To ensure food security, the actual cropland area in the country is maintained at 129 million hectares under the red line policy of 120 million hectares, which is about 12.7% of the national territory and ranks fourth in the world (Food Agriculture Organization of the United Nations, 2020). Therefore, valuing natural capital in China's cropland ecosystems is of importance for decision-makers, especially under the current national strategy (Song and Pijanowski, 2014; Jiang et al., 2016).
Ecosystem services mean the direct and indirect contributions of ecosystems to human society, representing part of the total economic value of the planet, including material services, regulating services, and cultural services (Costanza et al., 1997; Ouyang et al., 2016). The term “ecosystem services” is always used to assess natural resources and potential ecological benefits for human beings to survive and develop (Xu et al., 2021). For cropland ecosystems, the most important functions for human wellbeing and sustainable development are material product supply, climate regulation, soil retention, air purification, and carbon sequestration (Rodriguez-Entrena et al., 2014; Divinsky et al., 2017; Granado-Diaz et al., 2020). The values of these ecosystem services in croplands are enormous and often underappreciated (Power, 2010). Cropland ecosystems are facing the dual challenge of increasing food production while continuing to provide much-needed environmental goods and services (Cao et al., 2020). China's massive croplands make its ecosystems even more important for maintaining ecological balance, improving the environment, and protecting the basic conditions for human survival (Diaz et al., 2018; Losacco et al., 2021). Considering China's greater dependence on grain production, there will be a greater need for decision-makers to clarify changes in the provision and delivery of cropland ecosystem services to ensure self-sufficient agriculture production and sustainable cropland management (Fan et al., 2012).
There is a growing interest in the assessment and valuation of ecosystem services (Carpenter et al., 2006; Jackson et al., 2016; Gomez-Baggethun et al., 2019). The approaches from the perspective of social-ecological systems are used to analyze, assess, and quantify ecosystem services (Torres et al., 2021). For instance, the Millennium Ecosystem Assessment introduced a wide-disseminated framework for managing ecosystem services, showing the possibility of using economic valuation to value natural capital in ecosystems (Millennium Ecosystem Assessment., 2005). Previous studies used the economic valuation methods to better understand how ecosystems provide value to people and how to protect that value (Ranganathan, 2011). On this basis, more studies applied ecological-economic models to estimate the value of ecosystem services from forests, wetlands, and croplands at local and national levels (Dong et al., 2007; Guo et al., 2008; Nelson et al., 2009; Goldstein et al., 2012; Li et al., 2015; Ouyang et al., 2020). However, these approaches that translate ecosystems' contributions to the economy into monetary terms could be inconsistent, leading to their results that may not be comparable with each other.
To achieve a uniform measurement of ecosystem services, Ouyang et al. (2020) developed gross ecosystem product (GEP) to summarize the value of the contributions of nature to economic activity in a single monetary metric. Analogous to gross domestic product (GDP), GEP uses market prices and surrogates to calculate the value of ecosystem services and then aggregate them into a measure of the ecosystems to human society. Their results demonstrated that it is feasible to produce an estimate of GEP with currently available data and methods, and GEP can provide decision-makers with a clear understanding of the monetary value of ecosystem services (Wang et al., 2019a; Liang et al., 2021). In recent years, the ministry of ecology and environment of the People's Republic of China has published the technical guideline on gross ecosystem product which allowed to assess China's GEP with finite data and methods (Chinese Academy of Environmental Planning Research Center for Eco-Environmental Sciences, 2020).
The GEP has been assessed in various studies, but it is still difficult to compare the results, especially in agriculture. On the one hand, there is a shortage of unified assessment methods. On the other hand, the range of estimation and indicators is not consistent. Relevant studies show that the assessment of GEP mostly focuses on ecosystems such as forests and wetlands, and there are few specific studies on croplands, let alone a nationwide assessment of cropland ecosystem services and differentiation of human and natural impacts. In this study, we conducted a comprehensive analysis using GEP as a metric of the monetary evaluation of the final ecosystem services to assess the stock of the ecosystem and the flow of value in China's cropland ecosystems and their drivers from 2001 to 2019. The GEP of material services, regulating services, and cultural services was calculated to account for food production, water retention, soil retention, carbon sequestration, air purification, climate control, biodiversity, and agricultural tourism. The biophysical quantities were estimated using the statistical survey method, precipitation storage method, RUSLE model, carbon sequestration mechanism model, pollutant purification model, and evapotranspiration model following the recommended approaches by the Technical Guideline on Gross Ecosystem Product. The market value method, travel cost method, shadow project method, replacement cost method, and conservation value method were used to calculate the monetary value. Moreover, we analyzed spatial and temporal patterns of GEP across China's cropland ecosystems over the past two decades. Furthermore, we further set up seven experimental scenarios and used the linear least square regression method with an F-test to evaluate the effects of natural factors (including precipitation, high-temperature days, and evapotranspiration) and social-economic factors (including acreage and prices) on inter-annual changes in GEP. The aims of our study are as follows: (1) to evaluate the spatial pattern of GEP across China's cropland ecosystems; (2) to analyze the temporal pattern of GEP in China at the provincial scale during 2001–2019; and (3) to assess the impacts of natural factors and social-economic factors on GEP variation between years.
In our research, there were mainly three types of data, namely, crop data, meteorological data, and geographic information, obtained from the government departments, the industry standards, and the literature. Data from the government departments included the planting areas, prices, DEM, and climate factors. They were selected mainly from the National Bureau of Statistics, the Ministry of Agriculture and Rural Affairs, the Shuttle Radar Topography Mission, the Chinese National Metrological Information Center, and so on (Supplementary Figure 1 and Supplementary Tables 1, 2). To better assess the GEP in China's cropland, two industry standards containing the Technical Guideline on Gross Ecosystem Product and Guidelines for measurement and estimation of soil erosion in production and construction projects (SL 773-2018) were used. Moreover, other data, such as parameters, were collected from reviewing the literature (Supplementary Table 3). More detailed data descriptions are provided in the Supplementary material.
Ecological assessment systems of China's GEP in cropland have considered the individual characteristics, structure, and ecological services. The accounting index of GEP was divided into three major services and six smaller classes. We chose the ecological services described above because previous studies have shown their importance to cropland ecosystems, and we had available data and methods to evaluate their value according to the Technical Guideline on Gross Ecosystem Product (Yuan et al., 2011; Li et al., 2016; Tzilivakis et al., 2019; Cai et al., 2020). Material services, regulating services, and cultural services are accounted for in Eq. (1). Furthermore, water retention, soil retention, carbon sequestration, air purification, climate control, and biodiversity are accounted for in Eq. (2), relative to data availability:
where GEP is the value of the cropland gross ecosystem product; EPV is the value of cropland ecosystem products; ERV is the value of regulating services; ECV is the value of cultural services; WR, SR, CS, AP, CC, and BI represent the value of water retention, soil retention, carbon sequestration, air purification, climate control, and biodiversity, respectively. All the variables were defined in Table 1.
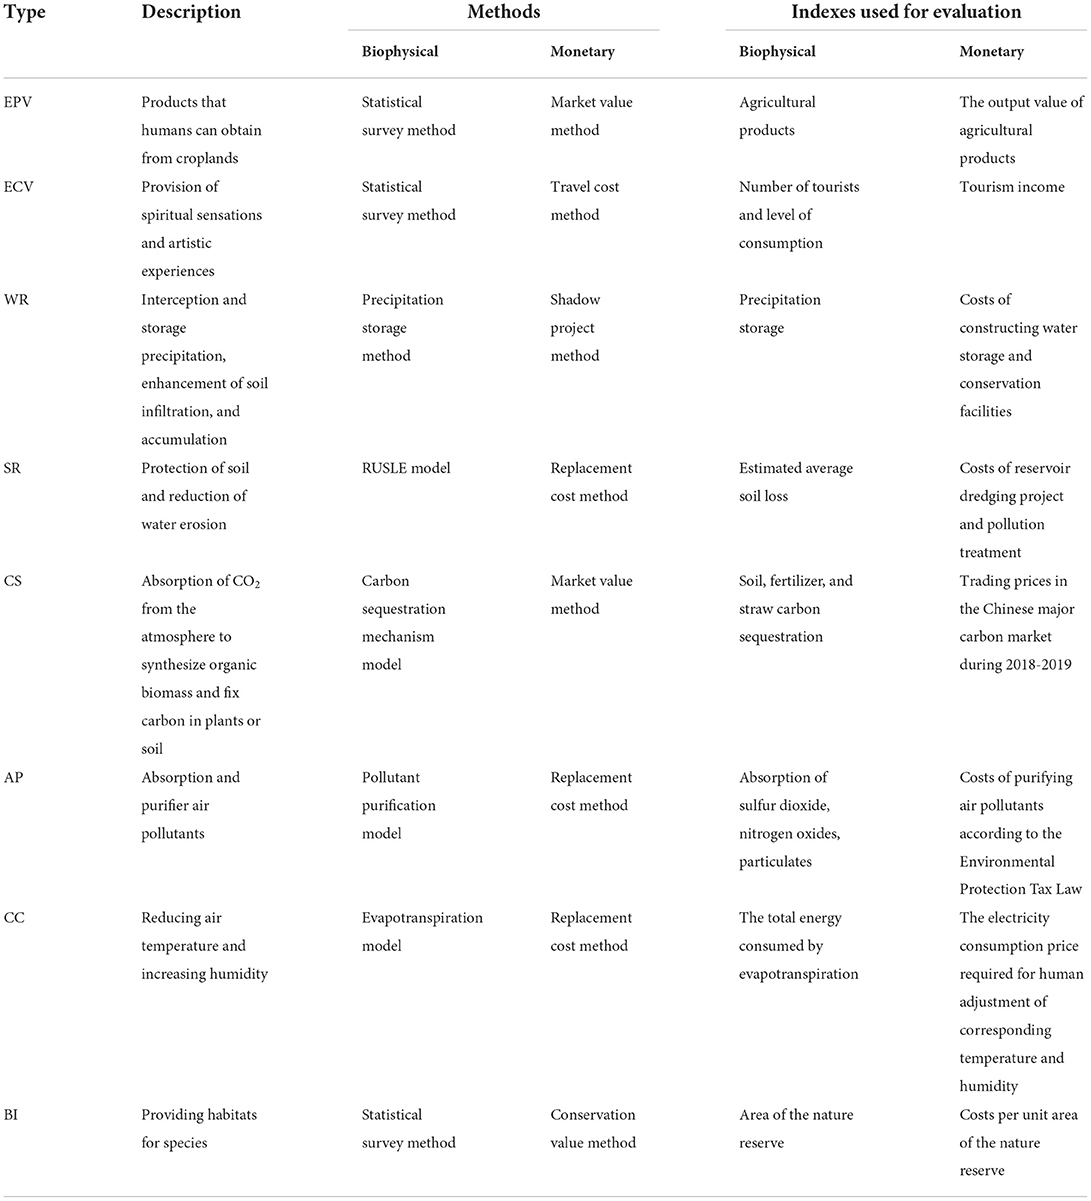
Table 1. Description of the evaluation methods of different types of ecosystem services.
The technical framework for the GEP of cropland contained two steps. First, the biophysical value of products and services was calculated by obtaining the output and quantity in China's cropland. To calculate the GEP, the biophysical value is measured followed by the monetary value. Second, we collected different prices to assess the monetary value. More detailed assessment methods are provided in Table 1 and Supplementary material.
To reveal the relationship between climate change, human activities, and GEP, we set up separate scenarios where the normal scenario allowed all the variables to change with time, and in the other scenarios, we kept one of all the variables at the 2001 level while allowing the other variables to change over time. These experimental scenarios considered both natural and social-economic influences on the biophysical and monetary value and also referred to the literature on driving factors of ecosystem services (Schroter et al., 2005; Haberl et al., 2007; Wang et al., 2016). To be specific, S0, SP, SH, SE, SN, SA, SC, and SS represent the scenarios of normal, no variation in precipitation, high-temperature days, evapotranspiration, all three natural factors, planting area, product prices, and two social-economic factors, respectively. Owing to some prices set by the government nationwide, therefore, we chose other drivers to compare in order to represent variation between provinces.
The trends in material services, regulating services, cultural services, GEP, and all the scenarios in China's croplands were estimated using the linear least square regression method with an F-test. Moreover, we analyzed the correlation between the trend of GEP and natural factors (including precipitation, high-temperature days, and evapotranspiration) and social-economic factors (including planting area and prices) over the whole study area. To be specific, the dominant factor is chosen by selecting the maximum difference between the trend of S0 and the trend of Si (i is the kind of scenario).
To evaluate the spatial pattern of GEP across China's cropland ecosystems from 2001 to 2019, we accounted for the values of the material, regulating, and cultural services and then aggregated them into GEP at the provincial and national scales (Figure 1 and Supplementary Table 4). The multiyear mean values of material services, regulating services, and cultural services of China's cropland ecosystems were 4.76 × 10⁶ million CNY, 3.86 × 10⁷ million CNY, and 1.16 × 10⁵ million CNY, respectively. The multiyear mean value of GEP was 4.35 × 10⁷ million CNY. However, our results showed that the values of the material, regulating, and cultural services were different among provinces, leading to a heterogeneous spatial pattern of GEP across China's cropland ecosystems. Specifically, the values of material and regulating services in the southern provinces were higher than those in the northern provinces, and the values of cultural services were high in the provinces of the North China Plain and Guangdong Province. The spatial pattern of GEP was similar to that of regulating services across China's cropland ecosystems, implying that cropland ecosystems contributed more to regulating services in the southern provinces. Moreover, we found that one-quarter of the provinces (including Sichuan, Henan, Hunan, Hubei, Yunnan, Guangdong, and Guangxi) contributed to over 50% of the total values of GEP across China's cropland ecosystems. Unlike natural ecosystems, cropland ecosystems were associated with human activities. Most of those provinces with high GEP were located on the east side of the Heihe-Tengchong line. Therefore, the spatial pattern of GEP was influenced by the population and cultivated area of each province according to the GEP accounting method.
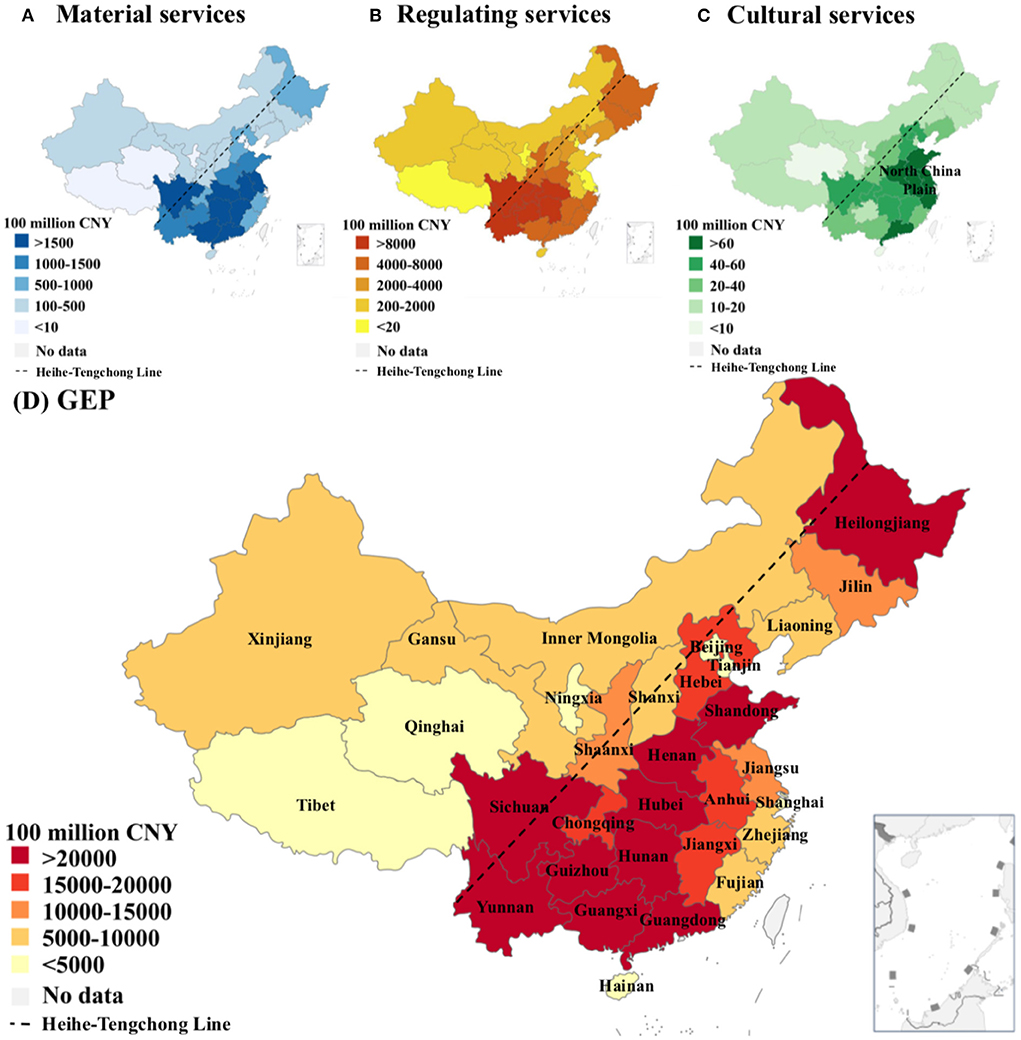
Figure 1. Spatial patterns of cropland ecosystem services in China during 2001–2019. (A–C) Spatial patterns of the multiyear mean values of the material, regulating, and cultural services; (D) Spatial pattern of the multiyear mean value of gross ecosystem product (GEP). The dashed line indicates the Heihe-Tengchong line.
To examine the temporal pattern of GEP across China's cropland ecosystems from 2001 to 2019, we analyzed the trends in the values of the material, regulating, cultural services, and GEP at the provincial and national scales (Figure 2 and Supplementary Table 4). The values of the material, regulating, and cultural services have increased at a rate of (0.35 ± 0.01) × 106 million CNY a−1, (1.12 ± 0.10) × 106 million CNY a−1, and (0.002 ± 0.0002) × 106 million CNY a−1, respectively (P < 0.05). Over this period, GEP associated with China's cropland ecosystems has increased at a rate of (1.47 ± 0.11) × 106 million CNY a−1 (P < 0.05). Our results showed that the increase in the value of regulating services accounted for the majority of the increase in GEP over the past two decades. Specifically, the values of soil retention, climate control, water retention, carbon sequestration, air purification, and biodiversity have increased at a rate of (0.86 ± 0.08) × 106 million CNY a−1, (0.11 ± 0.02) × 106 million CNY a−1, (0.10 ± 0.01) × 106 million CNY a−1, (0.04 ± 0.003) × 106 million CNY a−1, (0.004 ± 0.001) × 106 million CNY a−1, and (0.004 ± 0.0004) × 106 million CNY a−1, respectively (P < 0.05). Moreover, our results showed that the changes in the values of the material, regulating, and cultural services were different among provinces, leading to a heterogeneous temporal pattern of GEP across China's cropland ecosystems. The provinces with a high multiyear mean GEP (including Sichuan, Henan, Hunan, Hubei, Yunnan, Guangdong, and Guangxi) have a large increase in GEP due to the fast rise of the value of regulating services. However, not all provinces showed an increase in GEP, e.g., Beijing and Shanghai. Similar to the spatial patterns of cropland ecosystem services in China, the temporal patterns showed an important role in regulating services in boosting the total GEP of cropland ecosystems in China, especially in the southern provinces. In addition, we found a rapid increase in GEP in Xinjiang and Inner Mongolia. With shifting the centers of population and economy, GEP growth may no longer be limited by the Heihe-Tengchong line.

Figure 2. Temporal patterns of cropland ecosystem services in China during 2001–2019. (A–C) Temporal patterns of the growth rates of the material, regulating, and cultural services; (D) Temporal pattern of the growth rates of gross ecosystem product (GEP). The scatterplot is the linear regression of each service's value over time in China.
In this study, we performed several types of experimental scenarios to separate the effects of natural (i.e., precipitation, high-temperature days, and evapotranspiration) and social-economic (i.e., planting area and product prices) drivers on GEP during 2001–2019 (Figure 3 and Supplementary Table 5). The normal scenario (S0) allowed all the variables to change with time, showing a GEP trend at a rate of (1.47 ± 0.11) × 106 million CNY a−1 (P < 0.05). For the other scenarios, we held one of all the variables constant at its 2001 level, while allowing the other variables to change with time. Our results showed that the natural effects of precipitation, high-temperature days, and evapotranspiration on GEP were (1.10 ± 0.07) × 106 million CNY a−1, (1.47 ± 0.11) × 106 million CNY a−1, and (1.39 ± 0.10) × 106 million CNY a−1, respectively. The effect of precipitation contributed to a significant increase in GEP during 2001–2019, accounting for (0.37 ± 0.09) × 106 million CNY a−1. The total effect of natural drivers on GEP was (1.02 ± 0.06) × 106 million CNY a−1. Moreover, the social-economic effects of planting area and prices on GEP were (1.19 ± 0.09) × 106 million CNY a−1 and (0.44 ± 0.06) × 106 million CNY a−1, respectively. The effect of product prices contributed to a significant increase in GEP during 2001–2019, accounting for (1.03 ± 0.06) × 106 million CNY a−1. The total effect of social-economic drivers on GEP was (0.23 ± 0.05) × 106 million CNY a−1. Overall, we found that social-economic factors had a greater impact on GEP than natural factors, driving the increase in ecosystem services in China's croplands over the past two decades.
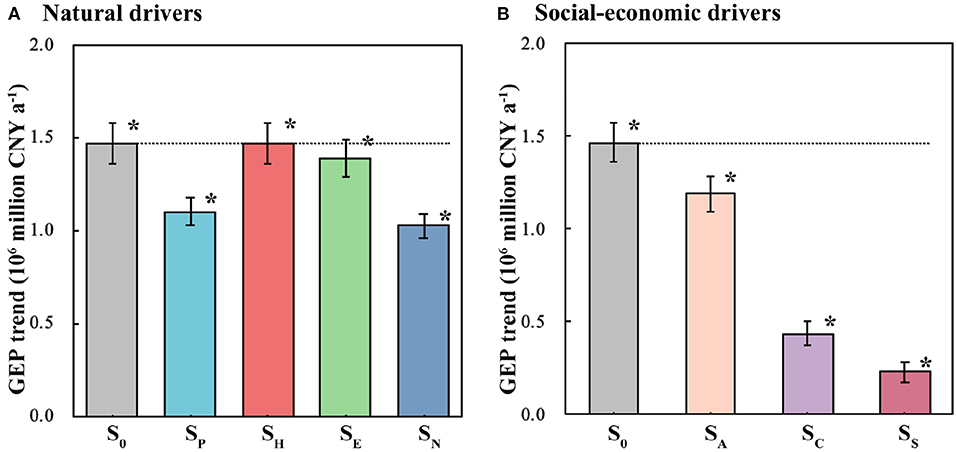
Figure 3. Effects of (A) natural and (B) social-economic drivers on GEP. S0, SP, SH, SE, SN, SA, SC, and SS represent the scenarios of normal, no variation in precipitation, high-temperature days, evapotranspiration, all three natural factors, planting area, product prices, and two social-economic factors, respectively. The dotted lines indicate the value of S0. * indicates significance at the 0.05 level.
Furthermore, we evaluated the effects of natural and social-economic drivers on GEP for each province during 2001–2019 (Figure 4 and Supplementary Table 6). Considering the uniformity of prices across 31 provinces in China, we only separated the effects of the other variables (i.e., precipitation, high-temperature days, evapotranspiration, and planting area) on GEP at the provincial scale. Our results showed that the trends in GEP were dominated by the changes in planting area in 20 of the 31 provinces over the past two decades. Specifically, the increases in planting area led to the growth of GEP in most provinces, such as Hunan, Yunnan, and Guizhou. However, for the provinces with faster economic development, such as Guangdong, Fujian, Hebei, Zhejiang, Hainan, Shanghai, Tianjin, and Beijing, the decreases in planting area resulted in slow growth and even a decrease in GEP. In addition, the changes in precipitation dominated the growth of GEP by affecting 8 of the 31 provinces, including Sichuan, Hubei, Jiangxi, and so on. Meanwhile, the changes in evapotranspiration dominated the growth of GEP affecting 3 of the 31 provinces, including Guangxi, Shandong, and Tibet. As we mentioned above, the changes in GEP were more relevant to social-economic factors rather than natural factors at both the provincial and national scales. China's social-economic policies (e.g., land-use change, ecological redline policy, and macro-economic control) exhibited a significant role in cropland ecosystem services over the past two decades.
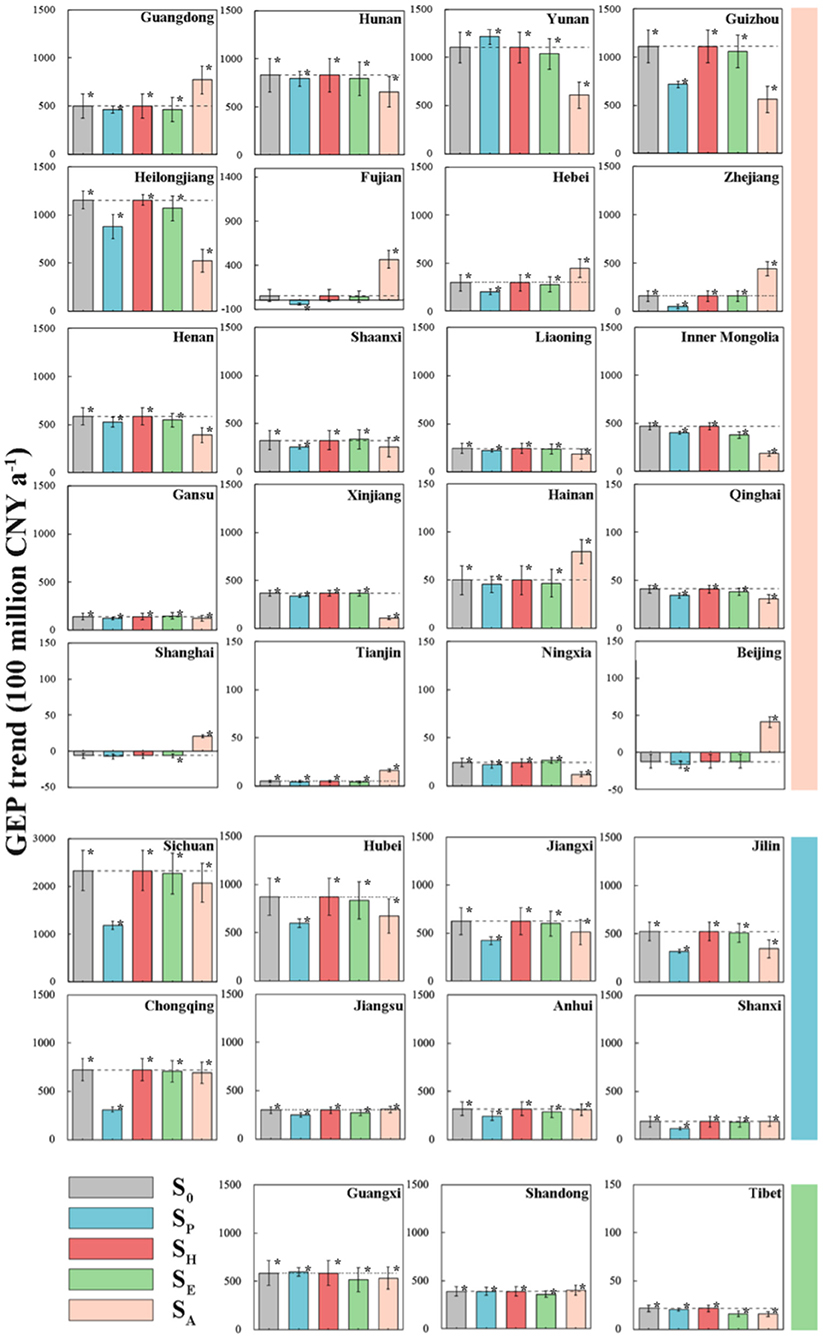
Figure 4. Effects of natural and social-economic drivers on GEP for 31 provinces in China. S0, SP, SH, SE, SN, SA, SC, and SS represent the scenarios of normal, no variation in precipitation, high-temperature days, evapotranspiration, all three natural factors, planting area, product prices, and two social-economic factors, respectively. The dotted lines indicate the value of S0. * indicates significance at the 0.05 level. The colors of the rectangle on the right side indicate the dominant driver.
As the foundation of social development, agriculture has consistently played an irreplaceable role in the national economy (Swinton et al., 2007; Power, 2010; Schipanski et al., 2014). The assessment of products and services within croplands helps to better understand the current state of agricultural development (Duguma et al., 2019; Balzan et al., 2020). However, many ecosystem services have indirect market-based prices in the current assessment system, and each service has different price accounting methods, making the assessment results more dependent on choices of distinct methods and consequently less comparable (Polasky et al., 2015). Therefore, a valuation was carried out for the cropland ecosystem services in China during 2001–2019 for 31 provinces (autonomous regions and municipalities) in our study, aiming to address the uncertainty of existing assessment strategies for the selection of indicators and inter-annual variables for each province. For example, Xie et al. (2015) calculated the value of the ecological services equivalent factor for rice, wheat, and maize. The factor was only defined as the value of the natural production of croplands with a national average yield of 3406.5 CNY·hm−2. After adding ecological services of croplands, the value has increased to 12919.2 CNY·hm−2 (Huang et al., 2022). Compared with previous studies, our estimated GEP is slightly larger than their findings (Chen et al., 2020; Yang et al., 2020; Jia et al., 2021). The major reason could be due to the selection of ecosystem indicators, inconsistent pricing methods for products and services, and inter-annual variations in model parameters. Some previous studies have concluded that material services were the dominant services of cropland ecosystem, which is mainly attributed to the fact that the material produced in the previous studies contained the additional products of cropland. For example, Yin et al. (2022) considered the value of straw, which was included in the carbon sequestration of regulating services in our study. In addition, compared with previous studies, we integrated more regulating services subsets to further expand its value (Bai et al., 2010; Marinidou et al., 2019; Cai et al., 2020). Therefore, it is recommended to strengthen the standardization of essential aspects such as ecological product assessment framework, index system, methods, and key parameters in the research of GEP, so as to achieve the systematic, repeatability, and horizontal comparability of results.
In our study, we found that the values of the southern provinces were generally higher than those of the northern provinces. More than half of China's croplands were in Hebei, Shandong, Henan, Shanxi, Heilongjiang, Jilin, Liaoning, and Sichuan (Song and Deng, 2017). However, China's precipitation resources were abundant but unbalanced, leading to a spatially heterogeneous distribution of GEP (Wang et al., 2016). Moreover, the provinces with high GEP were located on the east side of the Heihe-Tengchong line, which indicates a positive correlation between agriculture, population density, and topography (Wang et al., 2019b). Our results also showed that the major reasons why GEP was increasing in most of China's provinces were the effects of variation in price, planting area, and precipitation. Similarly, the findings on population, social-economic level, and industry scale for spatial heterogeneity have been proved in other studies (Gordeev et al., 2021; Wang et al., 2021, 2022; Zeng and Wang, 2022). In China, the effects of population growth and urbanization were significant. The decrease in food supplies has made structural inflation inevitable (Durevall et al., 2013). China's government has implemented a policy of agricultural subsidies to encourage cultivation, which was aiming at maintaining planting areas and safeguarding production (Huang and Yang, 2017). However, due to economic development accelerating the process of urbanization and reducing planting area, the two provinces where GEP was decreasing were Beijing and Shanghai. Due to the responses exhibited in both areas, specific ecological protection policies should be adopted. Besides, the provinces that were influenced by precipitation were mostly distributed along the Yangtze River. The phenomenon may be caused by the significant effects of meteorological factors on the extreme precipitation of the Yangtze River (Zou et al., 2021).
At present, the assessment of GEP in croplands is still in a developing stage, there are many imperfections. The effort in this study represents a start toward accounting of GEP in croplands, but much work remains. First, data limitations lead to an inaccurate estimation of assessment. Therefore, it is important to improve the scale, resolution, and frequency of data collection to examine a comprehensive and accurate accounting. Second, the growth periods of different plants should be considered in the calculation and using meteorological data at different stages. Maybe we estimated the contribution of croplands slightly higher than it actually was by using annual data. Third, although we have considered the influence of three natural factors and two social-economic factors and set up seven different scenarios based on each ecosystem service assessment process and referring to previous literature, the drivers of cropland ecosystems are still complex and various. We need to measure more comprehensively the drivers of cropland ecosystems, such as the population density and the transfer of GEP in croplands among provinces after policy regulation. This is an issue that needs to be considered in the future.
This study uses GEP as a metric of the monetary evaluation of final ecosystem services to estimate the stock of the ecosystem and the flow of value in China's cropland ecosystems and their drivers from 2001 to 2019 based on crop data, meteorological data, and geographic information. The study presents the following conclusions: (1) The average of China's GEP in croplands over the past two decades was 4.35 × 10⁷ million CNY. From the perspective of different ecosystem services, the value of regulating services reached 3.86 × 10⁷ million CNY and accounted for 88.78% of the gross ecosystem products. This was followed by material services 4.76 × 10⁶ million CNY and cultural services 1.16 × 10⁵ million CNY. Specifically, the values in the southern provinces were higher than those in the northern provinces. (2) In general, the temporal pattern of GEP across China's cropland ecosystems showed a positive trend during 2001–2019. GEP associated with China's cropland ecosystems has increased at a rate of (1.47 ± 0.11) × 106 million CNY a−1 (P < 0.05). The values of the material, regulating, and cultural services have increased at a rate of (0.35 ± 0.01) × 106 million CNY a−1, (1.12 ± 0.10) × 106 million CNY a−1, and (0.002 ± 0.0002) × 106 million CNY a−1, respectively (P < 0.05). Within the regulating services, the value of soil retention increased most rapidly, followed by climate control, water retention, and carbon sequestration, and the slowest was in the values of air purification and biodiversity. However, not all provinces showed an increase in GEP, e.g., Beijing and Shanghai. (3) In addition, social-economic factors have contributed more to cropland GEP than natural factors. In particular, inflation has significantly improved GEP over the past two decades. Furthermore, except for economic factors, the planting area influenced most provinces. It is expected that the results of our study will provide a novel insight for the future ecological assessments of cropland. This information will assist stakeholders in the scientific management of agriculture in China and draw greater attention to the utility of its resources.
The original contributions presented in the study are included in the article/Supplementary material, further inquiries can be directed to the corresponding author/s.
JZ collected and calculated the data and wrote the manuscript. YS helped design the structure of the manuscript and revised it. JW was involved in the study design and critically revised the manuscript. All authors have contributed to the article and approved the submitted version.
This research was supported by the National Key Research and Development Program of China (2021YFD1901104) and the 2115 Talent Development Program of China Agricultural University (00109016).
We would like to acknowledge the Chinese Academy of Environment Planning and Research Center for Eco-Environmental Sciences (CAS) for proposing the method of GEP assessment. We acknowledge all the producers of the datasets used in this study. We thank the editors and three reviewers for their constructive comments to further improve the quality of this manuscript.
The authors declare that the research was conducted in the absence of any commercial or financial relationships that could be construed as a potential conflict of interest.
All claims expressed in this article are solely those of the authors and do not necessarily represent those of their affiliated organizations, or those of the publisher, the editors and the reviewers. Any product that may be evaluated in this article, or claim that may be made by its manufacturer, is not guaranteed or endorsed by the publisher.
The Supplementary Material for this article can be found online at: https://www.frontiersin.org/articles/10.3389/fevo.2022.959329/full#supplementary-material
Bai, Y., Ouyang, Z. Y., and Zheng, H. (2010). Environmental benefit-loss analysis of agro-ecosystem in Haihe River basin, China. Chin. J. Appl. Ecol. 21, 2938–2945. doi: 10.13287/j.1001-9332.2010.0409
Balzan, M. V., Sadula, R., and Scalvenzi, L. (2020). Assessing ecosystem services supplied by agroecosystems in Mediterranean Europe: a literature review. Land-Basel 9, 245–266. doi: 10.3390/land9080245
Cai, S. Z., Zhang, X. L., Cao, Y. H., Zhang, Z. H., and Wang, W. (2020). Values of the farmland ecosystem services of Qingdao City, China, and their changes. J. Resour. Ecol. 11, 443–453. doi: 10.5814/j.issn.1674-764x.2020.05.002
Cao, Y., Li, G. Y., Tian, Y. H., Fang, X. Q., Li, Y., and Tan, Y. Z. (2020). Linking ecosystem services trade-offs, bundles and hotspot identification with cropland management in the coastal Hangzhou Bay area of China. Land Use Policy 97, 104689. doi: 10.1016/j.landusepol.2020.104689
Carpenter, S. R., DeFries, R., Dietz, T., Mooney, H. A., Polasky, S., Reid, W. V., et al. (2006). Millennium ecosystem assessment: research needs. Science 314, 257–258. doi: 10.1126/science.1131946
Chen, J., Yu, L. X., Yan, F. Q., and Zhang, S. W. (2020). Ecosystem service loss in response to agricultural expansion in the small Sanjiang Plain, Northeast China: process, driver and management. Sustainability 12, 2430–2445. doi: 10.3390/su12062430
Chinese Academy of Environmental Planning and Research Center for Eco-Environmental Sciences. (2020). The Technical Guideline on Gross Ecosystem Product (GEP) (1.0 Version). Accessed online at: http://www.caep.org.cn/zclm/sthjyjjhszx/zxdt_21932/202010/W020201029488841168291.pdf (accessed September 30, 2020).
Costanza, R., dArge, R., deGroot, R., Farber, S., Grasso, M., Hannon, B., et al. (1997). The value of the world's ecosystem services and natural capital. Nature 387, 253–260.
Diaz, S., Pascual, U., Stenseke, M., Martin-Lopez, B., Watson, R. T., Molnar, Z., et al. (2018). Assessing nature's contributions to people. Science 359, 270–272. doi: 10.1126/science.aap8826
Divinsky, I., Becker, N., and Bar, P. (2017). Ecosystem service tradeoff between grazing intensity and other services: a case study in Karei-Deshe experimental cattle range in northern Israel. Ecosyst. Serv. 24, 16–27. doi: 10.1016/j.ecoser.2017.01.002
Dong, X. B., Gao, W. S., Chen, Y. Q., and Liang, W. L. (2007). Valuation of fragile agro-ecosystem services in the Loess region: a case study of Ansai county in China. Outlook Agr. 36, 247–253. doi: 10.5367/000000007783418561
Duguma, M. S., Feyssa, D. H., and Biber-Freudenberger, L. (2019). Agricultural biodiversity and ecosystem services of major farming systems: a case study in Yayo coffee forest biosphere reserve, Southwestern Ethiopia. Agriculture 9, 48–74. doi: 10.3390/agriculture9030048
Durevall, D., Loening, J. L., and Birru, Y. A. (2013). Inflation dynamics and food prices in Ethiopia. J. Dev. Econ. 104, 89–106. doi: 10.1016/j.jdeveco.2013.05.002
Fan, M. S., Shen, J. B., Yuan, L. X., Jiang, R. F., Chen, X. P., Davies, W. J., et al. (2012). Improving crop productivity and resource use efficiency to ensure food security and environmental quality in China. J. Exp. Bot. 63, 13–24. doi: 10.1093/jxb/err248
Fan, Y. (2011). Study on Ecological Civilization Construction with Characteristic of China (Doctoral thesis). Wuhan: Wuhan University.
Feng, Y. X., He, S. W., and Li, G. D. (2021). Interaction between urbanization and the eco-environment in the Pan-Third Pole region. Sci. Total Environ. 789, 140811. doi: 10.1016/j.scitotenv.2021.148011
Food and Agriculture Organization of the United Nations. (2020). FAO Statistics. Available online at: https://www.fao.org/faostat (accessed September 1, 2021).
Goldstein, J. H., Caldarone, G., Duarte, T. K., Ennaanay, D., Hannahs, N., Mendoza, G., et al. (2012). Integrating ecosystem-service tradeoffs into land-use decisions. Proc. Natl. Acad. Sci. U. S. A. 109, 7565–7570. doi: 10.1073/pnas.1201040109
Gomez-Baggethun, E., Tudor, M., Doroftei, M., Covaliov, S., Nastase, A., Onara, D. F., et al. (2019). Changes in ecosystem services from wetland loss and restoration: an ecosystem assessment of the Danube Delta (1960–2010). Ecosyst. Serv. 39, 100965. doi: 10.1016/j.ecoser.2019.100965
Gordeev, R. V., Pyzhev, A. I., and Yagolnitser, M. A. (2021). Drivers of spatial heterogeneity in the Russian forest sector: a multiple factor analysis. Forests. 12, 1635. doi: 10.3390/f12121635
Granado-Diaz, R., Gomez-Limon, J. A., Rodriguez-Entrena, M., and Villanueva, A. J. (2020). Spatial analysis of demand for sparsely located ecosystem services using alternative index approaches. Eur. Rev. Agric. Econ. 47, 752–784. doi: 10.1093/erae/jbz036
Guo, H., Wang, B., Ma, X. Q., Zhao, G. D., and Li, S. N. (2008). Evaluation of ecosystem services of Chinese pine forests in China. Sci. China Ser. C. 51, 662–670. doi: 10.1007/s11427-008-0083-z
Haberl, H., Erb, K. H., Krausmann, F., Gaube, V., Bondeau, A., Plutzar, C., et al. (2007). Quantifying and mapping the human appropriation of net primary production in earth's terrestrial ecosystems. Proc. Natl. Acad. Sci. U. S. A. 104, 12942–12945. doi: 10.1073/pnas.0704243104
Huang, H. C., Lei, M., Kong, X. B., and Wen, L. Y. (2022). Spatial pattern change of cultivated land and response of ecosystem service value in China. Res. Soil Water Conserv. 29, 339–348.
Huang, J. K., and Yang, G. L. (2017). Understanding recent challenges and new food policy in China. Glob Food Secur. Agric. 12, 119–126. doi: 10.1016/j.gfs.2016.10.002
Intergovernmental Panel on Climate Change (IPCC). (2018). Global Warming of 1.5°C: An IPCC Special Report on the Impacts of Global Warming of 1.5°C Above Pre-Industrial Levels and Related Global Greenhouse Gas Emission Pathways, in the Context of Strengthening the Global Response to the Threat of Climate Change, Sustainable Development, and Efforts to Eradicate Poverty. Geneva: World Meteorological Organization.
Jackson, S. T., Duke, C. S., Hampton, S. E., Jacobs, K. L., Joppa, L. N., Kassam, K. A. S., et al. (2016). Toward a national, sustained US ecosystem assessment. Science 354, 838–839. doi: 10.1126/science.aah5750
Jia, Y., Liu, Y., and Zhang, S. (2021). Evaluation of agricultural ecosystem service value in arid and semiarid regions of northwest China based on the equivalent factor method. Environ. Process. 8, 713–727. doi: 10.1007/s40710-021-00514-2
Jiang, H. Q., Wu, W. J., Wang, J. N., Yang, W. S., Gao, Y. M., Duan, Y., et al. (2021). Mapping global value of terrestrial ecosystem services by countries. Ecosyst. Serv. 52, 101361. doi: 10.1016/j.ecoser.2021.101361
Jiang, M., Xin, L. J., Li, X. B., and Tan, M. H. (2016). Spatiotemporal variation of China's state-owned construction land supply from 2003 to 2014. Sustainability 8, 1137. doi: 10.3390/su8111137
Lambin, E. F., and Meyfroidt, P. (2011). Global land use change, economic globalization, and the looming land scarcity. Proc. Natl. Acad. Sci. U. S. A. 108, 3465–3472. doi: 10.1073/pnas.1100480108
Li, S. N., Zhang, J. J., Chen, J., and Zhao, Y. H. (2016). Review on farmland ecosystem services and its valuation. J. Hebei Agric. Sci. 20, 87–94. doi: 10.16318/j.cnki.hbnykx.2016.03.023
Li, Y. L., Deng, H. B., and Dong, R. C. (2015). Prioritizing protection measures through ecosystem services valuation for the Napahai Wetland, Shangri-La County, Yunnan Province, China. Int. J. Sust. Dev. World 22, 142–150. doi: 10.1080/13504509.2014.926298
Li, Z. H., Wang, J., Kong, X. S., Zhang, B. E., Liu, J. J., Ding, S., et al. (2021). Effects of ecosystems preservation on economic growth in China's coastal region: Multilevel modeling and exploration. Ecol. Indic. 132, 108224. doi: 10.1016/j.ecolind.2021.108224
Liang, L. N., Siu, W. S., Wang, M. X., and Zhou, G. J. (2021). Measuring gross ecosystem product of nine cities within the Pearl River Delta of China. Environ. Chall. 4, 100105. doi: 10.1016/j.envc.2021.100105
Losacco, D., Ancona, V., De Paola, D., Tumolo, M., Massarelli, C., Gatto, A., et al. (2021). Development of ecological strategies for the recovery of the main nitrogen agricultural pollutants: a review on environmental sustainability in agroecosystems. Sustainability 13, 7163–7180. doi: 10.3390/su13137163
Ma, K. P., and Wei, F. W. (2021). Ecological civilization: a revived perspective on the relationship between humanity and nature. Natl. Sci. Rev. 8, 112. doi: 10.1093/nsr/nwab112
Ma, T. X., Hu, Y. S., Wang, M., Yu, L. J., and Wei, F. W. (2021). Unity of nature and man: a new vision and conceptual framework for the post-2020 global biodiversity framework. Natl. Sci. Rev. 8, 265. doi: 10.1093/nsr/nwaa265
Marinidou, E., Jimenez-Ferrer, G., Soto-Pinto, L., Ferguson, B. G., and Saldivar-Moreno, A. (2019). Agro-ecosystem services assessment of silvopastoral experiences in Chiapas, Mexico: towards a methodological proposal. Exp. Agric. 55, 21–37. doi: 10.1017/S0014479717000539
Millennium Ecosystem Assessment. (2005). Ecosystems and Human Well-Being: Synthesis. Washington, DC: Island Press
Ministry of Agriculture and Rural Affairs. (2021). 14th Five-Year National Agriculture Green Development Plan. Available online at: http://www.moa.gov.cn/nybgb/2021/202109/202112/t20211207_6384020.htm (accessed March 23, 2022).
Naustdalslid, J. (2014). Circular economy in China: the environmental dimension of the harmonious society. Int. J. Sust. Dev. World 21, 303–313. doi: 10.1080/13504509.2014.914599
Nelson, E., Mendoza, G., Regetz, J., Polasky, S., Tallis, H., Cameron, D. R., et al. (2009). Modeling multiple ecosystem services, biodiversity conservation, commodity production, and tradeoffs at landscape scales. Front. Ecol. Environ. 7, 4–11. doi: 10.1890/080023
Ouyang, Z., Zheng, H., Xiao, Y., Polasky, S., Liu, J., Xu, W., et al. (2016). Improvements in ecosystem services from investments in natural capital. Science 352, 1455–1459. doi: 10.1126/science.aaf2295
Ouyang, Z. Y., Song, C. S., Zheng, H., Polasky, S., Xiao, Y., Bateman, I. J., et al. (2020). Using gross ecosystem product (GEP) to value nature in decision making. Proc. Natl. Acad. Sci. U. S. A. 117, 14593–14601. doi: 10.1073/pnas.1911439117
Polasky, S., Kling, C. L., Levin, S. A., Carpenter, S. R., Daily, G. C., Ehrlich, P. R., et al. (2019). Role of economics in analyzing the environment and sustainable development. Proc. Natl. Acad. Sci. U. S. A. 116, 5233–5238. doi: 10.1073/pnas.1901616116
Polasky, S., Tallis, H., and Reyers, B. (2015). Setting the bar: standards for ecosystem services. Proc. Natl. Acad. Sci. U. S. A. 112, 7356–7361. doi: 10.1073/pnas.1406490112
Power, A. G. (2010). Ecosystem services and agriculture: tradeoffs and synergies. Philos. Trans. R. Soc. B. 365, 2959–2971. doi: 10.1098/rstb.2010.0143
Ranganathan, J. (2011). Natural Capital: Theory and Practice of Mapping Ecosystem Services. New York, NY: Oxford University Press.
Rodriguez-Entrena, M., Espinosa-Goded, M., and Barreiro-Hurle, J. (2014). The role of ancillary benefits on the value of agricultural soils carbon sequestration programmes: evidence from a latent class approach to Andalusian olive groves. Ecol. Econ. 99, 63–73. doi: 10.1016/j.ecolecon.2014.01.006
Schipanski, M. E., Barbercheck, M., Douglas, M. R., Finney, D. M., Haider, K., Kaye, J. P., et al. (2014). A framework for evaluating ecosystem services provided by cover crops in agroecosystems. Agric. Syst. 125, 12–22. doi: 10.1016/j.agsy.2013.11.004
Schroter, D., Cramer, W., Leemans, R., Prentice, I. C., Araujo, M. B., Arnell, N. W., et al. (2005). Ecosystem service supply and vulnerability to global change in Europe. Science 310, 1333–1337. doi: 10.1126/science.1115233
Skinner, M. W., Kuhn, R. G., and Joseph, A. E. (2001). Agricultural land protection in China: a case study of local governance in Zhejiang Province. Land Use Policy 18, 329–340. doi: 10.1016/S0264-8377(01)00026-6
Song, W., and Deng, X. Z. (2017). Land-use/land-cover change and ecosystem service provision in China. Sci. Total Environ. 576, 705–719. doi: 10.1016/j.scitotenv.2016.07.078
Song, W., and Pijanowski, B. C. (2014). The effects of China's cultivated land balance program on potential land productivity at a national scale. Appl. Geogr. 46, 158–170. doi: 10.1016/j.apgeog.2013.11.009
Swinton, S. M., Lupi, F., Robertson, G. P., and Hamilton, S. K. (2007). Ecosystem services and agriculture: cultivating agricultural ecosystems for diverse benefits. Ecol. Econ. 64, 245–252. doi: 10.1016/j.ecolecon.2007.09.020
Torres, A. V., Tiwari, C., and Atkinson, S. F. (2021). Progress in ecosystem services research: a guide for scholars and practitioners. Ecosyst. Serv. 49, 101267. doi: 10.1016/j.ecoser.2021.101267
Tzilivakis, J., Warner, D. J., and Holland, J. M. (2019). Developing practical techniques for quantitative assessment of ecosystem services on farmland. Ecol. Indic. 106, 105514. doi: 10.1016/j.ecolind.2019.105514
van Vliet, J., Eitelberg, D. A., and Verburg, P. H. (2017). A global analysis of land take in cropland areas and production displacement from urbanization. Glob. Environ. Change 43, 107–115. doi: 10.1016/j.gloenvcha.2017.02.001
Wang, F., Zhang, S. L., Hou, H. P., Yang, Y. J., and Gong, Y. L. (2019a). Assessing the changes of ecosystem services in the Nansi lake wetland, China. Water 11, 788. doi: 10.3390/w11040788
Wang, H., Zhou, S. L., Li, X. B., Liu, H. H., Chi, D. K., and Xu, K. K. (2016). The influence of climate change and human activities on ecosystem service value. Ecol. Eng. 87, 224–239. doi: 10.1016/j.ecoleng.2015.11.027
Wang, H. Z., Pan, X. M., and Zhang, S. B. (2021). Spatial autocorrelation, influencing factors and temporal distribution of the construction and demolition waste disposal industry. Waste Manage. 127, 158–167. doi: 10.1016/j.wasman.2021.04.025
Wang, Z., Xia, H. B., Tian, Y., Wang, K., Hua, H., Geng, W. J., et al. (2019b). A big-data analysis of HU Line existence in the ecology view and new economic geographical understanding based on population distribution. Acta Ecol. Sin. 39, 5166–5177. doi: 10.5846/stxb201812212776
Wang, Z. S., Zhang, Z. S., and Liu, J. K. (2022). Exploring spatial heterogeneity and factors influencing construction and demolition waste in China. Environ. Sci. Pollut. R. doi: 10.1007/s11356-022-19554-8
World Bank, GDP statistics. (2020). Available online at: https://data.worldbank.org.cn/country/china. (accessed July 1, 2021).
Xie, G. D., Zhang, C. X., Zhang, L. M., Chen, W. H., Li, S. M., et al. (2015). Improvement of the evaluation method for ecosystem service value based on per unit area. J. Nat. Resour. 30, 1243–1254. doi: 10.11849/zrzyxb.2015.08.001
Xu, Y. N., Wei, J. N., Li, Z. J., Zhao, Y. X., Lei, X. Y., Sui, P., et al. (2021). Linking ecosystem services and economic development for optimizing land use change in the poverty areas. Ecosyst. Health Sust. 7, 325–336. doi: 10.1080/20964129.2021.1877571
Yang, H., and Li, X. B. (2000). Cultivated land and food supply in China. Land Use Policy 17, 73–88. doi: 10.1016/S0264-8377(00)00008-9
Yang, Y. J., Wang, K., Liu, D., Zhao, X. Q., and Fan, J. W. (2020). Effects of land-use conversions on the ecosystem services in the agro-pastoral ecotone of northern China. J. Clean Prod. 249, 119360. doi: 10.1016/j.jclepro.2019.119360
Yin, Y., Xi, F. M., Bing, L. F., and Wang, J. Y. (2022). A quantitative study on cultivated land compensation based on ecological value accounting——Taking Shenyang city as an example. Nat. Resour. Econ. China. doi: 10.19676/j.cnki.1672-6995.000750
Yuan, Y., Liu, J. T., and Jin, Z. D. (2011). An integrated assessment of positive and negative effects of high-yielding cropland ecosystem services in Luancheng County, Hebei Province of North China. Chin. J. Ecol. 30, 2809–2814. doi: 10.13292/j.1000-4890.2011.0412
Zeng, J. H., and Wang, C. (2022). Temporal characteristics and spatial heterogeneity of air quality changes due to the COVID-19 lockdown in China. Resour. Conserv. Recy. 181, 106223. doi: 10.1016/j.resconrec.2022.106223
Zhang, M. Y. (2012). Research on soil and water environmental problems in the construction of agro-ecological civilization: a case study of Henan Province. Adv. Mater. Res. Switz. 347–353, 2749–2753. doi: 10.4028/www.scientific.net/AMR.550-553.2749
Zheng, W. W., Ke, X. L., Zhong, T., and Yang, B. H. (2019). Trade-offs between cropland quality and ecosystem services of marginal compensated cropland: a case study in Wuhan, China. Ecol. Indic. 105, 613–620. doi: 10.1016/j.ecolind.2018.05.089
Keywords: gross ecosystem product, ecosystem service, cropland, driving factor, spatial distribution
Citation: Zhang J, Song Y and Wang J (2022) Spatiotemporal patterns of gross ecosystem product across China's cropland ecosystems over the past two decades. Front. Ecol. Evol. 10:959329. doi: 10.3389/fevo.2022.959329
Received: 01 June 2022; Accepted: 11 July 2022;
Published: 02 August 2022.
Edited by:
Fan Zhang, Institute of Geographic Sciences and Natural Resources Research (CAS), ChinaReviewed by:
Wang Zhenshuang, Dongbei University of Finance and Economics, ChinaCopyright © 2022 Zhang, Song and Wang. This is an open-access article distributed under the terms of the Creative Commons Attribution License (CC BY). The use, distribution or reproduction in other forums is permitted, provided the original author(s) and the copyright owner(s) are credited and that the original publication in this journal is cited, in accordance with accepted academic practice. No use, distribution or reproduction is permitted which does not comply with these terms.
*Correspondence: Jing Wang, d2FuZ2pAY2F1LmVkdS5jbg==
Disclaimer: All claims expressed in this article are solely those of the authors and do not necessarily represent those of their affiliated organizations, or those of the publisher, the editors and the reviewers. Any product that may be evaluated in this article or claim that may be made by its manufacturer is not guaranteed or endorsed by the publisher.
Research integrity at Frontiers
Learn more about the work of our research integrity team to safeguard the quality of each article we publish.