- 1Center for Tropical Medicine, Faculty of Medicine, Public Health, and Nursing, Universitas Gadjah Mada, Yogyakarta, Indonesia
- 2Department of Biostatistics, Epidemiology, Population Health, Faculty of Medicine, Public Health, and Nursing, Universitas Gadjah Mada, Yogyakarta, Indonesia
- 3Wildlife Laboratory, Faculty of Forestry, Universitas Gadjah Mada, Yogyakarta, Indonesia
- 4Department of Health Behavior, Environment, and Social Medicine, Faculty of Medicine, Public Health, and Nursing, Universitas Gadjah Mada, Yogyakarta, Indonesia
- 5Department of Industrial Engineering, Faculty of Engineering, Universitas Indonesia, Depok, Indonesia
- 6Department of Industrial Engineering, Faculty of Engineering, Diponegoro University, Semarang, Indonesia
- 7Institute of Forest Growth and Forest Computer Sciences, Department of Forest Sciences, Faculty of Environmental Sciences, Technische Universität Dresden, Tharandt, Germany
Introduction: Coronavirus transmission is strongly influenced by human mobilities and interactions within and between different geographical regions. Human mobility within and between cities is motivated by several factors, including employment, cultural-driven, holidays, and daily routines.
Method: We developed a sustained metapopulation (SAMPAN) model, an agent-based model (ABM) for simulating the effect of individual mobility and interaction behavior on the spreading of COVID-19 viruses across main cities on Java Island, Indonesia. The model considers social classes and social mixing affecting the mobility and interaction behavior within a sub-population of a city in the early pandemic. Travelers’ behavior represents the mobility among cities from central cities to other cities and commuting behavior from the surrounding area of each city.
Results: Local sensitivity analysis using one factor at a time was performed to test the SAMPAN model, and we have identified critical parameters for the model. While validation was carried out for the Jakarta area, we are confident in implementing the model for a larger area with the concept of metapopulation dynamics. We included the area of Bogor, Depok, Bekasi, Bandung, Semarang, Surakarta, Yogyakarta, Surabaya, and Malang cities which have important roles in the COVID-19 pandemic spreading on this island.
Discussion: Our SAMPAN model can simulate various waves during the first year of the pandemic caused by various phenomena of large social mobilities and interactions, particularly during religious occasions and long holidays.
Introduction
Standard models of COVID-19 transmission mostly use a numerical model to provide insight into disease dynamics. Predictions are developed for a single area, such as in the Wuhan district, China (Zhou et al., 2020), or a single country, such as Italy (Pedersen and Meneghini, 2020). For example, Wuhan prediction is made using a YJ-SEIR model in which the improved version of Susceptible-Exposed-Infective-Recovered (SEIR) is improved. The new categories of the improved model are divided into Y-type (suspected/with the symptom but not confirmed in time) and J-type (indirectly infected people) (Zhou et al., 2020). A susceptible-infectious-quarantine-recovered (SIQR) model is considered a suitable model in Italy. The model included a sub-population of those who were quarantined (Q = Quarantine), which calculates the infectious case’s estimation since its outbreak and the endless number of undetected positive cases (Pedersen and Meneghini, 2020).
In contrast, as COVID-19 is transmitted via droplets, a close, person-to-person interaction will drive the spread of the disease through the population (World Health Organization [WHO], 2020). During the early days of the pandemic, statistics from several European countries showed that large urban agglomerations such as London, Paris, and Madrid registered many cases due to their size and population density (Hantrais and Letablier, 2021). As such, the contact rate is influenced by many different factors. Contact patterns are usually influenced by age-specific mixing patterns, for example, children mixing with children at school and adults mixing with an adult. However, it is also influenced by demographic characteristics, family structure, and culture-specific practices (Hunter et al., 2018; Liu et al., 2021). For example, intergeneration contact is less likely in developed countries such as Europe than in developing countries where extended family is still widely practiced. This heterogeneity in social network and contact patterns can result in a differential impact on transmission (Muller et al., 2020; Liu et al., 2021).
Furthermore, mobile activities that involve people commuting by public transportation led to the different interactions of a group of people in various locations. Therefore, this mobility is a potential leading source to picture disease transmission dynamics (Perez and Dragicevic, 2009). However, a numerical model has limited flexibility to accommodate the complexity of social interaction in influencing COVID-19 transmissions, mainly when the population is heterogeneously mixed with a complex social network (Frias-Martinez et al., 2011; Pellegrino et al., 2022). In this situation, an agent-based model (ABM) provides a high-resolution simulation of both temporal and spatial epidemic dynamics at the individual level (Truszkowska et al., 2021). In addition, ABM is more flexible in simulating non-linear relations influenced by multiple levels and interpersonal interactions than other approaches (Tracy et al., 2018).
To this end, we aim to develop an agent-based model for understanding the roles of social interaction and individual decisions to move from the main cities on Java Island, Indonesia. Indonesia is unique as it is a large archipelago country with a diverse demographic and cultural situation. These diversities affecting the mobility behavior of the people and the interactions among individuals are essential mechanisms in the spreading of COVID-19.
Materials and methods
We developed the sustained metapopulation (SAMPAN) model, an agent-based model for simulating the dynamics of COVID-19 spreading across various main cities on Java Island, Indonesia. The SAMPAN model considers the variation of social classes among individuals, affecting social mixing in each city. In addition, we also consider mobility among cities and within cities which leads to interaction, consider the metapopulation concept among cities on Java Island, and the variation among individuals (age classes and occupations), which lead to mobility behavior and affect the infection rate of the population for the context in Indonesia. To describe the SAMPAN model, we followed the Overview, Design, and Details (ODD) protocol format (Grimm et al., 2010, 2020) for clarity and possible replication. The study area of our model is the main cities on Java Island (Jakarta, Bodetabek, Bandung, Semarang, Surakarta, Yogyakarta, Surabaya, and Malang), as shown in Figure 1.
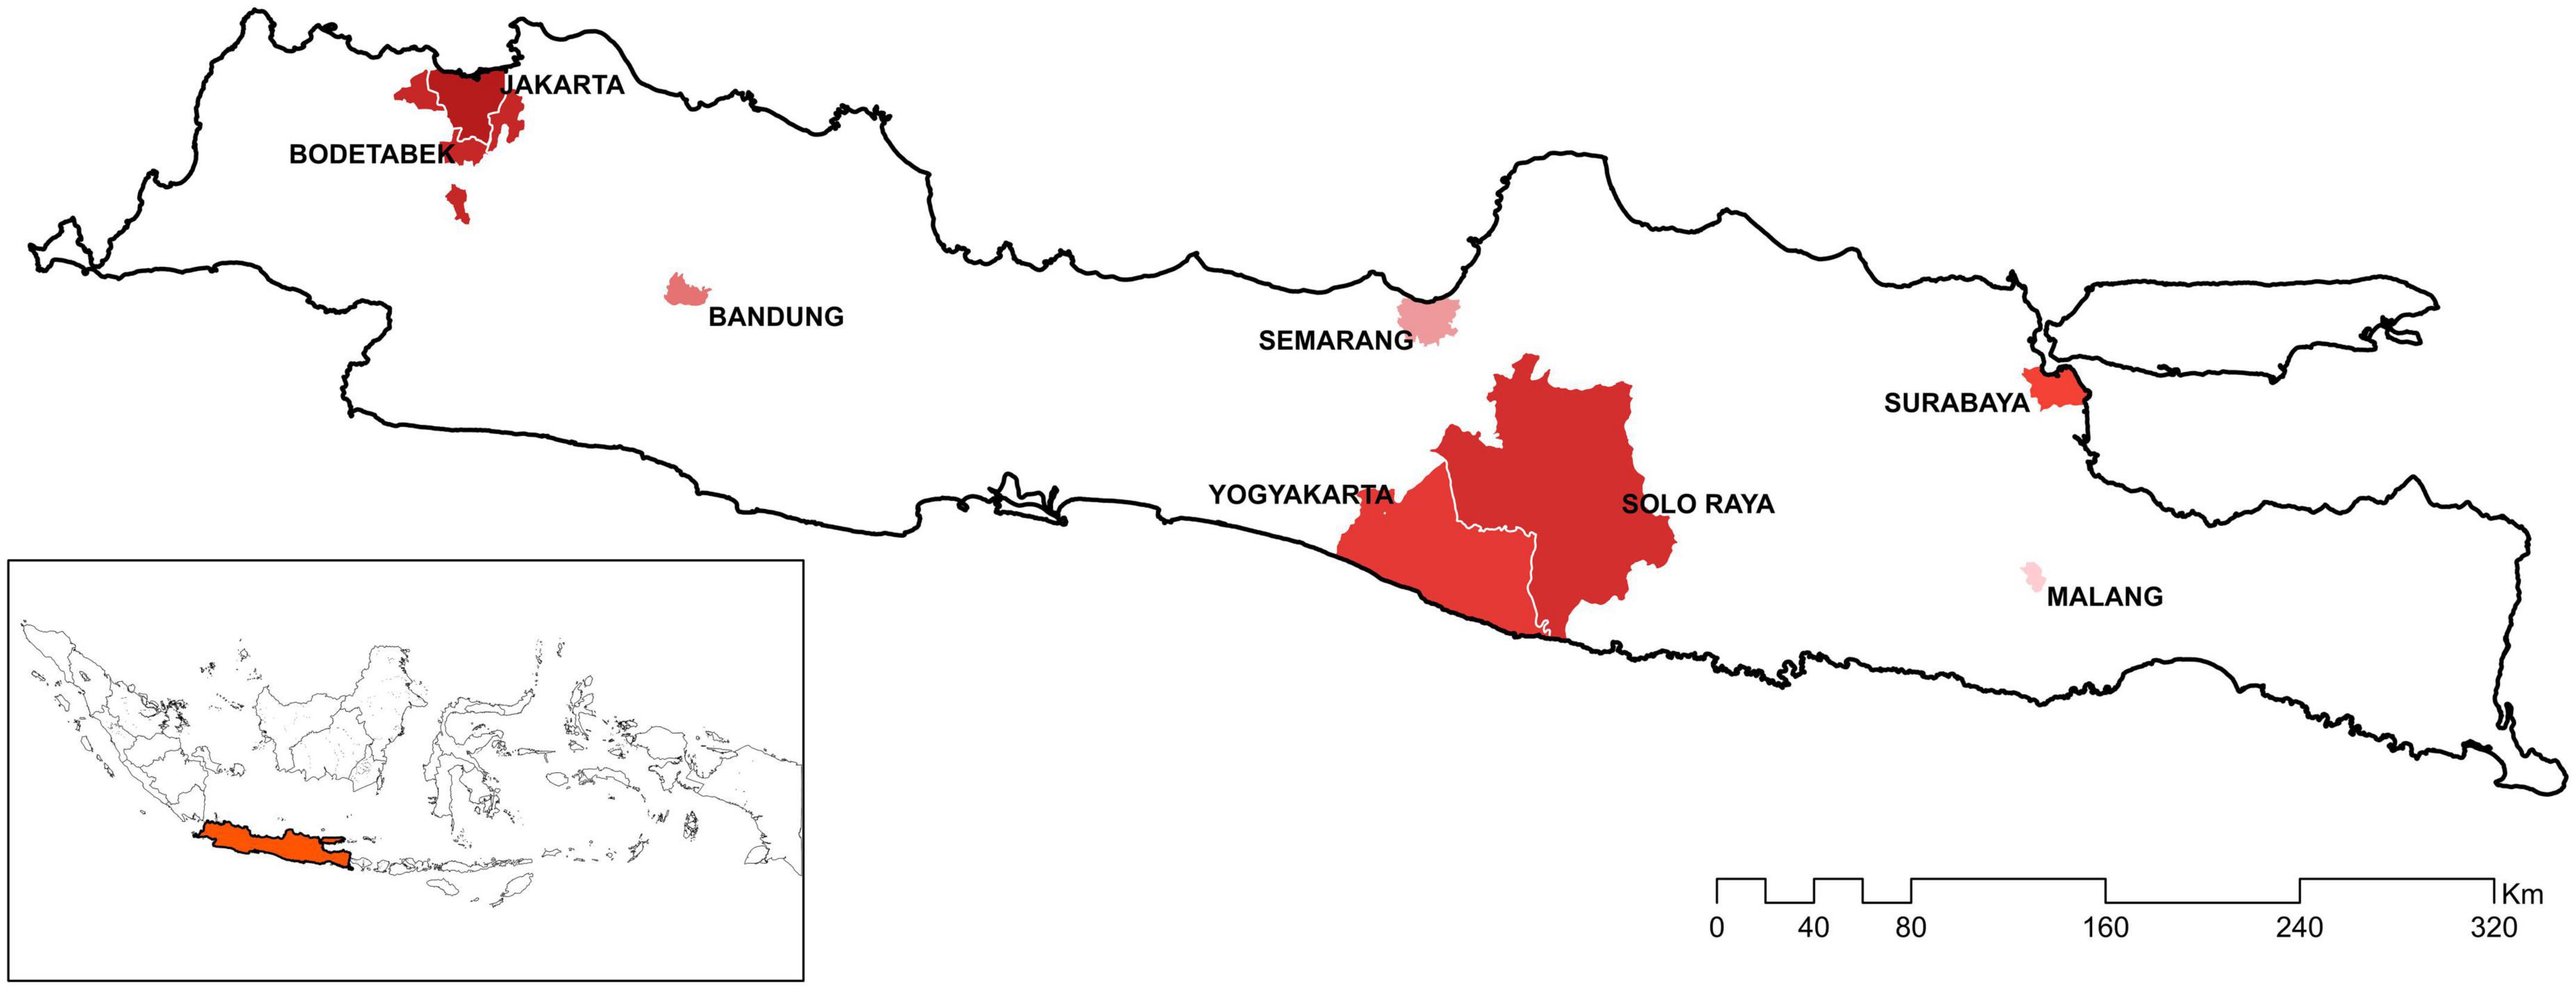
Figure 1. Study area of the SAMPAN model in various prominent cities on Java Island. Jakarta and Bodetabek are the closest sub-population in the SAMPAN model.
Study setting
Indonesia is a large archipelago country with a diverse demographic and cultural diversity. It has five main inhabited islands, with a population of 270 million in 2020. Java Island has the highest population density in Indonesia, with more than 50% of the total population of Indonesia inhabiting this island (Central Statistical Bureau of Indonesia, 2020). The population has a multi-ethnic and cultural background, which plays an essential role in individual interaction. In addition, good infrastructure, mainly roads and airports, plays an essential role in showing a picture of people’s mobility between cities.
The first two cases of COVID-19 were reported in Jakarta on 2 March 2020. Shortly after, the virus spread among the main cities on Java Island. Since the pandemic, Java Island has always had Indonesia’s highest number of cases.
Overview
Purposes
The model aims to simulate the dynamics of COVID-19 transmission due to interaction between infected and contagious individuals and other individuals within and between different social classes and mobility roles within and between populations of eight big cities on Java islands.
Entities, state variables, and scales
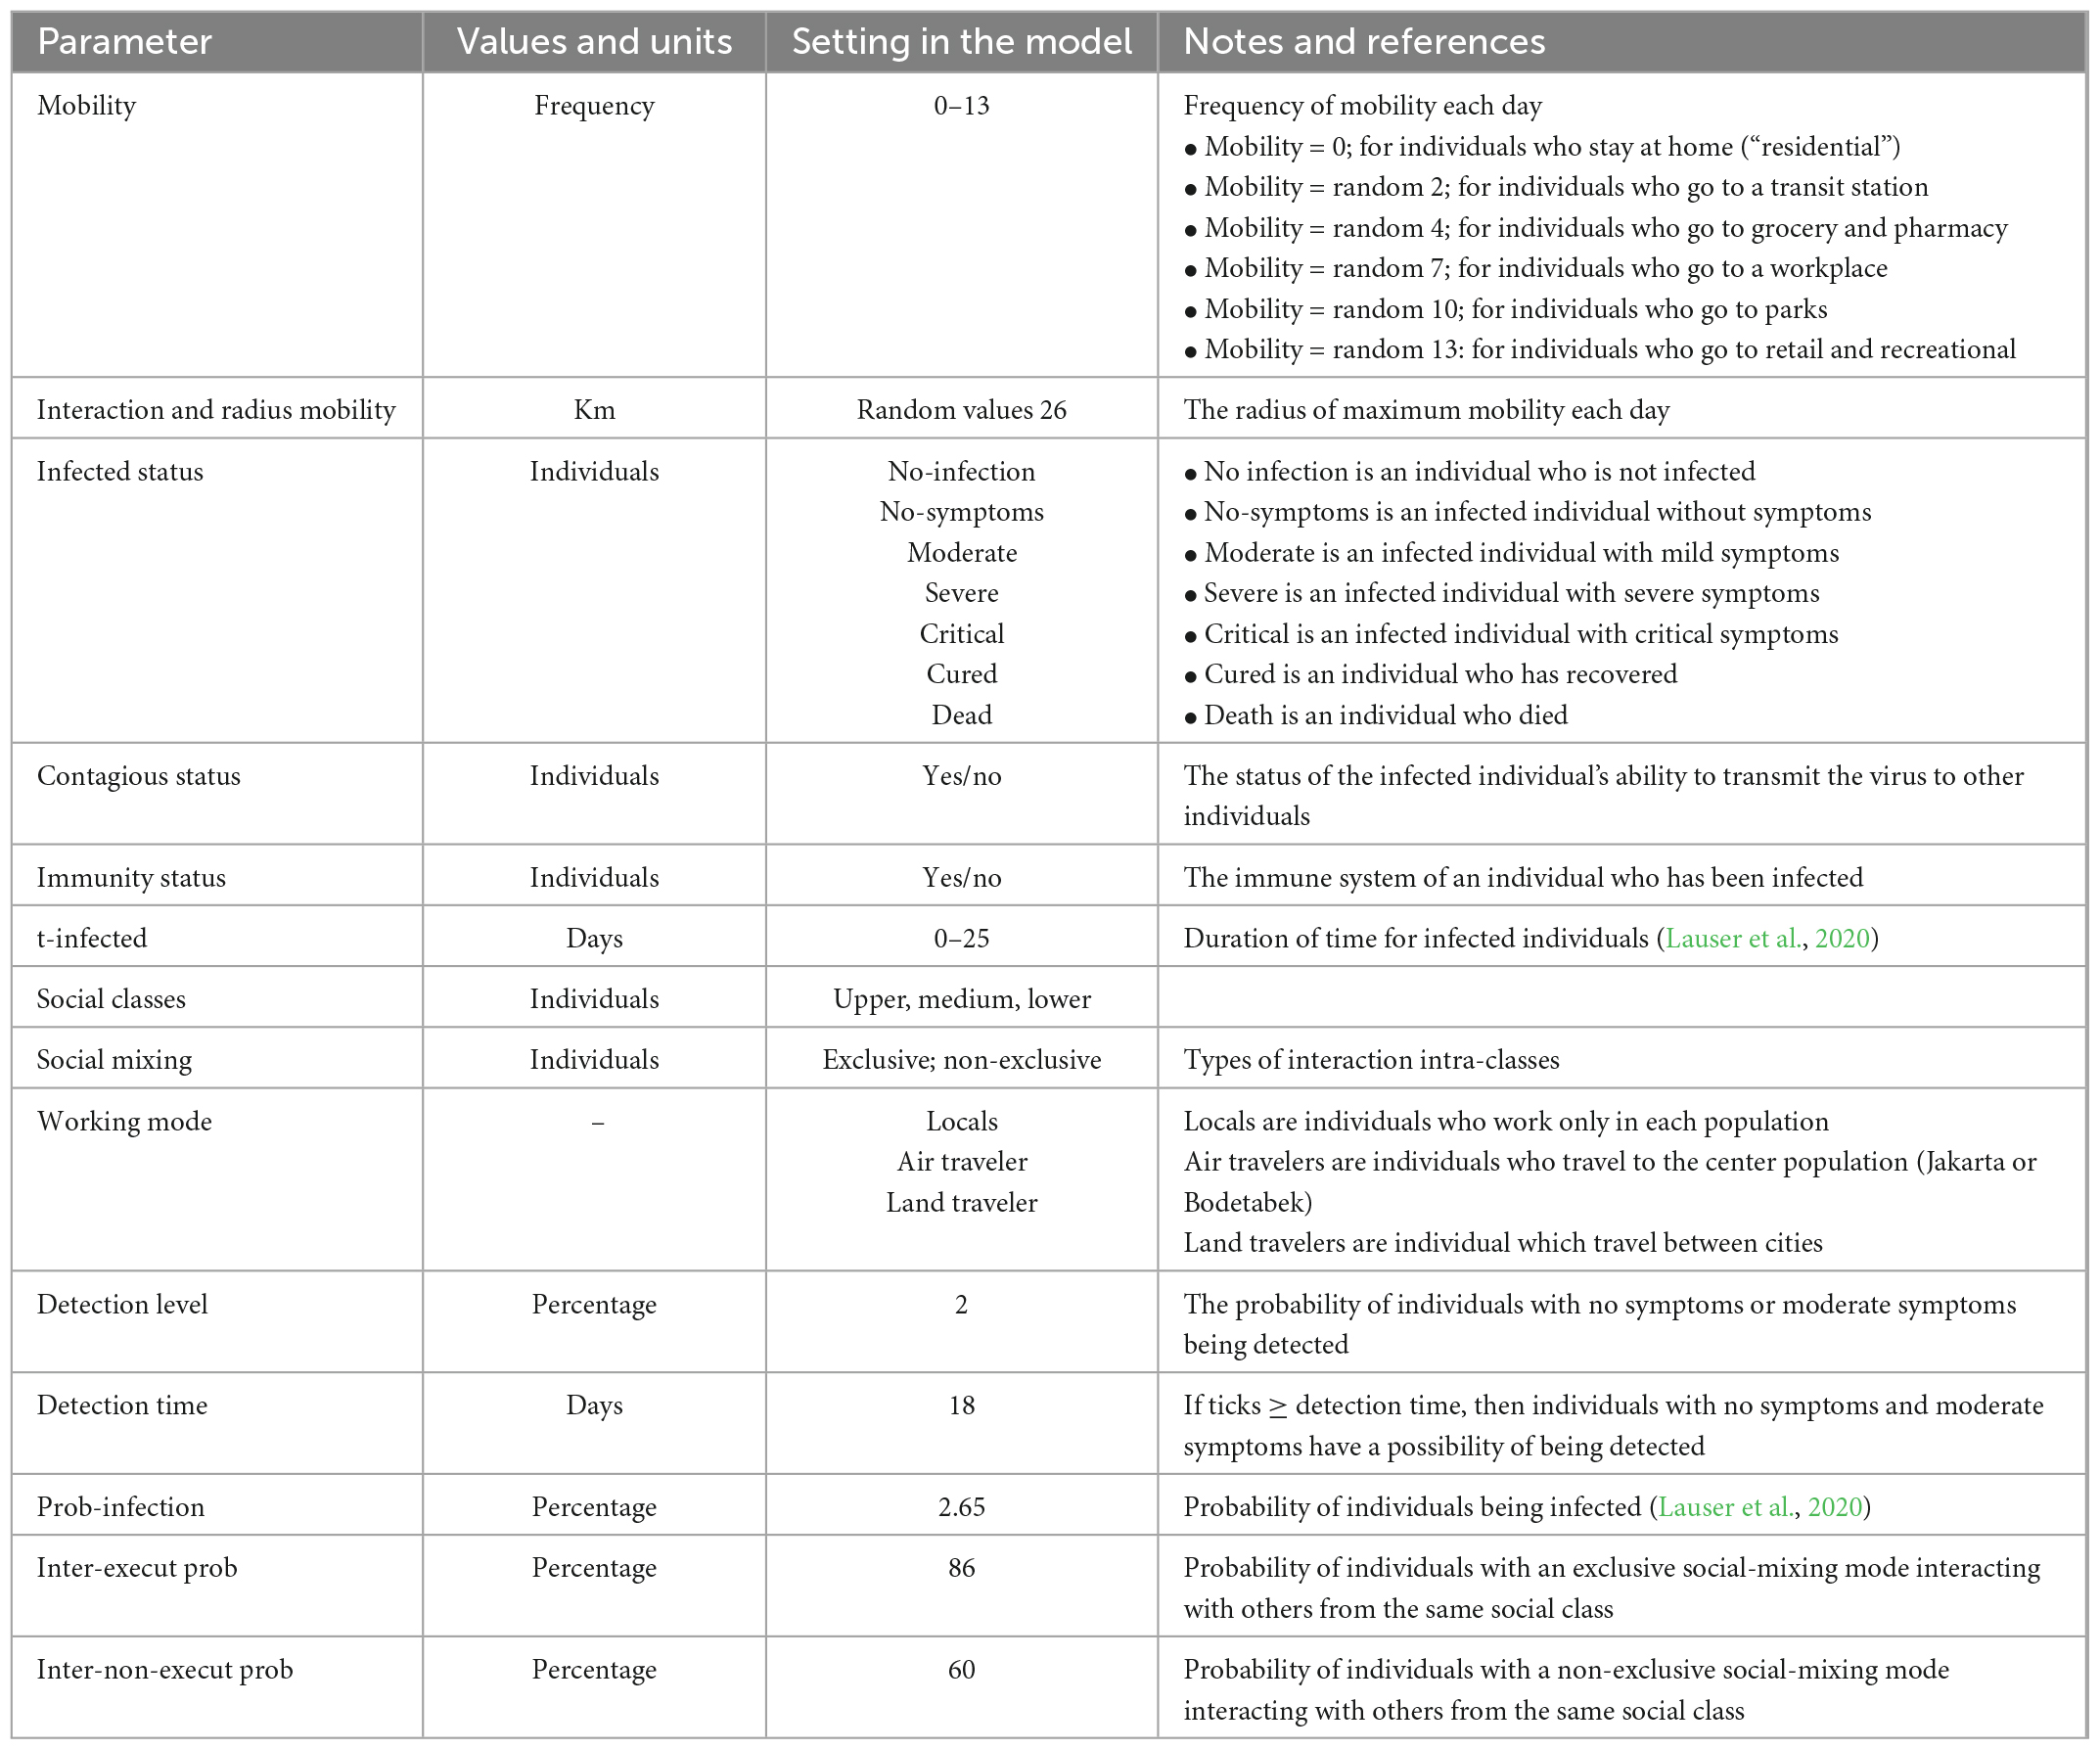
The main agent of the SAMPAN model is humans, which is unique in each state variable. Each individual is assigned to a different city with three main social classes and has its social-mixing modes. Furthermore, individuals can have mobility within and between cities. Thus, the metapopulations are represented by interconnected compartments comprising 500 × 200 patches divided into 10 squares of 100 × 100 patches representing 1 km2 of each city (Figure 2). The time step is 1 day, and the model is simulated for 143 days starting from 1 March 2020, which is important for understanding how the spreading mechanism occurs in Indonesia from the main cities. Table 1 describes the model parameters. Table 2 describes the eight main sub-populations of Java Island included in the simulation.
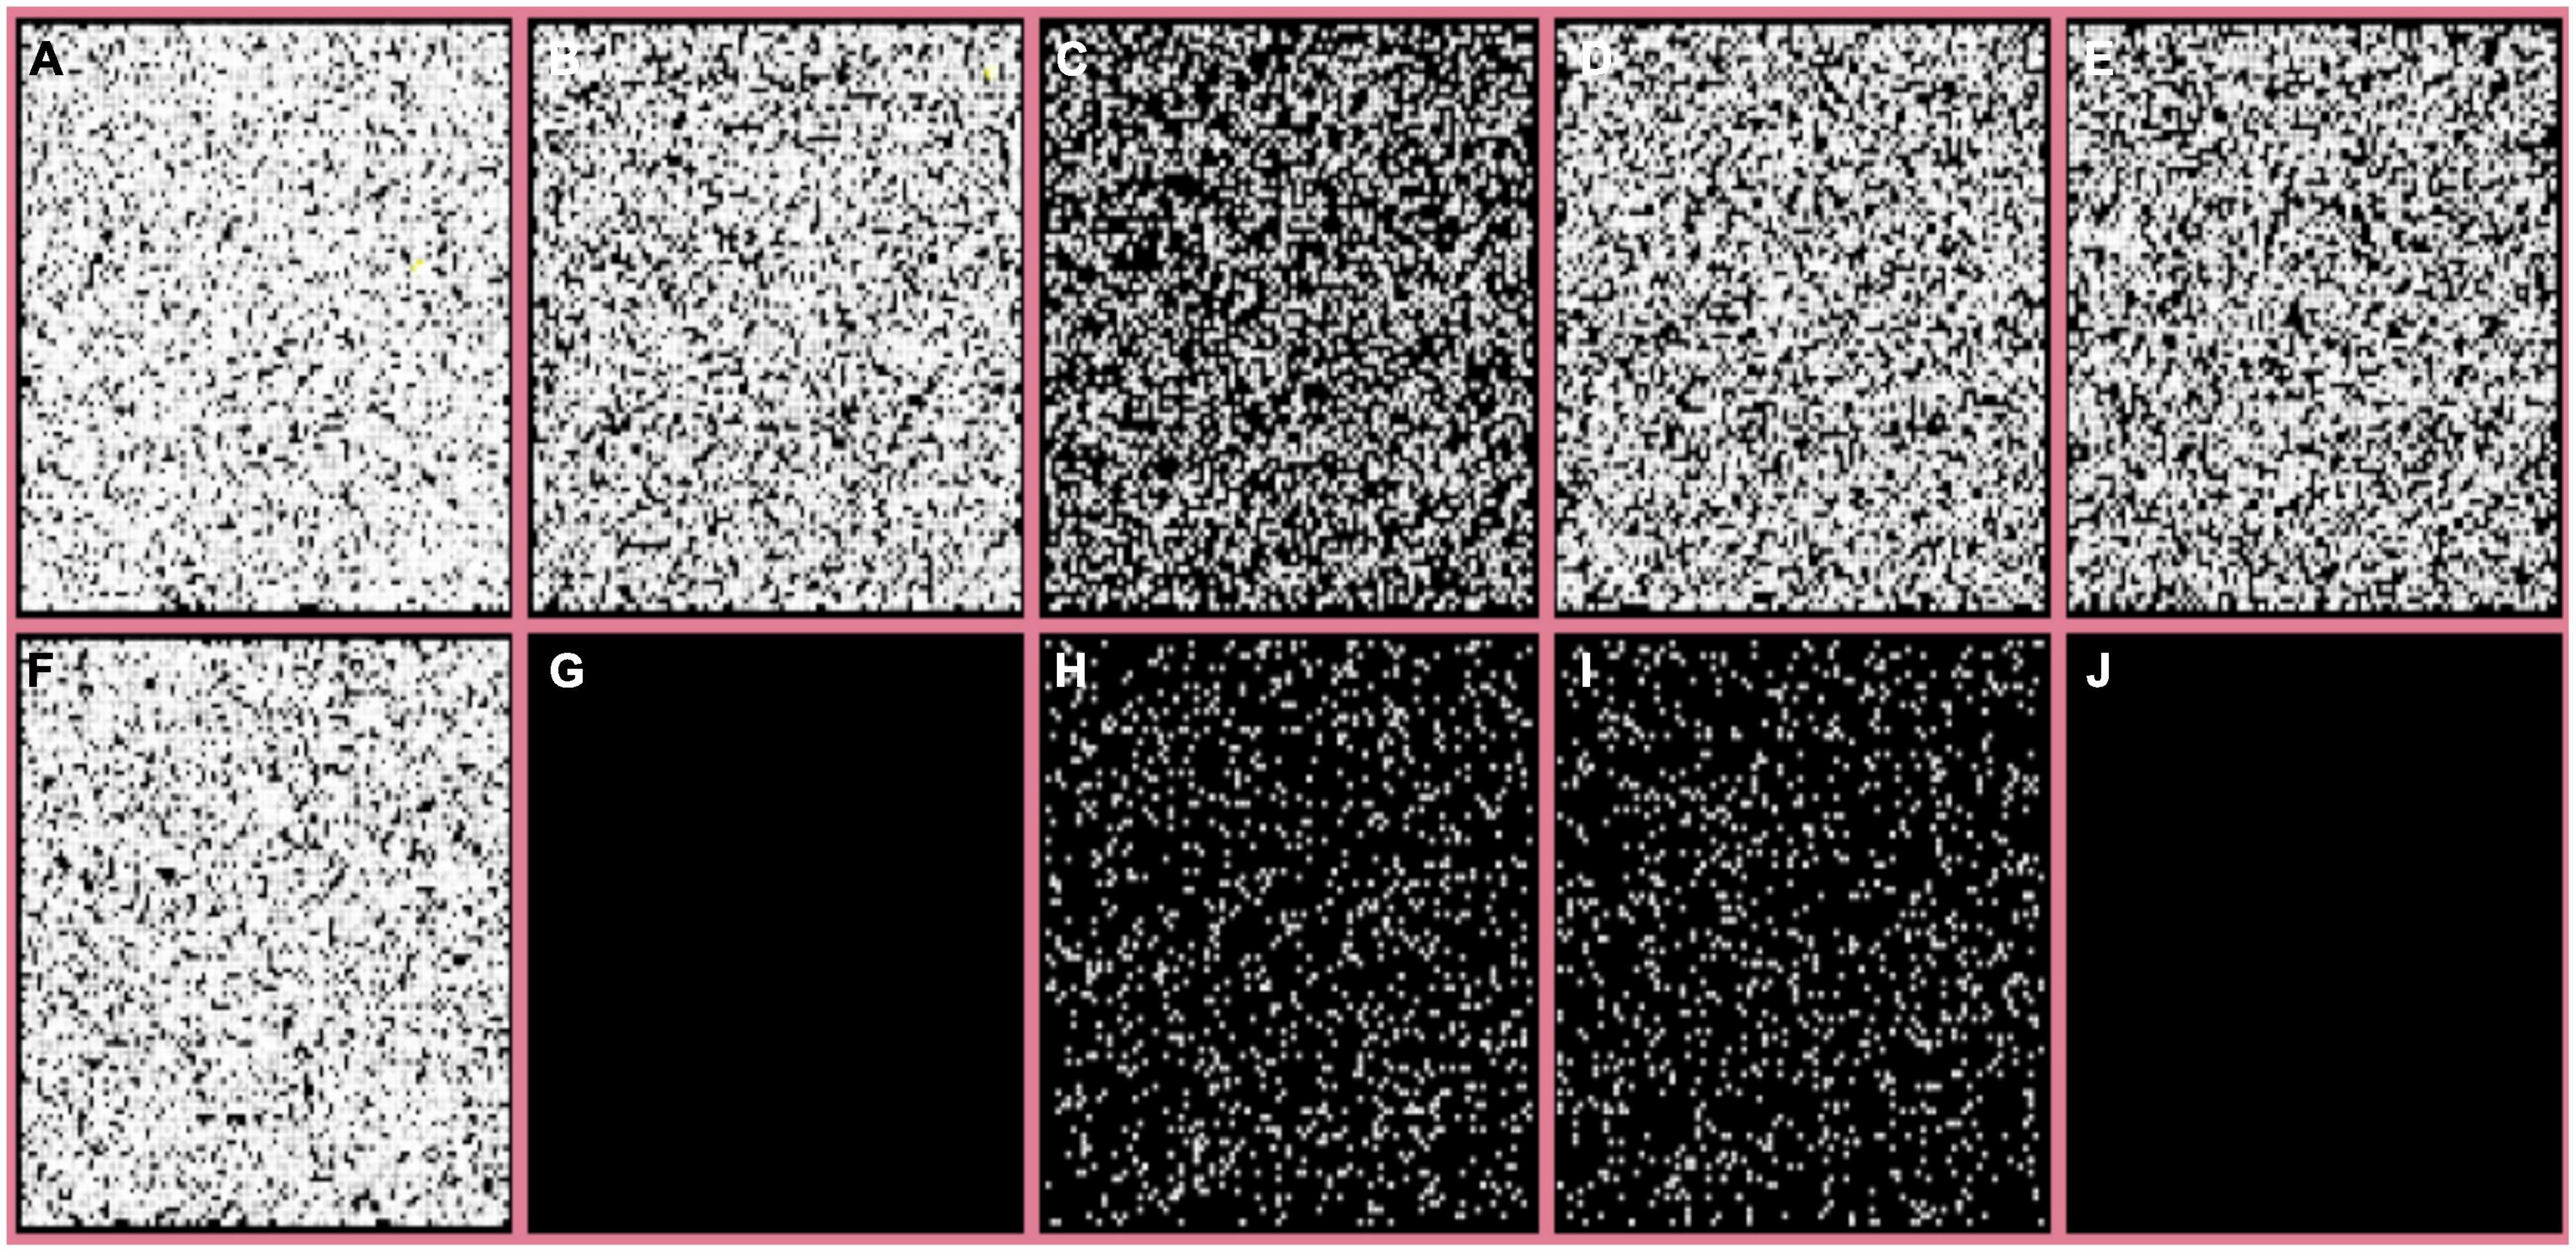
Figure 2. SAMPAN model interface in NetLogo: (A) Jakarta, (B) Bodetabek, (C) Semarang, (D) Surabaya, (E) Malang, (F) Bandung, (G) empty compartment, (H) Yogyakarta, (I) Surakarta, and (J) isolation room.
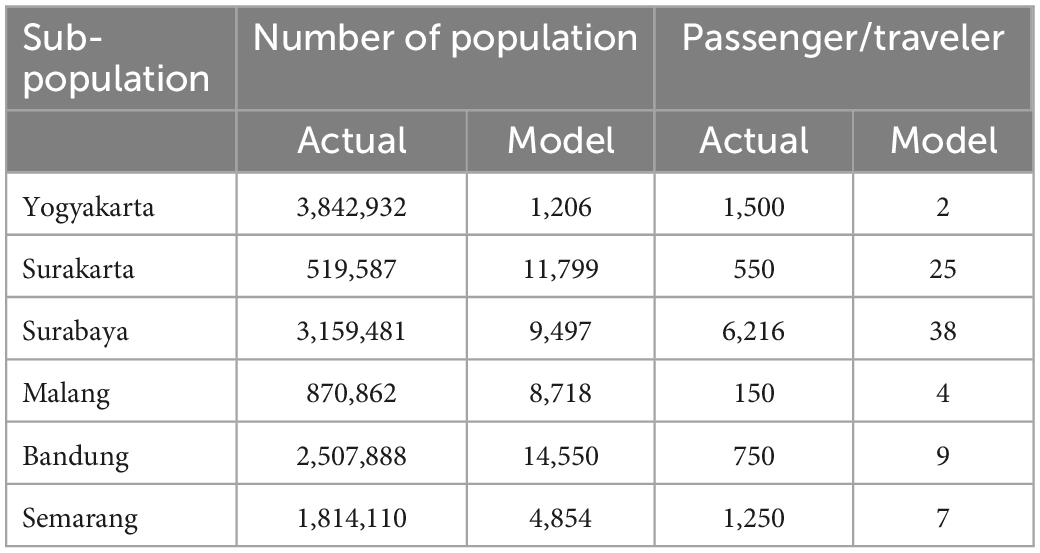
Table 2. Sub-populations and their number of air travelers to the main city of Jakarta (www.bps.go.id accessed 13 July 2020, www.flightradar24.com accessed 13 February 2021).
Process overview and scheduling
Mobility and social interaction
Individual mobilities are categorized into three modes: locals, land travelers, and air travelers. Local mobility results in an interaction of individuals within a sub-population, while traveler mobility (land and air) causes individuals’ interaction between sub-populations. Locals are individuals with local mobility, while land travelers have local and inter-city mobilities. Air travelers are those upper or medium social class who travel from or to Jakarta from other cities. All cities have a direct air connection to Jakarta (the capital city of Indonesia) and between cities via land routes. We used flight data records from Flight Radar1 to simulate the numbers of air travelers’ mobility between the city of origin and the capital city, assuming only the medium and upper classes who travel between cities using this mode of transportation. Mobility among sub-populations/cities is also modeled with a land traveler using mobility data from Facebook.
Local mobility is characterized by radius mobility and probability of mobility within and between social classes. Radius mobility for everyone is set into random 26 per time step. Every time step, the model assigns different random values for individuals and is used to detect any target individuals for each mobility. Mobility is the frequency of each mobility per time step. It is generated through a random number which equals the number of individuals being met per individual with close contact and a minimum of 15 min of each meeting.
Incubation periods and case detection
We follow Lauser et al. (2020) to represent incubation periods of each stage (no symptoms, mild/moderate, severe, and critical). Infected individuals with no symptoms have a contagious period of 14 days after infection. Meanwhile, moderate symptoms have a contagious period from 0 to 21 days. The severe and critical individuals have 25 days of contagious periods, including death. Individuals with no symptoms and mild symptoms continue to have mobility and interaction with others, which may transmit to others through the probability of infection. Therefore, only individuals in severe and critical conditions are directly assigned as isolated and do not have any chance to meet other individuals. If individuals with no or moderate symptoms have a high probability of detection level, when the time is equal to detection time, they will have a high probability as detected and then isolated. Thus, there is no mobility chance to meet other individuals.
Infection process
The virus transmission process occurs when an infected individual meets another individual who is not infected. These healthy individuals have a possibility of being infected. In the model, when an individual with contagious status meets or interacts with uninfected individuals, the uninfected individuals will be infected and update their contagious status from “none” to “contagious.” However, the individuals will not show symptoms from the first to the fifth day after infection. Thus, their infected status is “no symptom.” On the 50th day after infection, we assume that the individuals have a chance of 30% being immune, 55% having moderate symptoms, 10% having severe symptoms, and 5% having acute symptoms following Lauser et al. (2020).
Design
Basic principle
We applied the SIQR model for COVID-19 (Hongfan et al., 2021) as the basic structure for the SAMPAN model. We assume that the COVID-19 carrier can infect a susceptible individual. Some infected individuals are detected and then quarantined, and some die due to COVID-19. Both infected and quarantined individuals will eventually be cured after some time.
Their mobility and social interaction determine the probability of individuals getting infected. In addition, due to their mobility and social interaction, susceptible individuals encounter infected individuals who are not quarantined. In that case, some individuals may be infected and become a source of infection for other individuals.
Emergence
The total number and daily cases of infected persons emerge from interaction among individuals with different social connectedness and spatially separated.
Adaptation
Adaptation in this model occurred during the movement restriction implemented in Indonesia. Individuals will reduce their mobility (through social interaction) and radius movement as soon as a restriction is implemented. However, the movement within and among cities will return to normal when the restriction is removed.
Objectives
Each individual aims to move and meet others according to their social classes and mixing.
Interaction
Interaction between individuals is assigned through social classes and their probability of social interaction. Individuals are most likely to meet other individuals within their social classes and have less probability of meeting individuals from different social classes. Figure 3 shows the probability of mobility among individuals using between and within social–classes social interactions.
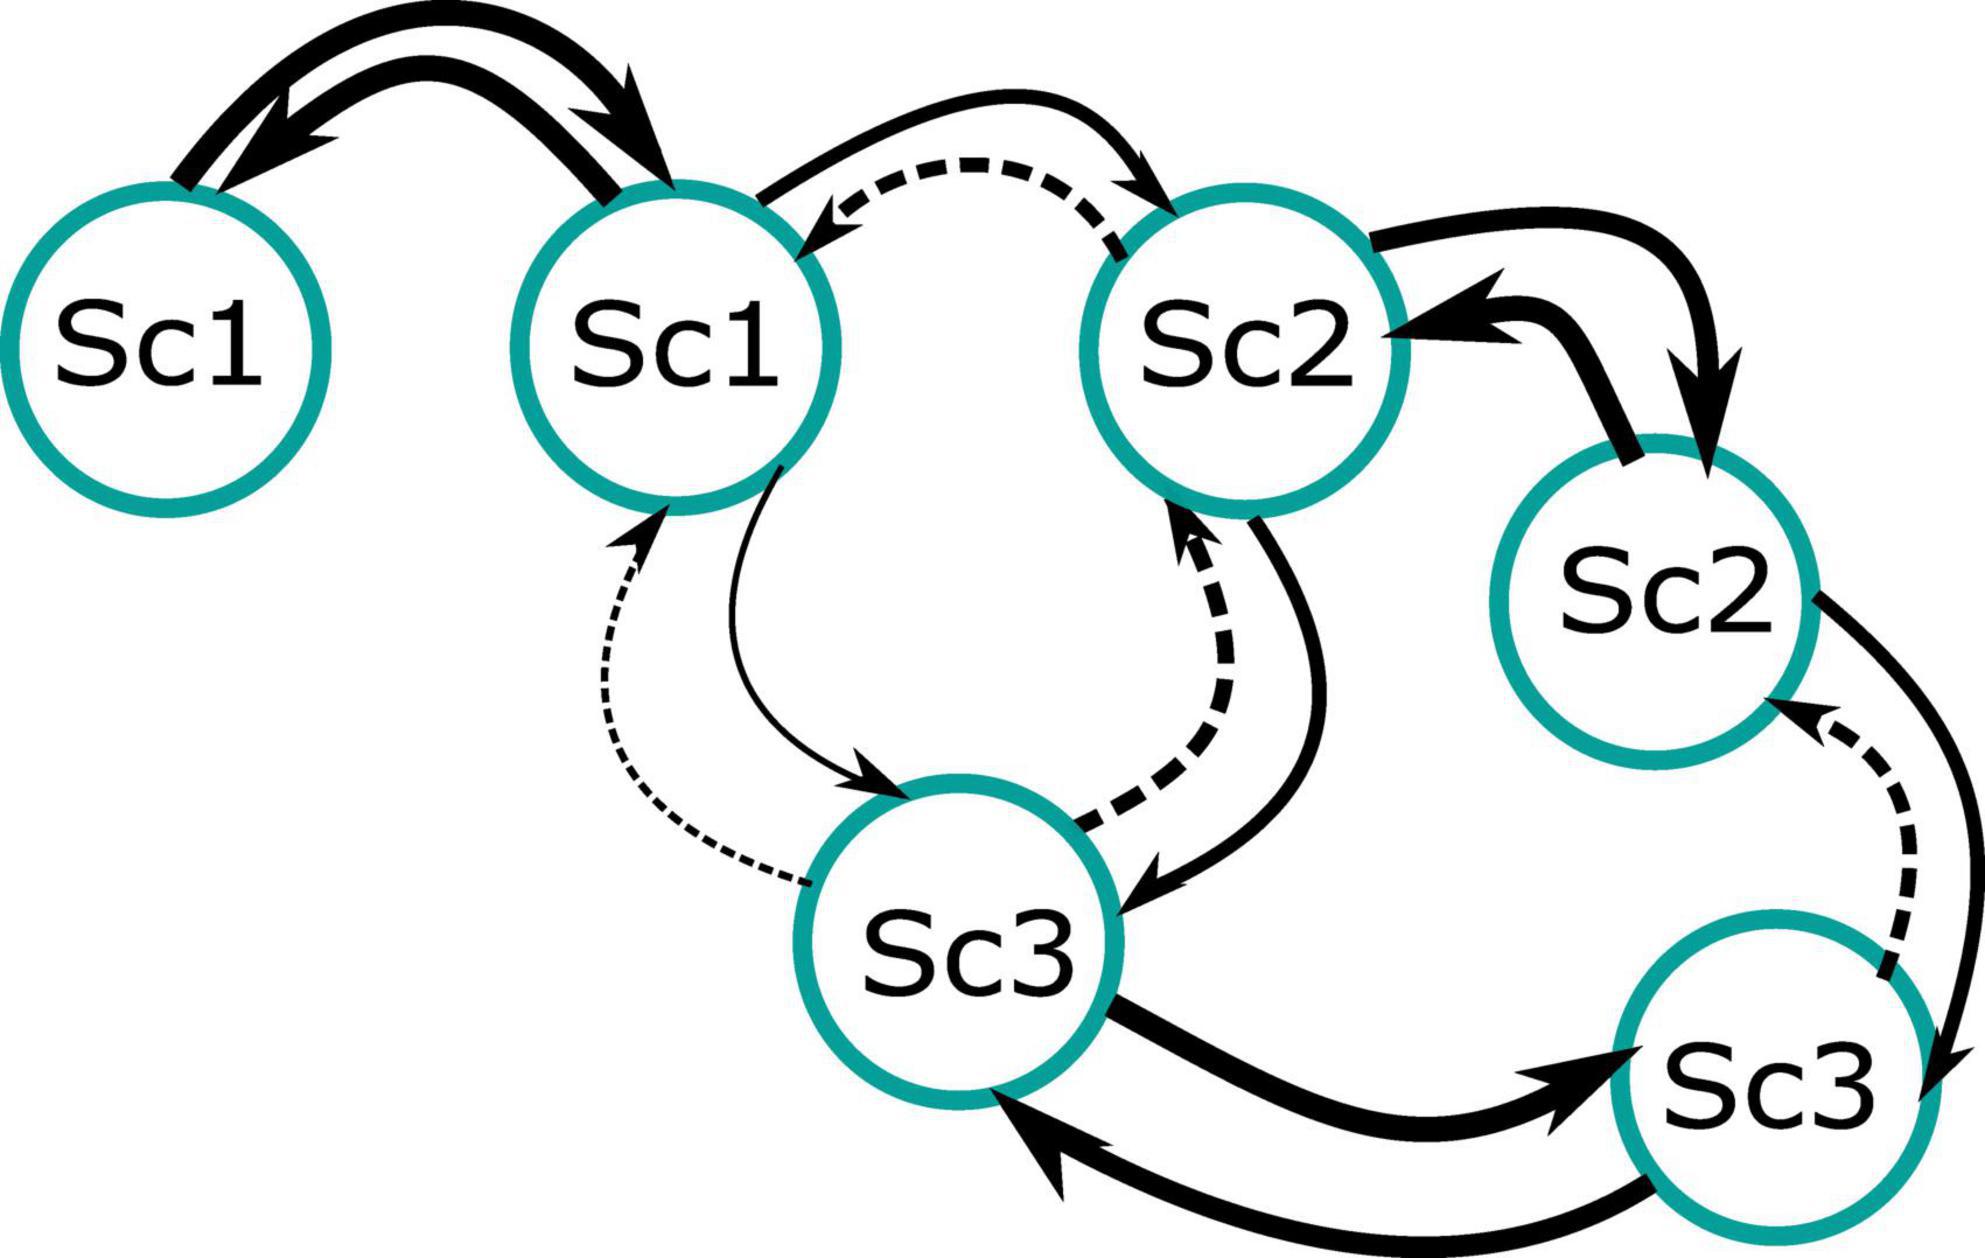
Figure 3. Interaction concepts of individuals for each social class and social-mixing types are implemented in the model. Sc1, upper-classes; Sc2, medium classes; and Sc3, lower classes. Each class has stronger interactions within their classes, while intra-classes have less strong interactions. The arrow’s thickness shows the relative strength of the interaction, with dashed arrows representing weaker interaction.
Interaction among individuals happens when individuals move toward selected individuals as defined in the mobility behavior. If an individual interacts with an infected but undetected individual, the uninfected individual can be infected as much as prob-infection. This infection-spreading process will be explained further in the sub-model section.
Stochasticity
The stochasticity in the model appears in some processes. For example, stochasticity is used in this model when individuals are placed at a random location when the model is initialized. Stochasticity is also used in the mobility and radius mobility parameters to determine the frequency of movement (mobility) and distance traveled (radius mobility) for a new location of mobility for individuals.
Collectives
Social classes are collectives: individuals tend to move closer to others with the same social classes, as shown in Figure 3.
Observation
We observed the dynamics of the number of individuals detected, infected with no, moderate, severe, and critical symptoms, death, and the number of daily new cases.
Details
Initialization
The model is initialized with eight regions (Jakarta; Bodetabek/cities around Jakarta, that is, Bogor, Depok, and Bekasi; Bandung; Semarang; Yogyakarta; Surakarta; Surabaya; and Malang) with each region having a certain amount of population and spatially separated (Figure 2). The population in each region is divided into three social classes and two social mixing with each certain proportion, as shown in Tables 3, 4. Meanwhile, each social class is divided into two social mixings: exclusive and non-exclusive. For example, individuals with upper social class consist of 95% agents with non-exclusive and exclusive social-mixing modes for the rest. Meanwhile, individuals with middle and lower class consist of 90% population with non-exclusive social mixing, and the rest is complete social mixing.
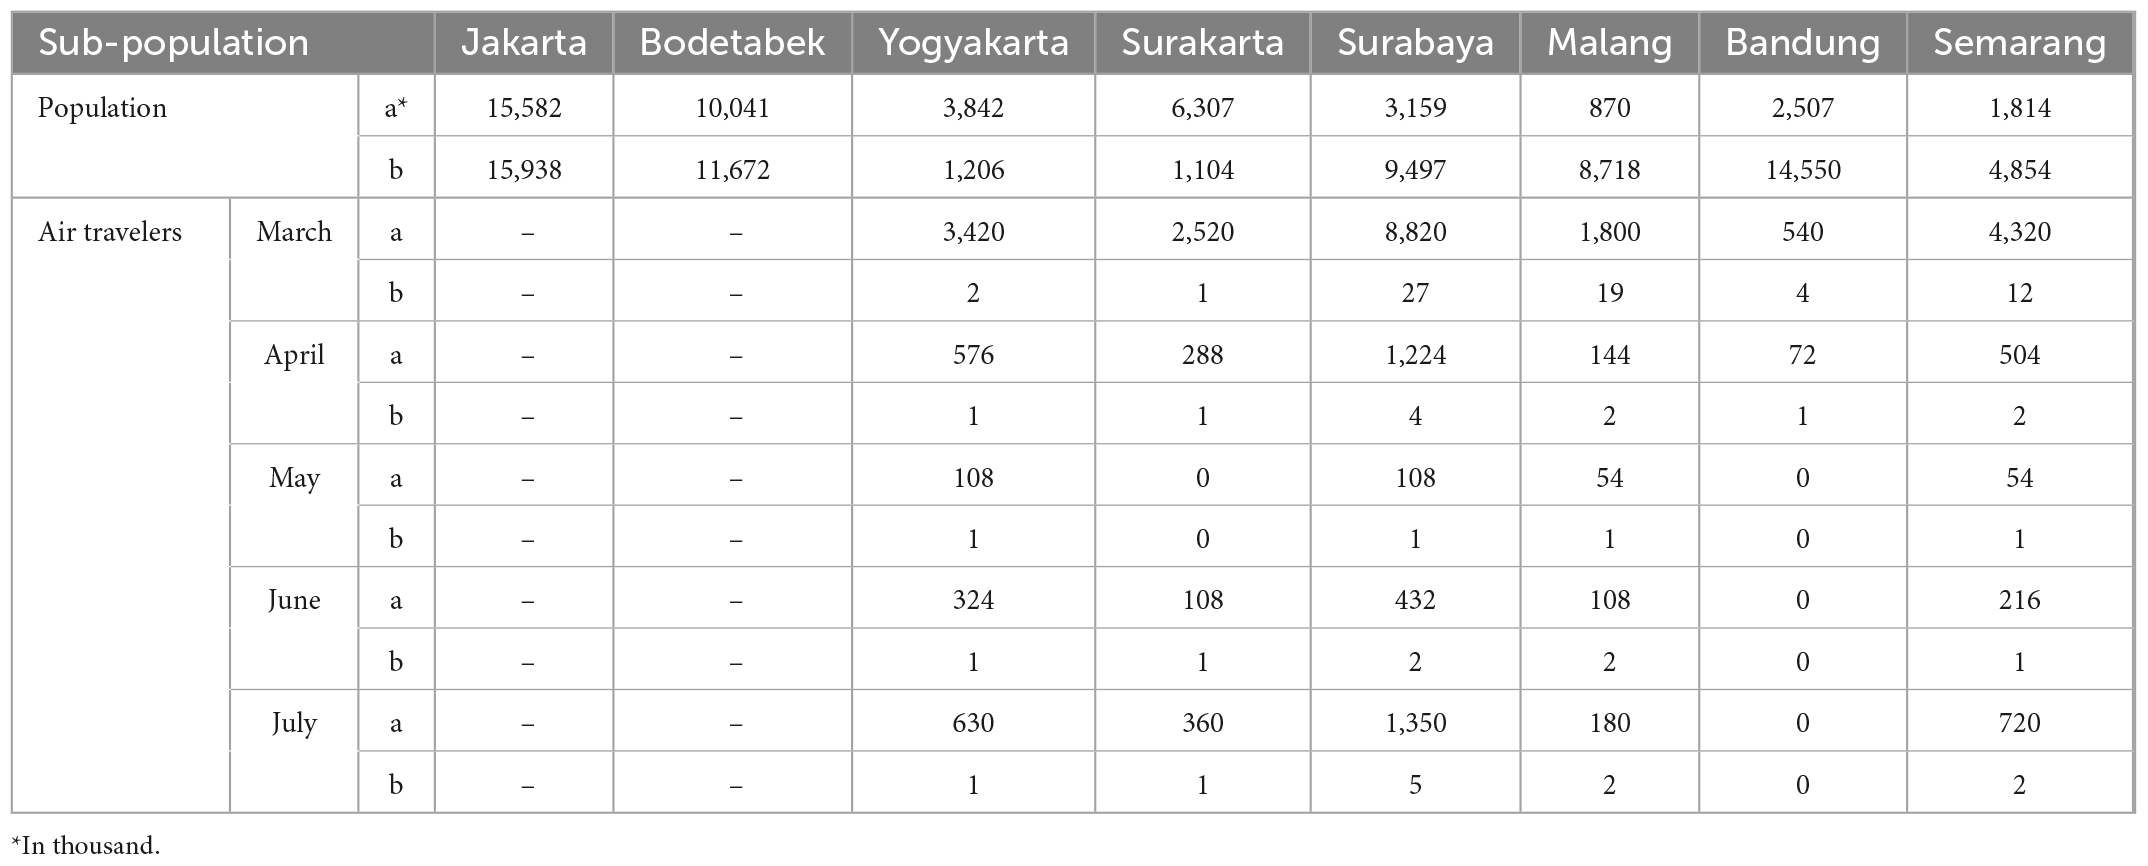
Table 3. Actual (a) and model’s (b) population density and their air mobility among sub-populations.
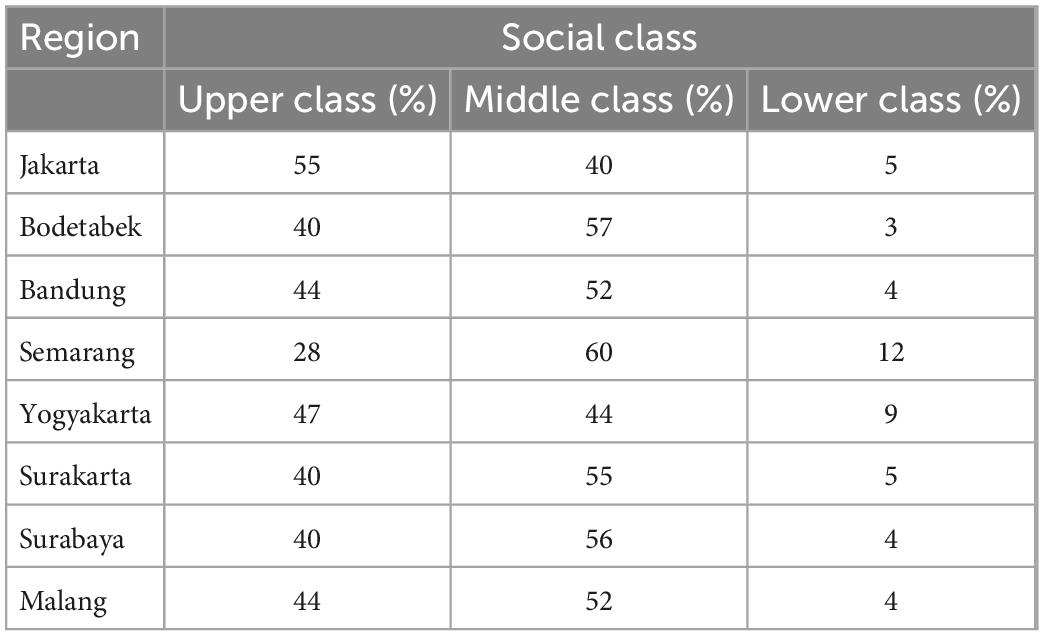
Table 4. Number of social class percentages for each region (www.bps.go.id, accessed 13 July 2020).
Every region starts with individuals who have not been infected (infected status = no infection), are not contagious (contagious status = none), and are shown in a circle shape and white color. Next, every individual is placed in a random region that would be set to be their home (my base). The transmission process starts when an individual from the upper social class in Jakarta and the Bodetabek area is infected. Then, in the fifth time step, an individual in Yogyakarta with upper social class status and exclusive social-mixing mode is also infected. Finally, eight individuals in Surabaya are infected at the 13th time step. The identification of infected individuals is based on the actual case data from Indonesia.
Input data
The model used mobility index data from Google Mobility2 as the external input to define the mobility of each individual based on their activity (retail and recreation, grocery and pharmacy, parks, transit station, workplaces, and residential). The model also used Facebook Data for Good to estimate the percentage of individuals with land-travel mode3.
Sensitivity analysis and validation of the model
We conducted a local sensitivity analysis with the one-at-a-time (OAT) technique (Saltelli et al., 2006) to examine the effects of parameters on the model’s output. We used the Morris’s screening method, which calculates the relative influence of each factor on the output of the model relatively and has been used for various (Campolongo et al., 2007; Imron et al., 2012). The experimental of the Morris method was individually randomized one factor at time experiments. The method started with running a set of parameter combinations. Then, a parameter was changed gradually; other parameters were set at their median known values and compared the output with the previous output. The output of the method is expressed into μ* (effect of parameter’s influence) and σ (strength of parameter interaction). Theμ* is an estimate, representing the mean of the distribution of the absolute values of the elementary effects (Campolongo et al., 2007). While σ estimates the effect of non-linearity and/or the effect due to the interaction of the parameters with other factors. We run the sensitivity analysis using Morris screening method available in the package “nlrx” (Salecker et al., 2019) in R software.
For each simulation, we analyzed the total number of contagious, critical, detected, infected, moderate, and severe using the SAMPAN model. Next, we simulated the SAMPAN model with 30 replicates for each combination of parameters. We used the Jakarta population to conduct the validation process as it has the complete data we can access during the pandemic. Finally, we compared the simulated and observed data and projected it into a graph for early pandemic periods in Indonesia. We performed the simulation using a high-performance computer in Universitas Gadjah Mada, Indonesia, because the model involved more than 50,000 simulated individuals with a combined variation of input variables (Tables 1, 5) which required high speed and memory for simulations.
Results
Model sensitivity
Our sensitivity analysis shows that among the parameters used in the model, all output parameters (contagious, critical, detected, infected, moderate, and severe) are sensitive to the change in mobility (Figure 4). The parameter effect (μ*) and interaction (σ) are provided in Table 5. The change in each parameter and its effect on the number of detected individuals is presented in Figure 5.
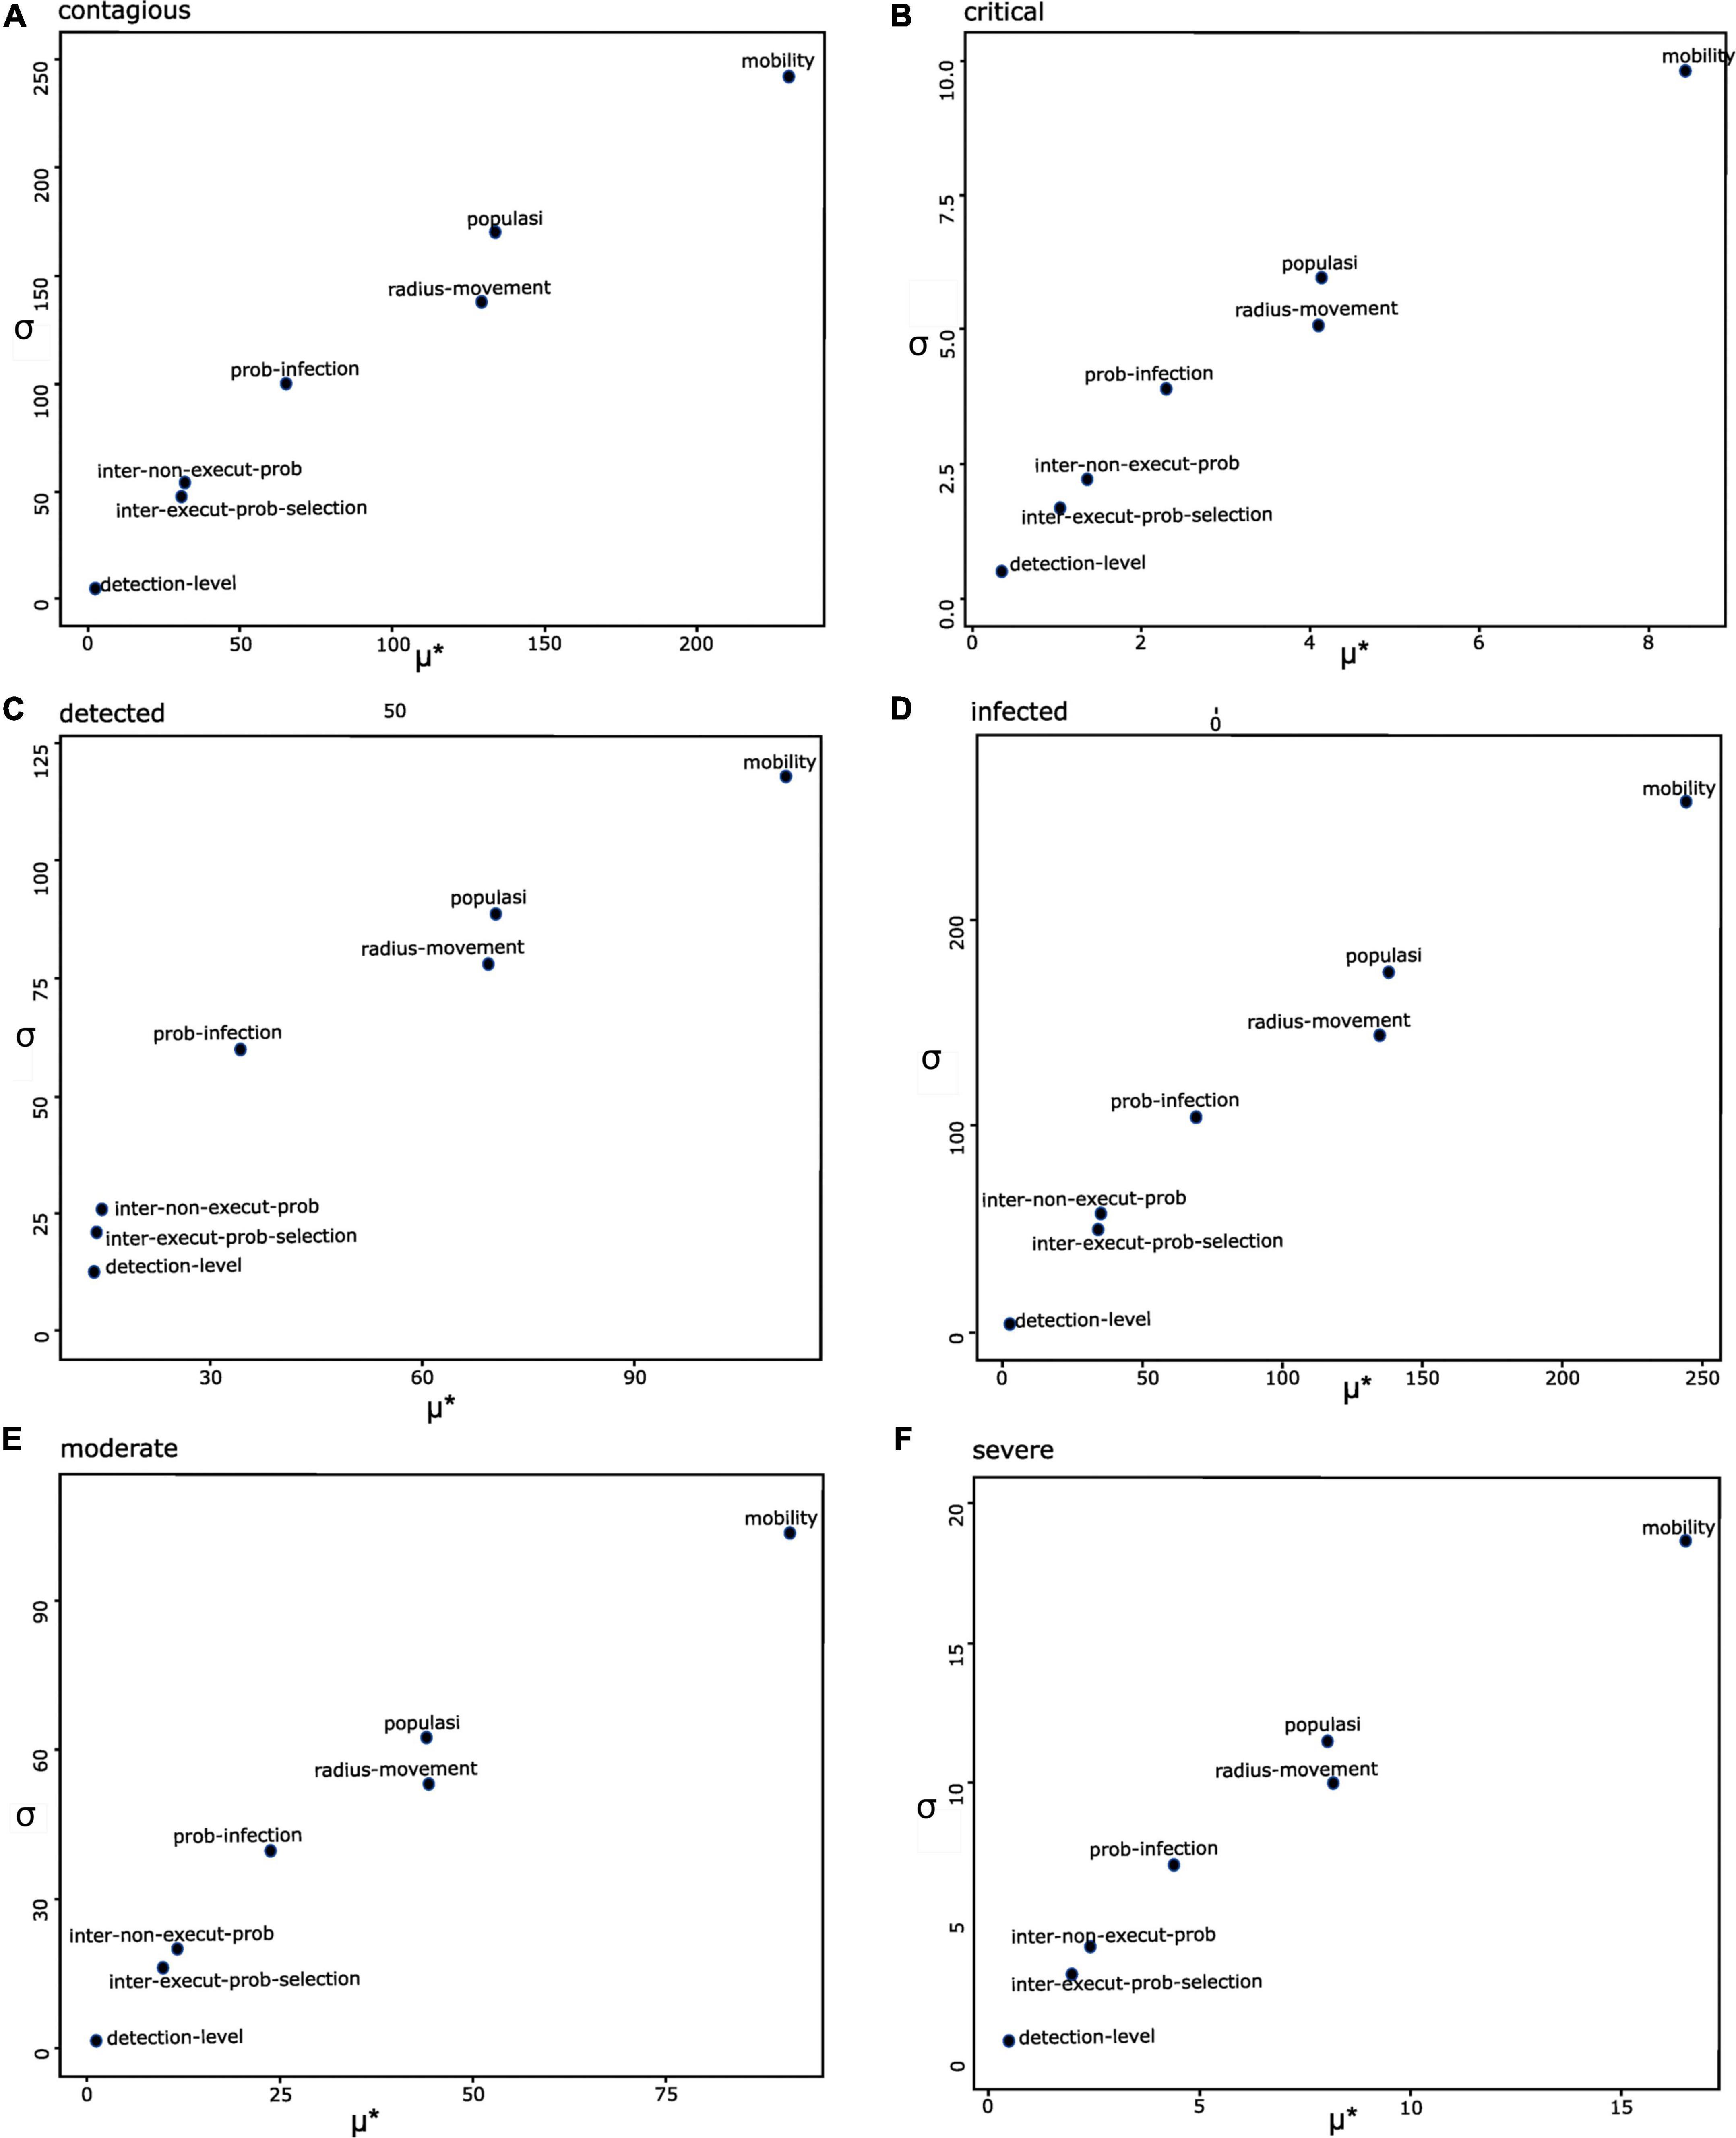
Figure 4. Sensitivity analysis uses the SAMPAN model’s main parameters to investigate their effect on the number of individuals with (A) contagious, (B) critical, (C) detected, (D) infected, (E) moderate, and (F) severe. The μ* represents the effect of a parameter on the model output. The σ shows the interaction of a parameter on the model output.
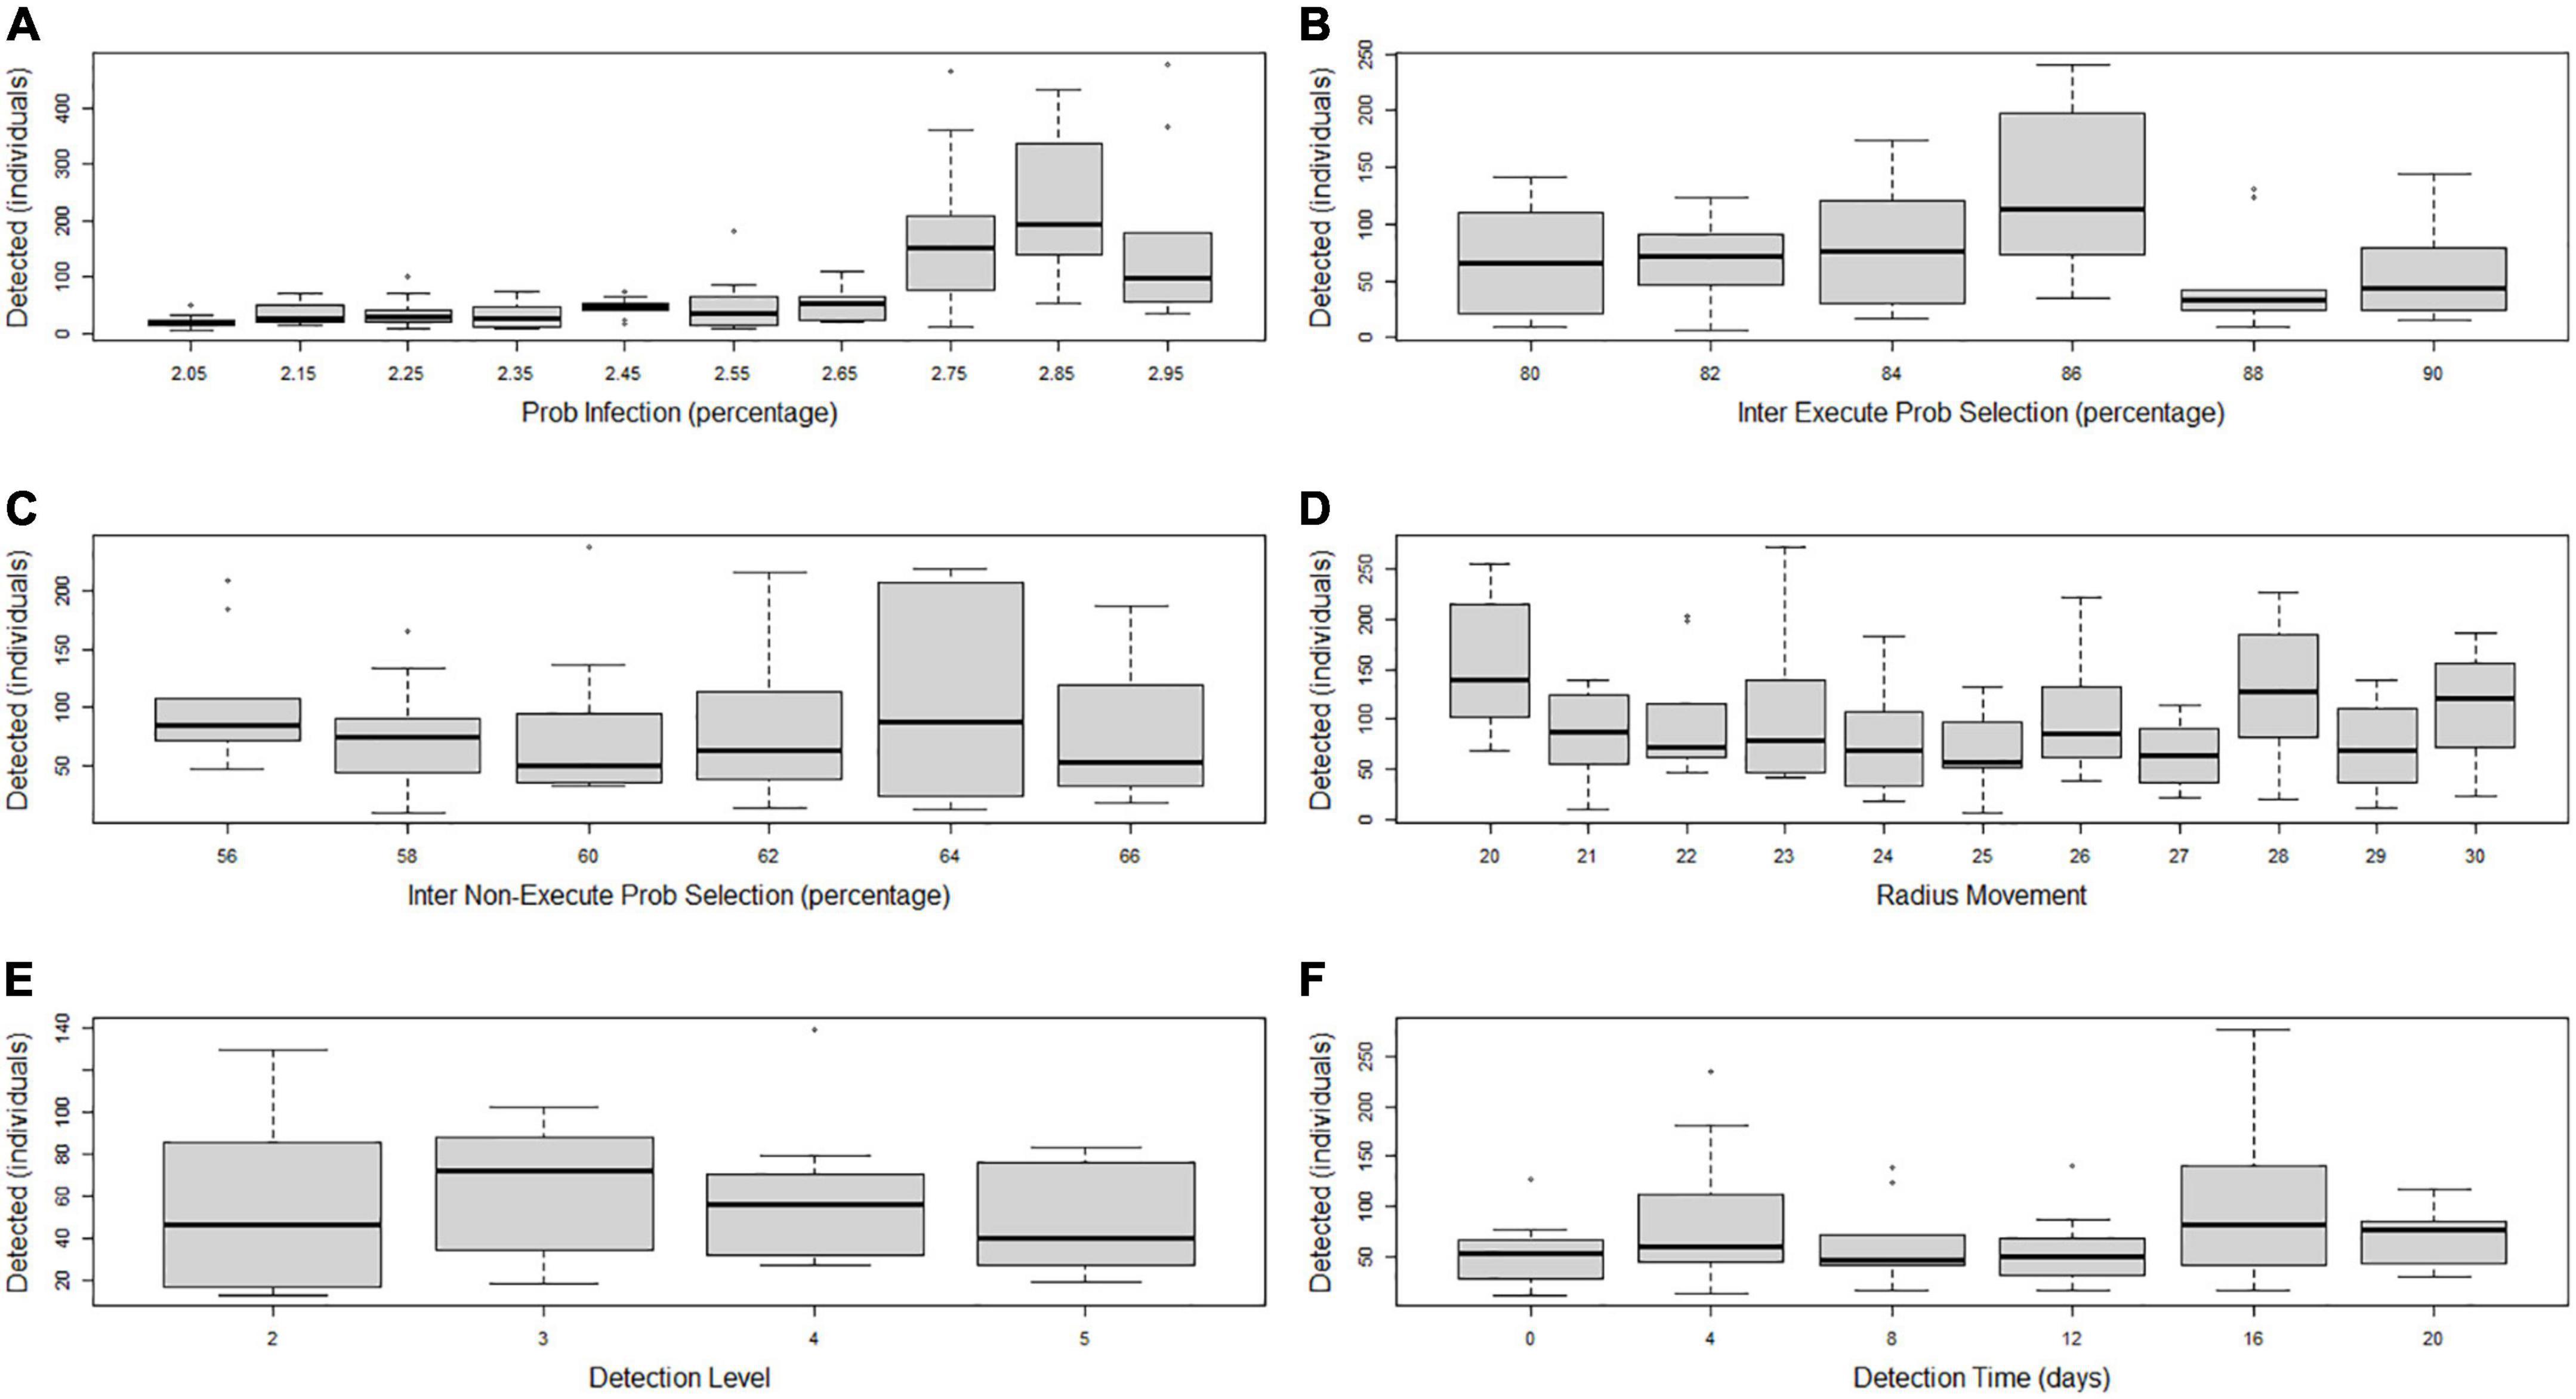
Figure 5. Boxplot of the effect of the parameter change, including (A) probability of infection, (B) inter execute probability, (C) inter non-execute probability, (D) radius movement, (E) detection level, and (F) detection time, in the number of infected individuals for the SAMPAN model.
Validation
The validation of the SAMPAN model by comparing actual data and simulated data is shown in Figure 6. The SAMPAN model can follow the actual data pattern during the first 60 days, while the pattern diverges after 60 days of simulation (Figure 6).
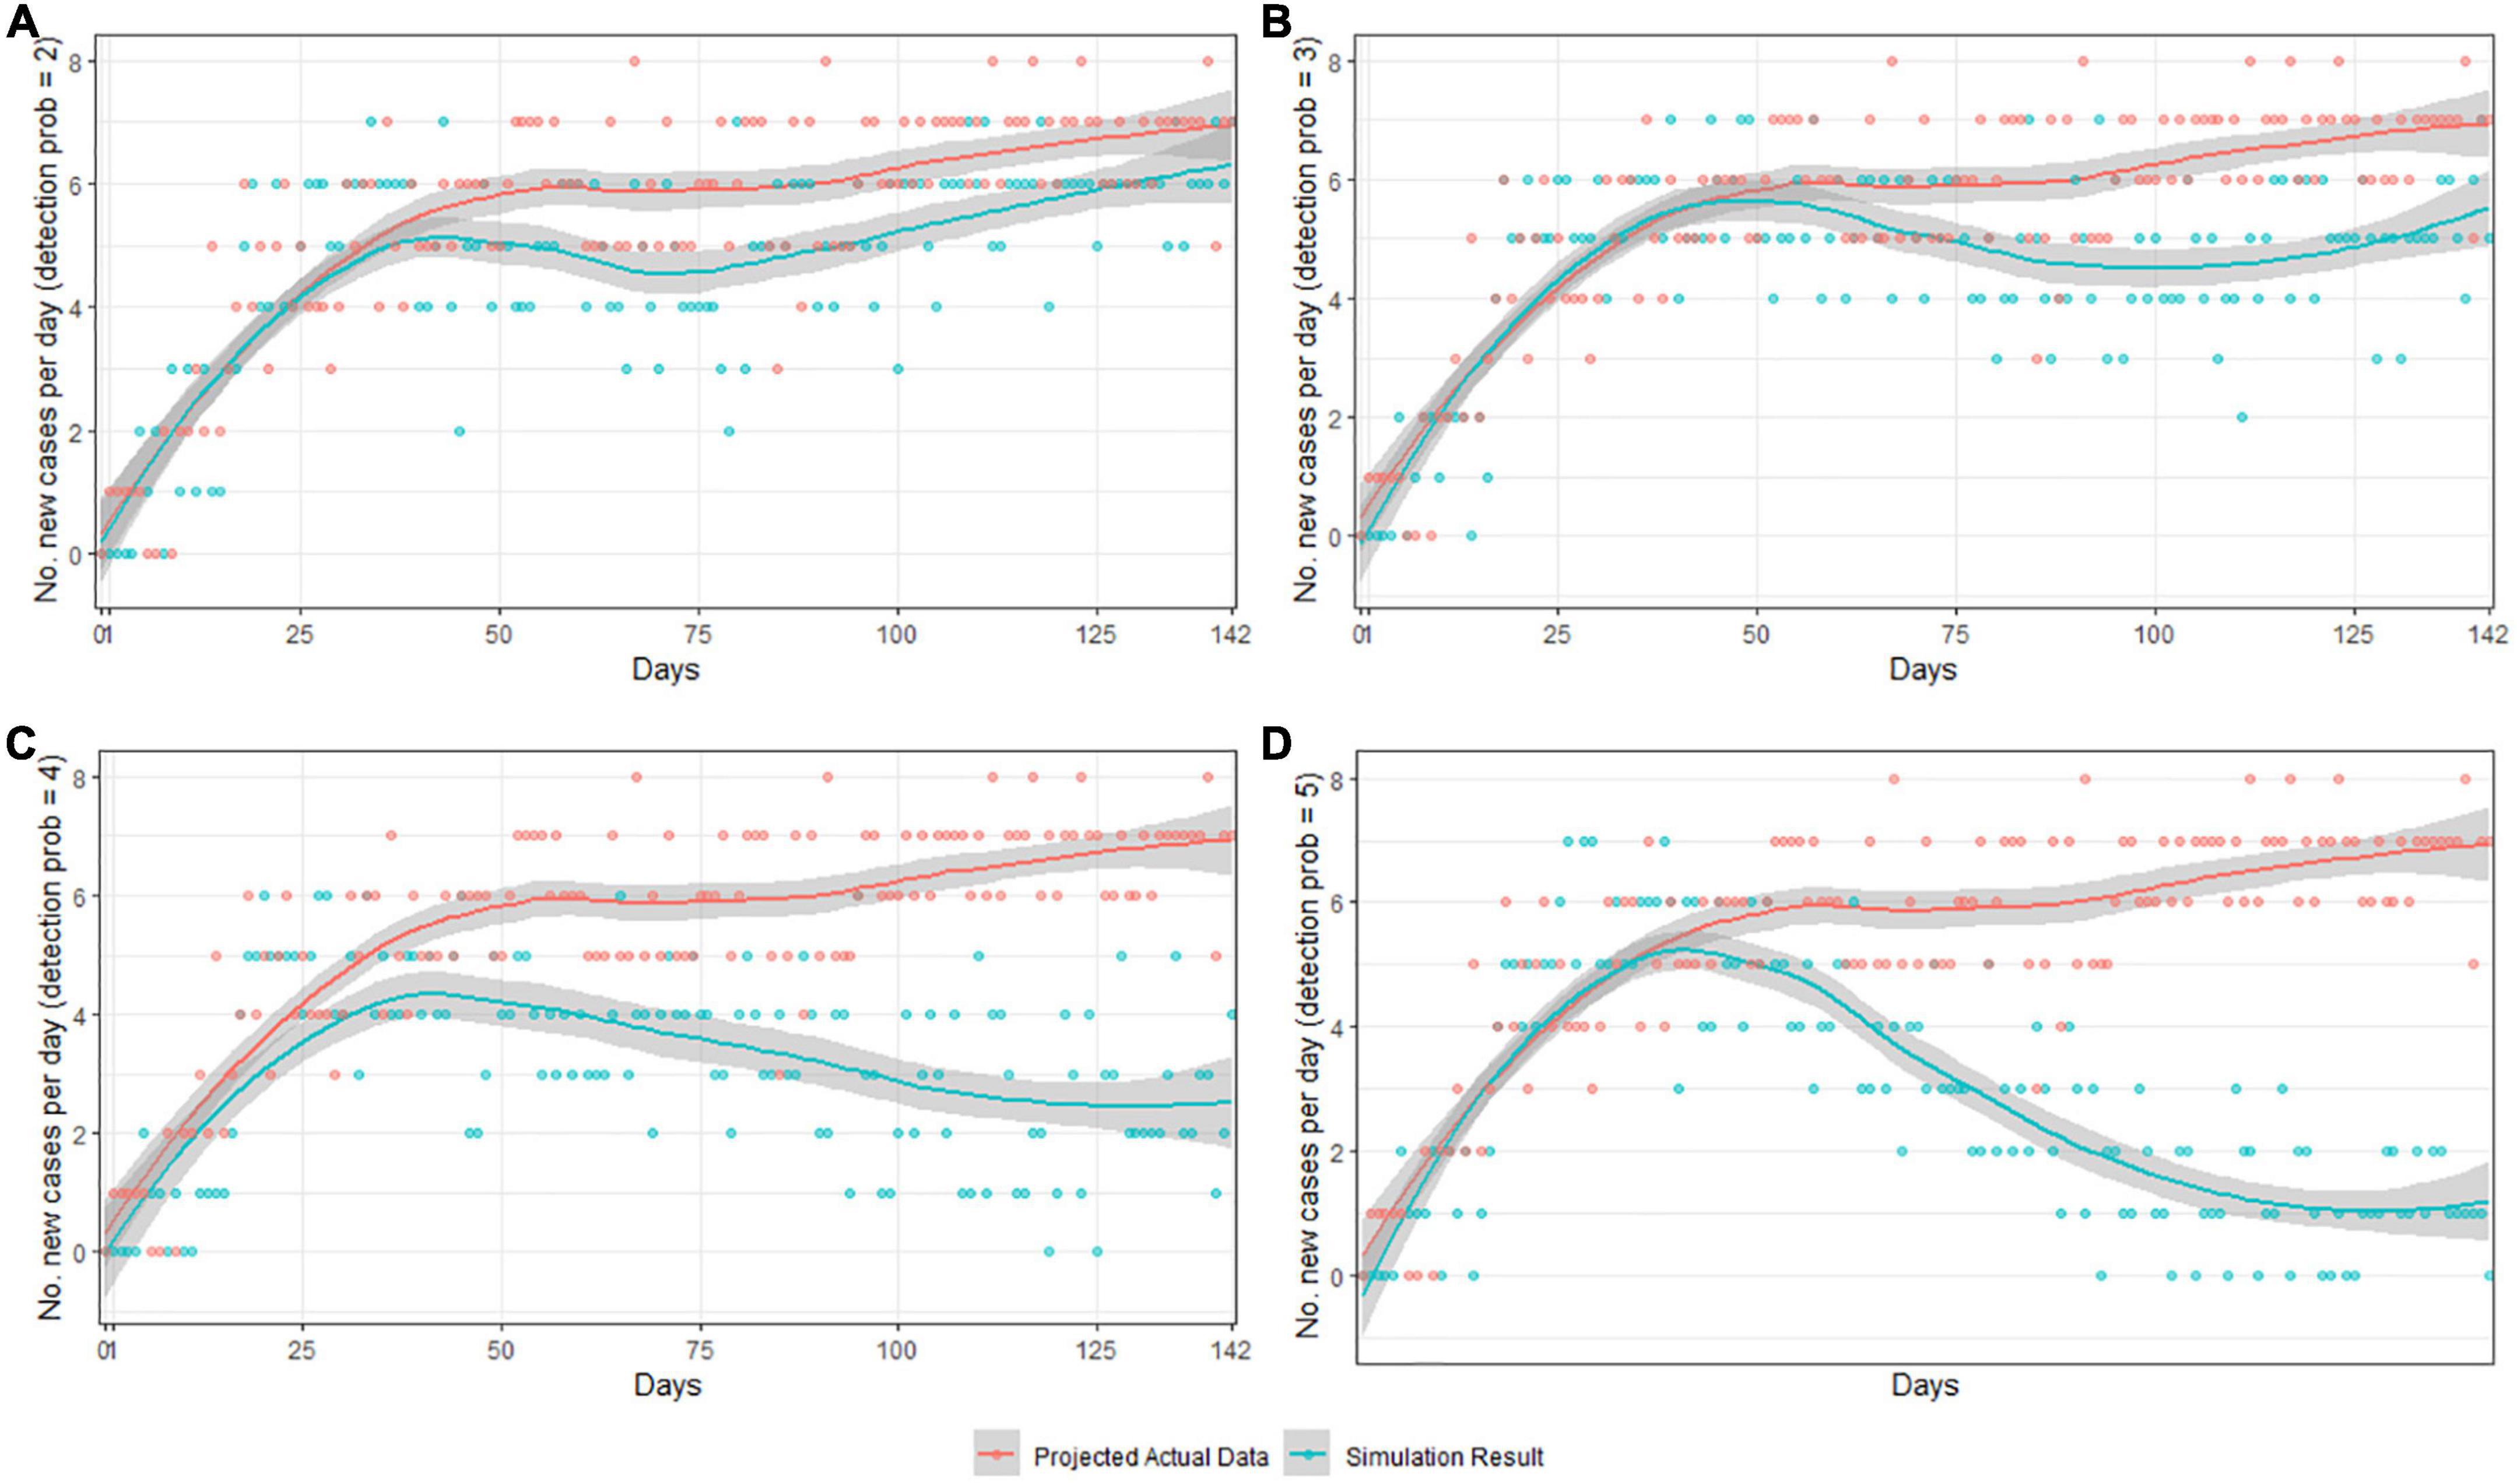
Figure 6. Comparison between detected probability with value of (A) 2, (B) 3, (C) 4, and (D) 5, for the projection of daily new cases using actual data of total population (red line) and simulated data (blue line) during 143 days.
Metapopulation dynamics
An illustration of the simulated SAMPAN model is shown in Figure 7. Our model has shown that the number of contagious individuals is dynamic over time. The peak number of contagious individuals did not occur once, and each sub-population has its peak periods. All sub-populations together contribute to the dynamic of the metapopulation. The simulation results also show that the model’s predicted proportion of reported cases corresponds with the observed proportion of the reported cases.
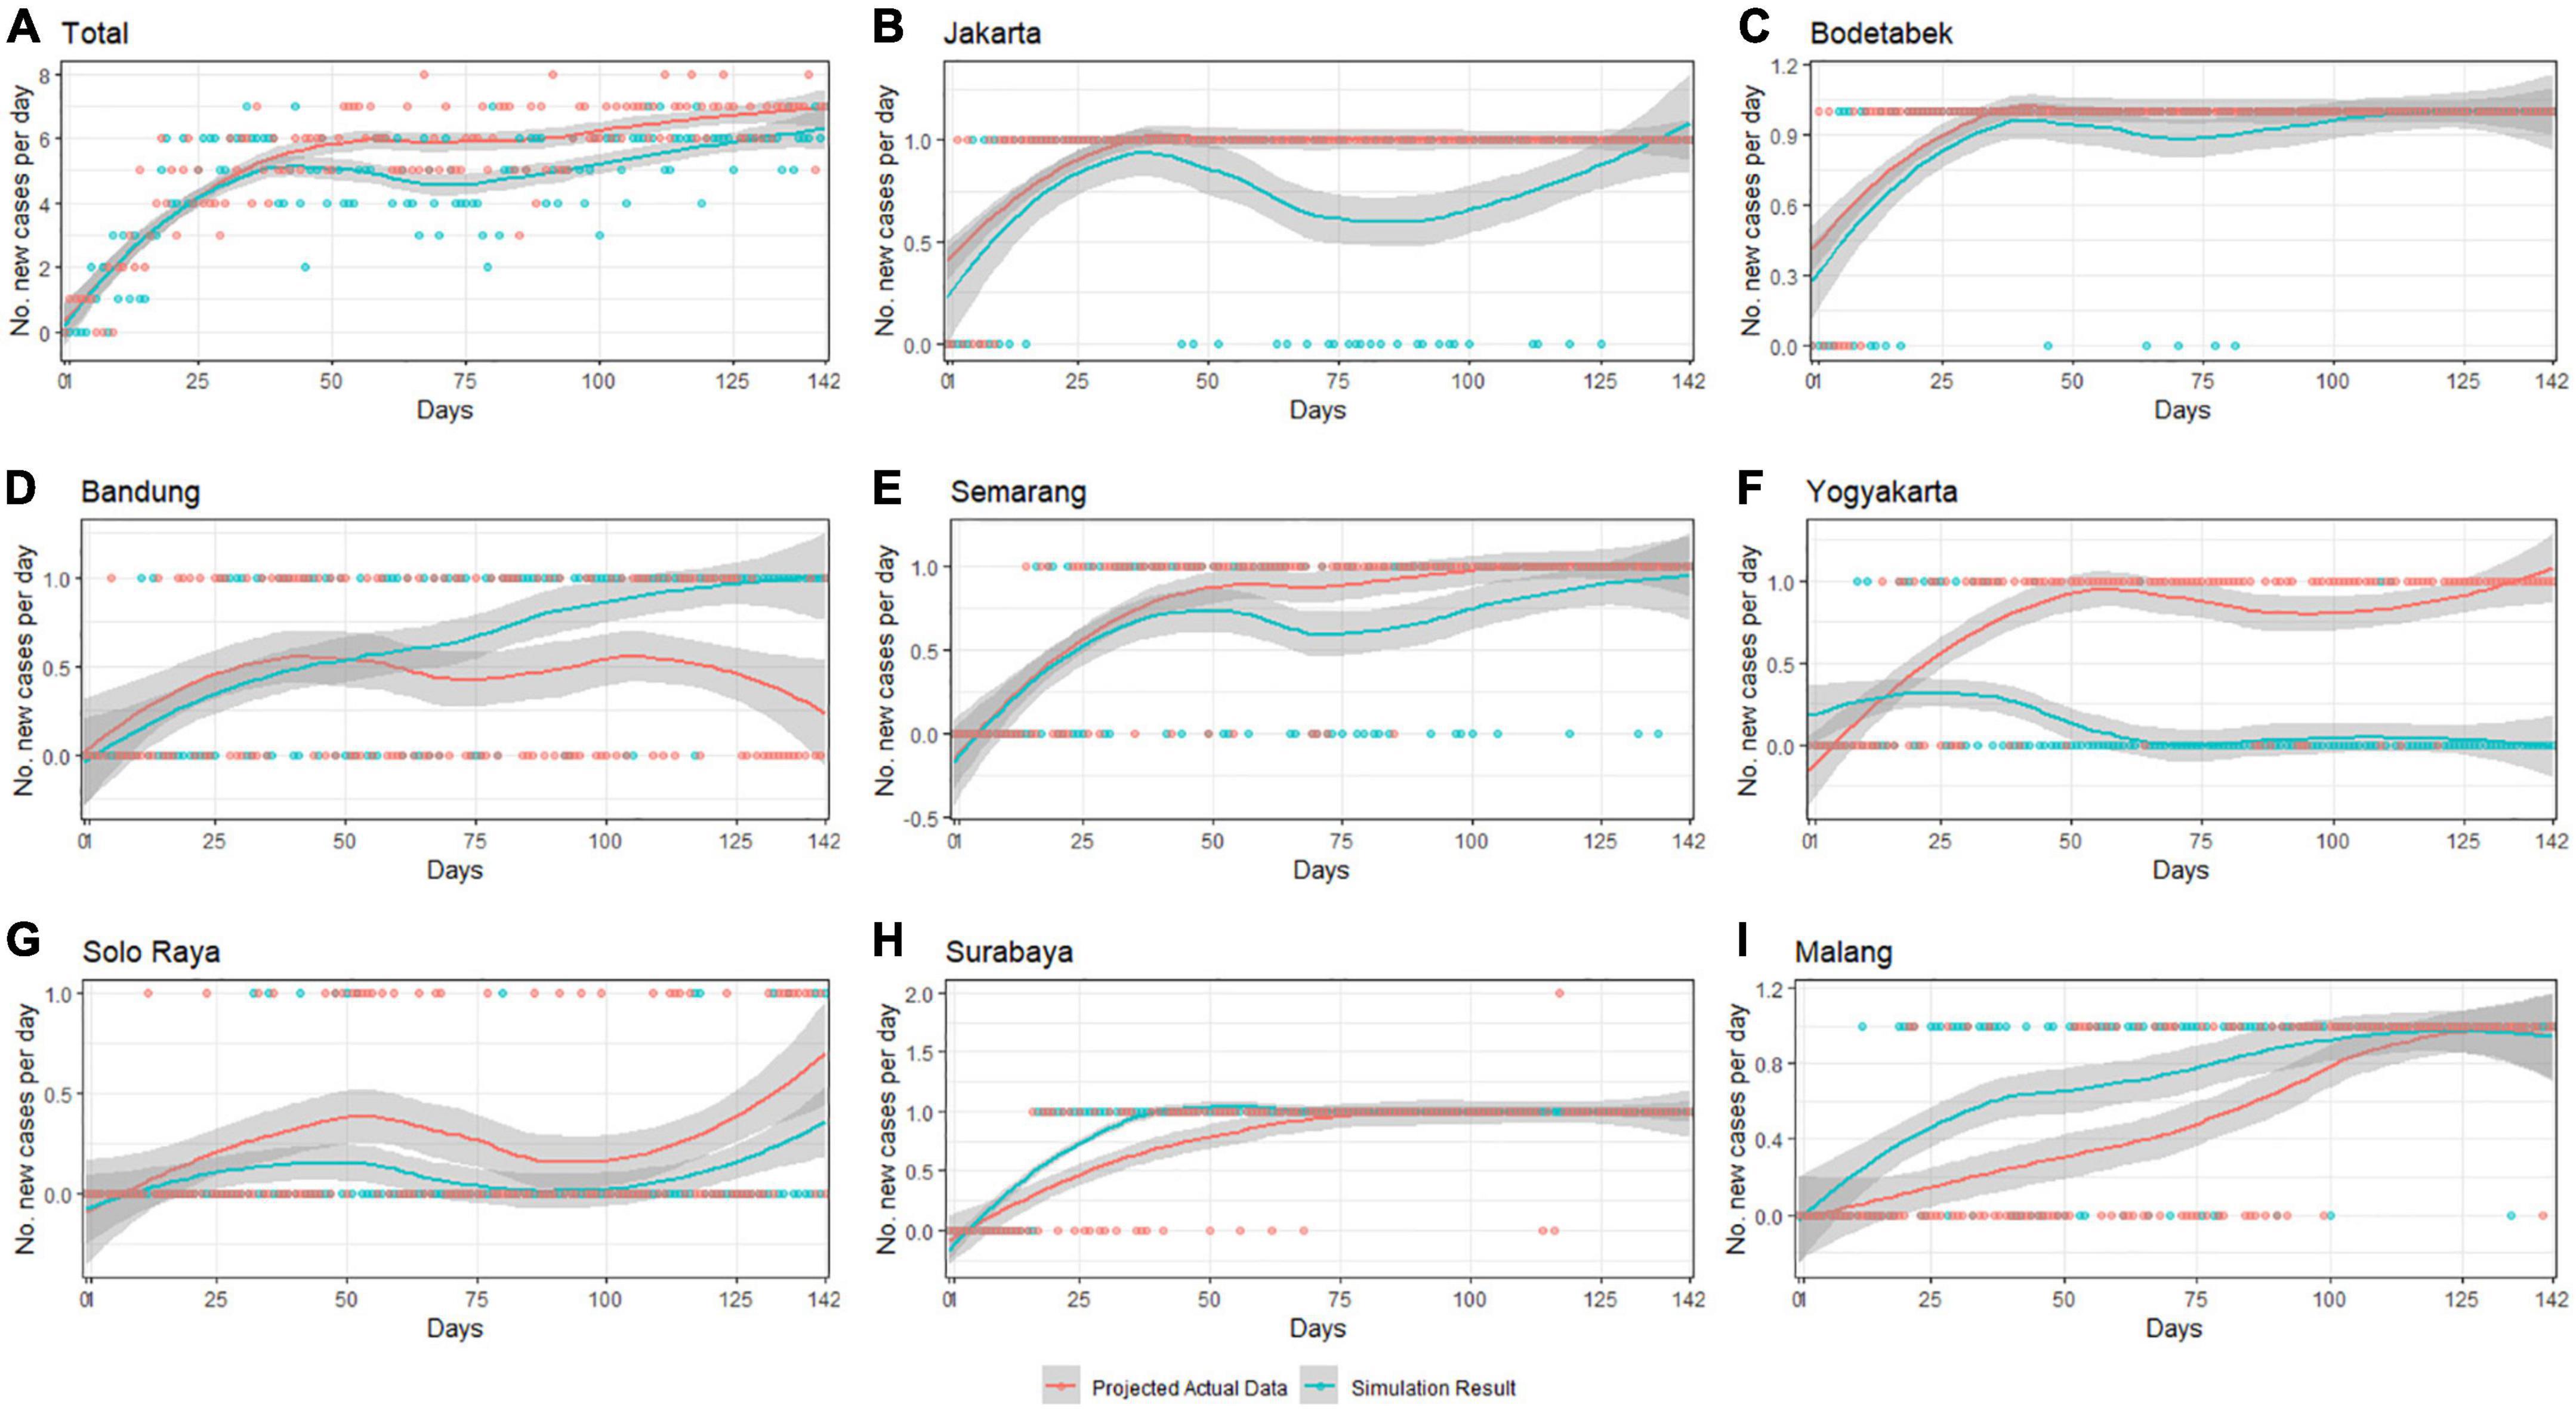
Figure 7. Dynamics of the proportion of detected daily cases per population from observed data (red line) and simulated data (blue line) in (A) all cities and each city [(B) Jakarta, (C) Bodetabek, (D) Bandung, (E) Semarang, (F) Yogyakarta, (G) Solo Raya/Surakarta, (H) Surabaya, and (I) Malang].
Discussion
A SAMPAN is the first agent-based model for simulating Indonesia’s COVID-19 pandemic with metapopulation. The model simulated the social interaction between and within social classes in the eight main cities of Java Island. Findings from the model suggest that mobility strongly influences the disease dynamic in the population. Furthermore, model exploration with available sociodemographic and mobility data shows that social interaction and mobility corresponded to the COVID-19 statistics reported in the eight cities on Java Island. Thus, the model can be used to explain the COVID-19 transmission dynamics in these cities.
Numerical models have been widely used for simulating communicable disease dynamics. However, the agent-based model is becoming more commonly used in simulating infectious disease transmission (Tracy et al., 2018). Both numerical (Arti and Bhatnagar, 2020; Chintalapudi et al., 2020; Ferguson et al., 2020; Lin et al., 2020; Moghadas et al., 2020; Rhodes et al., 2020; Verity et al., 2020; Xu and Li, 2020) and ABM (Silva et al., 2020; Wolfram, 2020; Gomez et al., 2021; Hinch et al., 2021; Pescarmona et al., 2021; Truszkowska et al., 2021; Lombardo et al., 2022) have been used to simulate COVID-19 transmission dynamics. The use of ABM in the extension of SIR models allows the introduction of individual-level heterogeneity and a more complex social network into the traditional SIR compartmental model. Thus, ABM is an appropriate tool to explore and test causal mechanisms in which many interacting and competing causes interplay for disease spread in a population (Tracy et al., 2018). In addition, as ABM consists of a series of interaction rules between agent movement in different places, it can simulate spatiotemporal transmission at the microscopic level and implement counterfactual simulations that may be difficult to observe in the real world. Thus, it can provide what-if scenarios and evidence for implementing specific public health measures (Tracy et al., 2018; Kong et al., 2022).
Our SAMPAN model is agent-based, considering everyone has unique characteristics represented by social classes, social-mixing types, mobility, and mobility radius. We introduced the use of social classes and the social-mixing concept for mobility and interaction behavior. Social classes and behavior are a common social–economic modeling approach (Smajgl and Bohensky, 2013), but a rare approach is used for epidemiology.
We used a metapopulation approach consisting main cities on Java Island. While metapopulation ABM models are widely used in other fields such as ecology (Taylor, 1990; Possingham et al., 1992; Hess, 1996; Lopez and Pfister, 2001; Lehmann and Perrin, 2006; Bull et al., 2007; Ross et al., 2008), only limited studies incorporate this approach to simulate disease transmission, particularly COVID-19 (Hinch et al., 2021; Lombardo et al., 2022). In contrast, other models used a metapopulation approach but did not use an agent-based model (Costa et al., 2020; Kong et al., 2022). Therefore, the use of metapopulation in this study is suitable to reflect the epidemiological situations on Java Island, where COVID-19 transmission is concentrated in several interconnected main cities.
The validation of our agent-based model on COVID-19 using metapopulation for the main cities on Java Island has shown that the model performed similar patterns as reproduced by actual data. We believe the model applies to other Java and island cities using our simulated parameters if cities have relatively good data to compare. However, caution should be applied when using SAMPAN data for the entire population. Although our SAMPAN model can simulate bounced peaks several times at the metapopulation level, the model still has limited ability to simulate bounce within a sub-population. The main sub-population in this model (the Jakarta population) has increased the contagious population and remains until it reaches its peak. The next peak has never been reached in this sub-population. At the same time, studies have warned us that a second wave can occur (Wu et al., 2020; Xu and Li, 2020). Second waves occur in each simulated city, while our model cannot perform these details. However, we do not aim to match our model with actual data because, in the model, we calculated the emergence of the model as the number of contiguous individuals. We should change the output parameter of our emergence into detected individuals because there is no available data on the number of contagious individuals except for detected individuals. Improving the model using sub-populations or groups might be an alternative solution for producing local peaks within sub-populations. We also have identified that our model is limited to the early condition of COVID-19 in Indonesia. Therefore, we suggest to include more data and the behavior of people in our current model for better reliability of application of our model for the current situation of the pandemic.
Our simulation showed that the rise of COVID-19 cases in different cities in Java was linked to mobility and social interactions between and within cities. Therefore, coherence and systematic public health interventions among the different populations on Java Island are required. However, as Indonesia has a decentralized governmental structure, it is challenging to coordinate timely and synchronized interventions. For example, Lele (2021) documented that before the national government sanctioned large-scale national mobility restrictions, many local governments had taken different approaches, albeit controversial. In some cases, there were contradictory policies between the local and national authorities. For example, a mobility restriction in one province was canceled by the central government due to a lack of coordination in timing (Supriyadi et al., 2021).
This incoherence to intervention policies arose because lack of understanding of the mechanism of disease transmission, mainly as COVID-19 is a new disease with limited scientific evidence during the early pandemic. Our model can contribute to understanding the nature of the COVID-19 pandemic from a metapopulation perspective. Furthermore, the model can provide the what-if scenarios of different interventions which may affect these cities differently. Therefore, we expect our model provides a valuable tool for policymakers to select appropriate intervention policies, taking into account different scenarios which may arise during the pandemic in Indonesia in the future.
Data availability statement
The raw data supporting the conclusions of this article will be made available by the authors, without undue reservation.
Author contributions
RA: model and research design and writing. MI: model and research design, writing, model development and validation, and data analysis. AR: data analysis and writing. NL: model development, data analysis, and writing. FA: model development, data analysis, and writing. KW: data analysis. AF: design and writing. All authors contributed to the article and approved the submitted version.
Funding
This study was supported by the Universitas Gadjah Mada as part of dedicated funds for COVID-19 research (Grant No. 1803/UN1.P.III/DIT-LIT/PT/2020).
Acknowledgments
We thank the DSSDI of Universitas Gadjah Mada for generous allocations of computer time and access to the high performance of computing.
Conflict of interest
The authors declare that the research was conducted in the absence of any commercial or financial relationships that could be construed as a potential conflict of interest.
Publisher’s note
All claims expressed in this article are solely those of the authors and do not necessarily represent those of their affiliated organizations, or those of the publisher, the editors and the reviewers. Any product that may be evaluated in this article, or claim that may be made by its manufacturer, is not guaranteed or endorsed by the publisher.
Footnotes
- ^ www.flightradar24.com
- ^ https://www.google.com/covid19/mobility/
- ^ https://dataforgood.facebook.com/
References
Arti, M. K., and Bhatnagar, K. (2020). Modeling and predictions for COVID 19 spread in India. Berlin: ResearchGate. doi: 10.13140/RG.2.2.11427.81444
Bull, J. C., Pickup, N. J., Pickett, B., Hassell, M. P., and Bonsall, M. B. (2007). Metapopulation extinction risk is increased by environmental stochasticity and assemblage complexity. Proc. Biol. Sci. 274, 87–96. doi: 10.1098/rspb.2006.3691
Campolongo, F., Cariboni, J., and Saltelli, A. (2007). An effective screening design for sensitivity analysis of large models. Environ. Modelling Softw. 22, 1509–1518. doi: 10.1016/j.envsoft.2006.10.004
Central Statistical Bureau of Indonesia (2020). Jumlah penduduk hasil proyeksi menurut provinsi dan jenis kelamin (Ribu Jiwa), 2018-2020. Jakarta: Central Statistical Bureau of Indonesia.
Chintalapudi, N., Battineni, G., and Amenta, F. (2020). COVID-19 virus outbreak forecasting of registered and recovered cases after a sixty-day lockdown in Italy: A data-driven model approach. J. Microbiol. Immunol. Infect. 53:3. doi: 10.1016/j.jmii.2020.04.004
Costa, G. S., Cota, W., and Ferreira, S. C. (2020). Outbreak diversity in epidemic waves propagating through distinct geographical scales. Phys. Rev. Res. 2:043306. doi: 10.1103/PhysRevResearch.2.043306
Ferguson, N. M., Laydon, D., Nedjati-gilani, G., Imai, N., Ainslie, K., Baguelin, M., et al. (2020). Report 9: Impact of non-pharmaceutical interventions (NPIs) to reduce COVID-19 mortality and healthcare demand. London: Imperial College London.
Frias-Martinez, E., Williamson, G., and Frias-Martinez, V. (2011). “An agent-based model of epidemic spread using human mobility and social network information,” in Proceedings of the 2011 IEEE international conference on privacy, security, risk, and trust, and IEEE international conference on social computing, (Boston, MA: IEEE). doi: 10.1109/PASSAT/SocialCom.2011.142
Gomez, J., Prieto, J., Leon, E., and Rodríguez, A. (2021). INFEKTA-An agent-based model for transmission of infectious diseases: The COVID-19 case in Bogotá, Colombia. PLoS One 16:e0245787. doi: 10.1371/journal.pone.0245787
Grimm, V., Berger, U., DeAngelis, D., Polhill, J., Giske, J., and Railsback, S. (2010). The ODD protocol: A review and first update. Ecol. Model. 221, 2760–2768. doi: 10.1016/j.ecolmodel.2010.08.019
Grimm, V., Railsback, S. F., Vincenot, C. E., Berger, U., Gallagher, C., DeAngelis, D. L., et al. (2020). The ODD protocol for describing agent-based and other simulation models: A second update to improve clarity, replication, and structural realism. J. Artif. Soc. Simul. 23:7. doi: 10.18564/jasss.4259
Hantrais, L., and Letablier, M. (2021). Comparing and contrasting the impact of the COVID-19 pandemic in the European Union. London: Routledge. doi: 10.4324/9781003140719
Hess, G. (1996). Disease in metapopulation models: Implications for conservation. Ecology 77, 1617–1632. doi: 10.2307/2265556
Hinch, R., Probert, W., Nurtay, A., Kendall, M., Wymant, C., Hall, M., et al. (2021). OpenABM- Covid19–An agent-based model for non- pharmaceutical interventions against COVID-19 including contact tracing. PLoS Comput. Biol. 17:e1009146. doi: 10.1371/journal.pcbi.1009146
Hongfan, L., Yuting, D., Silin, G., and Shishi, W. (2021). Mathematical modeling and dynamic analysis of SIQR model with delay for pandemic COVID-19. Math. Biosci. Eng. 18, 3197–3214. doi: 10.3934/mbe.2021159
Hunter, E., Mac Namee, B., and Kelleher, J. (2018). An open-data-driven agent-based model to simulate infectious disease outbreaks. PLoS One 13:e0208775. doi: 10.1371/journal.pone.0208775
Imron, M. A., Gergs, A., and Berger, U. (2012). Structure and sensitivity analysis of individual based predator-Prey models. Reliability Eng. Syst. Saf. 107, 71–81. doi: 10.1016/j.ress.2011.07.005
Kong, L., Duan, M., Shi, J., Hong, J., Chang, Z., and Zhang, Z. (2022). Compartmental structures used in modeling COVID-19: A scoping review. Infect. Dis. Poverty 11:72. doi: 10.1186/s40249-022-01001-y
Lauser, S. A., Grantz, K. H., Bi, Q., Jones, F. K., Zheng, Q., Meredith, H. R., et al. (2020). The incubation period of coronavirus disease 2019 (COVID-19) from publicly reported confirmed cases: Estimation and application. Ann. Internal Med. 172, 577–583. doi: 10.7326/M20-0504
Lehmann, L., and Perrin, N. (2006). On metapopulation resistance to drift and extinction. Ecology 87, 1844–1855. doi: 10.1890/0012-9658(2006)87[1844:OMRTDA]2.0.CO;2
Lele, G. (2021). Concurrency as crisis decision-making governance: Lessons from Indonesia’s response to the COVID-19 pandemic. Reg. Fed. Stud. 1–26. doi: 10.1080/13597566.2021.1960513
Lin, Q., Zhao, S., Gao, D., Lou, Y., Yang, S., Musa, S. S., et al. (2020). A conceptual model for the coronavirus disease 2019 (COVID 19) outbreak in Wuhan, China with individual reaction and governmental action. Int. J. Infect. Dis. 93, 211–216. doi: 10.1016/j.ijid.2020.02.058
Liu, C. Y., Berlin, J., Kiti, M. C., Del Fava, E., Grow, A., Zagheni, E., et al. (2021). Rapid review of social contact patterns during the COVID-19 pandemic. Epidemiology 32, 781–791. doi: 10.1097/EDE.0000000000001412
Lombardo, G., Pellegrino, M., Tomaiuolo, M., Cagnoni, S., Mordonini, M., Giacobini, M., et al. (2022). Fine-grained agent-based modeling to predict Covid-19 spreading and effect of policies in large-scale scenarios. IEEE J. Biomed. Health Inform. 26, 2052–2062. doi: 10.1109/JBHI.2022.3160243
Lopez, J. E., and Pfister, C. A. (2001). Local population dynamics in metapopulation models: Implications for conservation. Conserv. Biol. 15, 1700–1709. doi: 10.1046/j.1523-1739.2001.00140.x
Moghadas, S. M., Fitzpatrick, M. C., Sah, P., Pandey, A., Shoukat, A., and Singer, B. H. (2020). The implications of silent transmission for the control of COVID-19 outbreak. Proc. Natl. Acad. Sci. U.S.A. 117, 17513–17515. doi: 10.1073/pnas.2008373117
Muller, S. A., Balmer, M., Neumann, A., and Nagel, K. (2020). Mobility traces and spreading of COVID-19. MedRxiv [Preprint]. doi: 10.1101/2020.03.27.20045302
Pedersen, M. G., and Meneghini, M. (2020). Quantifying undetected COVID-19 cases and effects of containment measures in Italy. ResearchGate [Preprint]. 10.
Pellegrino, M., Lombardo, G., Cagnoni, S., and Poggi, A. (2022). High-performance computing and ABMS for High-resolution COVID-19 spreading simulation. Future Internet 14:83. doi: 10.3390/fi14030083
Perez, L., and Dragicevic, S. (2009). An agent-based approach for modeling dynamics of contagious disease spread. Int. J. Health Geogr. 8:50. doi: 10.1186/1476-072X-8-50
Pescarmona, G., Terna, P., Acquadro, A., Pescarmona, P., Russo, G., Sulis, E., et al. (2021). “An agent-based model of COVID-19 diffusion to plan and evaluate intervention policies,” in Crowd dynamics, Vol. 3, eds N. Bellomo and L. Gibelli (Cham: Birkhäuser), 203–257. doi: 10.1007/978-3-030-91646-6_9
Possingham, H. P., Davies, I., Noble, I. R., and Norton, T. W. (1992). A metapopulation simulation model for assessing the likelihood of plant and animal extinctions. Math. Comp. Simul. 33, 367–372. doi: 10.1016/0378-4754(92)90123-X
Rhodes, T., Lancaster, K., and Rosengarten, M. (2020). A model society: Maths, models, and expertise in viral outbreaks. Crit. Public Health 30, 253–256. doi: 10.1080/09581596.2020.1748310
Ross, J. V., Sirl, D. J., Pollett, P. K., and Possingham, H. P. (2008). Metapopulation persistence in a dynamic landscape: More habitat or better stewardship? Ecol. Appl. 18, 590–598. doi: 10.1890/07-1094.1
Salecker, J., Sciaini, M., Meyer, K., and Wiegand, K. (2019). The nlrx r package: A next-generation framework for reproducible NetLogo model analyses. Methods Ecol. Evol. 10, 1854–1863. doi: 10.1111/2041-210X.13286
Saltelli, A., Ratto, M., Tarantola, S., and Campolongo, F. (2006). Sensitivity analysis practices: Strategies for model-based inference. Reliab. Eng. Syst. Saf. 91, 1109–1125. doi: 10.1016/j.ress.2005.11.014
Silva, P. C. L., Batista, P. V. C., Lima, H. S., Alves, M. A., Guimarães, F. G., and Silva, R. C. P. (2020). COVID-ABS: An agent-based model of COVID-19 epidemic to simulate health and economic effects of social distancing interventions. Chaos Solitons Fractals 139:110088. doi: 10.1016/j.chaos.2020.110088
Smajgl, A., and Bohensky, E. (2013). Behavior and space in agent-based modeling: Poverty patterns in East Kalimantan, Indonesia. Environ. Model. Softw. 45, 8–14. doi: 10.1016/j.envsoft.2011.10.014
Supriyadi, A., Wang, T., Pribadi, P., Mauludin, M., Ma’arif, F., and Nuryana, Z. (2021). A review of institutional response and Covid-19 pandemic risk communication in regional autonomy system in Indonesia. Int. J. Commun. Soc. 3, 39–51. doi: 10.31763/ijcs.v3i1.192
Taylor, A. D. E. (1990). Metapopulations, dispersal, and predator-prey dynamics: An overview. Ecology 71, 429–433. doi: 10.2307/1940297
Tracy, M., Cerdá, M., and Keyes, K. (2018). Agent-based modeling in public health: Current Applications and future directions. Annu. Rev. Public Health 39, 77–94. doi: 10.1146/annurev-publhealth-040617-014317
Truszkowska, A., Behring, B., Hasanyan, J., Zino, L., Butail, S., Caroppo, E., et al. (2021). High-resolution agent-based modeling of COVID-19 spreading in a small town. Adv. Theory Simul. 4:2000277. doi: 10.1002/adts.202000277
Verity, R., Okell, L., Dorigatti, I., Winskill, P., Whittaker, C., Imai, N., et al. (2020). Estimates of the severity of coronavirus disease 2019: A model-based analysis. Lancet Infect. Dis. 20, 669–677. doi: 10.1016/S1473-3099(20)30243-7
Wolfram, C. (2020). An agent-based model of COVID-19. Complex Syst. 29, 87–105. doi: 10.25088/ComplexSystems.29.1.87
World Health Organization [WHO] (2020). WHO announces COVID-19 outbreak a pandemic. Geneva: World Health Organization.
Wu, J. T., Leung, K., and Leung, G. M. (2020). Nowcasting and forecasting the potential domestic and international spread of the 2019-nCoV outbreak originating in Wuhan, China: A modelling study. Lancet 395, 689–697. doi: 10.1016/S0140-6736(20)30260-9
Xu, S., and Li, Y. (2020). Beware of the second wave of COVID-19. Lancet 395, 1321–1322. doi: 10.1016/S0140-6736(20)30845-X
Keywords: Indonesia, metapopulation, pandemic, COVID-19, human movement, social interaction
Citation: Ahmad RA, Imron MA, Ramadona AL, Lathifah N, Azzahra F, Widyastuti K and Fuad A (2023) Modeling social interaction and metapopulation mobility of the COVID-19 pandemic in main cities of highly populated Java Island, Indonesia: An agent-based modeling approach. Front. Ecol. Evol. 10:958651. doi: 10.3389/fevo.2022.958651
Received: 31 May 2022; Accepted: 29 December 2022;
Published: 20 January 2023.
Edited by:
Sandrine Charles, Université de Lyon, FranceReviewed by:
Gianfranco Lombardo, University of Parma, ItalySetia Pramana, Politeknik Statistika STIS, Indonesia
Copyright © 2023 Ahmad, Imron, Ramadona, Lathifah, Azzahra, Widyastuti and Fuad. This is an open-access article distributed under the terms of the Creative Commons Attribution License (CC BY). The use, distribution or reproduction in other forums is permitted, provided the original author(s) and the copyright owner(s) are credited and that the original publication in this journal is cited, in accordance with accepted academic practice. No use, distribution or reproduction is permitted which does not comply with these terms.
*Correspondence: Muhammad Ali Imron,  bWFpbXJvbkB1Z20uYWMuaWQ=
†These authors have contributed equally to this work
 Riris Andono Ahmad
 Muhammad Ali Imron
 Aditya Lia Ramadona
 Nurul Lathifah
 Faradhina Azzahra
 Kirana Widyastuti
 Anis Fuad1,2