- 1Department of Natural Environmental Studies, Graduate School of Frontier Sciences, The University of Tokyo, Kashiwa, Japan
- 2Faculty of Science, Academic Assembly, University of Toyama, Toyama, Japan
Dental microwear texture analysis (DMTA) is rapidly expanding for the dietary estimation of extinct animals. There has been an extensive accumulation of microwear texture data from herbivorous mammals, especially for ruminant artiodactyls, but suids are still underrepresented. Microwear varies depending on the diet, and suids are naturally more flexible than other artiodactyls. Thus, their microwear is prone to greater variability. In this study, we examine the tooth microwear texture of wild boars from Toyama Prefecture, Japan, for which detailed ecological and dietary information by stomach content analysis is available. We first investigated 205 individuals of wild-shot Toyama boars with known sex, age class, localities (the eastern high latitude region vs. the western low latitude region), and season of collection. The tooth surfaces of boarlets were rougher than those of juvenile and adult animals. The decrease in surface roughness with age implied that the frequency of tooth-tooth contact, which seemed to result in cracking of enamels and thus rough surfaces, decreased after the boars started feeding on solid foods (food-tooth contact), with progressive involvement of rooting behavior in mature adults. We further found that surface roughness showed significant differences between localities, with the western Toyama boars having flatter surfaces, possibly because they were involved in more rooting and feeding on soil-contaminated rhizomes than the eastern ones, as implied by the available stomach content data. The frequency of rooting was also evident in the broader comparison among Japanese boar populations with different habitat environments. The mainland boars inhabiting deciduous broad-leaved forests had a flatter and less rough tooth surfaces than those in the subtropical evergreen broad-leaved forests of the southern islands. This corresponds to the fact that above-ground dietary resources were more abundant in the habitat of the southern island boars, where crops like succulent vegetables and fruits, as well as naturally fallen acorns, were abundant, whereas underground plant parts were the dominant diet component for the mainland boars. This study proved that DMTA can identify the difference in foraging modes in suids and make it possible to estimate the frequency of rooting, which is informative for inferring breeding methods of boars/pigs from archaeological sites.
Introduction
The wild boar (Sus scrofa) is the most widely distributed terrestrial wild mammal globally and is currently distributed throughout Eurasia and northern Africa. It has been introduced to the North and South Americas and the Oceanian islands. The wild boar is highly adaptable to local environments and shows plasticity in feeding habits. Wild boars have been a important human food resource for a long time, possibly more than several hundred thousand years (Stiner et al., 2009), and boars excavated from archaeological sites have been a particular focus of zooarchaeological research to verify the process of domestication by humans (Larson et al., 2007, 2010). In recent years, in addition to the conventional comparative anatomy of bones and teeth [e.g., Evin et al., 2013 and the references therein], attempts have been made to investigate the domestication and husbandry practices of wild boars by clarifying the feeding habits of boars excavated from archaeological sites (Minagawa et al., 2005; Vanpoucke et al., 2013; Halley and Rosvold, 2014; Yamada et al., 2021). Isotopic analyses were conducted to reveal dietary differences among wild and reared boars/pigs from excavated historical sites and clarified in part that some pigs from historical sites were raised on human refuse and not on a diet predominated by terrestrial plants, which was indicative of outspan foraging (Minagawa et al., 2005; Halley and Rosvold, 2014). On the other hand, studies on dental use-wear analysis, which analyzes the microscopic wear (microwear) formed on tooth enamel surfaces, focused not only on a diet but also on the frequency of rooting behavior (Vanpoucke et al., 2013; Yamada et al., 2021). Because rooting and foraging on grit-contaminated foods could produce characteristic dental wear (Ward and Mainland, 1999; Souron et al., 2015; Yamada et al., 2018; Lazagabaster, 2019) (see below), husbandry practices, which keep boars/pigs within stalls and restrict rooting behavior, could be inferred from dental microwear. Therefore, analysis of microwear is anticipated to reveal the transition from free-ranging to rearing within stalls, which should have occurred in the domestication process.
Dental microwear texture analysis (DMTA) is one of the dietary estimation methods and has been developed since the 2000s (Scott et al., 2005, 2006; Schulz et al., 2010). DMTA has been applied to diverse vertebrates, including mammals, reptiles, and fish (Purnell et al., 2012, 2013; DeSantis et al., 2013; Desantis and Haupt, 2014; Gill et al., 2014; Calandra and Merceron, 2016; Bestwick et al., 2019; Winkler et al., 2019). The relationship between DMT and diet derived from extant species has been used to estimate the diet of fossil species. Among them, extensive DMT data of extant herbivorous mammals have been generated and accumulated, both for wild individuals (Merceron et al., 2010, 2014; Scott, 2012; Kubo et al., 2017; Aiba et al., 2019; Arman et al., 2019; Kubo and Fujita, 2021) and laboratory-reared, diet-controlled ones (Merceron et al., 2017; Winkler et al., 2019, 2020; Ackermans et al., 2020, 2021). DMT data of the omnivorous species, however, have not been investigated rigorously, possibly because their flexible dietary preferences make the comparisons difficult and less interpretable. Yet, a few DMT studies of boars have been conducted, comparing DMT among multiple species with different foraging ecologies (Souron et al., 2015; Lazagabaster, 2019) and among populations of the same species in different habitats (Yamada et al., 2018). In the former studies, distinct differences in DMT were found between species that frequently forage on grasses and their roots and those that are more omnivorous and feed on rhizomes, nuts, leaves, grasses, and animal matter (Souron et al., 2015; Lazagabaster, 2019). The herbivorous species had tooth surfaces with more aligned scratches and, therefore, were less complex and more homogeneous than the omnivorous species. In the latter study, three populations of the same species (Sus scrofa) in Japan were compared: mainland boars, which were involved in frequent rooting behavior; boars from the southern island (Iriomote Island), which are thought to have a higher consumption rate of fruits, nuts, and cultivated plants in their diets; and boars that were raised in a concrete-floored stall and fed corn hay (Yamada et al., 2018). Significant differences in DMT were found between the mainland boars and the reared boars, and the island boars were placed between them. Ward and Mainland (1999) also found the same dental microwear differences, though not by the three-dimensional DMT but by a conventional method of counting microwear features from 2D images obtained by SEM, between free-ranging and stall-fed pigs. Yamada et al. (2021) further investigated the DMT of boars/pigs from archaeological sites in the southern islands (Ryukyu Islands) of Japan. They found chronological and/or locality differences in DMT among studied populations. The differences were interpreted by possible feeding on human leftovers and rearing in floored stalls: boars/pigs having lower surface roughness might be allowed to range freely around human settlements and thus forage on underground plant resources, whereas those having higher surface roughness were expected to be kept in floored stalls and fed on softer diets, possibly provided by humans. The above DMTA studies on extant suids (Ward and Mainland, 1999; Souron et al., 2015; Yamada et al., 2018; Lazagabaster, 2019) were based on information about “known” diets of populations, though quantitative data on their diets were not provided. To supplement these studies, a study examining the relationship between DMT and diet was conducted by running feeding experiments on pigs; the pigs were fed different seed-mixed diets among the groups (Louail et al., 2021). While seed foraging was shown to be associated with DMT, the control group feeding only on soy flour, the food item which was included in the diets of other seed feeding groups, showed a large variation of DMT parameters and overlapped with other seed-feeding groups, making dietary inference from DMT more complicated. Since wild boars feed on various items at varying proportions according to seasons, it is necessary to conduct analyses of wild populations whose diet is more clearly defined by quantitative dietary analysis. It will be a crucial step toward a more quantitative estimation of suid diets by DMTA.
In this study, we aim to solve the above problem and clarify how locality, season, and age at the culling are related to DMT for wild boars hunted in Toyama Prefecture, Japan. Stomach content analysis has already been conducted for some of the boars analyzed in this study (Yasuda and Yokohata, 2015), and the quantitative dietary data can be used to correlate with DMT. The habitat environments were different between the eastern and western regions of Toyama Prefecture (see Materials and methods Section), which caused a difference in the food habits of wild boars between the localities. We also used the DMT data of Japanese wild boars obtained by Yamada et al. (2018, 2021), aiming to conduct a broader comparison and examine the relationship between the foraging ecology and the DMT of wild boars in Japan. From the preceding DMTA and conventional microwear studies, we specifically expect that both diets and frequency of rooting are associated with DMT even at finer scales among Japanese wild boars, aiming at providing a more solid background when discussing boar husbandry practice in the zooarchaeological context.
Materials and methods
Sus scrofa population from Toyama Prefecture
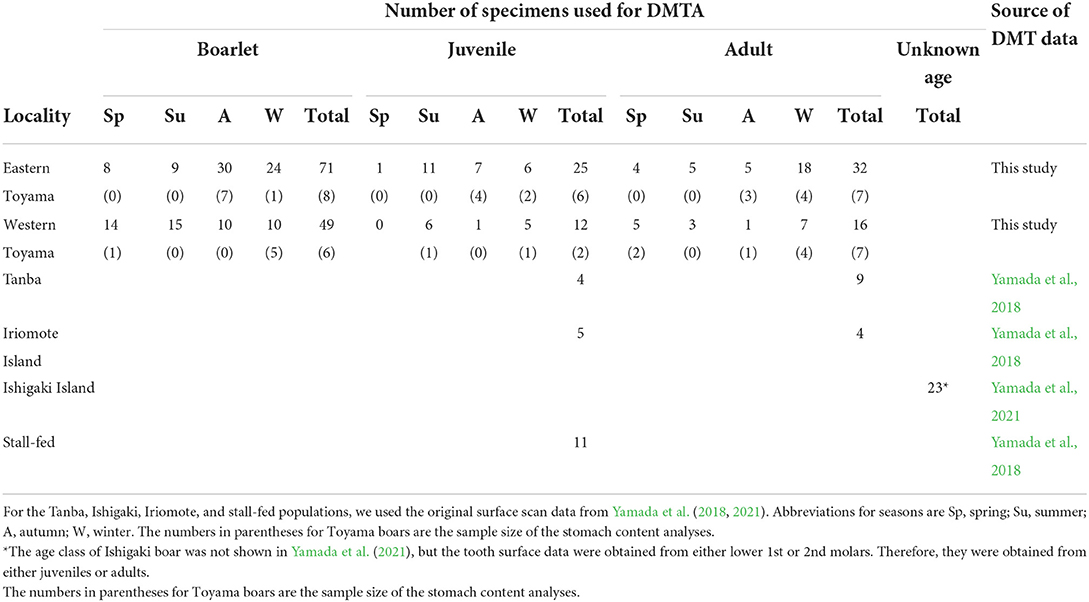
We used 205 individuals of wild boars collected by nuisance culls in Toyama Prefecture, central western Japan (Figure 1). The nuisance cull was done year-round, and sex, date of collection, and localities were recorded. In the present study, the boars were divided into two localities, i.e., the eastern and western Toyama, which were separated by the Jinzu River running across Toyama Prefecture in the north-south direction (Figure 1). The geological and environmental settings of the two localities were contrasting. The eastern region was characterized by high elevation areas (altitude of ca. 100–2,000 m) with natural vegetation of cool-temperate deciduous broad-leaved forest and secondary forest. On the other hand, the western region was in lower elevation areas (altitude of ca. 100–500 m), and both secondary and planted coniferous forests showed a mosaic distribution. Agricultural fields (rice and other crops) were more widely distributed in the western region. Mean annual temperature and annual precipitation were 11.8°C and 3020.7 mm for the eastern Toyama (Kamiichi-machi, 36°40′20″ N, 137°25′40″E) and 13.4°C and 2597.3 mm for the western Toyama (Nanto-shi, 36°32′70″ N, 136°52′30″E). The number of specimens used in the present study is given in Table 1.
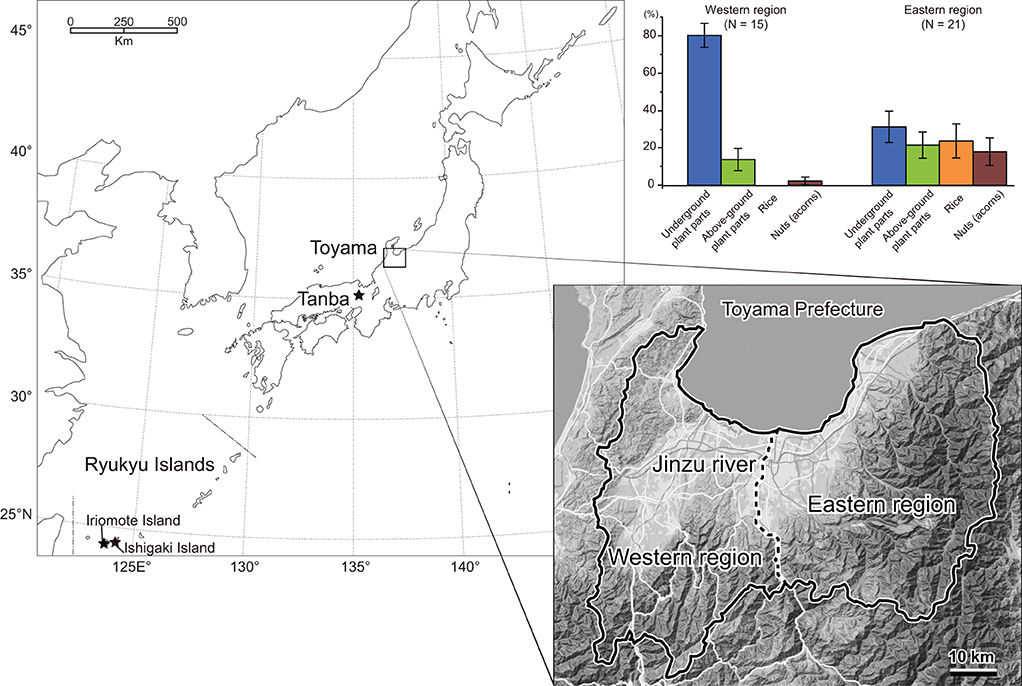
Figure 1. Localities of Sus scrofa populations used in the present study. Results of the stomach content analysis of Toyama boars are presented, respectively, for eastern and western regions, with the bars representing average proportions of four food categories and standard errors.
The boars' age at death (in months) was assessed by tooth eruption and wear status according to the method of Kodera et al. (2012). Subsequently, we classified them into three age classes: adults (older than 20 months), juveniles (12–20 months), and boarlets (younger than 12 months). The season of death was classified into spring (March, April, and May), summer (June, July, and August), autumn (September, October, and November), and winter (December, January, and February). Among the 205 individuals, the stomach contents of 36 wild boars were investigated (Yasuda and Yokohata, 2015). The dried weight of stomach contents was weighed for four dietary categories: above-ground plant parts (leaves and stems), underground plant parts (rhizomes, tubers, and roots), nuts, and rice. In the current samples, animal matters (vertebrates and invertebrates) were minor components; therefore, the boars in Toyama Prefecture had herbivorous feeding habits in general, similar to other Japanese mainland populations (Asahi, 1975; Kodera et al., 2013). The proportion of each category (weight of the dietary item/total weight of analyzed stomach content) was calculated, and the category that accounted for the largest part of stomach content was identified for each boar. Table 1 includes the number of samples of stomach content analysis, and the proportion of each dietary item in percent (%) is provided in Supplementary Table S1. Figure 1 includes bar charts showing the difference in stomach content between the eastern and western regions. All the skull specimens are stored in the Faculty of Science, University of Toyama.
Molding and obtaining microwear texture data
Dental impressions were obtained from the occlusal enamel surfaces of the lower 4th deciduous premolar (dp4) and the lower 1st, 2nd, or 3rd permanent molars. Following Souron et al. (2015) and Yamada et al. (2018, 2021), we investigated the lingual enamel bands (facets 1, 3, 5, and 7 in Figure 2), which act as Phase I shearing facets during mastication. When the lingual enamel band was broken (N = 42), we used the buccal enamel bands (facets 2, 4, 6, 8, and 10 in Figure 2). In the present dataset, we did not observe any significant differences in DMT parameters between the lingual and buccal enamel bands (see Supplementary Figure S1), therefore we combined the data from different enamel bands. Molding was conducted following the methodology of Kubo et al. (2017), in which the tooth occlusal surfaces were cleaned with cotton swabs soaked with acetone, and molds were taken using high-resolution A-silicone dental impression material (Dr. Silicon regular type, BSA Sakurai, Japan). We used a confocal laser microscope (VK-9700, Keyence, Japan) equipped with a 100 × long-distance lens (N.A. = 0.95) to scan the occlusal impressions. It uses a violet laser, and its wavelength is 408 nm. Generated 3D microwear texture data had point clouds with lateral (x, y) sampling with an interval of 0.137 μm and a vertical resolution (z) of 0.001 μm (the nominal value from the brochure). The field of view was 140 × 105 μm. We scanned four adjacent fields and combined them into one large field by using VK Assembler software (Keyence, Japan). The total acquired area was smaller than 280 × 210 μm due to overlaps between adjacent fields and thus variable among the specimens. After trimmed into 208 × 144 μm in size (see “Processing 3D surfaces and calculation of DMT parameters” below), DMT parameters were calculated from these combined fields by using surface roughness software (Mountains Map, Imaging Topography, ver. 9. 0. 9733, Digital Surf, France).
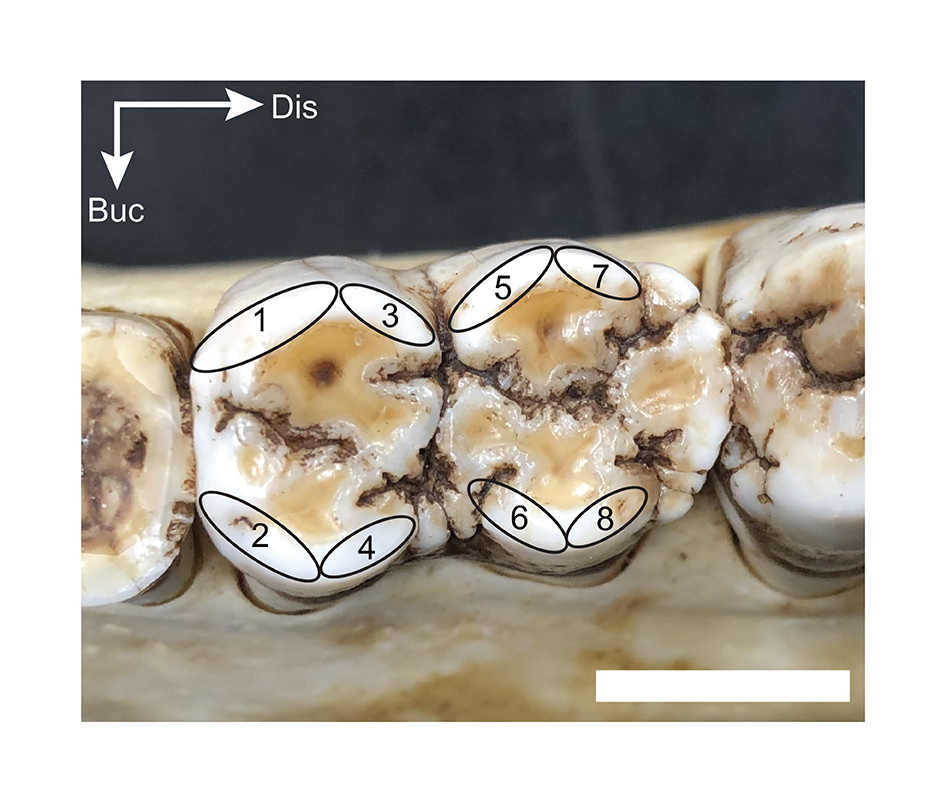
Figure 2. The occlusal surface of the left lower second molar and nomenclature of enamel bands. This study scanned the lingual enamel bands (facets 1, 3, 5, and 7). In case the lingual enamel bands were broken, we used the buccal enamel bands (facets 2, 4, 6, and 8). The scale bar is 10 mm. Abbreviations for orientation are Buc, buccal; Dis, distal.
Comparative DMT data of extant Sus scrofa populations from Japan
Yamada et al. (2018, 2021) compared DMT data of extant and archaeological S. scrofa populations from Japan. We utilized the scan data of the four extant populations: a wild mainland population from the Tanba region, Hyogo Prefecture, central Japan (hereafter referred to as Tanba), reared individuals in a concrete-floored stall (stall-fed), and two wild populations from the Ryukyu Islands (Iriomote Island and Ishigaki Island). Detailed information on these populations is given in Yamada et al. (2018, 2021), and dietary characteristics are summarized below. The boars from the Tanba population inhabited deciduous broad-leaved forests and fed mainly on roots, barks, and rhizomes during the winter season (Asahi, 1975). The boars from Iriomote Island lived in subtropical evergreen broad-leaved forests and consumed roots, rhizomes, fruits, and nuts throughout the year (Ishigaki et al., 2007). The boars from Ishigaki Island were not investigated in their feeding habits, but they also lived in subtropical evergreen broad-leaved forests and fed on crops (Ishigaki City, 2021). Both Iriomote and Ishigaki Island boars were known to feed on crops such as pineapples, bananas, mandarin oranges, sugar canes, and sweet potatoes (Ishigaki et al., 2007; Ishigaki City, 2021). The stall-fed boars were fed mainly on corn. Except for the Ishigaki population, the age at death in months was estimated by Yamada et al. (2018) following the method of Hayashi et al. (1977). There was a good correspondence between the methodologies of Hayashi et al. (1977) and Kodera et al. (2012). Therefore, the estimated ages were comparable to the Toyama populations. The number of specimens used for comparative analysis is shown in Table 1. Using a modified analytical template of the newer version of the software (Mountains Map) after the publications of Yamada et al. (2018, 2021), we reanalyzed the original scan data obtained by Yamada et al. (2018, 2021) rather than compared it to the published DMT parameter values. The method for obtaining 3D surfaces by Yamada et al. (2018, 2021) was identical to that was applied for the Toyama boars: i.e., the same tooth types and facets were scanned by the same laser microscope with the same settings; therefore, the DMTA data are directly comparable after the application of the newer analytical template.
Processing 3D surfaces and calculation of DMT parameters
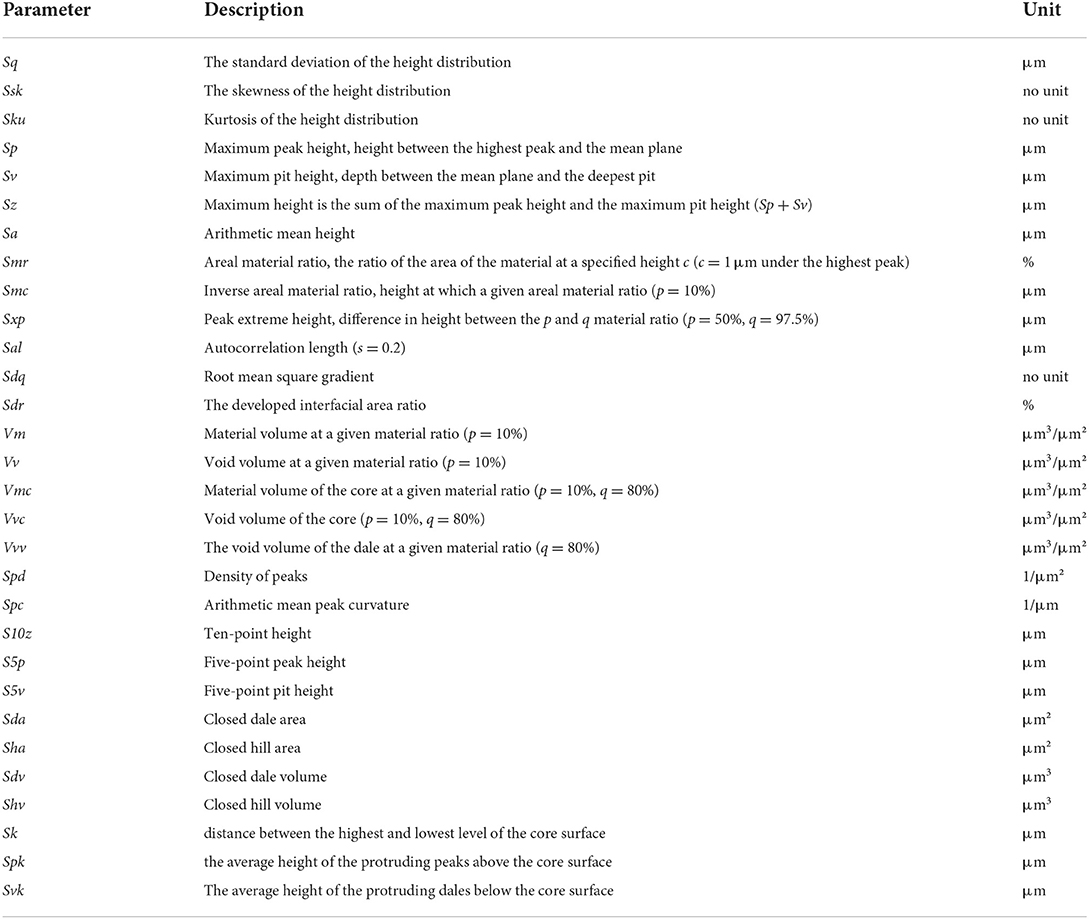
All the 3D surface data were processed following the procedures of Yamada et al. (2018) and Aiba et al. (2019) by Mountains Map Imaging Topography. The scanned impressions were mirror images of the actual tooth surfaces. Therefore, the coordinates were mirrored in the x- and z-axes. The surfaces were then leveled via the least-square plane by subtraction to remove the inclination of the molds, and a robust Gaussian filter was applied with a cutoff value of 0.8 μm to remove measurement noise (S-filter as defined in ISO 25178-2). The form removal function (polynomial of increasing power = 2) was utilized to remove the large-scale curvature of the enamel bands (F-operation in ISO 25178-2). Because measurement noise appeared as spikes on the surface, we applied the automated outlier removal function, which removes any features with a slope of > 80° and a threshold that removes the upper and lower 0.1% of the data. These non-measured points were subsequently filled using the smoothing function of the Mountains Map. This workflow was similar to that of the preceding DMTA research (Arman et al., 2016; Kubo et al., 2017), but the difference was in filtering: i.e., a robust Gaussian with a 0.8 μm threshold was used in the present study, whereas single, double, and triple usage of spline, Gaussian, and robust Gaussian filters with different threshold values were used in previous studies (Arman et al., 2016; Kubo et al., 2017). Finally, the scanned areas were trimmed to 208 × 144 μm to standardize the area size. After the above procedures, 30 parameters of ISO 25178-2 were calculated. The names and definitions of the parameters are shown in Table 2.
Statistical analyses
We conducted a principal component analysis (PCA) to summarize the 30 parameters into a few interpretable components. The PCA was applied to the whole dataset (N = 261). In the following statistical analyses, we focused on the principal components. Since the normal distribution of the principal components was rejected by the Shapiro–Wilk test (P < 0.05, see Supplementary materials), we transformed them using Johnson's Su distribution to fulfill the normality. Hereafter, the transformed principal components are referred to as PCs for simplicity.
First, we compared PC1, PC2, and PC3 among Toyama boars to test the relationships between dietary and ecological characteristics and DMT. The following hypotheses were tested: (1) there are significant differences among the dietary groups based on the stomach contents, (2) there is an ontogenetic change in DMT from boarlets to adults, and (3) there are significant differences between localities (eastern Toyama vs. western Toyama) and among seasons of collection in DMT. In the first analysis, we conducted an ANOVA comparing the four dietary categories using 36 individuals with data on stomach contents: above-ground plant parts, N = 7; underground plant parts, N = 21; nuts, N = 3; and rice, N = 5. Due to the scarcity of samples, we grouped both localities, seasons, and age classes. In the second and third analyses, we used the whole Toyama dataset (N = 205) and conducted a stepwise model selection with the PCs being the response variables and age class, locality, season, and their interaction terms (age class*locality, age class*season, locality*season, and age class*locality*season) being the explanatory variables. Since we did not find a consistent difference between adults and juveniles in PCs (the Tukey–Kramer test, P > 0.05), we used a dichotomous age class (adult/juvenile vs. boarlet). We used Akaike's information criterion for a small sample size (AICc) for model selection. The model was significantly different when the ΔAICc was >2. The model with the lowest AICc value and all included explanatory variables being statistically significant was selected as the best model (Burnham and Anderson, 1998).
Second, we compared the PCs of Toyama populations with other wild boar populations and the stall-fed ones. For this comparison, we only used juvenile and adult individuals of Toyama boars with combined collection seasons. We conducted a one-way ANOVA followed by pairwise comparisons with the Tukey-Kramer tests. All the statistical analyses were conducted with the statistical software JMP (ver 16.2, SAS Institute Inc., USA).
Results
Principal component analysis of DMT parameters
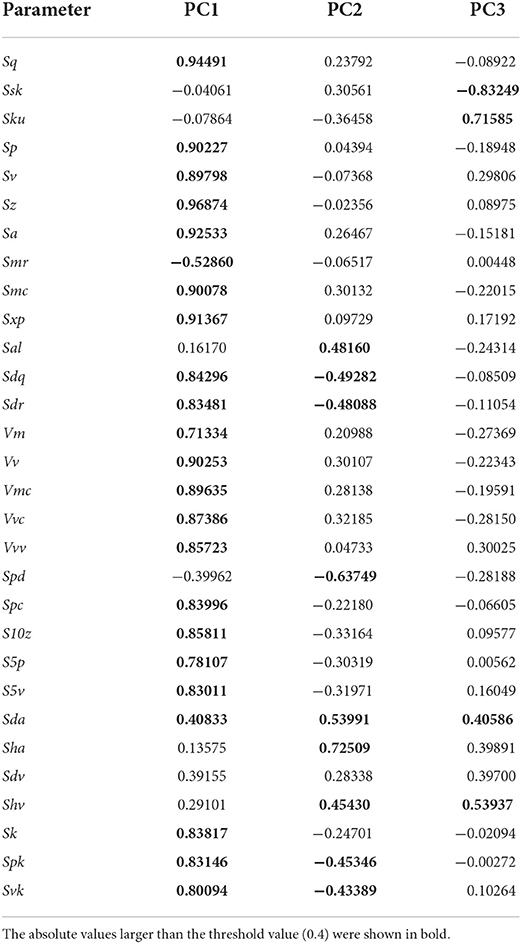
According to PCA of 30 ISO 25178-2 parameters, the first, second, and third PCs explained about 55.5, 12.7, and 9.2% of the total variance, respectively. Table 3 presents the factor loadings of the parameters. The first component (PC1) can be interpreted as the overall surface roughness or size of microwear features, as most of the height (e.g., Sq: standard deviation of the height distribution, Sp: maximum peak height, and Sa: arithmetic mean height) and volume parameters (e.g., Vv: void volume at a given material ratio, Vmc: material volume of the core at a given material ratio, and Vvc: void volume of the core) showed large values of the loadings. These were positively loaded; therefore, larger PC1 values indicated greater surface relief. The parameters which exerted a strong influence on the second component (PC2) are those which are related to surface segmentation. Sda (closed dale area) and Sha (closed hill area) have large positive loadings, whereas Spd (density of peaks) has a negative loading value. This indicates that larger values of PC2 represent tooth surfaces segmented into larger hills and dales, resulting in a lower number of segments (i.e., low density of peaks). The negative factor loadings of Sdr (developed interfacial area ratio) and Sdq (root mean square gradient) are related to the fineness of surface features, with the larger values indicating the dominance of finer features, are concordant to this interpretation. The third component (PC3) is related to height distribution. Ssk (skewness of the height distribution) and Sku (kurtosis of the height distribution) show large factor loadings. Therefore, the larger value of PC3 indicates the height distribution of the surface is skewed to a high elevation with the pointed peaks and valleys.
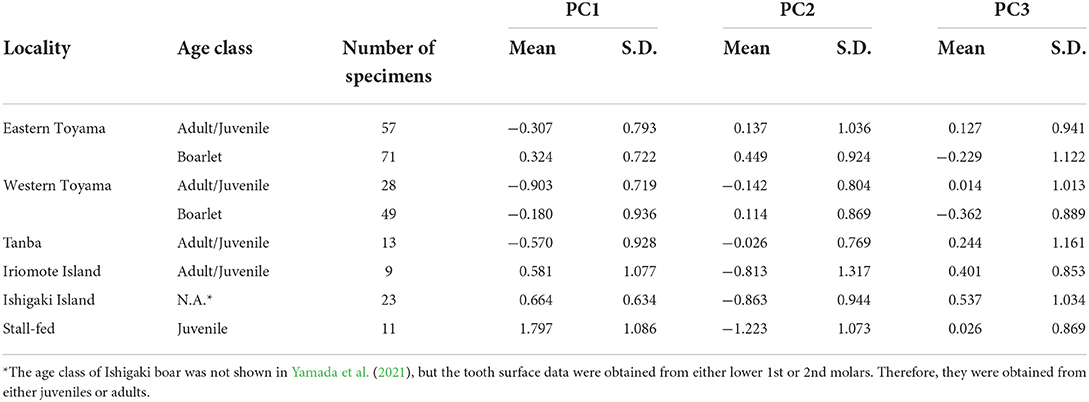
All the raw parameter values and PC scores are included in Supplementary Table S1. The descriptive statistics of PCs are presented in Table 4.
Correlation between stomach contents and DMT in Toyama boars
There are no significant differences in any of the PCs among the four dietary groups defined by stomach content analysis [one-way ANOVA; PC1: F3, 32 = 0.26, P = 0.85; PC2: F3, 32 = 0.10, P = 0.96; PC3: F3, 32 = 1.51, P = 0.23; Supplementary Figure S2], refuting the correlation between the stomach content and DMT parameters in Toyama boars at the individual level.
Factors responsible for the variation of PCs in Toyama boars
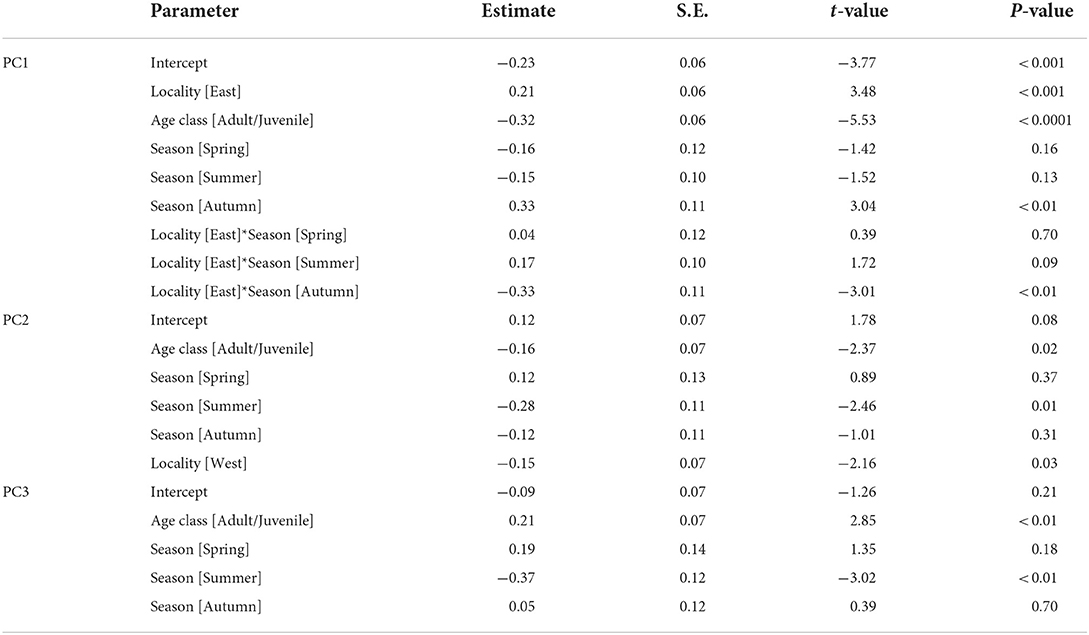
We selected the best models explaining the variation of PC1–3 by stepwise model selection using AICc (Supplementary Table S2). The best model for PC1 includes four explanatory variables: age class, locality (east or west), season, and interaction of locality*season, whereas that for PC2 shares the same variables but lacks the interaction term (locality*season). On the other hand, only age class and season are included in the best model for PC3. The parameter estimates of the best models for PC1, PC2, and PC3 are presented in Table 5. These results indicate habitat-related differences in DMT are reflected in PC1 and PC2 but not in PC3. Considering the fact that PC3 contributed a smaller amount of total variation (9.2%) than PC1 and PC2, in the following analyses, we only focused on PC1 and PC2. PC1, the proxy of overall surface roughness or size and depth of microwear features, is significantly larger in boarlets than adults/juveniles and larger in eastern Toyama than in western Toyama. Seasonal differences were detected only in western Toyama. In both age classes, the individuals collected in autumn showed significantly higher PC1 scores than in other seasons (Figure 3A). PC2 is the proxy of surface fineness, with larger values indicating that the surfaces were segmented into larger hills and dales. The parameter estimate of age class “adult/juvenile” has a negative value on PC2 (Table 5), which means the tooth surfaces of adult/juvenile are characterized by fine features. The differences between localities are also statistically significant, with the boars in the western region having lower PC2 scores (i.e., finer microwear features) than those in the eastern region. There is a significant seasonal difference only between summer and winter, i.e., the tooth surfaces of individuals collected in summer have finer features (Figure 3B).
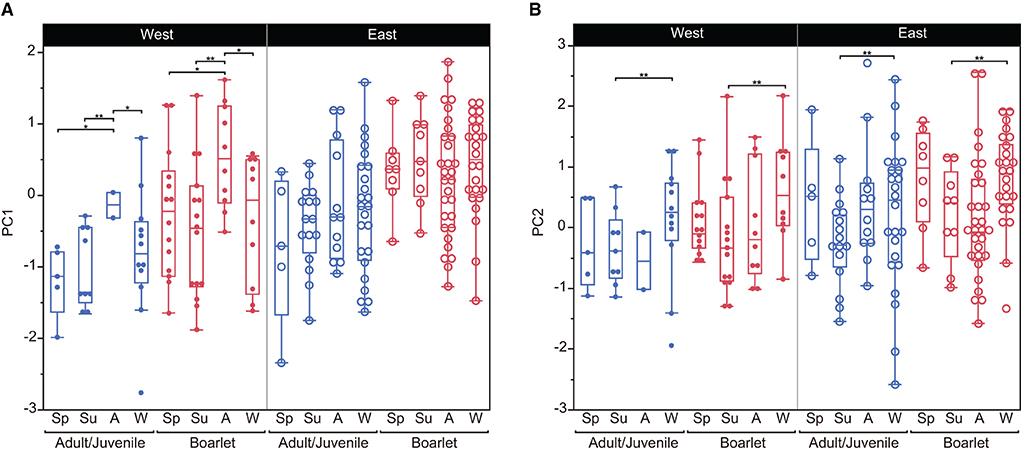
Figure 3. Comparisons of principal components (PC1 and PC2) between localities, age classes, and seasons of collection of Toyama boars. The box encloses the 25th and 75th percentiles, with the horizontal line representing the median. Whiskers (perpendicular lines stretching from the upper and lower edges of the box) show the range of observed values that fall within 1.5 times the interquartile range (the length of the box) from the upper and lower edges of the box. (A) PC1, (B) PC2. *P < 0.05, **P < 0.01. Abbreviations for seasons are Sp, spring; Su, summer; A, autumn; W, winter.
Comparisons of Toyama boars with other wild and stall-fed boar populations
After we combined all seasons for the east and west Toyama populations, a one-way ANOVA was conducted to test for differences among the six boar populations. Both PC1 and PC2 are significantly different among the populations [PC1: F(5, 135) = 24.26, P < 0.0001; PC2: F(5, 135) = 6.53, P < 0.0001; PC3: F(5, 135) = 0.95, P = 0.44]. Subsequent pairwise comparisons by the Tukey-Kramer method reveal both disparities and similarities among the populations (Figure 4). There is an explicit difference in PC1: the stall-fed boars display the highest PC1 scores, followed by two southern island populations (Iriomote and Ishigaki populations) and three mainland populations (eastern and western Toyama and Tanba). On the other hand, PC2 scores of groups overlap each other except for the stall-fed and eastern Toyama populations (Figure 4). A scatter plot of PC1 and PC2 illustrates the similarity between populations (Figure 5). The three mainland populations (eastern and western Toyama and Tanba) overlap each other, whereas the two island populations and the stall-fed show considerable overlap. The overlap between the mainland populations and the island ones is relatively small. This is exemplified by the representative 3D surface models (Figure 5). The boars from the mainland populations have overall flat and homogeneous surfaces with abundant scratches (Figures 5A–C), and the island populations have more heterogeneous surfaces with high relief (Figures 5D,E). The stall-fed individuals show high relief with heterogeneity (Figure 5F).
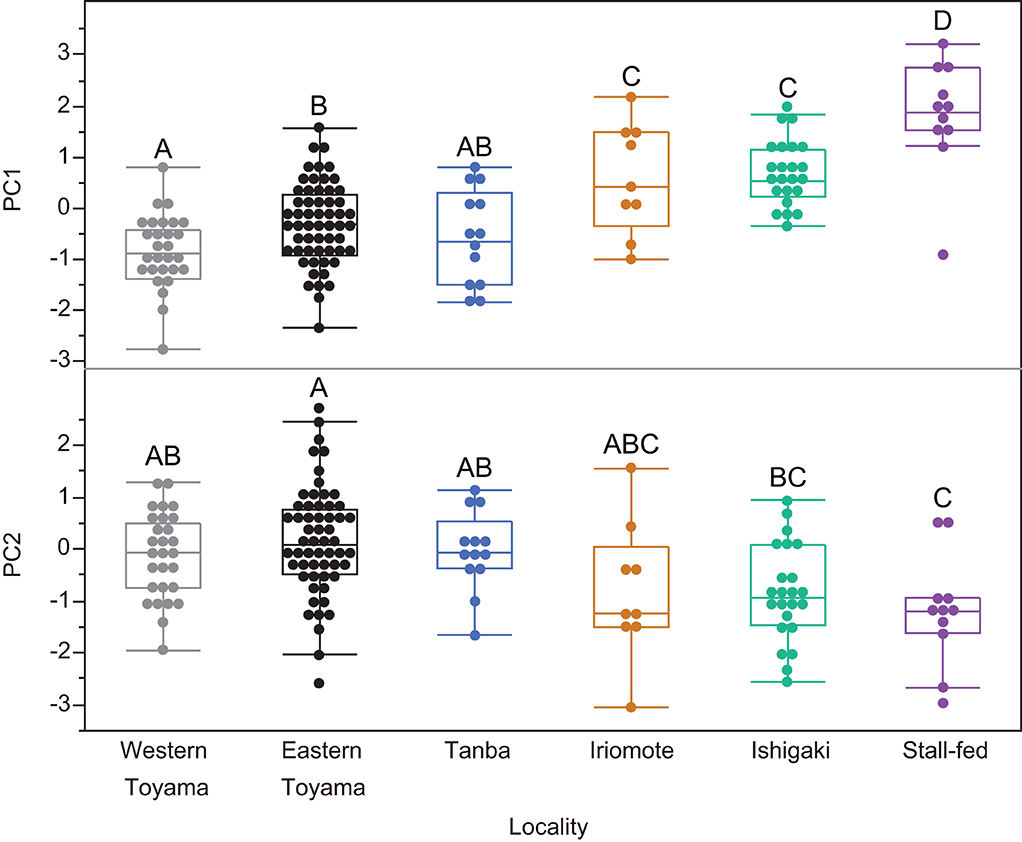
Figure 4. Comparisons of principal components (PC1 and PC2) among six wild and stall-fed boar populations. The box plot format was the same as in Figure 3. The groups with different alphabets indicate significant differences (Tukey–Kramer tests, P < 0.05).
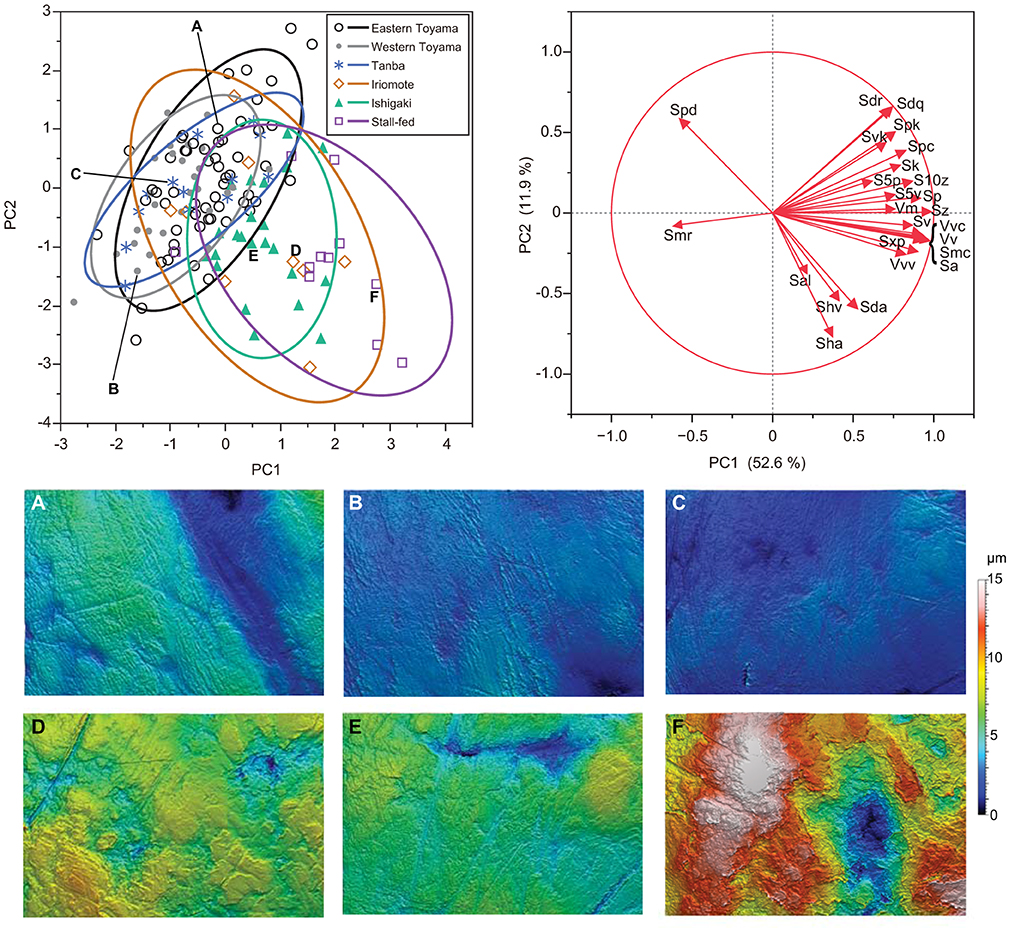
Figure 5. A scatter plot of PC1 and PC2 accompanied by the representative 3D surface models of wild and stall-fed boars. The 90% confidence ellipse is drawn for each population. DMTA variables with factor loadings higher than 0.4 in absolute values are shown as arrows in vector mapping. Surface models are presented with the same height (z) scale. (A) Eastern Toyama (2008S-45), (B) western Toyama (2007S-11), (C) Tanba (No. 75♀), (D) Iriomote Island (M31148), (E) Ishigaki Island (OPM-102), (F) stall-fed (Ishii-16).
Discussion
Through the intensive sampling of wild-shot boars in Toyama Prefecture and comparison to other wild and stall-fed populations, this study clarified the difference in DMT of S. scrofa, both at the finer and broader geographical scales. In the following discussion, we start with the comparison between geographically and ecologically different populations, then continue to the discussion on DMT differences observed within Toyama boars.
Variation among the wild boar populations in different habitat environments
As shown in Figures 4, 5, the DMT of six populations showed differentiation among the ecologically different groups, i.e., those in temperate deciduous broad-leaved forests (eastern and western Toyama and Tanba), those in subtropical evergreen broad-leaved forests (Ishigaki and Iriomote Islands), and stall-fed, and similarity within each group. The stall-fed boars have the largest PC1 scores, shown on their tooth surfaces with large and deep depressions (Figure 5F). As discussed in Yamada et al. (2018), the characteristic tooth surfaces of the stall-fed boars resulted from their feeding on corn hay in the concrete-floored stall. Crushing of hard seeds without contamination of soils is responsible for their extremely rough tooth surfaces. On the other hand, the boars from deciduous broad-leaved forests had flatter tooth surfaces with abundant scratches (Figures 5A–C). As discussed in previous studies (Ward and Mainland, 1999; Souron et al., 2015; Yamada et al., 2018), this reflects the frequent rooting of these populations. In addition to feeding on rhizomes and roots, above-ground plant parts, like bamboo shoots in spring and leaves and stems of dicots and monocots from spring to summer, were important food items for mainland boars in deciduous forests (Kodera et al., 2013; Yasuda and Yokohata, 2015). The shearing of tough and fibrous plant tissues causes dental wear with numerous scratches and more homogeneous tooth surfaces in primates (Grine and Kay, 1988; Scott et al., 2005). Therefore, it is expected that both feedings on soil-contaminated underground storage organs and fibrous above-ground plant tissues caused relatively flat and homogeneous tooth surfaces of the mainland boar populations.
Contrary to the results of Yamada et al. (2018), in which they did not find statistically significant differences between the island boars in subtropical evergreen broad-leaved forests and the stall-fed ones, we found significant differences between the two groups (Figure 4). This is probably due to our current statistical procedure, transforming PC scores to achieve normality and using parametric tests, which are more sensitive to detecting the differences than the non-parametric tests (Wilcoxon rank-sum tests) applied by Yamada et al. (2018) for most of the ISO parameter comparisons. Both island populations were not significantly different in PC scores, and their PC1 values were located between the stall-fed and the mainland populations. Based on the limited information on the feeding habits of the island boars, they feed on fruits, seeds, nuts, and crops throughout the year (Ishigaki et al., 2007; Ishigaki City, 2021). Therefore, it is expected that their mode of mastication was more inclined to crushing hard objects and pulping the succulent vegetable tissues, both of which would cause more pitted tooth surfaces. The boars from the southern islands might also be involved in rooting and feeding on leaves and stems, but the high availability of nutritionally preferred foods (fruits, seeds, and crops) in their habitats might offer them more opportunities for feeding on these items.
Variation in DMT in Toyama boars and its interpretation
In the current samples of Toyama boars, for which stomach contents were analyzed (N = 36), we did not find a clear relationship between DMT and the dietary groups defined by the major items in the stomach contents. This is not surprising because of the opportunistic feeding of the boars and the different timescales at which the two dietary signals are recorded (Davis and Pineda Munoz, 2016). Through experimental feeding trials, Winkler et al. (2020) estimated how long the turnover of DMT takes place in laboratory-reared rats. It was shown to be ~16–24 days, after which the later diets overwrote dietary signals. Therefore, the association between the stomach contents (the “last supper”) and DMT should not be apparent unless the animals had continuously been fed on the same diet for a while. In addition, the sample size of stomach content analysis might not be large enough to average and represent the dietary groups, failing to detect the group differences.
The differences between the two localities (eastern vs. western Toyama) are notable. The boars in the west of the Toyama region showed lower PC1 values than those from the eastern region (Figure 3A, Table 5), even in the broader comparison with other populations (Figure 4). This indicates that the boars in the eastern region have overall rougher tooth surfaces than the western boars. Though we did not find a direct association between the stomach content and DMT at the individual scale, this regional difference can be interpretable from the viewpoint of the habitat environment and feeding habits. Nakajima and Kobayashi (2014) investigated the distribution of forest types in Toyama Prefecture and reported that in the eastern region, natural forests, secondary forests, and planted forests tend to be distributed sequentially in this order from the mountainous areas to the low elevation areas, whereas in the western region, these different forests show a mosaic distribution. The Toyama boars preferably consumed rhizomes of Japanese yam (Dioscorea japonica) and kudzu (Pueraria lobata) (Yasuda and Yokohata, 2015), which are more abundant in the secondary forests. Due to the mosaic distribution of the secondary forest in the western region, the boars could use the secondary forests frequently. Together with the current data of stomach content analysis (Figure 1), it suggests that the boars in the western region were involved in more frequent rooting during foraging, possibly in the secondary forests, which resulted in a flatter and more homogeneous tooth surfaces, presumably by the abrading effect of grit as suggested by Souron et al. (2015). On the other hand, the boars in the eastern region foraged on the four dietary categories in approximately equal amounts (Figure 1). A higher rate of nut consumption compared to the western boars is notable, and this corresponds to the distribution of acorn-bearing trees (Fagus crenata, Quercus crispula, and Quercus serrata) in the eastern region (Nakajima and Kobayashi, 2014). Feeding on acorns requires a high bite force for crushing kernels, which may induce the generation of large pits (Scott et al., 2005; Ungar et al., 2008; Daegling et al., 2011). In addition, rice husks were abundantly detected in the stomachs of some eastern Toyama boars (Yasuda and Yokohata, 2015). Ramdarshan et al. (2016) pointed out by their experimental feeding that the highest surface complexity was observed in a group of ewes fed with clover and barley. Therefore, it is possible that ingestion of rice husks may cause strong abrasive wear. These food items might be potential causes of the higher surface roughness in the eastern boars during the seasons when they were available (summer and autumn for rice and autumn and winter for acorns). Acorns were utilized by boars until mid-winter (December) but might disappear in late winter (Yasuda and Yokohata, 2015).
The seasonal difference in PC1 was detected only in the western region (Figure 3A, Table 5). The western boars culled in autumn showed significantly rougher tooth surfaces than those culled in other seasons. The PC1 scores of the autumn-culled individuals from the western region are comparable to those of the eastern boars: both western boarlets and juveniles/adults culled in autumn show higher PC1 scores than western boars in other seasons, but their values are similar to those of the eastern boars (Figure 3A). That means the western boars show overall less rough surfaces than the eastern boars, but the surface roughness increases to the level of the eastern boars in autumn. Therefore, it is possible that in the autumn season, the boars in the western region are involved in less rooting than in other seasons and might more frequently feed on acorns and rice, which are mostly available in autumn. Intensive rooting and feeding on underground plant parts in winter might quickly reduce the roughness of the surface in western boars.
We found significant differences between the age classes (adult/juvenile vs. boarlet). The tooth surfaces of boarlets are characterized by larger and deeper microwear features and are segmented into larger hills and dales (i.e., coarser surface texture) than adults and juveniles. This may reflect a higher frequency of tooth-tooth (= attrition) contact, which seemed to result in cracking of enamels and thus rough surfaces in sucklings and weanlings. After the boars start feeding on solid foods, food-tooth (= abrasion) contact becomes predominant and decreases overall surface roughness (i.e., flatter tooth surfaces). It is possible that progressive involvement of rooting behavior in adults also reduces surface roughness due to a polishing effect of contaminated soils. This perspective, i.e., rough and non-homogeneous tooth surfaces by frequent tooth-tooth contacts, would explain why the stall-fed boars (Yamada et al., 2018 and data shown in Figure 4) and the pigs experimentally fed on flour as the control feeding group (Louail et al., 2021) have similarly rough tooth surfaces.
We provided the first evidence of significant differences in DMT reflecting the frequency of rooting and foraging on underground plant parts at scales finer than interspecific comparisons, i.e., among populations in ecologically diverse habitats in Japan and even between geographically close but slightly different habitats. Therefore, the current data can be a reference for the foraging ecology of excavated boars/pigs from archaeological sites. As boar skeletal remains are abundantly yielded from Holocene archaeological sites in Japan (Nishimoto, 1994), investigation of DMT of these dental boar remains will shed light on their palaeoecology and human–animal relationships that have changed trough over time.
Further technical considerations of DMTA
We used 30 ISO 25178-2 parameters and resultant PCs in this study to detect DMT differences among boar populations. Though PCA successfully extracted the trends in DMT, further application of scale-sensitive fractal analysis (SSFA) would be beneficial for evaluating the more heterogeneous tooth surfaces of suids (Souron et al., 2015; Lazagabaster, 2019; Louail et al., 2021). This is reserved in the present study because of our past experiences based on ruminant DMTA, in which we found SSFA was less powerful in detecting dietary differences (Kubo et al., 2017; Kubo and Fujita, 2021), and the fact that analytical software formerly used in SSFA (Toothfrax or Sfrax) and the SSFA module now integrated into MountainsMap produce significantly different values (Calandra et al., 2021). Reanalysis of published DMT of suids analyzed by older SSFA software is mandatory when integrative comparisons are made.
Another technical issue is the replication of surface scans from the same tooth facet. In the present study, we used four single scans of 140 × 100 μm and combined them into a larger area of 208 × 144 μm. It is equivalent to the commonly used total scan size (e.g., Scott et al., 2012: single scan size of 102 × 138 μm and combined four into 204 × 276 μm; Louail et al., 2021: single scan of 200 × 200 μm per a facet; Ramdarshan et al., 2016: single scan of 333 × 251 μm was segmented into four 140 × 100 μm areas). Therefore, we consider that total areas of 208 × 144 μm can fulfill the requirements of the DMTA standard. Nevertheless, intra-facet variability in DMT exists in various mammals (e.g., Bas et al., 2020 in humans; Sawaura et al., 2022 in macaques; Ramdarshan et al., 2017 in sheep); therefore, it may also have strong effects on tooth facets of omnivorous suids. Additional scans from different spots in the same facet can increase the sample size, control the intra-facet variability, and then make the statistical tests more sensitive, especially when we apply statistical tests with nested structures.
Conclusion
In this study, we compared the tooth microwear texture of wild boars from six populations in Japan. Detailed ecological and dietary information from stomach content analysis was available for Toyama populations, allowing us to test the effects of ecological variables on DMT. As expected, we did not find a correlation between stomach content and DMT at the individual level, but the dietary difference between localities was detected, even between locations with geographical proximity. The tooth surfaces of boarlets are rougher than those of juvenile and adult animals, which cautions against the mixed usage of deciduous and permanent molars of fossil or archaeological specimens in dental microwear studies. The decrease in surface roughness with age implies that the frequency of tooth-tooth contact, which seems to result in cracking of enamels and thus rough surfaces, decreases after the boars start feeding on solid foods (food-tooth contact), with progressive involvement of rooting behavior in mature adults. We further found that surface roughness showed significant differences among localities, with the western boars having flatter surfaces, possibly due to their more intense involvement in rooting and feeding on soil-contaminated rhizomes than the eastern ones, as evidenced by the available stomach content data. The difference in rooting frequency is also evident in the broader comparison among populations with different habitat environments. The mainland boars inhabiting deciduous broad-leaved forests have flatter tooth surfaces than those in the subtropical evergreen broad-leaved forests of the southern islands. This corresponds to the fact that above-ground dietary resources are more abundant in the habitat of the southern island boars, where crops like succulent vegetables and fruits, as well as naturally fallen acorns, are abundant, whereas underground plant parts are the dominant diet component for the mainland boars. Together with the data of the boars reared under dietary control, this study suggests that DMTA can identify the difference in foraging modes in suids with great dietary variability and paves the way to estimate the frequency of rooting in semi-domesticated and free-ranging boars from archaeological sites.
Data availability statement
The original data presented in the study are included in the main text and the Supplementary materials. We also uploaded 1) the original scan data of all individuals in common 3D surface format (“.sur” format) and 2) 3D surface analytical files including raw scans and procedures of analyses in DMTA standard format (“.mnt”) to online repository (Zenodo). DOI of the scan data files is: https://doi.org/10.5281/zenodo.6965607.
Ethics statement
Ethical review and approval were not required for this study because we used the stored skeletal specimens of boars collected by nuisance culls and the published resources of the previous studies.
Author contributions
KM: conceptualization, investigation, formal analysis, and writing—original draft preparation. MOK: conceptualization, investigation, formal analysis, data curation, visualization, and writing—original draft preparation. YY: resources, data curation, and writing—review and editing. All authors contributed to the article and approved the submitted version.
Funding
This study was partially funded by the JSPS KAKENHI Grant (No. 16K18615) to MOK.
Acknowledgments
We are grateful to the following people for their assistance during this study: Yamada, E. for sharing the published DMT data of wild boars, Yasuda, A., and the members of Yokohata Laboratory, and the University of Toyama for valuable assistance with collections of skull specimens of wild boars. The comments from two reviewers (AS and IC) improved the manuscript greatly, and we appreciate their constructive comments.
Conflict of interest
The authors declare that the research was conducted in the absence of any commercial or financial relationships that could be construed as a potential conflict of interest.
Publisher's note
All claims expressed in this article are solely those of the authors and do not necessarily represent those of their affiliated organizations, or those of the publisher, the editors and the reviewers. Any product that may be evaluated in this article, or claim that may be made by its manufacturer, is not guaranteed or endorsed by the publisher.
Supplementary material
The Supplementary Material for this article can be found online at: https://www.frontiersin.org/articles/10.3389/fevo.2022.957646/full#supplementary-material
References
Ackermans, N. L., Winkler, D. E., Martin, L. F., Kaiser, T. M., Clauss, M., Hatt, J. M., et al. (2020). Dust and grit matter: abrasives of different size lead to opposing dental microwear textures in experimentally fed sheep (Ovis aries). J. Exp. Biol. 223, jeb.220442. doi: 10.1242/jeb.220442
Ackermans, N. L., Winkler, D. E., Schulz-Kornas, E., Kaiser, T. M., Martin, L. F., Hatt, J. M., et al. (2021). Dental wear proxy correlation in a long-term feeding experiment on sheep (Ovis aries). J. R. Soc. Interface 18, 20210139. doi: 10.1098/rsif.2021.0139
Aiba, K., Miura, S., and Kubo, M. O. (2019). Dental Microwear texture analysis in two ruminants, Japanese Serow (Capricornis crispus) and Sika Deer (Cervus nippon), from Central Japan. Mammal Study 44, 183–192. doi: 10.3106/ms2018-0081
Arman, S. D., Prowse, T. A. A., Couzens, A. M. C., Ungar, P. S., and Prideaux, G. J. (2019). Incorporating intraspecific variation into dental microwear texture analysis. J. R. Soc. Interface 16, 20180957. doi: 10.1098/rsif.2018.0957
Arman, S. D., Ungar, P. S., Brown, C. A., DeSantis, L. R. G., Schmidt, C., Prideaux, G. J., et al. (2016). Minimizing inter-microscope variability in dental microwear texture analysis. Surface Topogr. Metrol Propert. 4, 024007. doi: 10.1088/2051-672X/4/2/024007
Asahi, M. (1975). Stomach contents of wild boars (Sus scrofa leucomystax) in winter. J. Mammal. Soc. Jpn. 6, 115–120.
Bas, M., Le Luyer, M., Kanz, F., Rebay-Salisbury, K., Queffelec, A., Souron, A., et al. (2020). Methodological implications of intra- and inter-facet microwear texture variation for human childhood paleo-dietary reconstruction: insights from the deciduous molars of extant and medieval children from France. J. Archaeol. Sci. Rep. 31, 102284. doi: 10.1016/j.jasrep.2020.102284
Bestwick, J., Unwin, D. M., and Purnell, M. A. (2019). Dietary differences in archosaur and lepidosaur reptiles revealed by dental microwear textural analysis. Sci. Rep. 9, 11691. doi: 10.1038/s41598-019-48154-9
Burnham, K. P., and Anderson, D. R. (1998). Model Selection and Inference: A Practical Information-Theoretic Approach. New York, NY: Springer. doi: 10.1007/978-1-4757-2917-7
Calandra, I., Bob, K., Merceron, G., Blateyron, F., Hildebrandt, A., Schulz-Kornas, E., et al. (2021). Dental microwear texture analysis in Toothfrax and Mountains Map® SSFA module: different software packages, different results? bioRxiv [Preprint]. doi: 10.5281/zenodo6669276
Calandra, I., and Merceron, G. (2016). Dental microwear texture analysis in mammalian ecology. Mamm. Rev. 46, 215–228. doi: 10.1111/mam.12063
Daegling, D. J., McGraw, W. S., Ungar, P. S., Pampush, J. D., Vick, A. E., Bitty, E. A., et al. (2011). Hard-object feeding in sooty mangabeys (Cercocebus atys) and interpretation of early hominin feeding ecology. PLoS ONE 6, e23095. doi: 10.1371/journal.pone.0023095
Davis, M., and Pineda Munoz, S. (2016). The temporal scale of diet and dietary proxies. Ecol. Evol. 6, 1883–1897. doi: 10.1002/ece3.2054
Desantis, L. R., and Haupt, R. J. (2014). Cougars' key to survival through the Late Pleistocene extinction: insights from dental microwear texture analysis. Biol. Lett. 10, 20140203. doi: 10.1098/rsbl.2014.0203
DeSantis, L. R., Scott, J. R., Schubert, B. W., Donohue, S. L., McCray, B. M., Van Stolk, C. A., et al. (2013). Direct comparisons of 2D and 3D dental microwear proxies in extant herbivorous and carnivorous mammals. PLoS ONE 8, e71428. doi: 10.1371/journal.pone.0071428
Evin, A., Cucchi, T., Cardini, A., Strand Vidarsdottir, U., Larson, G., Dobney, K., et al. (2013). The long and winding road: identifying pig domestication through molar size and shape. J. Archaeol. Sci. 40, 735–743. doi: 10.1016/j.jas.2012.08.005
Gill, P. G., Purnell, M. A., Crumpton, N., Brown, K. R., Gostling, N. J., Stampanoni, M., et al. (2014). Dietary specializations and diversity in feeding ecology of the earliest stem mammals. Nature 512, 303–305. doi: 10.1038/nature13622
Grine, F. E., and Kay, R. F. (1988). Early hominid diets from quantitative image analysis of dental microwear. Nature 333, 765–768. doi: 10.1038/333765a0
Halley, D. J., and Rosvold, J. (2014). Stable isotope analysis and variation in medieval domestic pig husbandry practices in northwest Europe: absence of evidence for a purely herbivorous diet. J. Archaeol. Sci. 49, 1–5. doi: 10.1016/j.jas.2014.04.006
Hayashi, Y., Nishida, T., and Mochizuki, K. (1977). Sex and age determination of the Japanese wild boar (Sus scrofa leucomystax) by the lower teeth. Jpn. J. Vet. Sci. 39, 165–174. doi: 10.1292/jvms1939.39.165
Ishigaki City (2021). Management plan for prevention of agricultural damage by wild animals in Ishigaki City. Ishigaki City: Ishigaki City, 12.
Ishigaki, C., Shinzato, T., Aramoto, M., and Wu, L. (2007). Feed plant, dressing and utilization of carcass of Ryukyuan wild boar in Iriomote Island. Sci. Bull. Faculty Agricul. Univ. Ryukyus 54, 23–27.
Kodera, Y., Kanzaki, N., Ishikawa, N., and Minagawa, A. (2013). Food habits of wild boar (Sus scrofa) inhabiting Iwami District, Shimane Prefecture, western Japan. Honyurui Kagaku 53, 279–287. doi: 10.11238/mammalianscience.53.279
Kodera, Y., Takeda, T., Tomaru, S., and Sugita, S. (2012). The estimation of birth periods in wild boar by detailed aging. Honyurui Kagaku 52, 185–191. doi: 10.11238/mammalianscience.52.185
Kubo, M. O., and Fujita, M. (2021). Diets of Pleistocene insular dwarf deer revealed by dental microwear texture analysis. Palaeogeogr. Palaeoclimatol. Palaeoecol. 562, 110098. doi: 10.1016/j.palaeo.2020.110098
Kubo, M. O., Yamada, E., Kubo, T., and Kohno, N. (2017). Dental microwear texture analysis of extant sika deer with considerations on inter-microscope variability and surface preparation protocols. Biosurface Biotribol. 3, 155–165. doi: 10.1016/j.bsbt.2017.11.006
Larson, G., Albarella, U., Dobney, K., Rowley-Conwy, P., Schibler, J., Tresset, A., et al. (2007). Ancient DNA, pig domestication, and the spread of the Neolithic into Europe. Proc. Nat. Acad. Sci. U. S. A. 104, 15276–15281. doi: 10.1073/pnas.0703411104
Larson, G., Liu, R., Zhao, X., Yuan, J., Fuller, D., Barton, L., et al. (2010). Patterns of East Asian pig domestication, migration, and turnover revealed by modern and ancient DNA. Proc. Natl. Acad. Sci. U. S. A. 107, 7686–7691. doi: 10.1073/pnas.0912264107
Lazagabaster, I. A. (2019). Dental microwear texture analysis of Pliocene Suidae from Hadar and Kanapoi in the context of early hominin dietary breadth expansion. J. Hum. Evol. 132, 80–100. doi: 10.1016/j.jhevol.2019.04.010
Louail, M., Ferchaud, S., Souron, A., Walker, A. E. C., and Merceron, G. (2021). Dental microwear textures differ in pigs with overall similar diets but fed with different seeds. Palaeogeogr. Palaeoclimatol. Palaeoecol. 572, 110415. doi: 10.1016/j.palaeo.2021.110415
Merceron, G., Blondel, C., Brunetiere, N., Francisco, A., Gautier, D., Ramdarshan, A., et al. (2017). Dental microwear and controlled food testing on sheep: the TRIDENT project. Biosurface Biotribol. 3, 174–183. doi: 10.1016/j.bsbt.2017.12.005
Merceron, G., Escarguel, G., Angibault, J. M., and Verheyden-Tixier, H. (2010). Can dental microwear textures record inter-individual dietary variations? PLoS ONE 5, e9542. doi: 10.1371/journal.pone.0009542
Merceron, G., Hofman-Kamińska, E., and Kowalczyk, R. (2014). 3D dental microwear texture analysis of feeding habits of sympatric ruminants in the Białowieza Primeval Forest, Poland. For. Ecol. Manag. 328, 262–269. doi: 10.1016/j.foreco.2014.05.041
Minagawa, M., Matsui, A., and Ishiguro, N. (2005). Patterns of prehistoric boar Sus scrofa domestication, and inter-islands pig trading across the East China Sea, as determined by carbon and nitrogen isotope analysis. Chem. Geol. 218, 91–102. doi: 10.1016/j.chemgeo.2005.01.019
Nakajima, H., and Kobayashi, H. (2014). Distribution of forest types classified by vegetation map and distribution of private and national forest in Toyama Prefecture, Japan. Bull. Toyama For. Res. Instit. 6, 1–12.
Nishimoto, T. (1994). Differences of concept of animals between the Jomon people and the yayoi people. Bull Natl. Museum Japanese Hist. 61, 73–86.
Purnell, M., Seehausen, O., and Galis, F. (2012). Quantitative three-dimensional microtextural analyses of tooth wear as a tool for dietary discrimination in fishes. J. R. Soc. Interface 9, 2225–2233. doi: 10.1098/rsif.2012.0140
Purnell, M. A., Crumpton, N., Gill, P. G., Jones, G., and Rayfield, E. J. (2013). Within-guild dietary discrimination from 3-D textural analysis of tooth microwear in insectivorous mammals. J. Zool. 291, 249–257. doi: 10.1111/jzo.12068
Ramdarshan, A., Blondel, C., Brunetière, N., Francisco, A., Gautier, D., Surault, J., et al. (2016). Seeds, browse, and tooth wear: a sheep perspective. Ecol. Evol. 6, 5559–5569. doi: 10.1002/ece3.2241
Ramdarshan, A., Blondel, C., Gautier, D., Surault, J., and Merceron, G. (2017). Overcoming sampling issues in dental tribology: insights from an experimentation on sheep. Palaeontol. Electron. 19.3.53A, 1–19. doi: 10.26879/762
Sawaura, R., Kimura, Y., and Kubo, M. O. (2022). Accuracy of dental microwear impressions by physical properties of silicone materials. Front. Ecol. Evol. 10: 975283. doi: 10.3389/fevo.2022.975283
Schulz, E., Calandra, I., and Kaiser, T. M. (2010). Applying tribology to teeth of hoofed mammals. Scanning 32, 162–182. doi: 10.1002/sca.20181
Scott, J. R. (2012). Dental microwear texture analysis of extant African Bovidae. Mammalia 76, 157–174. doi: 10.1515/mammalia-2011-0083
Scott, R. S., Teaford, M. F., and Ungar, P. S. (2012). Dental microwear texture and anthropoid diets. Am. J. Phys. Anthropol. 147, 551–579. doi: 10.1002/ajpa.22007
Scott, R. S., Ungar, P. S., Bergstrom, T. S., Brown, C. A., Childs, B. E., Teaford, M. F., et al. (2006). Dental microwear texture analysis: technical considerations. J. Hum. Evol. 51, 339–349. doi: 10.1016/j.jhevol.2006.04.006
Scott, R. S., Ungar, P. S., Bergstrom, T. S., Brown, C. A., Grine, F. E., Teaford, M. F., et al. (2005). Dental microwear texture analysis shows within-species diet variability in fossil hominins. Nature 436, 693–695. doi: 10.1038/nature03822
Souron, A., Merceron, G., Blondel, C., Brunetière, N., Colyn, M., Hofman-Kamińska, E., et al. (2015). Three-dimensional dental microwear texture analysis and diet in extant Suidae (Mammalia: Cetartiodactyla). Mammalia 79, 279–291. doi: 10.1515/mammalia-2014-0023
Stiner, M. C., Barkai, R., and Gopher, A. (2009). Cooperative hunting and meat sharing 400-200 kya at Qesem Cave, Israel. Proc. Natl. Acad. Sci. U. S. A. 106, 13207–13212. doi: 10.1073/pnas.0900564106
Ungar, P. S., Grine, F. E., and Teaford, M. F. (2008). Dental microwear and diet of the Plio-Pleistocene hominin Paranthropus boisei. PLoS ONE 3, e2044. doi: 10.1371/annotation/195120f0-18ee-4730-9bd6-0d6effd68fcf
Vanpoucke, S., Mainland, I., De Cupere, B., and Waelkens, M. (2013). Dental microwear study of pigs from the classical site of Sagalassos (SW Turkey) as an aid for the reconstruction of husbandry practices in ancient times. Environ. Archaeol. 14, 137–154. doi: 10.1179/146141009X12481709928328
Ward, J., and Mainland, I. L. (1999). Microwear in modern rooting and stall-fed pigs: the potential of dental microwear analysis for exploring pig diet and management in the past. Environ. Archaeol. 4, 25–32. doi: 10.1179/env.1999.4.1.25
Winkler, D. E., Schulz-Kornas, E., Kaiser, T. M., Codron, D., Leichliter, J., Hummel, J., et al. (2020). The turnover of dental microwear texture: testing the “last supper” effect in small mammals in a controlled feeding experiment. Palaeogeogr. Palaeoclimatol. Palaeoecol. 557, 109930. doi: 10.1016/j.palaeo.2020.109930
Winkler, D. E., Schulz-Kornas, E., Kaiser, T. M., and Tutken, T. (2019). Dental microwear texture reflects dietary tendencies in extant Lepidosauria despite their limited use of oral food processing. Proc. Biol. Sci. 286, 20190544. doi: 10.1098/rspb.2019.0544
Yamada, E., Hongo, H., and Endo, H. (2021). Analyzing historic human-suid relationships through dental microwear texture and geometric morphometric analyses of archaeological suid teeth in the Ryukyu Islands. J. Archaeol. Sci. 132, 105419. doi: 10.1016/j.jas.2021.105419
Keywords: Sus scrofa, ISO 25178, tooth wear, rooting, diets, foraging ecology, boars, pigs
Citation: Miyamoto K, Kubo MO and Yokohata Y (2022) The dental microwear texture of wild boars from Japan reflects inter- and intra-populational feeding preferences. Front. Ecol. Evol. 10:957646. doi: 10.3389/fevo.2022.957646
Received: 31 May 2022; Accepted: 17 August 2022;
Published: 28 October 2022.
Edited by:
Eduardo Jiménez-Hidalgo, University of the Sea, MexicoReviewed by:
Antoine Souron, UMR5199 De la Prehistoire A l'actuel Culture, Environnement et Anthropologie (PACEA), FranceIvan Calandra, Romano-Germanic Central Museum, Germany
Copyright © 2022 Miyamoto, Kubo and Yokohata. This is an open-access article distributed under the terms of the Creative Commons Attribution License (CC BY). The use, distribution or reproduction in other forums is permitted, provided the original author(s) and the copyright owner(s) are credited and that the original publication in this journal is cited, in accordance with accepted academic practice. No use, distribution or reproduction is permitted which does not comply with these terms.
*Correspondence: Mugino O. Kubo, bXVnaW5vQGsudS10b2t5by5hYy5qcA==
†Present Address: Kohga Miyamoto, Technology Research Institute, Obayashi Co., Tokyo, Japan
‡These authors have contributed equally to this work and share first authorship
 Kohga Miyamoto1†‡
 Mugino O. Kubo