- 1School of Geographical Sciences, Changchun Normal University, Changchun, China
- 2Northeast Institute of Geography and Agroecology, Chinese Academy of Sciences, Changchun, China
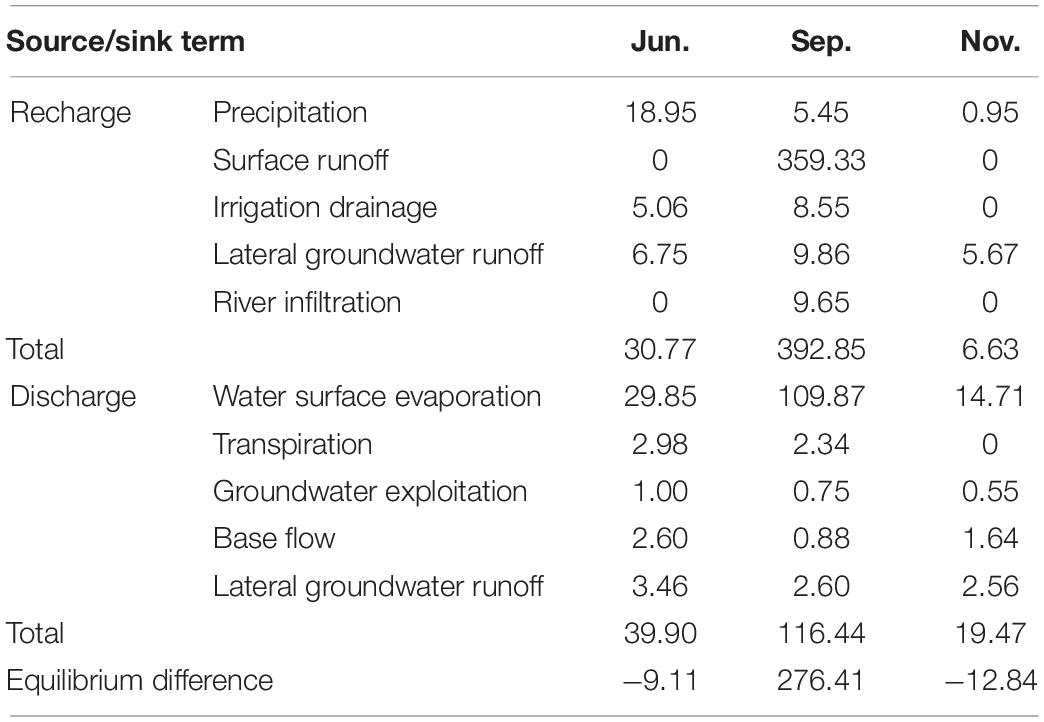
Hydrological connectivity in wetland ecosystems comprises a combination of hydrodynamic, hydrochemical, and biological characteristics. Hydrodynamic characteristics are important for the transmission of energy, matter, and information between surface water bodies and are critical for maintaining the health of wetland ecosystems. The hydrodynamic characteristics of wetlands are the temporal and spatial changes in the water level, flow direction, quantity, recharge, and discharge conditions of surface water and groundwater. Identifying wetland hydrodynamic characteristics is of great significance in revealing the hydrological patterns and biogeochemical phenomena of wetland ecosystems. The Momoge National Nature Reserve (MNNR) is a wetland located in the semi-arid region of northeast China, where the hydrodynamic characteristics are still unclear. In this study, water level monitoring of surface water and groundwater in MNNR was carried out, and wetland recharge and discharge were calculated according to a water balance analysis. The submerged wetland area was simulated based on an improved distributed hydrological model, SWAT-DSF, and compared with remote sensing data. The results showed that the dynamic characteristics of wetland surface water and groundwater are mostly affected by topography and recharge water sources. The water resources in the reserve are in a positive state of equilibrium in the wet season (September), with an equilibrium difference of 276.41 × 10⁴ m3/day. However, it displays a negative equilibrium state in dry (November) and other (June) seasons, with an equilibrium difference of −12.84 × 10⁴ m3/day and −9.11 × 10⁴ m3/d, respectively. The difference between the submerged areas of the MNNR wetland during the wet and dry seasons was 250 km2.
Introduction
Wetlands, often vividly described as the “kidneys of the Earth” are a critical part of the surface covering of our planet. Wetlands, forests, and oceans are three major ecosystems with irreplaceable functions (Mitsch et al., 2009; Keddy, 2010). Unfortunately, the global wetland area has decreased by nearly 70% since the beginning of the 20th century (Davidson, 2014; Hu et al., 2017), resulting in a sharp decline in the service functions of wetland ecosystems. Countries worldwide have signed the Ramsar Convention on Wetlands to deal with and prevent further deterioration. Therefore, the protection and restoration of wetlands have become crucial issues for global research (Wang Q. et al., 2021; Xi et al., 2021). Wetlands comprise interconnected terrestrial and aquatic ecosystems (Lu et al., 2020; Guo et al., 2021). Inevitably, water plays a critical role in the formation, development, succession, and extinction of wetlands. In particular, hydrological processes are essential for maintaining the balance of regional water resources and the health of wetland ecosystems (Johnston, 2020; Makungu and Hughes, 2021). Most of the transmission of matter, energy, and information is related to wetland hydrological processes and water cycles. Therefore, hydrodynamic characteristics govern the stability and self-maintenance of wetland ecosystems (Singh and Sinha, 2019).
The hydrodynamic characteristics of wetlands include temporal and spatial changes in the water level, flow direction, and water quantity, as well as the recharge and discharge conditions of wetland groundwater and surface water. Hydrodynamic processes are critical in the formation and development of wetland ecosystems and habitat patterns by reshaping wetland topography, changing habitat distribution structures, and disturbing the physical and chemical properties. They shape wetland topography and geomorphology mostly through the erosion and deposition of sediment carried by water flow. For example, the alternating distribution of shoals and deep troughs is caused by variations in flow velocity, erosion, and accumulation. While flow erosion creates the topography of deep water areas, accumulation creates the shoals (Eulie et al., 2021). Changes in hydrodynamics affect and control the distribution pattern and succession of the wetland plant community. At the local scale, water level, flow state, and other hydrological conditions cause water stress to plants in wetlands, affect plant growth, morphological characteristics, and biomass. In addition, it determines the spatial distribution pattern of wetland plants. Hydrological processes affect the evolution of wetland topography by regulating the distribution pattern of wetland plant communities and the interaction between nutrients and carbon fluxes. Hydrological processes determine the essential properties and specific ecosystem structure and function of wetlands (Evenson et al., 2018a; Qi et al., 2021; Wu et al., 2021).
Groundwater is an essential form of water and energy source for wetland ecosystems. In addition to precipitation, the groundwater spatial-temporal variability and groundwater table changes are usually driven by evaporation and transpiration (Roulet, 1990; Carlson Mazur et al., 2020; Galliari et al., 2021). Moreover, they are accompanied by changes in the structure, distribution, and development of wetland vegetation and biological communities (Budzisz et al., 2017; Chen et al., 2021). However, descriptions of underground hydrological processes are often ignored or simplified in traditional wetland research. As a result, the transformation and circulation of materials and energy between wetland and groundwater systems remain poorly understood. Thus, further research on their interaction and ecological effects is required.
The complex interactions of multi-element, multi-scale, and multi-process wetland ecosystems and the dynamic matching of hydrological, biological, and ecological processes from the viewpoint of hydrological connectivity are important problems to be solved in wetland science. Hydrodynamic processes are the basic elements of wetland ecosystems. Based on hydrogeological conditions, topographic features, and anthropogenic disturbances, the objectives of this study are as follows: (1) to analyze the characteristics of wetland surface water and groundwater levels and calculate wetland recharge and discharge based on water balance analysis, (2) to simulate the evolutionary process of submerged wetland areas, and (3) to clarify the horizontal and vertical hydrodynamic characteristics of the Momoge National Nature Reserve (MNNR). The results will provide an important basis for exploring the distribution and evolution of wetland hydrochemical characteristics to achieve the goal of a continuous process, complete structure, and stable function of wetland ecosystems.
Materials and Methods
Study Area
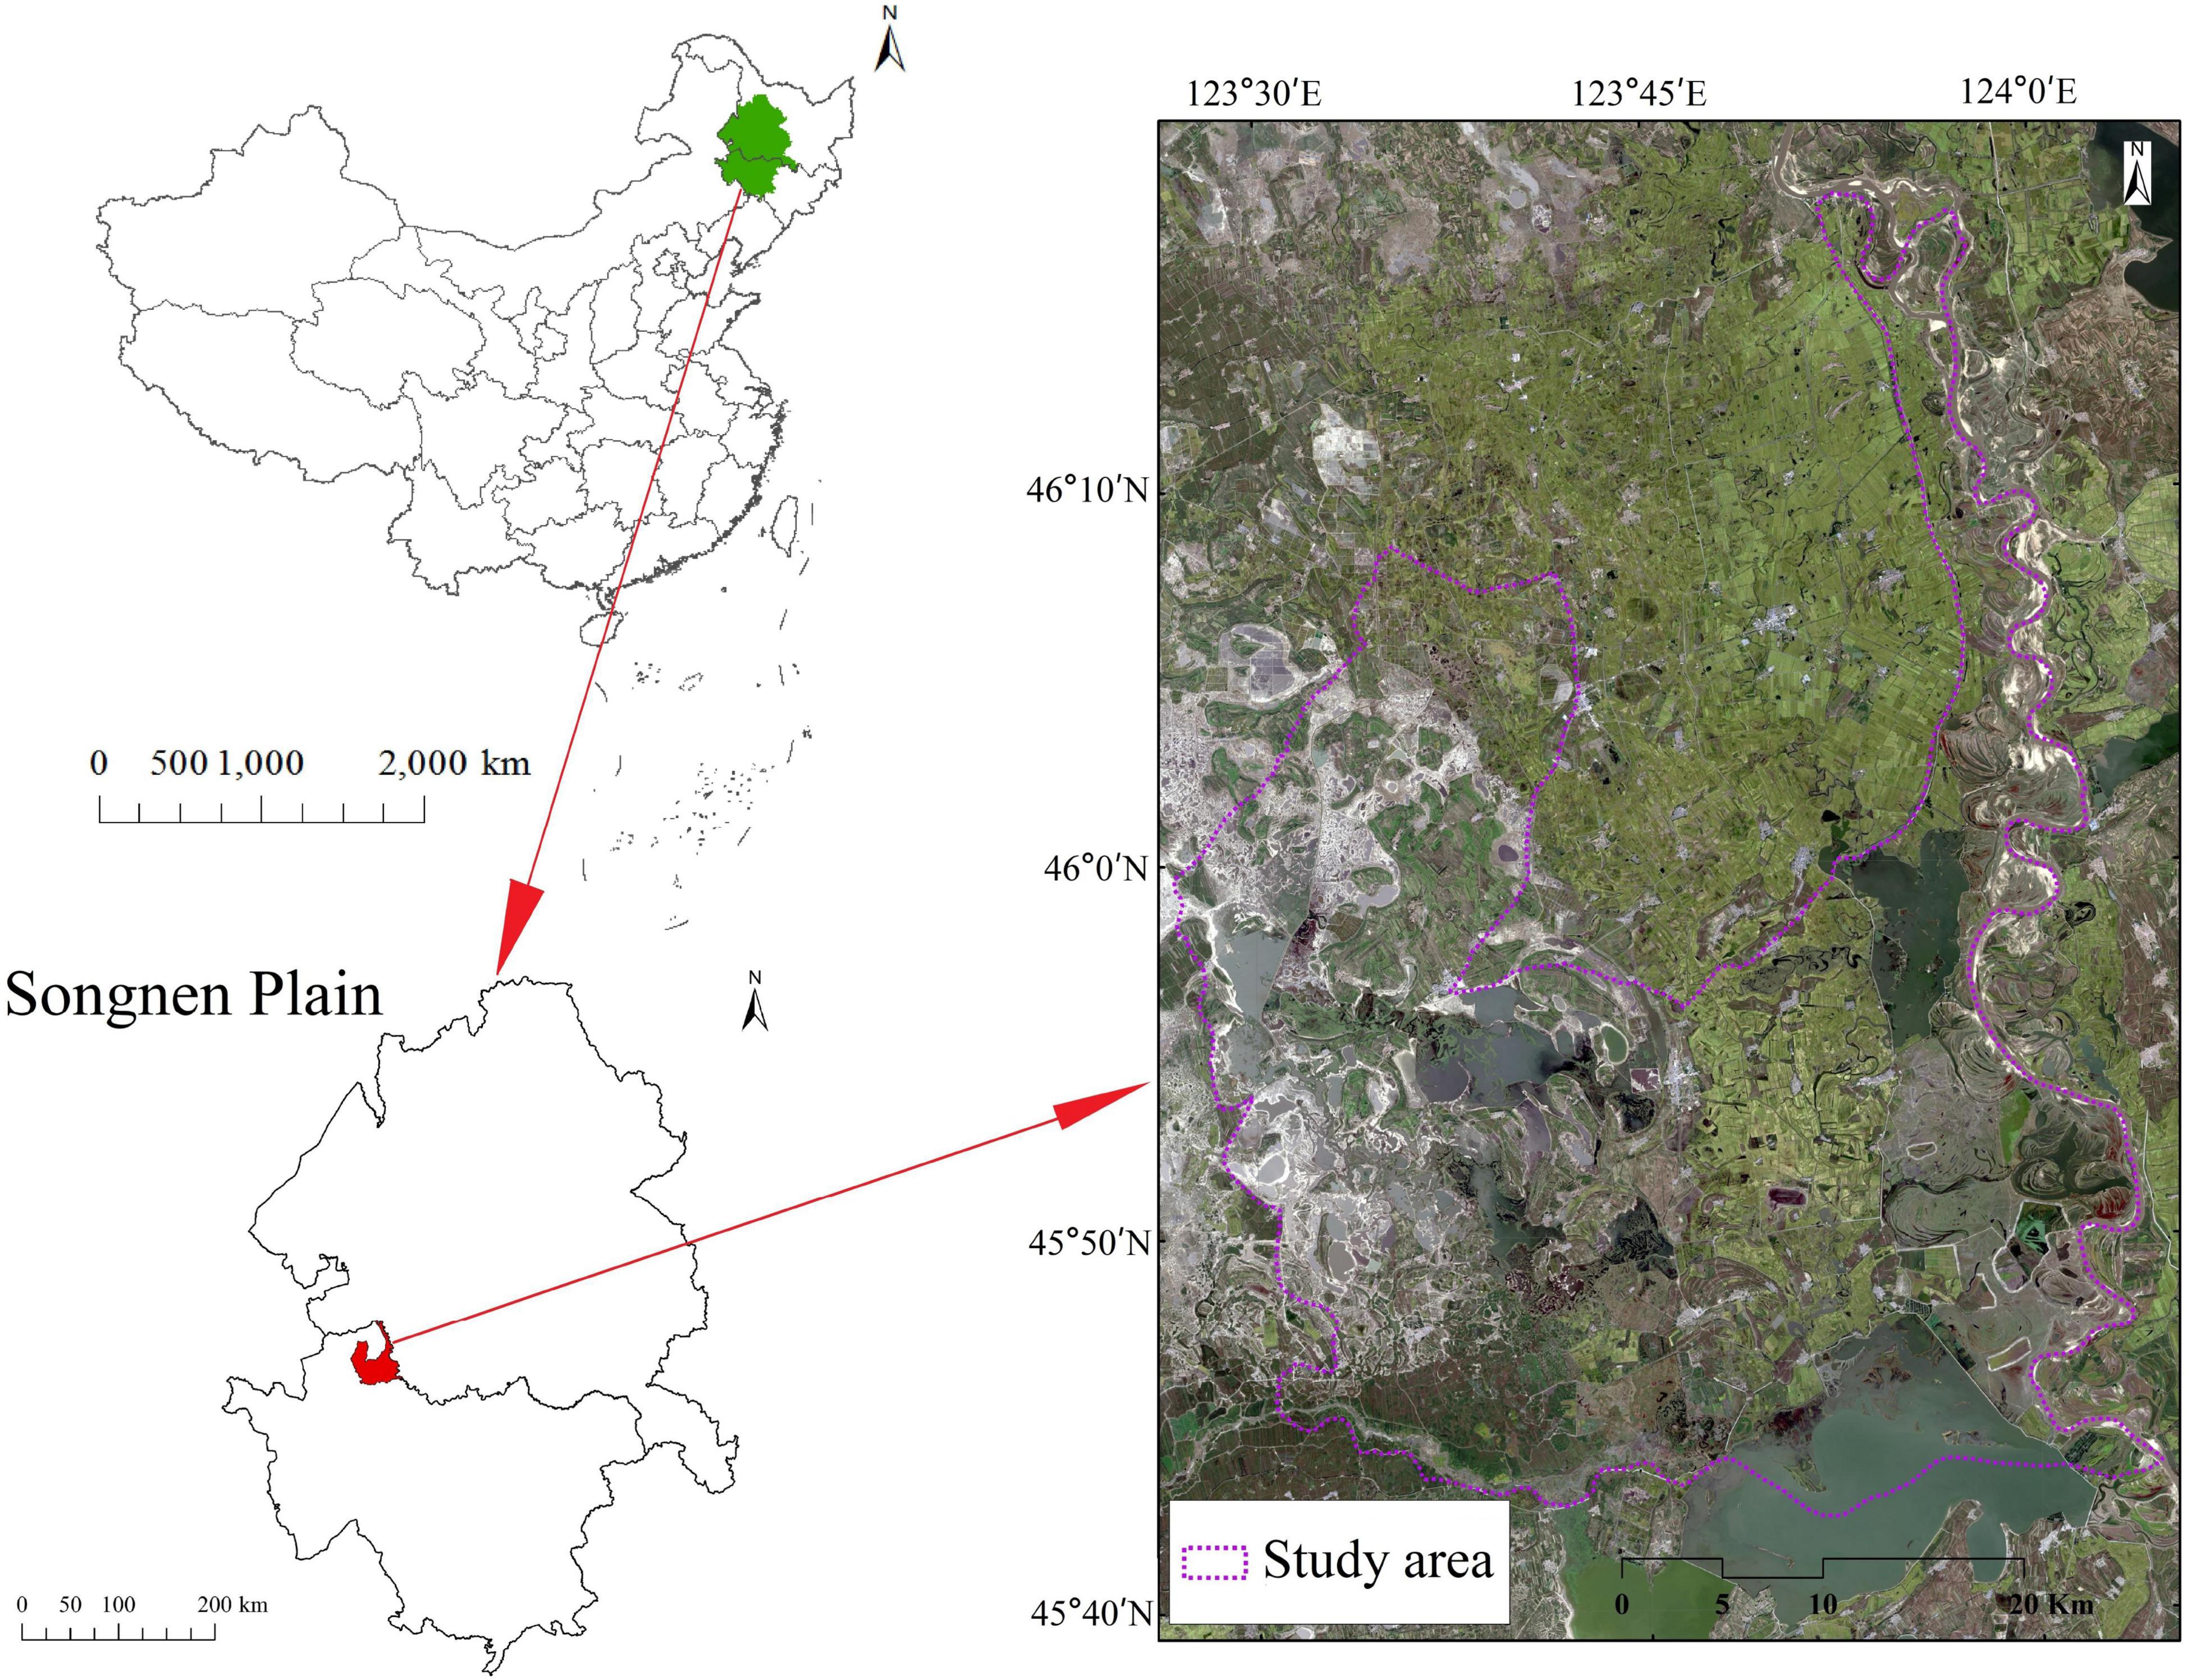
Momoge National Nature Reserve is an inland wetland and water ecosystem reserve in the saline-alkali land of western Jilin Province, China, with a total area of 1,440 km2 from 45°4225″ to 46°18″N and 123°27′0″ to 124°4′33.7″E, respectively. The Nenjiang River flows from north to south and serves as the eastern boundary of the MNNR (Figure 1). The altitude of the reserve is between 100 and 171 m, and the land is generally high in the northwest and low in the southeast. There are several small and large lakes surrounded by uplands in western MNNR. However, the eastern part is relatively flat with a relative elevation difference of only 2–5 m. The MNNR is located in a semi-arid region and has a temperate continental monsoon climate with an average annual temperature of 4.2°C. The highest temperature occurs in July, with an average temperature of 23.5°C, and the lowest temperature occurs in January, with an average temperature of −17.4°C. The average annual precipitation is 391.8 mm. Generally, precipitation is relatively concentrated from June to September, reaching 300 mm and accounting for 76.6% of the annual precipitation. The average annual evaporation was 1,585.1 mm, with the highest evaporation in May.
Field Monitoring
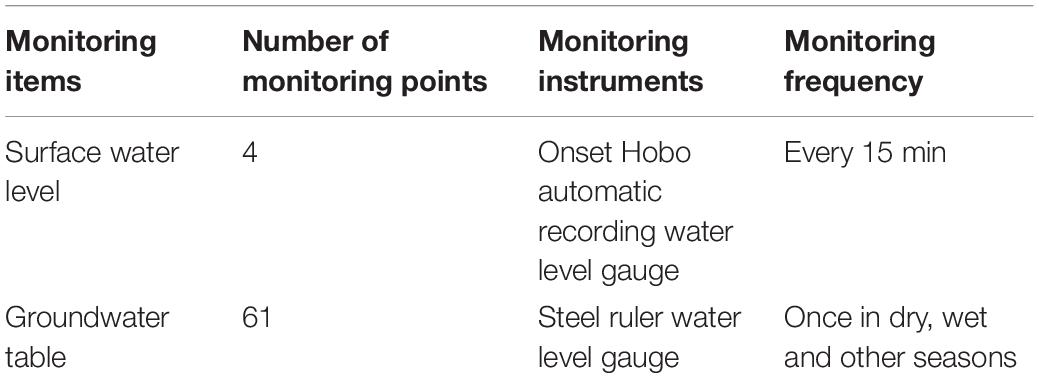
To understand the water level fluctuation and hydrodynamic characteristics of natural water in the study area, a detailed hydrogeological survey was conducted in and around the MNNR. Sixty-one groundwater table monitoring points were arranged to cover the entire area using existing boreholes, civil wells, and exploration wells. Four water level gauges were arranged in the wetlands from west to east within the MNNR to monitor the surface water level continuously (Figure 2).
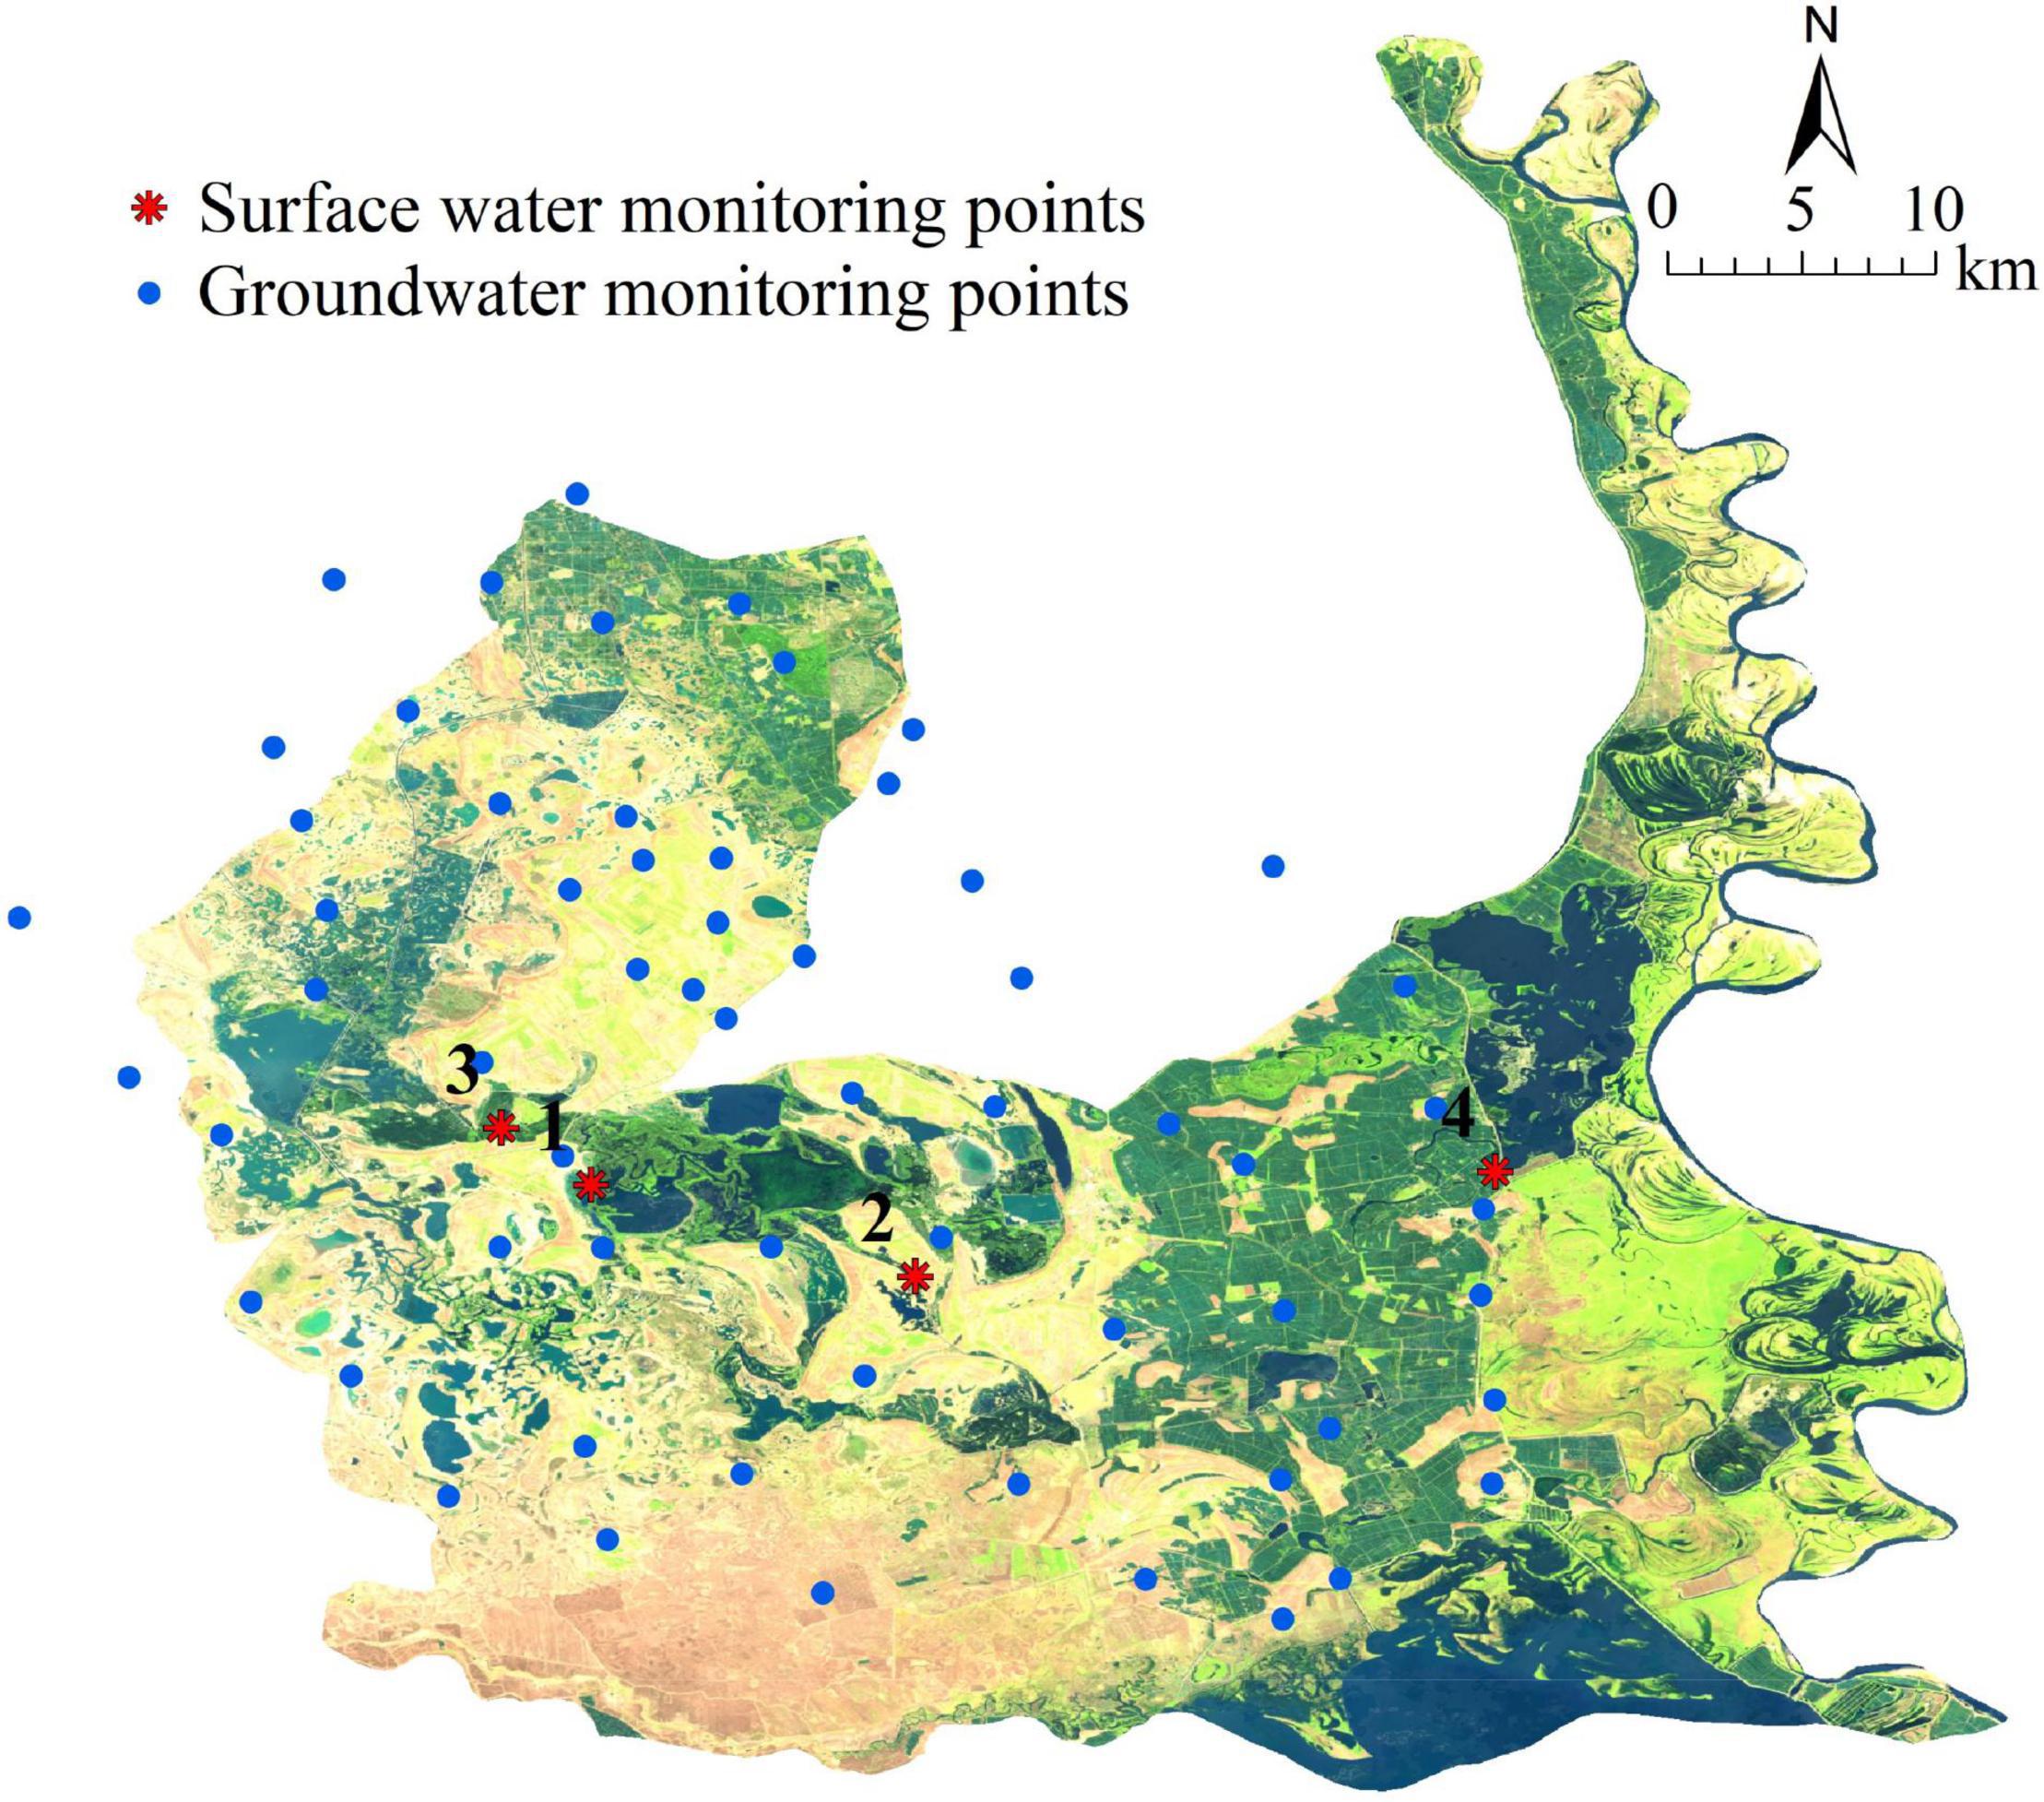
Figure 2. Distribution of surface water level loggers and groundwater table monitoring sites (Image source: Landsat 8TM band 654 false-color combination, imaging date: June 20, 2019).
The groundwater table was measured in June, September, and November 2019. The specific work-monitoring means and frequencies are listed in Table 1. Combining continuous groundwater table monitoring data collected from two monitoring points, Yinghua and Dongerlong, the regional multi-dimensional hydrodynamic characteristics were ascertained based on the hydrological and hydrogeological conditions and water level fluctuation at the above monitoring points.
Analysis of Water Balance in Momoge National Nature Reserve
The water budget in the dry (November), wet (September), and other (June) seasons, including surface water and shallow groundwater, of the study area was calculated using the water balance equation:
where, △Q is the variation in the water resources in the study area during the equilibrium period (m3/day), Qin is the recharge of water resources during the equilibrium period (m3/day), and Qout is the discharge of water resources during the equilibrium period (m3/day).
According to the actual situation in the MNNR, the water balance equation can be specified as:
where, △Q is the change in water resources storage in MNNR; QP is the precipitation recharge; QC is the recharge of farmland drainage; QS is the recharge of river flooding; EW is the water surface evaporation; Et is transpiration; W is groundwater extraction; GW is the lateral groundwater runoff; a positive value indicates that the groundwater recharge from the outside of the MNNR to the interior is greater than the groundwater discharge; on the contrary, a negative value indicates that the groundwater discharge is greater than the groundwater recharge; QG–S is the exchange flux between groundwater and Nenjiang River; a positive value indicates that the groundwater recharges the river, and a negative value indicates that the river recharges the groundwater. The units of the above elements are m3/day, and each element is calculated according to existing data and calculation formulas.
Simulation of Wetland Hydrological Process
The improved distributed hydrological model SWAT-DSF (Depressional Storage and Flows, DSF; Evenson et al., 2018b) was utilized to simulate the wetland hydrological processes. Based on the improved SWAT model proposed by Evenson et al. (2016), three hydrological response units (HRUs) are established in the model: depressional HRUs, non-depressional HRUs discharged by the depression unit, and non-depressional HRUs discharged directly into the sub-basin. The wetland in the depression unit was simulated using the following water-balance equation:
where, △V is the variation in wetland water storage (m3/day), P is the precipitation on the wetland submerged area that changes with time (m3/day), ET is the evapotranspiration in the wetland submerged area (m3/day), QSurf is the runoff flowing in from the non-depression unit in the higher terrain (m3/day), QSpill is the surface water outflow (m3/day) leaving the wetland via the delineated outlet for spillage (i.e., when wetland storage capacity is exceeded).
The upland portion of the depressional HRU (i.e., the upland area surrounding the wetland and contained within the HRU depressional boundary) was simulated as having the following water balance:
where, △S is the daily water volume change (m3/day) in the HRU (in the soil profile, shallow aquifer, and deep aquifer), P is precipitation (m3/day) on the upland portion of the HRU, ET is evapotranspiration (m3/day) from the upland portion of the HRU, Qlat, in is subsurface inflow (m3/day) entering the soil profile from upgradient HRUs, Qlat, out is the subsurface outflow (m3/day) leaving the HRU and entering either a downgradient depressional HRU or the reach, Qgw is groundwater outflow (m3/day) leaving shallow and deep aquifers and entering the reach, and Qlocal is the net subsurface flow (m3/day) entering (+) or leaving (−) the upland portion via local exchange with a wetland.
Qlocal is simulated as:
where, Ksat,w is the saturated hydraulic conductivity (m/day) of the wetland sediments, ywt is the upland groundwater height, ywet is the wetland surface water level, SADarcy is the dynamic submerged area of the wetland, rw,max is the radius at which the wetland reaches the maximum area, and α and β are the correction parameters.
Due to limitations of the runoff data, the data from June 2006 to June 2013 were selected to run the model (with June 2006 to June 2010 and July 2010 to June 2013 as the verification periods). Moreover, we utilized the water body coverage area, calculated by the algorithm based on the Google Earth Engine platform in our previous study (Cui et al., 2021) as the verification data.
The results directly reflected the applicability of the model to the study area. The relative error, percent bias (PBIAS), certainty coefficient, R2, and Nash efficiency coefficient (NSE) were selected to evaluate the simulation results of the model in this study.
where, is the observed value, the simulated value, Qobs is the average of the observed values, and Qsim the average of the simulated values.
Results
Changes in Surface Water Level
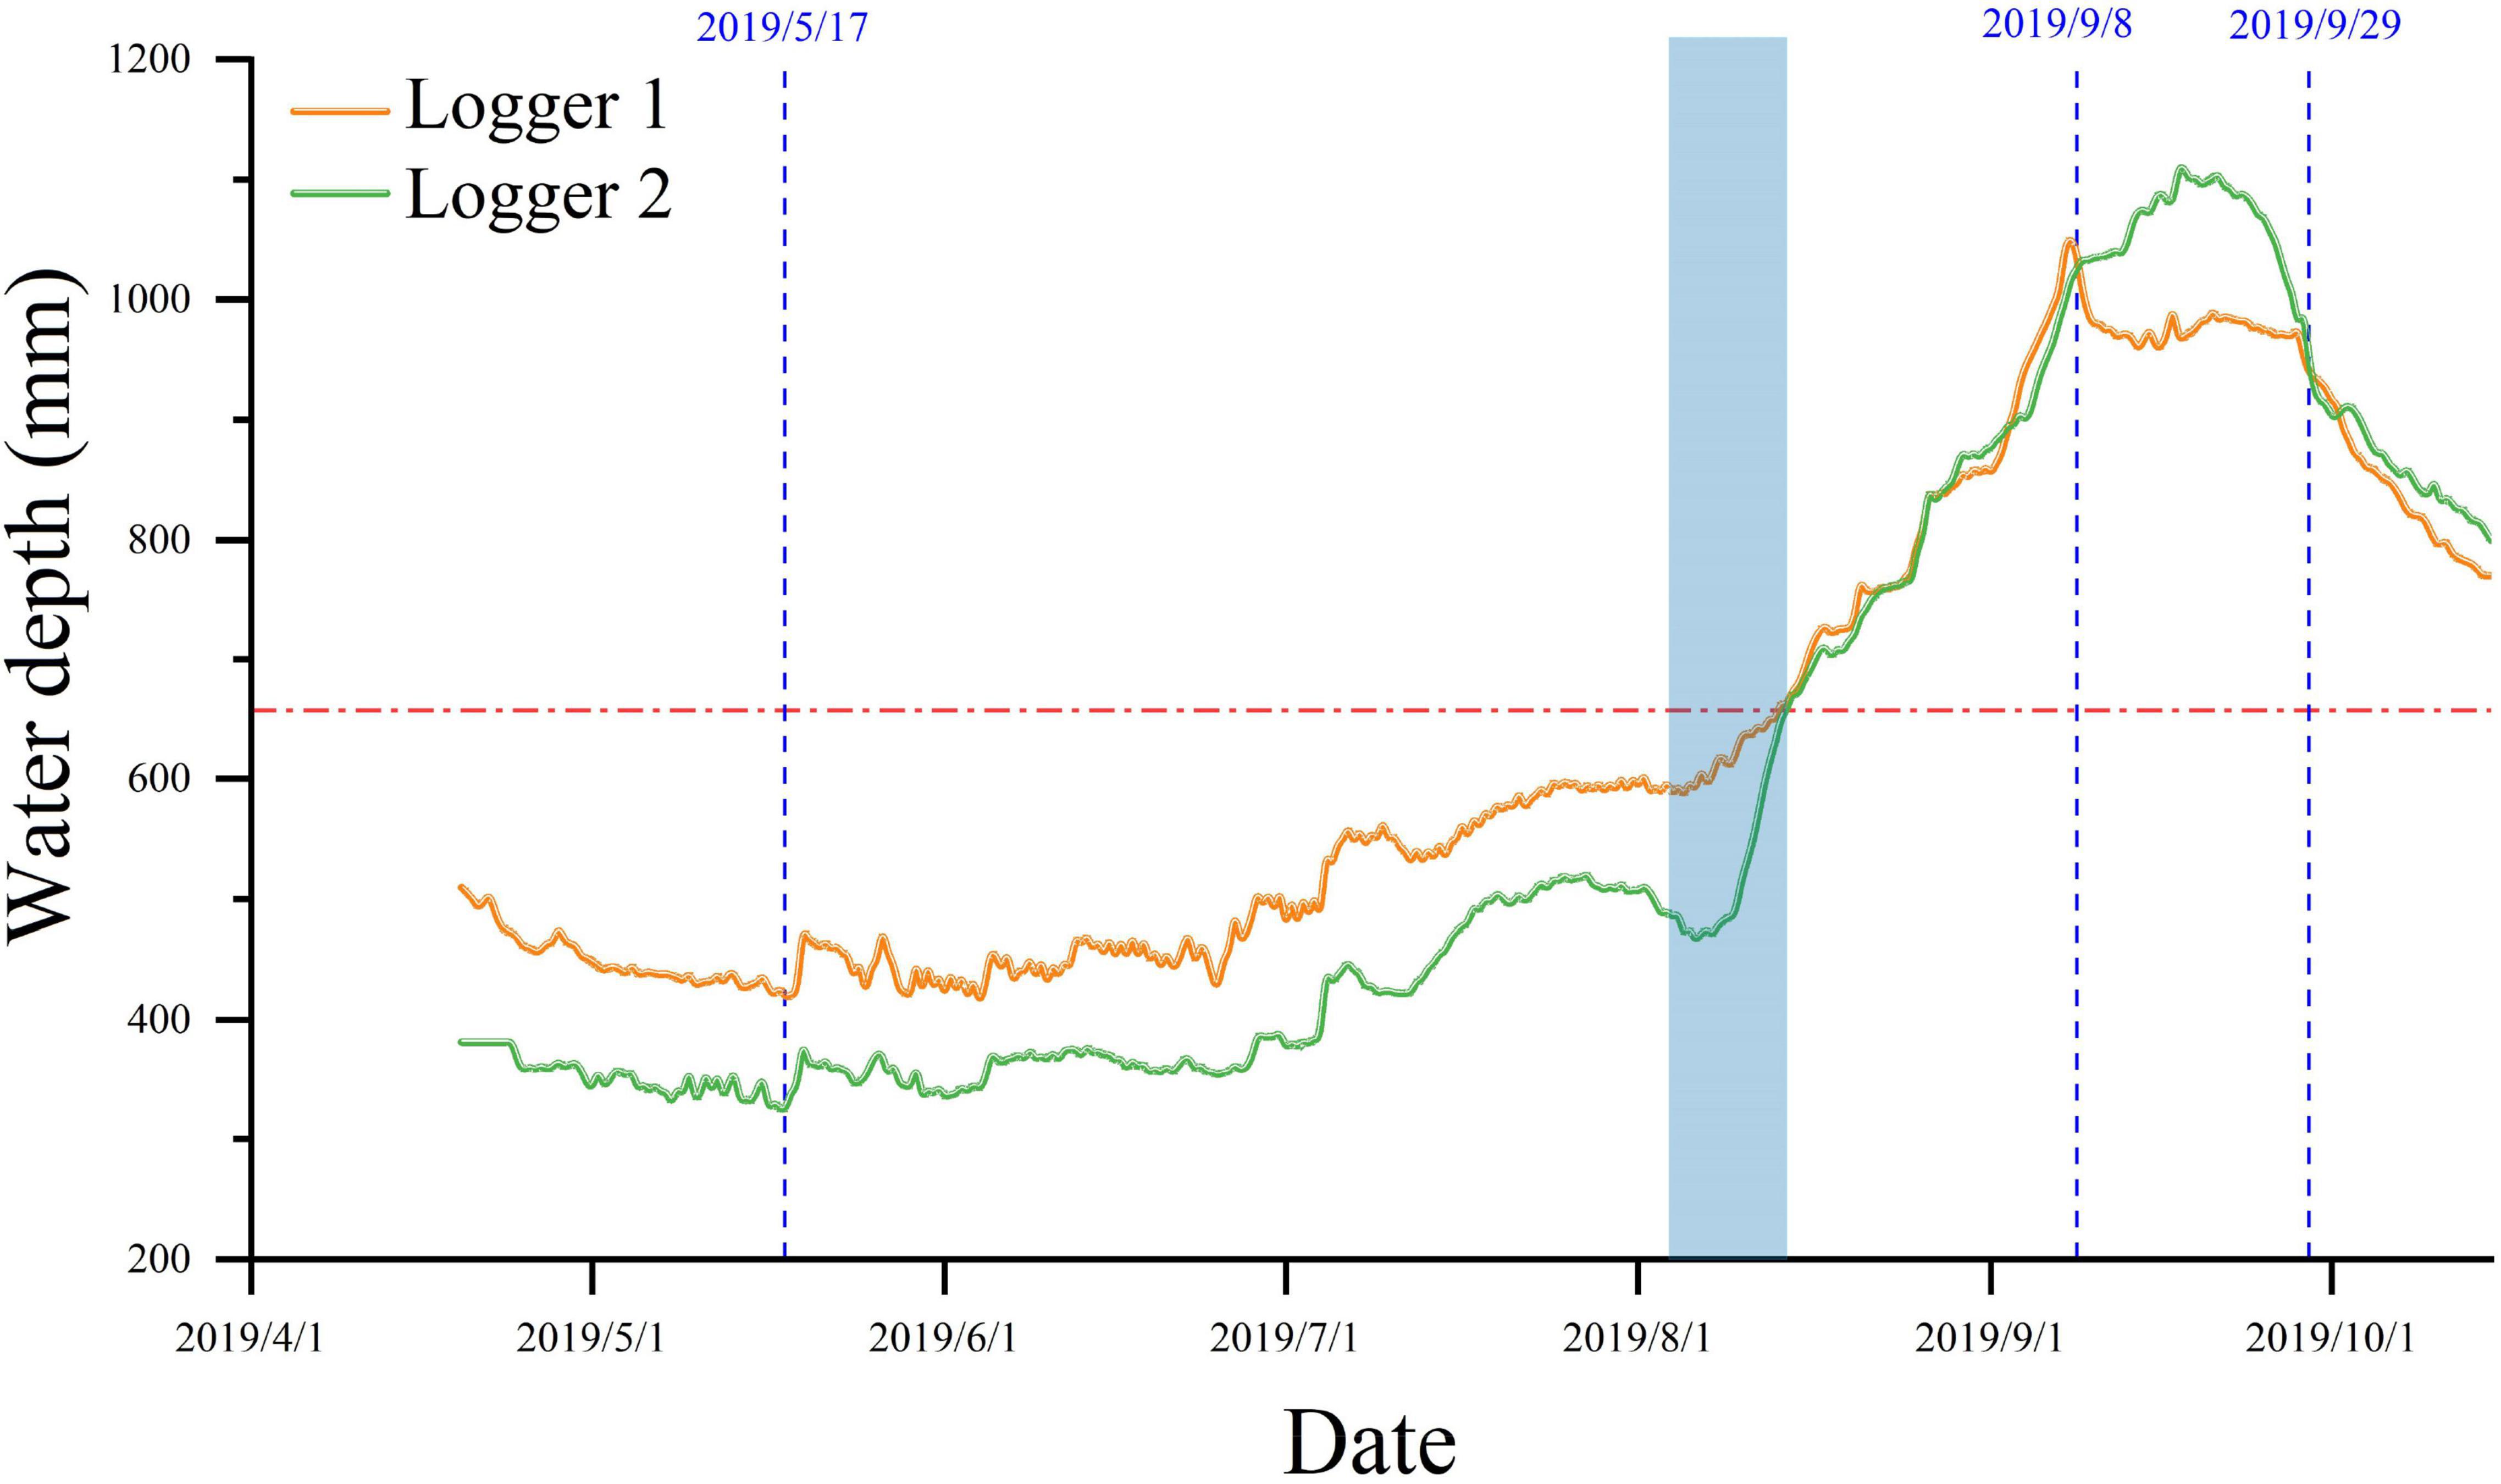
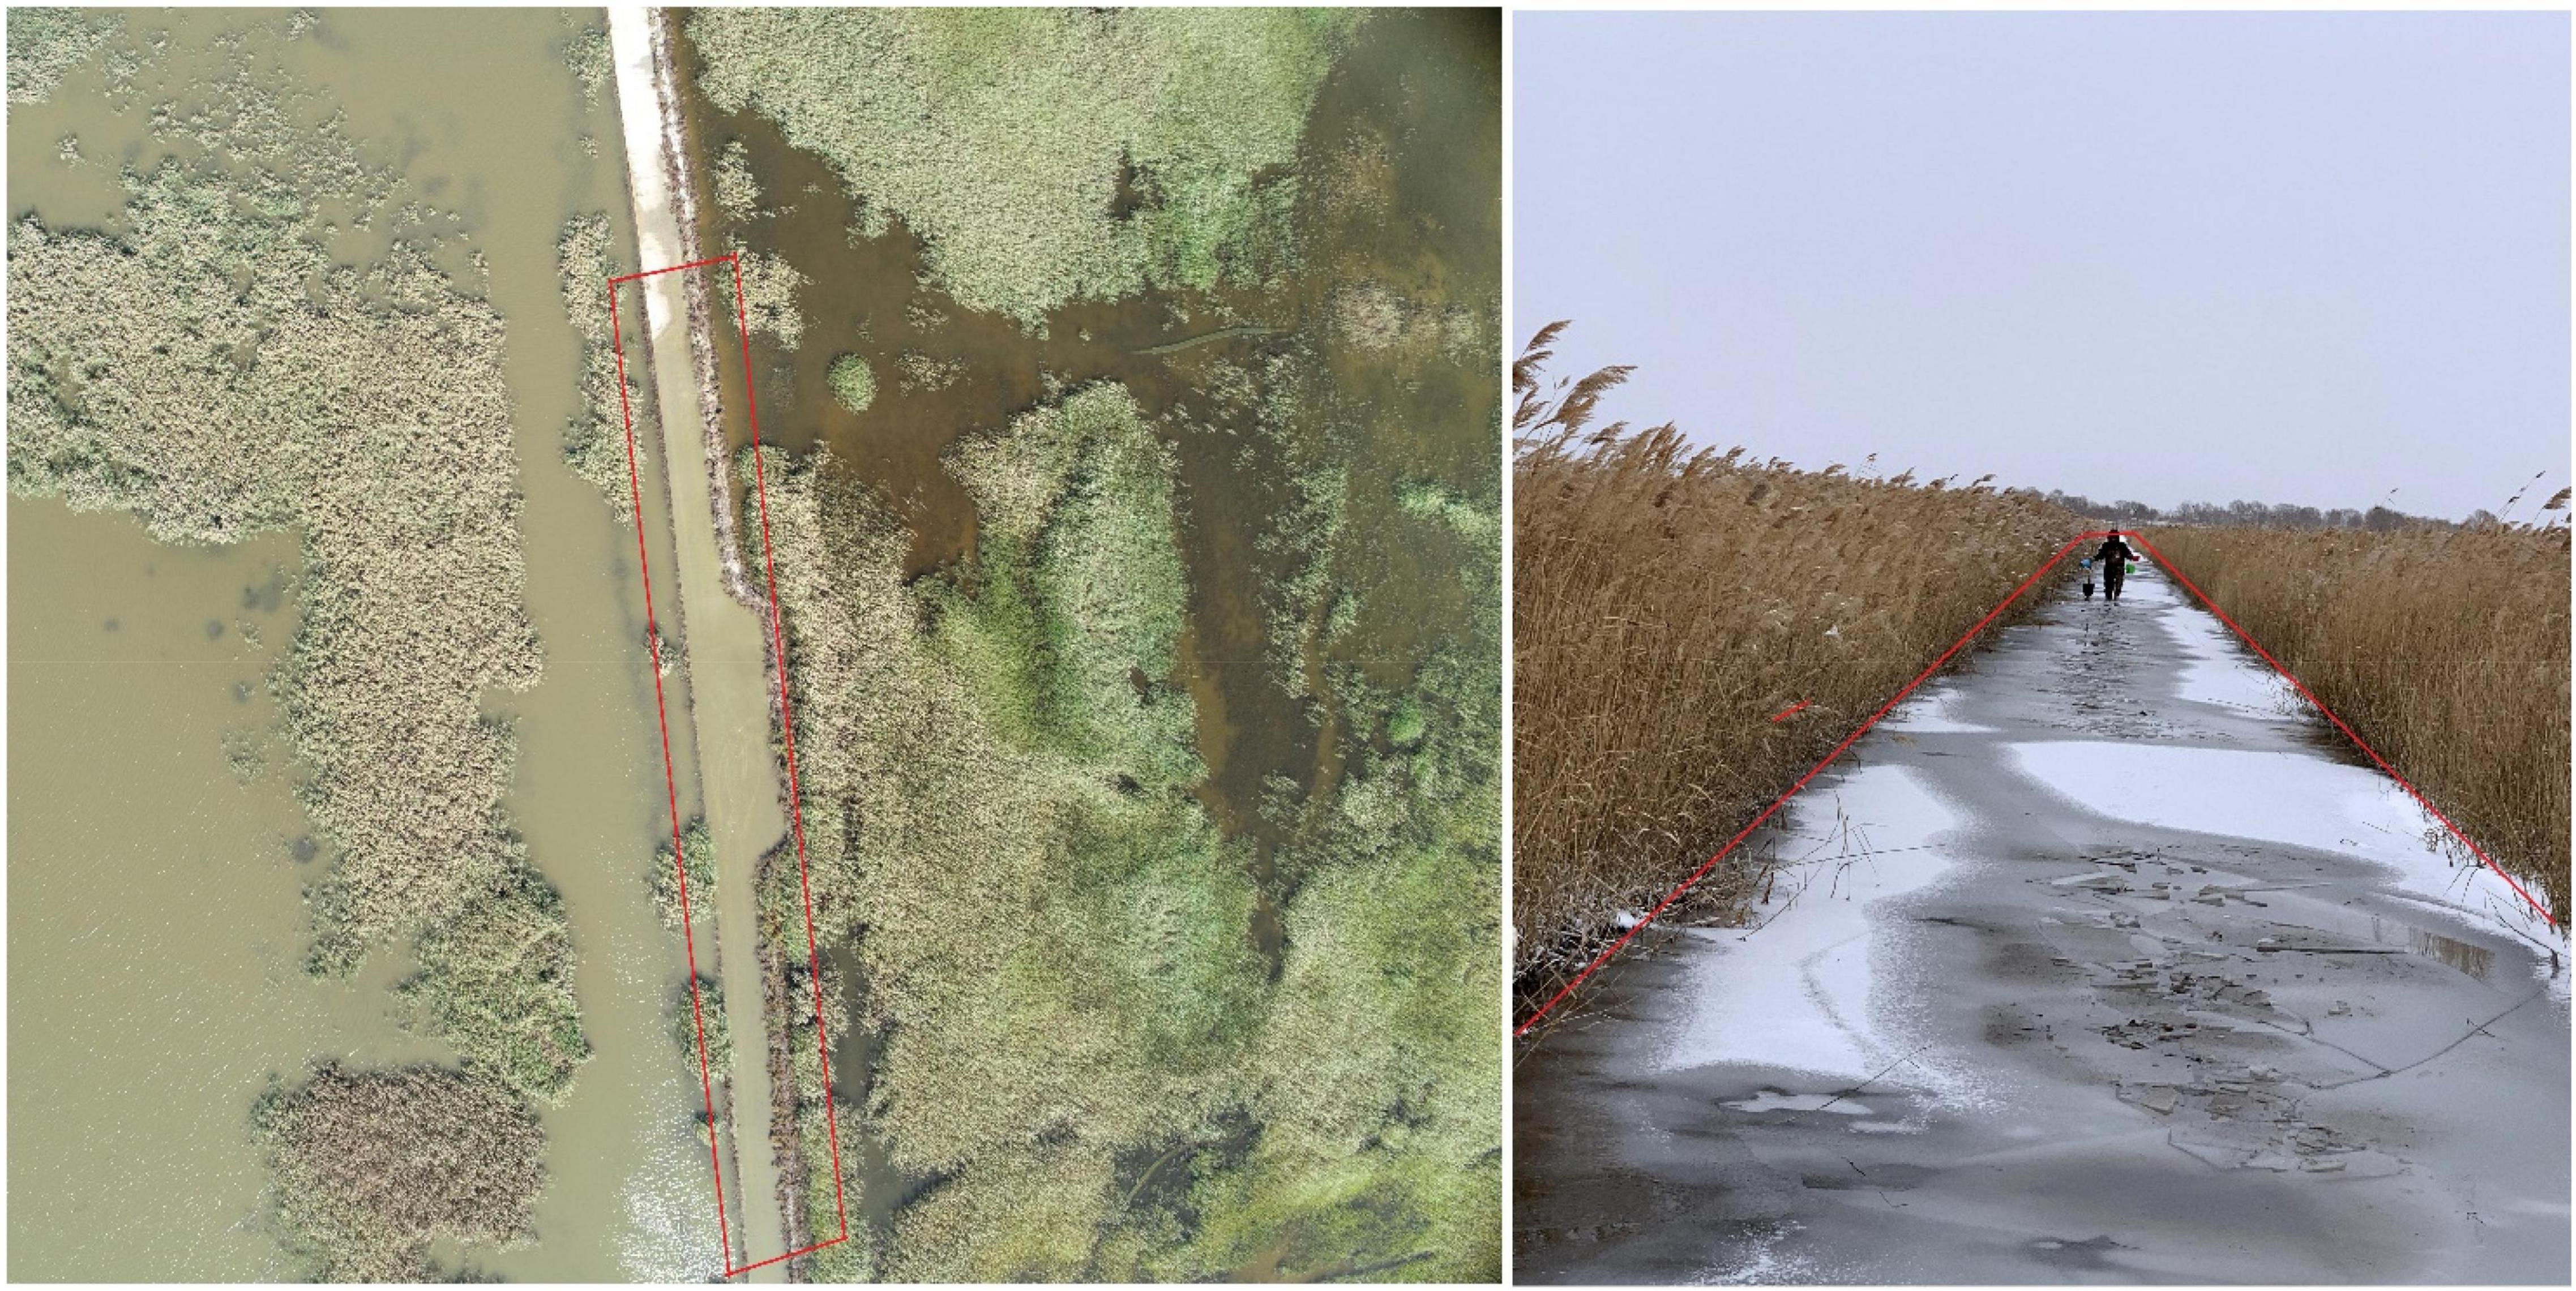
Water level gauges 1 and 2 were located on both sides of the road within the Baihe Lake. They lacked a surface hydraulic connection due to the presence of the road. Figure 3 Displays that the water level at the two points fluctuated and decreased before May 17, showing the same trends, which were predominantly driven by atmospheric rainfall and evaporation. However, a water level difference of 20 cm existed at the two points due to water head loss during the underground connection formed by seepage across the road.
From May 17, the water level gradually increased when the Qianhang drainage station in the upper reaches of Baihe Lake opened its floodgates to discharge farmland irrigation water into the area where water level meter 1 was located. Furthermore, the water level at the point where water level meter 2 was located also increased because of the underground connectivity. In early August (the blue columnar area in Figure 3), the water in Baihe Lake overflowed and spread over the road around the Lake because of the continuous water level rise. As a result, the surface water inside and outside the road became partially connected, and the water level outside the road rose until it reached the same water level of 68 cm and further merged completely with the water inside the road.
On September 8, the sluice gate opened and water in Baihe Lake began to discharge downstream, resulting in the declination of water level. The water level outside Baihe Lake also decreased slowly due to the connection, and finally, the two tended to be consistent. The surface water inside and outside the road remained connected until it began to freeze in November. The change in surface connectivity was also caused by water level variation. Therefore, irrigation and drainage in farming are the major factors affecting water-level fluctuations from May to October. The water level variation near Baihe Lake was mostly affected by natural rainfall, evaporation, and underground connectivity when there was no irrigation water discharge. A photograph of the field is shown in Figure 4.
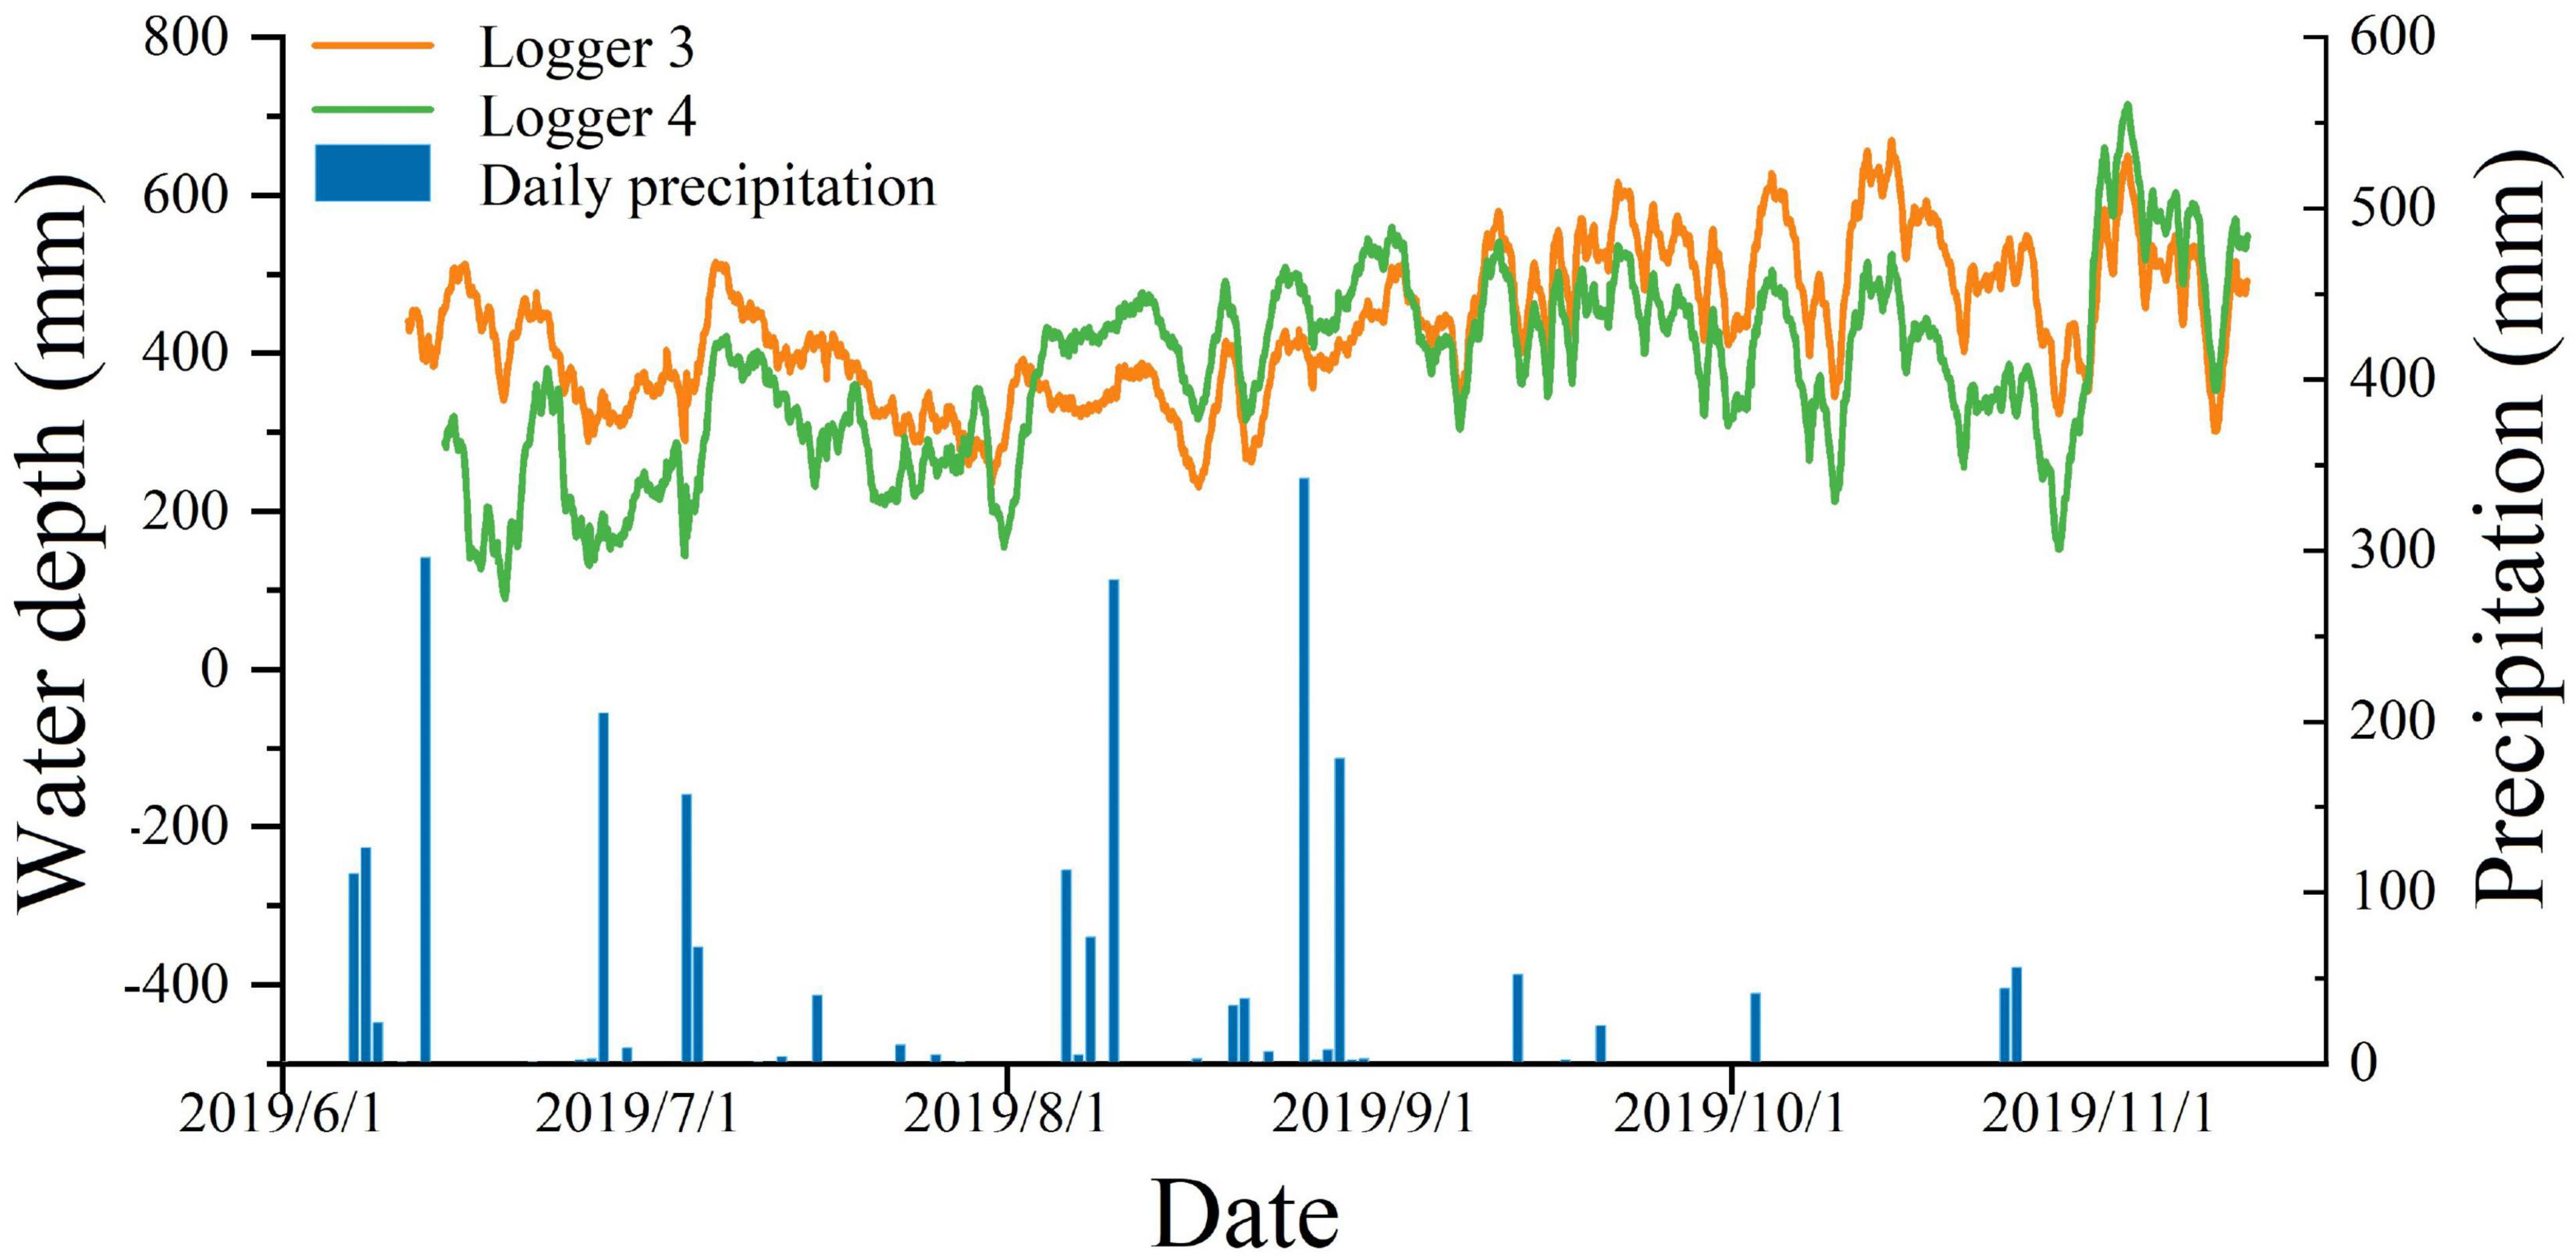
Water level gauge 3 was located on the island west of the MNNR, and water level gauge 4 was located in a pond outside the gate of the Harnao Reservoir in the northeastern part of the MNNR. As shown in Figure 5, although gauges 3 and 4 were geographically far apart, their fluctuation trends were very similar. Both demonstrated a good relationship with precipitation, indicating that the two points were affected by precipitation. In early August and early November 2019, the water level of gauge 4 increased with an increase in the water level of the Nenjiang River under the influence of two distinct inflow processes of the Nenjiang River. In addition, the rising range was greater than that of gauge 3. This trend reveals a minor head loss due to groundwater flow during the groundwater connection between the two points.
Groundwater Dynamic Process
Response of Groundwater to Precipitation
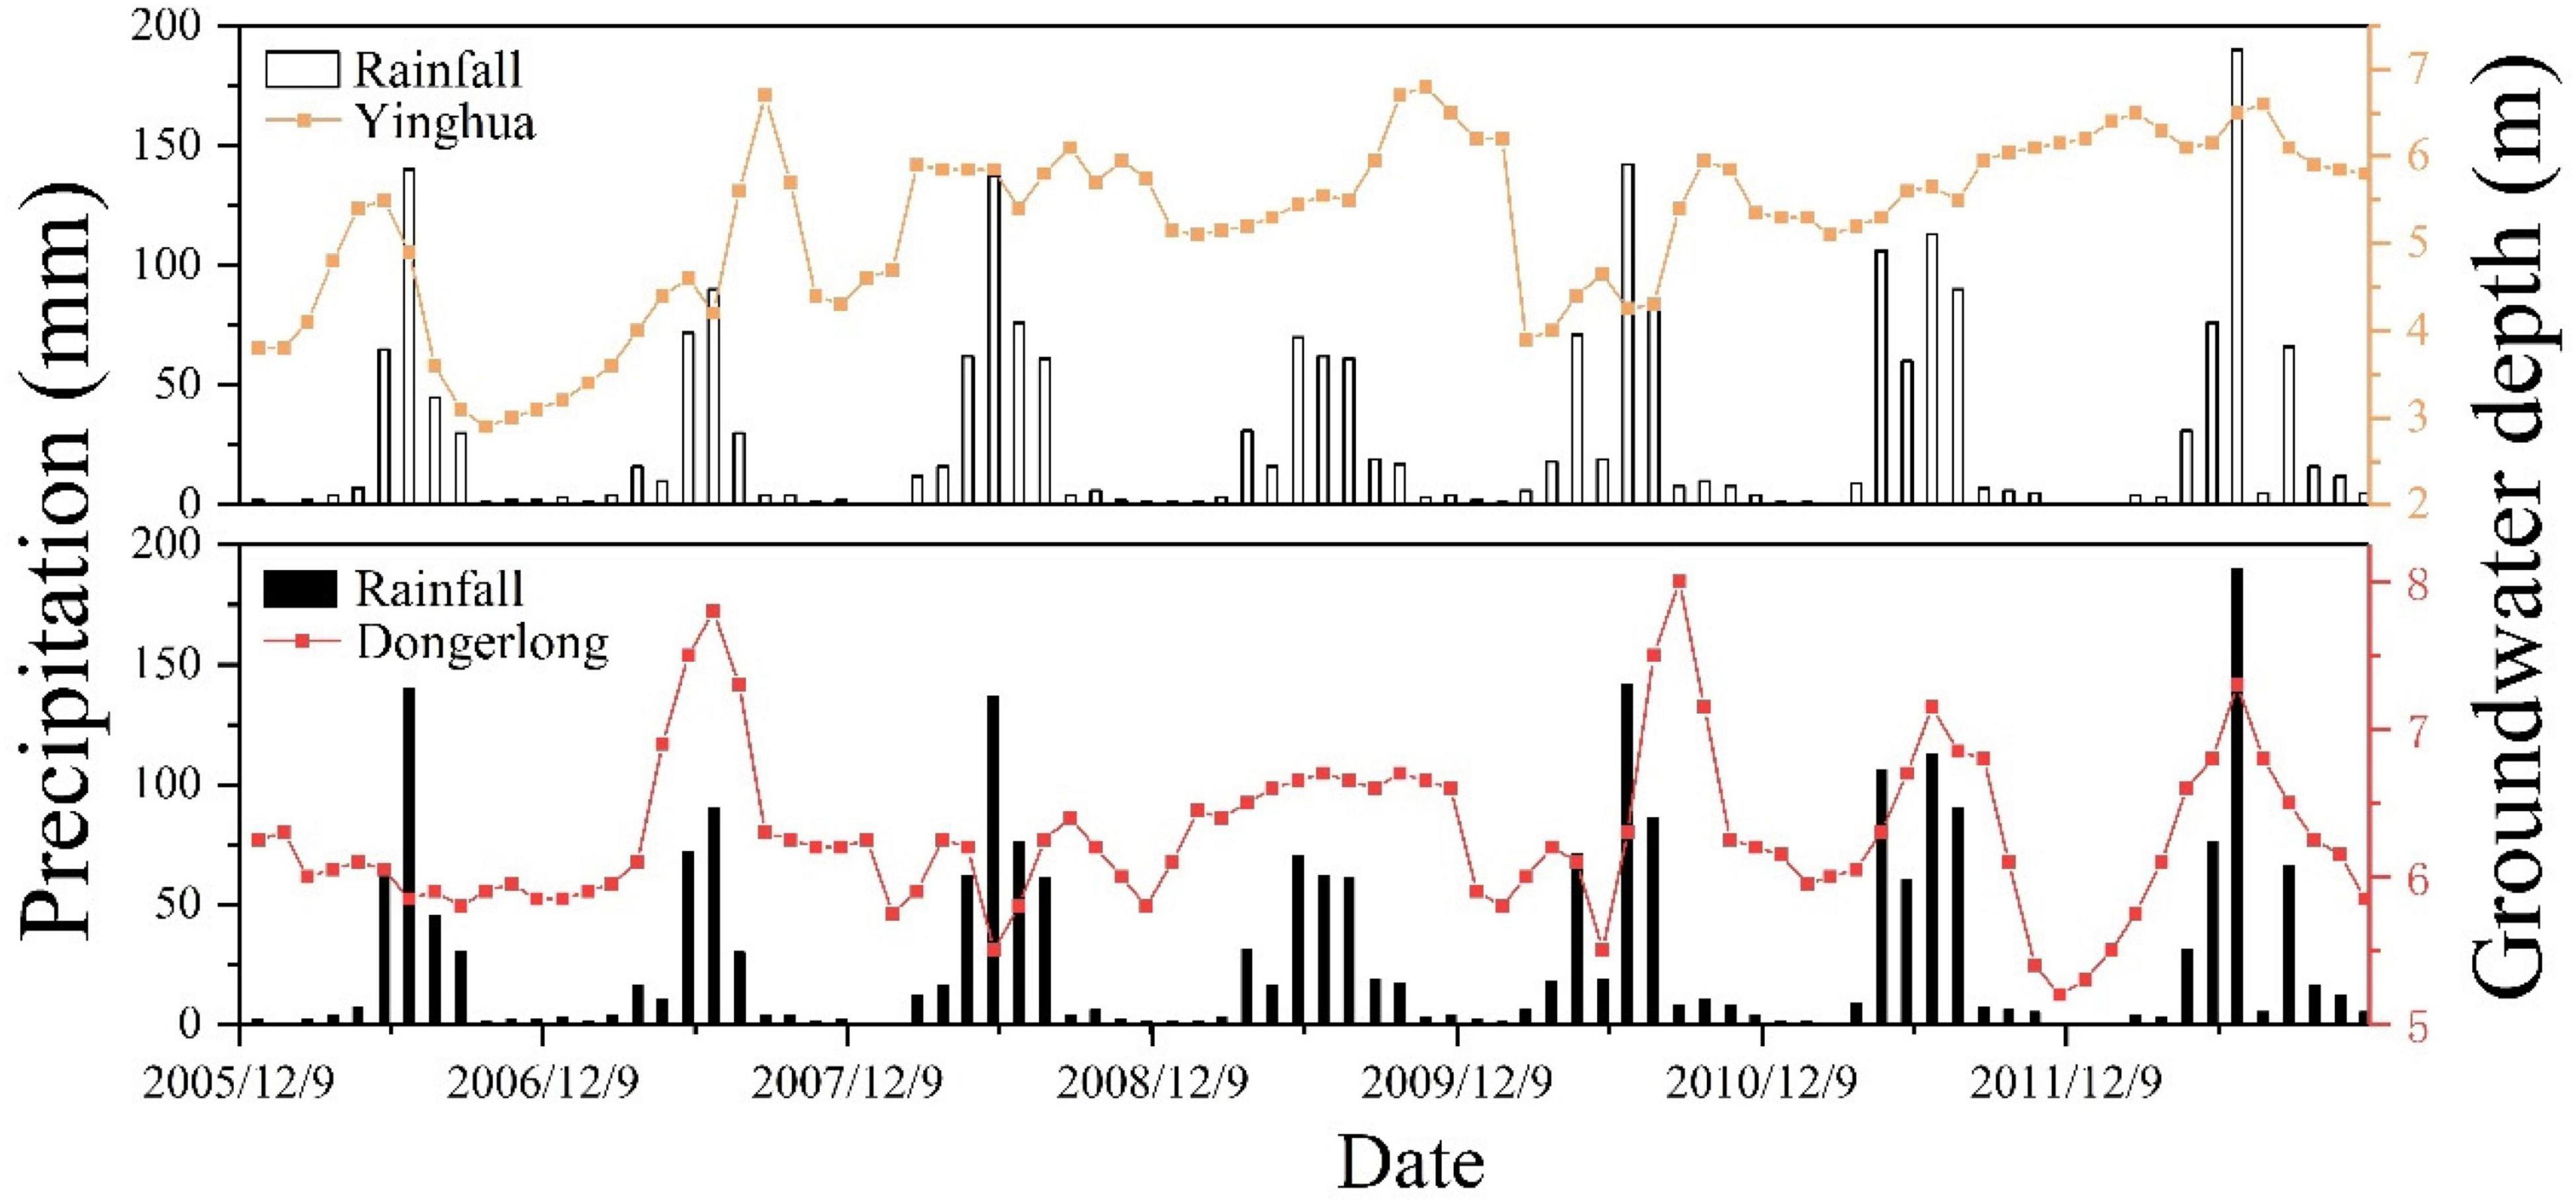
According to the precipitation data of MNNR from 2006 to 2012 and the relationship between the groundwater depth at monitoring points Yinghua and Dongerlong (Figure 6), precipitation indicated an overall upward trend. The groundwater depth at Yinghua also demonstrated an overall upward trend from 2 m in 2006 to 6 m in 2011. Although the groundwater depth in Dongerlong fluctuated, it remained at about 6 m. In the densely populated area of Yinghua, owing to the over-exploitation of groundwater, the groundwater table gradually decreased with the increase in precipitation. The decline in the groundwater level will affect the ecological environment of the wetlands, and it is necessary to explore the groundwater dynamics of MNNR further.
Seasonal Variation of the Groundwater Flow Field
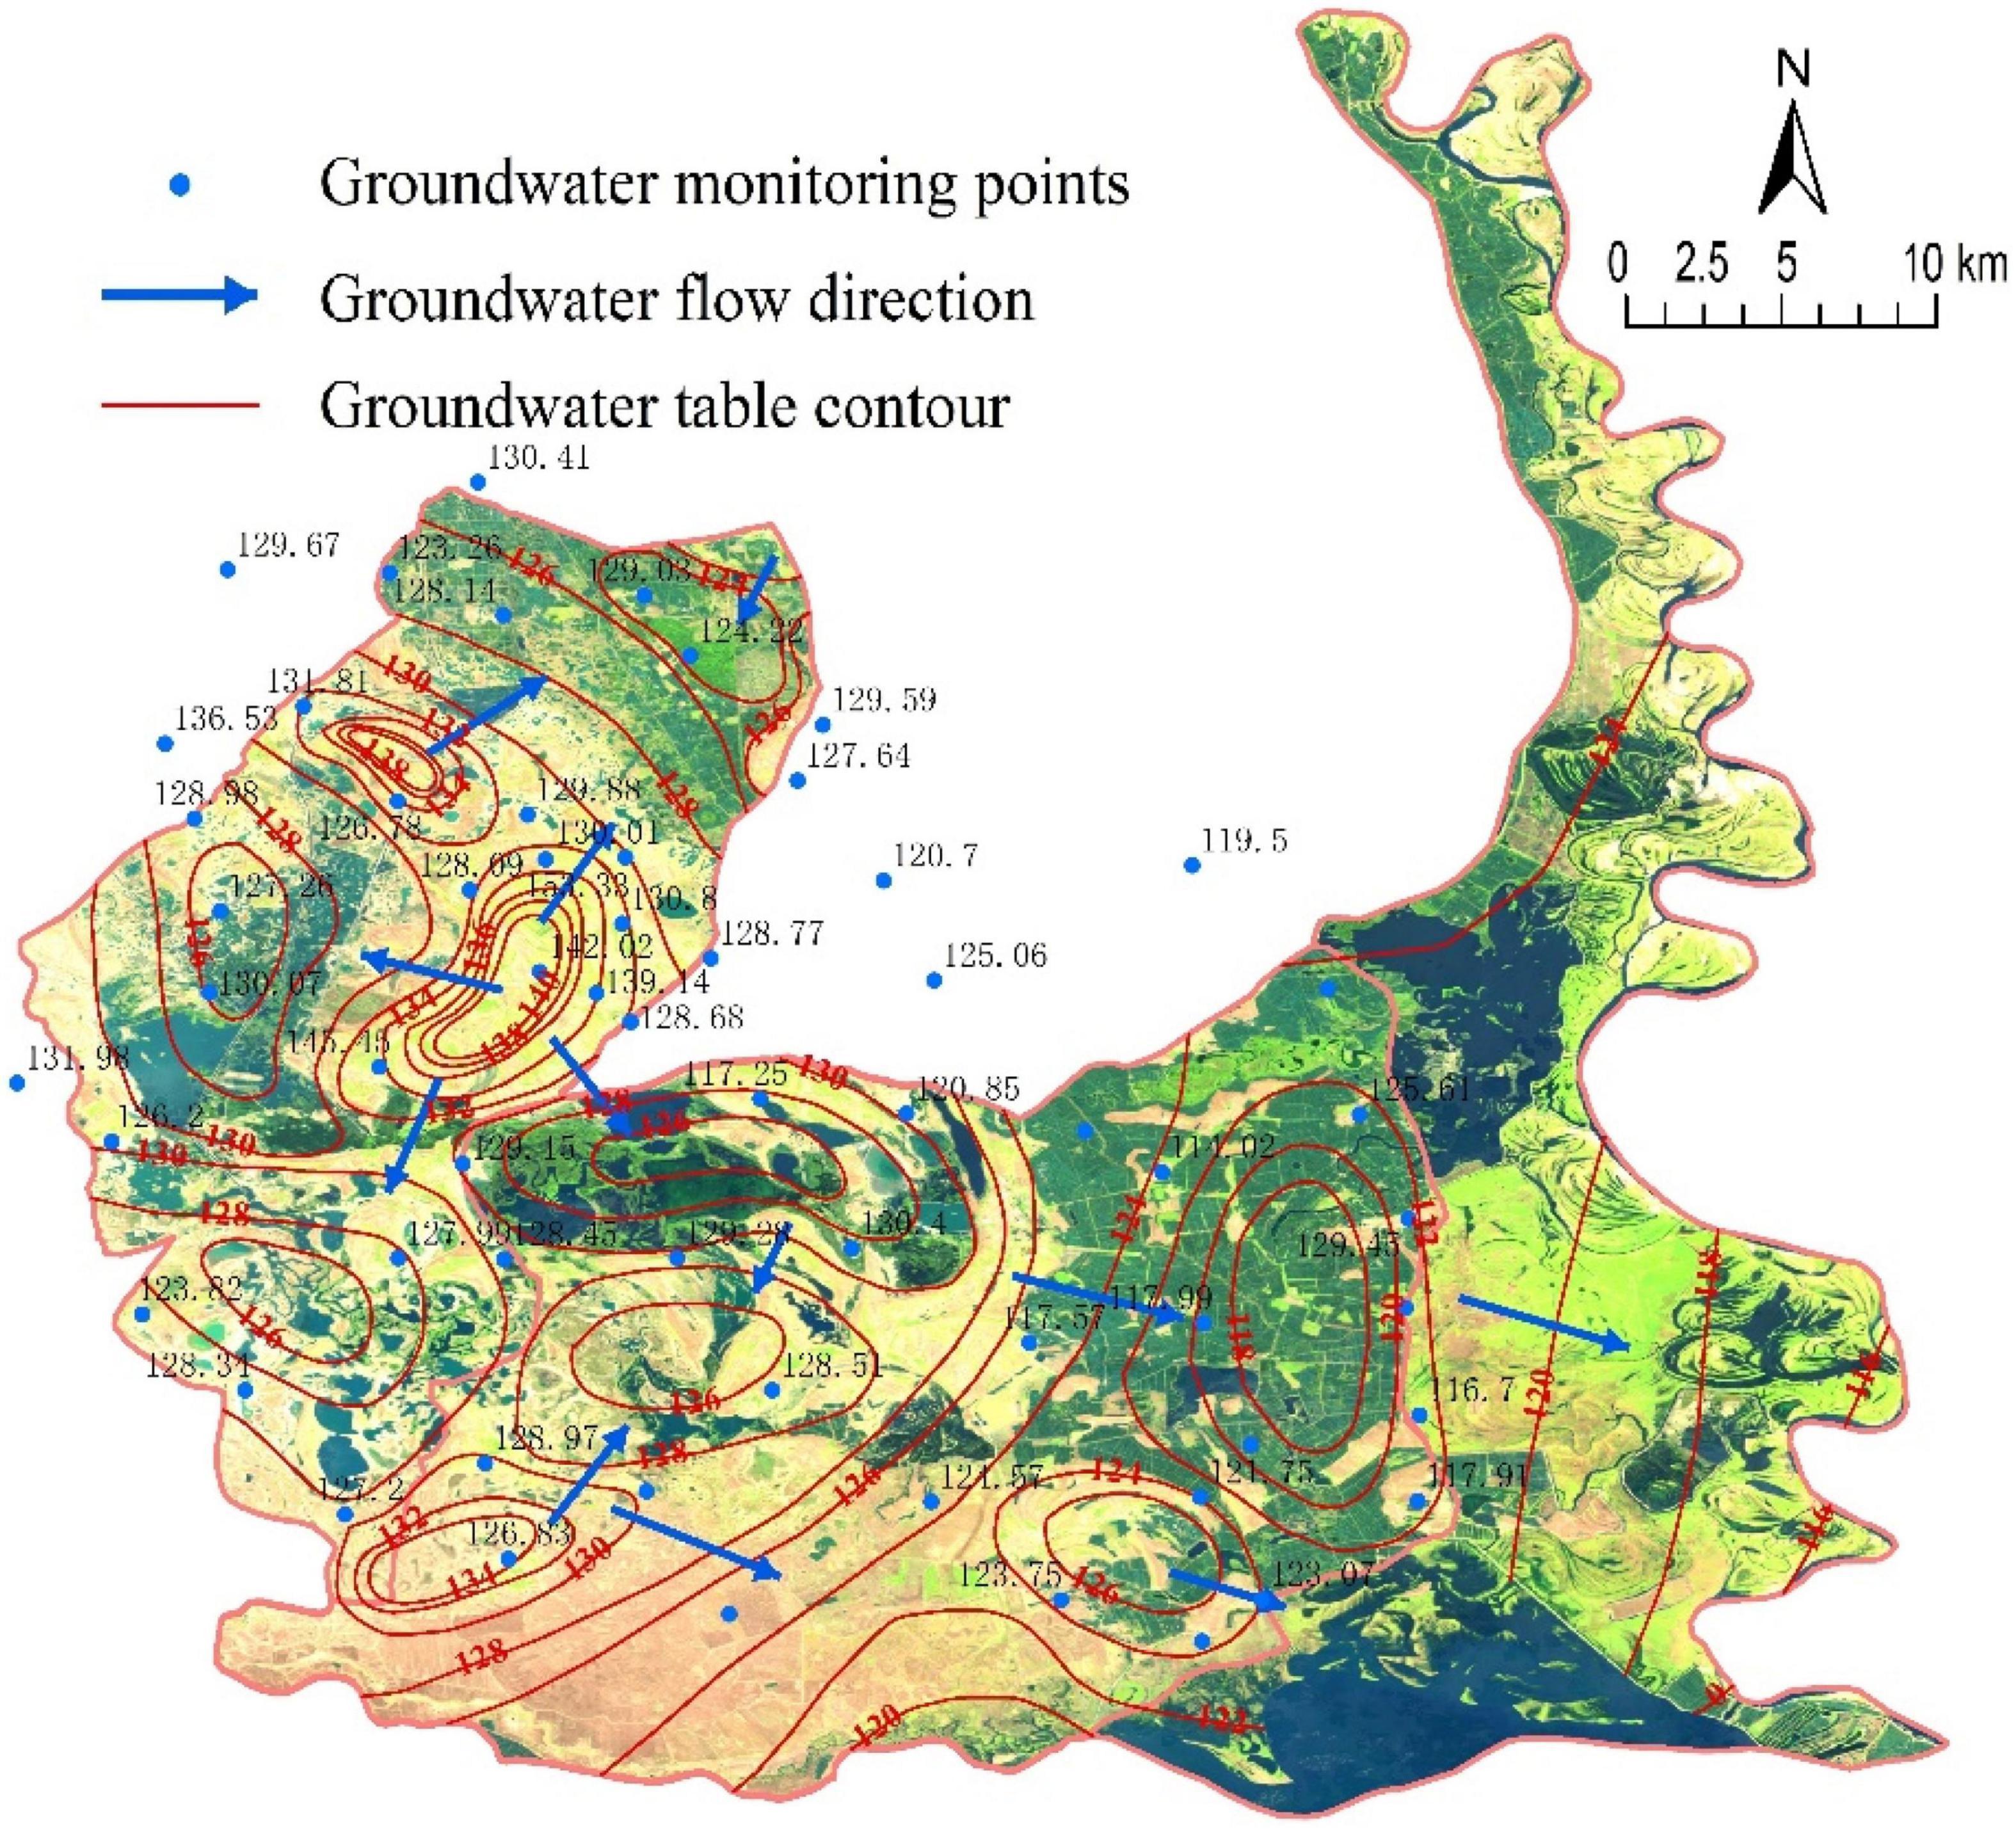
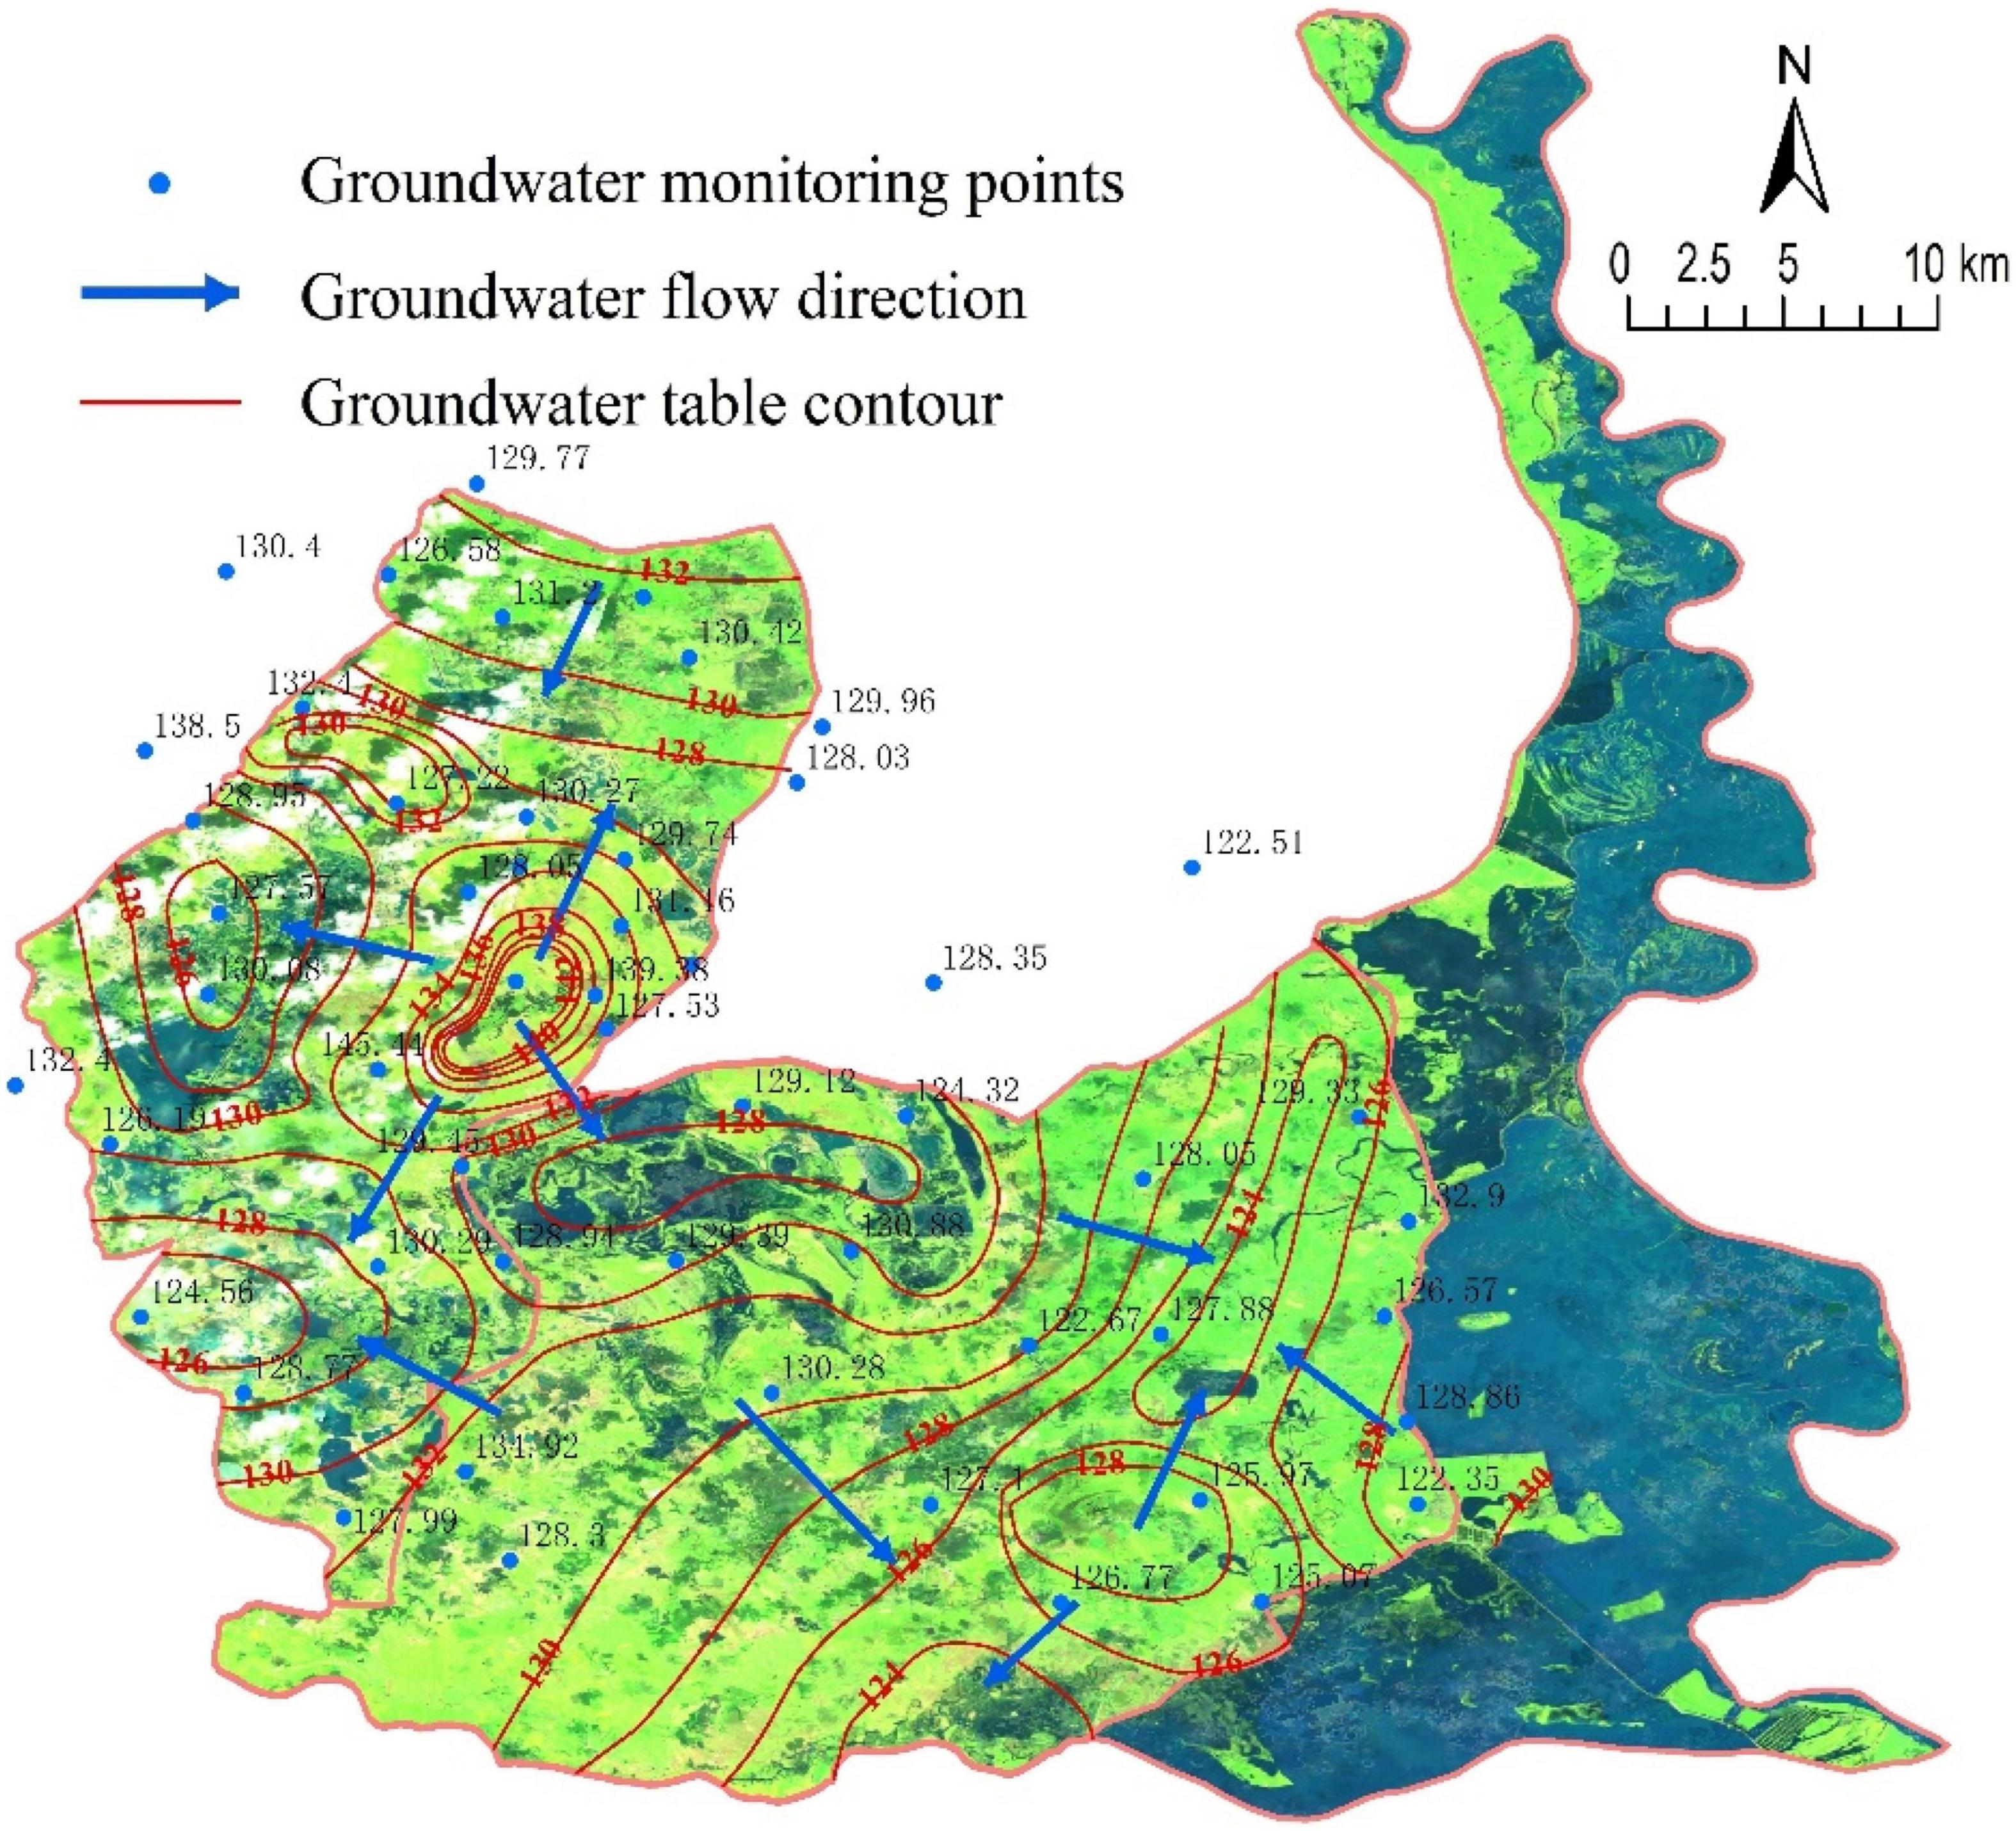
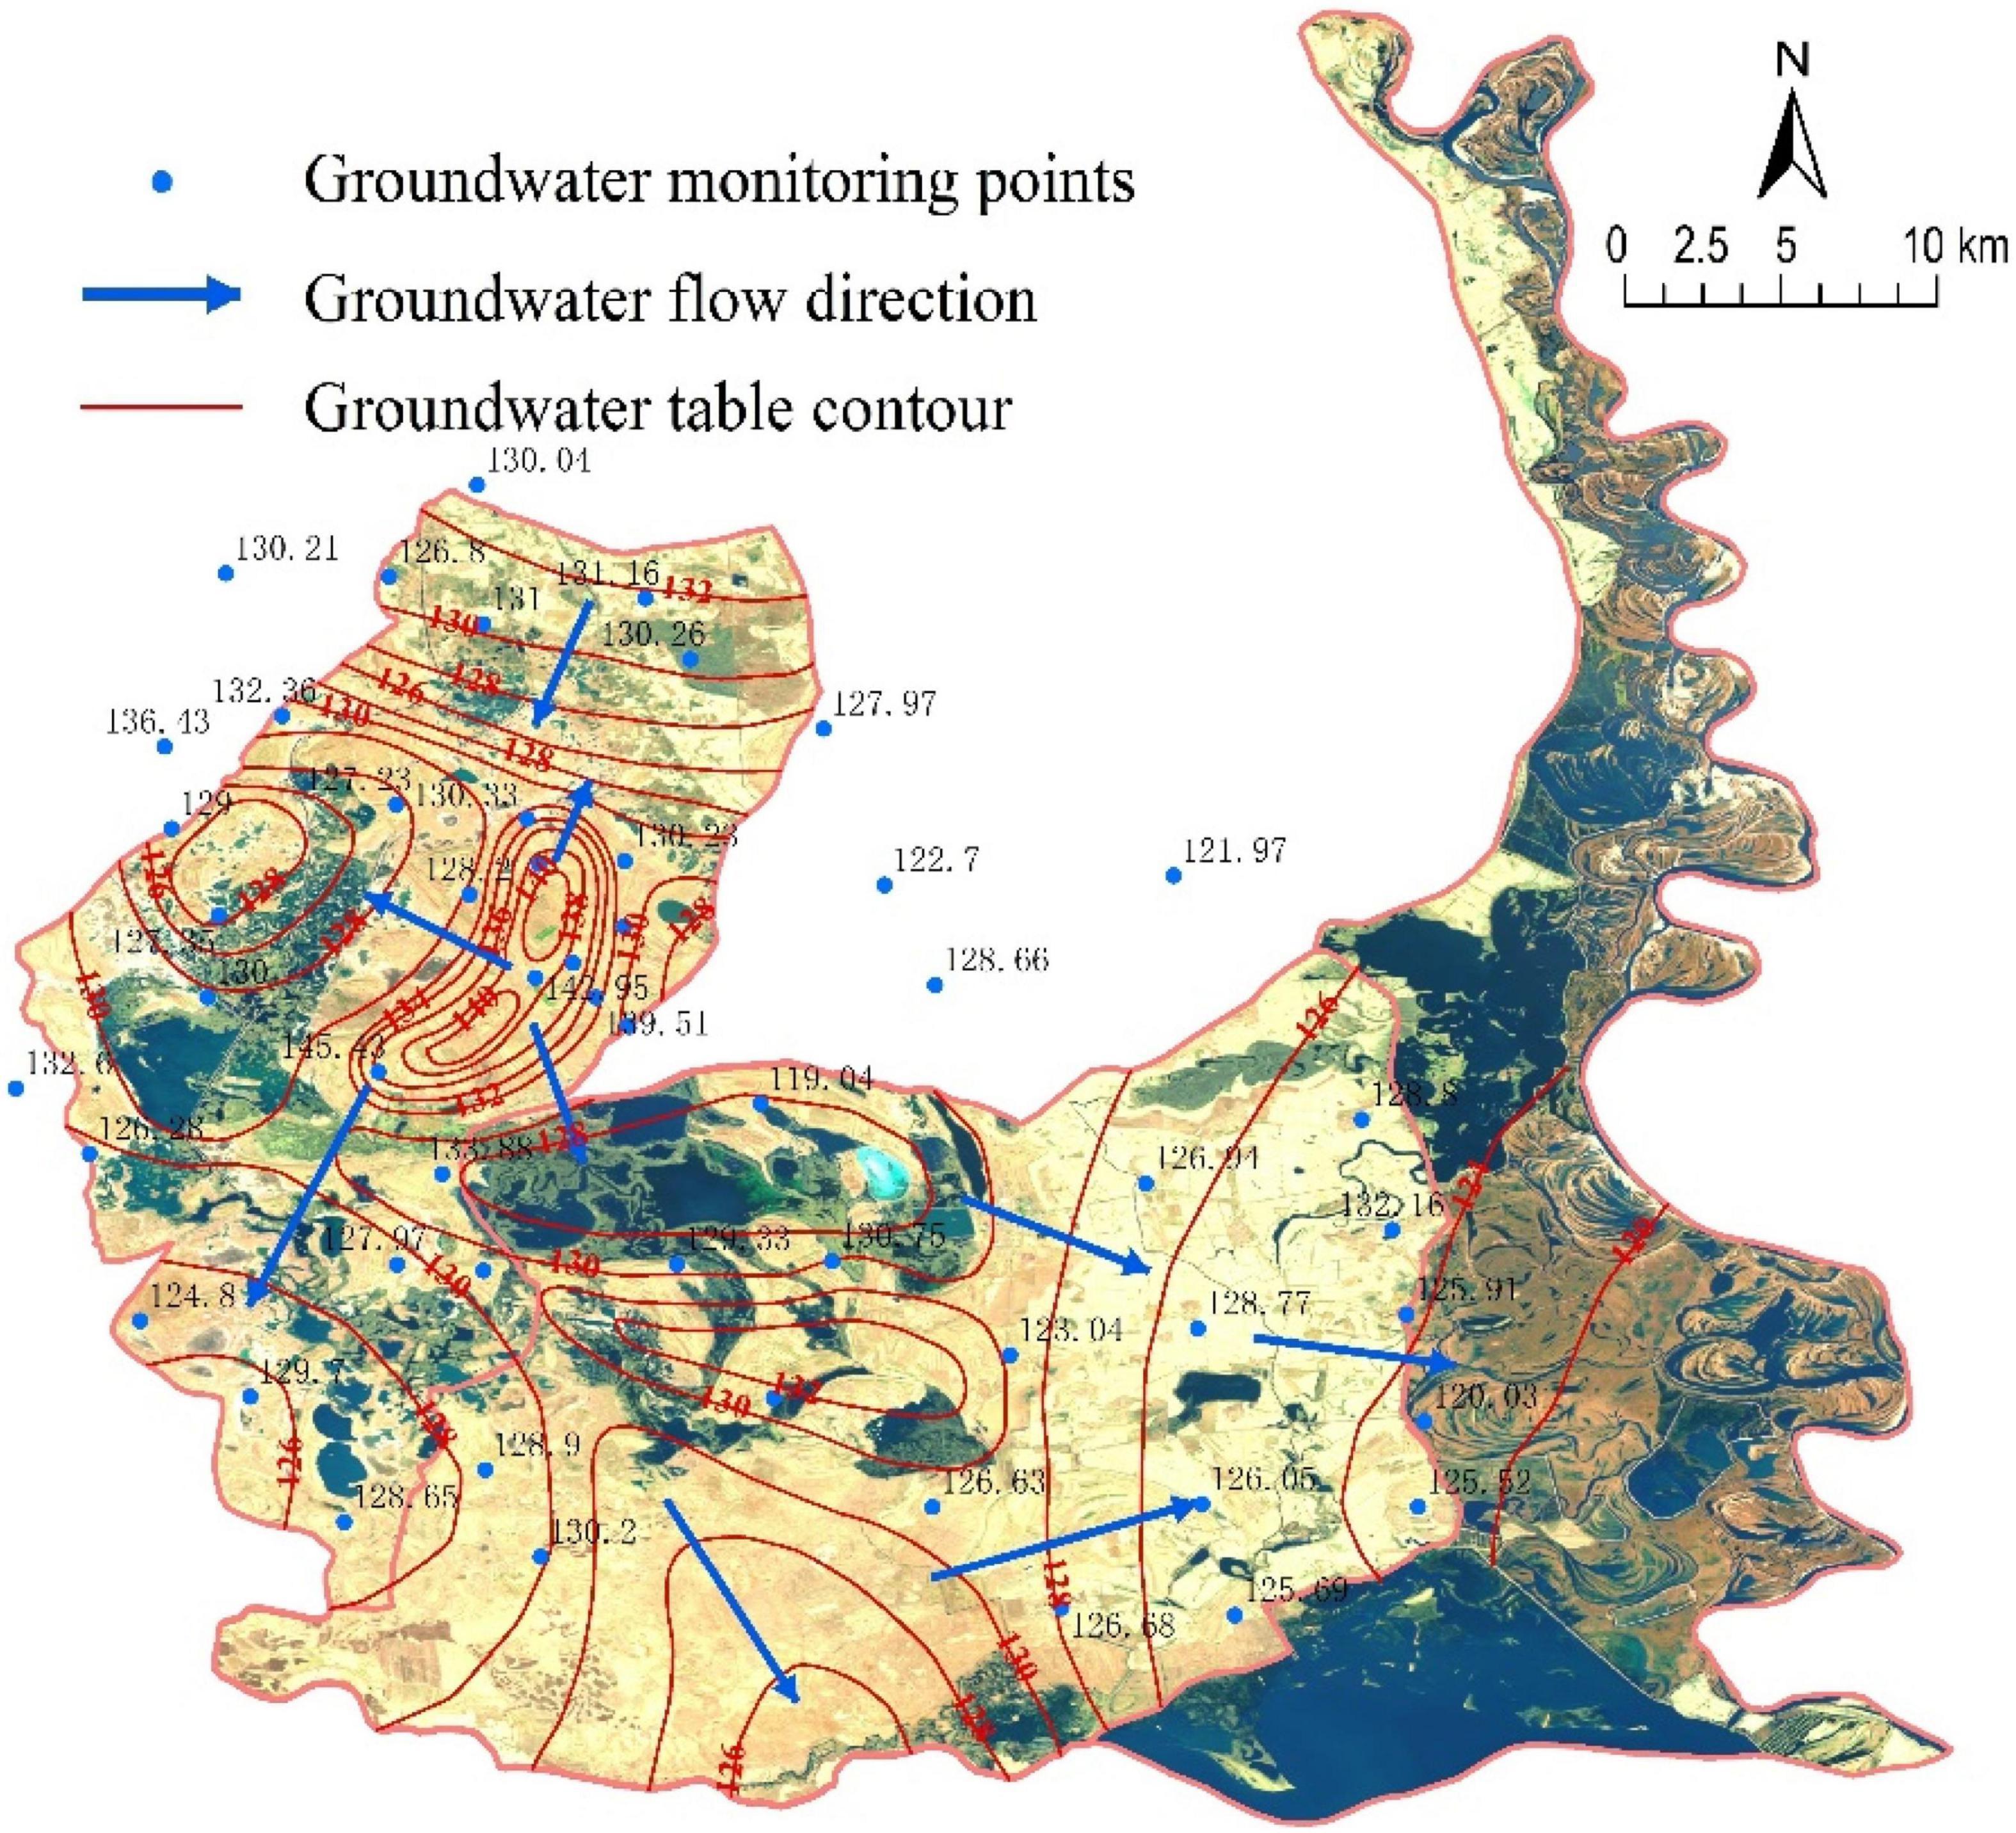
In the wet, dry and other seasons, groundwater in the MNNR generally flows from northwest to southeast, driven by the topography and aquifer floor gradient (Figures 7, 8, 9). In the northwest, groundwater flows from the uplands to the surrounding low-lying lakes, forming widely distributed isolated wetlands. In the central region, groundwater flows from west to east, and the hydraulic gradient is lower than that in the northwest. However, local differences in groundwater flow fields exist due to variations in hydrological conditions. Because of the rising water level of the Nenjiang River during the flood season, the floodplain on the west side of the Nenjiang River is submerged by the river water. Moreover, the infiltration of surface water increases the groundwater table, changing the direction of local groundwater that flows toward the west of the MNNR along the west bank of the Nenjiang River. Groundwater is discharged to the Nenjiang River the dry season and June. In the western part of the reserve, there is groundwater recharge from outside the reserve in the northwest during the wet and dry seasons, which does not occur in the other season (June). In the middle of the reserve, except for the groundwater recharge to Baihe Lake from the uplands, the groundwater generally flows northwest to southeast. In the wet season, the groundwater table increases significantly, and the hydraulic gradient becomes higher due to the increase in precipitation and the rise in the river water level. By contrast, in the dry season and in June, the hydraulic gradient of groundwater is relatively low. In particular, a regional cone of groundwater depression forms in the west of the floodplain of the Nenjiang River in June.
Groundwater is a major factor maintaining the wetland water source, and the topography significantly affects the groundwater flow direction and hydraulic gradient. In addition to precipitation and artificial recharge, groundwater flows from the surrounding upland to the lake in the northwest. The evolution of groundwater flow fields in the central and eastern regions was mostly affected by the precipitation and hydrological conditions of the Nenjiang River.
Water Balance Calculation
The primary water sources of MNNR include precipitation, surface runoff, irrigation drainage, groundwater lateral runoff, and river infiltration. The recharge and discharge of the MNNR water resources and equilibrium calculation results are listed in Table 2. The water resources in the MNNR were in negative equilibrium during the dry season and in the month of June, with equilibrium differences of −12.84 × 10⁴ and −9.11 × 10⁴ m3/day, respectively. These results indicate that water surface evaporation significantly affects the volume of water resources in the MNNR. During the wet season, the water resources in MNNR were in positive equilibrium, and the equilibrium difference was 276.41 × 10⁴ m3/day. The increase in water resources mostly emerged from the floodplain submerged by the flood of the Nenjiang River.
Simulation Results of Submerged Area in Momoge National Nature Reserve
The submerged area of the wetlands varied considerably between 2010 and 2013 (Figure 10). The extent was approximately 50 km2 in the dry season, and a small peak occurred during the snowmelt period. While the area was generally approximately 300 km2 in the wet season, it reached 400 km2 in 2012. The simulation results were generally lower in the wet season and higher in the dry season than observed in the remote sensing observations. This trend was due to the influence of high vegetation coverage on remote sensing calculations and the calculation error of groundwater recharge by the SWAT-DSF. The water level and wetland discharge can be inferred based on their correlation with submerged areas.
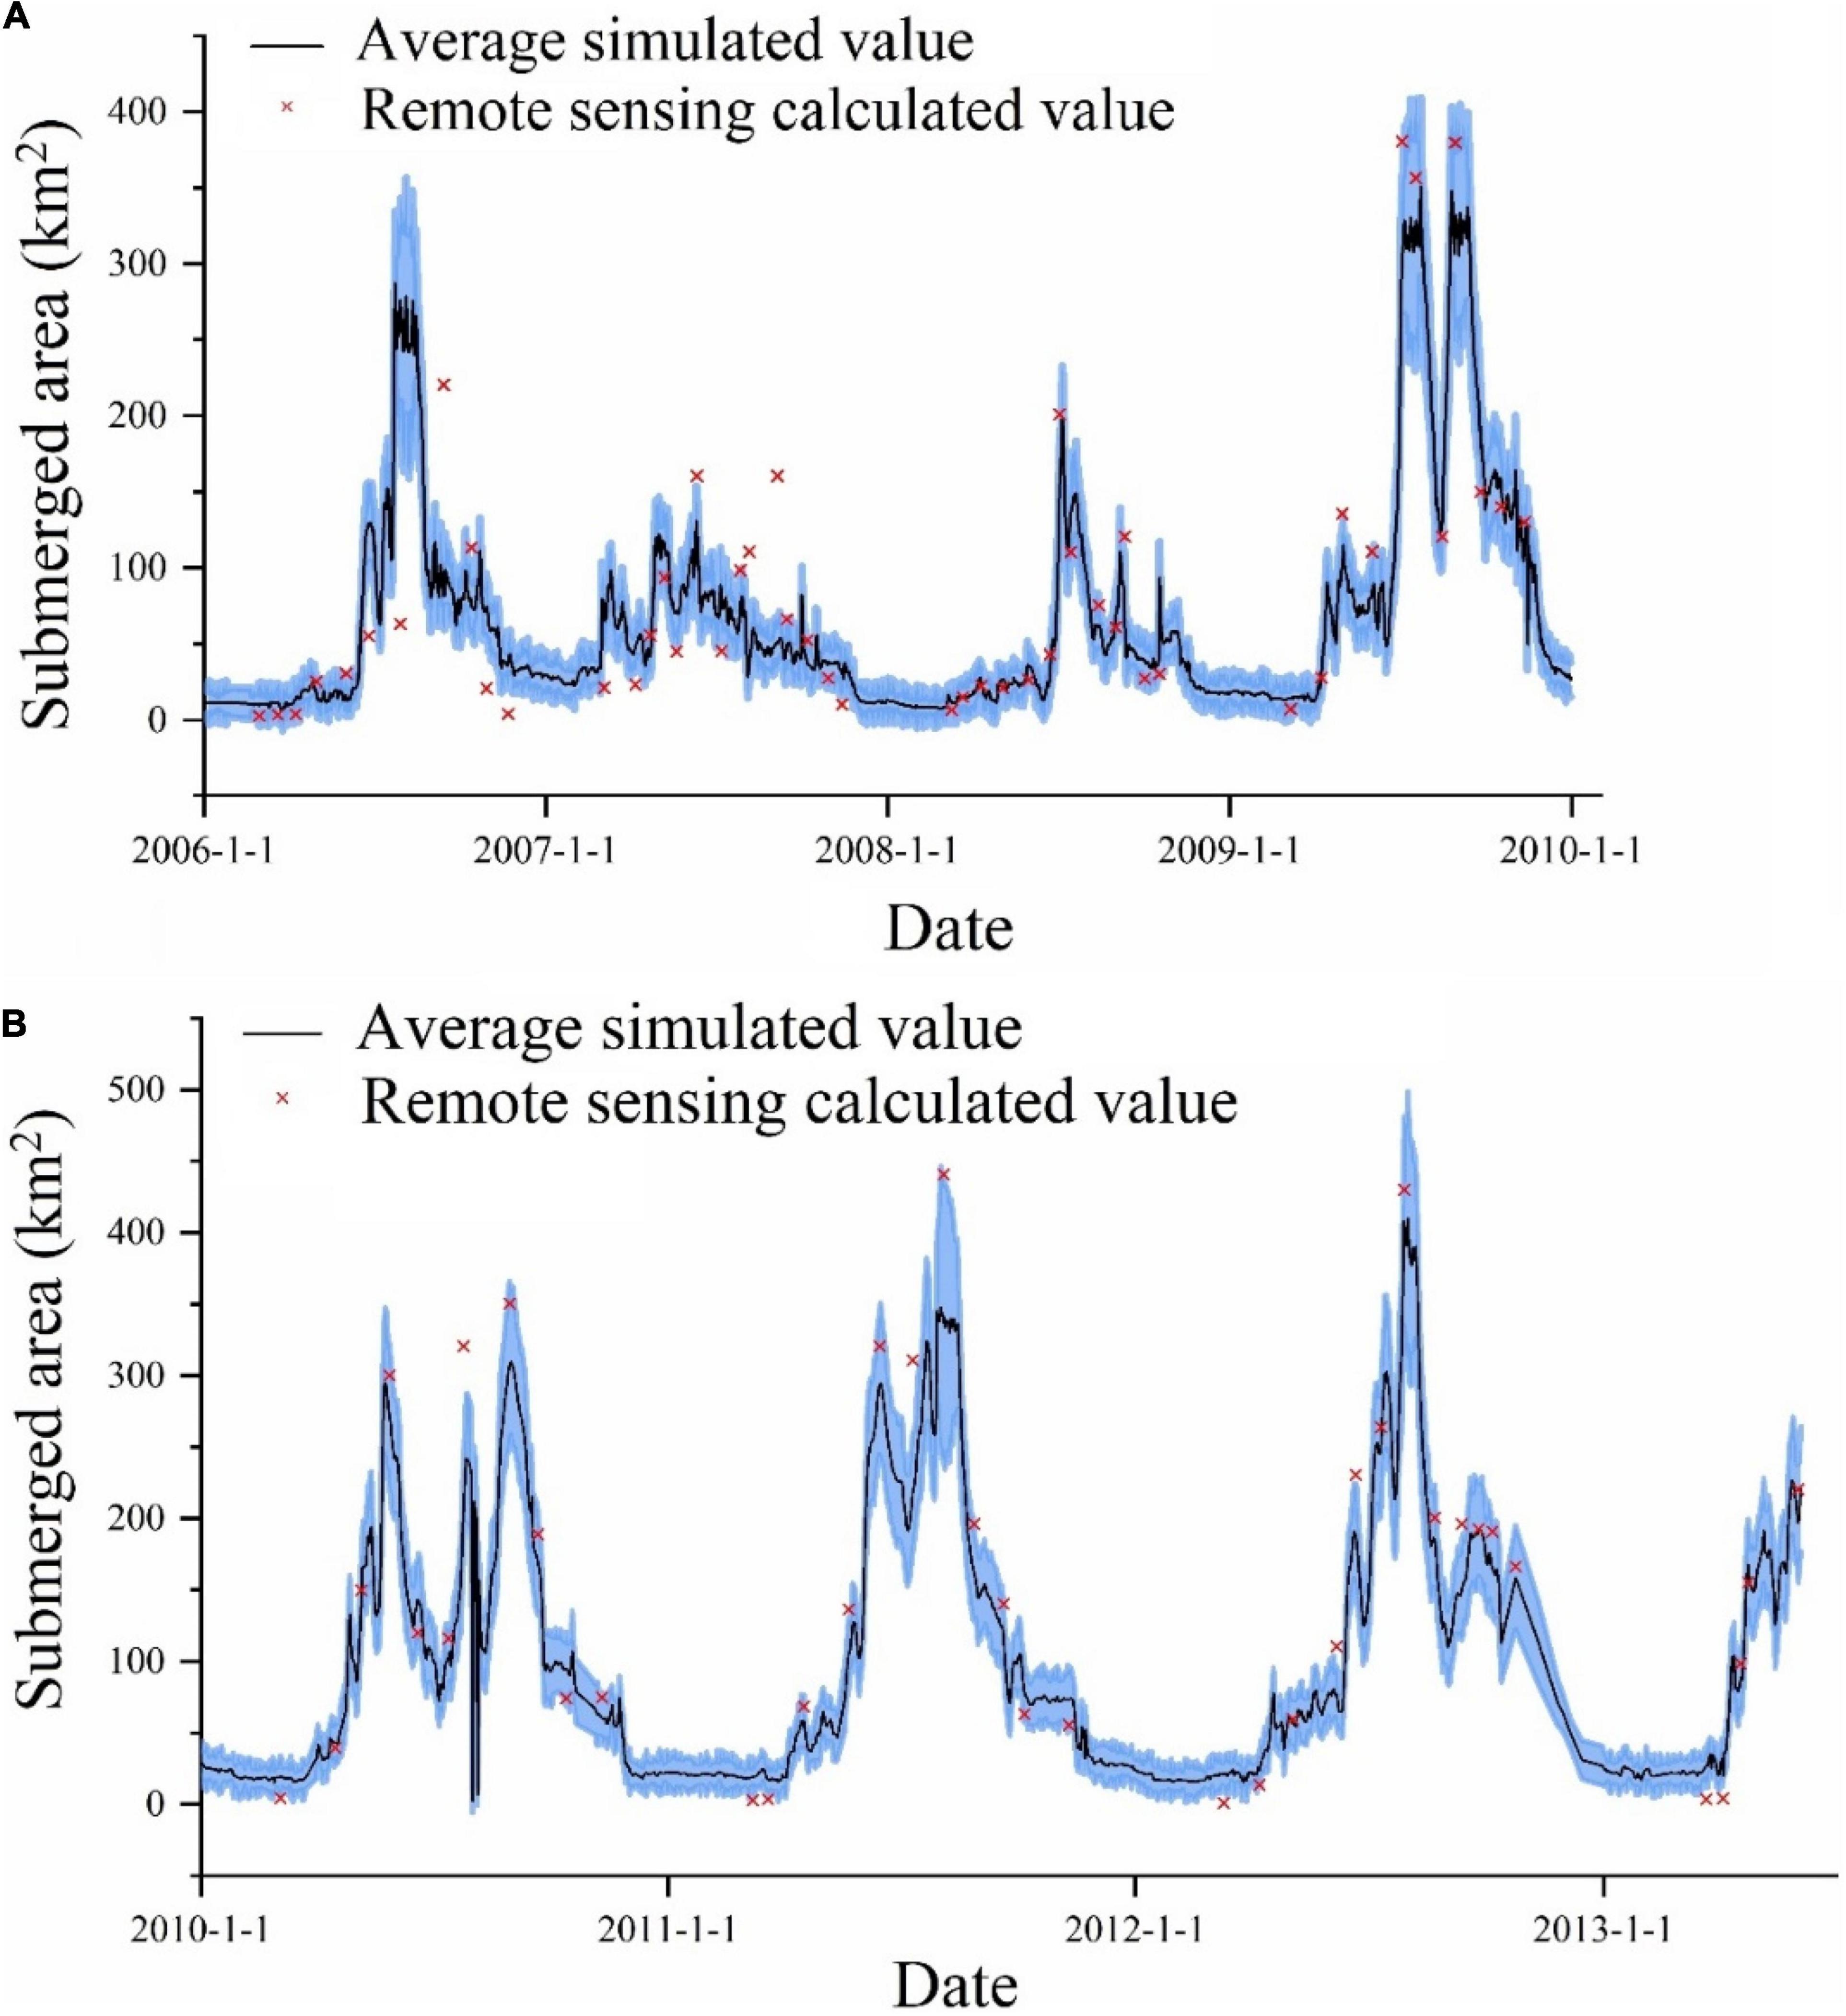
Figure 10. Simulations and remote sensing observations of the total submerged area of wetland (A: calibration period; B: validation period; blue area represents the range given across all parameter sets as evaluated for the calibration period).
As for the model simulation accuracy, PBIAS was within ±20%, NSE > 0.5, and R2 > 0.6 (Table 3), which met the requirements of model simulation accuracy. In addition, the simulation result of the validation period was better than that of the calibration period. Therefore, the model results are reliable.
Discussion
Horizontal Hydrodynamic Processes
The analysis of the surface water level fluctuation in the western part of the MNNR demonstrated that the lakes were mostly linked by hydrodynamic connections. The surface water area of the floodplain expands and shrinks with the seasons. When the level of the Nenjiang River exceeds the banks or embankments, the floodplain is submerged. In depressions, the surface water forms permanent or seasonal wetlands when the river level drops. The surface water in the uplands flows back to the river or infiltrates the shallow aquifer. The horizontal hydrodynamic processes mostly occur on the surface. Previous research has shown that there are three mechanisms of horizontal hydrodynamic processes: fill-spill, fill-merge, and river-floodplain connections.
When the net inflow of an upland wetland exceeds its capacity, the water overflows into another lower-lying wetland, called a fill-spill (Spence and Woo, 2003; Tromp-van Meerveld and McDonnell, 2006; Figure 11A). Fill-merge occurs when the water depth of one depression exceeds the internal overflow point of another adjacent depression. In this case, the flow of material is bidirectional rather than the unidirectional flow occurring during fill-spill (Leibowitz et al., 2016; Grimm and Chu, 2020; Figure 11B). Although the wetland storage within the floodplain differs, the floodplain can reduce and delay flooding by storing the water overflow from the riverbank. The floodplain is a depression outside the natural river embankment, including perennial and seasonal wetlands, among which the seasonal wetlands are primarily controlled by periodic floods (Figure 11C). The surface water level monitoring results indicate that the wetlands west of the MNNR achieve hydraulic connection by fill-spill. In contrast, wetlands within the floodplain are hydraulically connected by fill-merge and river-floodplain connections.
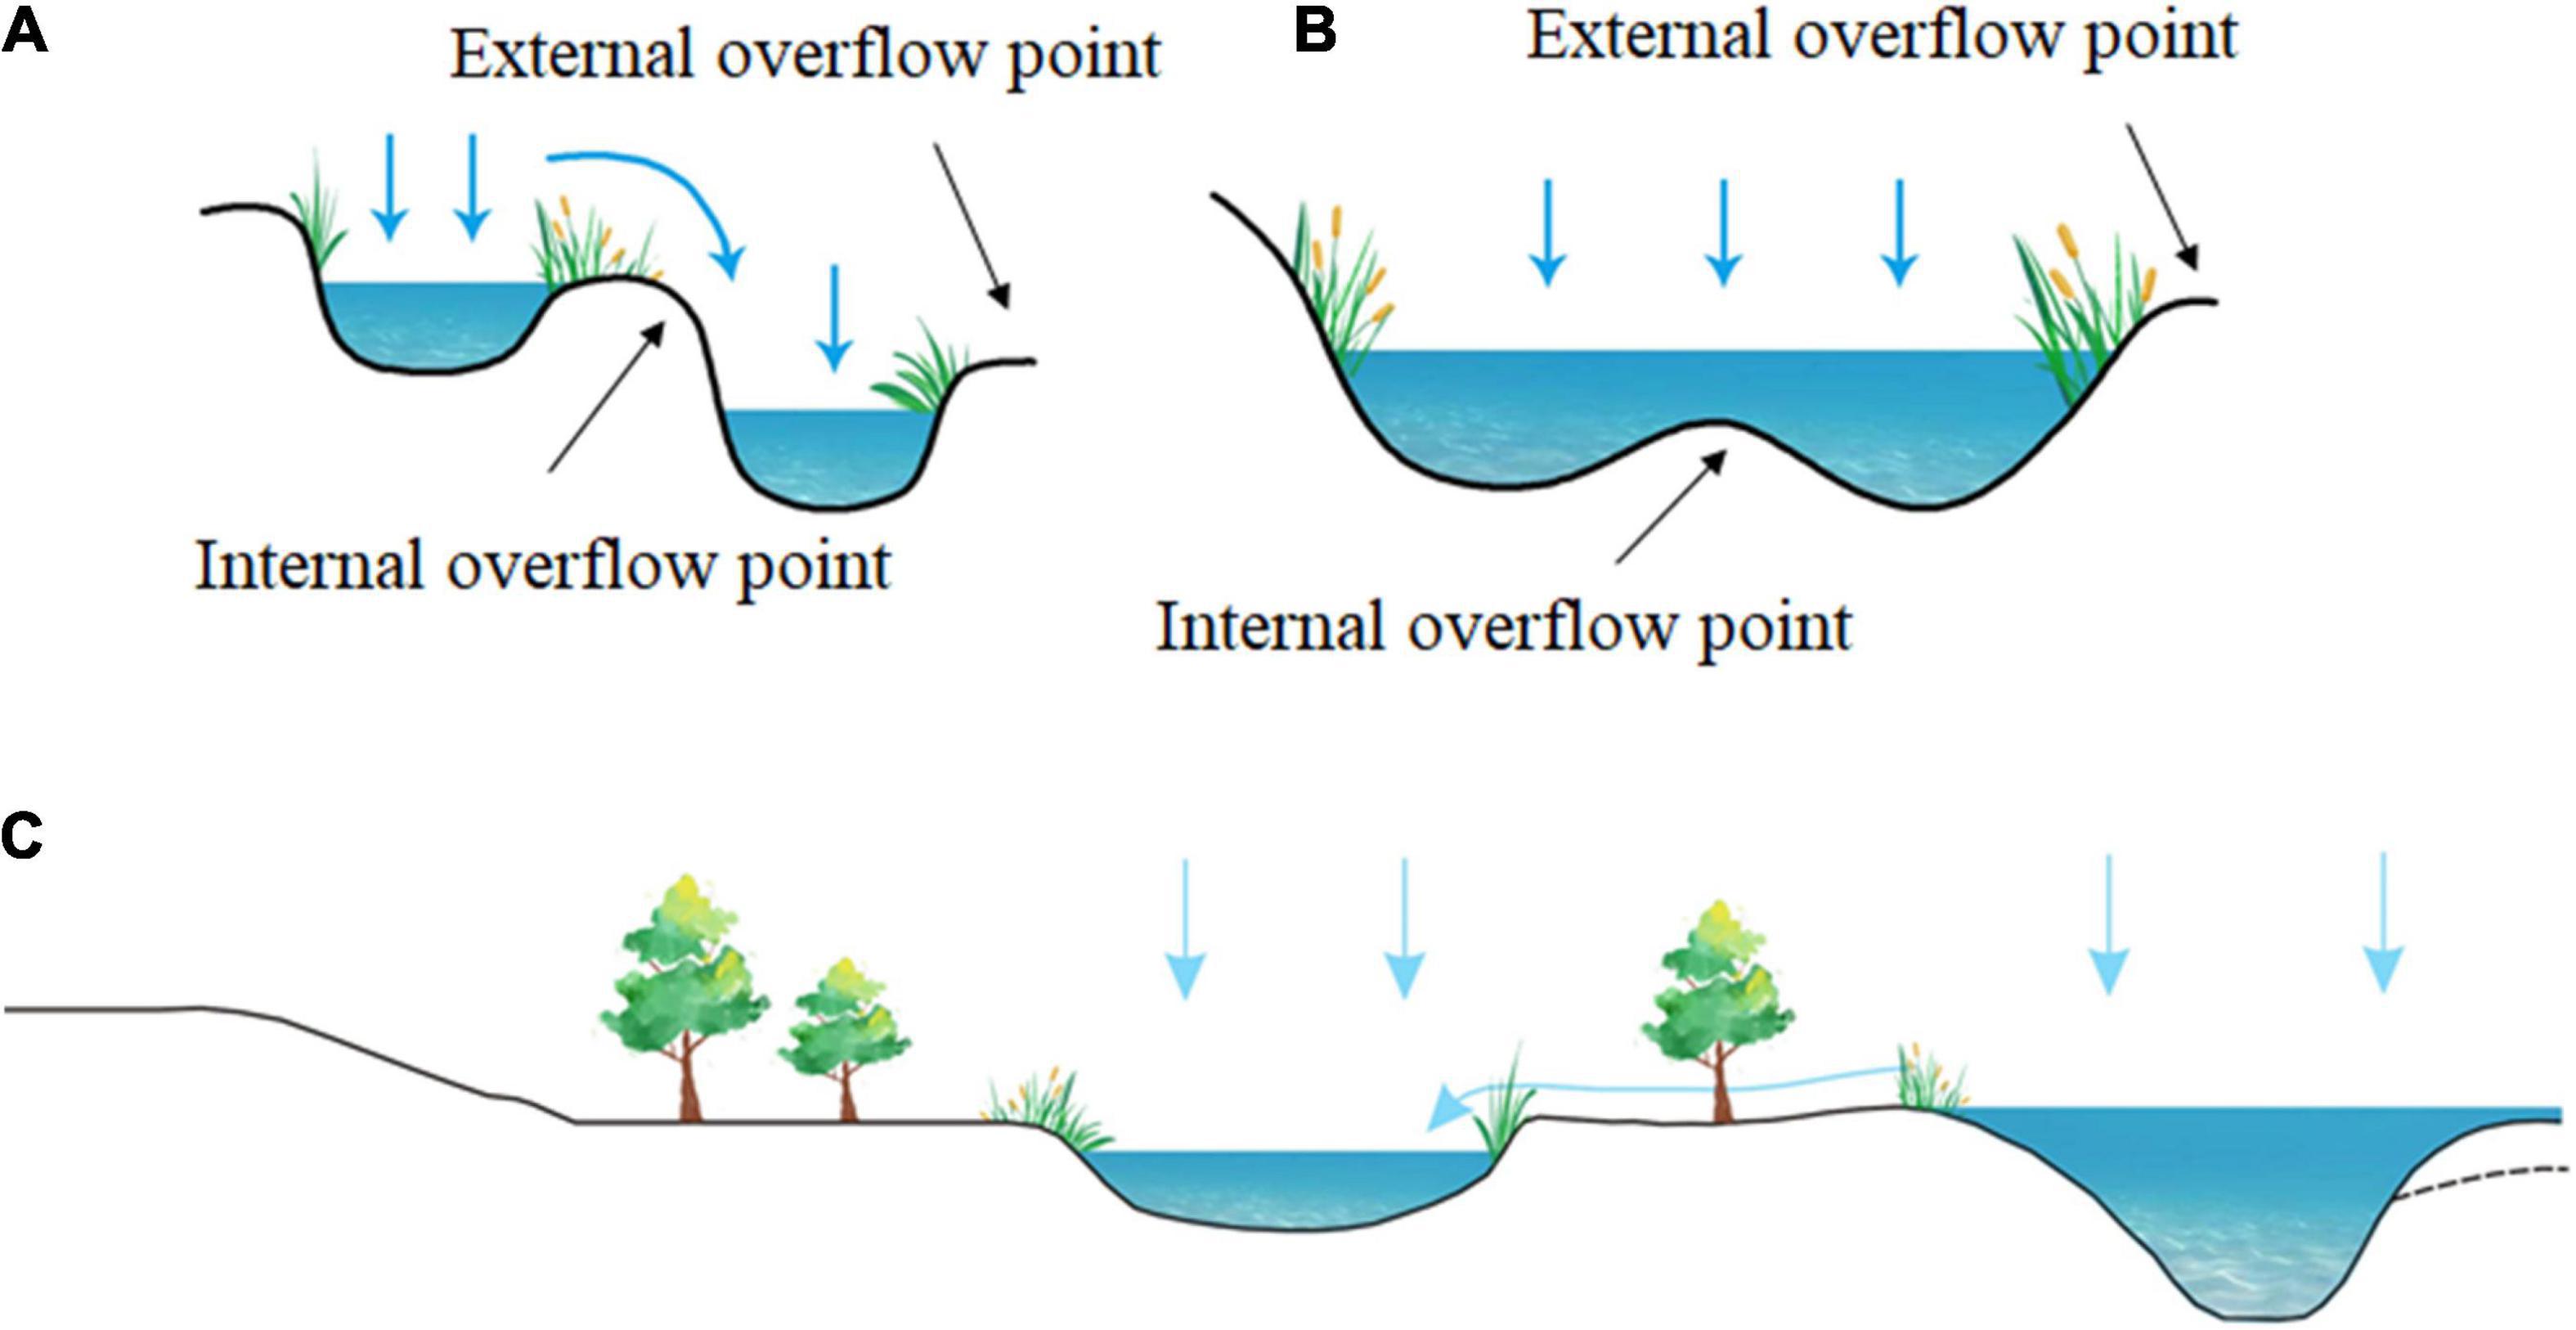
Figure 11. Mechanisms and types of surface hydrodynamic process (A. fill-spill; B. fill-merge; and C. river-floodplain connections).
Vertical Hydrodynamic Processes
Wetlands may recharge or discharge groundwater due to variations in the hydrogeological conditions. The surface water-groundwater exchange flux is affected by the hydraulic gradient of the groundwater and wetland surface water along with the hydraulic conductivity of the aquifer and wetland sediment. Precipitation, topography, and underground runoff are the major factors affecting the groundwater flow field in the study area. The hydrodynamic characteristics and seasonal variation of groundwater in the MNNR show that the upland topography around the lakes and the high permeability of the phreatic aquifer of Pleistocene sand and loess sub-sand provide favorable conditions for the flow of groundwater to the lakes. The regional groundwater flow field displays a hydraulic relationship between the wetland water and the surrounding groundwater in the uplands, which is predominantly affected by the shallow local groundwater flow system (Figure 12). However, the recharge mode (such as vertical or lateral recharge) and recharge intensity of groundwater to lake water differ, owing to the difference in hydraulic gradient and hydraulic conductivity of the sediment and aquifer. There may be an unsaturated zone of a certain thickness under the lake sediment due to very fine-grained silt with low permeability, which can affect the exchange flux between wetland surface water and groundwater.
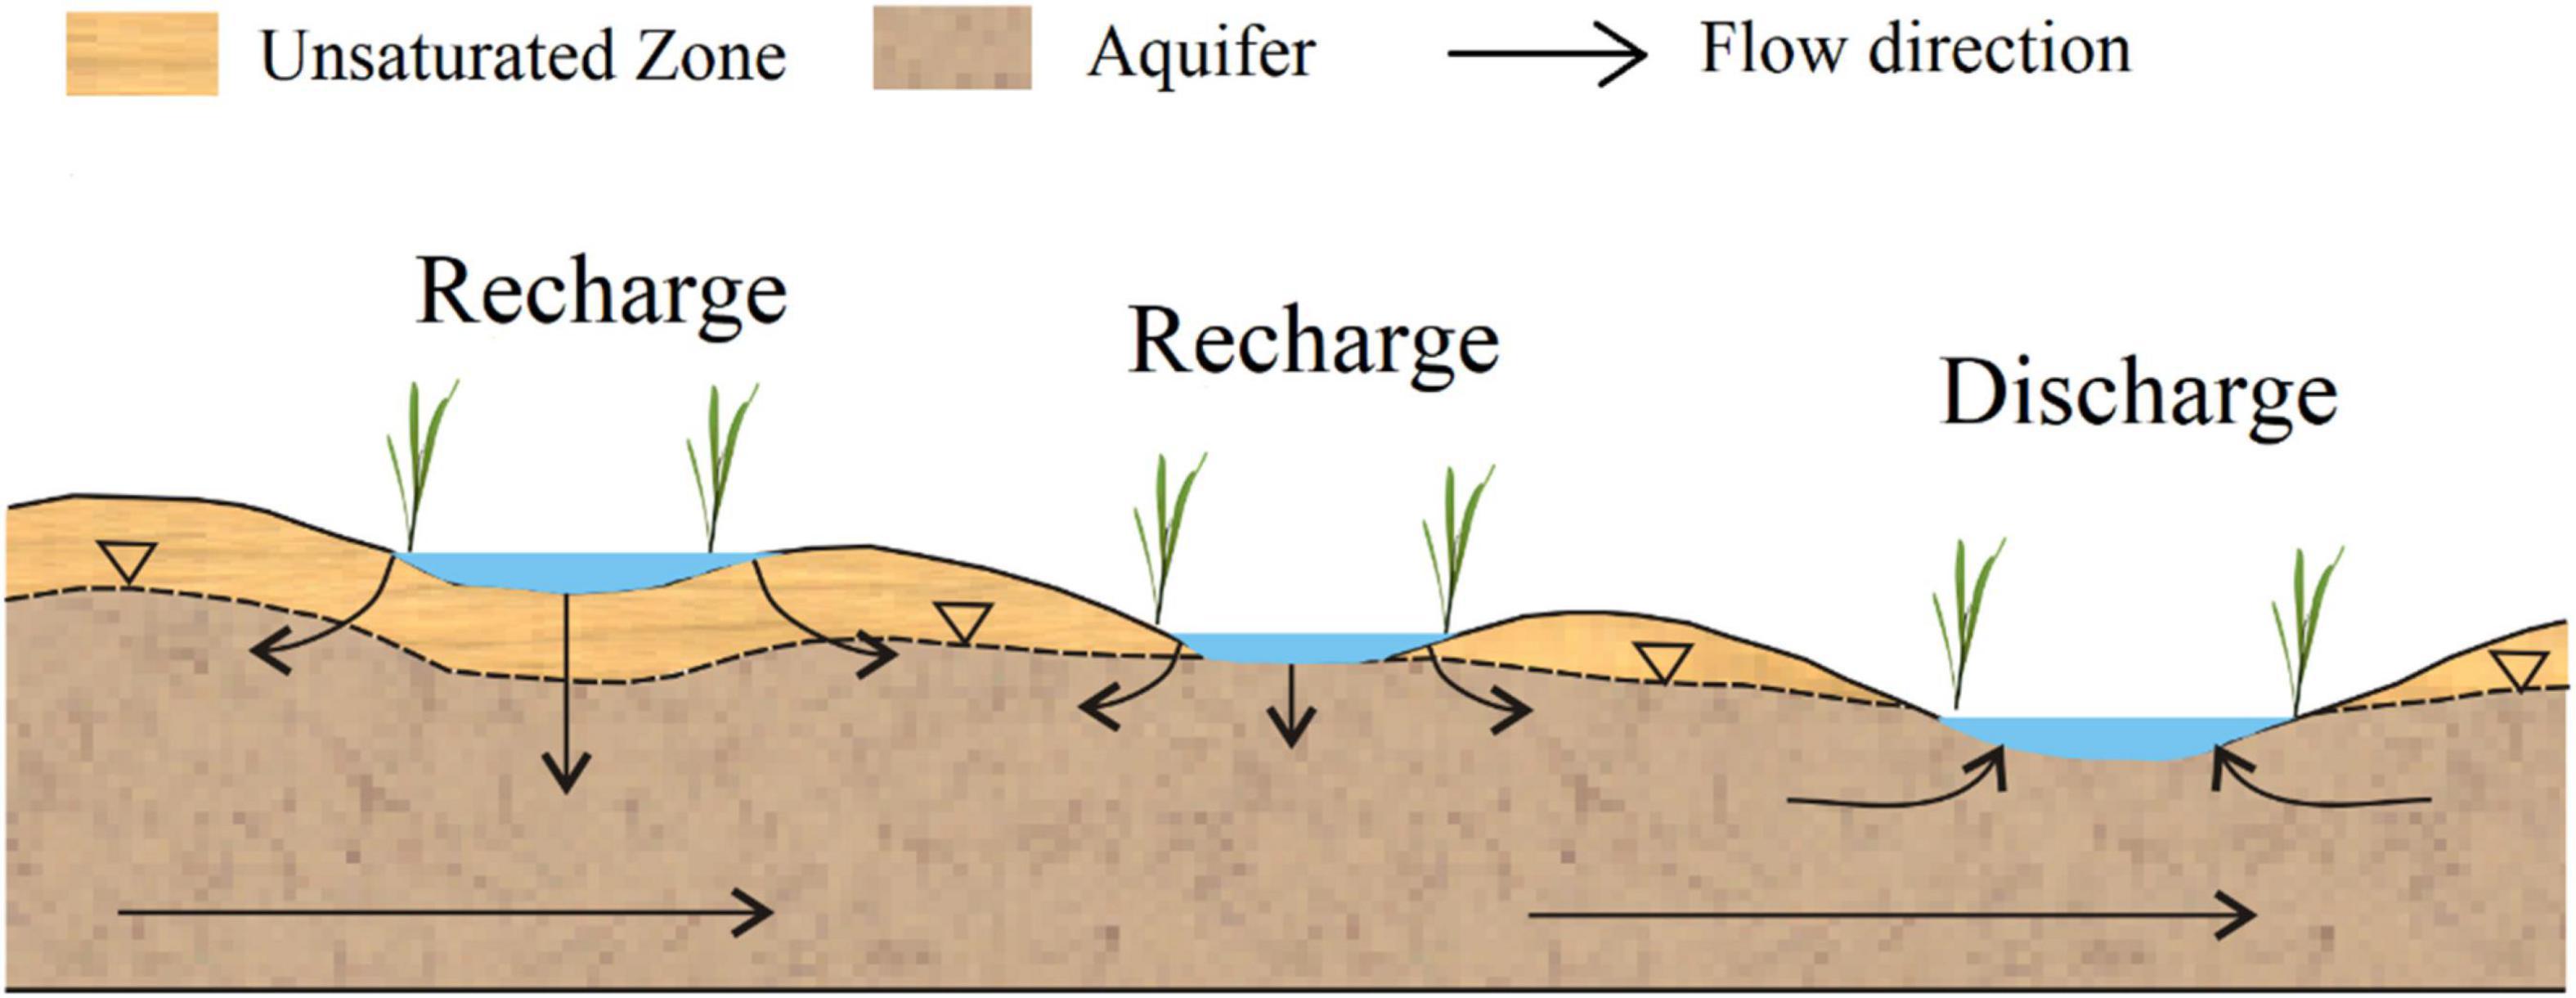
Figure 12. Schematic diagram of local groundwater flow system in wetland (modified from Hayashi et al., 2016).
Hydrodynamic processes are formed by surface-underground connectivity. In addition, a comprehensive analysis of topographic features and statistical characteristics of hydrological processes controlled by depressions will help reveal the internal relationship between them and improve watershed modeling.
Simulation of Hydrological Processes in Wetland
Under the premise of a known topography, there is a functional relationship between the volume of water resources and the wetland water level. The water level and volume directly affect the hydrodynamic characteristics. Therefore, it is important to obtain accurate water quantities and water levels. The hydrological processes of small-scale wetlands can be evaluated using on-site monitoring (Clilverd et al., 2013). However, it is impractical to explore the hydrological/hydraulic interactions between wetlands and other water bodies and aquifers in large catchment areas (Fan and Miguez-Macho, 2011). The application of hydrological models is a common method for studying the hydrological processes of large-scale wetlands and watersheds. Watershed hydrological models have been developed from lumped conceptual models to physics-based distribution models. Furthermore, wetlands are directly or indirectly included in watershed-scale models (Singh, 1997).
In the standard semi-distributed hydrological model, it is assumed that the entire area of the basin is well connected with its related outlet. In addition, the surface depression is usually concentrated at a depth to provide water storage and discharge functions for the entire basin. However, practically, the contribution area of the watershed is variable and can be significantly affected by the spatial distribution and dynamic connectivity of depressions (Wang N. et al., 2021). Direct water exchange between wetlands and other water bodies is limited. From the perspective of filling and overflow, wetlands can establish hydrological connectivity with downstream wetlands through local surface flow paths (Brierley et al., 2013). The recharge and discharge of wetlands and downstream water surface-groundwater exchange between wetlands and the surrounding uplands (Hayashi et al., 2016; Ameli and Creed, 2017) are important for the hydrological process of the depression, but they are not completely reflected in most watershed hydrological models. Therefore, a distributed hydrological model is required for improved simulations of wetland hydrological processes. In addition, an improved spatial resolution is required to predict and manage hydrological, biogeochemical, and biological functions on a larger spatial scale.
The SWAT model provides a limited description of hydrological exchange in wetlands, especially in terms of the local underground exchange between wetlands and uplands and the surface connection between wetlands. The surface and groundwaters from a single HRU are presumed to flow to rivers. However, in reality, they flow to the wetlands of the HRU (considering the model limitations and the complexity of each wetland separately, it is assumed that there is only one wetland in each HRU, and each wetland represents a collection of all scattered wetlands in its HRU). The water stored in each wetland either flows directly into the sub-basin as surface overflow or returns to the HRU as seepage. This method limits the characterization of surface and underground exchange. Surface water flows directly from the wetland collection to the sub-basin reach; therefore, it is not possible to simulate the exchange between wetlands through fill-spill dynamics or surface drainage characteristics (such as agricultural ditches). For underground exchange, the original SWAT model largely determines the inflow and outflow of wetlands as a function of HRU conditions. This modeling method excludes the representation of the variation in the water head gradient between wetlands and their surrounding uplands, while the variation in the water head gradient drives the amplitude and direction of local underground exchange (inflow and outflow; McLaughlin et al., 2014).
In wetland hydrological simulations, the vertical underground-surface interaction cannot be ignored, and further nuanced dynamic characterization can be combined with the groundwater model in future research to study the impact of depressions on the entire hydrological system.
Conclusion
The hydrodynamic characteristics of wetlands include the intensity, amplitude, period, and cycle characteristics of hydrological regime changes in wetlands. Furthermore, it explains the hydrological mechanism of hydrological connectivity in maintaining the structure and function of wetland systems. Therefore, groundwater plays a critical role in maintaining the integrity of wetland ecosystems.
The water balance of wetlands is controlled by the strong influence of watershed runoff and the exchange between wetland water and groundwater around wetlands. During the simulation of the hydrological processes of wetlands, the exchange of vertical groundwater should be completely considered to simulate the submerged area of wetlands more accurately. The dynamic change in the hydrodynamic characteristics should be further verified on a smaller scale and combined with hydrochemistry, isotope tracking, and other methods in future research.
Data Availability Statement
The original data presented in this study are included in the article further inquiries can be directed to the corresponding author.
Author Contributions
YL: investigation, data curation, writing – original draft preparation, and funding acquisition. GC: software, visualization, validation, and writing – review and editing. ST: conceptualization and methodology. SW: visualization and investigation. XL: supervision. All authors contributed to the article and approved the submitted version.
Funding
This research was funded by the National Key Research and Development Program of China (2019YFC0409103), Chinese Academy of Sciences (XDA23060402), China Postdoctoral Science Foundation (2021M693154), Natural Science Foundation of Changchun Normal University (2021-009), and the Jilin Association of Science and Technology (QT202029). We express their deep gratitude to the funding agency for supporting this research.
Conflict of Interest
The authors declare that the research was conducted in the absence of any commercial or financial relationships that could be construed as a potential conflict of interest.
Publisher’s Note
All claims expressed in this article are solely those of the authors and do not necessarily represent those of their affiliated organizations, or those of the publisher, the editors and the reviewers. Any product that may be evaluated in this article, or claim that may be made by its manufacturer, is not guaranteed or endorsed by the publisher.
References
Ameli, A. A., and Creed, I. F. (2017). Quantifying hydrologic connectivity of wetlands to surface water systems. Hydrol. Earth Syst. Sci. 21, 1791–1808. doi: 10.5194/hess-21-1791-2017
Brierley, G., Fryirs, K., Cullum, C., Tadaki, M., Huang, Q. H., and Blue, B. (2013). Reading the landscape: integrating the theory and practice of geomorphology to develop place-based understandings of river systems. Prog. Phys. Geogr. 37, 601–621. doi: 10.1177/0309133313490007
Budzisz, M., Cieśliński, R., and Woźniak, E. (2017). Effect of changes in groundwater levels on selected wetland plant communities. Art. Subm. XV, 19–29. doi: 10.5775/fg.2016.032.s
Carlson Mazur, M. L., Wilcox, D. A., and Wiley, M. J. (2020). Hydrogeology and landform morphology affect plant communities in a great lakes ridge-and-swale wetland complex. Wetlands 40, 2209–2224. doi: 10.1007/s13157-020-01312-6
Chen, G., Yue, D., Zhou, Y., Wang, D., Wang, H., Hui, C., et al. (2021). Driving factors of community-level plant functional traits and species distributions in the desert-wetland ecosystem of the Shule river basin, China. Land Degrdn. Dev. 32, 323–337. doi: 10.1002/ldr.3624
Clilverd, H. M., Thompson, J. R., Heppell, C. M., Sayer, C. D., and Axmacher, J. C. (2013). River–floodplain hydrology of an embanked lowland Chalk river and initial response to embankment removal. Hydrol. Sci. J. 58, 627–650. doi: 10.1080/02626667.2013.774089
Cui, G., Liu, Y., and Tong, S. (2021). Analysis of the causes of wetland landscape patterns and hydrological connectivity changes in Momoge National Nature Reserve based on the google earth engine platform. Arab. J. Geosci. 14:170. doi: 10.1007/s12517-021-06568-8
Davidson, N. C. (2014). How much wetland has the world lost? Long-term and recent trends in global wetland area. Mar. Freshw. Res. 65, 934–941. doi: 10.1071/MF14173
Eulie, D. O., Leonard, L., and Polk, M. (2021). Sediment deposition and availability in riparian wetlands. J. Coast. Res. 37, 302–315. doi: 10.2112/JCOASTRES-D-20-00020.1
Evenson, G. R., Golden, H. E., Lane, C. R., and Ellen, D. A. (2016). An improved representation of geographically isolated wetlands in a watershed-scale hydrologic model. Hydrol. Process. 30, 4168–4184. doi: 10.1002/hyp.10930
Evenson, G. R., Golden, H. E., Lane, C. R., McLaughlin, D. L., and D’Amico, E. (2018a). Depressional wetlands affect watershed hydrological, biogeochemical, and ecological functions. Ecol. Appl. 28, 953–966. doi: 10.1002/eap.1701
Evenson, G. R., Jones, C. N., McLaughlin, D. L., Golden, H. E., Lane, C. R., DeVries, B., et al. (2018b). A watershed-scale model for depressional wetland-rich landscapes. J. Hydrol. X 1:100002. doi: 10.1016/j.hydroa.2018.10.002
Fan, Y., and Miguez-Macho, G. (2011). A simple hydrologic framework for simulating wetlands in climate and earth system models. Clim. Dyn. 37, 253–278. doi: 10.1007/s00382-010-0829-8
Galliari, J., Santucci, L., Misseri, L., Carol, E., and del Pilar Alvarez, M. (2021). Processes controlling groundwater salinity in coastal wetlands of the southern edge of South America. Sci. Total Environ. 754:141951. doi: 10.1016/j.scitotenv.2020.141951
Grimm, K., and Chu, X. (2020). Depression threshold control proxy to improve HEC-HMS modeling of depression-dominated watersheds. Hydrol. Sci. J. 65, 200–211. doi: 10.1080/02626667.2019.1690148
Guo, H., Cai, Y., Yang, Z., Zhu, Z., and Ouyang, Y. (2021). Dynamic simulation of coastal wetlands for Guangdong-Hong Kong-Macao Greater Bay area based on multi-temporal Landsat images and FLUS model. Ecol. Ind. 125:107559. doi: 10.1016/j.ecolind.2021.107559
Hayashi, M., Kamp, G. V. D., and Rosenberry, D. O. (2016). Hydrology of prairie wetlands: understanding the integrated surface-water and groundwater processes. Wetlands 36(Suppl. 2), 237–254. doi: 10.1007/s13157-016-0797-9
Hu, S., Niu, Z., Chen, Y., Li, L., and Zhang, H. (2017). Global wetlands: potential distribution, wetland loss, and status. Sci. Total Environ. 586, 319–327. doi: 10.1016/j.scitotenv.2017.02.001
Johnston, C. (2020). Mechanisms of Wetland-Water Quality Interaction, Constructed Wetlands for Water Quality Improvement. Boca Raton, FL: CRC Press, 293–299. doi: 10.1201/9781003069997-35
Keddy, P. A. (2010). Wetland Ecology: Principles and Conservation. Cambridge: Cambridge university press. doi: 10.1017/CBO9780511778179
Leibowitz, S. G., Mushet, D. M., and Newton, W. E. (2016). Intermittent surface water connectivity: fill and spill vs. fill and merge dynamics. Wetlands 36, 323–342. doi: 10.1007/s13157-016-0830-z
Lu, Q., Bai, J., Yan, D., Cui, B., and Wu, J. (2020). Sulfur forms in wetland soils with different flooding periods before and after flow-sediment regulation in the yellow river delta, China. J. Clean. Prod. 276:122969. doi: 10.1016/j.jclepro.2020.122969
Makungu, E., and Hughes, D. A. (2021). Understanding and modelling the effects of wetland on the hydrology and water resources of large African river basins. J. Hydrol. 603:127039. doi: 10.1016/j.jhydrol.2021.127039
McLaughlin, D. L., Kaplan, D. A., and Cohen, M. J. (2014). A significant nexus: geographically isolated wetlands influence landscape hydrology. Water Resour. Res. 50, 7153–7166. doi: 10.1002/2013wr015002
Mitsch, W. J., Gosselink, J. G., Zhang, L., and Anderson, C. J. (2009). Wetland Ecosystems. Hoboken, NJ: John Wiley & Sons.
Qi, Q., Zhang, D., Zhang, M., Tong, S., An, Y., Wang, X., et al. (2021). Hydrological and microtopographic effects on community ecological characteristics of Carex schmidtii tussock wetland. Sci. Total Environ. 780:146630. doi: 10.1016/j.scitotenv.2021.146630
Roulet, N. T. (1990). Hydrology of a headwater basin wetland: groundwater discharge and wetland maintenance. Hydrol. Process. 4, 387–400. doi: 10.1002/hyp.3360040408
Singh, M., and Sinha, R. (2019). Evaluating dynamic hydrological connectivity of a floodplain wetland in North Bihar, India using geostatistical methods. Sci. Total Environ. 651, 2473–2488. doi: 10.1016/j.scitotenv.2018.10.139
Singh, V. P. (1997). Computer Models of Watershed Hydrology. 443–476. Highlands Ranch: Water Resources Publications
Spence, C., and Woo, M.-K. (2003). Hydrology of subarctic Canadian shield: soil-filled valleys. J. Hydrol. 279, 151–166. doi: 10.1016/S0022-1694(03)00175-6
Tromp-van Meerveld, H., and McDonnell, J. (2006). Threshold relations in subsurface stormflow: 2. the fill and spill hypothesis. Water Resour. Res. 42:W02411. doi: 10.1029/2004WR003800
Wang, N., Chu, X., and Zhang, X. (2021). Functionalities of surface depressions in runoff routing and hydrologic connectivity modeling. J. Hydrol. 593:125870. doi: 10.1016/j.jhydrol.2020.125870
Wang, Q., Rogers, M. J., Ng, S. S., and He, J. (2021). Fixed nitrogen removal mechanisms associated with sulfur cycling in tropical wetlands. Water Res. 189:116619. doi: 10.1016/j.watres.2020.116619
Wu, S., Tetzlaff, D., Goldhammer, T., and Soulsby, C. (2021). Hydroclimatic variability and riparian wetland restoration control the hydrology and nutrient fluxes in a lowland agricultural catchment. J. Hydrol. 603:126904. doi: 10.1016/j.jhydrol.2021.126904
Keywords: wetland, hydrodynamic characteristic, water level monitoring, water balance, Momoge National Nature Reserve
Citation: Liu Y, Cui G, Tong S, Wang S and Lu X (2022) Determination of the Hydrodynamic Characteristics of a Typical Inland Saline-Alkali Wetland in Northeast China. Front. Ecol. Evol. 10:939431. doi: 10.3389/fevo.2022.939431
Received: 09 May 2022; Accepted: 31 May 2022;
Published: 17 June 2022.
Edited by:
He Yixin, Key Laboratory of Mountain Ecological Rehabilitation and Biological Resource Utilization, Chengdu Institute of Biology (CAS), ChinaReviewed by:
Zhiqiang Tan, Nanjing Institute of Geography and Limnology (CAS), ChinaWenjun Cai, Taiyuan University of Technology, China
Copyright © 2022 Liu, Cui, Tong, Wang and Lu. This is an open-access article distributed under the terms of the Creative Commons Attribution License (CC BY). The use, distribution or reproduction in other forums is permitted, provided the original author(s) and the copyright owner(s) are credited and that the original publication in this journal is cited, in accordance with accepted academic practice. No use, distribution or reproduction is permitted which does not comply with these terms.
*Correspondence: Geng Cui, Y3VpZ2VuZ0BpZ2EuYWMuY24=
 Yan Liu1,2
 Geng Cui
 Shouzheng Tong