
95% of researchers rate our articles as excellent or good
Learn more about the work of our research integrity team to safeguard the quality of each article we publish.
Find out more
ORIGINAL RESEARCH article
Front. Ecol. Evol. , 09 August 2022
Sec. Ecophysiology
Volume 10 - 2022 | https://doi.org/10.3389/fevo.2022.934164
This article is part of the Research Topic Beyond Commensals — Interactions Between the Gut Microbiome and Metazoan Host Metabolic Performance View all 7 articles
 Elina Hanhimäki1,2
 Phillip C. Watts3†Esa Koskela3†
 Paweł Koteja4†
 Tapio Mappes3†
 Anni M. Hämäläinen3,4*†
Gut microbiota is expected to coevolve with the host's physiology and may play a role in adjusting the host's energy metabolism to suit the host's environment. To evaluate the effects of both evolved host metabolism and the environmental context in shaping the gut microbiota, we used a unique combination of (1) experimental evolution to create selection lines for a fast metabolism and (2) a laboratory-to-field translocation study. Mature bank voles Myodes glareolus from lines selected for high aerobic capacity (A lines) and from unselected control (C lines) were released into large (0.2 ha) outdoor enclosures for longitudinal monitoring. To examine whether the natural environment elicited a similar or more pronounced impact on the gut microbiota of the next generation, we also sampled the field-reared offspring. The gut microbiota were characterized using 16S rRNA amplicon sequencing of fecal samples. The artificial selection for fast metabolism had minimal impact on the gut microbiota in laboratory conditions but in field conditions, there were differences between the selection lines (A lines vs. C lines) in the diversity, community, and resilience of the gut microbiota. Notably, the selection lines differed in the less abundant bacteria throughout the experiment. The lab-to-field transition resulted in an increase in alpha diversity and an altered community composition in the gut microbiota, characterized by a significant increase in the relative abundance of Actinobacteria and a decrease of Patescibacteria. Also, the selection lines showed different temporal patterns in changes in microbiota composition, as the average gut microbiota alpha diversity of the C lines, but not A lines, was temporarily reduced during the initial transition to the field. In surviving young voles, the alpha diversity of gut microbiota was significantly higher in A-line than C-line voles. These results indicate that the association of host metabolism and gut microbiota is context-specific, likely mediated by behavioral or physiological modifications in response to the environment.
Host-associated microbiota composition is determined by complex interactions between the host, its environment, and the microbiota (Hufeldt et al., 2010; Groussin et al., 2017; Rothschild et al., 2018). According to the holobiont concept, gut microbiota is expected to evolve alongside the host's physiology, with the host and its associated microbiota potentially acting alike a unit of selection (Suzuki, 2017; Rosenberg and Zilber-Rosenberg, 2018). In evidence of such a connection, certain heritable bacterial taxa in human gut microbiota are associated with body mass index (fat storage) (Goodrich et al., 2014), indicating an evolved link between the host energy metabolism and gut microbiota. Gut microbiota and the metabolites it produces can improve host metabolic efficiency and health (Donohoe et al., 2011; Tremaroli and Bäckhed, 2012; den Besten et al., 2013; Koh and Bäckhed, 2020) (but note that some bacteria can also have adverse health effects, Bäumler and Sperandio, 2016). For instance, germ-free mice need to consume more calories to maintain the same body weight as mice with a gut microbiota (Bäckhed et al., 2004; Donohoe et al., 2011), indicating an effect of gut microbiota on metabolic efficiency. Furthermore, many host species depend on the metabolic capacity of the gut microbiota for digestion of food components (Krajmalnik-Brown et al., 2012; Moeller and Sanders, 2020), such that the fermentation of food by gut microbiota may supply between 10 and 70% of the host's daily energy requirements (Flint et al., 2008). Although gut microbiota and the host energy metabolism are, thus, critically interlinked, the general associations between the host metabolic rate and microbiota composition remain obscure beyond studies of humans and laboratory model species (Tremaroli and Bäckhed, 2012). Empirical data are lacking on the relative importance of gut microbiota in meeting demands made by differing host metabolic needs within an ecological context.
Considering the environmental context is important because the environmental conditions in which the holobiont evolved, and which it currently inhabits, shape the interactions of the host and microbiota as well as the performance of the holobiont per se. A rapidly adapting microbiota can possibly act as a buffer for the slower evolving host genome (Rosenberg and Zilber-Rosenberg, 2018; Moeller and Sanders, 2020), thus facilitating the host's ability to adjust to the prevailing (or changing) environmental conditions. The microbiota may, for example, be capable of utilizing a novel food resource and thus help the host meet its metabolic needs (Alberdi et al., 2016; Lindsay et al., 2020). The host individuals also express heterogeneity in their metabolic processes, energy needs, and thus susceptibility to, for example, resource availability (Bozinovic et al., 2007; Burton et al., 2011; Zeng et al., 2017), potentially reinforcing the significance of gut microbiota in matching the host's energy needs with its environment. Hosts may, for instance, respond to a changing environment with metabolic rate plasticity (Norin and Metcalfe, 2019), which could be aided by the effect of gut microbiota on the host metabolic rate (Bäckhed et al., 2004; Zhang et al., 2018; Lindsay et al., 2020; Scanes et al., 2021). Furthermore, the environmental conditions can influence gut microbiota directly by exposure to biotic (e.g., pathogens, Paris et al., 2020; predation risk, Zha et al., 2018) and abiotic features of the environment (e.g., contaminants, Paris et al., 2020; Brila et al., 2021; Lavrinienko et al., 2021) and indirectly via the host diet (Carmody et al., 2015; Martínez-Mota et al., 2020). The environment can, therefore, impact the host physiology, gut microbiota, and their interactions in complex ways.
The connection between the gut microbiota and the host metabolism has been exclusively studied in the laboratory (Viney, 2019; Lindsay et al., 2020). However, information derived solely from laboratory studies may overlook ecological processes that influence the gut microbiota, such as resource availability, colonization of the gut microbiota with environmental microbes, variation in diet, stress, as well as parasite and disease burden (Wang et al., 2014; Weldon et al., 2015; Leung et al., 2018). Indeed, evidence from multiple taxa indicate that the microbiota of captive animals consistently differs from their wild counterparts. For example, a reduced diversity and “humanization” of the microbiota of captive relative to wild animals has been described for many species (Leung et al., 2018; Alberdi et al., 2021; Trevelline and Moeller, 2022) with possible physiological and health effects for the hosts. For example, relocation of laboratory mice Mus musculus domesticus to outdoor enclosures resulted in an increase in diversity of their gut microbiota (Leung et al., 2018) and reconstitution of laboratory mice with the gut microbiota from wild mice reduced inflammation and increased survival following a viral infection (Rosshart et al., 2017). These results suggest that relying on laboratory studies misrepresents the diversity of conditions in which the host physiology and microbiota have evolved. Hence, the ecological and evolutionary roles of microbiota are best understood using a combination of laboratory and field studies (Calisi and Bentley, 2009). One way of achieving such a combined design is the comparison of host–microbiota interactions in laboratory vs. field conditions (as in Leung et al., 2018) which permits investigation of the holobiont in a standard vs. a completely novel environment.
In this study, we combined artificial selection for a fast metabolism in a mammalian host with a lab-to-field translocation to quantify the effects of both evolved host metabolism and environmental context in shaping the gut microbiota of a small mammal, the bank vole Myodes [Clethrionomys] glareolus. This was achieved by releasing laboratory-reared bank voles from high-metabolism selection lines (A lines) and control lines (C lines) into outdoor enclosures that represent a natural environment and collecting longitudinal samples of feces to monitor changes in the gut microbiota. The A-line bank voles have a higher exercise-induced and basal metabolic rate and increased daily food consumption compared to the unselected control (C-line) bank voles (Sadowska et al., 2015; Dheyongera et al., 2016), indicating an increased energy need by the former. Additionally, the bank vole selection lines differ in the expression of several genes related to metabolic processes (Konczal et al., 2015) and in some behavioral traits (Maiti et al., 2019). An earlier study found no significant differences in the composition of cecal microbiota between A and C lines (after 15 generations of selection, when the swim-induced metabolic rate was about 55% higher in the A lines than in the C lines; Kohl et al., 2016). However, this analysis was based on a moderate sample size (N = 48) and on animals kept in the laboratory and fed with a standard diet that likely homogenized the cecal microbiota community and reduced potential variation among lines. Also, with a further 12 generations of selection, a greater divergence in metabolism between the lines (84% difference in voluntary maximum oxygen consumption in generation 27, after which the selection was relaxed; Supplementary Figure S1) might afford a greater influence on the gut microbiota. In the wild, bank vole gut microbiotas are dominated by Bacteroidetes (approximate range of proportions 35–75%) and Firmicutes phyla (20–47%), with smaller contributions from Proteobacteria (2–9%) and Spirochaetes (3–12%) (Lavrinienko et al., 2018, 2020; Brila et al., 2021). The effects of lab-to-field transition on specific bacterial taxa are difficult to predict, but earlier studies have observed most consistent differences in the abundance of phyla Firmicutes, Bacteroidetes, and Proteobacteria between the gut microbiota of wild and captive animals (multiple species, McKenzie et al., 2017). Further differentiation may occur at lower taxonomic levels (Kohl and Dearing, 2014; Leung et al., 2018). Bank vole gut microbiota is also impacted by features of the environment, such as exposure to pollution (Lavrinienko et al., 2020; Brila et al., 2021) but interactive effects of environmental characteristics and host phenotype (e.g., metabolic rate) on microbiota have not been studied.
Here, we use these selection lines to examine the connection between host metabolic rate and gut microbiota relative to the environmental context. First, based on earlier studies (Kohl and Dearing, 2014; McKenzie et al., 2017; Leung et al., 2018), bank vole gut microbiota was expected to shift in composition and acquire new species (i.e., an increase in alpha diversity) when inhabiting a natural environment compared with a laboratory environment (Hypothesis HI). For the effect of selection on metabolism, we hypothesized that the differences between the gut microbiota of the A and C lines should be larger in the field than that in the laboratory because of stronger selective pressures in field conditions (Hypothesis HII). This prediction is based on (a) variation in energy availability and energy demand (Sadowska et al., 2015; Rudolf et al., 2017) (e.g., unlimited access to food and low energy demand in the laboratory, vs. greater energy expenditure associated with for example, foraging, territory defense, predation avoidance and breeding in the field), and (b) opportunities for the selection lines to express intrinsic physiological (Sadowska et al., 2015; Rudolf et al., 2017; Jaromin et al., 2019; Lipowska et al., 2020) and/or behavioral differences (Maiti et al., 2019) more broadly in natural conditions. The differences in diversity and composition of the gut microbiota would be expected if, for example, higher locomotory activity and energy requirement of the A-line voles result in an increased exposure to a larger variety of microbes associated with different microhabitats and/or dietary items. Finally, we predicted that these differences between the selection lines would be especially pronounced in animals that were born during the experiment and reared in field conditions (Hypothesis HIII). We hypothesized that the microbiota of young animals may show a higher degree of genetic differentiation because individuals reared in the field conditions could adjust their phenotype already during the early life when both the gut microbiota and the physiological phenotype are most malleable.
To address these three hypotheses, we determined the following: Which components of the gut microbiota are affected when bank voles that were born and raised in the laboratory inhabit a natural environment (HI); Whether evolved host metabolic capacity affects the transition or the eventual diversity and composition of the gut microbiota in a natural environment (HII); Whether the effects of evolved high aerobic capacity on gut microbiota are retained or enhanced in individuals raised in field conditions (HIII).
The bank vole (Myodes [Clethrionomys] glareolus) is a small rodent that inhabits mixed forest habitats in much of Europe and western Russia (Hutterer et al., 2021). Bank voles have a diverse diet of different plants, lichens, moss, and fungi as well as occasional invertebrates (Hansson, 1979).
In 2000-2001, 320 bank voles were captured in the Niepolomice Forest (near Kraków, southern Poland) and maintained in the laboratory for about seven generations, after which selective breeding was used to create four parallel selection lines of bank voles that had a significantly higher aerobic capacity (A lines) than the control line animals (four parallel C lines) that were not selected for any specific trait (Sadowska et al., 2008; Jaromin et al., 2019; Supplementary Figure S1). A similar number of families were used for breeding in both line types. The A-line voles were selected for high voluntary maximum rate of oxygen consumption reached during a standardized swimming test in thermoneutral conditions (Sadowska et al., 2008; Jaromin et al., 2019).
For this study, A- and C-line bank voles of generation 28 of the selection experiment were transported from Poland to Finland 2 weeks before the start of the experiment. After the transportation and prior to releasing them to the field enclosures, the voles were maintained in the laboratory animal facilities of the University of Jyväskylä and Konnevesi research station, Finland (see Supplementary materials for details on standard maintenance conditions). All voles were implanted with electronic identification microchips (Trovan) with unique identity numbers to enable recognition of the individuals throughout the experiment.
All procedures with animals conformed to national legislation and were approved by an ethical committee (permit ESAVI/3981/2018).
Voles were released into field enclosures (0.2 ha, each) located in an old field in Central Finland (see Supplementary Figure S2B for enclosure map) in the following two replicate rounds: Eighty-eight voles were released into 11 enclosures in late June 2019 and another 40 voles into 5 of these enclosures from mid-July 2019 [see Supplementary Figure S2A and Oksanen et al. (2003) for a description of enclosures]. Each of the 16 enclosure replicates contained 8 unrelated animals (4 males and 4 females) of either selection line (i.e., each enclosure contained only A- or C-line voles). Following release, voles were monitored with Ugglan Special multiple-capture live traps (Grahnab, Sweden) (20 evenly placed traps per enclosure, each with sunflower seeds and potato as bait) during weeks 1, 2, and 7 of the experiment (Figure 1). During trapping sessions, each lasting 2–4 days, traps were checked every 8 h (3 times/day). A fecal sample was collected (see below) once per trapping session from each surviving individual. The survival estimates during the experiment are shown in Supplementary Figure S3.
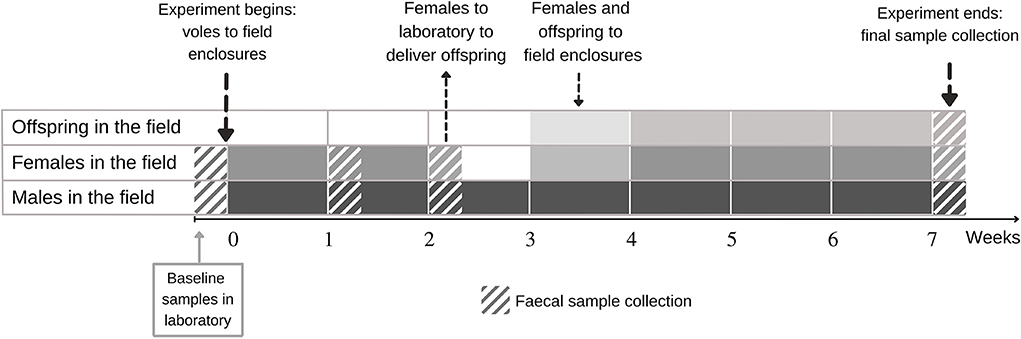
Figure 1. Design of experimental study on the effect of lab-to-field transition on the gut microbiota of the selection lines of bank voles that differ in metabolic capacity. Fecal samples were first collected in the laboratory, after which voles were transferred to the field enclosures for 7 weeks. The animals were captured alive for fecal sample collection and body mass measurement in weeks 1, 2, and 7. Females were taken to the laboratory in week 2 to deliver offspring. Within 3 days of the delivery the family was returned to the field. For the offspring, fecal samples were collected only in week 7.
Bank voles were free to interact within the enclosures, and most females were apparently gravid by the second capture session (2 weeks after release). To monitor reproductive output and to individually mark offspring, all females were returned to the laboratory at week 2 (Figure 1) where they were housed until they delivered a litter (or were confirmed not gravid). Females were maintained singly in standard cages with ad libitum food (the same rodent pellets used in the animal facilities prior to release in the field) and water, in rooms with windows to permit tracking the natural light cycle. Females were observed daily. On the day of the delivery, offspring were counted, weighed, and individually marked by distal phalanx removal (to enable subsequent identification) (Dahlborn et al., 2013). In total, 150 offspring were born to 30 dams, with 61 born to 12 A-line dams (mean litter size 5.1 ranging from 3 to 7) and 89 born to 18 C-line dams (mean litter size 4.9 ranging from 3 to 7). Within 3 days of the delivery of the litter, the females were returned to their original enclosure along with their offspring (following a standard protocol, Mappes et al., 1995). The surviving offspring (N = 69) were recaptured for fecal sampling at the end of the experiment (week 7), by which time the pups had weaned and were moving independently.
Fecal samples were collected from animals at four time points. The first sampling represented the baseline prior to release in the field (“week 0”), then field samples were collected in weeks 1, 2, and 7 (Figure 1). The animals were placed inside a small (0.75 L) ethanol-cleaned plastic box singly to obtain a fresh fecal sample. After defecation, the vole was removed, and the collection box immediately placed in a cooler (4°C). The fecal samples were collected using sterile equipment in the laboratory within 5 h and immediately stored at −20°C. We selected a subset of 245 samples for further processing to meet our objectives of monitoring longitudinal changes in microbiota and the subsequent microbiota of field-raised offspring (see Section Statistical analyses below for the sample sizes).
The DNA was extracted from ~0.1 g feces [homogenized using a TissueLyser (Qiagen) in 25 Hz for 10 min] using a Power Soil pro kit (Qiagen) according to the manufacturer's instructions. The DNA with 2 blank (negative control) samples were sent for paired-end (250 bp) sequencing at BGI (www.bgi.com/global) on an Illumina MiSeq. The PCR amplification and library preparation were performed according to the Earth Microbiome Protocol (www.earthmicrobiome.org/protocols-and-standards), and the target region for amplicon sequencing was the V4 region of the 16S rRNA, using the standard primer pair 515F/806R (Caporaso et al., 2012).
The raw sequence data were cleaned (trimmed according to quality threshold 30 with Illumina adapters removed) and demultiplexed by the sequencing center. The blank samples produced no sequences. The data were processed with QIIME2 v.2020.6 (Bolyen et al., 2019). The demultiplexed paired-end reads (26,087,717 read pairs) were joined using VSEARCH v.2020.6.0 (Rognes et al., 2016) and quality filtered (using default parameters) and denoised using Deblur v.2020.6.0 (Amir et al., 2017) with the first 19 bp removed from the beginning of each read (to remove primer sequences) and a total trim length of 269 bp. This process resulted in 5,348,913 sequences and 7,127 amplicon sequence variants (ASVs) with an average of 21,744 sequences and 751 ASVs per sample. Taxonomy was assigned to ASVs using the q2-feature-classifier plugin in QIIME2 and SILVA reference database v.138 (Quast et al., 2013). The ASVs that were not assigned to any bacterial phyla or were classified as mitochondria or chloroplasts were removed from the data, after which a midpoint rooted tree was constructed in QIIME2. The resulting final dataset consisted of 5,344,108 sequences and 7,105 ASVs with an average of 21,724 sequences and 752 ASVs per sample. The data were rarefied to 10,095 reads per sample with no loss of samples.
The data were analyzed and visualized using a combination of QIIME2 v.2020.6 (Bolyen et al., 2019) and R v.4.0.4 (R Core Team, 2020) packages ggplot2 (Wickham, 2016), lme4 v.1.1-26 (Bates et al., 2015), vegan v.2.5-7 (Oksanen et al., 2020), phyloseq v.1.34.0 (McMurdie and Holmes, 2013), and microbiome v.1.12.0 (Lahti and Shetty, 2017).
First, to test Hypothesis HI, we evaluated the overall effects of lab-to-field transition on gut microbiota using pooled data from both selection line types and characterized the differences between laboratory and field microbiota. For hypothesis HII, we examined the interactive effects of selection and environment to determine whether the gut microbiota of the selection lines respond differently to the change in environment. Here, we also evaluated the effect of selection on host metabolic capacity on the composition and diversity of the gut microbiota of bank voles in laboratory conditions to re-appraise the outcomes of a previous study on cecal microbiota of bank voles (Kohl et al., 2016). Finally, for hypothesis HIII, we tested whether there were differences in the composition and diversity of gut microbiota of field-reared offspring from the different selection lines.
We performed all microbiota composition analyses on the following two distinct data sets: (1) Founder animals (i.e., adults released from the laboratory) and (2) offspring born during the experiment. The founder data consisted of 198 samples from 61 individuals (98 and 100 samples from A-line and C-line voles, respectively). On a few occasions, especially with young voles, animals failed to produce sufficient feces during sampling, and thus the sample size for gut microbiota is smaller than the number of surviving individuals. The offspring data comprised samples from 47 animals (20 from A-line, 27 from C-line animals) (see Supplementary Table S1 for details on sample sizes).
Alpha diversity was calculated using Shannon index, Chao1 estimator and observed number of ASVs. Shapiro–Wilk normality test (Shapiro and Wilk, 1965) in R was used to test for normality of the alpha diversity datasets. Nested ANOVA of the parallel selection line nested within the selection line type (four lineages within A-line and C-line types, each) was utilized to compare alpha diversity between the lines. To account for repeated sampling of the same individuals, linear mixed-effect models were used with the package lme4 (Bates et al., 2015) to explain variation in alpha diversity throughout the experiment. For founders (adult voles), initial explanatory variables (fixed effects) included in the model to explain alpha diversity (Shannon, Chao1, observed ASVs) were sex (female, male), and the main effects and interaction of the selection line (A, C) and sampling event [weeks 0 (= laboratory), 1, 2, and 7]. We included animal ID (N = 61) nested in the (round-specific) enclosure replicate (N = 15, one of the replicates yielded no samples) as random effects. Including parallel lineage (four A and four C lines) as a random effect caused non-convergence of the model and was thus excluded. For offspring, the model included only the selection line (A, C) as a fixed effect and mother's ID (N = 16) as a random effect to account for possible maternal effects. The relatively small sample size and unbalanced distribution of offspring among the selection lines and enclosures prevented us from building more complex models. The visual inspection of residual plots did not reveal any clear deviations from homoscedasticity or normality. To account for multiple testing (performing the analyses using three different metrics of alpha diversity for the same data sets), the results are interpreted in light of Bonferroni-corrected significance threshold (0.05/3): p = 0.017.
Beta diversity was estimated using phyloseq package v.1.34.0 (McMurdie and Holmes, 2013) in R with several metrics to capture information on the presence, abundance, and phylogenetic relatedness of bacteria of the microbial communities. Therefore, we computed Bray–Curtis dissimilarity (Bray and Curtis, 1957), unweighted UniFrac, and weighted UniFrac distances (Lozupone et al., 2011) for each sampling event (week). We built principal coordinate analysis (PCoA) plots using phyloseq (McMurdie and Holmes, 2013) to visualize patterns of sample clustering. To compare beta diversities between groups, we computed permutational multivariate analysis of variance (PERMANOVA; 999 permutations) using the adonis2 function and used the functions betadisper and permutest to examine potential differences in dispersion among groups of samples in vegan (Oksanen et al., 2020).
A PERMANOVA was completed for the founder data for each separate sampling event, with the selection line (A, C), experimental replicate round (mid- or late summer), and sex (female, male) used as predictors. For the offspring data, a PERMANOVA was completed with the selection line and experimental replicate round as predictors. Conservative Bonferroni-corrected significance thresholds were determined for adults across all three tests and four sampling events (0.05/12) as p = 0.004, and for offspring as p = 0.017.
To examine the change in microbiota during the lab-to-field transition, we performed longitudinal pairwise-distance analyses of beta diversity with QIIME2 plugin longitudinal v.2020.6.0 (Bokulich et al., 2018b) between the samples collected in the laboratory and in the second week of sampling from the same individuals. The 2-week period in the field was selected to represent the field gut microbiota because 2 weeks (rather than week 1 or 7) was considered sufficient to permit the microbiota to adjust to a new environment (Leung et al., 2018), while retaining a larger sample size (N = 49 individuals) and a comparable time spent in the field for males and females (Figure 1).
The relative abundances of taxa were visualized using phyloseq (McMurdie and Holmes, 2013) and statistical differences between the abundances of each phylum in the gut microbiota between sampling events were calculated with a Kruskal–Wallis test applying a Bonferroni correction. A random forest classifier (QIIME2 plugin q2-sample-classifier; Bokulich et al., 2018a) reporting the ASVs that best predict group membership was employed to identify how well the microbiota could distinguish among the sampling events and the selection lines. Core microbiota (ASVs present in >50% of samples) was determined for laboratory and the pooled field samples using R package microbiome (Lahti and Shetty, 2017).
In line with our prediction (HI), gut bacterial community composition of bank voles (both selection lines) housed in the laboratory differed from the gut microbiota of bank voles living in the field. We observed a clear differentiation of the bacterial communities in the laboratory relative to the field conditions (Figure 2; samples that cluster together on the PCoA plot indicate more similar bacterial communities relative to samples that are further apart). This difference was more notable for unweighted UniFrac (Figure 2A) and Bray–Curtis metrics (Figure 2C) and less so for weighted UniFrac (Figure 2B). Out of the 13 bacterial phyla identified in our samples, Firmicutes and Bacteroidetes dominated the communities (>90% proportion) throughout the longitudinal sampling (Supplementary Figure S4), with the transition from laboratory to field having no significant effect on the relative abundances of these phyla (effect of sampling events on the relative abundance of Firmicutes: Kruskal–Wallis, χ2 = 1.7078, df = 3, p = 0.635; Bacteroidetes: Kruskal–Wallis, χ2 = 3.665, df = 3, p = 0.300; see Supplementary Table S4). The next most abundant bacterial phyla, Desulfobacterota, was also little impacted by the transition to the field (Kruskal–Wallis, χ2 = 3.328, df = 3, p = 0.344). By contrast, the phyla Actinobacteria increased (Kruskal–Wallis, χ2 = 106.800, df = 3, p <0.001) and Patescibacteria decreased in relative abundance in the field compared with the samples from animals housed in the laboratory (Kruskal–Wallis, χ2 = 45.959, df = 3, p <0.001). Overall, the core microbiota of bank voles in the laboratory consisted of 299 ASVs (present in more than half of the samples), whereas field samples incorporated 9% fewer core features (274 core ASVs) (Supplementary Table S5).
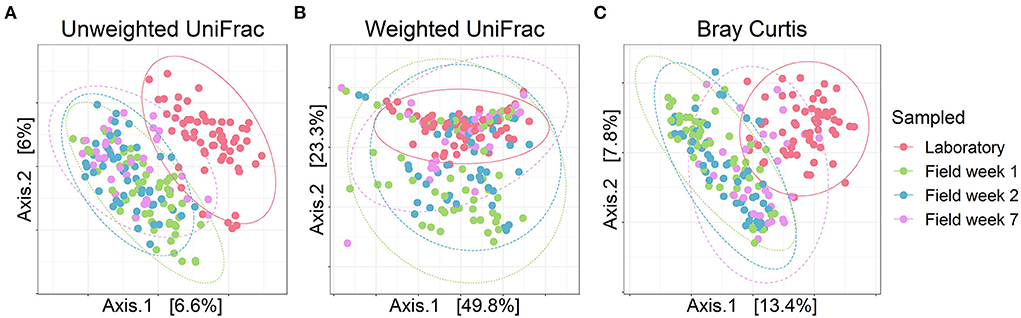
Figure 2. Bacterial composition of the founder bank vole gut microbiotas throughout the experiment. PCoA plots for (A) Unweighted UniFrac, (B) Weighted UniFrac and (C) Bray–Curtis dissimilarity. Dots represent individual samples, colors represent each sampling event and ellipses indicate 95% confidence intervals. Selection lines (A and C line) are pooled for these analyses.
The random forest classifier provided further support for the separation of laboratory and field samples based on species composition of the gut microbiota. The classifier identified laboratory samples as distinct from all field samples with 100% accuracy (Supplementary Figure S5; Supplementary Table S6). The different time points of the field samples were separated at an accuracy of 70–91%, indicating higher similarity among field samples than between the lab and the field samples. The three most important taxa differentiating all sampling events were the family Clostridia vadinBB60 group from phyla Firmicutes (random forest classifier feature importance value = 0.057) and two different strains of Actinobacteriota (both belonged to the family Eggerthellaceae, feature importance values of 0.041 and 0.036) (Supplementary Figure S7).
At baseline (in samples collected from voles in the laboratory prior to release into field enclosures), the diversity of gut (fecal) microbiota was similar for A-line and C-line founder animals. Alpha diversity did not differ between the selection line types (A vs. C) according to any of the indices [nested ANOVA: Shannon index: selection line type F(1,53) = 0.008, p = 0.929, lineage nested within the selection line type F(6,53) = 2.645, p = 0.026; Chao1 index: selection line type F(1,53) = 0.206, p = 0.651, lineage nested within the selection line type F(6,53) = 2.561, p = 0.030; observed ASVs: selection line type F(1,53) = 0.107, p = 0.745, lineage nested within the selection line type F(6,53) = 2.787, p = 0.020].
The A and C lines also had largely overlapped beta diversity in the laboratory (Figure 4), showing no difference based on Bray–Curtis dissimilarity [PERMANOVA; selection line (A vs. C) and sex as explanatory variables; p = 0.203, F = 1.210, R2 = 0.020] and weighted UniFrac distance (p = 0.224, F = 1.289, R2 = 0.021). For unweighted UniFrac, there was a slight but, after Bonferroni–correction, statistically non-significant difference between the gut microbiota of A- and C-line animals (p = 0.009, F = 1.478, R2 = 0.024) (for details, see Supplementary Figure S8). Group dispersions of the microbiota beta diversity between A and C lines were similar for all groups (Supplementary Table S8).
As hypothesized (HII), the selection lines showed slight differences in response to the transition in the composition of the bacteria and initial response in diversity. Alpha diversity of the gut microbiota of A-line voles increased gradually over time spent in the field (16% increase in ASV count from laboratory to field week 7) (Figures 3A–C). In contrast, for C-line voles, we observed a temporary decline in the alpha diversity from the laboratory to the first sampling event in the field (Figures 3A–C; significant interaction of the selection line and sampling event week 1 for Shannon index, Chao1 index and observed ASV count, Supplementary Figure S3). Thereafter, the C-line voles' alpha diversity increased such that by week 7 gut microbiota alpha diversity exhibited a similar response to the lab-to-field transition as did the gut microbiota of the A-line voles (e.g., an ~16% increase in ASV count from laboratory to field week 7). Alpha diversity did not differ among sexes (Supplementary Table S3). Notably, there was substantial inter-individual variation in alpha diversity at each sampling event and in the longitudinal patterns of change (Figures 3D–F).
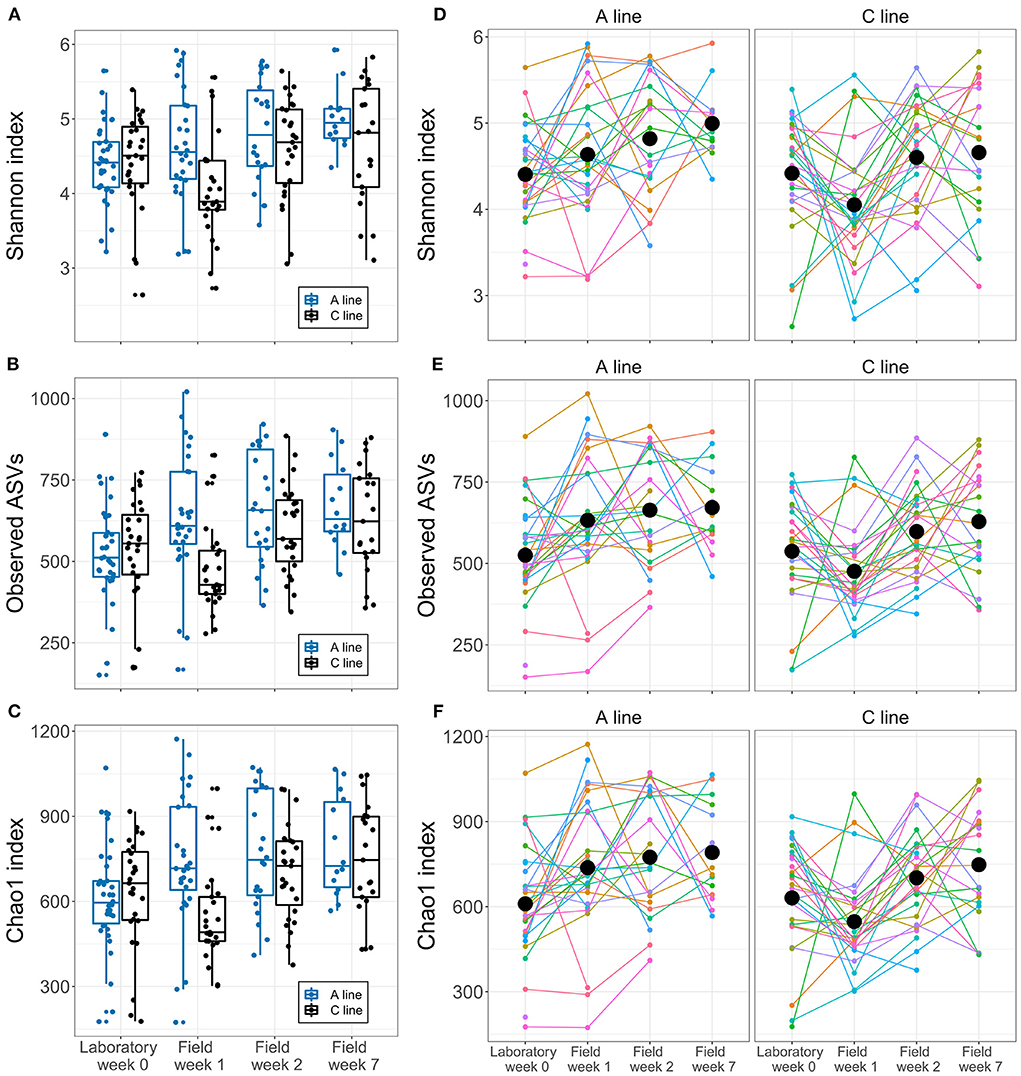
Figure 3. Longitudinal changes in bank vole microbiota alpha diversity during the transition from laboratory to field. (A–C) Boxplots for each alpha diversity index at each sampling points (A line, blue; C line, black). Dots represent individual samples. (D–F) Within- and between-individual variation in alpha diversity. Colored lines represent different individuals, connecting samples collected from the same individuals at different times. Black dots represent the mean index of each selection line type within each sampling event.
As predicted (HII), we also observed differences in the response of the microbiota of the selection lines to the change of environment. In contrast to the similar and not statistically different microbiota at baseline (see Section Effect of evolved metabolic capacity on gut microbiota of founders in the laboratory), in all field sampling events we observed subtle (R2 ≤ 0.05), but statistically significant, differences between A and C lines for unweighted UniFrac distance (at field week 1, p = 0.001, R2 = 0.040; field week 2, p = 0.001, R2 = 0.038; field week 7, p= 0.001, R2 = 0.050) and similar trends for Bray–Curtis dissimilarity (field week 1, p = 0.002, R2 = 0.044; field week 2, p = 0.007, R2 = 0.035; field week 7, p = 0.005, R2 = 0.050), but not for weighted UniFrac (field week 1, p = 0.313, R2 = 0.021; field week 2, p = 0.617, R2 = 0.012; field week 7, p = 0.358, R2 = 0.029) (PERMANOVA tests controlling for sex and experiment round, Bonferroni-corrected significance threshold p = 0.004; see Supplementary Table S8; Figure 4).
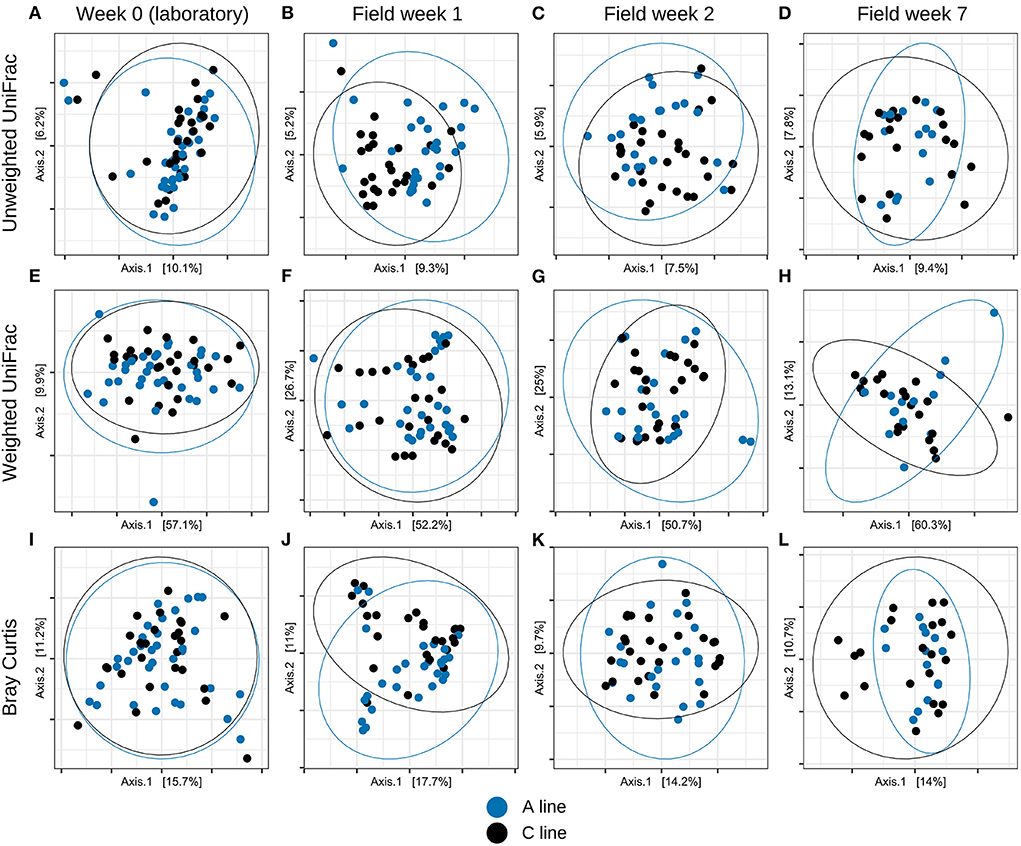
Figure 4. PCoA plots of bacterial community composition displaying the longitudinal change in the bank vole gut microbiotas throughout the experiment for (A–D) Unweighted UniFrac, (E–H) Weighted UniFrac and (I–L) Bray–Curtis dissimilarity. Dots represent individual samples (A line, blue; C line, black), ellipses indicate 95% confidence intervals.
Further quantification of the magnitude of change in the bacterial communities between the laboratory and week 2 in the field indicated different patterns of change between the selection lines. Using the Bray–Curtis dissimilarity metric, we observed that the gut microbiota of C line animals changed significantly more than did the gut microbiota of the A-line animals (Mann–Whitney, U = 175.0, p = 0.015; Bonferroni-corrected threshold p = 0.017). In contrast, when using the weighted UniFrac metric, the change from lab to field was marginally greater for microbiota of the A-line animals than C-line animals (Mann–Whitney, U = 410.0, p = 0.024), while there was no difference between lines using the unweighted UniFrac metric (Mann–Whitney, U = 316.0, P = 0.710) (Supplementary Figure S6).
Despite the subtle differences in gut microbiota communities, A- and C-line voles shared the same most abundant bacterial phyla both in the laboratory and in the field week 2 (Figure 5). No differences were found in the relative abundances of the top-5 abundant phyla between A and C lines in the laboratory nor in the second week in the field (Supplementary Table S9).
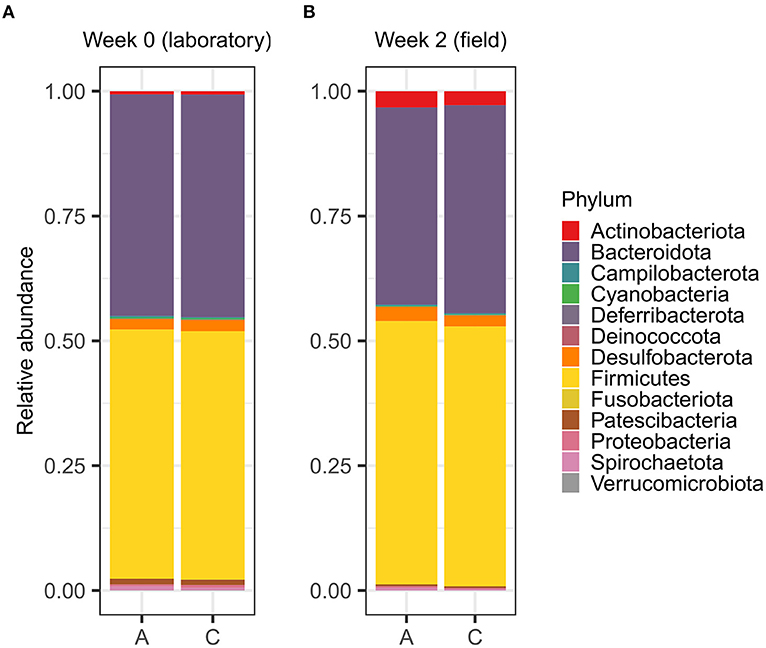
Figure 5. Relative abundances of bacterial phyla in the gut microbiotas of the adult bank vole selection lines (A) maintained in the laboratory and (B) after inhabiting the field enclosures for 2 weeks.
The random forest classifier distinguished between the A- and C-line gut microbiotas with an overall accuracy of 90% (Supplementary Figure S7; Supplementary Table S10). The C-line samples were correctly identified with 95% accuracy, whereas A-line samples were correctly assigned with slightly lower success (85% accuracy). The three most important bacterial phyla used to distinguish between the A- and C-line microbiota were two strains of Campylobacteria (both family Helicobacteraceae, feature importance values of 0.032 and 0.027) and one strain of Bacteroidetes (family Rikenellaceae, feature importance value of 0.020) (Supplementary Table S11).
In support of Hypothesis HIII, the microbiota of the young voles showed similar, but somewhat enhanced, effects of selection compared with the founder bank voles. The alpha diversity of the offspring fecal microbiota was slightly higher in A-line animals compared with the microbiota from C-line animals (Figure 6; Supplementary Table S12). This difference in alpha diversity was statistically significant for observed ASV count and Chao1 index, but not for Shannon index. The mother's identity explained a modest proportion of the variation in alpha diversity (1.2–8.5% difference in marginal vs. conditional R2, Supplementary Table S12; e.g., for the observed ASVs: marginal/conditional R2 = 0.127/0.157).
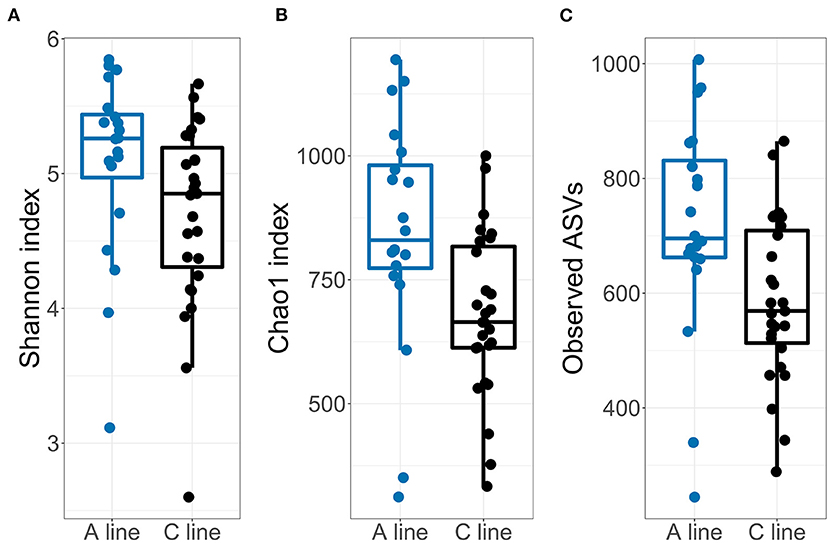
Figure 6. Diversities of the gut microbiotas of the offspring bank voles born during the field experiment for (A) Shannon index, (B) Observed ASV count and (C) Chao1 index. Dots represent individual samples (A line, blue; C line, black).
Similarly, the composition of the gut microbiota of the offspring bank voles differed between A- and C-line offspring, with slightly more variance in beta diversity explained (R2) by the selection line than apparent for the founders (PERMANOVA; experimental round and the selection line type as explanatory variables; Bonferroni-corrected significance threshold p = 0.017) for unweighted UniFrac distance (F = 3.15, R2 = 0.063, p = 0.001) and Bray–Curtis dissimilarity (F = 3.043, R2 = 0.059, p = 0.001) but not for weighted UniFrac distance (F = 0.839, R2 = 0.017, p = 0.450) (Figure 7; Supplementary Table S8). There was no significant difference in group dispersion of beta diversity among offspring of A and C line (Supplementary Table S8).
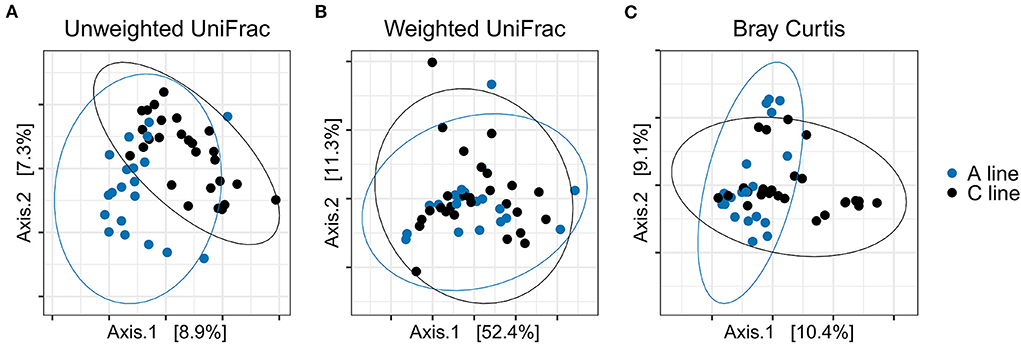
Figure 7. PCoA plots of bacterial community composition of the gut microbiotas from the offspring bank voles reared in field conditions (blue, A line; black, C line). (A) Unweighted UniFrac, (B) Weighted UniFrac, (C) Bray–Curtis dissimilarity. Dots represent individual samples and ellipses indicate 95% confidence intervals.
Similar to the founder bank voles, the random forest classifier was able to differentiate A- and C-line offspring gut microbiotas with and overall accuracy of 90% (Supplementary Figure S8; Supplementary Table S13). The C-line samples were correctly assigned in all cases (100% accuracy), while A-line samples were identified with lower success (75% accuracy). The three most important phyla used to differentiate between A- and C-line offspring samples were two strains of Firmicutes (families Ruminococcaceae, feature importance value of 0.074; and Lachnospiraceae, feature importance value of 0.071) and Campilobacterota (family Helicobacteraceae, feature importance value of 0.062) (Supplementary Table S14).
Gut microbiota is thought to be a dynamic part of the holobiont, facilitating the host's response to a new environment (Rosenberg and Zilber-Rosenberg, 2018). While the significance of gut microbiota for energy acquisition is unquestionable, associations between host metabolic needs and microbiota are poorly understood in natural environments. Thus, the aim of this study was to experimentally evaluate the joint effects of fast metabolism and environmental context in shaping the gut microbiota using a small mammal as a model. We accomplished this by combining (1) an experimental evolution approach to generate the metabolic selection lines, and (2) a complete environmental change by translocation from the laboratory to field conditions. In line with findings from earlier studies, the alpha diversity of the gut bacteria increased and the bacterial community composition changed when animals were transitioned from laboratory into a natural environment. Evolved high aerobic metabolism had a somewhat larger impact on the bank vole gut microbiota composition in field conditions than in the laboratory, suggesting that certain aspects of the gut bacteria may associate with the host's metabolic needs in the different environments. Furthermore, the effect of selection on gut microbiota tended to be stronger among young voles reared in field conditions than in voles reared in the laboratory, likely indicating the importance of the early life environment on microbiota. Our results complement the previous laboratory studies but highlight the significance of an ecological context in host–microbiota interactions and suggest that subtle but possibly biologically significant interactions occur among host physiology, gut microbiota, and the environment.
Changes in gut microbiota were largely consistent with the previous studies comparing gut microbiota of wild vs. captive or laboratory animals, including the apparent increase in alpha diversity, moderate change in the core microbiota, and altered relative abundances of bacterial taxa (McKenzie et al., 2017; Rosshart et al., 2017; Leung et al., 2018). The gut microbial communities between laboratory and field differed clearly in the rarer bacterial lineages and species abundances, whereas the difference was less evident for the more abundant lineages. Notably, the proportion of Actinobacteria increased slightly in field conditions, which is characteristic of the comparison among wild and captive animals (McKenzie et al., 2017). Actinobacteria represent a small percentage of the gut microbiota community, but are considered important for gut homeostasis and thus host health (Binda et al., 2018). The most abundant phyla throughout the experiment were Firmicutes and Bacteroidetes, which is typical for the gut microbiota of bank voles (Kohl et al., 2016; Lavrinienko et al., 2018; Brila et al., 2021) and other rodents (Maurice et al., 2015; Lavrinienko et al., 2021).
Alterations to the gut microbiota likely reflect a major change in the environmental microbiota and diet experienced by animals in captive vs. natural conditions. First, the increased diversity and shifted composition of gut microbiota may be a consequence of interacting with more diverse environmental bacteria, as observed in mice exposed to soil with a high biodiversity (Liddicoat et al., 2020). Second, the diet, which is considered a key regulator of gut microbiota composition (den Besten et al., 2013; Carmody et al., 2015; Gentile and Weir, 2018), tends to be more diverse in the field, especially for omnivorous species such as the bank vole. In the wild, bank voles consume grasses, leaves, seeds, fruit, mosses, roots, berries, fungi and some invertebrates (Hansson, 1979) and a similar diversity of dietary items is available in the experimental enclosures (Hämäläinen et al., 2022). A more diverse diet (compared with the similar rodent pellets fed to voles housed in the laboratory) likely supports a greater diversity and different communities of gut bacteria. Additionally, factors such as changes in social networks (Raulo et al., 2021), pathogen exposure (Leung et al., 2018), and effect of seasonality (Maurice et al., 2015) may also contribute to the microbial alterations associated with natural vs. captive environments. The relative contributions of such factors on changes in the microbiota represent interesting topics for future studies.
Notably, substantial inter- and intra-individual variation in the gut microbial diversity was apparent throughout the experiment. Individual voles or their gut microbiota may have responded differently to the laboratory-to-field transition due to genetic and behavioral variation. This is expected given the individual nature of the gut microbiota (Benson et al., 2010) but has rarely been documented in lab-to-field translocation studies. Consistent with an increased heterogeneity in field compared to the laboratory conditions, the smaller number of ASVs making up the core microbiota in the field than in the laboratory implies more heterogeneity of gut microbiota among individuals in the field conditions (fewer shared bacteria) than in the laboratory.
As hypothesized (HII), we found evidence of an interaction of host physiology and environment on gut microbiota. In the laboratory, the gut microbiotas of A and C lines were similar, except for minor differences in microbiota community membership between the lines. The results thus broadly align with an earlier study that found no significant differences in cecal microbiota between the selection lines (Kohl et al., 2016). The apparently contrasting results on community membership may reflect our larger sample size, the further physiological differentiation resulting from an additional 12 generations of selection, and/or the potentially broader diversity of microbiota obtained from fecal samples than the more specific environment of the cecum. In contrast to voles housed in the laboratory, in field conditions the gut microbiota composition differed between A- and C-line voles consistently, albeit moderately (up to 5% difference according to all beta diversity metrics). An implication of greater effect size of the selection line (R2 in Supplementary Table S8) in unweighted metrics (unweighted UniFrac, Bray–Curtis) compared with weighted UniFrac (which incorporates information on relative abundances), indicates that most of the differences between the selection lines were in the less abundant bacterial taxa. The most predictive features distinguishing A and C lines belonged to genus Helicobacter, which includes potentially pathogenic species (Péré-Védrenne et al., 2017), although the pathogenicity of the bacterial strains identified here is unknown. Overall, the effect of selection may be stronger in the field conditions because of the physiological and behavioral differences related to the rate of metabolism. For example, the higher activity levels and energy needs of A-line animals (Sadowska et al., 2015; Rudolf et al., 2017) may cause them to move and interact with the environment more or forage a larger or different variety of foods (Dheyongera et al., 2016), compared to the C-line animals. Such behavioral differences may influence, for example, the food intake, diet, and exposure to (transient) bacteria in the environment, with consequences for the gut microbiota community composition.
Our results further suggest that the timing or magnitude of the gut microbiota adjustment to new conditions may be moderated by host genotype, as the patterns of longitudinal change in the gut microbiota differed between the selection lines. Notably, in the first week after the change of environment, the bacterial diversity of the C-line gut microbiota was lower compared with the microbiota of the A-line animals, suggesting that the holobionts' initial reaction to the environmental change may have differed. Such a temporary shift is commonly observed as a result of changing conditions for the microbiota through diet or direct manipulations via, e.g., microbiota transplants (Goodrich et al., 2014). While gut microbiota can tolerate some short-term stress before shifting to a new equilibrium state (Lozupone et al., 2012; Sommer et al., 2017), physiological stress (e.g., elevated glucocorticoid hormone levels) caused by changing conditions may also mediate the effects of ecological and host characteristics on microbiota (Petrullo et al., 2022). The larger response in C-line voles might indicate their stronger initial stress response (and possibly higher stress resilience in A line voles), although no differences in stress physiology were observed between the lines in laboratory conditions (Lipowska et al., 2020). Alternatively, behavioral differences including diet choice could contribute to this result. While we did not assess diet variation in this study, our previous research indicates heterogeneity and a heritable component in bank vole diet choice (Hämäläinen et al., 2022). In turn, interactions between host genetics and diet can shape gut microbiota composition (Shenderov, 2012; Bonder et al., 2016; Lazar et al., 2019).
Interactions between host genetics, environment, and gut microbiota have rarely been studied in unison (e.g., Lindsay et al., 2020) but several lines of evidence suggest that such interactions may be common, albeit difficult to detect. First, there is strong evidence that host genetic background influences gut microbiota, as microbiota is partly inherited and coevolves with the host. Near-universal but weak heritability of microbiota traits was a feature of a large study of wild baboons, with any heritability potentially also masked by effects of within-host changes and environmental variation (Grieneisen et al., 2021). As such, heritability of microbiota may be difficult to detect with a small sample size and cross-sectional sampling in natural, heterogeneous populations that inevitably contain significant “noise” in the data. Here, longitudinal sampling and knowledge of host genetic background allowed us to detect differences in microbiota among the selection lines despite this noise, but it is possible that further differences are present yet undetectable with this sample size. Second, inherited gut microbiota can in turn affect host physiology, such as fat deposition and metabolism (Goodrich et al., 2014), and in this way influence the host's ability to cope with variation in resource availability and energy demand. Host metabolic rate, in particular, is associated with gut microbiota, although the patterns may not be consistent throughout taxa (Lindsay et al., 2020). Interestingly, gut bacterial load may associate positively with metabolic rate in various taxa (Bäckhed et al., 2004; Ayayee et al., 2018), whereas metabolic rate was negatively associated with bacterial diversity in oyster haemolymph (Scanes et al., 2021). Third, the capacity of gut microbiota to facilitate local adaptation can have important fitness consequences for the host. For example, Daphnia tended to have better survival and fecundity when colonized with a sympatric than with an allopatric microbiota (Houwenhuyse et al., 2021). Finally, a range of environmental characteristics have potential to influence traits of the hosts or microbiota, with impact on the holobiont because of the host–microbiota interactions described above.
Our results on the young voles align with our prediction (HIII) that any differences in gut microbiota between the selection lines would be larger in voles reared in field conditions. Compared with the founder voles, their offspring expressed slightly greater differences in terms of gut bacterial composition and diversity, with the higher bacterial diversity in young A-line than in C-line voles being a notable effect. Interestingly, the A- and C-line offspring gut microbiotas were distinguished by many of the same bacterial taxa as were used to distinguish the A- and C-line founder bank voles (such as the genus Helicobacter) according to the random forest classifier. The results on young voles should be considered somewhat preliminary due to the combination of a modest sample size and cross-sectional sampling, but overall, our data lend additional support to the conclusion that selection for high aerobic capacity shaped gut microbiota in field conditions.
The apparent magnified effect of selection in the young voles compared to the adults could result from the susceptible early life phase and lifelong exposure to the natural environment allowing gut microbiota to adjust to the host metabolic needs more effectively. Amplified effects through the mother and selective mortality may also contribute to this result. Importantly, voles developing in the field enclosures were exposed to environmental microbiota directly as well as through their mother's diet through milk from a very young age. Initial colonization of the gut microbiota is dependent on vertical (maternal) and horizontal (environmental) transmission of microbes and has long-term effects on the host metabolism (Bordenstein and Theis, 2015; Warne et al., 2019; Lindsay et al., 2020). The young could express any inherent differences in activity and diet choice from a young age, possibly allowing the gut microbiota to adjust in line with their phenotypic differences, thus leading to more apparent separation. Indeed, studies in laboratory mice have also demonstrated that host genotype, the early-life environment and diet interact to shape microbiota composition (Snijders et al., 2016). Finally, as not all offspring survived to the end of the experiment, the results may also be affected by selective mortality. Differential abundance of gut bacteria has been linked with survival (Akbar et al., 2021; Worsley et al., 2021). If gut microbiota affected the survival of young voles, then only the voles with the most appropriate microbiota (e.g., matching the evolved metabolic needs) would have been sampled.
This is the first experimental field study of the interactive effects of host metabolic rate and environmental context on gut microbiota. Our results suggest a context-specific association of host metabolism and gut microbiota, likely mediated by behavioral or physiological modifications by hosts in response to a changing environment. Future work should further examine the mechanisms of these observed associations; for example, by incorporating measures of holobiont fitness, behavioral and dietary changes of hosts, functional traits of differentially abundant bacteria, and by establishing causality via microbiota transplants. Furthermore, future work should quantify the rate of host metabolism in field conditions, to further examine whether the different microbiota acquired is linked to differences in metabolic rate. Experimental designs that allow distinguishing host genotype from the environment in an ecologically realistic setting, as employed in this study, are still rare. Yet, such combined approaches are vital for deepening our understanding of the evolution and dynamics of host physiology–microbiome–environment interactions.
The raw sequencing data presented in this study has been deposited in the Sequence Read Archive (SRA) at NCBI with the accession number: PRJNA833118- SAMN27960473-SAMN27960504, SAMN27960429-SAMN27960472, SAMN27960523-SAMN27960550, SAMN27960505-SAMN27960522, SAMN27960573-SAMN27960604, SAMN27960551-SAMN27960572, SAMN27960605-SAMN27960674. Metadata is available in the Supplementary material. Any further queries should be directed to the corresponding author.
The animal study was reviewed and approved by Etelä-Suomen aluehallintovirasto.
EH, EK, and AH carried out the study. EH, AH, and PW designed the data analyses. EH carried out the data analyses. EH and AH wrote the paper with inputs from all authors. All authors participated in designing the study. All authors contributed to the article and approved the submitted version.
The study was funded by National Science Center OPUS 15 no. 2018/29/B/NZ8/01924 and Finnish Cultural Foundation to AH. Personal funding from Societas pro Fauna et Flora Fennica and Oulun Luonnonystäväin Yhdistys was granted to EH. This research was funded also through the 2017-2018 Belmont Forum and BiodivERsA joint call for research proposals, under the BiodivScen ERA-Net COFUND program, and with the funding organizations Academy of Finland (329334, 326534 to PW, and 326533 to TM), Formas, and the National Science Foundation. The base colony of the voles (the selection experiment) was funded from National Science Centre (2016/23/B/NZ8/00888 to PK), and the Jagiellonian University (project DS/WBINOZ/INOS/757).
We thank Tanja Hirvonen, Katariina Tiainen, Rasmus Hindström, and the Konnevesi Research Station staff for help with the field work and Ilze Brila for sharing bioinformatics resources and code.
The authors declare that the research was conducted in the absence of any commercial or financial relationships that could be construed as a potential conflict of interest.
All claims expressed in this article are solely those of the authors and do not necessarily represent those of their affiliated organizations, or those of the publisher, the editors and the reviewers. Any product that may be evaluated in this article, or claim that may be made by its manufacturer, is not guaranteed or endorsed by the publisher.
The Supplementary Material for this article can be found online at: https://www.frontiersin.org/articles/10.3389/fevo.2022.934164/full#supplementary-material
Akbar, S., Huang, J., Zhou, Q., Gu, L., Sun, Y., Zhang, L., et al. (2021). Elevated temperature and toxic Microcystis reduce Daphnia fitness and modulate gut microbiota. Environ. Pollut. 271, 116409. doi: 10.1016/j.envpol.2020.116409
Alberdi, A., Aizpurua, O., Bohmann, K., Zepeda-Mendoza, M. L., and Gilbert, M. T. P. (2016). Do vertebrate gut metagenomes confer rapid ecological adaptation? Trends Ecol. Evol. 31, 689–699. doi: 10.1016/j.tree.2016.06.008
Alberdi, A., Martin Bideguren, G., and Aizpurua, O. (2021). Diversity and compositional changes in the gut microbiota of wild and captive vertebrates: a meta-analysis. Sci. Rep. 11, 22660. doi: 10.1038/s41598-021-02015-6
Amir, A., McDonald, D., Navas-Molina, J. A., Kopylova, E., Morton, J. T., Zech Xu, Z., et al. (2017). Deblur rapidly resolves single-nucleotide community sequence patterns. mSystems 2, e00191–e00116. doi: 10.1128/mSystems.00191-16
Ayayee, P. A., Ondrejech, A., Keeney, G., and Muñoz-Garcia, A. (2018). The role of gut microbiota in the regulation of standard metabolic rate in female Periplaneta americana. PeerJ. 6, e4717. doi: 10.7717/peerj.4717
Bäckhed, F., Ding, H., Wang, T., Hooper, L. V., Koh, G. Y., Nagy, A., et al. (2004). The gut microbiota as an environmental factor that regulates fat storage. Proc. Natl. Acad. Sci. U. S. A. 101, 15718–15723. doi: 10.1073/pnas.0407076101
Bates, D., Mächler, M., Bolker, B., and Walker, S. (2015). Fitting linear mixed-effects models using lme4. J. Stat. Softw. 67, 1–48. doi: 10.18637/jss.v067.i01
Bäumler, A. J., and Sperandio, V. (2016). Interactions between the microbiota and pathogenic bacteria in the gut. Nature 535, 85–93. doi: 10.1038/nature18849
Benson, A. K., Kelly, S. A., Legge, R., Ma, F., Low, S. J., Kim, J., et al. (2010). Individuality in gut microbiota composition is a complex polygenic trait shaped by multiple environmental and host genetic factors. Proc. Nat. Acad. Sci. U. S. A. 107, 18933–18938. doi: 10.1073/pnas.1007028107
Binda, C., Lopetuso, L. R., Rizzatti, G., Gibiino, G., Cennamo, V., and Gasbarrini, A. (2018). Actinobacteria: a relevant minority for the maintenance of gut homeostasis. Dig. Liver Dis. 50, 421–428. doi: 10.1016/j.dld.2018.02.012
Bokulich, N. A., Dillon, M. R., Bolyen, E., Kaehler, B. D., Huttley, G. A., and Caporaso, J. G. (2018a). q2-sample-classifier: machine-learning tools for microbiome classification and regression. J. Open Res. Softw. 3:934. doi: 10.1101/306167
Bokulich, N. A., Dillon, M. R., Zhang, Y., Rideout, J. R., Bolyen, E., Li, H., et al. (2018b). q2-longitudinal: longitudinal and paired-sample analyses of microbiome Data. mSystems 3, e00219–e00218. doi: 10.1128/mSystems.00219-18
Bolyen, E., Rideout, J. R., Dillon, M. R., Bokulich, N. A., Abnet, C. C., Al-Ghalith, G. A., et al. (2019). Reproducible, interactive, scalable and extensible microbiome data science using QIIME 2. Nat. Biotechnol. 37, 852–857. doi: 10.1038/s41587-019-0209-9
Bonder, M. J., Kurilshikov, A., Tigchelaar, E. F., Mujagic, Z., Imhann, F., Vila, A. V., et al. (2016). The effect of host genetics on the gut microbiome. Nat. Genet. 48, 1407–1412. doi: 10.1038/ng.3663
Bordenstein, S. R., and Theis, K. R. (2015). Host biology in light of the microbiome: ten principles of holobionts and hologenomes. PLoS Biol. 13, e1002226. doi: 10.1371/journal.pbio.1002226
Bozinovic, F., Muñoz, J. L. P., and Cruz-Neto, A. P. (2007). Intraspecific variability in the Basal metabolic rate: testing the food habits hypothesis. Physiol. Biochem. Zool. 80, 452–460. doi: 10.1086/518376
Bray, J. R., and Curtis, J. T. (1957). An ordination of the upland forest communities of Southern Wisconsin. Ecol. Monogr. 27, 325–349. doi: 10.2307/1942268
Brila, I., Lavrinienko, A., Tukalenko, E., Ecke, F., Rodushkin, I., Kallio, E., et al. (2021). Low-level environmental metal pollution is associated with altered gut microbiota of a wild rodent, the bank vole (Myodes glareolus). Sci. Total Environ. 790, 148224. doi: 10.1016/j.scitotenv.2021.148224
Burton, T., Killen, S. S., Armstrong, J. D., and Metcalfe, N. B. (2011). What causes intraspecific variation in resting metabolic rate and what are its ecological consequences? Proc. R. Soc. B Biol. Sci. 278, 3465–3473. doi: 10.1098/rspb.2011.1778
Calisi, R. M., and Bentley, G. E. (2009). Lab and field experiments: are they the same animal? Horm. Behav. 56, 1–10. doi: 10.1016/j.yhbeh.2009.02.010
Caporaso, J., Lauber, C., Walters, W., Berg-Lyons, D., Huntley, J., Fierer, N., et al. (2012). Ultra-high-throughput microbial community analysis on the Illumina HiSeq and MiSeq platformsOpen. ISME J. 6, 1621–1624. doi: 10.1038/ismej.2012.8
Carmody, R. N., Gerber, G. K., Luevano, J. M., Gatti, D. M., Somes, L., Svenson, K. L., et al. (2015). Diet dominates host genotype in shaping the murine gut microbiota. Cell Host Microbe 17, 72–84. doi: 10.1016/j.chom.2014.11.010
Dahlborn, K., Bugnon, P., Nevalainen, T., Raspa, M., Verbost, P., and Spangenberg, E. (2013). Report of the federation of european laboratory animal science associations Working Group on animal identification. Lab. Anim. 47, 2–11. doi: 10.1177/002367712473290
den Besten, G., van Eunen, K., Groen, A. K., Venema, K., Reijngoud, D.-J., and Bakker, B. M. (2013). The role of short-chain fatty acids in the interplay between diet, gut microbiota, and host energy metabolism. J. Lipid Res. 54, 2325–2340. doi: 10.1194/jlr.R036012
Dheyongera, G., Grzebyk, K., Rudolf, A. M., Sadowska, E. T., and Koteja, P. (2016). The effect of chlorpyrifos on thermogenic capacity of bank voles selected for increased aerobic exercise metabolism. Chemosphere 149, 383–390. doi: 10.1016/j.chemosphere.2015.12.120
Donohoe, D. R., Garge, N., Zhang, X., Sun, W., O'Connell, T. M., Bunger, M. K., et al. (2011). The microbiome and butyrate regulate energy metabolism and autophagy in the mammalian colon. Cell Metab. 13, 517–526. doi: 10.1016/j.cmet.2011.02.018
Flint, H. J., Bayer, E. A., Rincon, M. T., Lamed, R., and White, B. A. (2008). Polysaccharide utilization by gut bacteria: potential for new insights from genomic analysis. Nat. Rev. Microbiol. 6, 121–131. doi: 10.1038/nrmicro1817
Gentile, C. L., and Weir, T. L. (2018). The gut microbiota at the intersection of diet and human health. Science. 362, 776–780. doi: 10.1126/science.aau5812
Goodrich, J. K., Waters, J. L., Poole, A. C., Sutter, J. L., Koren, O., Blekhman, R., et al. (2014). Human genetics shape the gut microbiome. Cell 159, 789–799. doi: 10.1016/j.cell.2014.09.053
Grieneisen, L., Dasari, M., Gould, T. J., Björk, J. R., Grenier, J., Yotova, V., et al. (2021). Gut microbiome heritability is nearly universal but environmentally contingent. Science 186, 181–186. doi: 10.1126/science.aba5483
Groussin, M., Mazel, F., Sanders, J. G., Smillie, C. S., Lavergne, S., Thuiller, W., et al. (2017). Unraveling the processes shaping mammalian gut microbiomes over evolutionary time. Nat. Commun. 8, 14319. doi: 10.1038/ncomms14319
Hämäläinen, A., Kiljunen, M., Koskela, E., Koteja, P., Mappes, T., Rajala, M., et al. (2022). Artificial selection for predatory behaviour results in dietary niche differentiation in an omnivorous mammal. Proc. R. Soc. B Biol. Sci. 289, 20212510. doi: 10.1098/rspb.2021.2510
Hansson, L.. (1979). Condition and diet in relation to habitat in bank voles clethrionomys glareolus: population or community approach? Oikos 33, 55–63. doi: 10.2307/3544511
Houwenhuyse, S., Stoks, R., Mukherjee, S., and Decaestecker, E. (2021). Locally adapted gut microbiomes mediate host stress tolerance. ISME J. 15, 2401–2414. doi: 10.1038/s41396-021-00940-y
Hufeldt, M. R., Nielsen, D. S., Vogensen, F. K., Midtvedt, T., and Hansen, A. K. (2010). Variation in the gut microbiota of laboratory mice is related to both genetic and environmental factors. Comp. Med. 60, 336–347.
Hutterer, R., Kryštufek, B., Yigit, N., Mitsainas, G., Palomo, L., Henttonen, H., et al. (2021). Myodes glareolus (amended version of 2016 assessment). The IUCN Red List of Threatened Species 2021: e.T4973A197520967. Available online at: https://dx.doi.org/10.2305/IUCN.UK.2021-1.RLTS.T4973A197520967.en (accessed March 13, 2022).
Jaromin, E., Sadowska, E. T., and Koteja, P. (2019). Is experimental evolution of an increased aerobic exercise performance in bank voles mediated by endocannabinoid signaling pathway? Front. Physiol. 10, 640. doi: 10.3389/fphys.2019.00640
Koh, A., and Bäckhed, F. (2020). From association to causality: the role of the gut microbiota and its functional products on host metabolism. Mol. Cell 78, 584–596. doi: 10.1016/j.molcel.2020.03.005
Kohl, K. D., and Dearing, M. D. (2014). Wild-caught rodents retain a majority of their natural gut microbiota upon entrance into captivity. Environ. Microbiol. Rep. 6, 191–195. doi: 10.1111/1758-2229.12118
Kohl, K. D., Sadowska, E. T., Rudolf, A. M., Dearing, M. D., and Koteja, P. (2016). Experimental evolution on a wild mammal species results in modifications of gut microbial communities. Front. Microbiol. 7, 634. doi: 10.3389/fmicb.2016.00634
Konczal, M., Babik, W., Radwan, J., Sadowska, E. T., and Koteja, P. (2015). Initial molecular-level response to artificial selection for increased aerobic metabolism occurs primarily through changes in gene expression. Mol. Biol. Evol. 32, 1461–1473. doi: 10.1093/molbev/msv038
Krajmalnik-Brown, R., Ilhan, Z.-E., Kang, D.-W., and DiBaise, J. K. (2012). Effects of gut microbes on nutrient absorption and energy regulation. Nutr. Clin. Pract. 27, 201–214. doi: 10.1177/0884533611436116
Lahti, L., and Shetty, S. (2017). Tools for microbiome analysis in R. Version 1.12.0. Available online at: https://microbiome.github.io/tutorials (accessed March 5, 2022)
Lavrinienko, A., Hämäläinen, A., Hindström, R., Tukalenko, E., Boratyński, Z., Kivisaari, K., et al. (2021). Comparable response of wild rodent gut microbiome to anthropogenic habitat contamination. Mol. Ecol. 30, 3485–3499. doi: 10.1111/mec.15945
Lavrinienko, A., Mappes, T., Tukalenko, E., Mousseau, T. A., Møller, A. P., Knight, et al. (2018). Environmental radiation alters the gut microbiome of the bank vole Myodes glareolus. ISME J. 12, 2801–2806. doi: 10.1038/s41396-018-0214-x
Lavrinienko, A., Tukalenko, E., Kesäniemi, J., Kivisaari, K., Masiuk, S., Boratyński, Z., et al. (2020). Applying the Anna Karenina principle for wild animal gut microbiota: temporal stability of the bank vole gut microbiota in a disturbed environment. J. Anim. Ecol. 89, 2617–2630. doi: 10.1111/1365-2656.13342
Lazar, V., Ditu, L. M., Pircalabioru, G. G., Picu, A., Petcu, L., Cucu, N., et al. (2019). Gut microbiota, host organism, and diet trialogue in diabetes and obesity. Front. Nutr. 6, 21. doi: 10.3389/fnut.2019.00021
Leung J. M. Budischak S. A. Chung The H. Hansen C. Bowcutt R. Neill R. . (2018). Rapid environmental effects on gut nematode susceptibility in rewilded mice. PLoS Biol. 16, e2004108. doi: 10.1371/journal.pbio.2004108
Liddicoat, C., Sydnor, H., Cando-Dumancela, C., Dresken, R., Liu, J., Gellie, N. J. C., et al. (2020). Naturally-diverse airborne environmental microbial exposures modulate the gut microbiome and may provide anxiolytic benefits in mice. Sci. Total Environ, 701, 134684. doi: 10.1016/j.scitotenv.2019.134684
Lindsay, E. C., Metcalfe, N. B., and Llewellyn, M. S. (2020). The potential role of the gut microbiota in shaping host energetics and metabolic rate. J. Anim. Ecol. 89, 2415–2426. doi: 10.1111/1365-2656.13327
Lipowska, M. M., Sadowska, E. T., Bauchinger, U., Goymann, W., Bober-Sowa, B., and Koteja, P. (2020). Does selection for behavioral and physiological performance traits alter glucocorticoid responsiveness in bank voles? J. Exp. Biol. 223, jeb219865. doi: 10.1242/jeb.219865
Lozupone, C., Lladser, M. E., Knights, D., Stombaugh, J., and Knight, R. (2011). UniFrac: an effective distance metric for microbial community comparison. ISME J. 5, 169–172. doi: 10.1038/ismej.2010.133
Lozupone, C. A., Stombaugh, J. I., Gordon, J. I., Jansson, J. K., and Knight, R. (2012). Diversity, stability and resilience of the human gut microbiota. Nature 489, 220–230. doi: 10.1038/nature11550
Maiti, U., Sadowska, E. T., ChrzAścik, K. M., and Koteja, P. (2019). Experimental evolution of personality traits: open-field exploration in bank voles from a multidirectional selection experiment. Curr. Zool. 65, 375–384. doi: 10.1093/cz/zoy068
Mappes, T., Koskela, E., and Ylönen, H. (1995). Reproductive costs and litter size in the bank vole. Proc. Biol. Sci. 261, 19–24. doi: 10.1098/rspb.1995.0111
Martínez-Mota, R., Kohl, K. D., Orr, T. J., and Denise Dearing, M. (2020). Natural diets promote retention of the native gut microbiota in captive rodents. ISME J. 14, 67–78. doi: 10.1038/s41396-019-0497-6
Maurice, C. F. C. L, Knowles, S., Ladau, J., Pollard, K. S., Fenton, A., et al. (2015). Marked seasonal variation in the wild mouse gut microbiota. ISME J. 9, 2423–2434. doi: 10.1038/ismej.2015.53
McKenzie, V. J., Song, S. J., Delsuc, F., Prest, T. L., Oliverio, A. M., Korpita, T. M., et al. (2017). The effects of captivity on the mammalian gut microbiome. Integr. Comp. Biol. 57, 690–704. doi: 10.1093/icb/icx090
McMurdie, P. J., and Holmes, S. (2013). phyloseq: an R package for reproducible interactive analysis and graphics of microbiome census data. PLoS ONE 8, e61217. doi: 10.1371/journal.pone.0061217
Moeller, A. H., and Sanders, J. G. (2020). Roles of the gut microbiota in the adaptive evolution of mammalian species. Philos. Trans. R. Soc. Lond. B Biol. Sci. 375, 20190597. doi: 10.1098/rstb.2019.0597
Norin, T., and Metcalfe, N. B. (2019). Ecological and evolutionary consequences of metabolic rate plasticity in response to environmental change. Philos. Trans. R. Soc. B Biol. Sci. 374, 20180180. doi: 10.1098/rstb.2018.0180
Oksanen, J., Blanchet, F. G., Friendly, M., Kindt, R., Legendre, P., McGlinn, D., et al. (2020). Vegan community ecology package version 2.5-7 November 2020.
Oksanen, T. A., Jokinen, I., Koskela, E., Mappes, T., and Vilpas, H. (2003). Manipulation of offspring number and size: benefits of large body size at birth depend upon the rearing environment. J. Anim. Ecol. 72, 321–330. doi: 10.1046/j.1365-2656.2003.00703.x
Paris, L., Peghaire, E., Moné, A., Diogon, M., Debroas, D., Delbac, F., et al. (2020). Honeybee gut microbiota dysbiosis in pesticide/parasite co-exposures is mainly induced by Nosema ceranae. J. Invertebr. Pathol. 172, 107348. doi: 10.1016/j.jip.2020.107348
Péré-Védrenne, C., Flahou, B., Loke, M. F., Ménard, A., and Vadivelu, J. (2017). Other Helicobacters, gastric and gut microbiota. Helicobacter 22, e12407. doi: 10.1111/hel.12407
Petrullo, L., Ren, T., Wu, M., Boonstra, R., Palme, R., Boutin, S., et al. (2022). Glucocorticoids coordinate changes in gut microbiome composition in wild North American red squirrels. Sci. Rep. 12, 2605. doi: 10.1038/s41598-022-06359-5
Quast, C., Pruesse, E., Yilmaz, P., Gerken, J., Schweer, T., Yarza, P., et al. (2013). The SILVA ribosomal RNA gene database project: improved data processing and web-based tools. Nucleic Acids Res. 41, D590–D596. doi: 10.1093/nar/gks.1219
R Core Team (2020). R: A language and environment for statistical computing. R Foundation for Statistical Computing, Vienna, Austria. Available online at: https://www.R-project.org/ (accessed March 10, 2022).
Raulo, A., Allen, B. E., Troitsky, T., Husby, A., Firth, J. A., Coulson, T., et al. (2021). Social networks strongly predict the gut microbiota of wild mice. ISME J. 15, 2601–2613. doi: 10.1038/s41396-021-00949-3
Rognes, T., Flouri, T., Nichols, B., Quince, C., and Mahé, F. (2016). VSEARCH: a versatile open source tool for metagenomics. PeerJ. 4, e2584. doi: 10.7717/peerj.2584
Rosenberg, E., and Zilber-Rosenberg, I. (2018). The hologenome concept of evolution after 10 years. Microbiome 6, 78. doi: 10.1186/s40168-018-0457-9
Rosshart, S. P., Vassallo, B. G., Angeletti, D., Hutchinson, D. S., Morgan, A. P., Takeda, K., et al. (2017). Wild mouse gut microbiota promotes host fitness and improves disease resistance. Cell 171, 1015–1028.e13. doi: 10.1016/j.cell.2017.09.016
Rothschild, D., Weissbrod, O., Barkan, E., Kurilshikov, A., Korem, T., Zeevi, D., et al. (2018). Environment dominates over host genetics in shaping human gut microbiota. Nature 555, 210–215. doi: 10.1038/nature25973
Rudolf, A. M., Dańko, M. J., Sadowska, E. T., Dheyongera, G., and Koteja, P. (2017). Age-related changes of physiological performance and survivorship of bank voles selected for high aerobic capacity. Exp. Gerontol. 98, 70–79. doi: 10.1016/j.exger.2017.08.007
Sadowska, E., Baliga-Klimczyk, K., Chrzaścik, K., and Koteja, P. (2008). Laboratory model of adaptive radiation: a selection experiment in the bank vole. Physiol. Biochem. Zool. 81, 627–640. doi: 10.1086/590164
Sadowska, E. T., Stawski, C., Rudolf, A., Dheyongera, G., Chrzaścik, K. M., Baliga-Klimczyk, K., et al. (2015). Evolution of basal metabolic rate in bank voles from a multidirectional selection experiment. Proc. R. Soc. B Biol. Sci. 282, 20150025. doi: 10.1098/rspb.2015.0025
Scanes, E., Parker, L. M., Seymour, J. R., Siboni, N., Dove, M. C., O'Connor, W. A., et al. (2021). Microbiomes of an oyster are shaped by metabolism and environment. Sci. Rep. 11, 21112. doi: 10.1038/s41598-021-00590-2
Shapiro, S. S., and Wilk, M. B. (1965). An analysis of variance test for normality (complete samples). Biometrika 52, 591–611. doi: 10.1093/biomet/52.3-4.591
Shenderov, B. A.. (2012). Gut indigenous microbiota and epigenetics. Microb. Ecol. Health Dis. 23. doi: 10.3402/mehd.v23i0.17195
Snijders, A. M., Langley, S. A., Kim, Y.-M., Brislawn, C. J., Noecker, C., Zink, E. M., et al. (2016). Influence of early life exposure, host genetics and diet on the mouse gut microbiome and metabolome. Nat. Microbiol. 2, 1–8. doi: 10.1038/nmicrobiol.2016.221
Sommer, F., Anderson, J. M., Bharti, R., Raes, J., and Rosenstiel, P. (2017). The resilience of the intestinal microbiota influences health and disease. Nat. Rev. Microbiol. 15, 630–638. doi: 10.1038/nrmicro.2017.58
Suzuki, T. A.. (2017). Links between natural variation in the microbiome and host fitness in wild mammals. Integr. Comp. Biol. 57, 756–769. doi: 10.1093/icb/icx104
Tremaroli, V., and Bäckhed, F. (2012). Functional interactions between the gut microbiota and host metabolism. Nature 489, 242–249. doi: 10.1038/nature11552
Trevelline, B. K., and Moeller, A. H. (2022). Robustness of mammalian gut microbiota to humanization in captivity. Front. Ecol. Evol. 9, 785089. doi: 10.3389/fevo.2021.785089
Viney, M.. (2019). The gut microbiota of wild rodents: challenges and opportunities. Lab. Anim. 53, 252–258. doi: 10.1177/0023677218787538
Wang, J., Linnenbrink, M., Künzel, S., Fernandes, R., Nadeau, M.-J., Rosenstiel, P., et al. (2014). Dietary history contributes to enterotype-like clustering and functional metagenomic content in the intestinal microbiome of wild mice. Proc. Natl. Acad. Sci. U. S. A. 111, E2703–E2710. doi: 10.1073/pnas.1402342111
Warne, R. W., Kirschman, L., and Zeglin, L. (2019). Manipulation of gut microbiota during critical developmental windows affects host physiological performance and disease susceptibility across ontogeny. J. Anim. Ecol. 88, 845–856. doi: 10.1111/1365-2656.12973
Weldon, L., Abolins, S., Lenzi, L., Bourne, C., Riley, E. M., and Viney, M. (2015). The gut microbiota of wild mice. PLoS ONE 10, e0134643. doi: 10.1371/journal.pone.0134643
Wickham, H.. (2016). ggplot2: Elegant Graphics for Data Analysis. Springer-Verlag New York. 978-3-319-24277-4. Available online at: https://ggplot2.tidyverse.org (accessed January 15, 2022).
Worsley, S. F., Davies, C. S., Mannarelli, M.-E., Hutchings, M. I., Komdeur, J., Burke, T., et al. (2021). Gut microbiome composition, not alpha diversity, is associated with survival in a natural vertebrate population. Anim. Microbiome 3, 84. doi: 10.1186/s42523-021-00149-6
Zeng, L.-Q., Zhang, A.-J., Killen, S. S., Cao, Z.-D., Wang, Y.-X., and Fu, S.-J. (2017). Standard metabolic rate predicts growth trajectory of juvenile Chinese crucian carp (Carassius auratus) under changing food availability. Biol. Open 6, 1305–1309. doi: 10.1242/bio.025452
Zha, Y., Eiler, A., Johansson, F., and Svanbäck, R. (2018). Effects of predation stress and food ration on perch gut microbiota. Microbiome 6, 1–12. doi: 10.1186/s40168-018-0400-0
Keywords: metabolic rate, gut microbiota, bank vole, 16S rRNA sequencing, field experiment, experimental evolution, selection lines, longitudinal
Citation: Hanhimäki E, Watts PC, Koskela E, Koteja P, Mappes T and Hämäläinen AM (2022) Evolved high aerobic capacity has context-specific effects on gut microbiota. Front. Ecol. Evol. 10:934164. doi: 10.3389/fevo.2022.934164
Received: 02 May 2022; Accepted: 14 July 2022;
Published: 09 August 2022.
Edited by:
Kerri L. Coon, University of Wisconsin-Madison, United StatesReviewed by:
Lin Zhang, Hubei University of Chinese Medicine, ChinaCopyright © 2022 Hanhimäki, Watts, Koskela, Koteja, Mappes and Hämäläinen. This is an open-access article distributed under the terms of the Creative Commons Attribution License (CC BY). The use, distribution or reproduction in other forums is permitted, provided the original author(s) and the copyright owner(s) are credited and that the original publication in this journal is cited, in accordance with accepted academic practice. No use, distribution or reproduction is permitted which does not comply with these terms.
*Correspondence: Anni M. Hämäläinen, YW5uaS5tLmhhbWFsYWluZW5AZ21haWwuY29t
†ORCID: Phillip C. Watts https://orcid.org/0000-0001-7755-187X
Esa Koskela https://orcid.org/0000-0002-9418-5733
Paweł Koteja https://orcid.org/0000-0003-0077-4957
Tapio Mappes https://orcid.org/0000-0002-5936-7355
Anni M. Hämäläinen https://orcid.org/0000-0001-9260-8299
Disclaimer: All claims expressed in this article are solely those of the authors and do not necessarily represent those of their affiliated organizations, or those of the publisher, the editors and the reviewers. Any product that may be evaluated in this article or claim that may be made by its manufacturer is not guaranteed or endorsed by the publisher.
Research integrity at Frontiers
Learn more about the work of our research integrity team to safeguard the quality of each article we publish.