- 1School of Science, Shandong Jianzhu University, Jinan, China
- 2Shandong Provincial Eco-Environment Monitoring Center, Jinan, China
- 3Shandong Provincial Jinan Eco-Environment Monitoring Center, Jinan, China
- 4School of Municipal and Environmental Engineering, Shandong Jianzhu University, Jinan, China
Urban ozone (O3) pollution has become a prominent environmental threat to public health while the relationship between O3 formation and driving factors remains elusive, particularly for megacities in the Shandong Peninsula of China. In this study, we use intensive ambient measurements of trace gases to comprehensively investigate the magnitude of O3 pollution in Jinan city from 2013 to 2020. Further, emission inventory and OMI NO2 columns are used for probing changes in precursor emissions. Ground-level measurements indicate degraded O3 air quality afterward in 2015 and depict city-wide elevated O3 levels (higher than 140 μg/m3 in the warm season). For precursor emissions, it is found that NOx emissions have decreased more than 30% due to successful regulation efforts, which is in excellent agreement with NO2 columns from OMI. The method of objective synoptic weather pattern classification [T-Mode principal component analysis (PCT)] is adopted to distinguish the associated meteorological parameters under various synoptic patterns which govern the variability in regional O3 levels. Among identified synoptic patterns, Type 2 and Type 8 featured by low sea level pressure (SLP), high temperature, and strong ultraviolet radiation are the most prevalent synoptic patterns in spring and summer, respectively, which are prone to the occurrence of O3 exceedances. This work provides a detailed view of long-term O3 levels and the relationship between precursors and meteorological conditions in a typical densely populated city in northern China, showing implications for developing O3 mitigation strategies.
Introduction
Ozone (O3) is a criteria air pollutant that forms by photochemical reactions of precursors [NOx and volatile organic compounds (VOCs)] under the presence of sunlight. Exposure to elevated O3 levels could induce a variety of adverse impacts on human health (Cromar et al., 2019; Lin et al., 2019; Yang et al., 2021) and affect the productivity of sensitive vegetation (Vlachokostas et al., 2010; Dong et al., 2021; Li et al., 2021a). With the rapid industrialization and urbanization in China, severe O3 pollution has emerged as a pressing environmental concern in densely populated areas (Chan and Yao, 2008; Li and Huang, 2019; Dai et al., 2021; Li et al., 2021b; Xiong et al., 2021; Zhao et al., 2021), which is contrary to the steadily improved particle matter (PM) pollution over the past decade. In particular, Beijing-Tianjin-Hebei (BTH), Yangtze River Delta (YRD), Pearl River Delta (PRD), and Sichuan Basin (SCB) are recognized as the most polluted city clusters in China. Given the urgent demand to mitigate urban O3 pollution, it is crucial to characterize O3 variations and identify dominant factors that influence O3 formation over major city clusters.
The fate, transport, and removal of O3 in the atmosphere are largely determined by meteorological conditions (Wang et al., 2010; Pawlak and Jarosławski, 2014). Synoptic patterns act as the crucial factor which governs the variations of O3 levels induced by meteorological processes. Prior studies have investigated the relationship between various synoptic patterns and associated O3 changes in China through both modeling and statistical studies. Using a circulation classification method, Shu et al. (2016) found that the circulation pattern featured by stable western Pacific subtropical high could enhance O3 production over the YRD and indicated that the frequency of this meteorological phenomenon showed a strong relationship with O3 exceedance events. Wang et al. (2021) reported that synoptic forcing dominated by sea-land breeze contributed significantly to O3 formation in PRD. Yang et al. (2020) distinguished two typical synoptic patterns which triggered O3 episodes in the SCB based on the WRF-CMAQ model. Previous studies assessing the impacts of synoptic patterns on O3 have been restricted to several typical O3 episodes and mainly focused on BTH, YRD, PRD, and SCB, while little attention has been paid to megacities within these city clusters.
Jinan, the capital of Shandong Province, is recognized as one of the “2+26” cities of the channel of the BTH city cluster. While there have been considerable efforts in reducing air pollutants emissions, O3 levels have increased by 17.3% in 2019 compared with 2013 in Jinan, posing a challenge to environmental management. The statistical assessment reported that O3 exceedance is the major pollutant in 2020, accounting for 42.2% of air quality non-attainment in Jinan. The recent analysis by Lyu et al. (2019) demonstrated that O3 episodes in Jinan are closely related to synoptic-driven dynamics. Therefore, a better understanding of dominant processes that affect O3 levels in Jinan is required to design and implement effective O3 regulation policies.
In this work, ambient measurements of trace gases from 2013 to 2020 are used to determine the magnitude of O3 pollution in Jinan. Historical O3 levels and occurrence of exceedance events in Jinan are revealed. Further, the trend of NOx emissions is inferred from bottom-up emission inventory, as well as satellite observations, aimed at probing precursor emission changes from 2013 to 2020. Daily synoptic patterns are classified based on the objective T-Mode principal component analysis (PCT) method then combine with ground-level ambient measurements for examining the influence of different synoptic patterns on O3 levels in Jinan. The findings of this study not only help understand long-term variations of O3 levels but also have strong implications for designing and implementing effective regulatory policies in Jinan.
Materials and methods
Ambient air quality measurements
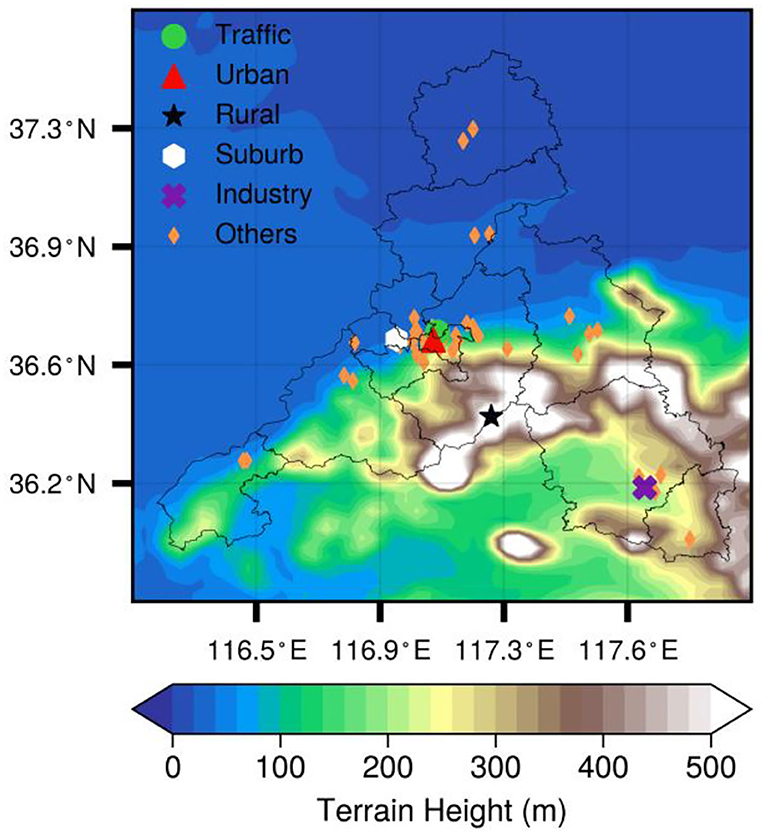
In this study, gaseous pollutants concentrations are collected from 14 national ambient air quality monitoring sites operated by China National Environmental Monitoring Center (CNEMC) and 11 local ambient air quality monitoring stations operated by Jinan Eco-environment Monitoring Center from 2013 to 2020 (locations shown in Figure 1). To identify variations among different type sites, ShiJianCeZhan (SJCZ), JiShuXueYuan (JSXY), PaoMaLing (PML), NongKeSuo (NKS), and ZhongZiCangKu (ZZKU) are selected for representing O3 levels at urban, industry, rural, suburb, and near-road (traffic) conditions (marked in Figure 1).
Here, we use the maximum daily average 8 h (MDA8) O3 concentration as the metric for assessing O3 pollution and MDA8 values >160 μg/m3 are identified as an exceedance day (which corresponds to National Ambient Air Quality Standards (NAAQS) (GB 3095-2012) for O3 concentration). Daily average concentrations of CO, NO2, and NO are calculated from hourly observations.
ERA5 reanalysis dataset
The ERA5 meteorological reanalysis from the European Center for Medium-Range Weather Forecasts (ECMWF) is adopted to represent meteorological phenomena over north China. The study domain is from 30°N to 42°N along the latitude and from 108°to 128°E along the longitude with a grid resolution of 0.25° ×0.25°. The daily sea level pressure (SLP) is used to classify the synoptic weather pattern at 08:00 local solar time (LST) from 2013 to 2020 over North China (Li et al., 2017). Other meteorological factors include 2 m temperature (T2M), relative humidity at 1,000 Pa (RH), downward ultraviolet radiation (UVB), and 10 m of wind fields.
Objective synoptic pattern classification
The obliquely rotated principal components analysis (PCA) in T-mode (PCT) is a mathematical method based on data similarity and variance maximization (Huth, 1996; Huth et al., 2008). This method decomposes the original high-dimensional data into the principal component matrix and the loadings matrix then selects several principal components with large variance contributions and further rotates them obliquely. Finally, the classification of synoptic patterns is performed for each time period according to the calculated loadings. The synoptic classification software (http://www.cost733.org) (Philipp et al., 2010) is provided by the COST action 733, so as to obtain more accurate and stable synoptic patterns.
Anthropogenic emission inventory
The Multi-resolution Emission Inventory for China (MEIC) is a bottom-up inventory that has been widely used in quantifying anthropogenic emissions and chemical transport modeling (Wu et al., 2020; Yang et al., 2020; Wang et al., 2022). It provides monthly human-induced emissions across China, with a spatial resolution of 0.25° ×0.25° (Zheng et al., 2018). Anthropogenic sectors in MEIC include power plants, agriculture, industrial, transportation, and residential.
OMI NO2 columns
Ozone Monitoring Instrument (OMI) is an ultraviolet-visible spectrometer onboard the NASA Aura satellite, with a sun-synchronous orbit that crosses the Equator at around 13:45 local time (Levelt et al., 2006; Boersma et al., 2011). It has a 2,600 km cross-track swath length which enables daily coverage across the globe. Here, the tropospheric NO2 retrieval product developed from Quality Assurance for Essential Climate Variables (QA4ECV) is used for inferring the trend in NO2 columns and probing the spatial changes in NO2 columns in Jinan over time (Zara et al., 2018). The development algorithm of QA4ECV NO2 from OMI involves multi-step processes, including the calculation of air mass factor (AMF), conversion of NO2 slant column to NO2 vertical column, and data assimilation from global chemical transport model TM5. The accuracy of QA4ECV NO2 has undergone rigorous validation against global differential optical absorption spectroscopy (DOAS) instrument networks (Compernolle et al., 2020).
Results and discussions
Characteristics of O3 pollution in Jinan
As shown in Figure 2, summertime O3 pollution in Jinan was quite severe which featured numerous O3 exceedances and a progressively increase in the number of O3 exceedance days was found over the study period (Table 1). The annual average MDA8 O3 concentrations in Jinan were 98.0, 106.6, 102.5, 105.2, 108.4, 114.2, 114.5, and 111.5 μg/m3 from 2013 to 2020, respectively. Since 2015, both O3 exceedances and annual average MDA8 O3 levels gradually increased and spiked to peak levels in 2019, implying that worsen O3 air quality has become an emerging environmental concern in Jinan. Table 2 presents average MDA8 O3 concentrations for different types of ambient monitoring stations during the warm season (April–September) from 2013 to 2020. Specifically, the trend in O3 variations is broadly consistent among selected typical sites (industrial, traffic, urban, and suburban), which featured by descending trends between 2013 and 2015 while degraded O3 levels afterward 2016. It is worth noting that both averaged MDA8 O3 concentrations at industrial and traffic sites during the warm season were in excess of the O3 standard (160 μg/m3) in China's current National Ambient Air Quality Standards (NAAQS) in 2019, indicating the severity of O3 pollution in Jinan.
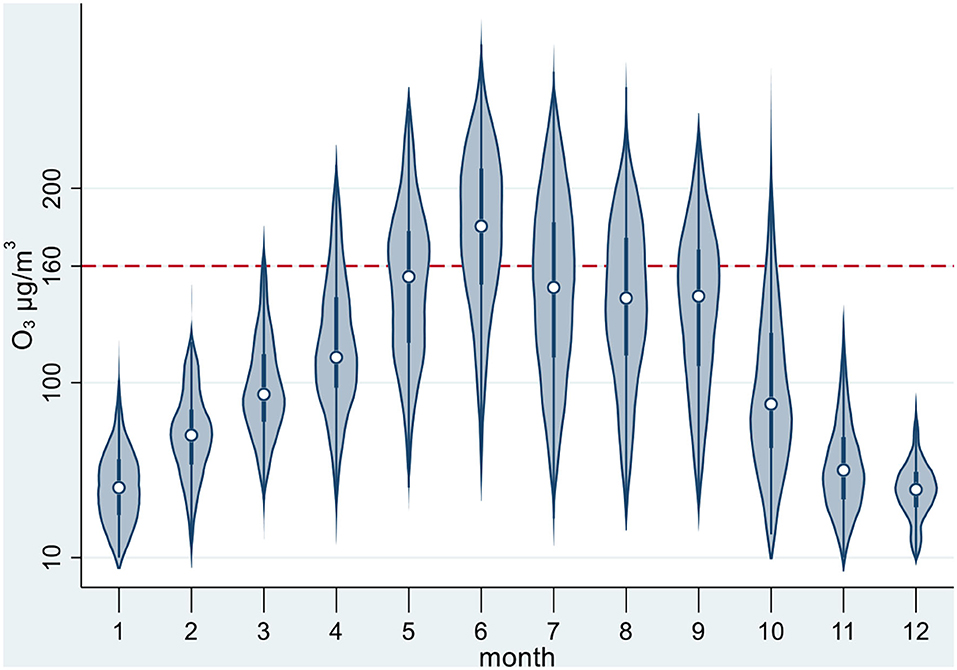
Figure 2. Probability distributions of MDA8 O3 concentration in 12 months during 2013–2020 in Jinan city.
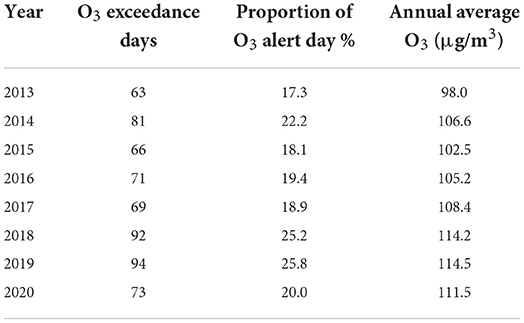
Table 1. O3 exceedance events and annual average MDA8 O3 concentrations from 2013 to 2020 in Jinan city.
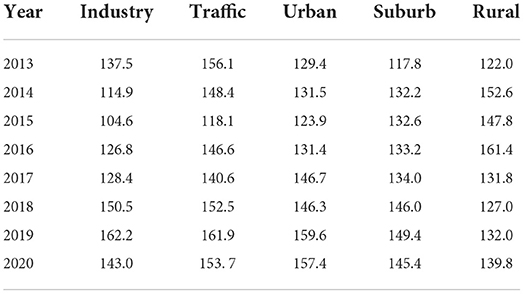
Table 2. Average concentration of MDA8 O3 over Jinan city during warm season (April–September) from 2013 to 2020.
Trend of NOx emissions in Jinan
Prior studies have demonstrated that urban O3 formation is largely determined by the abundance of precursors which affects the O3-VOCs-NOx sensitivity (Wu et al., 2022). To probe the variation of O3 precursor emissions in Jinan, anthropogenic NOx emissions from MEIC inventory for the warm season (April–September) of 2013–2020 are derived, as shown in Figure 3. Starting in 2013, the MEIC inventory shows a continuous pattern of reductions in total NOx emissions due to the implementation of the Air Pollution Prevention and Control Action Plan (APPCAP), declining by 30.0% for the 2013–2020 period, whereas NOx emissions in each anthropogenic sector exhibit highly variable trend. Specifically, power plant emissions of NOx have declined more than 50.0% in 2020 compared with 2013, and industrial emissions show marked declines from 2013 to 2020. On the contrary, residential emissions persistently increased from 2013 to 2017, followed by a substantial decrease in 2018, implying the effectiveness of coal-to-gas initiatives in Jinan. Unlike power plants and industrial emissions, NOx emitted from traffic sources decreased from 2013 to 2016 followed by leveling off and even increased trend of NOx emissions afterward 2016, underlining the urgent need of taking action on regulating traffic NOx emissions in Jinan. It is worth mentioning that NOx emissions in 2020 significantly decreased compared with 2019, which could be linked to the reduced mobility attributed to COVID-19 lockdown measures (Zheng et al., 2021). In general, reductions in NOx emissions in Jinan from 2013 to 2020 are mainly contributed by regulation efforts on industrial and power plant emissions, while traffic NOx emissions warrant further strict control.
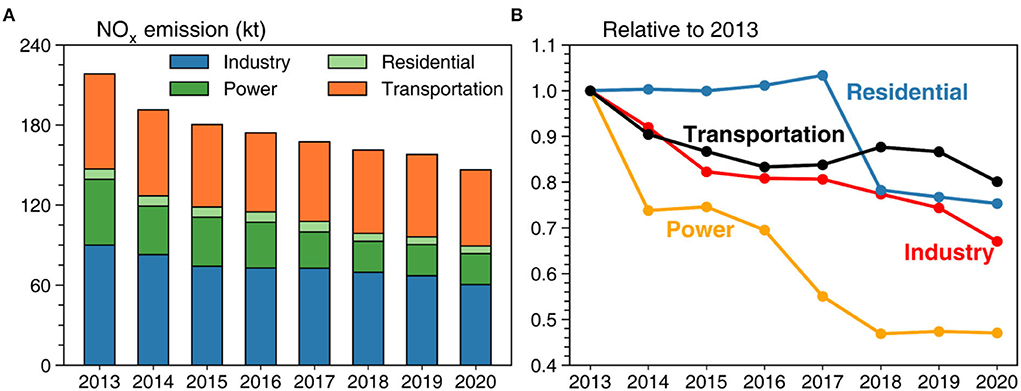
Figure 3. Sector-based anthropogenic NOx emissions derived from MEIC inventory during warm season (April-September) from 2013 to 2020 in Jinan city.
Figure 4 presents tropospheric NO2 columns from OMI during the warm season (April-September) from 2013 to 2020 over Jinan. For 2013, OMI depicts region-wide NO2 spots, with peak levels higher than 14 × 1015 molec/cm2. Interestingly, satellite observations indicate that emission control on NOx introduced by APPCAP leads to substantial reductions in NOx emissions over urban and suburban areas. As a result, NO2 columns over urban areas of Jinan were even lower than 8 × 10¹⁵ molec/cm2 for 2020. Compared with NOx emissions estimated by MEIC, OMI NO2 columns exhibit broadly consistent year-by-year changes and reduction magnitude. This phenomenon further confirms that control measures toward cutting NOx emissions are effective for Jinan city from 2013 to 2020.
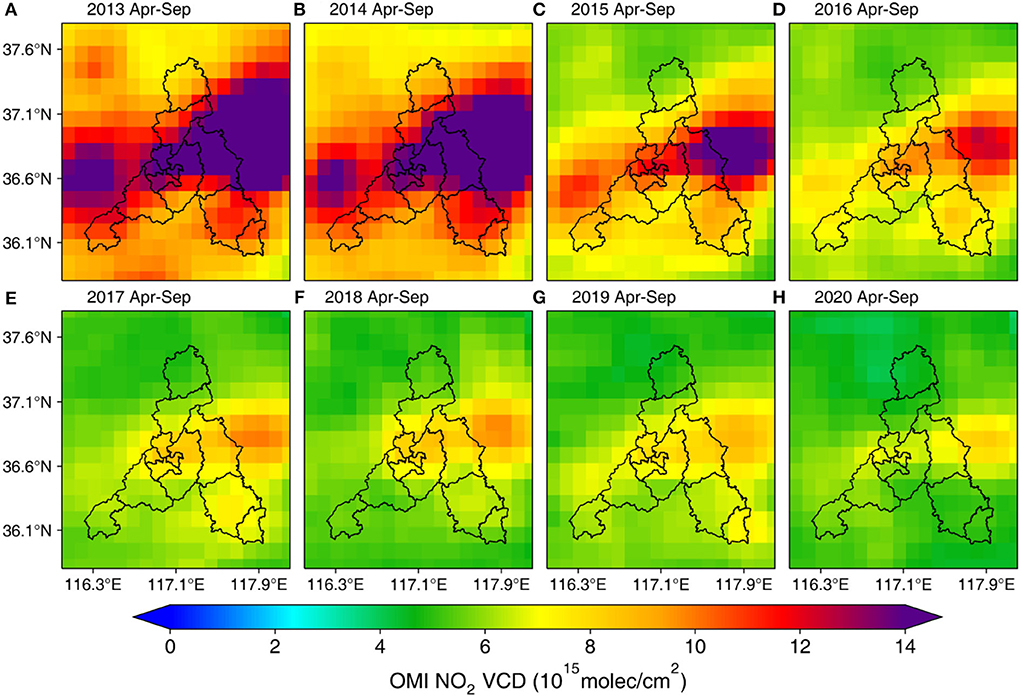
Figure 4. OMI mean tropospheric NO2 vertical column density (VCD) during warm season (April–September) from 2013 to 2020 over Jinan city.
Relationship between synoptic patterns and ozone pollution
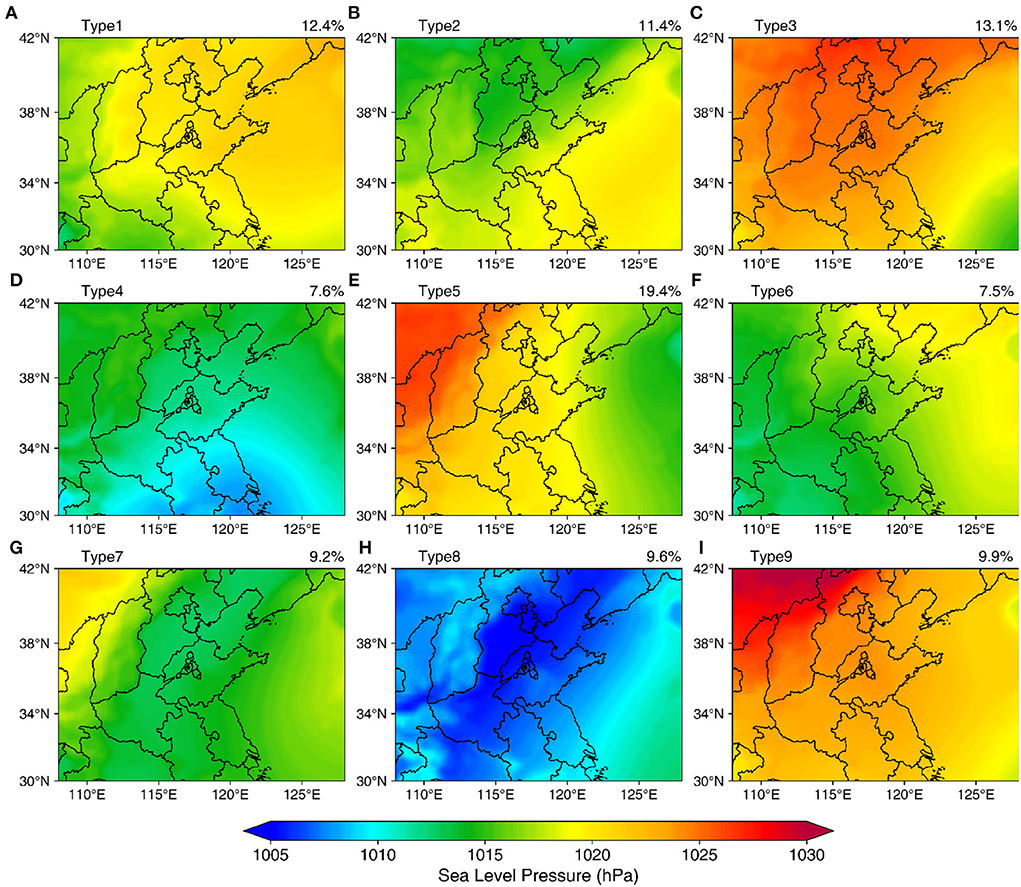
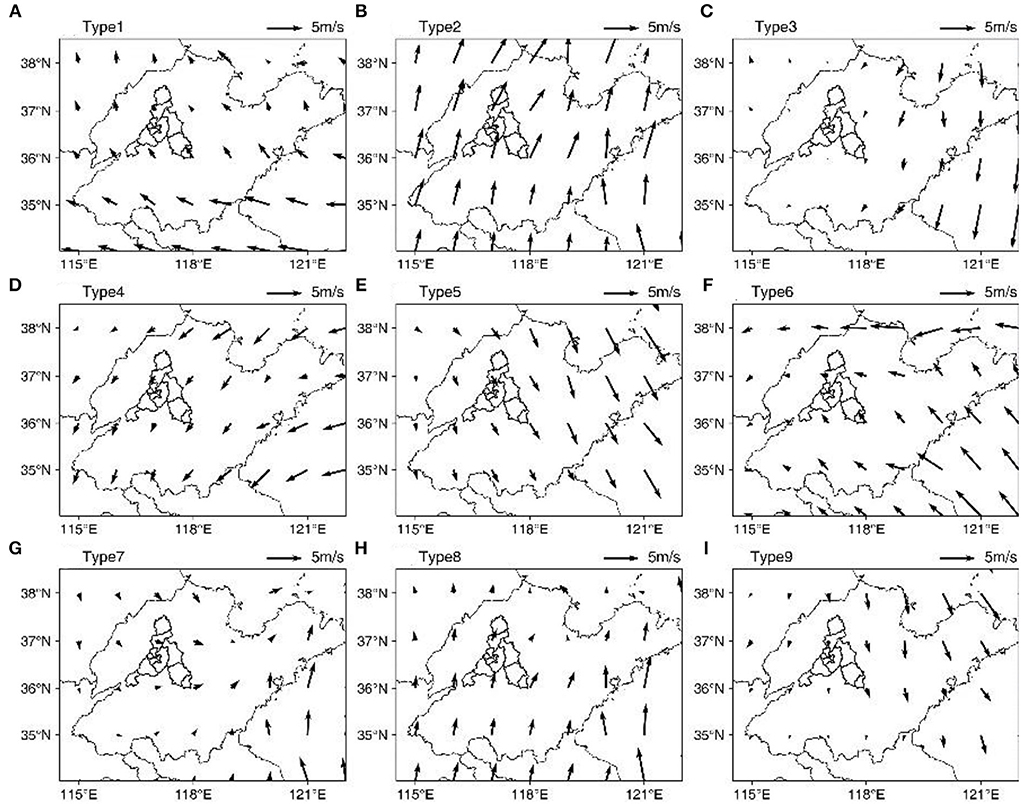
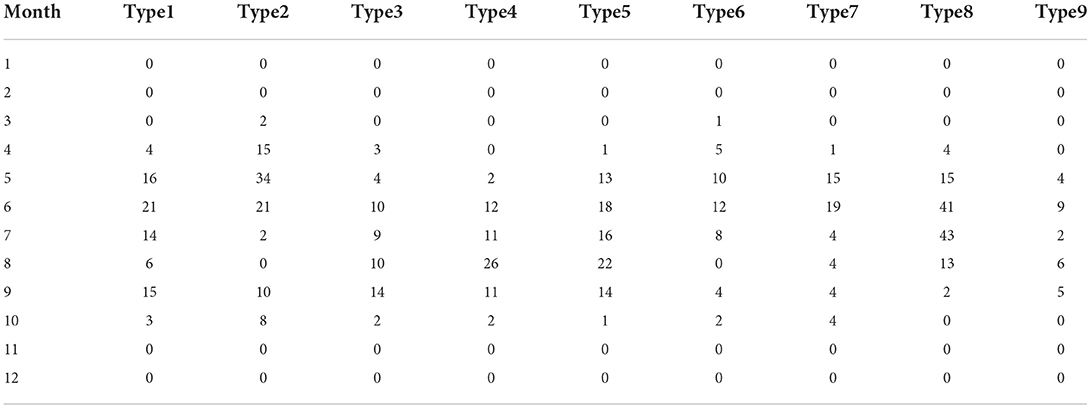
The synoptic weather pattern was classified into nine types by SLP based on the PCT method in North China (30° N−42°N, 108°E−128°E) from 2013 to 2020. Figure 5 depicts the spatial map of SLP among the identified 9 synoptic patterns. The spatial distribution of other key meteorological factors is presented in Figures 6–8. Furthermore, Table 3 lists monthly O3 exceedances for Types 1–9 over the study period. Evidently, both the number of exceedance and the average MDA8 O3 concentration in Type 8 is highest among identified synoptic patterns. In this cluster, the Shandong Peninsula, especially Jinan city, is situated in the center of the low-pressure system and is featured by low-pressure gradient and stagnant weather conditions, which are conducive to the accumulation of O3 precursors. Furthermore, meteorological conditions in Type 8 are characterized by high temperatures (regional average higher than 30°C) and intense ultraviolet radiation. The combination of the abovementioned phenomenon modulated by synoptic patterns leads to severe O3 pollution in Type 8. It is important to note that O3 exceedances in the summer season (particularly June and July) largely correspond to the occurrence of Type 8.
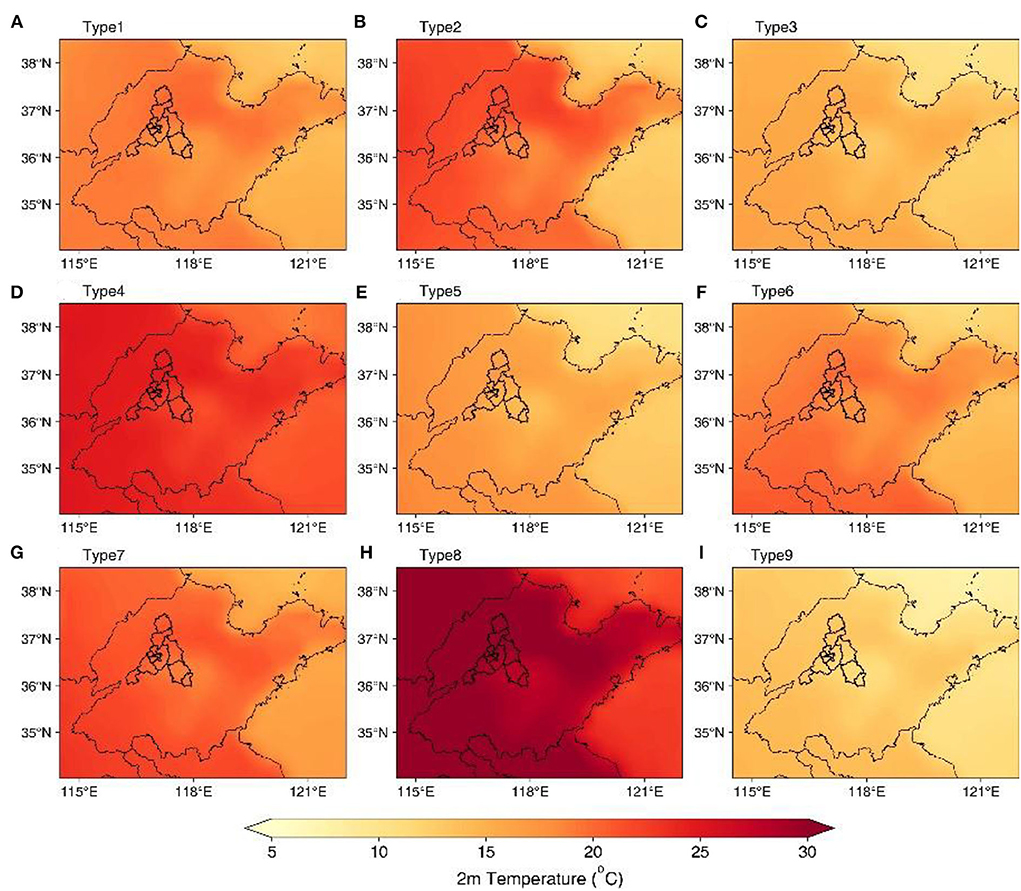
Figure 6. Air temperature at 2 m above the surface in 9 synoptic patterns during 2013–2020 in North China.
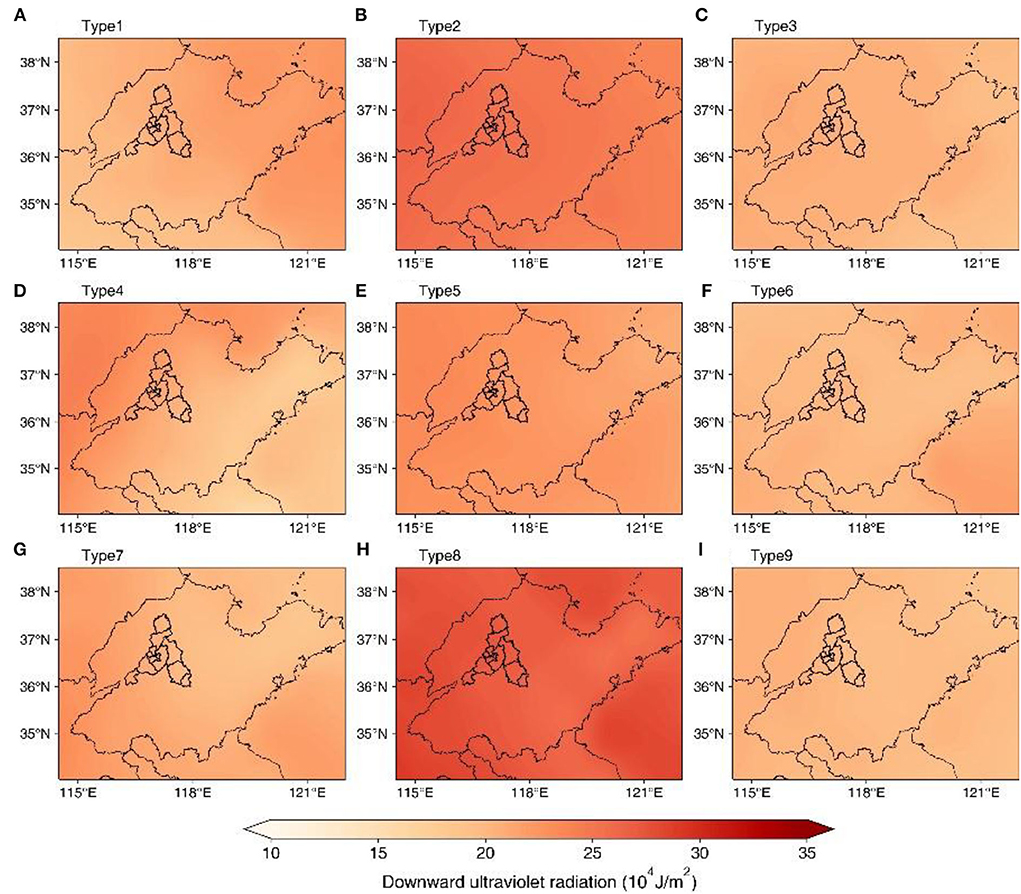
Figure 7. Downward UV radiation at the surface in 9 synoptic patterns during 2013–2020 in North China.
Similarly, elevated O3 levels are also depicted under the circulation pattern of Type 2. It can be clearly seen that this pattern is characterized by strong ultraviolet radiation and protracted higher temperature across Jinan and surrounding areas, which primes the landscape of O3 formation. However, the strong southerly wind fields could carry some pollutants to downwind regions, which may enhance the ventilation across the study domain. Contrary to Type 8, the occurrence of Type 2 is mainly concentrated in the spring season. To a lesser extent, it can be clearly seen that Types 1, 4, and 5 also contribute to O3 exceedances in summer. A detailed analysis shows that synoptic-driven weak wind fields in conjunction with stagnant conditions act as the governing factor in leading to the exceedances.
Conclusion
In this study, we adopt continuous ambient measurements from 2013 to 2020 for identifying variability in O3 concentrations over Jinan city in Shandong Province. It is found that deteriorated O3 pollution has emerged as a dominant environmental concern in the megacity, with a continuous increase in average MDA8 O3 concentrations and exceedances events since 2015. Elevated O3 levels are depicted across typical monitoring stations in each type, suggesting city-wide degraded O3 air quality.
For precursor emissions, NOx emissions from power plants (55%) and industrial (36%) sources substantially decreased over time due to the implementation of control strategies. However, traffic NOx emissions remain a prominent concern which still maintains high levels of emissions. A persistent decrease of NO2 columns is observed by OMI, adding support to the findings from the MEIC emission inventory. Given the continuous efforts on cutting NOx emissions, quantification of VOCs emissions and joint regulation on NOx and VOCs warrant further study.
Analysis of synoptic patterns shows that Type 2 and Type 8 are associated with higher O3 concentrations, which correspond to a meteorological phenomenon, including low SLP, high temperature, and strong ultraviolet radiation. Under the influence of stagnant conditions in combination with meteorological conditions modulated by the synoptic pattern, these weather patterns govern the occurrence of exceedance events in spring and summer over Jinan from 2013 to 2020.
Overall, the characteristics and the influence of precursors and meteorological conditions on ozone in Jinan city were analyzed based on the mathematical models using the data of meteorological measurements and pollutant monitoring. This work provides insights into the magnitude of O3 pollution in Jinan over time and distinguishes the trend of NOx emissions through emission inventory and satellite data, which shapes a clear view of long-term O3 variations. The classification of synoptic patterns clearly points to the relationship between O3 pollution and distinct meteorological conditions driven by synoptic patterns, which shed light on the regulation of ambient O3 in Jinan city.
Data availability statement
The original contributions presented in the study are included in the article/supplementary material, further inquiries can be directed to the corresponding author.
Author contributions
DL and GZ were responsible for the study concept and design. HY, YT, and YL contributed to the acquisition of the data. SH, HB, and WD assisted with the analyses and interpretation of the findings. DL drafted the initial manuscript. DL, GZ, HY, YT, YL, SH, HB, and WD critically reviewed the content and approved the final version of the manuscript for publication. All authors contributed to the article and approved the submitted version.
Funding
This work was supported by the Project Procurement of Atmospheric Source Apportionment of Jinan Government (No. 402015202000024-001), the Project of 20 Independent Training of Innovation Teams in Universities in Jinan (2020GXRC008), and the Planning Project of Commerce Statistical Society of China (2021STY30).
Conflict of interest
The authors declare that the research was conducted in the absence of any commercial or financial relationships that could be construed as a potential conflict of interest.
Publisher's note
All claims expressed in this article are solely those of the authors and do not necessarily represent those of their affiliated organizations, or those of the publisher, the editors and the reviewers. Any product that may be evaluated in this article, or claim that may be made by its manufacturer, is not guaranteed or endorsed by the publisher.
References
Boersma, K. F., Eskes, H. J., Dirksen, R. J., van der, A R. J, Veefkind, J. P., Stammes, P., et al. (2011). An improved tropospheric NO2 column retrieval algorithm for the Ozone Monitoring Instrument. Atmos. Meas. Tech. 4, 1905–1928. doi: 10.5194/amt-4-1905-2011
Chan, C. K., and Yao, X. (2008). Air pollution in mega cities in China. Atmos. Environ. 42, 1–42. doi: 10.1016/j.atmosenv.2007.09.003
Compernolle, S., Verhoelst, T., Pinardi, G., Granville, J., Hubert, D., Keppens, A., et al. (2020). Validation of Aura-OMI QA4ECV NO2 climate data records with ground-based DOAS networks: the role of measurement and comparison uncertainties. Atmos. Chem. Phys. 20, 8017–8045. doi: 10.5194/acp-20-8017-2020
Cromar, K. R., Gladson, L. A., and Ewart, G. (2019). Trends in excess morbidity and mortality associated with air pollution above American thoracic society-recommended standards, 2008-2017. Ann. Am. Thorac. Soc. 16, 836–845. doi: 10.1513/AnnalsATS.201812-914OC
Dai, H., Zhu, J., Liao, H., Li, J., Liang, M., Yang, Y., et al. (2021). Co-occurrence of ozone and PM2.5 pollution in the Yangtze River Delta over 2013-2019: spatiotemporal distribution and meteorological conditions. Atmos. Res. 249:105363. doi: 10.1016/j.atmosres.2020.105363
Dong, C., Gao, R., Zhang, X., Li, H., Wang, W., and Xue, L. (2021). Assessment of O3-induced crop yield losses in Northern China during 2013–2018 using high-resolution air quality reanalysis data. Atmos. Environ. 259:118527. doi: 10.1016/j.atmosenv.2021.118527
Huth, R (1996). An intercomparison of computer-assisted circulation classification methods. Int. J. Climatol. 16, 893–922. doi: 10.1002/(SICI)1097-0088(199608)16:8<893::AID-JOC51>3.0.CO;2-Q
Huth, R., Beck, C., Philipp, A., Demuzere, M., Ustrnul, Z., Cahynová, M., et al. (2008). Classifications of atmospheric circulation patterns: recent advances and applications. Ann. N. Y. Acad. Sci. 1146, 105–152. doi: 10.1196/annals.1446.019
Levelt, P. F., van den Oord, G. H. J., Dobber, M. R., Malkki, A., Visser, H., de Vries, J., et al. (2006). The ozone monitoring instrument. IEEE Trans. Geosci. Remote Sens. 44, 1093–1101. doi: 10.1109/TGRS.2006.872333
Li, C., Gu, X., Wu, Z., Qin, T., Guo, L., Wang, T., et al. (2021a). Assessing the effects of elevated ozone on physiology, growth, yield and quality of soybean in the past 40 years: a meta-analysis. Ecotoxicol. Environ. Saf. 208:111644. doi: 10.1016/j.ecoenv.2020.111644
Li, J., and Huang, X. (2019). Ground-level ozone concentration and landscape patterns in China's urban areas. Photogramm. Eng. Remote Sensing 85, 145–152. doi: 10.14358/PERS.85.2.145
Li, Y., Wang, X., Wu, Z., Li, L., Wang, C., Li, H., et al. (2021b). Atmospheric nitrous acid (HONO) in an alternate process of haze pollution and ozone pollution in urban Beijing in summertime: variations, sources and contribution to atmospheric photochemistry. Atmos. Res. 260:105689. doi: 10.1016/j.atmosres.2021.105689
Li, Z., Guo, J., Ding, A., Liao, H., Liu, J., Sun, Y., et al. (2017). Aerosol and boundary-layer interactions and impact on air quality. Natl. Sci. Rev. 4, 810–833. doi: 10.1093/nsr/nwx117
Lin, C. Y., Wang, C. M., Chen, M. L., and Hwang, B. F. (2019). The effects of exposure to air pollution on the development of uterine fibroids. Int. J. Hyg. Environ. Health 222, 549–555. doi: 10.1016/j.ijheh.2019.02.004
Lyu, X. P., Wang, N., Guo, H., Xue, L. K., Jiang, F., Zeren, Y. Z., et al. (2019). Causes of a continuous summertime O3 pollution event in Jinan, a central city in the North China Plain. Atmos. Chem. Phys. 19, 3025–3042. doi: 10.5194/acp-19-3025-2019
Pawlak, I., and Jarosławski, J. (2014). Analysis of Surface Ozone Variations Based on the Long-Term Measurement Series in Kraków (1854–1878), (2005–2013) and Belsk (1995–2012). Cham: Achievements, History and Challenges in Geophysics. doi: 10.1007/978-3-319-07599-0_18
Philipp, A., Bartholy, J., Beck, C., Erpicum, M., Esteban, P., Fettweis, X., et al. (2010). Cost733cat-A database of weather and circulation type classifications. Phys. Chem. Earth 35, 360–373. doi: 10.1016/j.pce.2009.12.010
Shu, L., Xie, M., Wang, T. J., Gao, D., Chen, P. L., Han, Y., et al. (2016). Integrated studies of a regional ozone pollution synthetically affected by subtropical high and typhoon system in the Yangtze River Delta region, China. Atmos. Chem. Phys. 16, 15801–15819. doi: 10.5194/acp-16-15801-2016
Vlachokostas, C., Nastis, S. A., Achillas, C., Kalogeropoulos, K., Karmiris, I., Moussiopoulos, N., et al. (2010). Economic damages of ozone air pollution to crops using combined air quality and GIS modelling. Atmos. Environ. 44, 3352–3361. doi: 10.1016/j.atmosenv.2010.06.023
Wang, H., Wu, K., Liu, Y., Sheng, B., Lu, X., He, Y., et al. (2021). Role of heat wave-induced biogenic VOC enhancements in persistent ozone episodes formation in Pearl River Delta. J. Geophys. Res. Atmos. 126:e2020JD034317. doi: 10.1029/2020JD034317
Wang, Y., Yang, X., Wu, K., Mei, H., Lu, Y., Smedt, I. D., et al. (2022). Long-term trends of ozone and precursors from 2013 to 2020 in a megacity (Chengdu), China: evidence of changing emissions and chemistry. Atmos. Res. 106309. doi: 10.1016/j.atmosres.2022.106309
Wang, Y., Zhang, Y., Hao, J., and Luo, M. (2010). Seasonal and spatial variability of surface ozone over China: contributions from background and domestic pollution. Atmos. Chem. Phys. Discuss. 10, 27853–27891. doi: 10.5194/acpd-10-27853-2010
Wu, K., Wang, Y., Qiao, Y., Liu, Y., Wang, S., Yang, X., et al. (2022). Drivers of 2013-2020 ozone trends in the Sichuan Basin, China: impacts of meteorology and precursor emission changes. Environ. Pollut. 300:118914. doi: 10.1016/j.envpol.2022.118914
Wu, K., Yang, X., Chen, D., Gu, S., Lu, Y., Jiang, Q., et al. (2020). Estimation of biogenic VOC emissions and their corresponding impact on ozone and secondary organic aerosol formation in China. Atmos. Res. 231:104656. doi: 10.1016/j.atmosres.2019.104656
Xiong, C., Wang, N., Zhou, L., Yang, F., Qiu, Y., Chen, J., et al. (2021). Component characteristics and source apportionment of volatile organic compounds during summer and winter in downtown Chengdu, Southwest China. Atmos. Environ. 258:118485. doi: 10.1016/j.atmosenv.2021.118485
Yang, J., Zhao, Y., Cao, J., and Nielsen, C. P. (2021). Co-benefits of carbon and pollution control policies on air quality and health till 2030 in China. Environ. Int. 152:106482. doi: 10.1016/j.envint.2021.106482
Yang, X., Wu, K., Wang, H., Liu, Y., Gu, S., Lu, Y., et al. (2020). Summertime ozone pollution in Sichuan Basin, China: Meteorological conditions, sources and process analysis. Atmos. Environ. 226:117392. doi: 10.1016/j.atmosenv.2020.117392
Zara, M., Boersma, K. F., De Smedt, I., Richter, A., Peters, E., Van Geffen, J. H. G. M., et al. (2018). Improved slant column density retrieval of nitrogen dioxide and formaldehyde for OMI and GOME-2A from QA4ECV: intercomparison, uncertainty characterization, and trends. Atmos. Meas. Tech. 11, 4033–4058. doi: 10.5194/amt-11-4033-2018
Zhao, H., Niu, Z., and Feng, X. (2021). Factors influencing improvements in air quality in Guanzhong cities of China, and variations therein for 2014-2020. Urban Clim. 38:10087. doi: 10.1016/j.uclim.2021.100877
Zheng, B., Tong, D., Li, M., Liu, F., Hong, C., Geng, G., et al. (2018). Trends in China's anthropogenic emissions since 2010 as the consequence of clean air actions. Atmos. Chem. Phys. 18, 14095–14111. doi: 10.5194/acp-18-14095-2018
Keywords: ozone (O3), objective synoptic weather pattern classification, NOx, air pollution, emission inventory
Citation: Liang D, Yan H, Tian Y, Liu Y, Hao S, Bai H, Zhang G and Deng W (2022) Identification of key controlling factors of ozone pollution in Jinan, northern China over 2013–2020. Front. Ecol. Evol. 10:930569. doi: 10.3389/fevo.2022.930569
Received: 28 April 2022; Accepted: 08 July 2022;
Published: 03 August 2022.
Edited by:
Yuzhong Zhang, Westlake University, ChinaReviewed by:
Xianyu Yang, Chengdu University of Information Technology, ChinaHaolin Wang, Sun Yat-sen University, China
Copyright © 2022 Liang, Yan, Tian, Liu, Hao, Bai, Zhang and Deng. This is an open-access article distributed under the terms of the Creative Commons Attribution License (CC BY). The use, distribution or reproduction in other forums is permitted, provided the original author(s) and the copyright owner(s) are credited and that the original publication in this journal is cited, in accordance with accepted academic practice. No use, distribution or reproduction is permitted which does not comply with these terms.
*Correspondence: Guiqin Zhang, emhhbmdndWlxaW5Ac2RqenUuZWR1LmNu
 Di Liang
 Huaizhong Yan2