 Liye Wang
 Siyu Zhang
 Yifan Xie
 Yanfang Liu1
 Yaolin Liu
95% of researchers rate our articles as excellent or good
Learn more about the work of our research integrity team to safeguard the quality of each article we publish.
Find out more
ORIGINAL RESEARCH article
Front. Ecol. Evol. , 30 June 2022
Sec. Environmental Informatics and Remote Sensing
Volume 10 - 2022 | https://doi.org/10.3389/fevo.2022.927238
This article is part of the Research Topic Meta-Scenario Computation for Social-Geographical Sustainability View all 60 articles
A clear understanding of cropland expansion dynamics and their effects is vital for cropland protection and food security. However, the trajectories of cropland expansion have been less discussed. This study referred to the modes of landscape expansion and assessed the cropland expansion trajectory in three urban agglomerations in the Yangtze River Economic Belt and its impact on cropland fragmentation. Specifically, we identified three cropland expansion trajectories using the landscape expansion index, namely, infilling, edge-expansion, and outlying. Moreover, the surface relief amplitude model was employed to characterize the relief amplitude effect on cropland expansion trajectories. By coupling landscape metrics (e.g., patch density, landscape shape index, the largest patch index, and aggregation index) and Spearman correlation analysis, the relationship between cropland expansion trajectories and cropland fragmentation was assessed. Results show that (1) three urban agglomerations experience cropland expansion, in which the edge-expansion trajectory is primary, followed by infilling and outlying trajectories; (2) the cumulative frequency curve indicates that infilling and edge-expansion trajectories are likely to be distributed in low topographic relief amplitude regions, while the outlying trajectory is located in relatively higher topographic relief amplitude regions; and (3) infilling and edge-expansion trajectories contribute to a significantly positive relationship with the decrease of cropland fragmentation, while the outlying trajectory has a negative relationship with cropland fragmentation. This research highlights that cropland protection policies should considerably focus on the trajectory of cropland expansion, not only request the total area of cropland in a dynamic balance.
Agricultural activities have been consistently chosen by humans to cultivate the earth’s surface for their needs in food, timber, and other living materials. In 2000, agricultural lands, including cropland and pasture, comprised at least 34% of the global land surface that is without ice (Ramankutty et al., 2008). Since the twenty-first century, the explosive population growth has placed immense pressure on agricultural lands (Tscharntke et al., 2012). Due to increasing income and socioeconomic growth brought by urbanization and globalization, this pressure to satisfy human’s increasing pursuit to improve their diet structure will keep on increasing in the foreseeable future (Phalan et al., 2011; Kastner et al., 2012; Dong et al., 2018). The requirement for food crops in 2050 is projected to increase by 100–110% compared with that in 2005, and the magnitude of land that will be cleared for agricultural expansion to meet this demand (Tilman et al., 2011).
Except for food use, crops are also used for animal feed, bioenergy, and industrial products, thereby affecting food availability for humans. Global research has shown that the allocation of crop yield for human food only accounts for 62% of the total cropland production (Foley et al., 2011). Cropland, as a vital producer of basic living materials, is one of the most important human-made landscapes on Earth and also a vital landscape for human society (Liu J. et al., 2014; van Vliet et al., 2017). A large number of policies have been implemented to maintain cropland to maintain food security (Liu et al., 2017). For example, the UK proposed the “Green Belt Policy” to restrict the loss of cropland and China implemented the “Basic Cropland Protection Policy” to prevent the disorderly urban sprawl (Cullingworth, 2014; Wang et al., 2022b). In the fields of land use science and landscape studies, cropland is consistently a popular issue for researchers (Sarparast et al., 2020; Zhou et al., 2021). Numerous cropland-related topics have been assessed by previous studies from the micro to macro scale, including cropland conversion encroaching with urban expansion and ecological land loss (Ke et al., 2018; Tu et al., 2021), interaction with ecosystem services (Ke et al., 2019; Wang et al., 2020), displacement (Yang et al., 2020), abandonment (Yan et al., 2009; Han and Song, 2020), driving forces (Prabhakar, 2021; Uisso and Tanrıvermiş, 2021), and expansion and intensification (Zabel et al., 2019; Nzabarinda et al., 2021).
Globally, cropland expansion has been considered as an important way to increase crop production (Zeng et al., 2018; van Vliet, 2019; Eigenbrod et al., 2020). By 2030, an estimated 7.3×10⁶ km2 of land globally will be additionally transformed into cropland (Zabel et al., 2019). Cropland expansion is a special topic because it increases food supply (Lambin and Meyfroidt, 2011; Cheng et al., 2021) and improves the income of farmers (He et al., 2021), but threatens biodiversity (Egli et al., 2018) and degrades ecosystem services (Ke et al., 2019). Given that China is the most populous developing country, ensuring food security, the strictest cropland protection policy has been promulgated by the Chinese government to protect the total area of cropland and promote cropland expansion (Song and Pijanowski, 2013; Wang et al., 2021). Tang et al. (2020b) explored the cropland expansion in Hubei Province, China and assessed its impact on carbon storage. They pointed out that the loss of carbon storage caused by cropland expansion is 3.89 times greater than that caused by urban expansion. Ma et al. (2019) mapped the cropland expansion in the Northwest of China and found the speed of cropland expansion in the Junggar Basin and Tarim Basin at 641.3 and 271.3 km2/year, respectively. However, there is still a research gap in systematically understanding the rate and trajectory of cropland expansion, particularly in combining spatiotemporal data in the urban agglomerations. Besides, the spatiotemporal characteristics of cropland expansion and its consequences are particularly vital for cropland protection and future policy-making. Therefore, understanding the speed, expansion trajectory, and consequences of cropland expansion is an important issue for researchers.
Cropland fragmentation is another focus of the government and researchers due to its threat to cropland productivity and food security (Song and Liu, 2017; Liang et al., 2021a; Tian et al., 2021). Cropland fragmentation comprises two types of fragmentation, namely, cropland physical and ownership fragmentations (Farley et al., 2012; Su et al., 2014). Cropland physical fragmentation refers to an increase in cropland patch numbers and a decrease in patch size, which are closely related to land conversion processes (Qi et al., 2014), Ownership fragmentation represents the spatial dispersibility of cropland patches owned by one cropland owner (Tan et al., 2006). Existing research has mainly focused on cropland fragmentation brought by land use change such as urbanization (Tu et al., 2021), resulting from land protection strategies (Brabec and Smith, 2002), and spatiotemporal changes in cropland fragmentation (Cheng et al., 2015). Only a few researchers have explored the impact of cropland expansion on cropland fragmentation. Yu et al. (2018) explored the gross area change of cropland and its interaction with cropland fragmentation in China and found little net change in cropland area while there was greater cropland fragmentation due to the redistribution of cropland. A nuanced analysis of the interaction between cropland expansion and cropland fragmentation has yet to be conducted. The proposed modes of landscape expansion (i.e., infilling, edge-expansion, and outlying) have been widely employed to understand the landscape expansion process (Xu et al., 2007; Li et al., 2013; Jiao et al., 2015). The modes of landscape expansion can be used to understand cropland expansion.
The Yangtze River Economic Belt (YREB) program was launched by the central government of China in 2016, and aims to promote the economic development of the coastal areas along the Yangtze River by giving play to the leading roles of the urban agglomerations in the YREB (Yang et al., 2021; Wang et al., 2022b). The YREB is located in the central part of China and it spans the West, Middle, and East of China, experiencing large-scale elevation changes. A large amount of cropland and cropland expansion activities are detected in the YREB (Tang et al., 2021; Wang et al., 2022a,b). Studies related to cropland expansion in the YREB include several perspectives, such as ecosystem services or functions (Tang et al., 2020b; Zhang et al., 2021), ecological risks (Ran et al., 2022), driving factors of cropland expansion (Wang et al., 2022b), and interactions between cropland and construction land expansion (Wang et al., 2022a). It is important to understand the cropland expansion trajectories and their impacts on cropland fragmentation in such an area with large-scale elevation changes and active cropland expansion activities.
Thus, choosing the urban agglomerations in the YREB as the case areas, this study used the landscape expansion modes as the basis for defining the trajectory of cropland expansion. Specifically, three cropland expansion trajectories were identified, namely, infilling, edge-expansion, and outlying trajectories. The research objectives of this study are to (1) identify the spatiotemporal heterogeneity of different cropland expansion trajectories; and (2) assess the interactions between cropland expansion trajectories and cropland fragmentation. In this study, cropland fragmentation refers to cropland physical fragmentation and cropland ownership fragmentation is not discussed.
In total, three Chinese national urban agglomerations in the YREB were selected to identify the impact of cropland expansion trajectories on cropland fragmentation: Yangtze River Delta Urban Agglomeration (YRDUA), Middle Reaches of Yangtze River Urban Agglomeration (MRYRUA), and Cheng and Yu Urban Agglomeration (C&YUA) (Figure 1). YREB is one of the most important economic and agricultural development zones. According to statistical data from the National Bureau of Statistics of China,1 YREB accounts for 44% of China’s GDP. Among them, the GDP of the primary industry accounts for 42% of the country. YREB, as one of the most important grain yield bases, also has 3.08 × 10⁷ ha of cropland, which contributes to 32.5% of grain yield, reflecting active agricultural activities. Therefore, frequent cropland transitions have been observed by recent studies (Cheng et al., 2020; Tang et al., 2021; Yang et al., 2021). With the exception of spontaneous cropland expansion activities, there are also some cropland expansion activities implemented under policy requirements, among which the Cropland Balance Policy is the most targeted policy (Song and Pijanowski, 2013; Liu et al., 2017). This policy regulates the activity of cropland compensation as a mitigation measure for cropland loss caused by urban land expansion, making cropland expansion activities considerably active in fast urbanization areas. Thus, YRDUA, MRYRUA, and C&YUA are superior regions for identifying cropland expansion trajectories.
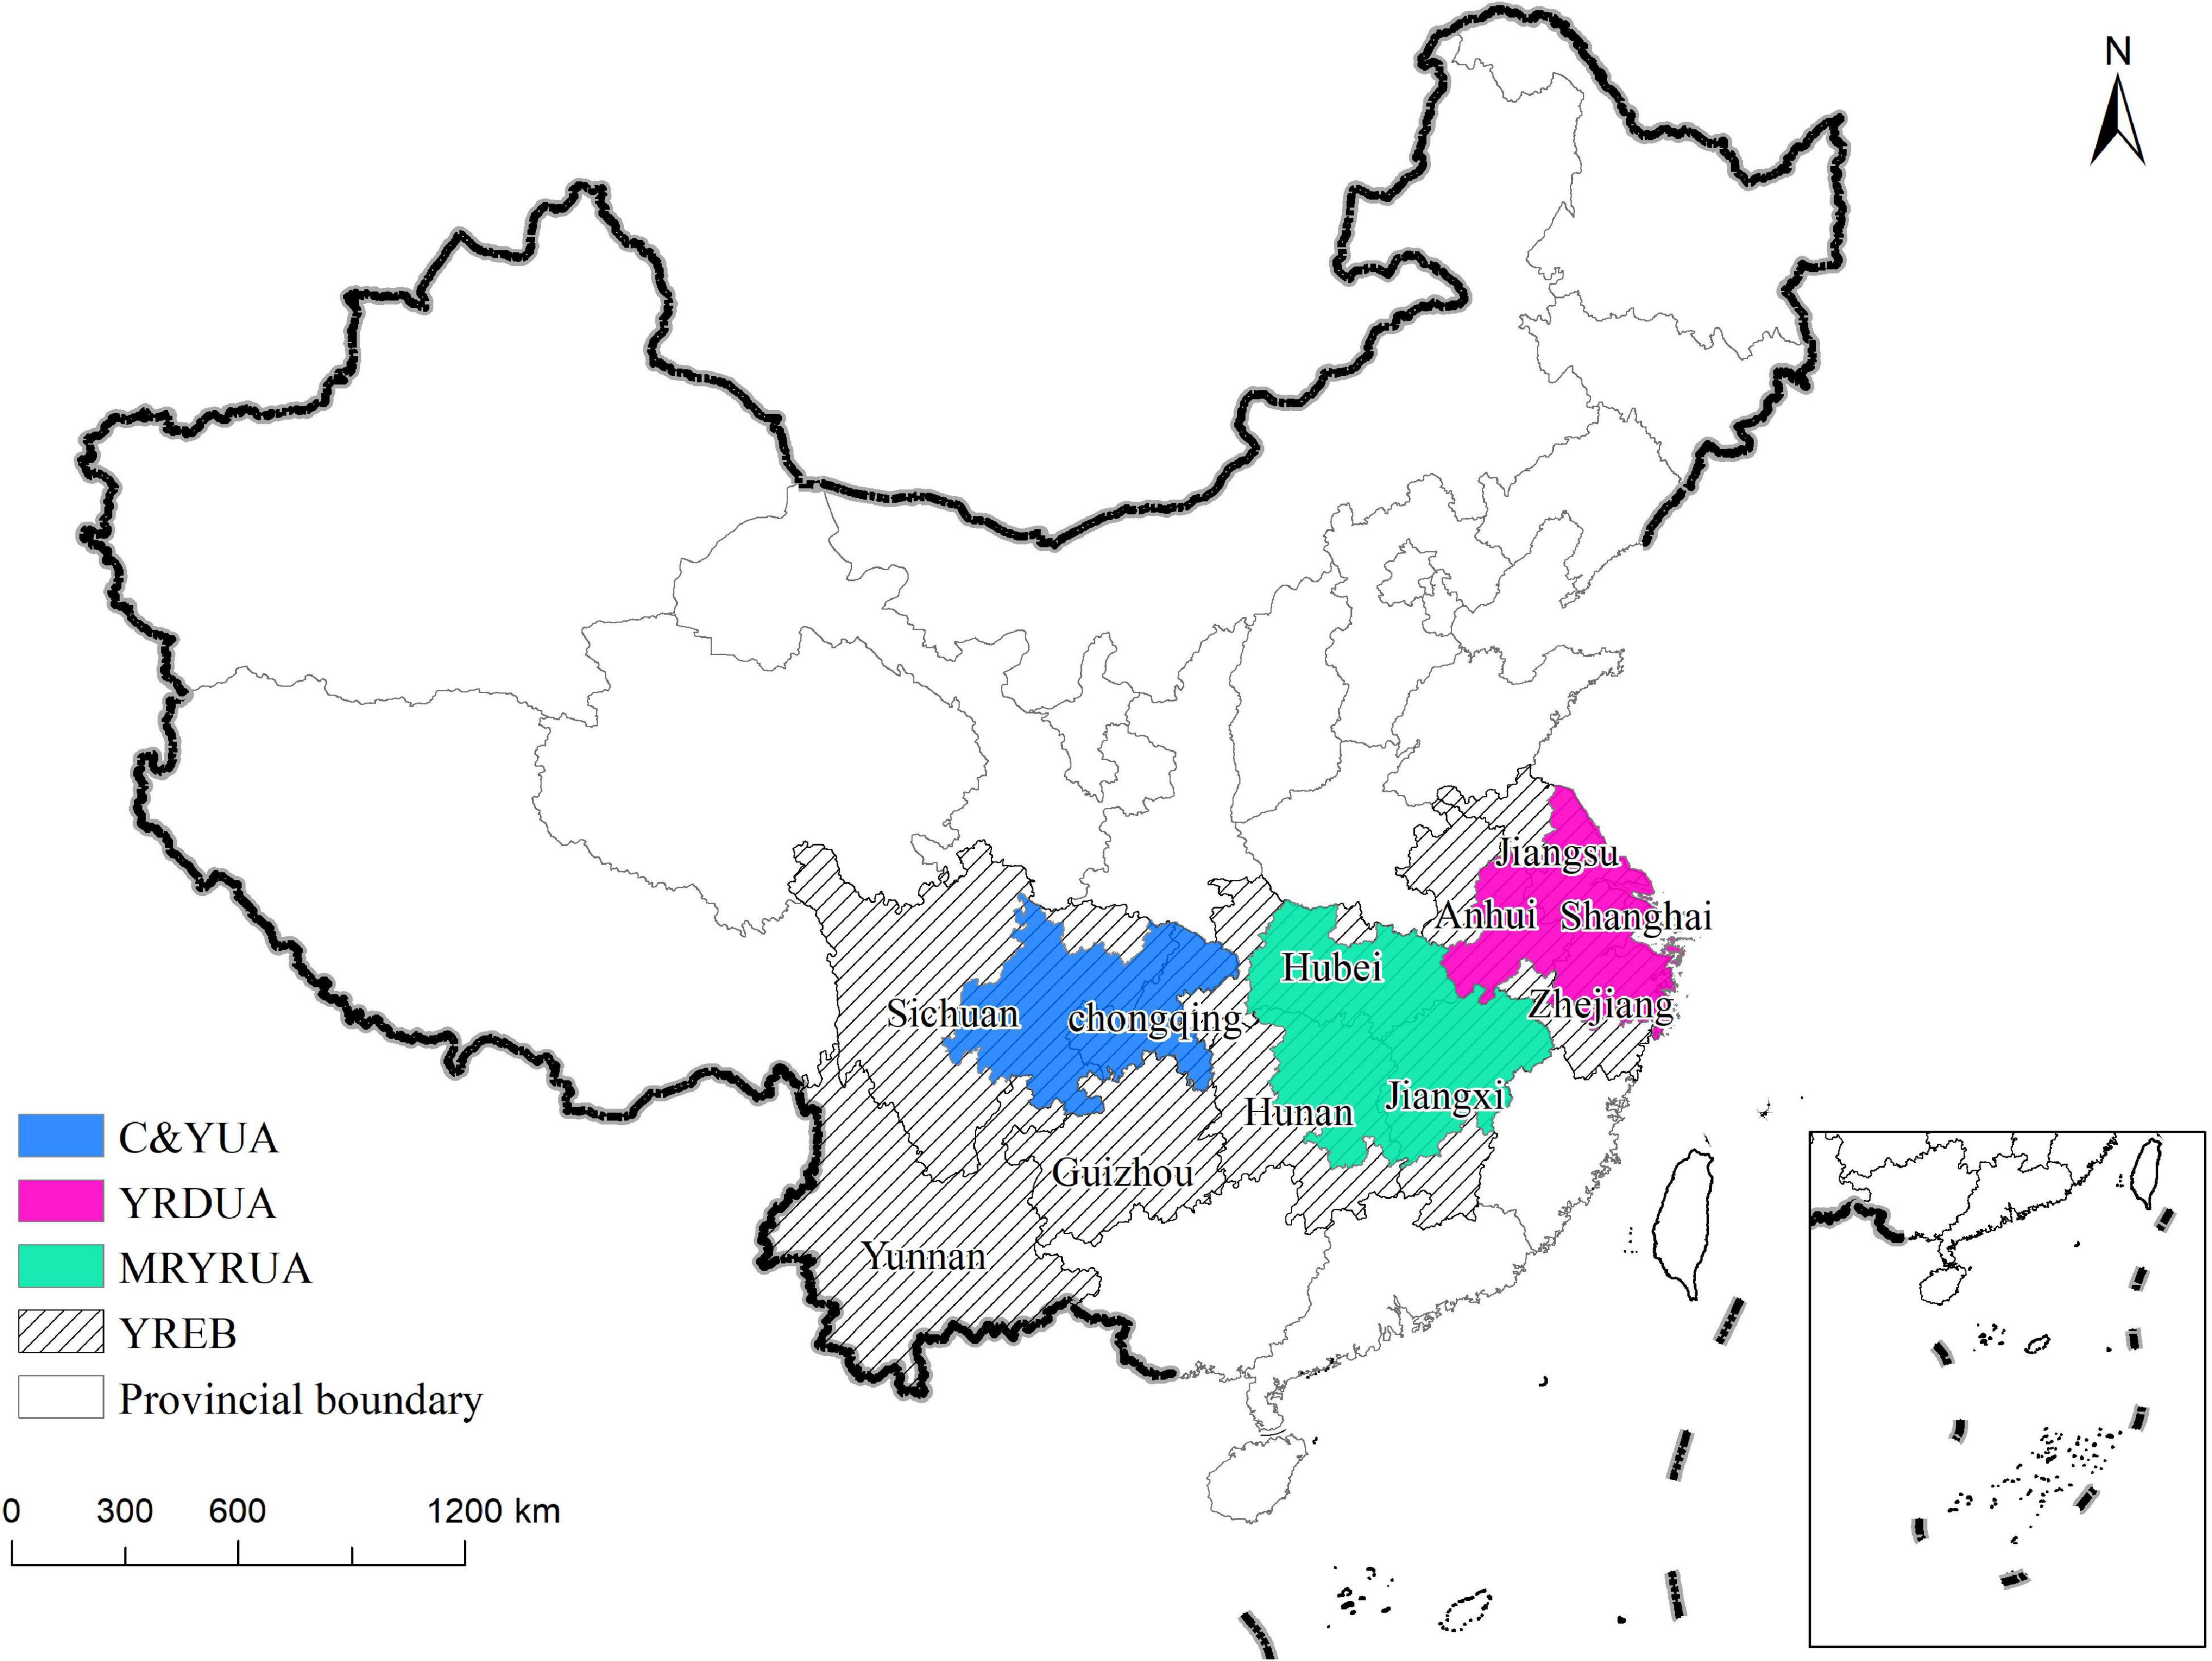
Figure 1. Location of the study area (names in this figure are the names of provinces in YREB).
The data chosen in this study consists of land use data from 2000 to 2015 (with a resolution of 30 m) from the Data Center of Resources and Environment, Chinese Academy of Sciences.2 Due to data limits for landscape metric calculation, we reclassified land use types into cropland and other lands (not cropland) for further analysis and resampled the spatial resolution into 100 m.
The three types of landscape expansion are infilling, edge-expansion, and outlying (Wilson et al., 2003; Li et al., 2013). All landscape expansion progress could be regarded as an integration of the three types (Forman, 1995; Ellman, 1997). Since Liu et al. (2010) proposed the landscape expansion index (LEI), numerous studies have used this index to identify the landscape expansion types in different regions, such as Wuhan and Beijing (Rao et al., 2021; Tu et al., 2021). By referencing studies related to landscape expansion, cropland expansion trajectories can also be subdivided into three trajectories, namely, infilling, edge-expansion, and outlying trajectories. The infilling trajectory specifically indicates the phenomenon that new expanded cropland is converted from the void area between or within the previous cropland. An edge-expansion trajectory represents a newly emerged cropland that spreads unidirectionally from the edge of the existing cropland. An outlying trajectory refers to a newly expanded area of cropland isolated from old patches.
The LEI is chosen to identify different cropland expansion trajectories. This index is calculated based on the interacted area between the buffer zone of newly expanded patches and old patches:
where LEIi,j is the landscape expansion index; AOi,j is the interacted area between the buffer zone of new expanded patches and old patches; AVi,j denotes the interacted area between the buffer zone and vacant area, and i and j represent the study area and period, respectively.
The thresholds of LEI are defined by Liu et al. (2010): (1) For the infilling trajectory, the threshold is above 50 and below or equal to 100. (2) If LEI belongs to the range of (0, 50], then the new expanded path can be defined as an edge-expansion trajectory. (3) The threshold of the outlying trajectory is equal to 0. In addition, another key parameter for the LEI calculation is the buffer distance, which should be decided based on the spatial resolution of the land use data. Thus, this parameter is 100 m in the current study.
Topographic factors, such as water and heat, can highly influence the spatial distribution of cropland and its expansion by affecting the distribution of farming conditions (Gao et al., 2019), thereby affecting the spatial distribution of different cropland expansion trajectories. The majority of the existing studies have explored the influence of DEM on cropland (Cheng et al., 2020; Folberth et al., 2020), and have disregarded the difference between the surface of relief amplitudes in different levels of DEM. For example, a district with a low DEM may have a higher relief amplitude than a district with a high DEM, thereby having limited cropland and cropland-related activities. Thus, the surface relief amplitude model was chosen to explore the characteristics of the distribution of different cropland expansion trajectories.
The surface relief amplitude model is an index to represent regional characteristics referring to the difference between the highest DEM and lowest DEM in a region. The related equation is shown as follows:
where SRAi represents the surface relief amplitude in the surface relief amplitude window i and DEMi,max and DEMi,min are the maximum and minimum, respectively, of DEM in the window i. The calculation results are scale-dependent, which means the spatial resolution of the surface relief amplitude window is the key factor to reflect the true situation of the surface relief amplitude (Liang et al., 2021b). Therefore, to determine the best scale of the window, the mean change point method is used to calculate the side length of the window.
First, we generate a series of surface relief amplitude windows with a side length of n (n = 1, 2, 3,…, 20) for the DEM data and calculate the surface relief amplitude by using Equation (2). Thereafter, we calculate the mean values of the surface relief amplitude in different side length windows and determine the surface relief amplitude per unit area. Lastly, we calculate the logarithm sequence {Xn} according to Equation (3).
where UAn is the surface relief amplitude per unit area in window n; n is the window’s side length, with a value of 1, 2, … 20. The variance of {Xn} is labeled as T.
Second, we make i = 2, 3,…,19, and each i places sequence {Xn} into two sub-sequences: {X1, X2, …, Xi–1} and {Xi,Xi + 1,…,Xn}. The mean value of the two sub-sequences Xi1 and Xi2 are obtained separately. The statistic value Ti of each sequence is calculated by the following equation:
Last, we calculate the difference between T and Ti, and find the best side length of the surface relief amplitude window corresponding to the maximum value of T−Ti. Figure 2 shows the statistical difference between T and Ti in three urban agglomerations. That is when i = 5, 5, 4, the difference between S and Si reaches the maximum values in YRDUA, MRYRUA, and C&YUA, respectively. Thus, the most suitable spatial resolutions of the window side length are 6, 6, and 5 km in YRDUA, MRYRUA, and C&YUA, respectively.
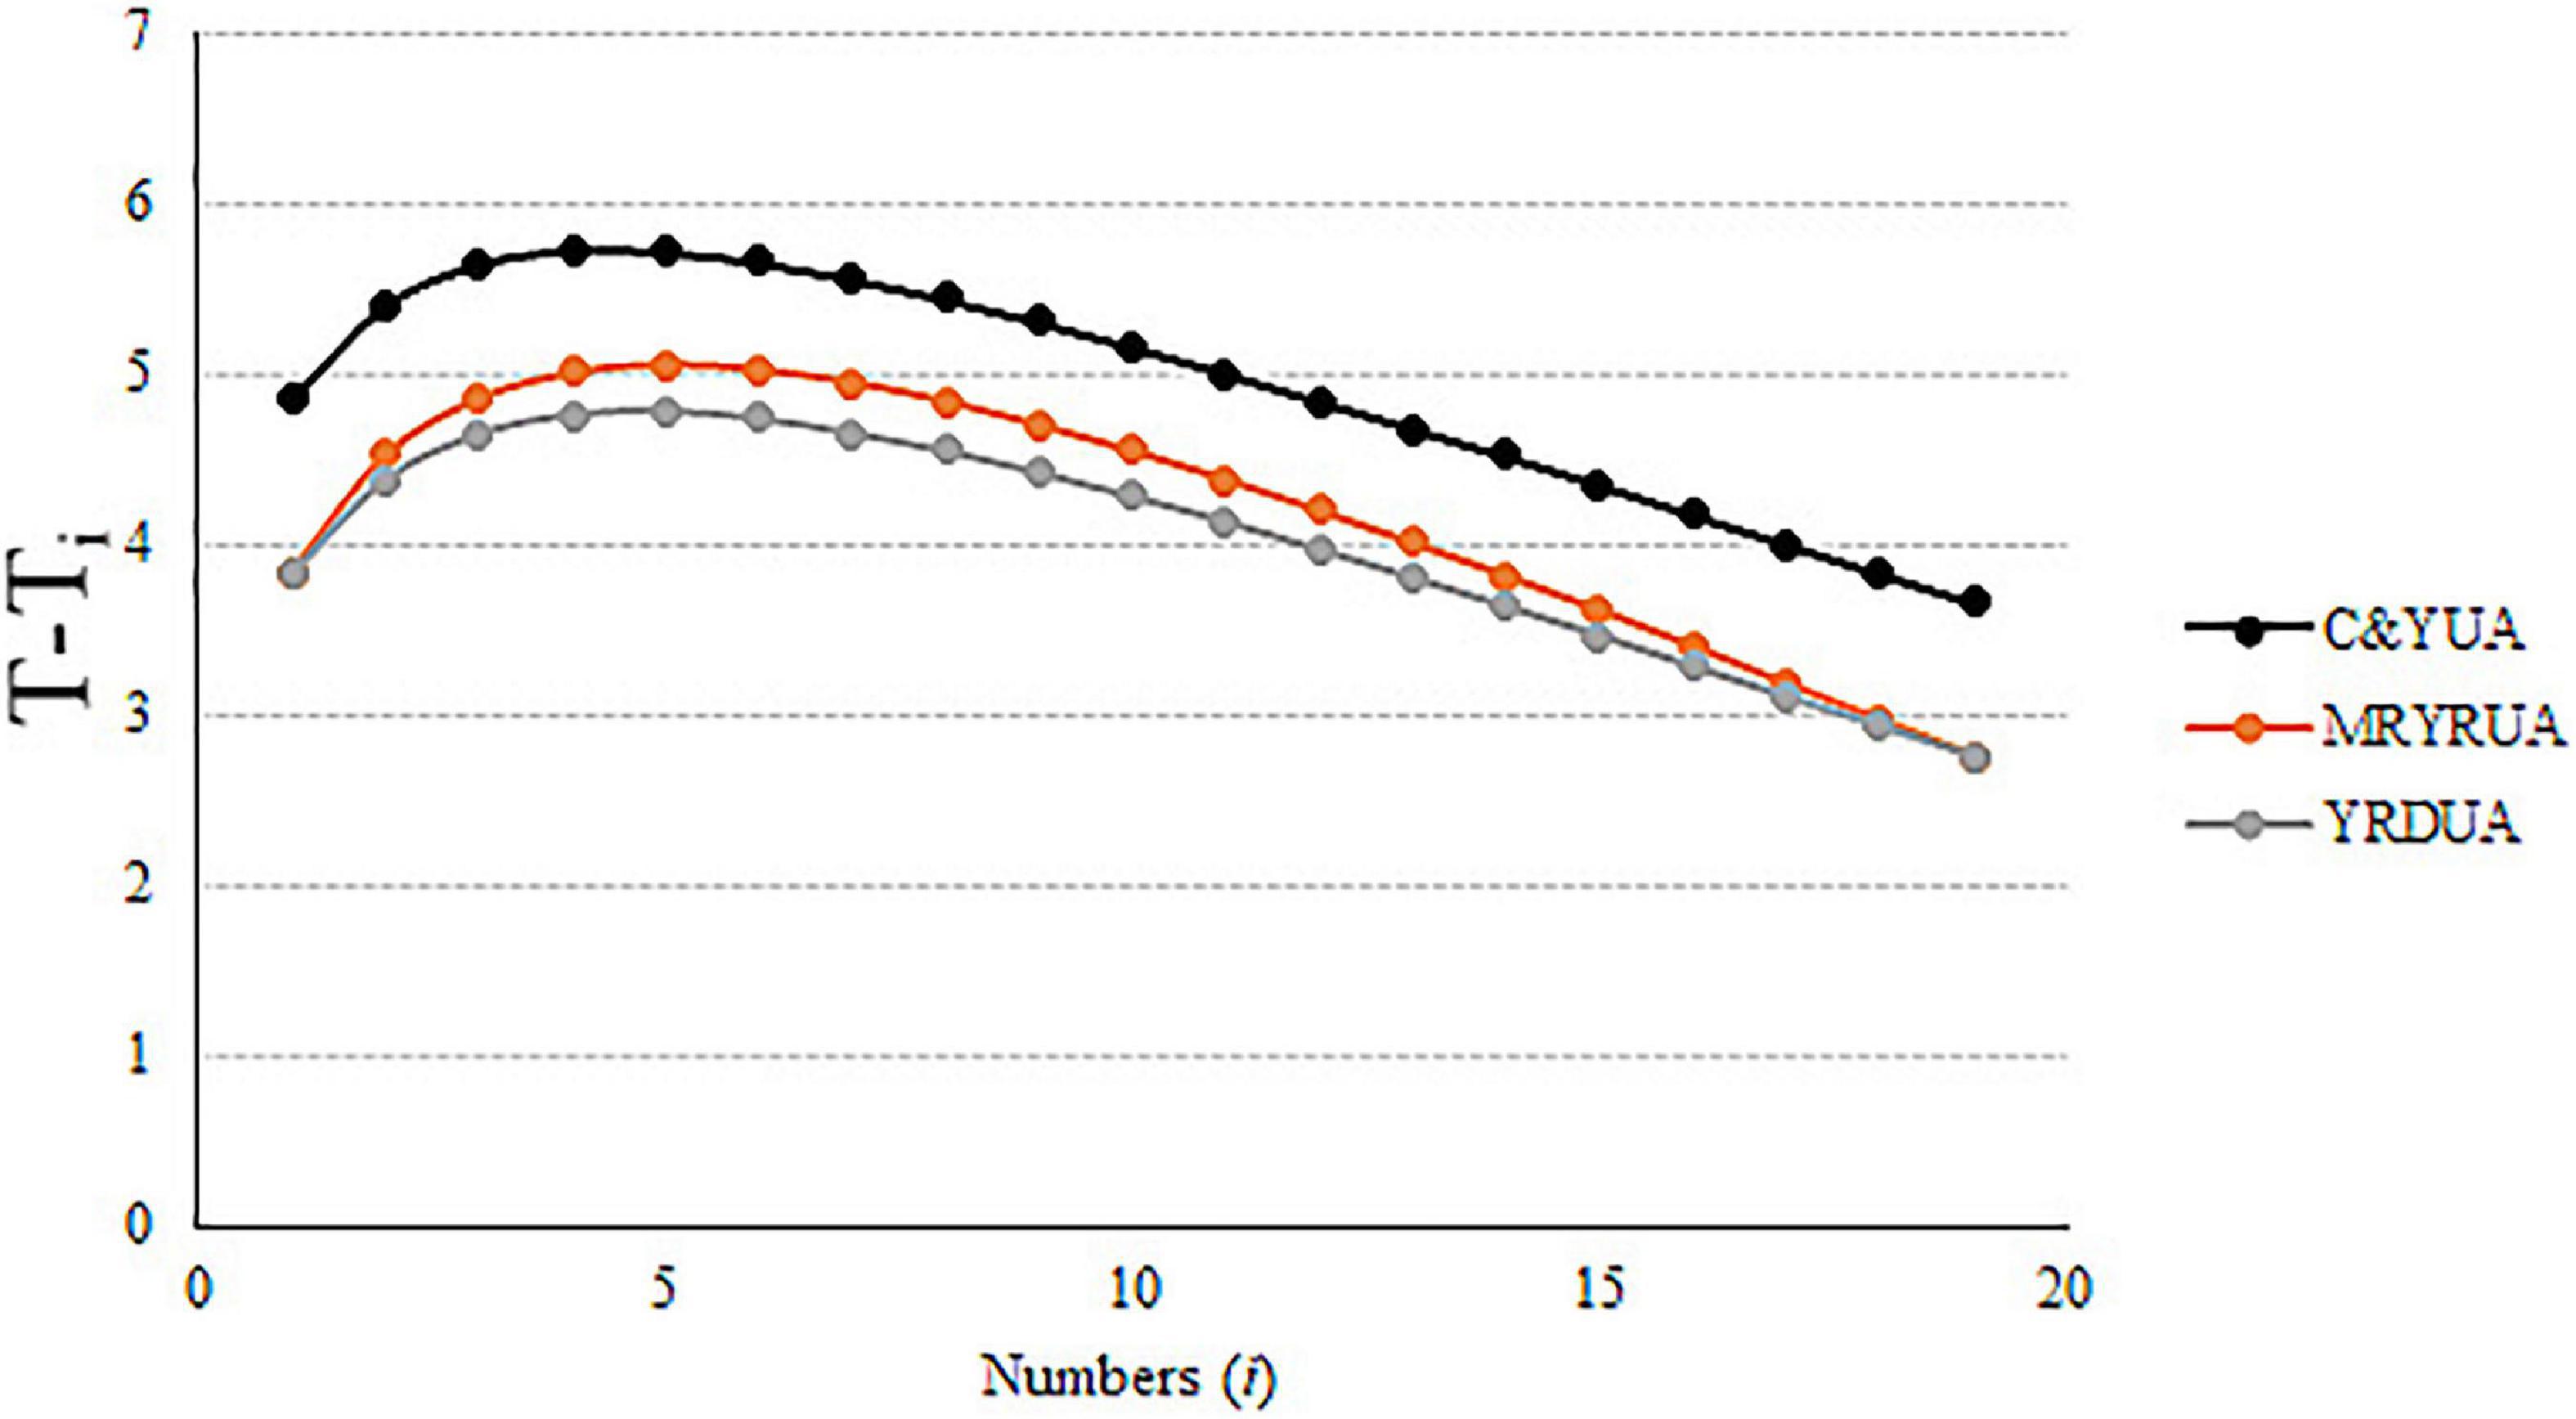
Figure 2. Statistical differences corresponding to each number of i.
Landscape metrics, which are the most widely used indexes in measuring landscape status, have been used in numerous studies to assess land fragmentation (Dewan et al., 2012; Su et al., 2012). To measure cropland fragmentation, four indexes are chosen to represent the level of fragmentation and continuity at the class level according to previous research: patch density (PD), landscape shape index (LSI), the largest patch index (LPI), and aggregation index (AI) (Cabral and Costa, 2017; Qiu et al., 2019; Tu et al., 2021).
Patch density is used to represent the level of cropland fragmentation or subdivision. LSI adjusts the size of cropland through the measurement of the total edge length of cropland. LPI reports the ratio between the area of the largest cropland patch and the total cropland. Lastly, AI indicates the largest possible number of patch adjacencies of cropland. In the progress of cropland expansion, both the number of patches and the area of cropland are increasing. However, there is a mismatch between the speed of the patch increase and area increase under different cropland expansion trajectories. For example, a new expanded cropland in infilling and edge-expansion trajectories may only lead to an increase in cropland area, influence the largest patch area, and not affect the number of patches. Therefore, these landscape metrics can be used to reflect the impacts of cropland expansion trajectories on cropland fragmentation.
All landscape metrics are calculated in Fragstats 4.2.1 software with no sampling strategy at the class scale.
This study defined the impact of cropland expansion trajectories on cropland fragmentation as it assessed the impacts of a new expanded cropland in the infilling, edge-expansion, and outlying trajectories on the fragmentation of the total new expanded cropland. Thus, we calculated the landscape metrics for the total new expanded cropland and the expanded cropland in three cropland trajectories. We likewise used the Spearman correlation analysis to assess the correlation between cropland expansion trajectories and the total expanded cropland. A positive correlation coefficient indicates a promotional effect between cropland trajectory and cropland fragmentation and vice versa (Han and Song, 2020; Li et al., 2021).
Given the scarcity of expanded cropland compared with the existing cropland and the readability of a figure, Figure 3 only presents the spatial distribution of expanded cropland in different cropland expansion trajectories in a time period from 2000 to 2015, rather than the three-time intervals: 2000–2005, 2005–2010, and 2010–2015. And, Table 1 shows the area of different cropland expansion trajectories in different periods.
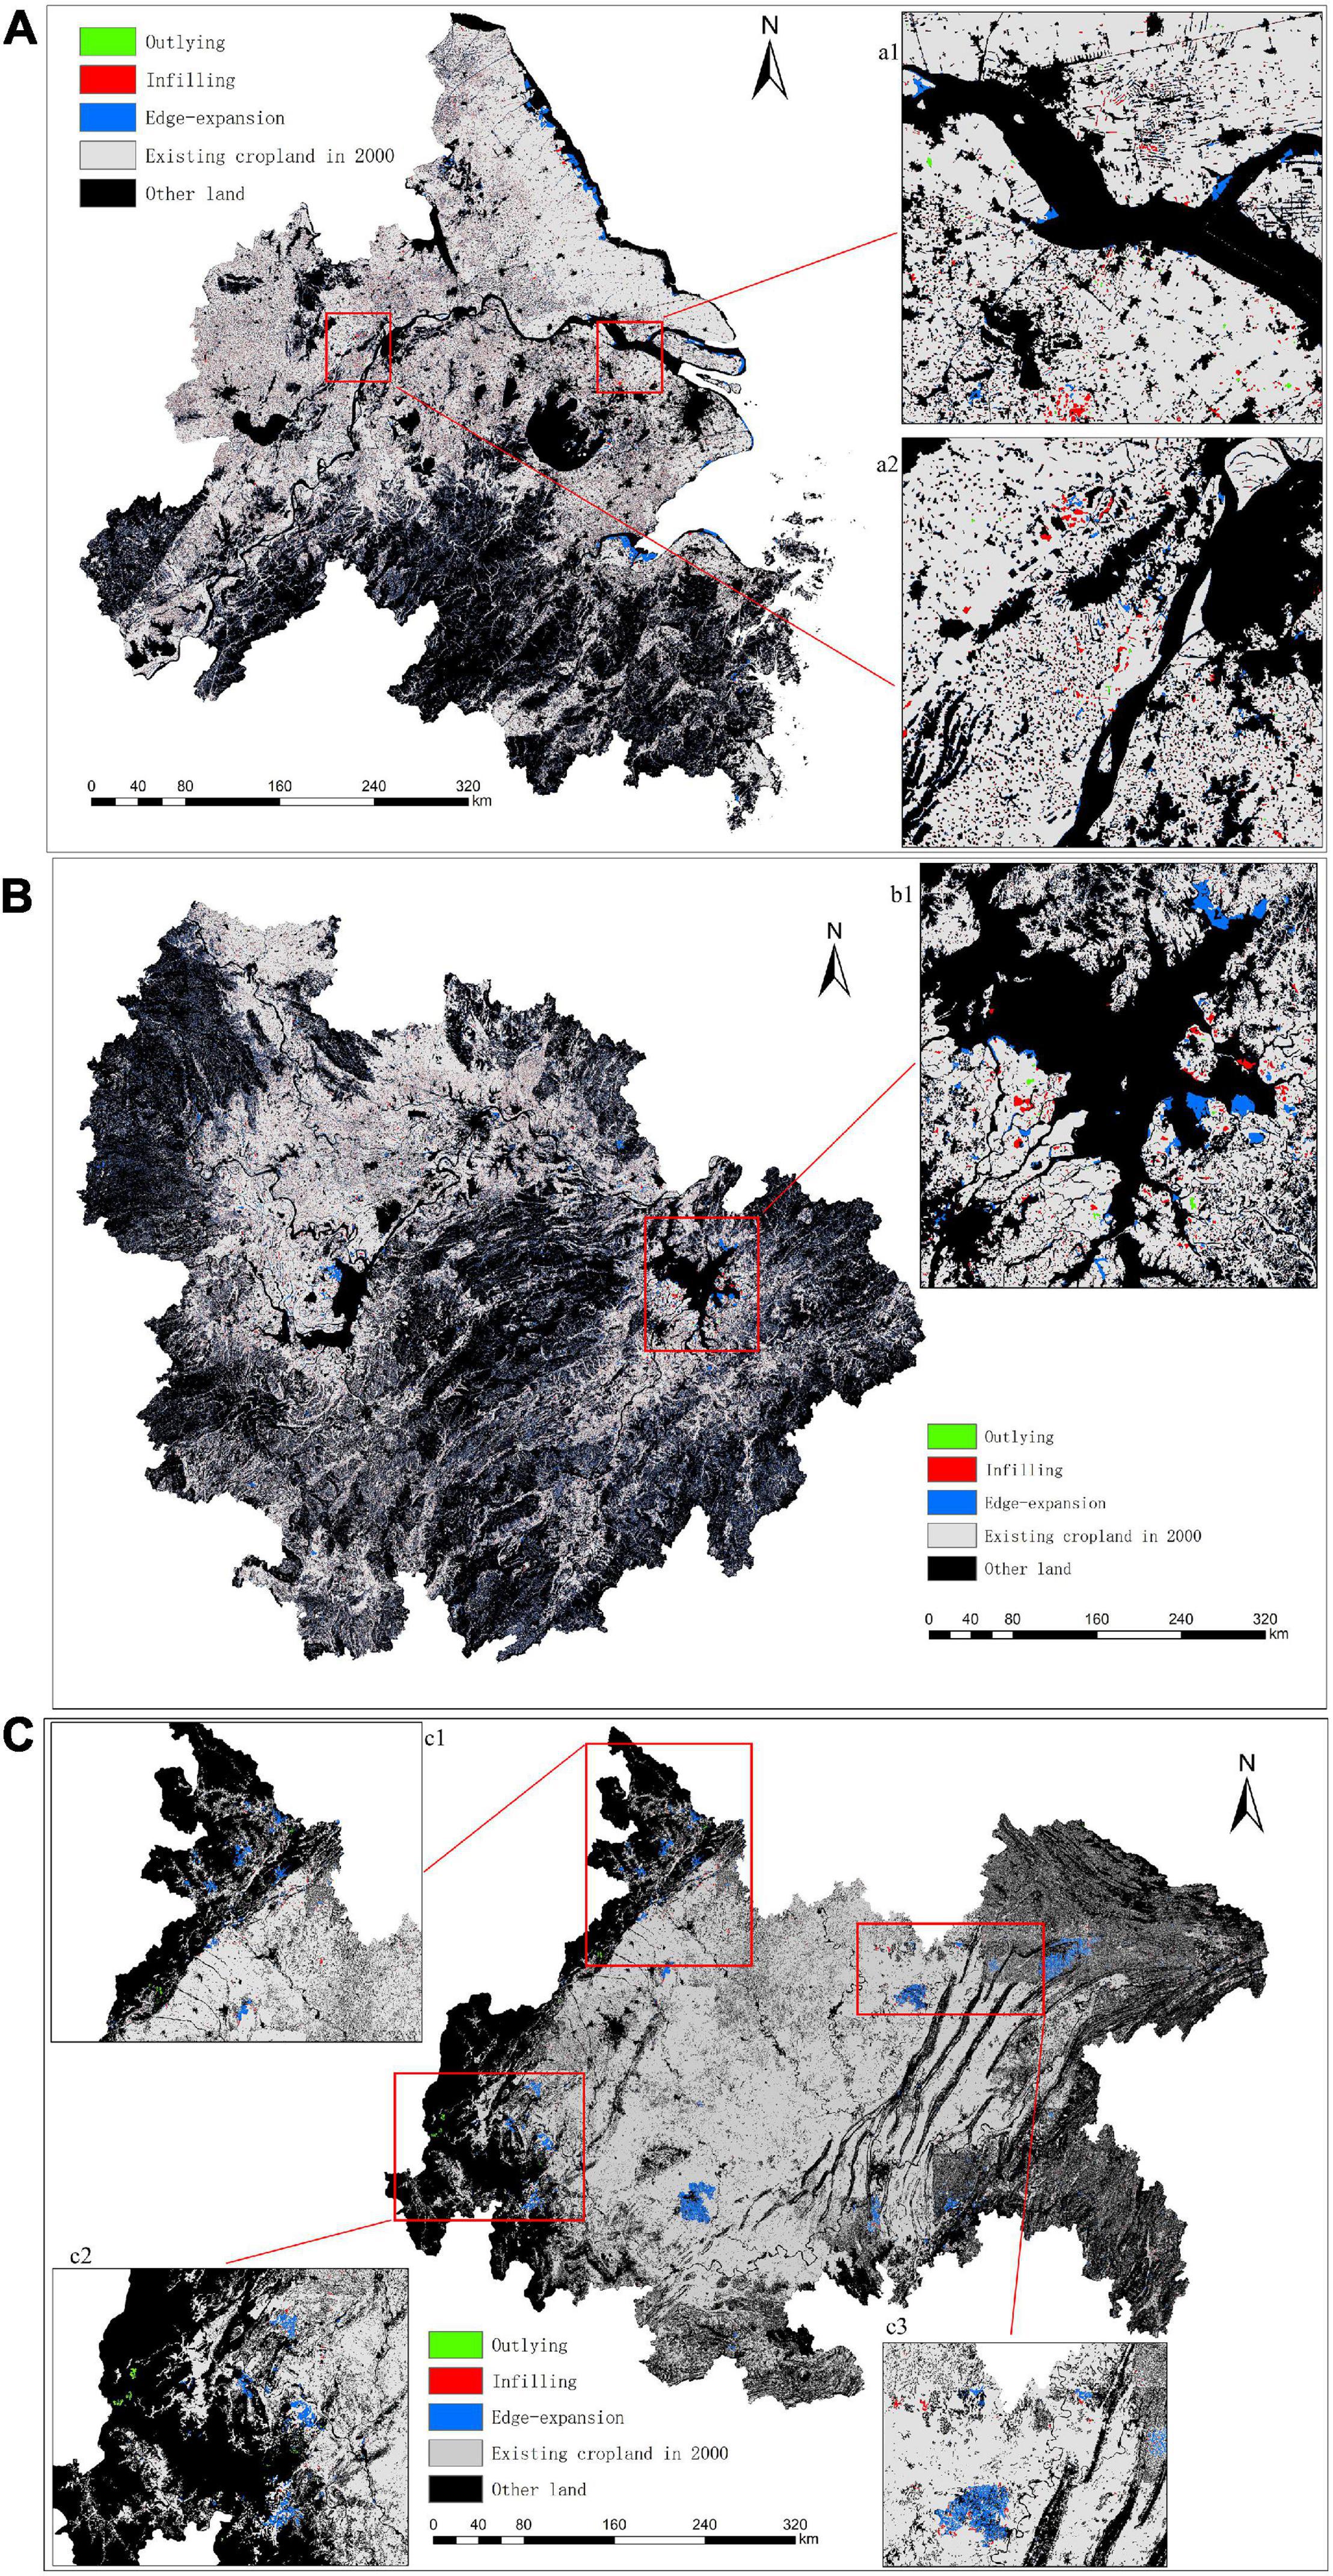
Figure 3. Spatial distributions of different types of cropland expansion trajectories from 2000 to 2015 in (A) YRDUA, (B) MRYRUA, and (C) C&YUA.
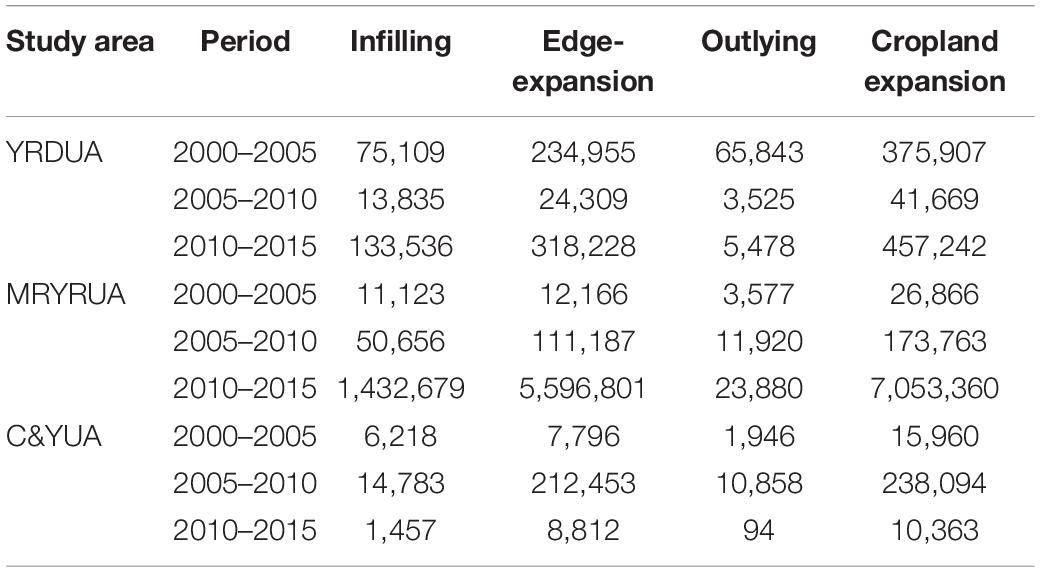
Table 1. Areas of different cropland expansion trajectories in 2000–2015 in YRDUA, MRYRUA, and C&YUA (ha).
The area of expanded cropland in different time intervals in each urban agglomeration varies with no rules to follow, while the area of cropland trajectories displays in a decreasing sequence of the edge-expansion, infilling, and outlying trajectories in each period (Table 1). From 2000 to 2005, YRDUA experienced the most cropland expansion, at 375,907 ha. Specifically, the areas of edge-expansion, infilling, and outlying trajectories are 234,955, 75,109, and 65,843 ha. In 2005–2010, the most active cropland expansion activity occurred in C&YUA, with 212,453, 14,783, and 10,858 ha of edge-expansion, infilling, and outlying trajectories. From 2010 to 2015, 7,053,360 ha of new expanded cropland occurred in MRYRUA, which is also the largest area of expanded cropland among all time intervals and regions. The detailed numbers are 5,596,801, 1,432,679, and 23,880 ha of edge-expansion, infilling, and outlying trajectories, respectively.
Figure 3 indicates the spatial distribution of different cropland expansion trajectories varies differently among urban agglomerations. As shown in Figure 3A, the infilling and edge-expansion trajectories exist throughout the study area in a scattered or aggregated status, while the outlying trajectory is minimally distributed, which can be detected in a few areas, such as in the middle (Figure 3A2) and eastern (Figure 3A1) of YRDUA. Some cropland in the edge-expansion trajectory were distributed in an aggregated status. This cropland is mainly clustered in the east, close to the eastern boundary of the existing cropland in 2000, and displayed in a belt distribution. In addition, a few cropland in the infilling trajectory also shows a centralized pattern, which is also shown in Figures 3A1,A2.
Figure 3B denotes the distribution of cropland expansion trajectories in MRYRUA. The distribution of the part that the infilling and edge-expansion trajectories are scattered located is similar to that in YRDUA, in which their existence is shown around the existing cropland. This figure shows that the distribution of the parts concentrated in three cropland trajectories is aggregated around lakes. For example, lakes in the middle, north, and east are concentrated with an edge-expansion trajectory. In particular, the lake in the east (Figure 3B1) is surrounded by existing cropland in 2000 and expanded cropland in all trajectories.
Unlike the distributions of cropland expansion trajectories in YRDUA and MRYRUA, cropland expansion trajectories are displayed at a concentrated status in C&YUA (Figure 3C). Obviously, the edge-expansion trajectory shows the most concentrated status and largest distribution. The infilling trajectory mostly surrounds near the edge-expansion trajectory (Figures 3C2,C3) and a few of them are located in the north and northwest independently (Figures 3C1,3). In the west and northwest, a few of the outlying trajectories can be observed (Figures 3C1,C2).
A significant difference in topographic relief amplitude exists in YRDUA, MRYRUA, and C&YUA at 1,571, 1,898, and 2,746 m, respectively, because they are located in the upper, middle, and lower reaches of the Yangtze River. Moreover, the variation range of the topographic relief amplitude of cropland expansion trajectories changes vastly over time and region.
In YRDUA, the infilling, edge-expansion, and outlying trajectory cumulative frequencies are up to at least 80% when the topographic reliefs are 91, 227, and 387 m in 2000–2005 (Figure 4). As time goes on, the topographic reliefs of the infilling and edge-expansion trajectories decrease to 25 and 168 m, respectively, while that of the outlying trajectory increases to 424 m in 2010–2015. From Figure 4, the distribution of the infilling and outlying trajectories is more concentrated with lower topographic relief amplitude, while the distribution of the outlying trajectory shows considerable dispersal.
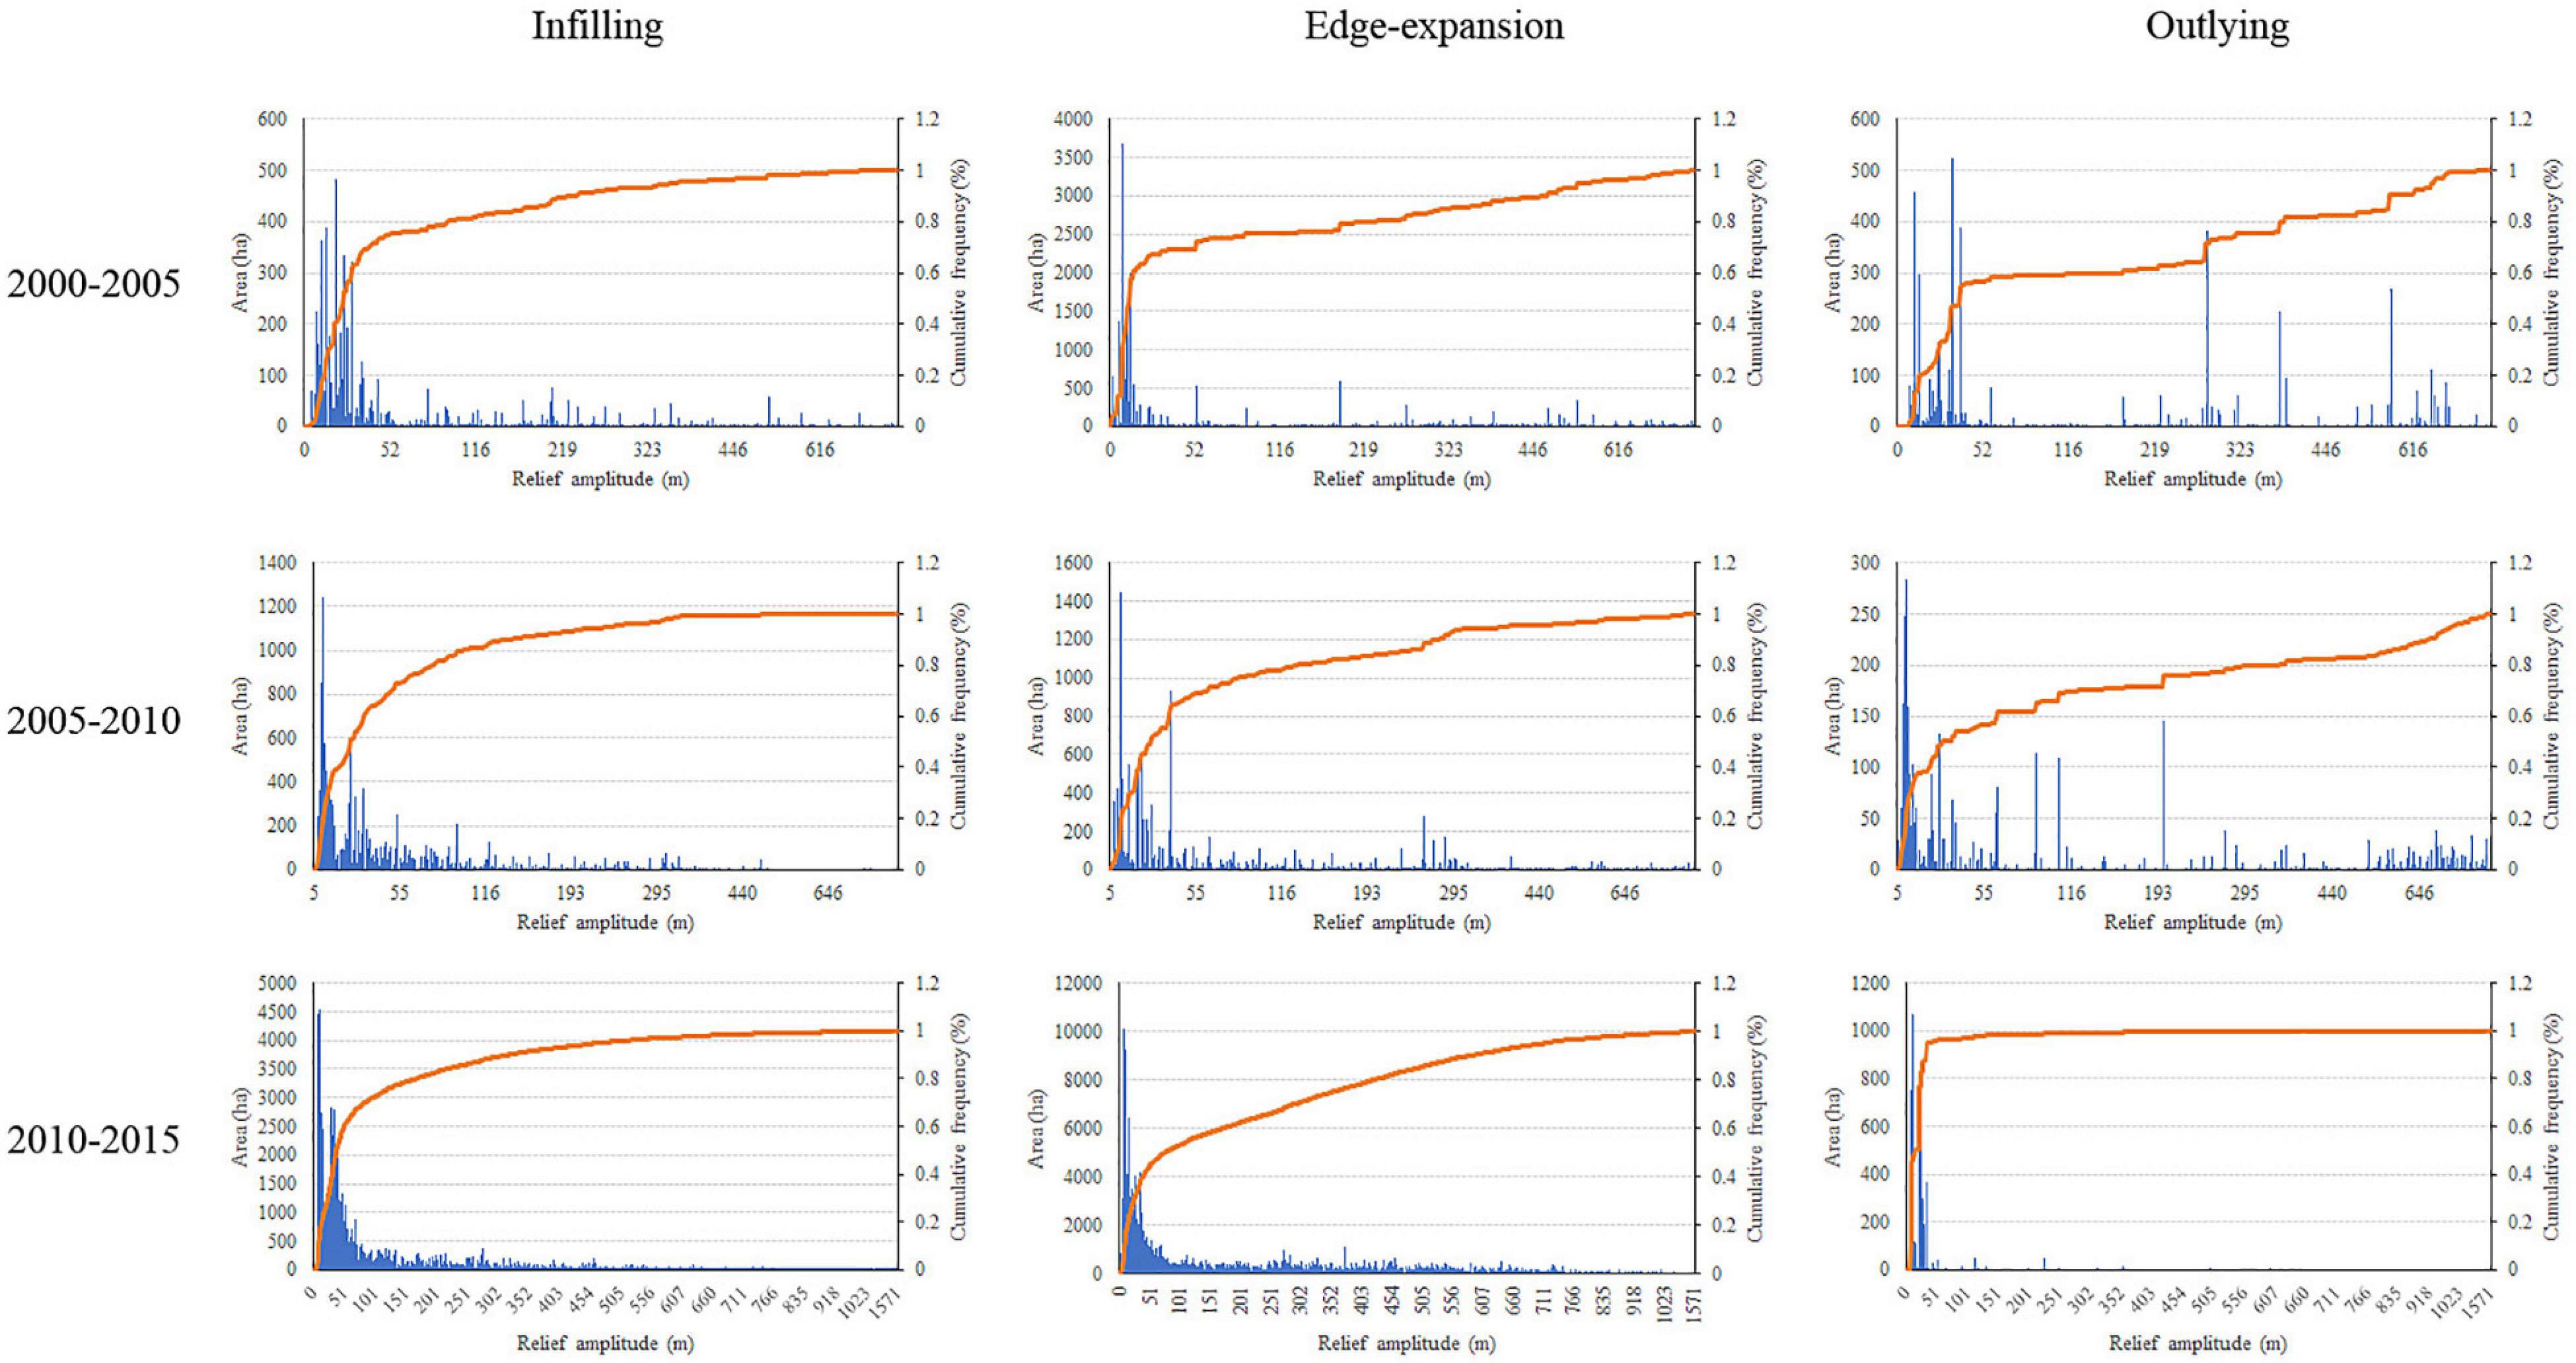
Figure 4. Topographic relief effect in cropland expansion trajectories in YRDUA from 2000 to 2015.
In MRYRUA, the topographic relief amplitude of trajectories’ cumulative frequency that reaches 80% shows an overall increase because of an increase in the topographic relief compared with that in YRDUA (Figure 5). Infilling and edge-expansion trajectories in 2010–2015 have the largest areas of cropland and display the most concentrated distribution, in which the topographic relief amplitudes are 320 and 491 m, respectively, when the cumulative frequency is up to over 80%. For the outlying trajectory, at least 80% is distributed under the topographic relief amplitude of 781 m in 2005–2010, which is the highest distribution among those in the three-time intervals.
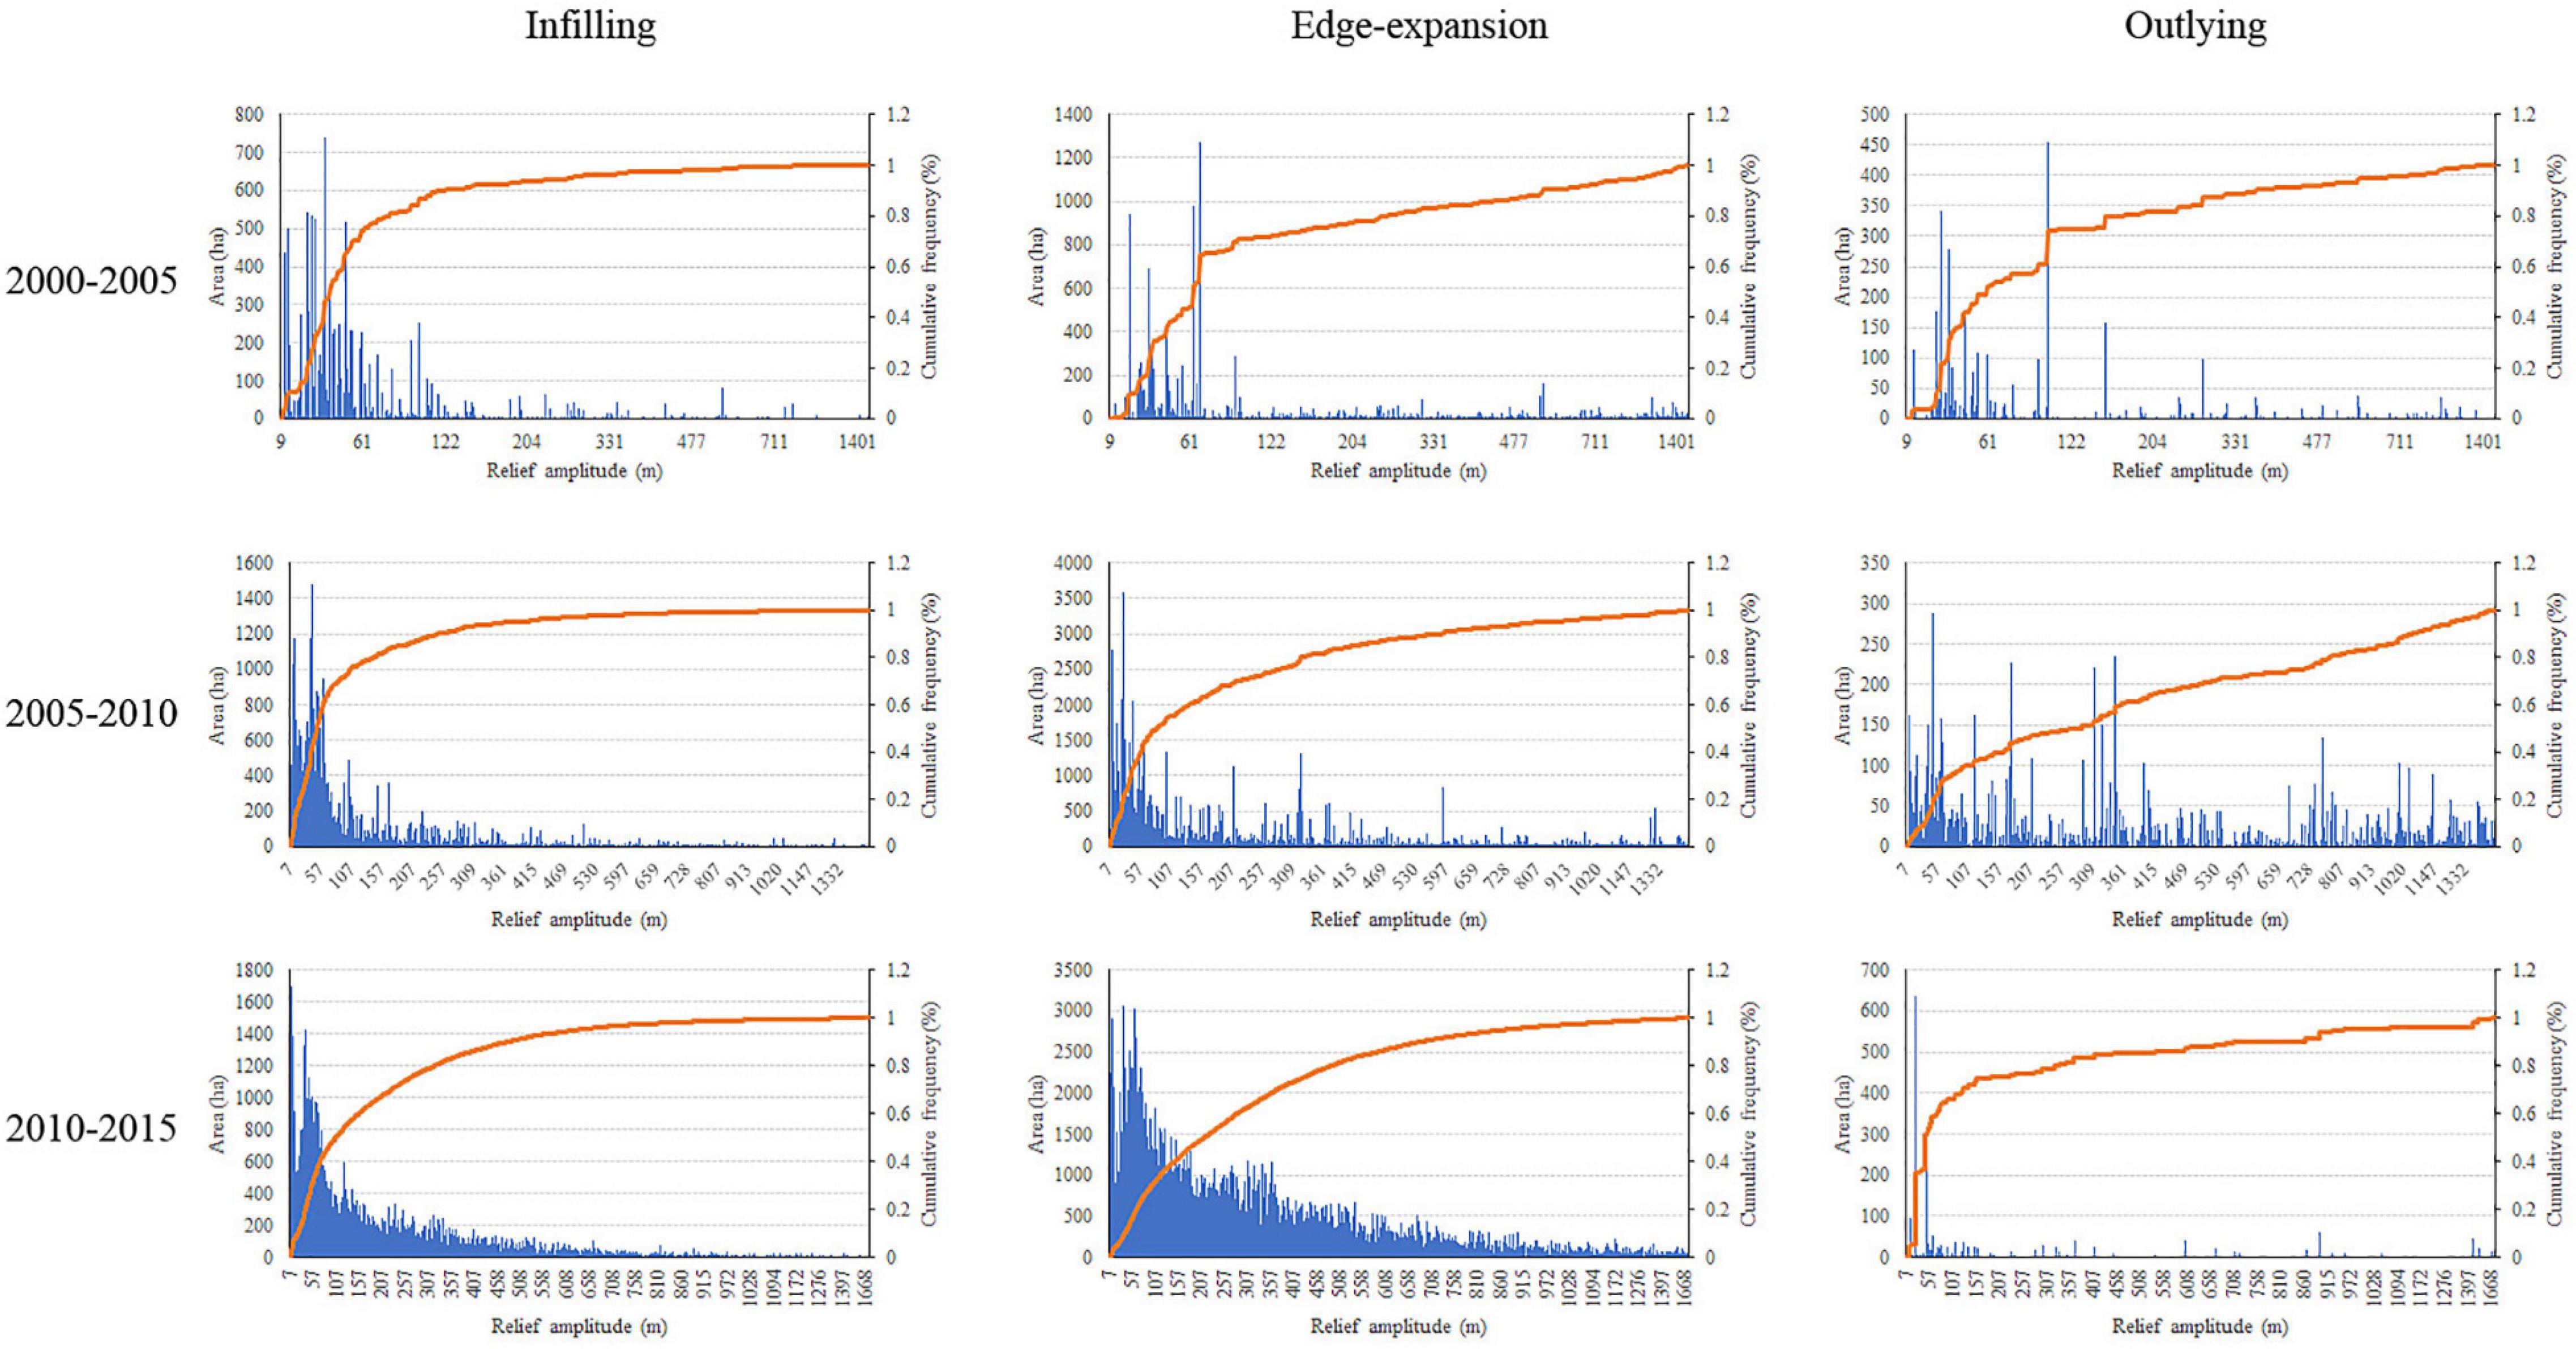
Figure 5. Topographic relief effect in cropland expansion trajectories in MRYRUA from 2000 to 2015.
As the region with the highest degree of topographic relief amplitude, the distribution of different cropland expansion trajectories is located in a relatively higher topographic relief amplitude and is more dispersed (Figure 6). Different from those in YRDUA and MRYRUA, some of the cumulative frequency curves of cropland expansion trajectories show a slight increase initially and a rapidly increasing pattern thereafter, such as the infilling, edge-expansion, and outlying trajectories in 2000–2005, and the outlying trajectory in 2005–2010. Meanwhile, the curves in 2010–2015 show a step-up trend. From 2010 to 2015, the cumulative frequency of the infilling, edge-expansion, and outlying trajectories is up to at least 80% at the topographic relief values of 522, 296, and 608 m, which is the lowest among the three-time intervals. These figures change to 933, 1,088, and 1,027 m, respectively, which are the highest among regions and periods.
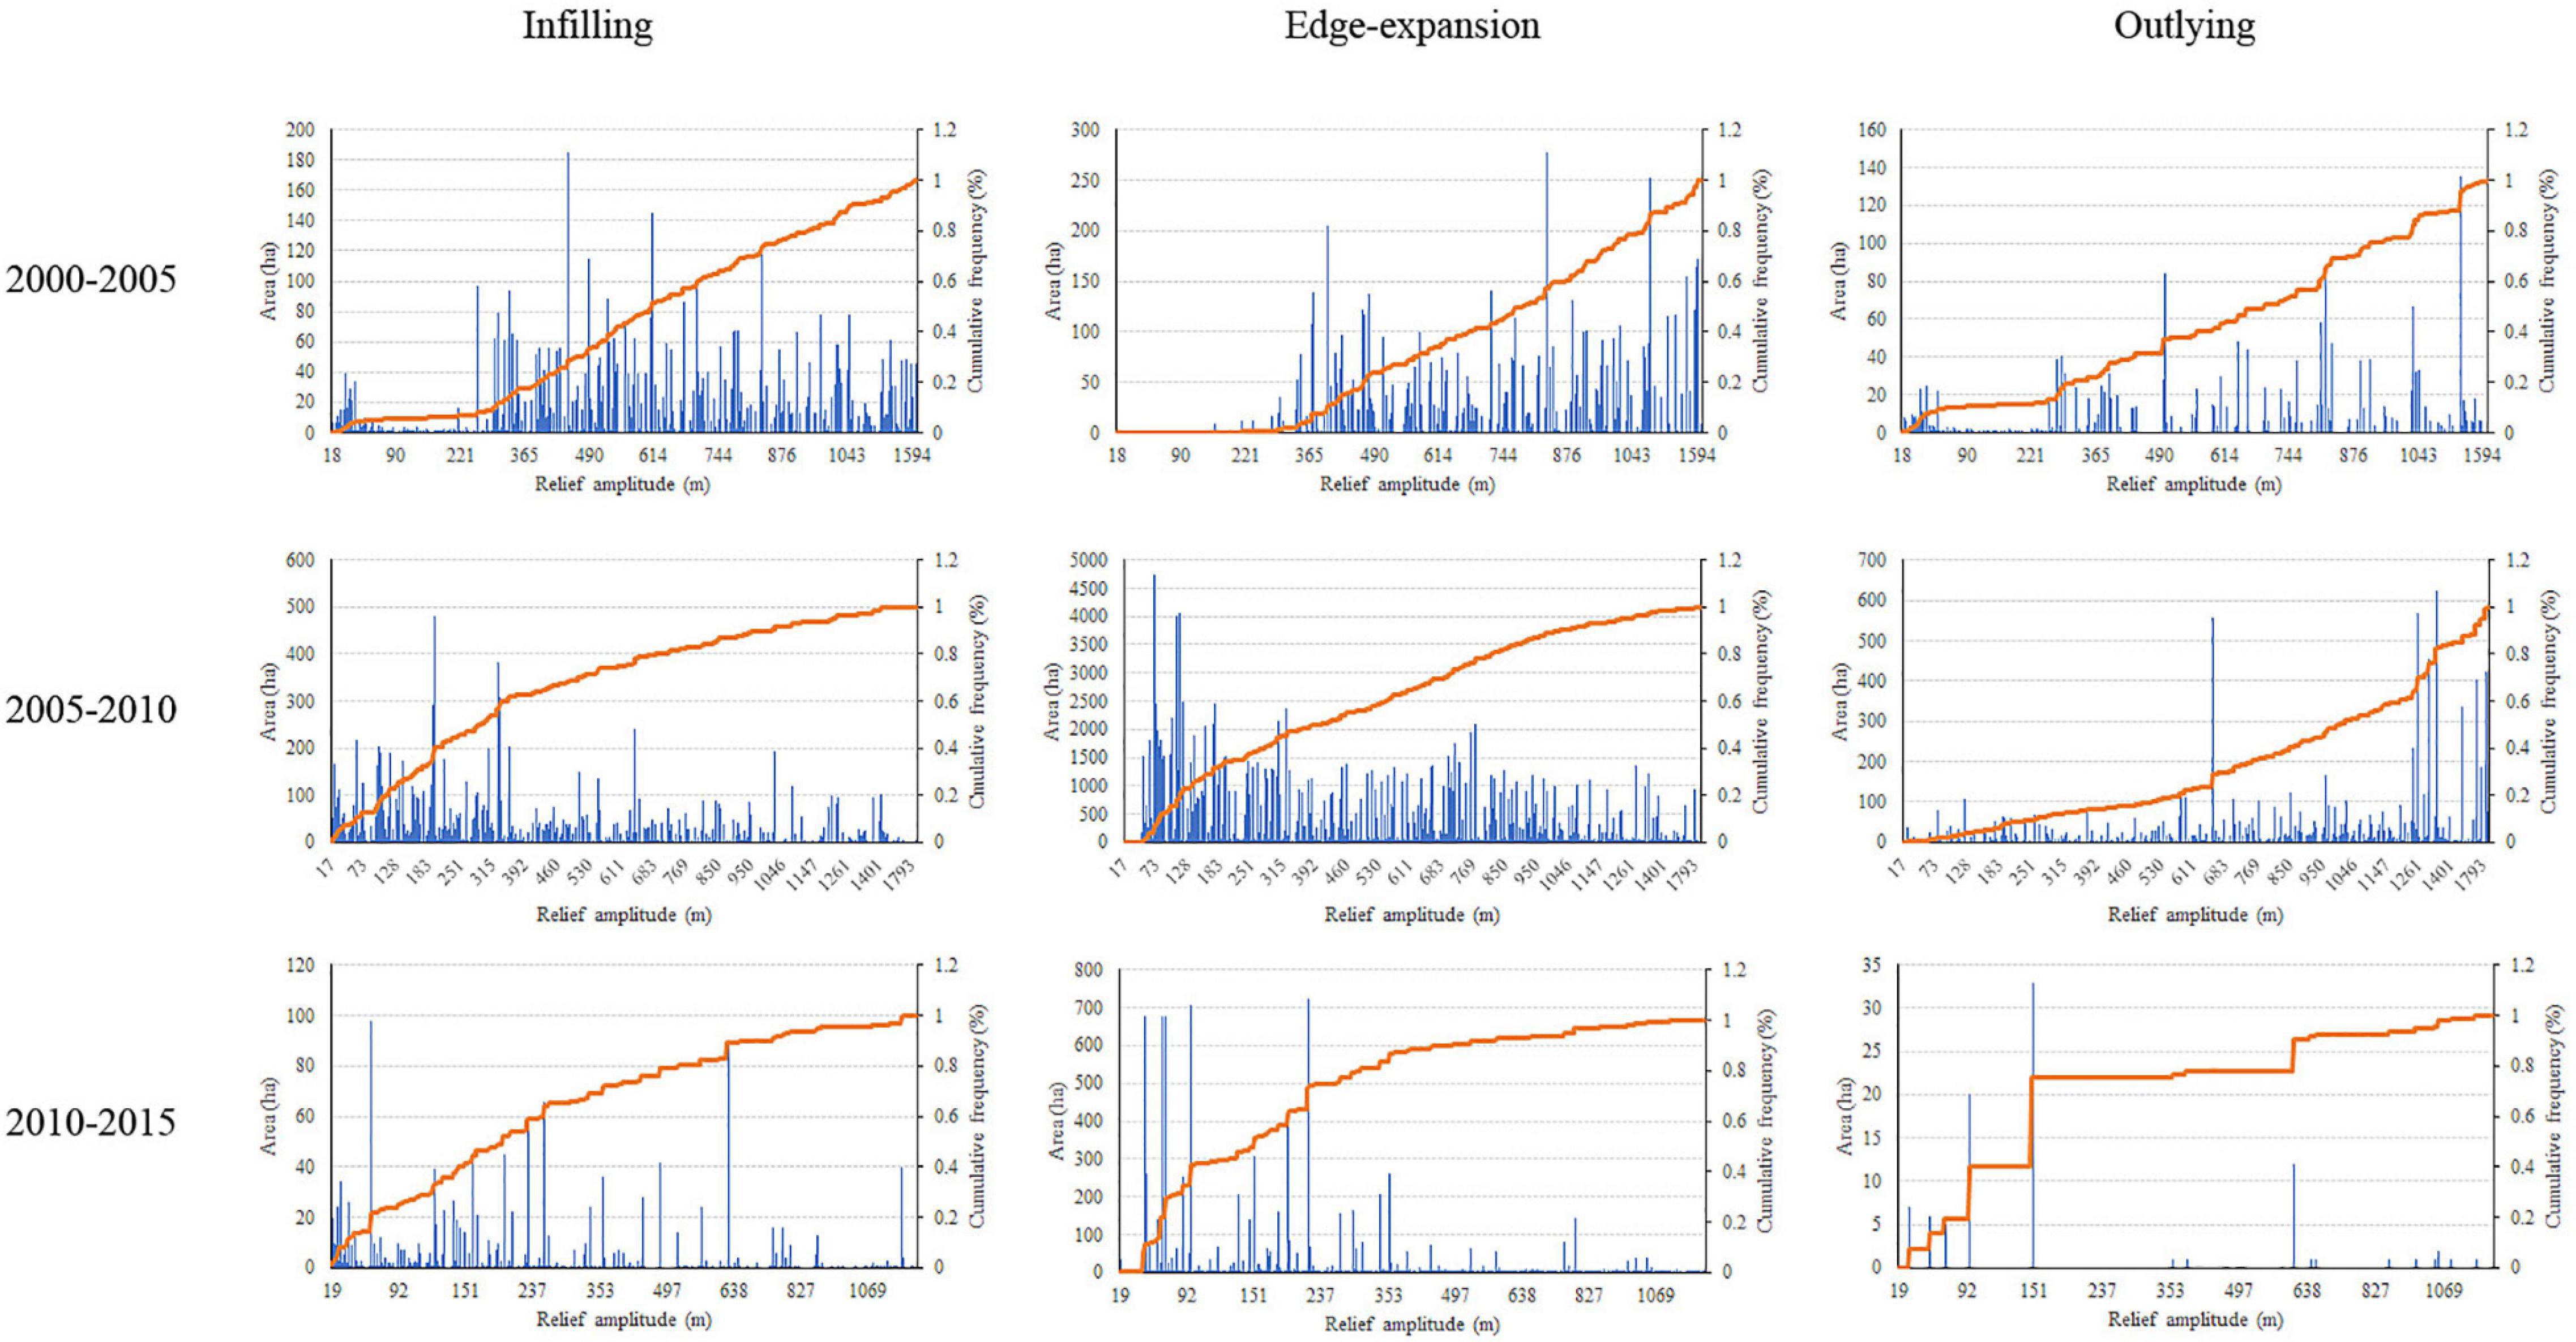
Figure 6. Topographic relief effect in cropland expansion trajectories in C&YUA from 2000 to 2015.
The distribution of the accumulative frequency under different topographic relief amplitude shows the following trend: (1) Compared with that of the outlying trajectory, infilling and edge-expansion trajectories are distributed at lower topographic relief amplitude levels no matter in what DEM level. (2) As the time goes by, the distribution of different trajectories is more likely to occur in a lower topographic relief amplitude level, indicating a more scientific method of cropland expansion.
Several steps have been taken to better understand the impact of different cropland expansion trajectories on cropland metrics. Several steps have been done: (1) Identify the no changed cropland (marked as NC) during the study period and calculate its landscape metrics; (2) distinguish the infilling, edge-expansion, and outlying trajectories; (3) overlie the no changed cropland and infilling trajectory (marked as infilling) and calculate its landscape metrics; (4) overlie the result of step 3 with the edge-expansion trajectory (marked as edge-expansion) and assess its landscape metrics; (5) the same calculation method is applied to the outlying trajectory (marked as outlying); and (6) a line chart is used to show the results (Figure 7).
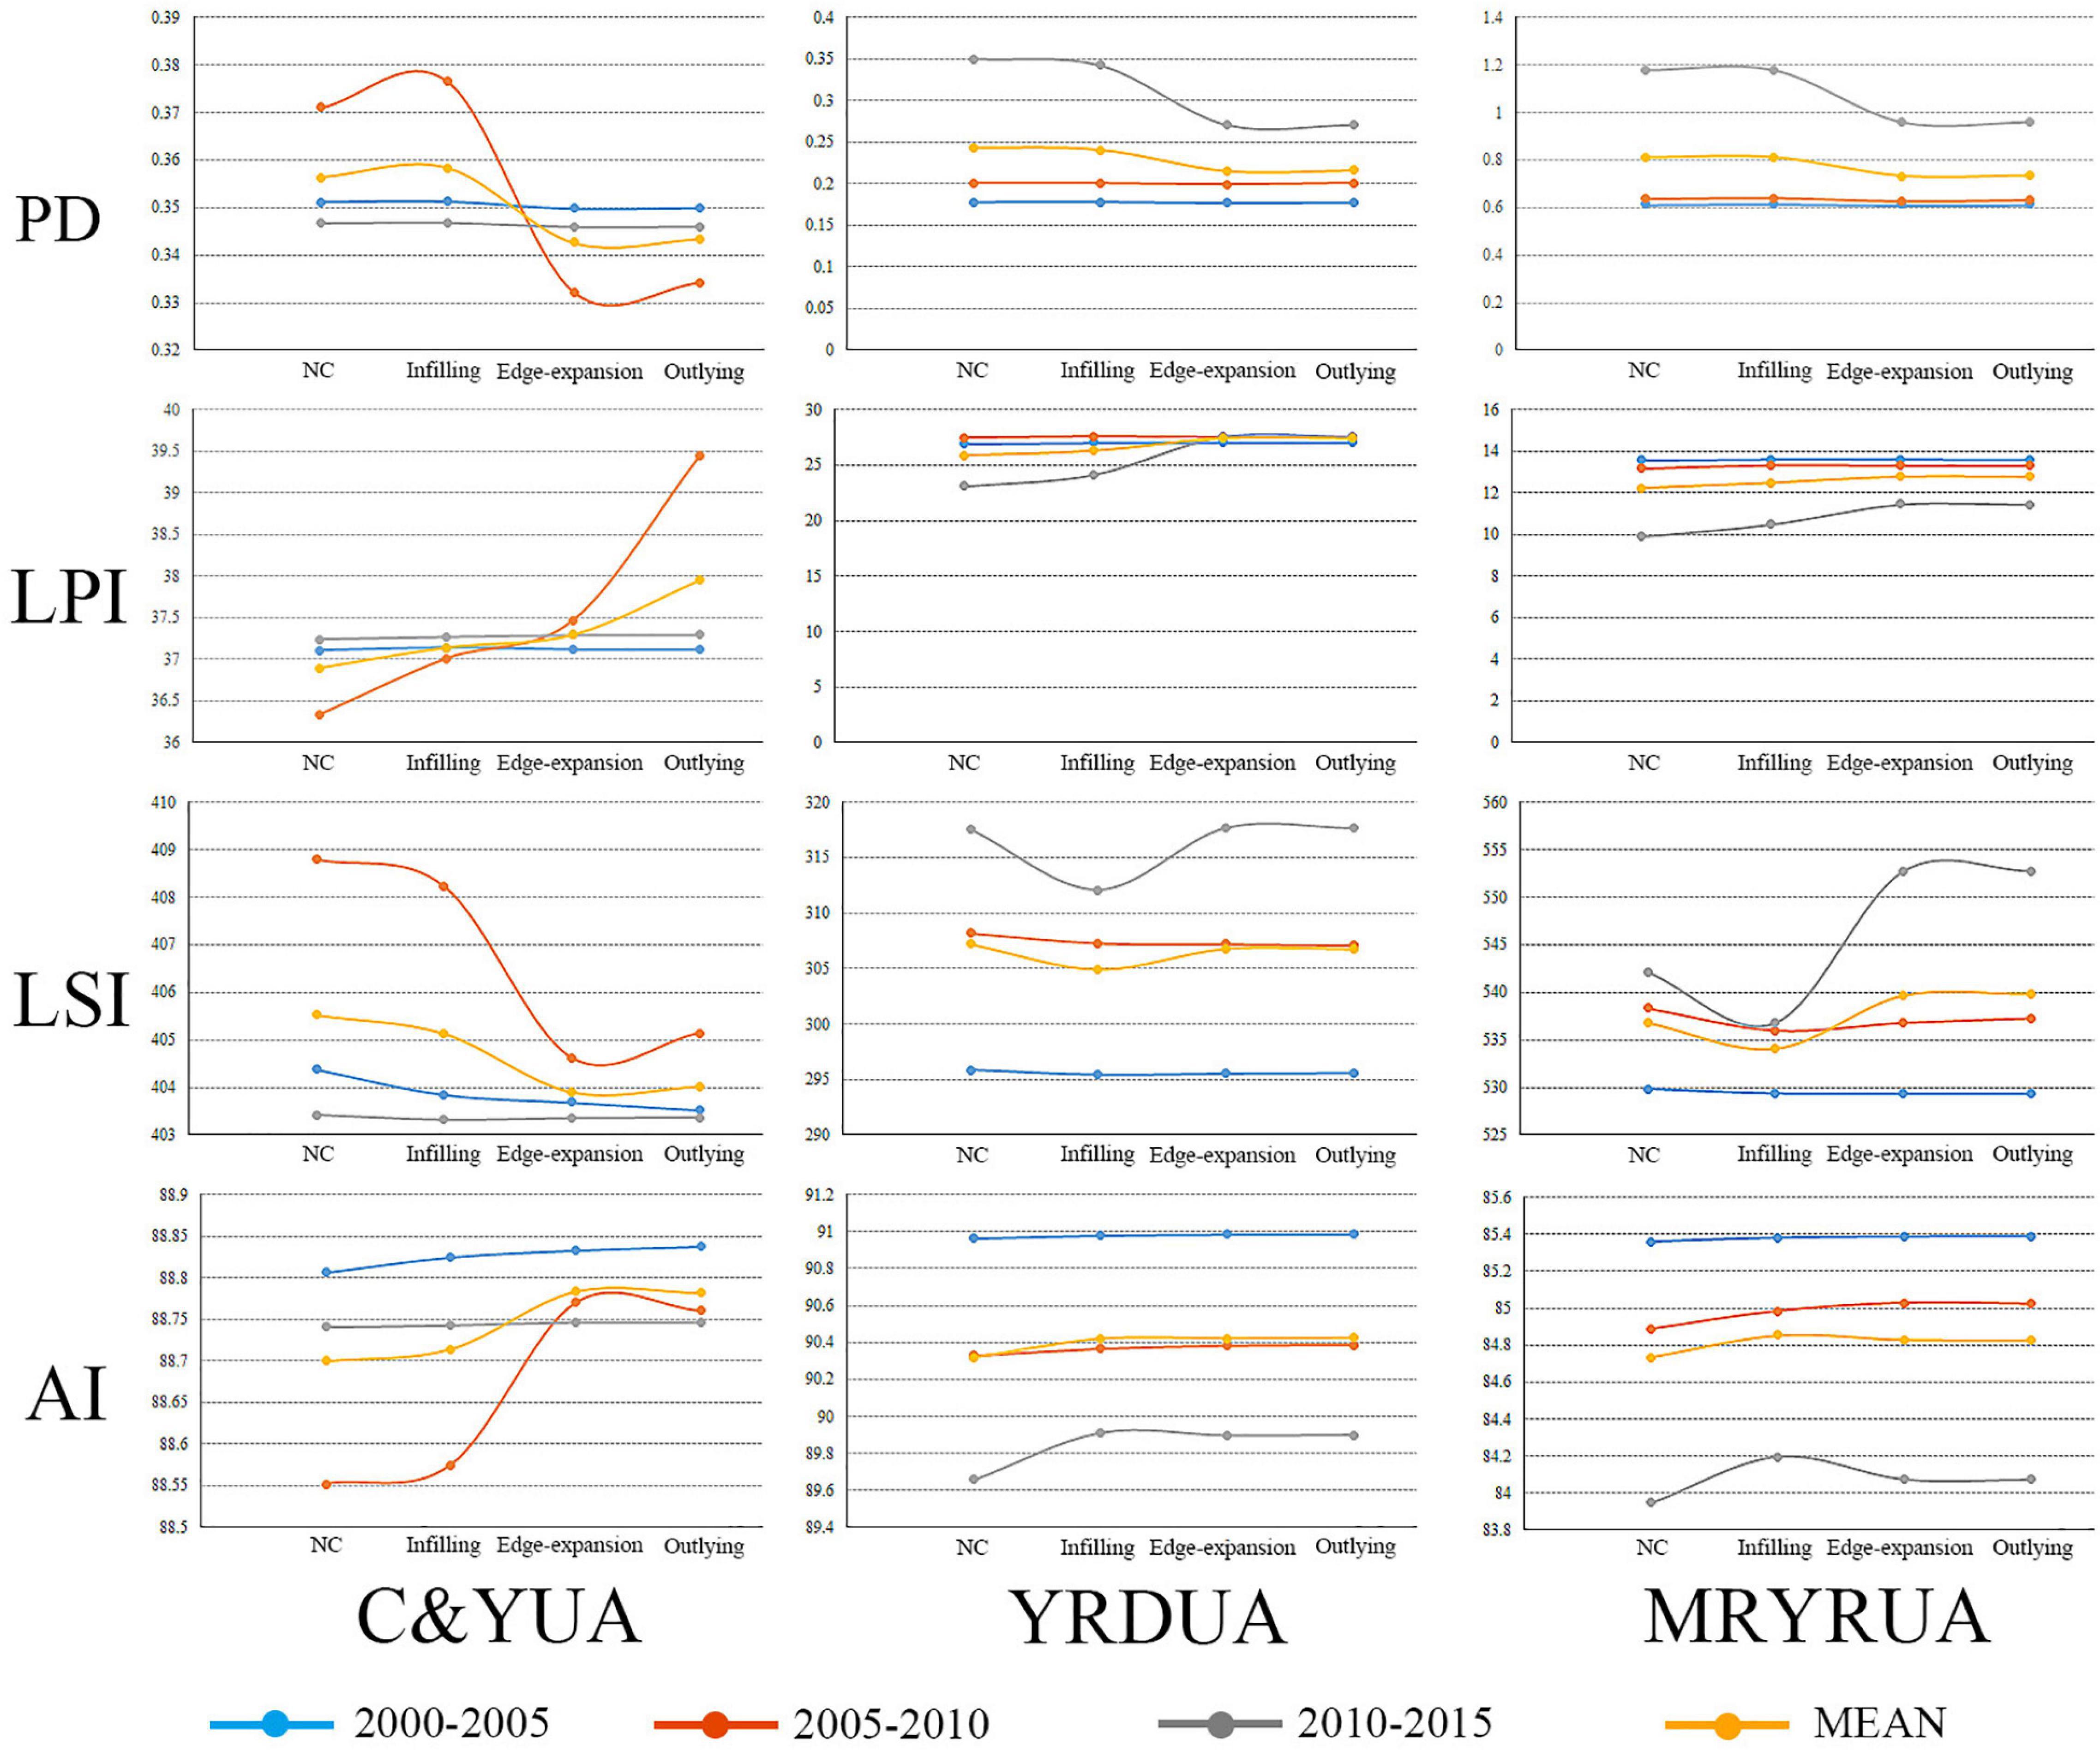
Figure 7. Cropland metrics change in YRDUA, MRYRUA, and C&YUA from 2000 to 2015. NC represents the no changed cropland during the research period. Infilling includes the no change and infilling cropland. Edge-expansion consists of the cropland with no change, infilling, and edge-expansion. Outlying represents the cropland with no change, infilling, edge-expansion, and outlying.
As shown in Figure 7, the scores of PD, LPI, LSI, and AI change across times and regions. Although some of the landscape metrics have formed their own unique trend, the overall changes of landscape metrics show the following rules on the basis of the NC landscape metrics: (1) PD exhibits a continuously decreasing trend in the infilling and edge-expansion, while increasing in the outlying. (2) LPI and AI show a continuous increase in infilling and edge-expansion and a slight decrease in outlying. (3) LSI shows a pattern of decrease in infilling and increase in edge-expansion and outlying.
Moreover, we used Spearman correlation analysis and identified the correlation of landscape metric between the total new expanded cropland and different cropland expansion trajectories (Figure 8A) and their significant degree (Figure 8B). A significant positive correlation exists between the infilling and edge-expansion trajectories and total expanded cropland. Except for the LPI of the infilling trajectory and total expanded cropland, all the correlation coefficients range from 0.955 to 0.999 and are significant at the 0.01 level. The largest correlation coefficient is displayed in LSI between the edge-expansion trajectory and total expanded cropland, with a value of 0.999. The correlation coefficients in all landscape metrics between the outlying trajectory and total expanded cropland are both negative, with a score ranging from -0.539 to -0.337. They reflect the negative correlation between the outlying trajectory and landscape metrics.
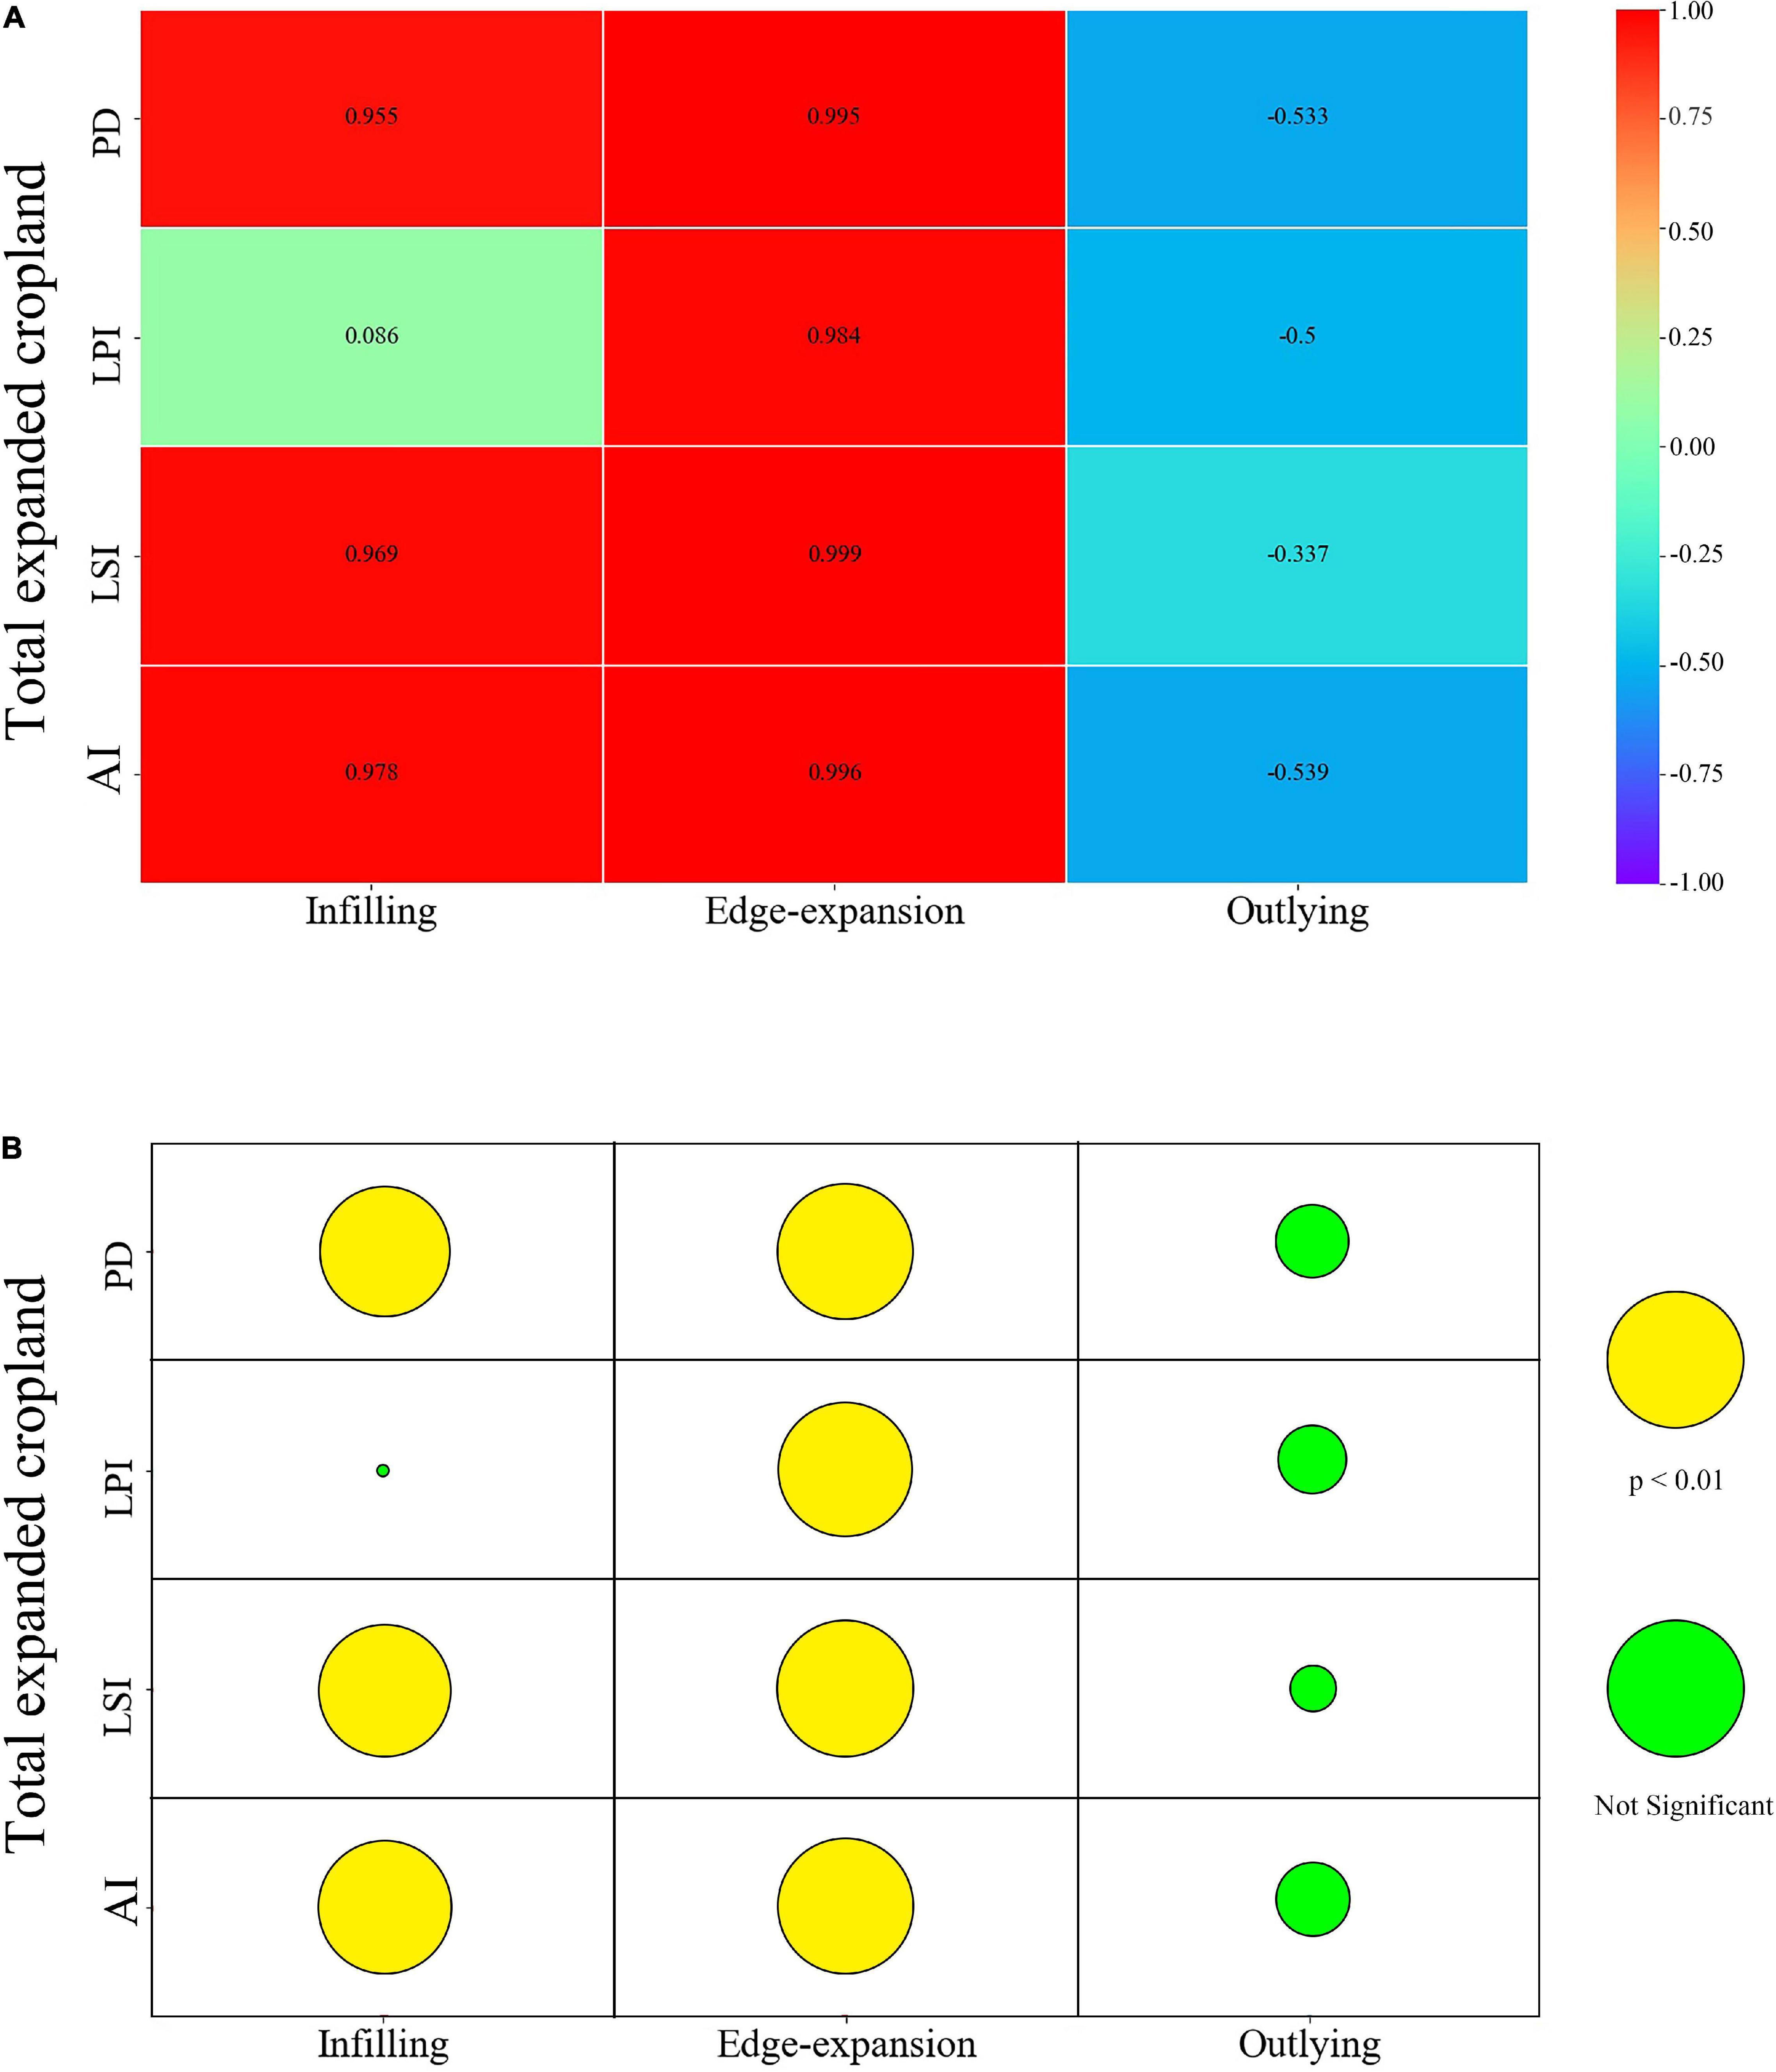
Figure 8. Correlation coefficients of landscape metrics between the total expanded cropland and cropland trajectories (A) and significant degrees (B). The size of circles represents the size of correlation coefficients.
Cropland expansion has become a popular issue for researchers. Existing research has studied the substantial sequences from various perspectives, such as natural habitat loss (van Vliet, 2019; Tang et al., 2021), deforestation (Ngoma et al., 2021), and changes in land productivity (Li et al., 2018; Yang et al., 2020). This study defines the three main cropland expansion trajectories, namely, infilling, edge-expansion, and outlying trajectories; and identifies their spatiotemporal distribution and their consequences on cropland fragmentation. The results show that cropland expansion will lead to an increase in cropland fragmentation, which is consistent with previous research (Brabec and Smith, 2002; Yu et al., 2018). Furthermore, we provided a nuanced analysis of the impact of different cropland expansion trajectories on cropland fragmentation through a step-by-step calculation of the fragmentation metrics of the expanded cropland in different cropland trajectories. We found that the increase in cropland fragmentation resulting from cropland expansion was mainly caused by the outlying trajectory, while infilling and edge-expansion trajectories in fact caused a decrease in fragmentation. The Spearman correlation analysis results showed a significantly positive correlation relationship between the infilling and edge-expansion trajectories and cropland fragmentation. Meanwhile, a negative correlation relationship was presented between the outlying trajectory and cropland fragmentation.
The LEI has been widely used to quantify the modes of urban expansion, which identifies that edge-expansion is the dominating mode followed by the infilling and outlying modes (Liu X. et al., 2014; Jiao et al., 2015; Rao et al., 2021). Our study demonstrated similar results for cropland expansion trajectories with urban expansion modes: edge-expansion trajectory is primary over research areas and periods, and the decreasing sequence of cropland expansion trajectories is infilling trajectory and outlying trajectory. This result can be attributed to the following reasons: (1) The expansion of cropland is mainly from two aspects, namely, farmers’ spontaneous agricultural activities and requests of administrative policies (Lin and Ho, 2003; Tang et al., 2020a). (2) Despite spontaneous agricultural activities and requests of administrative policies prefer the land near or next to the existing cropland to develop new cropland, only where there is insufficient suitable land for cropland reclamation can reserve land resources be used to reclaim cropland to meet policy requirements (Song and Pijanowski, 2013; Xin and Li, 2018). Thus, edge-expansion and infilling trajectories are the two main forms of cropland expansion. In addition, our study demonstrated that the cropland expansion activities in China have become increasingly scientific in recent years: The proportion of edge-expansion trajectory continues to increase (62.50, 45.28, and 48.85% in 2000–2005 and 69.60, 79.35, and 85.03% in 2010–2015 in YRDUA, MRYRUA, and C&YUA, respectively), while that of outlying trajectory continuously decreases (17.52, 13.31, and 12.19% in 2000–2005 and 1.20, 0.34, and 0.91% in 2010–2015 in YRDUA, MRYRUA, and C&YUA, respectively).
Cropland fragmentation is an environment- and dimension-dependent issue. Different types of fragmentation are defined by different research foci. For example, physical fragmentation focuses on the connectivity and contiguity of cropland patches, while the main point of ownership fragmentation is the spatial connectivity of cropland owned by one owner (Su et al., 2014). Therefore, numerous methods measure different types of fragmentation. Based on remote sensing data, landscape metrics are the most used indexes to measure physical fragmentation, such as path density, edge density, mean patch size, and patch cohesion index (Li et al., 2013; He S. et al., 2020). Ownership fragmentation is considerably complex because it is highly connected with socioeconomic activities. Consequently, it is frequently measured based on cadastral survey and questionnaire investigation data (Tan et al., 2006; Rahman and Rahman, 2009; Deininger et al., 2012). In this study, we measured the cropland physical fragmentation in three urban agglomerations with landscape metrics, including PD, LSI, LPI, and AI, because of the convenience and reliability of this method in measuring landscape patterns at a large scale. The application of this method provides a convenient pathway to explore interactions between the environment and human-related activities in the following ways: (1) Quantitative measurement of changes in the environment coupled with human activities will provide a feedback on the impact of human actions on the environment, thereby correcting the wrong behaviors of humans; (2) defining the threshold of environmental changes, which can be used to promote the development of environmental protection policies.
Also, there are some limitations to this study. First, we only identified the topographic relief effect of the distribution of cropland expansion trajectories. While this method can only express a phenomenon that the edge-expansion and infilling trajectory are located at low topographic relief amplitude areas and the outlying trajectory is distributed at a higher level. However, the distribution of different cropland expansion trajectories is affected by multiple drivers, such as temperature, DEM, slope, and other socioeconomic factors (Ma et al., 2019; He Y. et al., 2020). Future studies should explore the driving forces behind the distribution of cropland expansion trajectories by integrating geographical and socioeconomic factors with the help of profound mechanism models. Secondly, we chose three urban agglomerations in YREB as our research area, while these regions are on a similar latitude. A larger-scale analysis should be conducted, such as on a national scale or through comparative analyses of cropland expansion trajectories in different latitudes. Lastly, LEI can only assess the cropland expansion trajectory in a period, while it cannot capture the information of multi-temporal landscape data for continuous landscape expansion (Jiao et al., 2015). Thus, future research can explore the multi-order landscape expansion index to capture information about the continuous cropland expansion.
This study focused on different cropland expansion trajectories and their impact on cropland fragmentation. To achieve this goal, we first quantified the spatiotemporal patterns of different cropland expansion trajectories with the surface relief amplitude model. Thereafter, we identified the impact of different cropland expansion trajectories on cropland fragmentation. The results indicate that the edge-expansion trajectory is primary for cropland expansion, followed by infilling and outlying trajectories and the proportion of the outlying trajectory is continuously decreasing. Additionally, the topographic relief amplitude analysis shows that the edge-expansion and infilling trajectory are distributed at a lower topographic relief amplitude than the outlying trajectory which is located at a high topographic relief amplitude region. Along with cropland expansion, cropland fragmentation presents an increasing trend. Specifically, edge-expansion and infilling trajectories have a significantly positive relationship with cropland fragmentation, while the outlying trajectory has a negative effect on cropland fragmentation. This study highlights the need to regulate the trajectory of cropland expansion from the point of protecting cropland fragmentation, rather than only requesting the area of cropland.
Publicly available datasets were analyzed in this study. This data can be found here: https://www.resdc.cn/data.aspx? DATAID=184.
LW: original draft preparation, methodology, and visualization. SZ: editing and conceptualization. YX: visualization and software. YfL: reviewing, editing, and methodology. YlL: editing and supervision. All authors contributed to the article and approved the submitted version.
This work was supported by the Key National Research and Development Project of China (Grant No. 2017YFB0503601).
The authors declare that the research was conducted in the absence of any commercial or financial relationships that could be construed as a potential conflict of interest.
All claims expressed in this article are solely those of the authors and do not necessarily represent those of their affiliated organizations, or those of the publisher, the editors and the reviewers. Any product that may be evaluated in this article, or claim that may be made by its manufacturer, is not guaranteed or endorsed by the publisher.
Brabec, E., and Smith, C. (2002). Agricultural land fragmentation: the spatial effects of three land protection strategies in the eastern United States. Landsc. Urban Plan. 58, 255–268. doi: 10.1016/S0169-2046(01)00225-0
Cabral, A. I. R., and Costa, F. L. (2017). Land cover changes and landscape pattern dynamics in Senegal and Guinea Bissau borderland. Appl. Geogr. 82, 115–128. doi: 10.1016/j.apgeog.2017.03.010
Cheng, C., Liu, Y., Liu, Y., Yang, R., Hong, Y., Lu, Y., et al. (2020). Cropland use sustainability in Cheng–Yu Urban agglomeration, China: evaluation framework, driving factors and development paths. J. Clean. Prod. 256:120692. doi: 10.1016/j.jclepro.2020.120692
Cheng, L., Xia, N., Jiang, P., Zhong, L., Pian, Y., Duan, Y., et al. (2015). Analysis of farmland fragmentation in China Modernization Demonstration Zone since “Reform and Openness”: a case study of South Jiangsu Province. Sci. Rep. 5:11797. doi: 10.1038/srep11797
Cheng, P., Tang, H., Dong, Y., Liu, K., Jiang, P., and Liu, Y. (2021). Knowledge mapping of research on land use change and food security: a visual analysis using citespace and vosviewer. Int. J. Environ. Res. Public Health 18:13065. doi: 10.3390/ijerph182413065
Deininger, K., Savastano, S., and Carletto, C. (2012). Land Fragmentation, Cropland Abandonment, and Land Market Operation in Albania. World Dev. 40, 2108–2122. doi: 10.1016/j.worlddev.2012.05.010
Dewan, A. M., Yamaguchi, Y., and Rahman, M. Z. (2012). Dynamics of land use/cover changes and the analysis of landscape fragmentation in Dhaka Metropolitan, Bangladesh. GeoJournal 77, 315–330. doi: 10.1007/s10708-010-9399-x
Dong, C., Yin, Q., Lane, K. J., Yan, Z., Shi, T., Liu, Y., et al. (2018). Competition and transmission evolution of global food trade: a case study of wheat. Phys. A Stat. Mech. Appl. 509, 998–1008. doi: 10.1016/j.physa.2018.06.052
Egli, L., Meyer, C., Scherber, C., Kreft, H., and Tscharntke, T. (2018). Winners and losers of national and global efforts to reconcile agricultural intensification and biodiversity conservation. Glob. Chang. Biol. 24, 2212–2228. doi: 10.1111/gcb.14076
Eigenbrod, F., Beckmann, M., Dunnett, S., Graham, L., Holland, R. A., Meyfroidt, P., et al. (2020). Identifying agricultural frontiers for modfeling global cropland expansion. One Earth 3, 504–514. doi: 10.1016/j.oneear.2020.09.006
Ellman, T. (1997). Infill: the Cure for Sprawl? Arizona Issue Analysis, No. 146. Phoenix, AZ: The Goldwater Institute, 21.
Farley, K. A., Ojeda-Revah, L., Atkinson, E. E., and Eaton-González, B. R. (2012). Changes in land use, land tenure, and landscape fragmentation in the Tijuana River Watershed following reform of the ejido sector. Land Use Policy 29, 187–197. doi: 10.1016/j.landusepol.2011.06.006
Folberth, C., Khabarov, N., Balkovič, J., Skalský, R., Visconti, P., Ciais, P., et al. (2020). The global cropland-sparing potential of high-yield farming. Nat. Sustain. 3, 281–289. doi: 10.1038/s41893-020-0505-x
Foley, J. A., Ramankutty, N., Brauman, K. A., Cassidy, E. S., Gerber, J. S., Johnston, M., et al. (2011). Solutions for a cultivated planet. Nature 478, 337–342. doi: 10.1038/nature10452
Forman, R. T. (1995). Land Mosaics: The Ecology of Landscapes and Regions. Cambridge: Cambridge University Press.
Gao, X., Cheng, W., Wang, N., Liu, Q., Ma, T., Chen, Y., et al. (2019). Spatio-temporal distribution and transformation of cropland in geomorphologic regions of China during 1990–2015. J. Geogr. Sci. 29, 180–196. doi: 10.1007/s11442-019-1591-4
Han, Z., and Song, W. (2020). Abandoned cropland: patterns and determinants within the Guangxi Karst Mountainous Area, China. Appl. Geogr. 122:102245. doi: 10.1016/j.apgeog.2020.102245
He, S., Yu, S., Li, G., and Zhang, J. (2020). Exploring the influence of urban form on land-use efficiency from a spatiotemporal heterogeneity perspective: evidence from 336 Chinese cities. Land Use Policy 95, 104576. doi: 10.1016/j.landusepol.2020.104576
He, X., Yan, J., and Cheng, X. (2021). Household perspective on cropland expansion on the Tibetan Plateau. Reg. Environ. Change 21:21. doi: 10.1007/s10113-021-01752-8
He, Y., Lee, E., and Mankin, J. S. (2020). Seasonal tropospheric cooling in Northeast China associated with cropland expansion. Environ. Res. Lett. 15:034032. doi: 10.1088/1748-9326/ab6616
Jiao, L., Mao, L., and Liu, Y. (2015). Multi-order landscape expansion index: characterizing urban expansion dynamics. Landsc. Urban Plan. 137, 30–39. doi: 10.1016/j.landurbplan.2014.10.023
Kastner, T., Rivas, M. J. I., Koch, W., and Nonhebel, S. (2012). Global changes in diets and the consequences for land requirements for food. Proc. Natl. Acad. Sci. U.S.A. 109, 6868–6872. doi: 10.1073/pnas.1117054109
Ke, X., van Vliet, J., Zhou, T., Verburg, P. H., Zheng, W., and Liu, X. (2018). Direct and indirect loss of natural habitat due to built-up area expansion: a model-based analysis for the city of Wuhan, China. Land Use Policy 74, 231–239. doi: 10.1016/j.landusepol.2017.12.048
Ke, X., Wang, L., Ma, Y., Pu, K., Zhou, T., Xiao, B., et al. (2019). Impacts of strict cropland protection on water yield: a case study of Wuhan, China. Sustainability 11:184. doi: 10.3390/su11010184
Lambin, E. F., and Meyfroidt, P. (2011). Global land use change, economic globalization, and the looming land scarcity. Proc. Natl. Acad. Sci. U.S.A. 108, 3465–3472. doi: 10.1073/pnas.1100480108
Li, C., Li, J., and Wu, J. (2013). Quantifying the speed, growth modes, and landscape pattern changes of urbanization: a hierarchical patch dynamics approach. Landsc. Ecol. 28, 1875–1888. doi: 10.1007/s10980-013-9933-6
Li, J., Wang, Z., Lai, C., Wu, X., Zeng, Z., Chen, X., et al. (2018). Response of net primary production to land use and land cover change in mainland China since the late 1980s. Sci. Total Environ. 639, 237–247. doi: 10.1016/j.scitotenv.2018.05.155
Li, X., Yu, X., Wu, K., Feng, Z., Liu, Y., and Li, X. (2021). Land-use zoning management to protecting the regional key ecosystem services: a case study in the city belt along the Chaobai River, China. Sci. Total Environ. 762:143167. doi: 10.1016/j.scitotenv.2020.143167
Liang, X., Jin, X., Sun, R., Han, B., Liu, J., and Zhou, Y. (2021a). A typical phenomenon of cultivated land use in China’s economically developed areas: anti-intensification in Jiangsu Province. Land Use Policy 102:105223. doi: 10.1016/j.landusepol.2020.105223
Liang, X., Jin, X., Yang, X., Xu, W., Lin, J., and Zhou, Y. (2021b). Exploring cultivated land evolution in mountainous areas of Southwest China, an empirical study of developments since the 1980s. Land Degrad. Dev. 32, 546–558. doi: 10.1002/ldr.3735
Lin, G. C. S., and Ho, S. P. S. (2003). China’s land resources and land-use change: insights from the 1996 land survey. Land Use Policy 20, 87–107. doi: 10.1016/S0264-8377(03)00007-3
Liu, J., Kuang, W., Zhang, Z., Xu, X., Qin, Y., Ning, J., et al. (2014). Spatiotemporal characteristics, patterns, and causes of land-use changes in China since the late 1980s. J. Geogr. Sci. 24, 195–210. doi: 10.1007/s11442-014-1082-6
Liu, X., Li, X., Chen, Y., Tan, Z., Li, S., and Ai, B. (2010). A new landscape index for quantifying urban expansion using multi-temporal remotely sensed data. Landsc. Ecol. 25, 671–682. doi: 10.1007/s10980-010-9454-5
Liu, X., Ma, L., Li, X., Ai, B., Li, S., and He, Z. (2014). Simulating urban growth by integrating landscape expansion index (LEI) and cellular automata. Int. J. Geogr. Inf. Sci. 28, 148–163. doi: 10.1080/13658816.2013.831097
Liu, X., Zhao, C., and Song, W. (2017). Review of the evolution of cultivated land protection policies in the period following China’s reform and liberalization. Land Use Policy 67, 660–669. doi: 10.1016/j.landusepol.2017.07.012
Ma, L., Yang, S., Gu, Q., Li, J., Yang, X., Wang, J., et al. (2019). Spatial and temporal mapping of cropland expansion in northwestern China with multisource remotely sensed data. Catena 183:104192. doi: 10.1016/j.catena.2019.104192
Ngoma, H., Pelletier, J., Mulenga, B. P., and Subakanya, M. (2021). Climate-smart agriculture, cropland expansion and deforestation in Zambia: linkages, processes and drivers. Land Use Policy 107, 105482. doi: 10.1016/j.landusepol.2021.105482
Nzabarinda, V., Bao, A., Xu, W., Uwamahoro, S., Huang, X., Gao, Z., et al. (2021). Impact of cropland development intensity and expansion on natural vegetation in different African countries. Ecol. Inform. 64:101359. doi: 10.1016/j.ecoinf.2021.101359
Phalan, B., Onial, M., Balmford, A., and Green, R. E. (2011). Reconciling food production and biodiversity conservation: land sharing and land sparing compared. Science 333, 1289–1291. doi: 10.1126/science.1208742
Prabhakar, S. V. R. K. (2021). A succinct review and analysis of drivers and impacts of agricultural land transformations in Asia. Land Use Policy 102, 105238. doi: 10.1016/j.landusepol.2020.105238
Qi, Z. F., Ye, X. Y., Zhang, H., and Yu, Z. L. (2014). Land fragmentation and variation of ecosystem services in the context of rapid urbanization: the case of Taizhou city, China. Stoch. Environ. Res. Risk Assess. 28, 843–855. doi: 10.1007/s00477-013-0721-2
Qiu, L., Pan, Y., Zhu, J., Amable, G. S., and Xu, B. (2019). Integrated analysis of urbanization-triggered land use change trajectory and implications for ecological land management: a case study in Fuyang, China. Sci. Total Environ. 660, 209–217. doi: 10.1016/j.scitotenv.2018.12.320
Rahman, S., and Rahman, M. (2009). Impact of land fragmentation and resource ownership on productivity and efficiency: the case of rice producers in Bangladesh. Land Use Policy 26, 95–103. doi: 10.1016/j.landusepol.2008.01.003
Ramankutty, N., Evan, A. T., Monfreda, C., and Foley, J. A. (2008). Farming the planet: 1. Geographic distribution of global agricultural lands in the year 2000. Glob. Biogeochem. Cycles 22:GB1003. doi: 10.1029/2007GB002952
Ran, P., Hu, S., Frazier, A. E., Qu, S., Yu, D., and Tong, L. (2022). Exploring changes in landscape ecological risk in the Yangtze River Economic Belt from a spatiotemporal perspective. Ecol. Indic. 137:108744. doi: 10.1016/j.ecolind.2022.108744
Rao, Y., Yang, J., Dai, D., Wu, K., and He, Q. (2021). Urban growth pattern and commuting efficiency: empirical evidence from 100 Chinese cities. J. Clean. Prod. 302:126994. doi: 10.1016/j.jclepro.2021.126994
Sarparast, M., Ownegh, M., and Sepehr, A. (2020). Investigation the driving forces of land-use change in northeastern Iran: causes and effects. Remote Sens. Appl. Soc. Environ. 19:100348. doi: 10.1016/j.rsase.2020.100348
Song, W., and Liu, M. (2017). Farmland conversion decreases regional and national land quality in China. L. Degrad. Dev. 28, 459–471. doi: 10.1002/ldr.2518
Song, W., and Pijanowski, B. C. (2013). The effects of China’s cultivated land balance program on potential land productivity at a national scale. Appl. Geogr. 46, 158–170. doi: 10.1016/j.apgeog.2013.11.009
Su, S., Hu, Y., Luo, F., Mai, G., and Wang, Y. (2014). Farmland fragmentation due to anthropogenic activity in rapidly developing region. Agric. Syst. 131, 87–93. doi: 10.1016/j.agsy.2014.08.005
Su, S., Xiao, R., Jiang, Z., and Zhang, Y. (2012). Characterizing landscape pattern and ecosystem service value changes for urbanization impacts at an eco-regional scale. Appl. Geogr. 34, 295–305. doi: 10.1016/j.apgeog.2011.12.001
Tan, S., Heerink, N., and Qu, F. (2006). Land fragmentation and its driving forces in China. Land Use Policy 23, 272–285. doi: 10.1016/j.landusepol.2004.12.001
Tang, L., Ke, X., Chen, Y., Wang, L., Zhou, Q., Zheng, W., et al. (2021). Which impacts more seriously on natural habitat loss and degradation? Cropland expansion or urban expansion? Land Degrad. Dev. 32, 946–964. doi: 10.1002/ldr.3768
Tang, L., Ke, X., Zhou, T., Zheng, W., and Wang, L. (2020b). Impacts of cropland expansion on carbon storage: a case study in Hubei, China. J. Environ. Manage. 265:110515. doi: 10.1016/j.jenvman.2020.110515
Tang, L., Ke, X., Zhou, Q., Wang, L., and Koomen, E. (2020a). Projecting future impacts of cropland reclamation policies on carbon storage. Ecol. Indic. 119:106835. doi: 10.1016/j.ecolind.2020.106835
Tian, G., Duan, J., and Yang, L. (2021). Spatio-temporal pattern and driving mechanisms of cropland circulation in China. Land Use Policy 100:105118. doi: 10.1016/j.landusepol.2020.105118
Tilman, D., Balzer, C., Hill, J., and Befort, B. L. (2011). Global food demand and the sustainable intensification of agriculture. Proc. Natl. Acad. Sci. U.S.A. 108, 20260–20264. doi: 10.1073/pnas.1116437108
Tscharntke, T., Clough, Y., Wanger, T. C., Jackson, L., Motzke, I., Perfecto, I., et al. (2012). Global food security, biodiversity conservation and the future of agricultural intensification. Biol. Conserv. 151, 53–59. doi: 10.1016/j.biocon.2012.01.068
Tu, Y., Chen, B., Yu, L., Xin, Q., Gong, P., and Xu, B. (2021). How does urban expansion interact with cropland loss? A comparison of 14 Chinese cities from 1980 to 2015. Landsc. Ecol. 36, 243–263. doi: 10.1007/s10980-020-01137-y
Uisso, A. M., and Tanrıvermiş, H. (2021). Driving factors and assessment of changes in the use of arable land in Tanzania. Land Use Policy 104:105359. doi: 10.1016/j.landusepol.2021.105359
van Vliet, J. (2019). Direct and indirect loss of natural area from urban expansion. Nat. Sustain. 2, 755–763. doi: 10.1038/s41893-019-0340-0
van Vliet, J., Eitelberg, D. A., and Verburg, P. H. (2017). A global analysis of land take in cropland areas and production displacement from urbanization. Glob. Environ. Change 43, 107–115. doi: 10.1016/j.gloenvcha.2017.02.001
Wang, L., Ke, X., and Hatab, A. A. (2020). Trade-offs between economic benefits and ecosystem services value under three cropland protection scenarios for Wuhan City in China. Land 9:117. doi: 10.3390/land9040117
Wang, L., Zhang, S., Xiong, Q., Liu, Y., Liu, Y., and Liu, Y. (2022b). Spatiotemporal dynamics of cropland expansion and its driving factors in the Yangtze River Economic Belt : a nuanced analysis at the county scale. Land Use Policy 119:106168. doi: 10.1016/j.landusepol.2022.106168
Wang, L., Zhang, S., Liu, Y., and Liu, Y. (2022a). Interaction between construction land expansion and cropland expansion and its socioeconomic determinants : evidence from urban agglomeration in the middle reaches of the Yangtze River, China. Front. Environ. Sci. 10:882582. doi: 10.3389/fenvs.2022.882582
Wang, L., Zheng, W., Tang, L., Zhang, S., Liu, Y., and Ke, X. (2021). Spatial optimization of urban land and cropland based on land production capacity to balance cropland protection and ecological conservation. J. Environ. Manage. 285:112054. doi: 10.1016/j.jenvman.2021.112054
Wilson, E. H., Hurd, J. D., Civco, D. L., Prisloe, M. P., and Arnold, C. (2003). Development of a geospatial model to quantify, describe and map urban growth. Remote Sens. Environ. 86, 275–285. doi: 10.1016/S0034-4257(03)00074-9
Xin, L., and Li, X. (2018). China should not massively reclaim new farmland. Land Use Policy 72, 12–15. doi: 10.1016/j.landusepol.2017.12.023
Xu, C., Liu, M., Zhang, C., An, S., Yu, W., and Chen, J. M. (2007). The spatiotemporal dynamics of rapid urban growth in the Nanjing metropolitan region of China. Landsc. Ecol. 22, 925–937. doi: 10.1007/s10980-007-9079-5
Yan, H., Liu, J., Huang, H. Q., Tao, B., and Cao, M. (2009). Assessing the consequence of land use change on agricultural productivity in China. Glob. Planet. Change 67, 13–19. doi: 10.1016/j.gloplacha.2008.12.012
Yang, B., Ke, X., van Vliet, J., Yu, Q., Zhou, T., and Verburg, P. H. (2020). Impact of cropland displacement on the potential crop production in China: a multi-scale analysis. Reg. Environ. Change 20:97. doi: 10.1007/s10113-020-01690-x
Yang, B., Wang, Z., Zou, L., Zou, L., and Zhang, H. (2021). Exploring the eco-efficiency of cultivated land utilization and its influencing factors in China’s Yangtze River Economic Belt, 2001–2018. J. Environ. Manage. 294:112939. doi: 10.1016/j.jenvman.2021.112939
Yu, Q., Hu, Q., van Vliet, J., Verburg, P. H., and Wu, W. (2018). GlobeLand30 shows little cropland area loss but greater fragmentation in China. Int. J. Appl. Earth Obs. Geoinf. 66, 37–45. doi: 10.1016/j.jag.2017.11.002
Zabel, F., Delzeit, R., Schneider, J. M., Seppelt, R., Mauser, W., and Václavík, T. (2019). Global impacts of future cropland expansion and intensification on agricultural markets and biodiversity. Nat. Commun. 10:2844. doi: 10.1038/s41467-019-10775-z
Zeng, Z., Estes, L., Ziegler, A. D., Chen, A., Searchinger, T., Hua, F., et al. (2018). Highland cropland expansion and forest loss in Southeast Asia in the twenty-first century. Nat. Geosci. 11, 556–562. doi: 10.1038/s41561-018-0166-9
Zhang, S., Hu, W., Li, M., Guo, Z., Wang, L., and Wu, L. (2021). Multiscale research on spatial supply-demand mismatches and synergic strategies of multifunctional cultivated land. J. Environ. Manage. 299:113605. doi: 10.1016/j.jenvman.2021.113605
Keywords: cropland expansion trajectory, land fragmentation, landscape metrics, topographic relief amplitude, correlation analysis, landscape expansion index
Citation: Wang L, Zhang S, Xie Y, Liu Y and Liu Y (2022) How Does Different Cropland Expansion Trajectories Affect Cropland Fragmentation? Insights From Three Urban Agglomerations in Yangtze River Economic Belt, China. Front. Ecol. Evol. 10:927238. doi: 10.3389/fevo.2022.927238
Received: 24 April 2022; Accepted: 30 May 2022;
Published: 30 June 2022.
Edited by:
Jianhong Xia, Curtin University, AustraliaReviewed by:
Qingsong He, Huazhong University of Science and Technology, ChinaCopyright © 2022 Wang, Zhang, Xie, Liu and Liu. This is an open-access article distributed under the terms of the Creative Commons Attribution License (CC BY). The use, distribution or reproduction in other forums is permitted, provided the original author(s) and the copyright owner(s) are credited and that the original publication in this journal is cited, in accordance with accepted academic practice. No use, distribution or reproduction is permitted which does not comply with these terms.
*Correspondence: Yaolin Liu, eWFvbGluNjEwQDE2My5jb20=
Disclaimer: All claims expressed in this article are solely those of the authors and do not necessarily represent those of their affiliated organizations, or those of the publisher, the editors and the reviewers. Any product that may be evaluated in this article or claim that may be made by its manufacturer is not guaranteed or endorsed by the publisher.
Research integrity at Frontiers
Learn more about the work of our research integrity team to safeguard the quality of each article we publish.