 Shaobo Zhang1
 Yaqiong Lyu2*Xianyu Yang1
 Liang Yuan1Yurun Wang3Lei Wang1Yuxin Liang1Yuhong Qiao4,5Shigong Wang1
- 1Plateau Atmosphere and Environment Key Laboratory of Sichuan Province, School of Atmospheric Sciences, Chengdu University of Information Technology, Chengdu, China
- 2Institute of Mountain Hazards and Environment, Chinese Academy of Sciences, Chengdu, China
- 3Department of Land, Air and Water Resources, University of California, Davis, Davis, CA, United States
- 4Chongqing Institute of Eco-Environmental Science, Chongqing, China
- 5Chongqing Key Laboratory of Urban Atmospheric Environment Observation and Pollution Control, Chongqing, China
Biogenic volatile organic compounds (BVOCs) impact atmospheric oxidation capacity and regional air quality through various biogeochemistry processes. Accurate estimation of BVOC emissions is crucial for modeling the fate and transport of air pollutants in chemical transport models. Previous modeling characterizes the spatial variability of BVOCs while estimated BVOC emissions show large uncertainties, and the impacts of BVOC emissions on ozone (O3) air quality are not well understood. In this study, we estimate the BVOC emissions by model of emissions of gases and aerosols from nature (MEGAN) v2.1 and MEGAN v3.1 over the Sichuan Basin (SCB) situated in southwestern China for 2017. Further, the critical role of BVOC emissions on regional O3 pollution is illustrated with a CMAQ modeled O3 episode in summer 2017. Annual BVOC emissions over the SCB in 2017 are estimated to be 1.8 × 10⁶ tons with isoprene emissions as high as 7.3 × 10⁵ tons. Abundant BVOC emissions are depicted over the southern and southeastern SCB, in contrast to the relatively low emissions of BVOC over the Chengdu Plain and northeastern SCB. CMAQ simulations depict a strong influence of BVOC on ambient O3 formation over densely forested regions including southern SCB and Chongqing city, accounting for 10% of daily maximum hourly O3 concentration (DM1h O3) and 6% of daily maximum 8-h average O3 (MDA8h O3) concentrations in July 2017. Over the severe O3 episode in summer 2017, sensitivity experiments indicate that enhanced BVOC emissions contribute substantially to basin-wide O3 concentrations and elevate peak O3 levels by 36.5 and 31.2 μg/m3 for the southern SCB and Chengdu Plain, respectively. This work identifies robustly important effects of BVOC emissions on O3 exceedance events over the SCB and contributes insight into pursuing an O3 abatement strategy with full consideration of potential contributions from BVOC emissions.
Introduction
Biogenic volatile organic compounds (BVOCs) emitted by terrestrial ecosystems have multiple effects on the earth’s system through altering the global carbon cycle and shaping tropospheric composition due to their large quantity and high chemical reactivity (Peñuelas and Staudt, 2010; Unger, 2014). Globally, BVOC emissions are about 10 times higher than the anthropogenic VOC (AVOC) emissions (Messina et al., 2016). BVOCs are predominantly composed of isoprene, monoterpenes, and sesquiterpenes and these species undergo rapid oxidation reactions in the atmosphere, which then form air pollutants including ozone (O3) and particulate matter (PM), which are harmful to human health and vegetation growth (Carlton et al., 2010; Shrivastava et al., 2017; Xu et al., 2021). Substantial evidence from field, modeling, and laboratory works has shown that BVOCs actively participate in photochemical oxidation and influence urban O3 formation (Churkina et al., 2017; Gu et al., 2021). A better understanding of the estimation of BVOC is thus critical to assess the environmental impacts of BVOC and develop effective O3 control strategies.
Accurately estimating BVOC emissions is challenging due to limitations associated with spatial heterogeneity of land cover, multiple environmental stresses, and rapidly changing driving factors (Jiang et al., 2018; Demetillo et al., 2019). In recent years, BVOC emissions have been estimated on regional and global scales by various models, including the model of emissions of gases and aerosols from nature (MEGAN) and the biogenic emission inventory system (BEIS) (Carlton and Baker, 2011; Wu et al., 2020). Among numerical BVOC estimation models, MEGAN version 2.1 has been extensively used in previous studies due to its advanced algorithm and performance in capturing the magnitude and variations of BVOC emissions (Guenther et al., 2012). However, prior studies have revealed that environmental stress, particularly drought and ambient O3 concentrations, significantly influences the magnitude of BVOC emissions, while these mechanistic effects are not well represented in MEGANv2.1 (Jiang et al., 2018; Demetillo et al., 2019). To date, MEGANv3.1 has incorporated the parameterization of BVOC response to environment stress and Berkeley-Dalhousie Soil NOx Parameterization (BDSNP) for optimizing soil NOx emissions, which illustrates improved accuracy and enhanced capability in characterizing BVOC emissions (Guenther et al., 2017). Nonetheless, potential limitations in existing studies involve the lack of urban LAI in satellite-derived LAI products [typically from the moderate resolution imaging spectroradiometer (MODIS)]. As a result, BVOC emissions in urban areas could be significantly underestimated by numerical models and further lead to substantial uncertainty in assessing the impacts of BVOC emissions on urban air quality (Alonzo et al., 2015; Ghirardo et al., 2016). Given the growing urban green space in densely populated city clusters, urban BVOC emissions may be considerably higher than currently estimated and therefore can have an essential impact on urban atmospheric chemistry (Connop et al., 2016; Ren et al., 2017).
Strict regulation of NOx, SO2, and primary PM2.5 emissions by the Air Pollution Prevention and Control Action Plan (APPCAP) have resulted in declining ambient PM2.5 concentrations across China, which has effectively mitigated wintertime haze pollution (Zheng et al., 2018). Despite considerable achievements in reducing ambient PM2.5 concentrations, deteriorated O3 levels have emerged as a prominent concern in China, which raises a new challenge for air quality management (Liu and Wang, 2020). Highly developed city clusters including the North China Plain (NCP), Yangtze River Delta (YRD), Pearl River Delta (PRD), and Sichuan Basin (SCB) have turned out to be the most polluted regions throughout China (Wu et al., 2019; Wang et al., 2021; Yang et al., 2021). While several explanations have been proposed for the degraded O3 air quality over China including the transition of the O3-NOx-VOCs sensitivity regime attributed to disproportionately reductions in NOx and VOCs emissions, climate-driven unfavorable meteorological conditions, and the impacts of reduced PM emissions that influence O3 production, the crucial role of BVOC emissions on O3 pollution still lack of attention and BVOC emissions may be far more than currently thought. Furthermore, limited case studies are insufficient to demonstrate the sensitivity of BVOC emissions to model parameters and how these changes impact O3 production during extreme O3 episodes, particularly for the SCB where elevated BVOC emissions are estimated (Ma et al., 2019; Yang et al., 2020).
Located in the southwestern China, the SCB is the most developed economic zone in China and has approximately 110 million residents within an area of 260,000 km2. O3 attainment in SCB is challenging because of widely distributed industrial infrastructures, intense BVOC emissions, and a complex distribution of anthropogenic sources (Wu et al., 2022). The SCB is influenced by subtropical and temperate climates, featured by persistent high temperatures through the warm season. The vegetation types in this region are mainly subtropical evergreen broadleaf trees and subtropical evergreen coniferous trees, which exhibit high BVOC emission potentials (Wu et al., 2020). These features are in favor of BVOC emissions in the SCB. The national biogenic emission inventory reported in previous studies has shown that BVOC emissions in the SCB are much higher than in the NCP and YRD regions (Li et al., 2012). Though BVOCs are highly reactive in the atmosphere, their oxidation products have longer lifetime which can persist for a few days, allowing regional transport of secondary products under prevailing wind fields (Jeon et al., 2014). Measurements in the SCB indicate that urban BVOC emissions significantly contribute to O3 episodes and thus cannot be neglected (Tan et al., 2018). While prior studies have assessed the effects of BVOC emissions on O3 formation in SCB, most previous studies in SCB only focused on a specific short period and adopted a coarse spatial resolution that was not enough to fully quantify how BVOC emissions affect surface O3 spatiotemporally (Yang et al., 2020). Therefore, further detailed assessment of the unique and changing BVOC profiles in the SCB is urgently needed to formulate an effective O3 mitigation strategy.
In this study, we quantify the BVOC emission budget and examine BVOC profiles for 2017 over the SCB based on the MEGAN model, and quantitatively assess the impacts of BVOC emissions on O3 concentrations over the warm season in 2017 through the WRF-CMAQ modeling system. Further, a regional extreme O3 episode that occurred in July 2017 was simulated to probe the effects of heat wave induced BVOC enhancement on O3 episodes across the SCB. The article is organized as follows. In section “Methodology,” the configurations of the WRF-CMAQ system, the set-up of MEGAN and the ambient measurements of air pollutants are presented. The spatial pattern and seasonal variability of BVOC emissions and the contribution of BVOC to the basin-wide O3 episode are investigated in section “Results and Discussion.” In section “Conclusion,” we discuss the findings and implications for regulatory measures.
Methodology
Ambient Observations
Two observation datasets were adopted in this study for exploring the spatial pattern and magnitude of air pollutants and evaluating the model performance. For meteorology, hourly observation of meteorological parameters was acquired from the China Meteorological Data Service Center (CMDSC) which have made bias-correction for ensuring data accuracy. Hourly gaseous pollutants concentrations were obtained from the monitoring network operated by the China National Environmental Monitoring Center (CNEMC) with rigorous data quality control following the guidance of Sichuan environmental monitoring center.
Air Quality Modeling
Meteorological fields are simulated by the Weather Research and Forecasting (WRFv3.9.1) model. The model is set-up for three nested domains centered over SCB with horizontal resolution of 27, 9, and 3 km, respectively (as seen in Figure 1). The model simulation spans the time period for the whole year of 2017 with hourly output. To minimize the impact of initial conditions, we run the WRF model month by month with the first 3 days in each simulation excluded as spin-up. Meteorological initial and boundary conditions for driving WRF are acquired from the National Centers for Environmental Prediction (NCEP) Final (FNL) 1.0° × 1.0° reanalysis data.1 The vertical structure of the WRF model contains 30 layers of which 10 layers are within the boundary layer height. The four-dimensional data assimilation technique (FDDA) is applied to the outermost domain to nudge 3-D winds, temperature, and humidity at 3 h intervals with strengths of 5 × 10⁻⁵, 1 × 10⁻⁵, and 1 × 10⁻⁵ s–1, respectively (Yang et al., 2020). In addition, NCEP Automated Data Processing (ADP) global surface (ds461.0) and upper observational data2 are assimilated to WRF. Model configurations including physical parameterizations are summarized in Table 1.
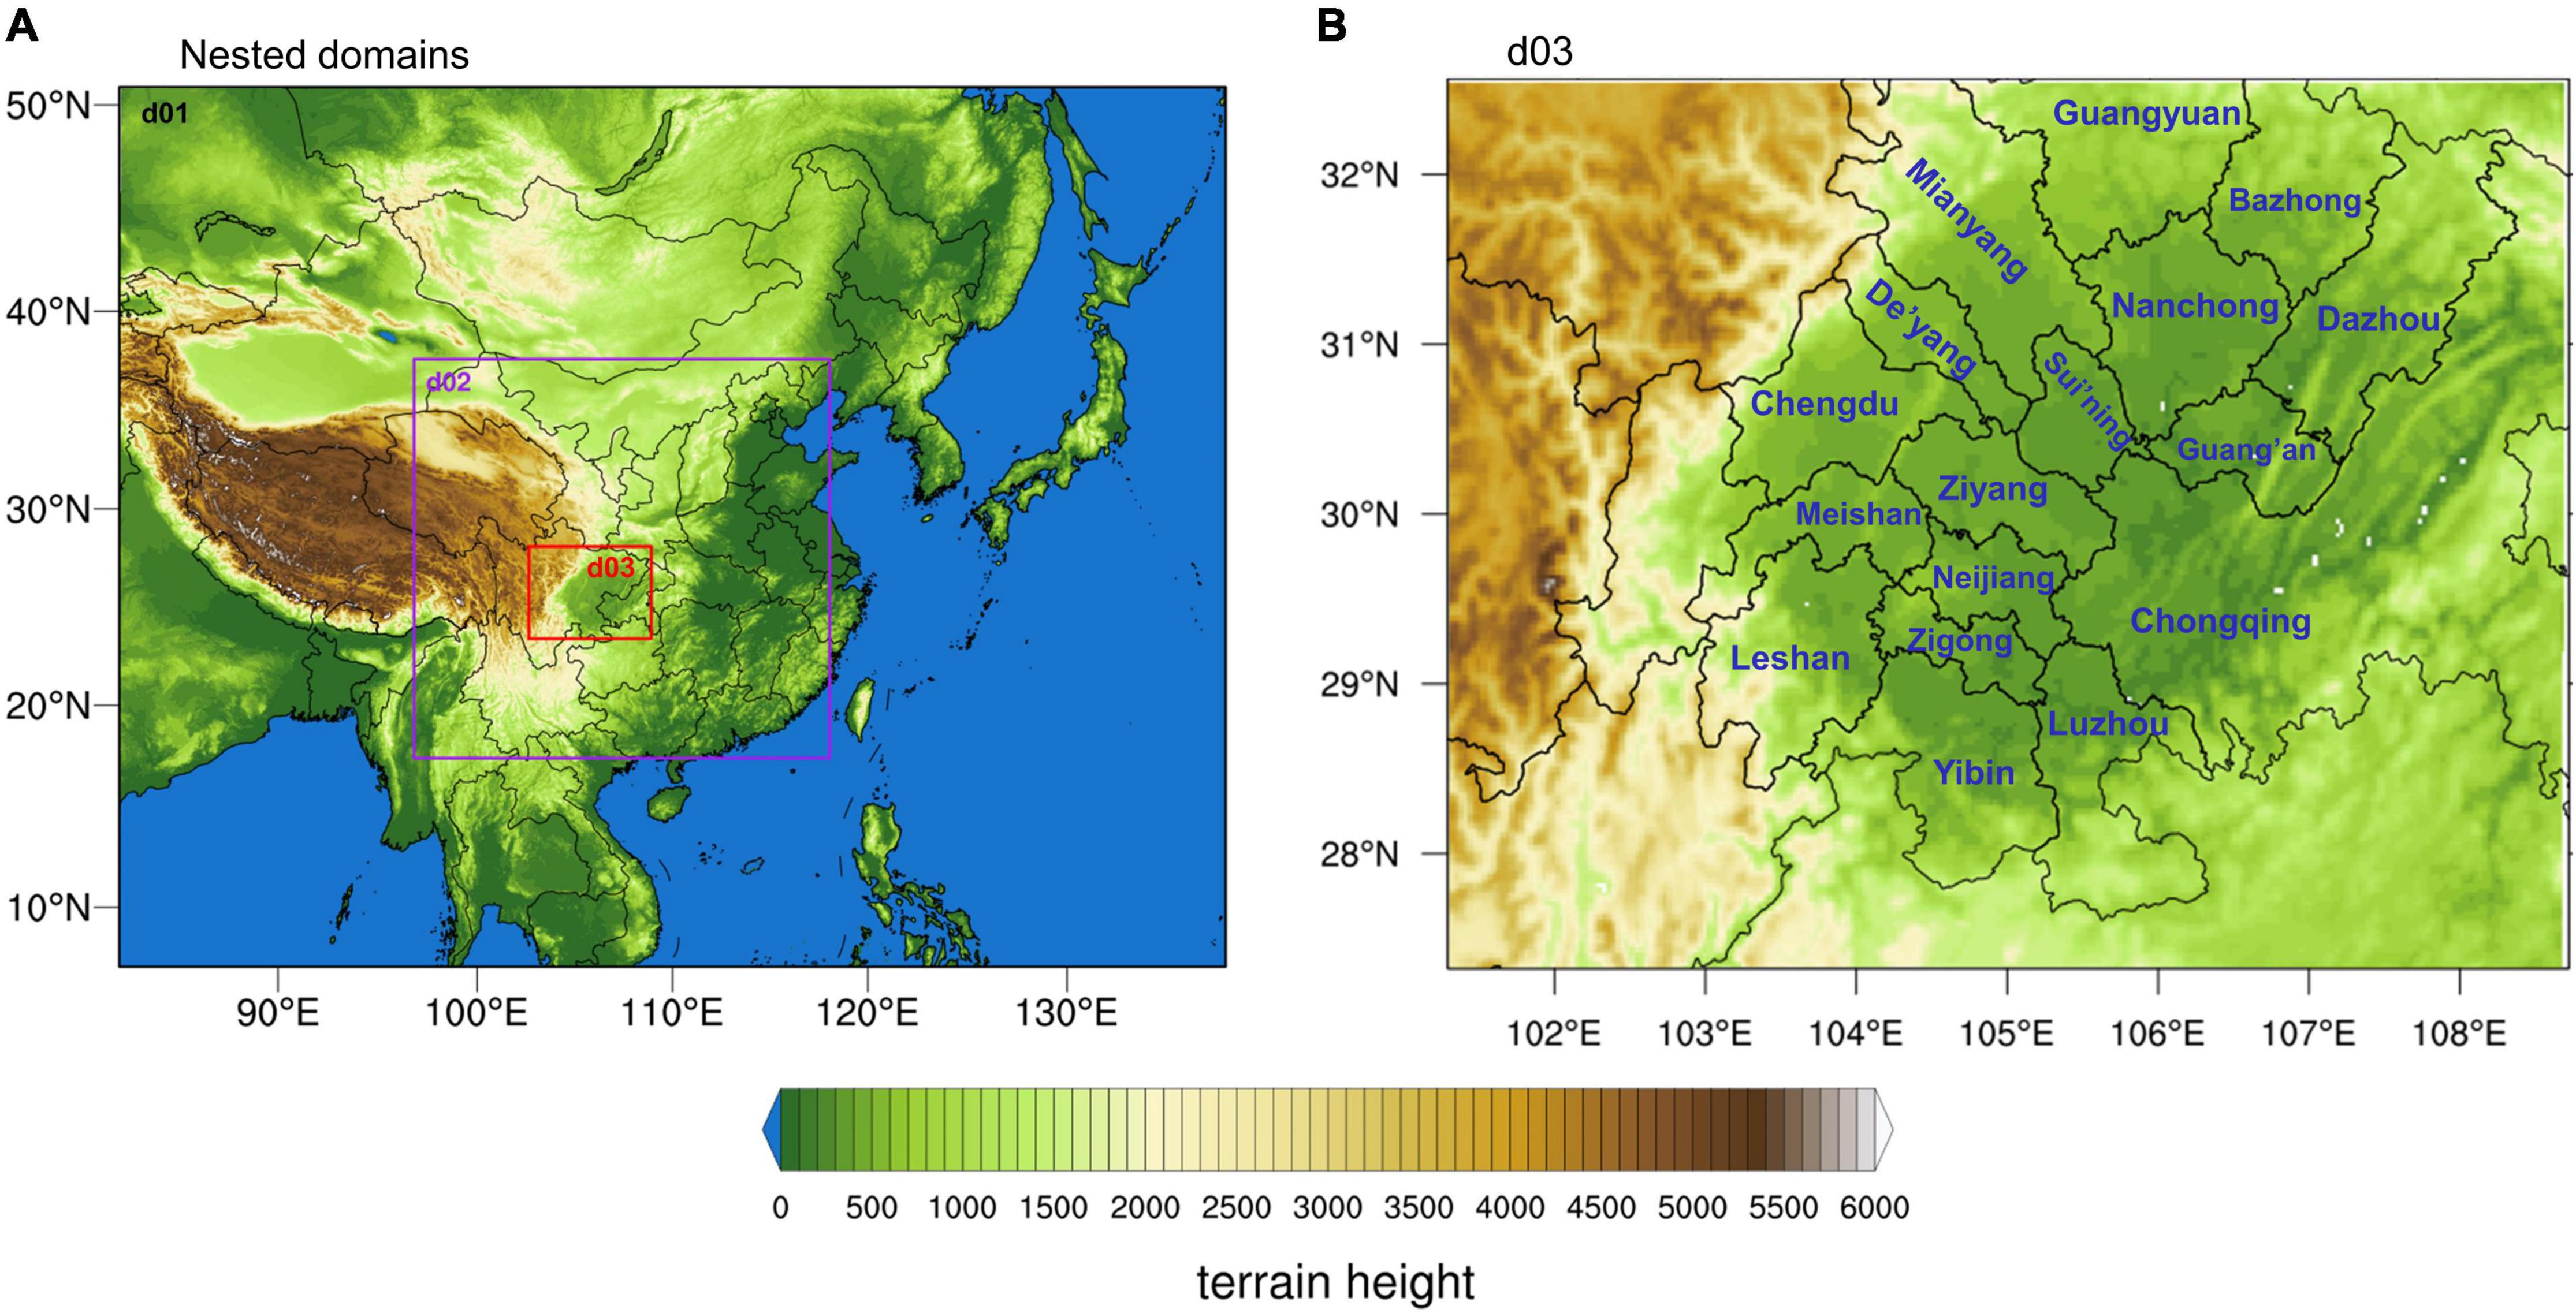
Figure 1. Three nested WRF domains with terrain height (m) (A) domain configurations, (B) innermost domain.
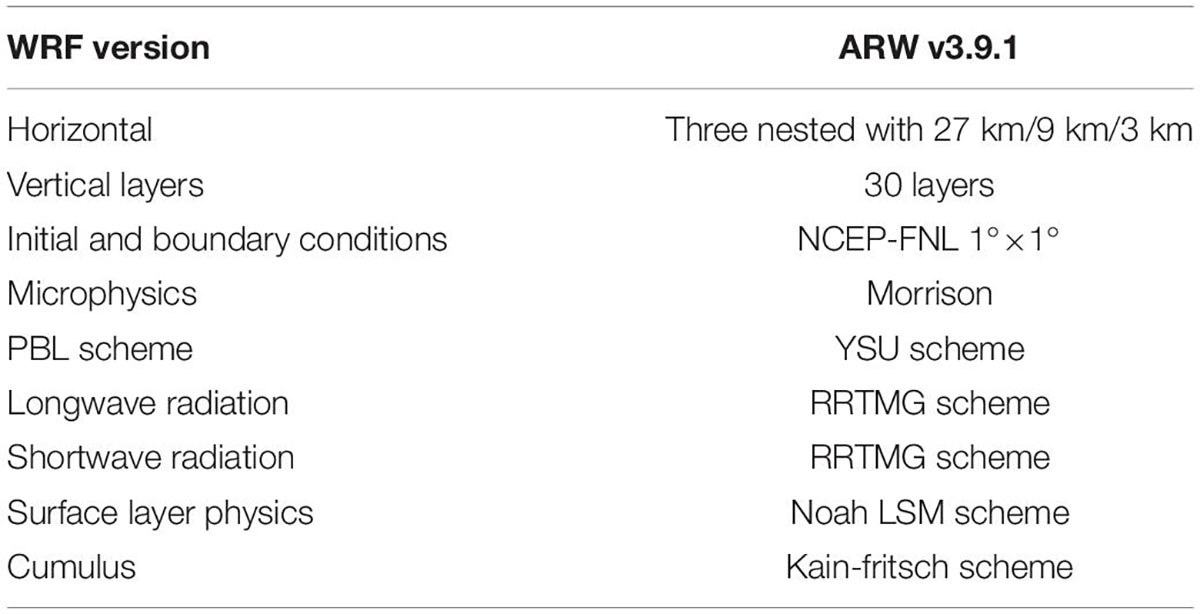
Table 1. Configurations of WRF model.
CMAQ v5.3.1 is used to simulate gaseous pollutants and aerosols (Appel et al., 2021). The simulation period spans from June 28 to July 30 in 2017, with the simulation results for June discarded as spin-up. Chemical boundary and initial conditions for the outermost domain were generated by default profiles within CMAQ which represent a clean atmosphere, while the initial and boundary conditions for the nested domains are extracted from model outputs of the outer domain. Gas-phase chemistry and aerosol mechanism were represented with the Carbon-Bond (CB06) and the Aerosol 06 (AERO6) (Pye et al., 2017). Anthropogenic emissions are based upon the Multi-resolution Emission Inventory for China (MEIC) in 2017 and undergo spatial and temporal allocation based on high resolution spatial surrogates (Zheng et al., 2018). Biogenic emissions are calculated from MEGAN, as discussed in section “Model of Emissions of Gases and Aerosols From Nature Model.” Here, two sensitivity experiments were conducted to examine the effects of BVOC emissions on summer O3 levels over the SCB, as summarized in Table 2. In the baseline scenario, both anthropogenic and biogenic emissions are included, while biogenic emissions are eliminated in the Nobio scenario to represent the pure contribution of anthropogenic emissions.
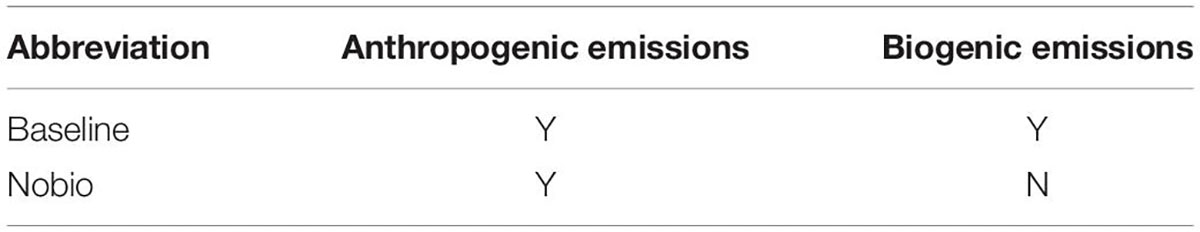
Table 2. CMAQ sensitivity experiments.
Model of Emissions of Gases and Aerosols From Nature Model
Biogenic emissions were calculated by using the MEGANv2.1 and MEGANv3.1 models, respectively (Guenther et al., 2012). For MEGANv2.1, the model inputs include leaf area index (LAI) based on the Moderate Resolution Imaging Spectroradiometer (MODIS) MOD15A2H LAI product and plant function types (PFTs) obtained from the MODIS MCD12Q1 product for 2017. A global emission factor database based on ecoregion-averaged PFT was used to reflect the BVOC emission rate under standard canopy conditions. The meteorological fields used for driving MEGAN were provided by the WRF model described in section “Air Quality Modeling.”
In the parameterization of MEGANv2.1, the emission rate of BVOCs is determined by the product of emission factor and emission activity factor, as shown in Eq. (1):
where ε represents the emission factor (emission rate at standard conditions) and ρ denotes the change within the canopy (generally set to 1). The emission activity factor for each compound class (γi) takes the changes in environmental conditions into account, which is formulated as Eq. (2):
where each parameter represents the emission response to light (γP), temperature (γT), leaf age (γA), soil moisture (γSM), leaf area index (LAI), and CO2 inhibition (γC).
Unlike MEGANv2.1, MEGANv3.1 introduces a J-rating scheme for representing the data quality of emission factors with a J-rating of 4 denoting the highest quality data while J-rating of 0 corresponding to lowest quality data (Guenther et al., 2017). Herein, we only use the data with a J-rating of 4 with parameterizations for environmental stress turned on in the experiment for MEGANv3.1.
Results and Discussion
Evaluation of Model Performance
To evaluate the model performance over the innermost domain, statistical metrics including mean bias (MB), normalized mean bias (NMB), normalized mean error (NME), and root-mean-square error (RMSE), were quantified based on ambient measurements and modeled parameters (including 2-m temperature, 2-m relative humidity, 10-m wind speed, 10-m wind direction, O3 levels, and NO2 concentrations). The definitions of these statistical metrics are presented in Eqs. (3)–(6), where Pi and Oi denote the predicted values and observations, respectively. The evaluation of WRF and CMAQ model performance over the study period have been described in detail by Yang et al. (2020) and Wang et al. (2022). Briefly, WRF model broadly capture the day-to-day variability of 2-m temperature and 2-m relative humidity with R values ranging from 0.92–0.98 to 0.58–0.67, respectively. For gaseous pollutants, CMAQ simulations successfully reproduce the diurnal pattern and peak O3 concentrations (R values ranged 0.68–0.75) over warm season (April–September), particularly showing good agreement with observed O3 in summer.
Spatial Pattern and Temporal Variability of Biogenic Volatile Organic Compounds Emissions
To identify spatially explicit BVOC emissions throughout the model domain, the SCB is divided into subregions based on geographic locations and air pollution zones (Table 3). The annual BVOC emissions for SCB in 2017 are 1.8 × 10⁶ tons and 1.2 × 10⁶ tons estimated by MEGANv2.1 and MEGANv3.1, respectively (as seen in Figure 2). By source category, the emissions of isoprene (ISOP), monoterpenes (TERP), sesquiterpene (SESQ), and other BVOCs in MEGANv2.1 were 7.3 × 10⁵ (41.1% of total BVOCs), 2.4 × 10⁵ (13.5%), 2.3 × 10⁴ (1.3%), and 7.9 × 10⁵ (44.1%) tons, respectively. In contrast, MEGANv3.1 estimated 3.6 × 10⁵ tons for ISOP (29.7% of total BVOCs), 3.0 × 10⁵ tons for TERP (24.8%), 2.9 × 10⁴ tons for SESQ (2.4%), and 5.3 × 10⁵ tons for other BVOCs (43.2%), respectively. The significant decrease in ISOP emission amount, while a slight increase in TERP and SESQ emissions, imply that the profound heatwaves in summer 2017 had a significant impact on BVOC emissions across the SCB (Wu et al., 2022). Interestingly, while isoprene is the governing compound among all species, the sum of other BVOCs is in excess of the emissions of isoprene. For the abundance of other VOCs in MEGANv2.1, methanol is the dominant contributor with annual emissions of 4.9 × 10⁵ tons, followed by acetone (6.2× 10⁴ tons), ethene (4.4× 10⁴ tons), propene (3.7× 10⁴ tons), and ethanol (2.1× 10⁴ tons). The amount of BVOC emissions is in good agreement with Wu et al. (2020) for the same period, while slightly lower than the value reported by Li et al. (2012), which could be partially attributed to input parameters and study period.
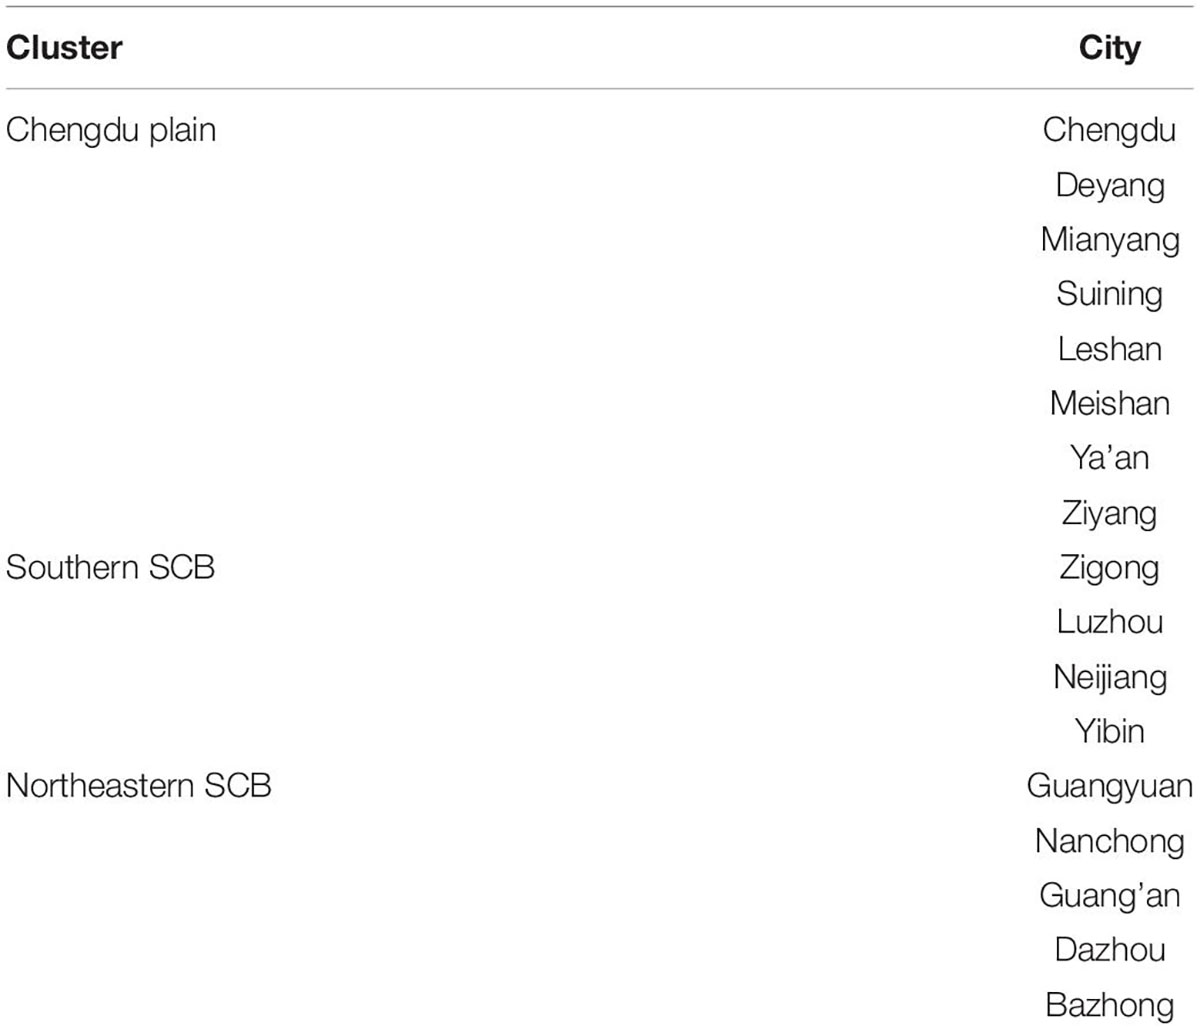
Table 3. Classification of city clusters in the SCB.
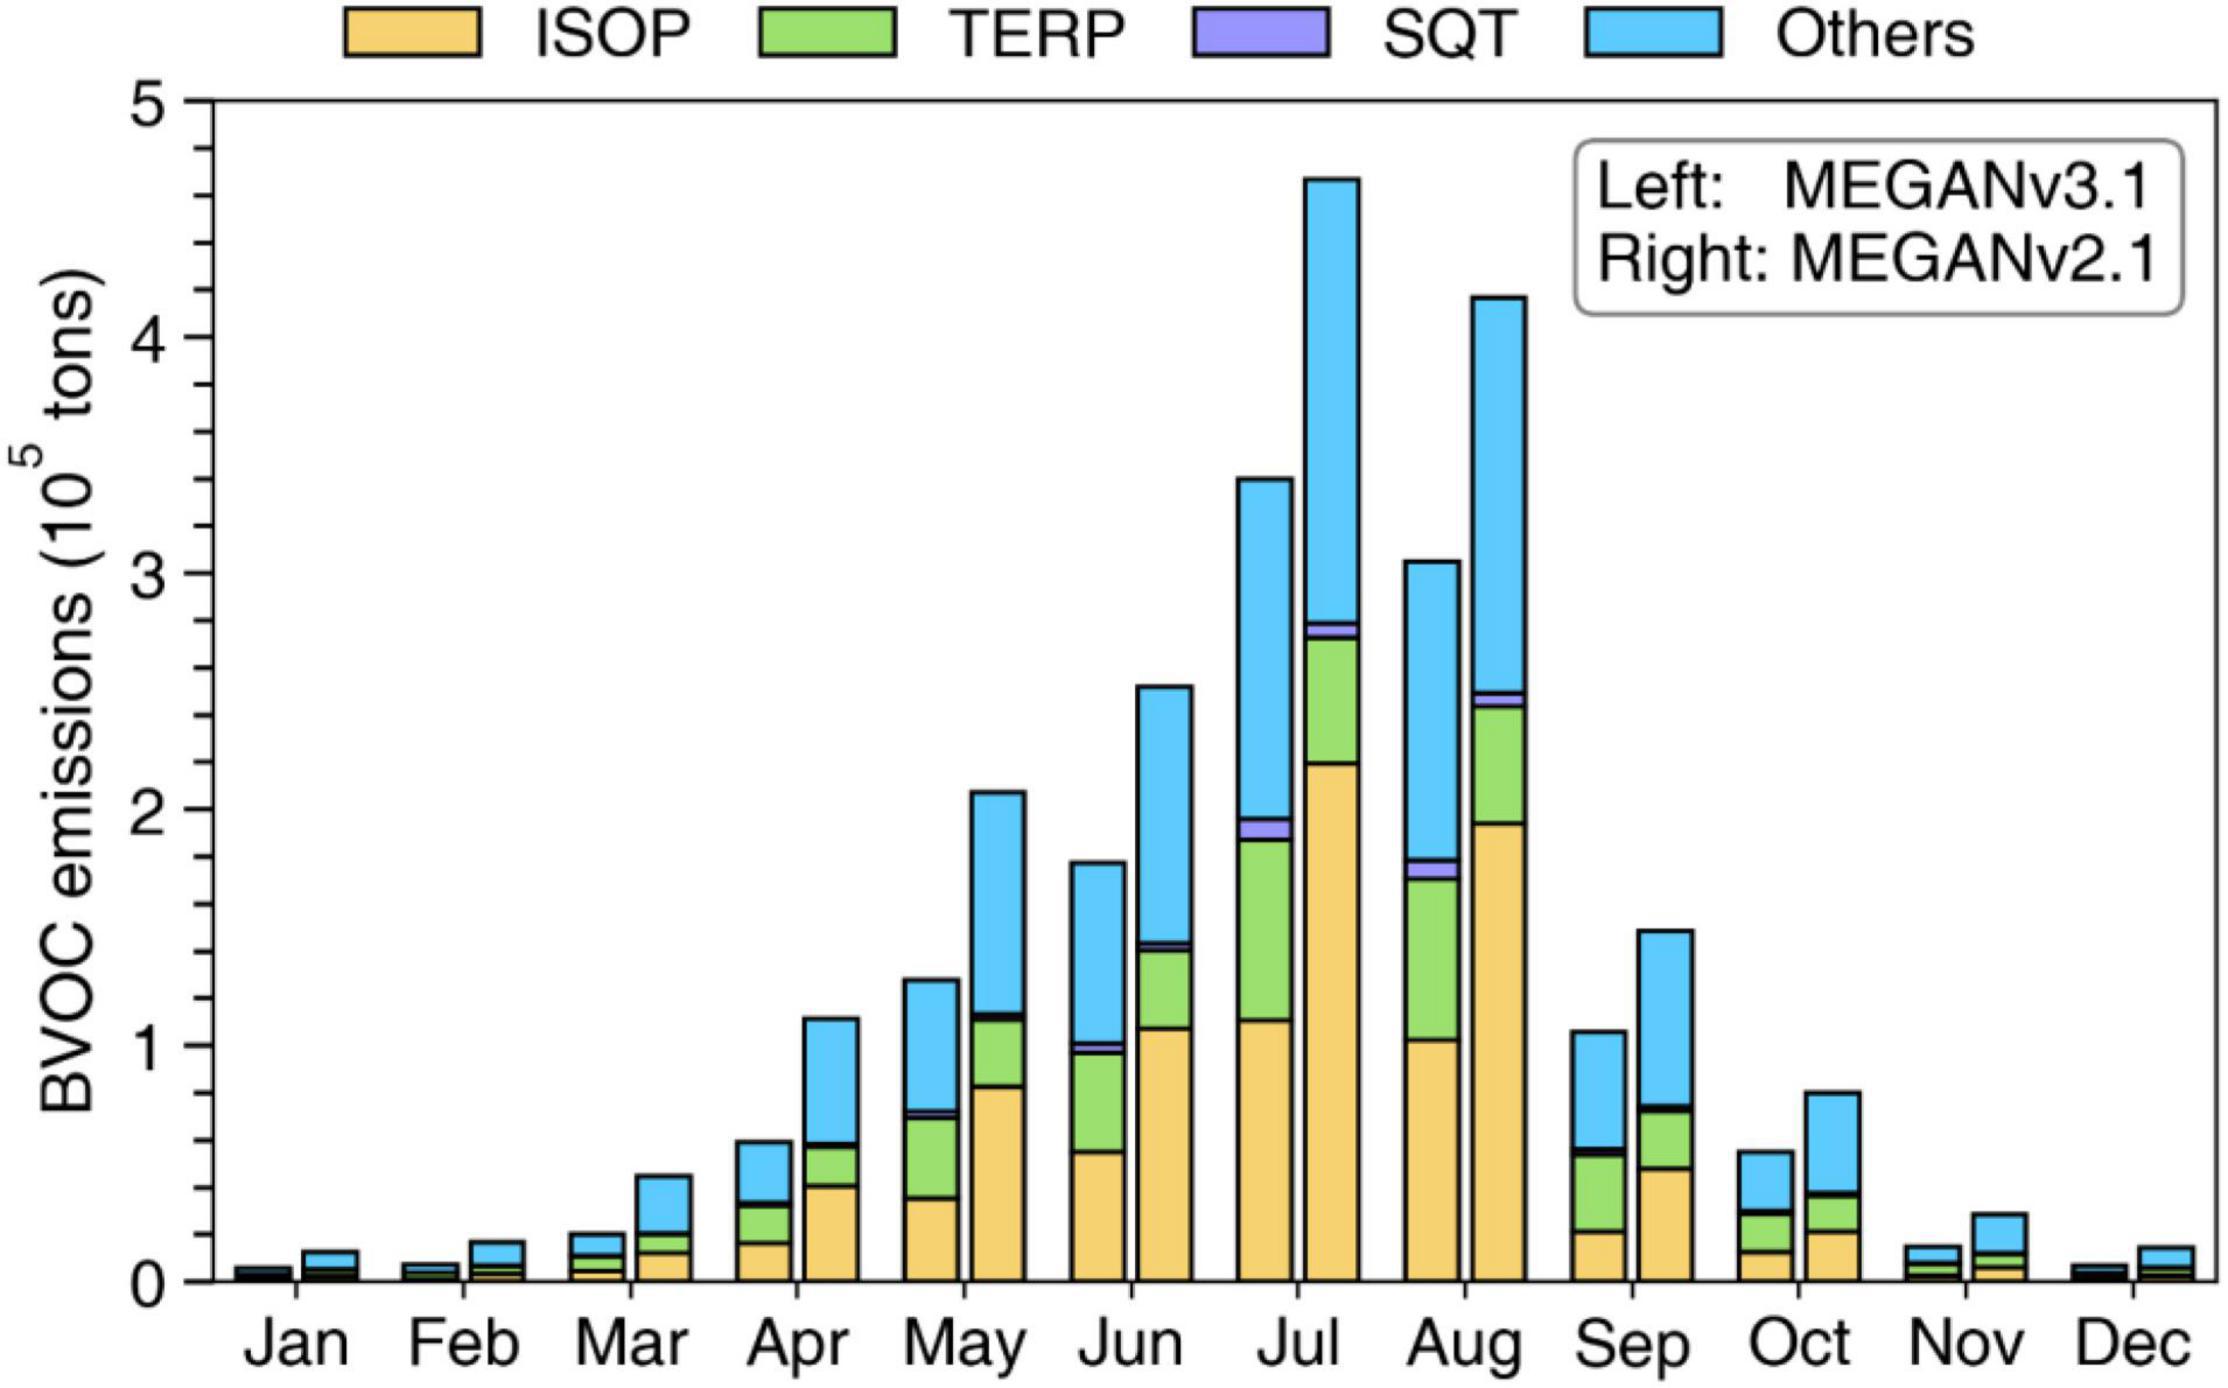
Figure 2. Monthly emission budget of BVOC over SCB for 2017 estimated by MEGANv2.1 and MEGANv3.1.
Figure 3 presents annual emissions of total BVOC, isoprene, monoterpenes, and sesquiterpenes across the SCB in MEGANv2.1. It can be clearly seen that emissions of BVOC are spatially heterogeneous over the study domain. Isoprene and monoterpenes emissions in Chengdu, Ziyang, Deyang, and Suining cities are relatively low because the PFTs in these cities are dominated by cropland rather than trees. In contrast, maximum BVOC emission fluxes are found in southern and southwestern SCB, particularly the cities of Luzhou, Yibin, Leshan, and Zigong exhibiting much higher BVOC emissions in comparison with the Chengdu Plain and central SCB. It is worth mentioning that BVOC emissions from southern SCB account for 56% of total BVOC budget, which is primarily driven by the combined effects of warm climate conditions and the high density of biomass in these regions (Ma et al., 2019). In MEGANv3.1, it can be clearly seen that TERP emissions are much higher than in MEGANv2.1, with strong enhancement (difference higher than 1 tons/km2) in southern and northeastern SCB (Figure 4). However, ISOP emissions exhibit basin-wide reductions (magnitude larger than 4 tons/km2) due to the response of vegetation to persistent drought conditions, thus leading to BVOC emissions in MEGANv3.1 significantly lower than in MEGANv2.1.
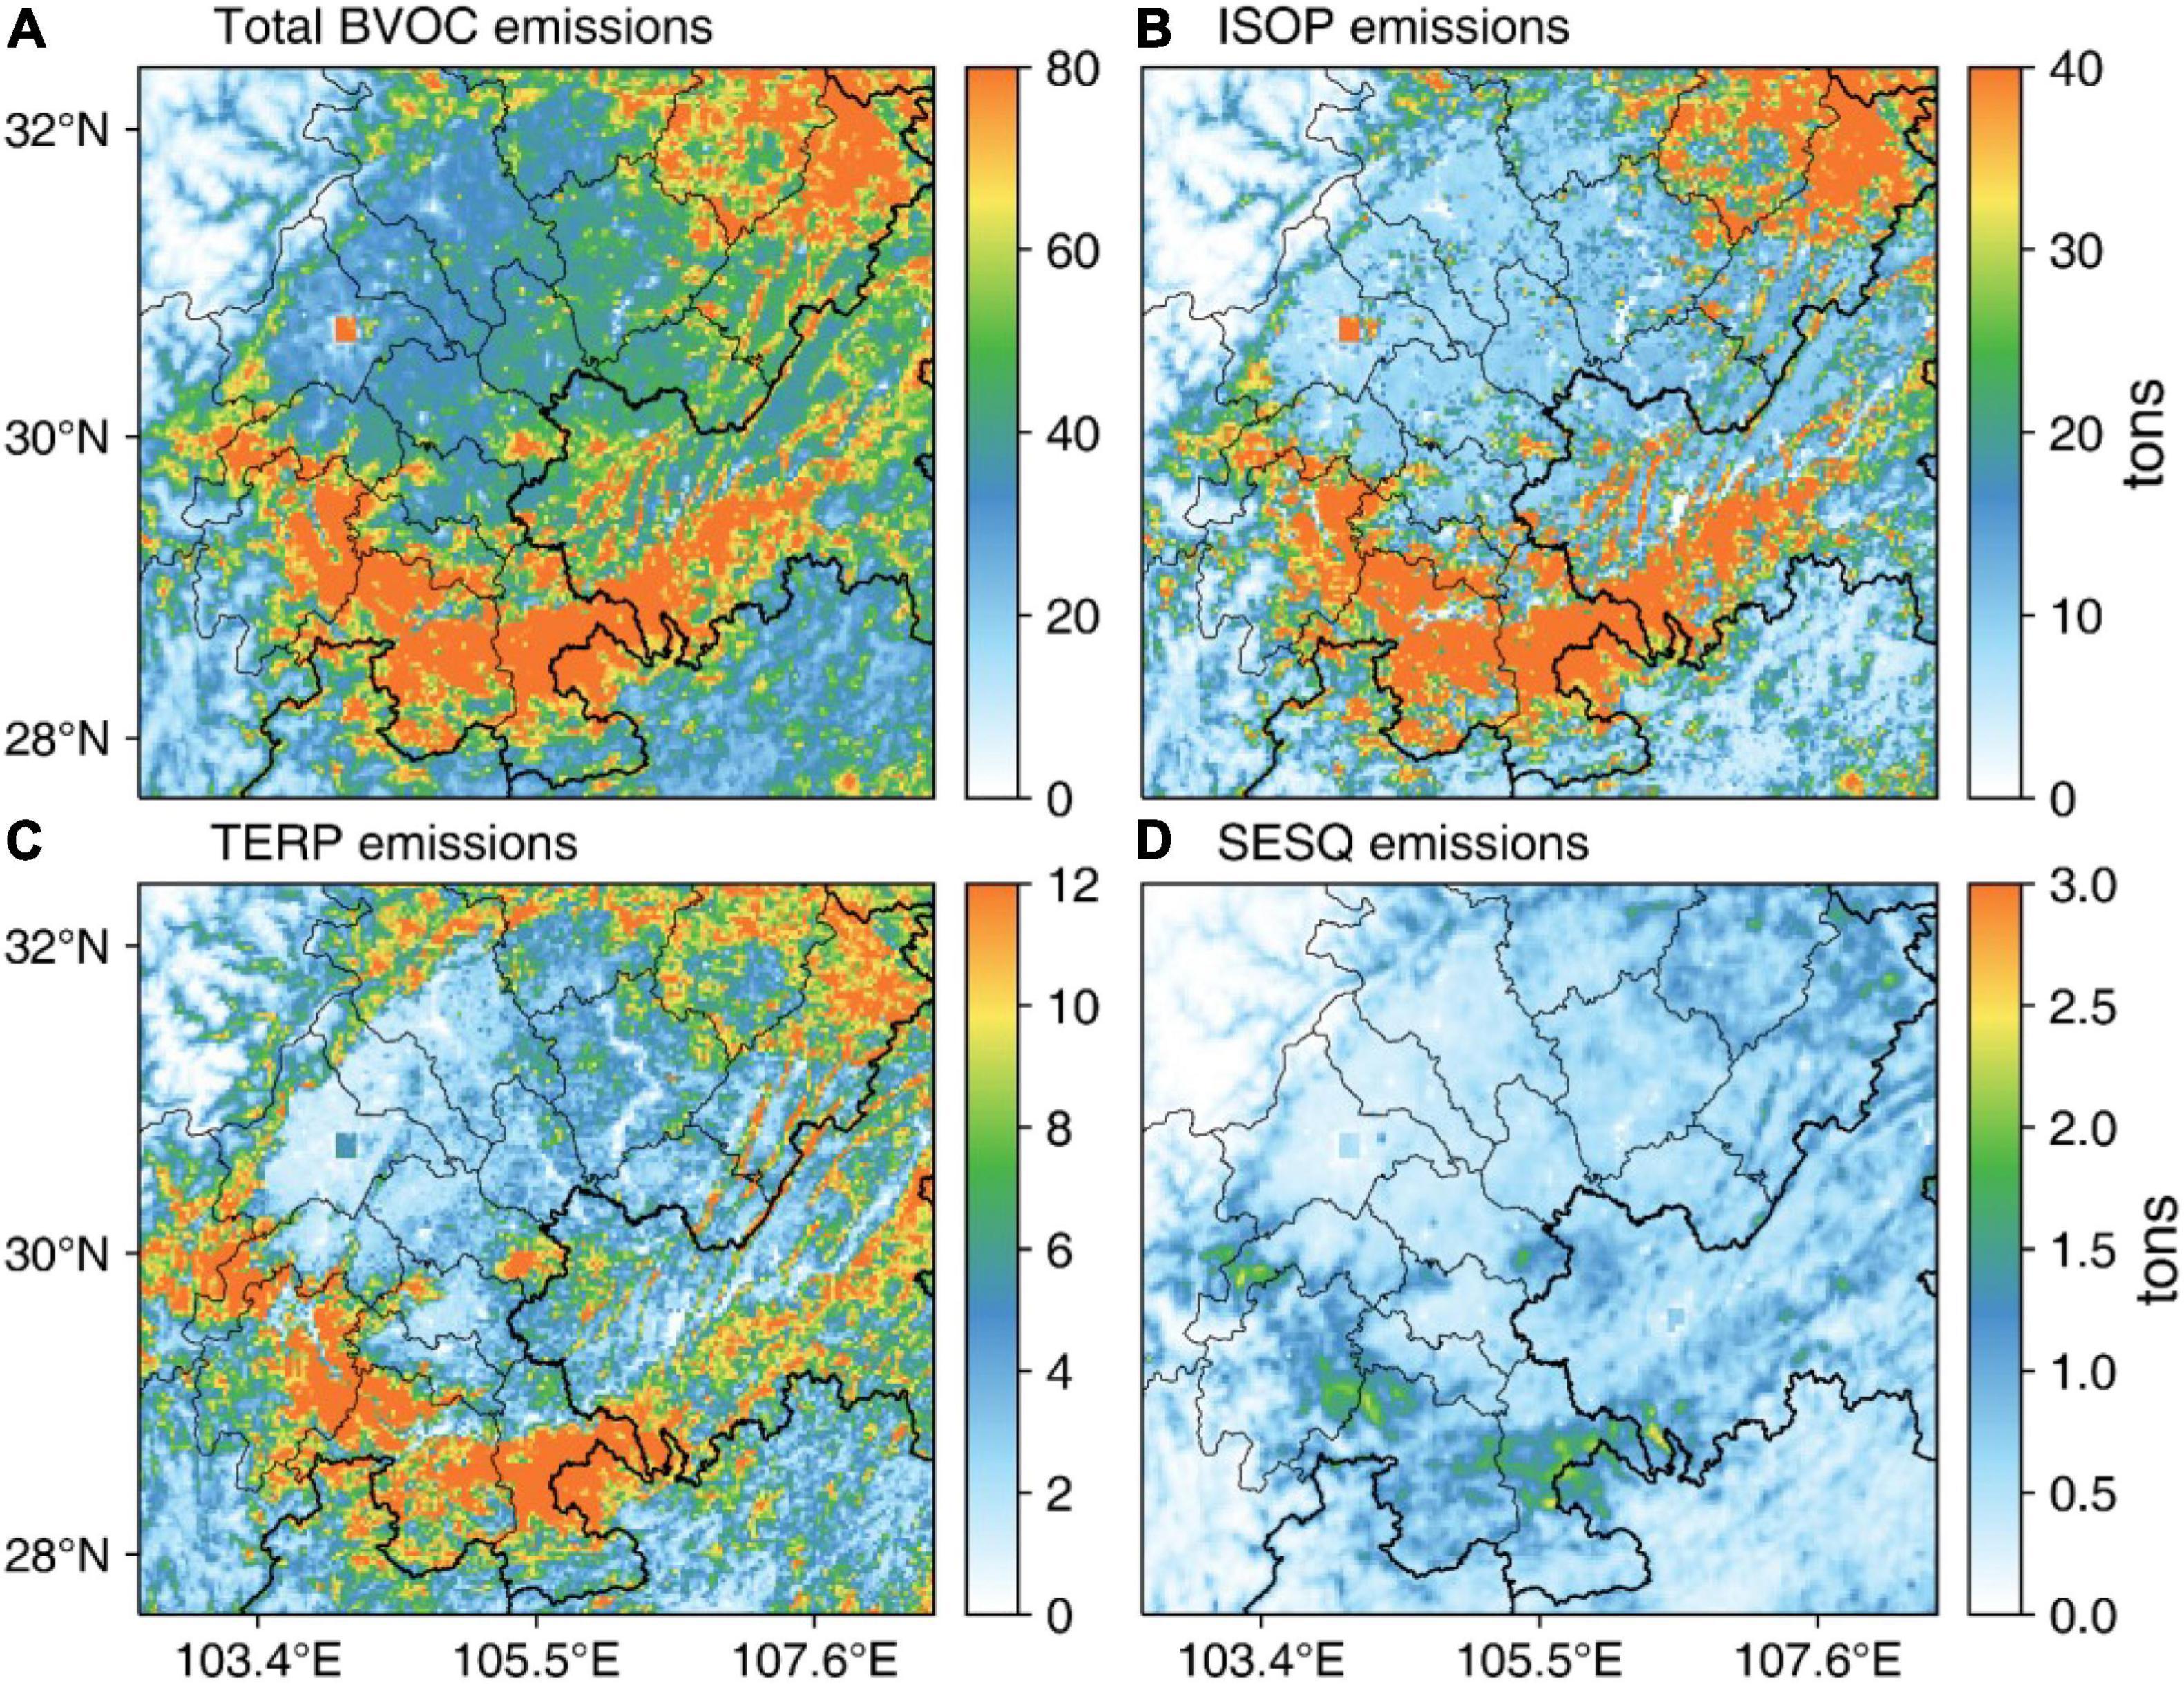
Figure 3. Annual emissions of total BVOC (A), isoprene (B), monoterpenes (C), and sesquiterpenes (D) for 2017 estimated by MEGAN2.1.
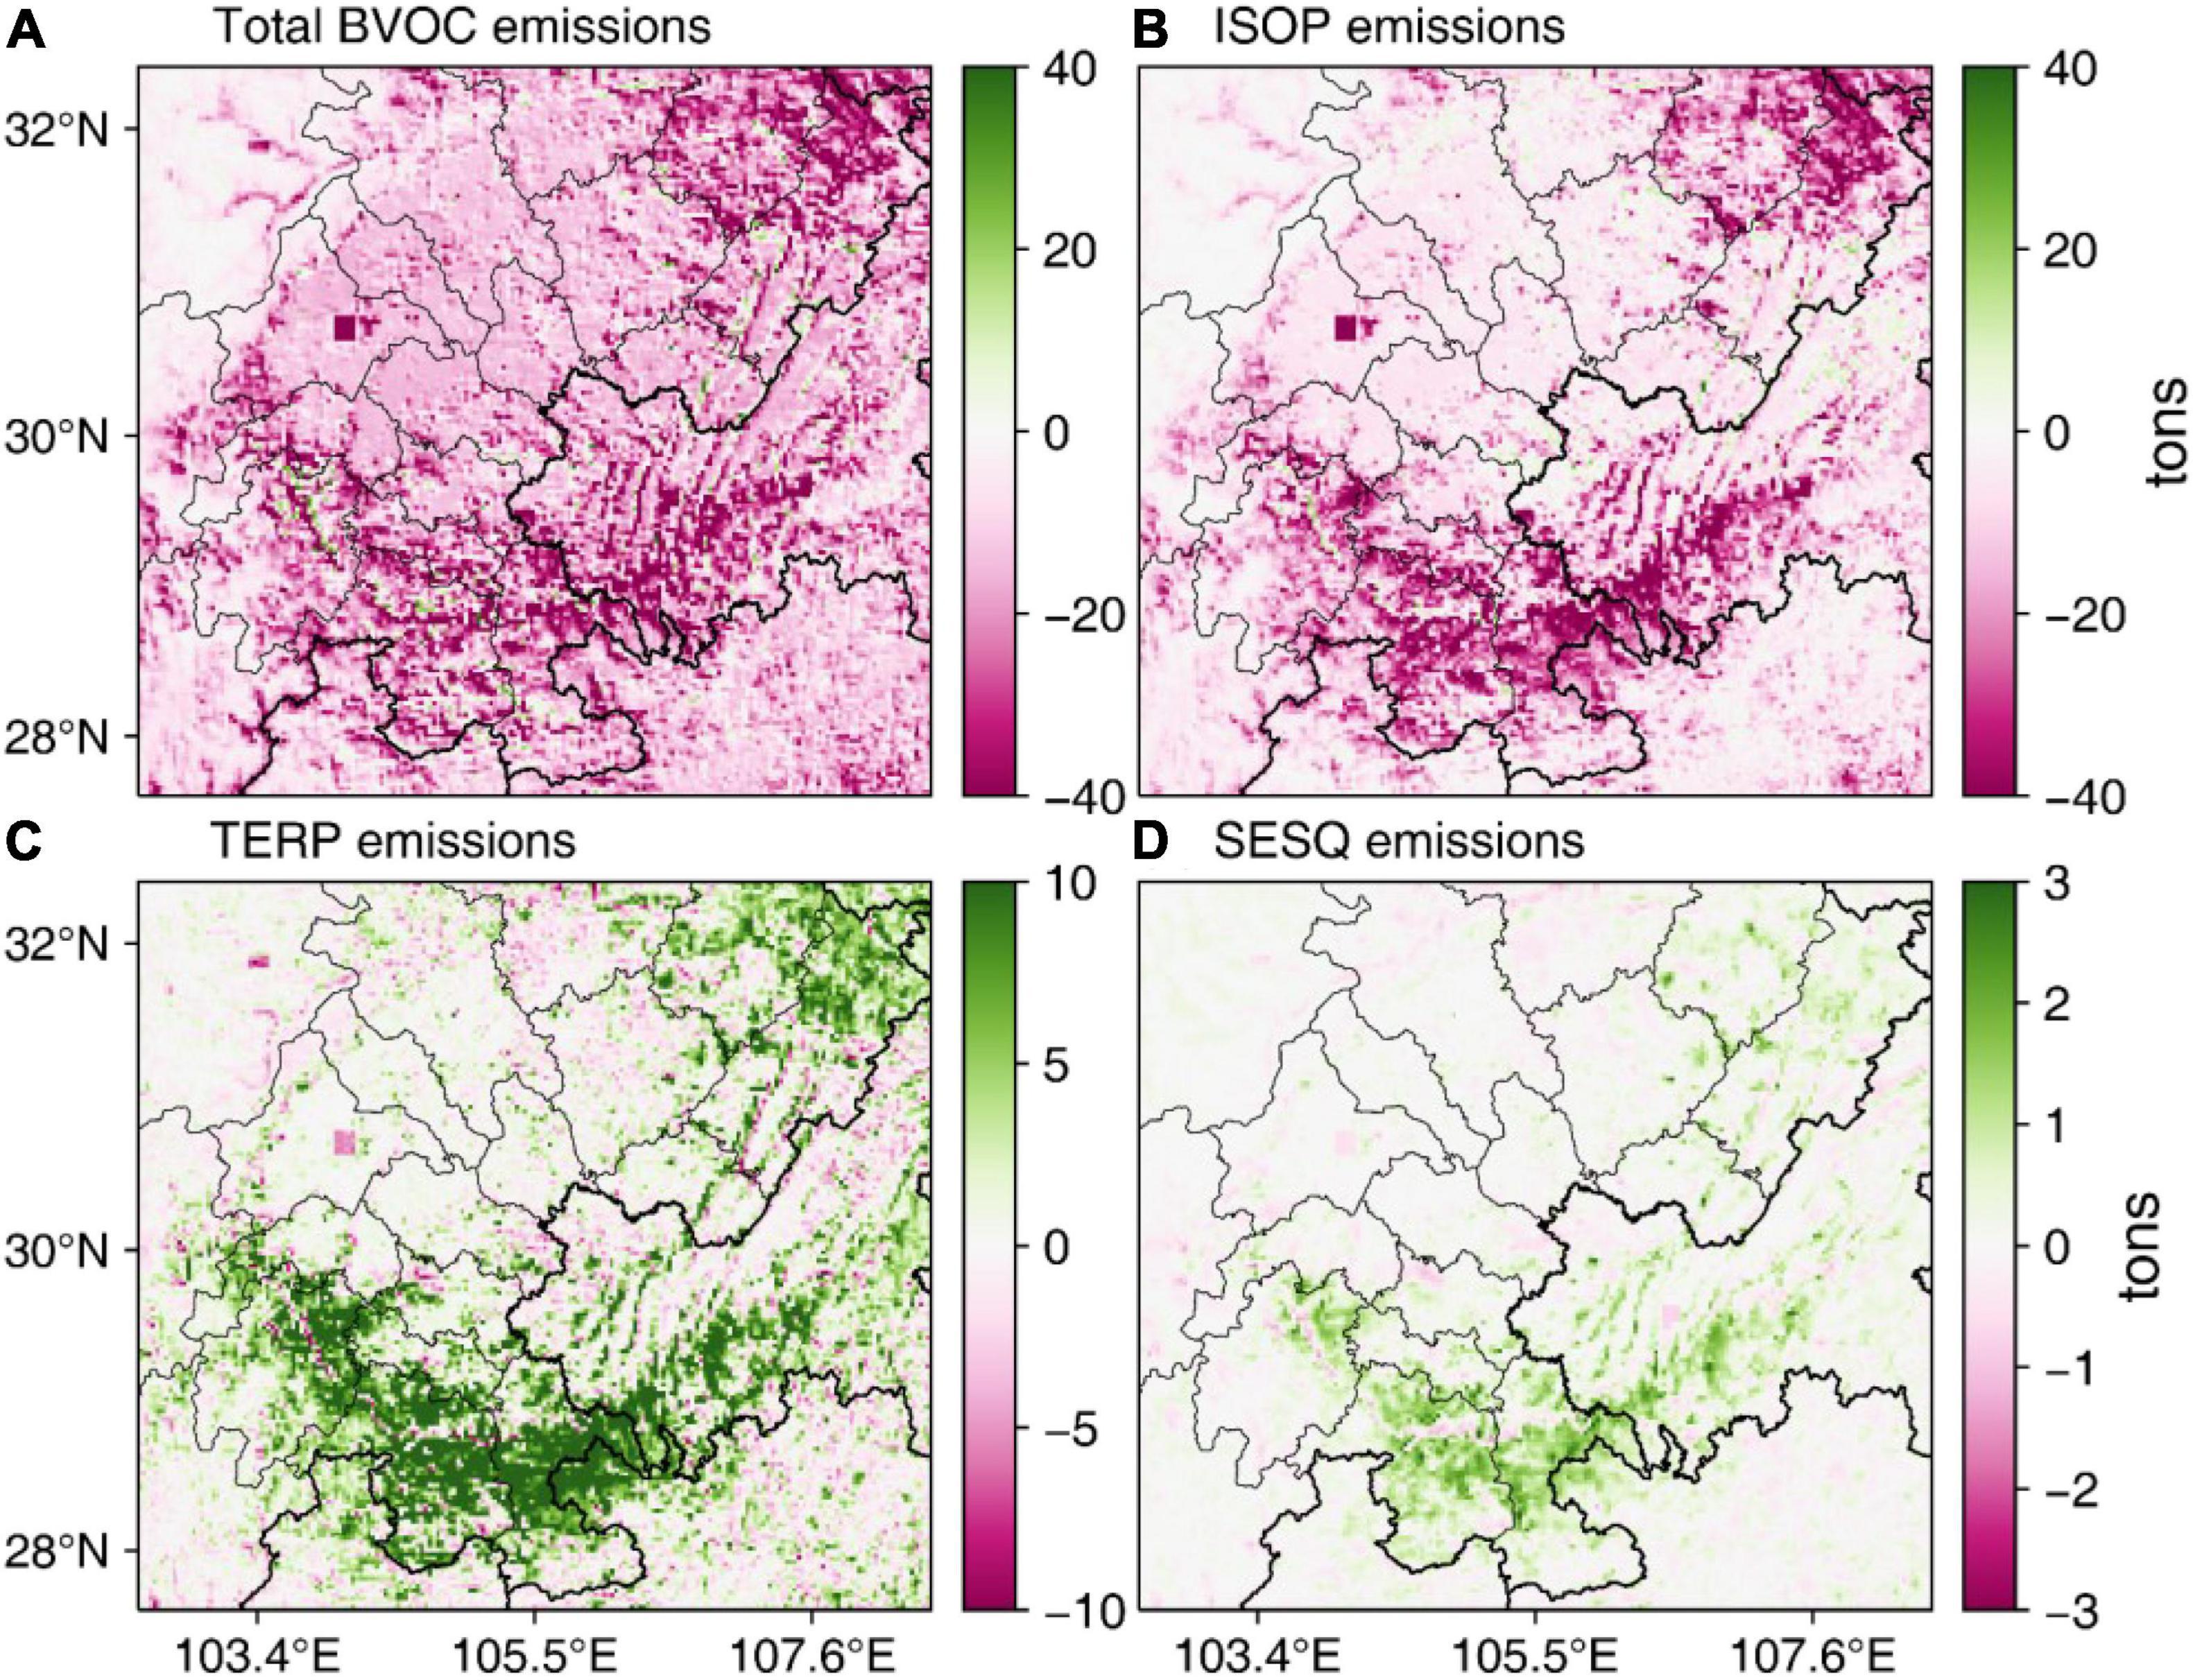
Figure 4. Differences of annual total BVOC, isoprene, monoterpene, and sesquiterpenes emissions between the MEGAN2.1 and MEGAN3.1.
Figure 5 depicts the seasonal distribution of BVOC emissions across the SCB for 2017. As ambient BVOCs are mainly emitted from vegetation, BVOC emissions have a seasonal pattern that is notably consistent with the period of plant growth and evolution. In summer, BVOC emissions generally reach their peak due to the hot and sunny weather conditions in combination with high values of LAI. Similarly, the warm meteorological conditions and moderate precipitation in spring both favor vegetation growth, resulting in high BVOC emissions that are only slightly lower than in summer. In contrast, plants enter the senescence period in autumn and LAI gradually decrease, causing BVOC emissions substantially decrease compared with spring and summer. Winter has the lowest BVOC emissions of the four seasons, owing to weakened plant evolution and a drop in temperature and sunlight.
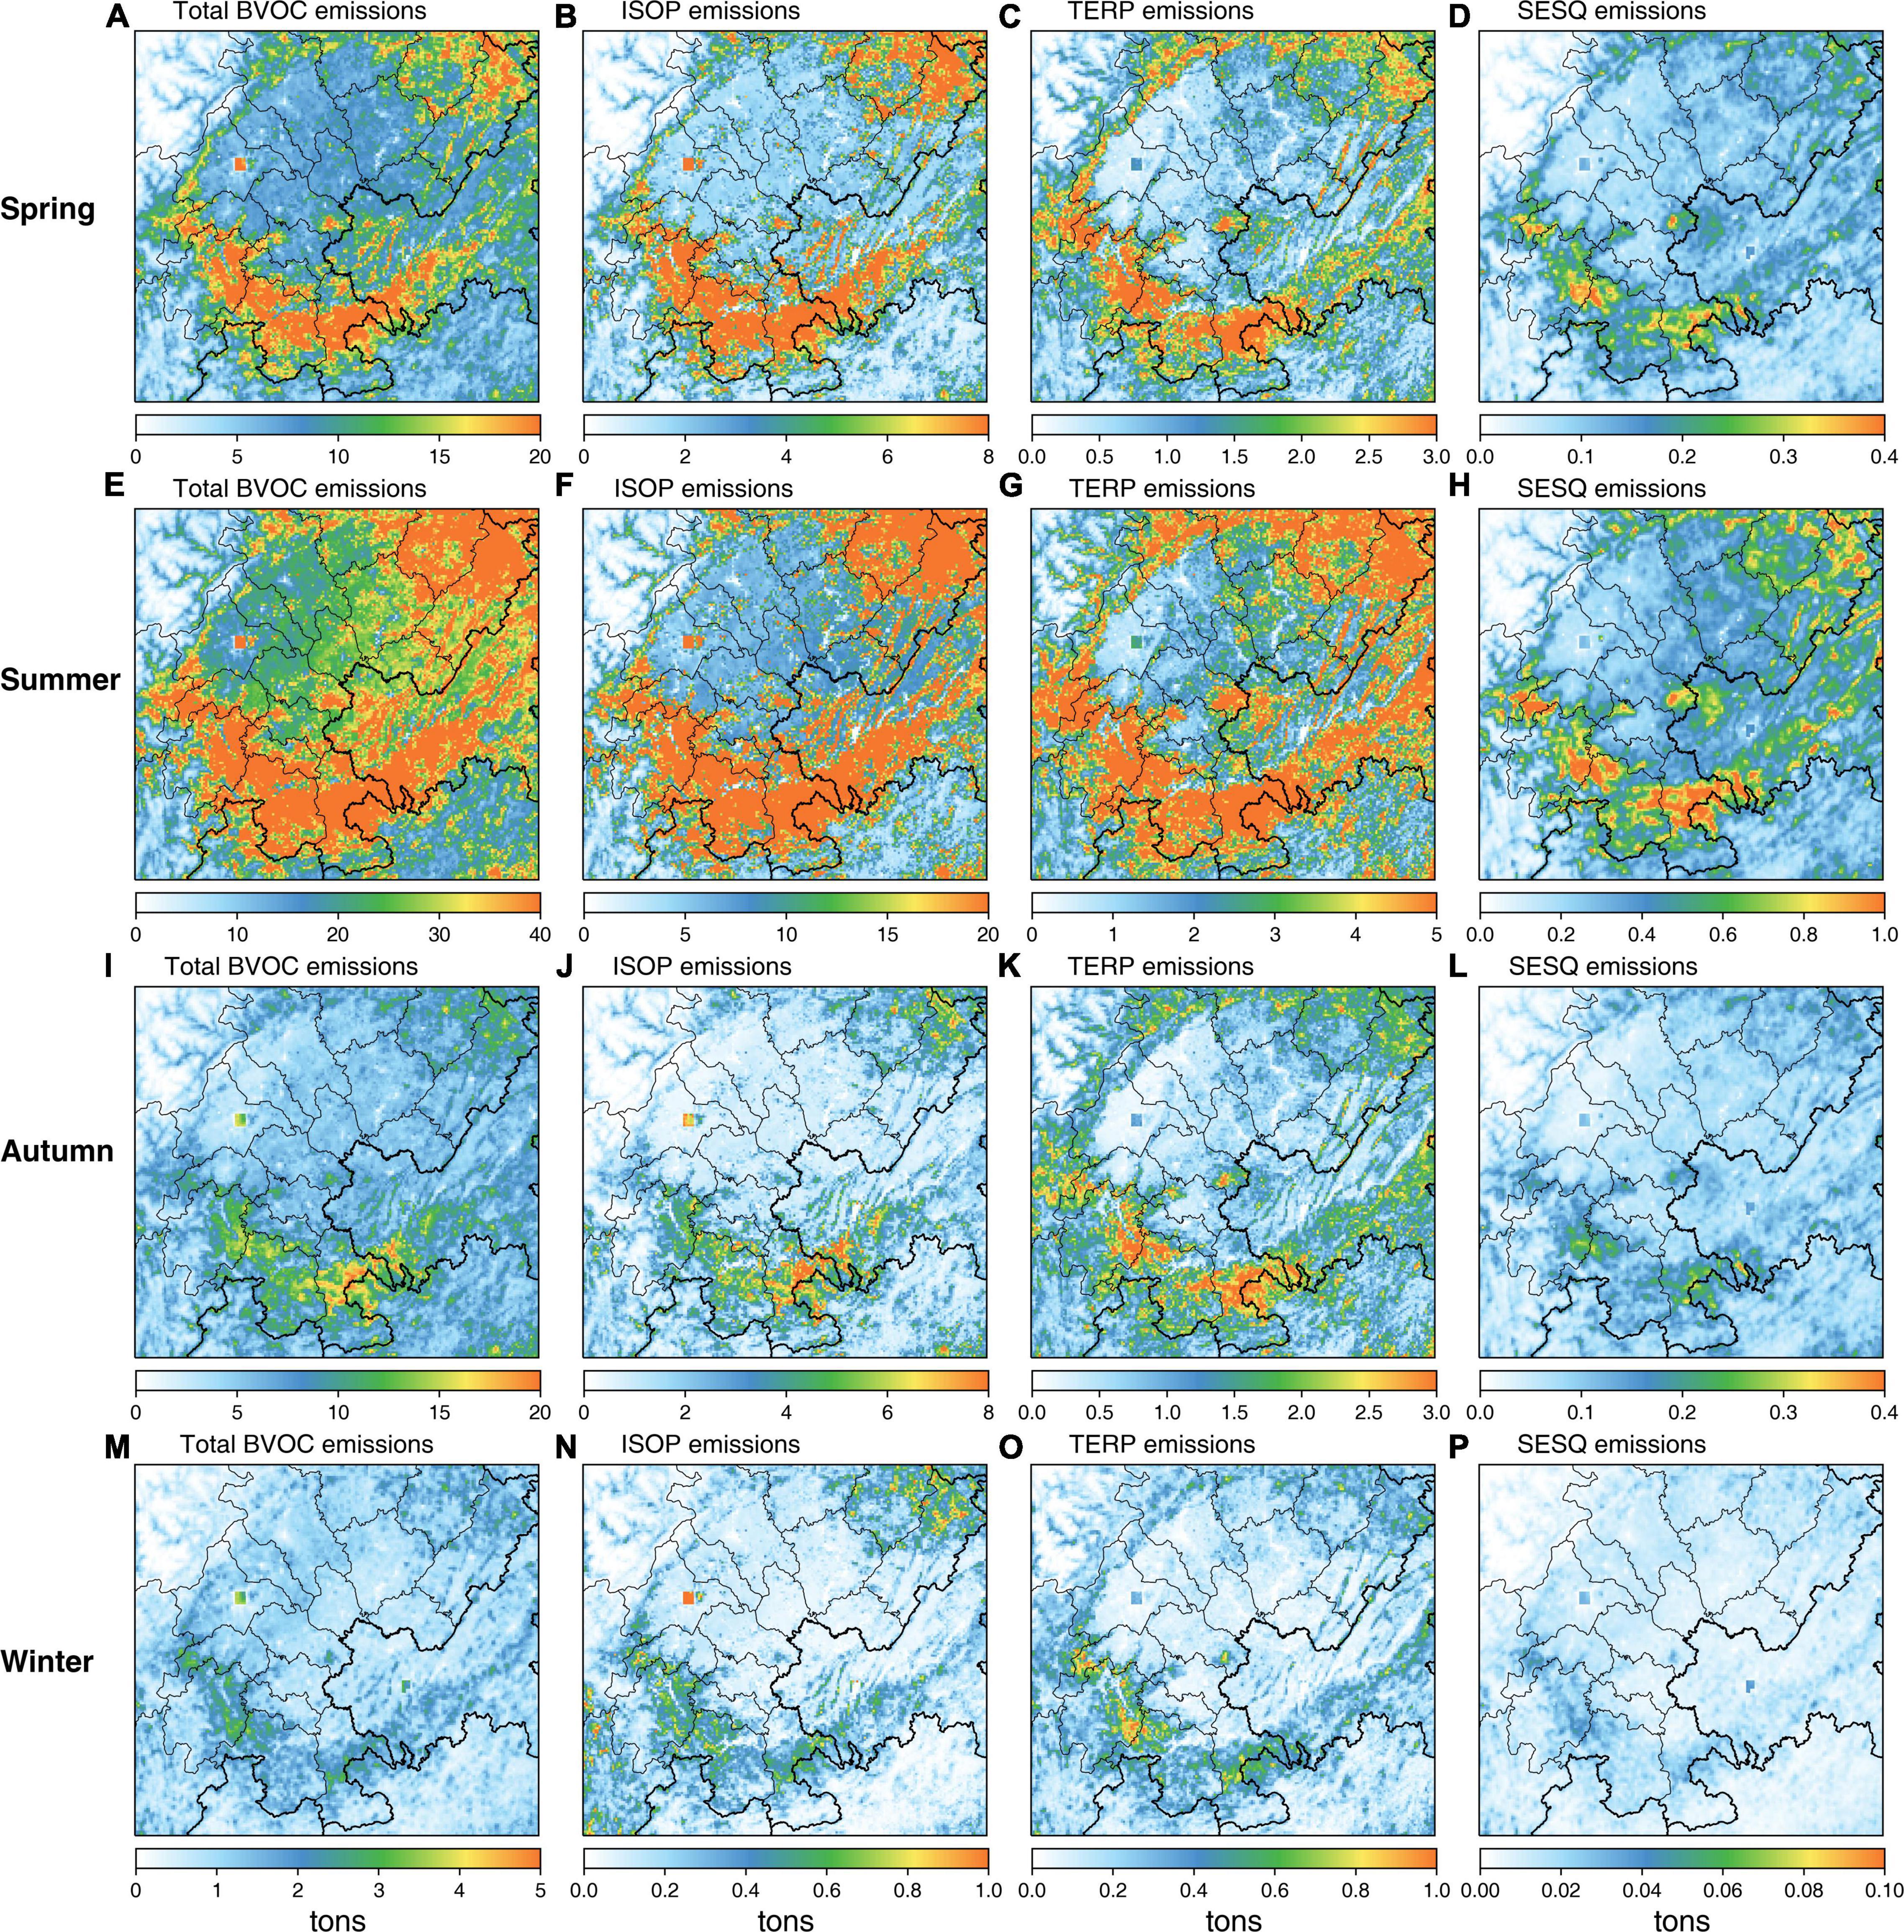
Figure 5. Seasonal emissions of total BVOC, isoprene (ISOP), monoterpenes (TERP), and sesquiterpenes (SESQ) over the SCB in 2017 estimated by MEGAN2.1.
Impact of Biogenic Volatile Organic Compounds Emission on Ozone Air Quality in the Sichuan Basin
Previous studies have suggested that severe O3 pollution over China in the year of 2017 is in large part due to protracted unfavorable meteorology (featured by hot and stagnant weather conditions) and climate-driven elevated BVOC emissions (Wu et al., 2020). In the summer of 2017, the SCB suffered profound heat waves that led to a substantial increase in O3 exceedances (Yang et al., 2020). Figure 6 presents the daily maximum hourly O3 concentration (DM1h O3) and daily maximum 8-h average O3 (MDA8 O3) concentrations in July 2017 for the SCB. The Chengdu Plain, the most densely populated area in SCB, exhibits the highest O3 levels in July (monthly average MDA8 O3 reaching 140 μg/m3). High levels of O3 are also found in southern SCB and metropolitan Chongqing where monthly average MDA8 O3 is higher than 120 μg/m3. For DM1h O3, the hotspots of O3 are much more clearly distinguishable, particularly featured by a broader region under high O3 exposure (DM1h O3 higher than 200 μg/m3).
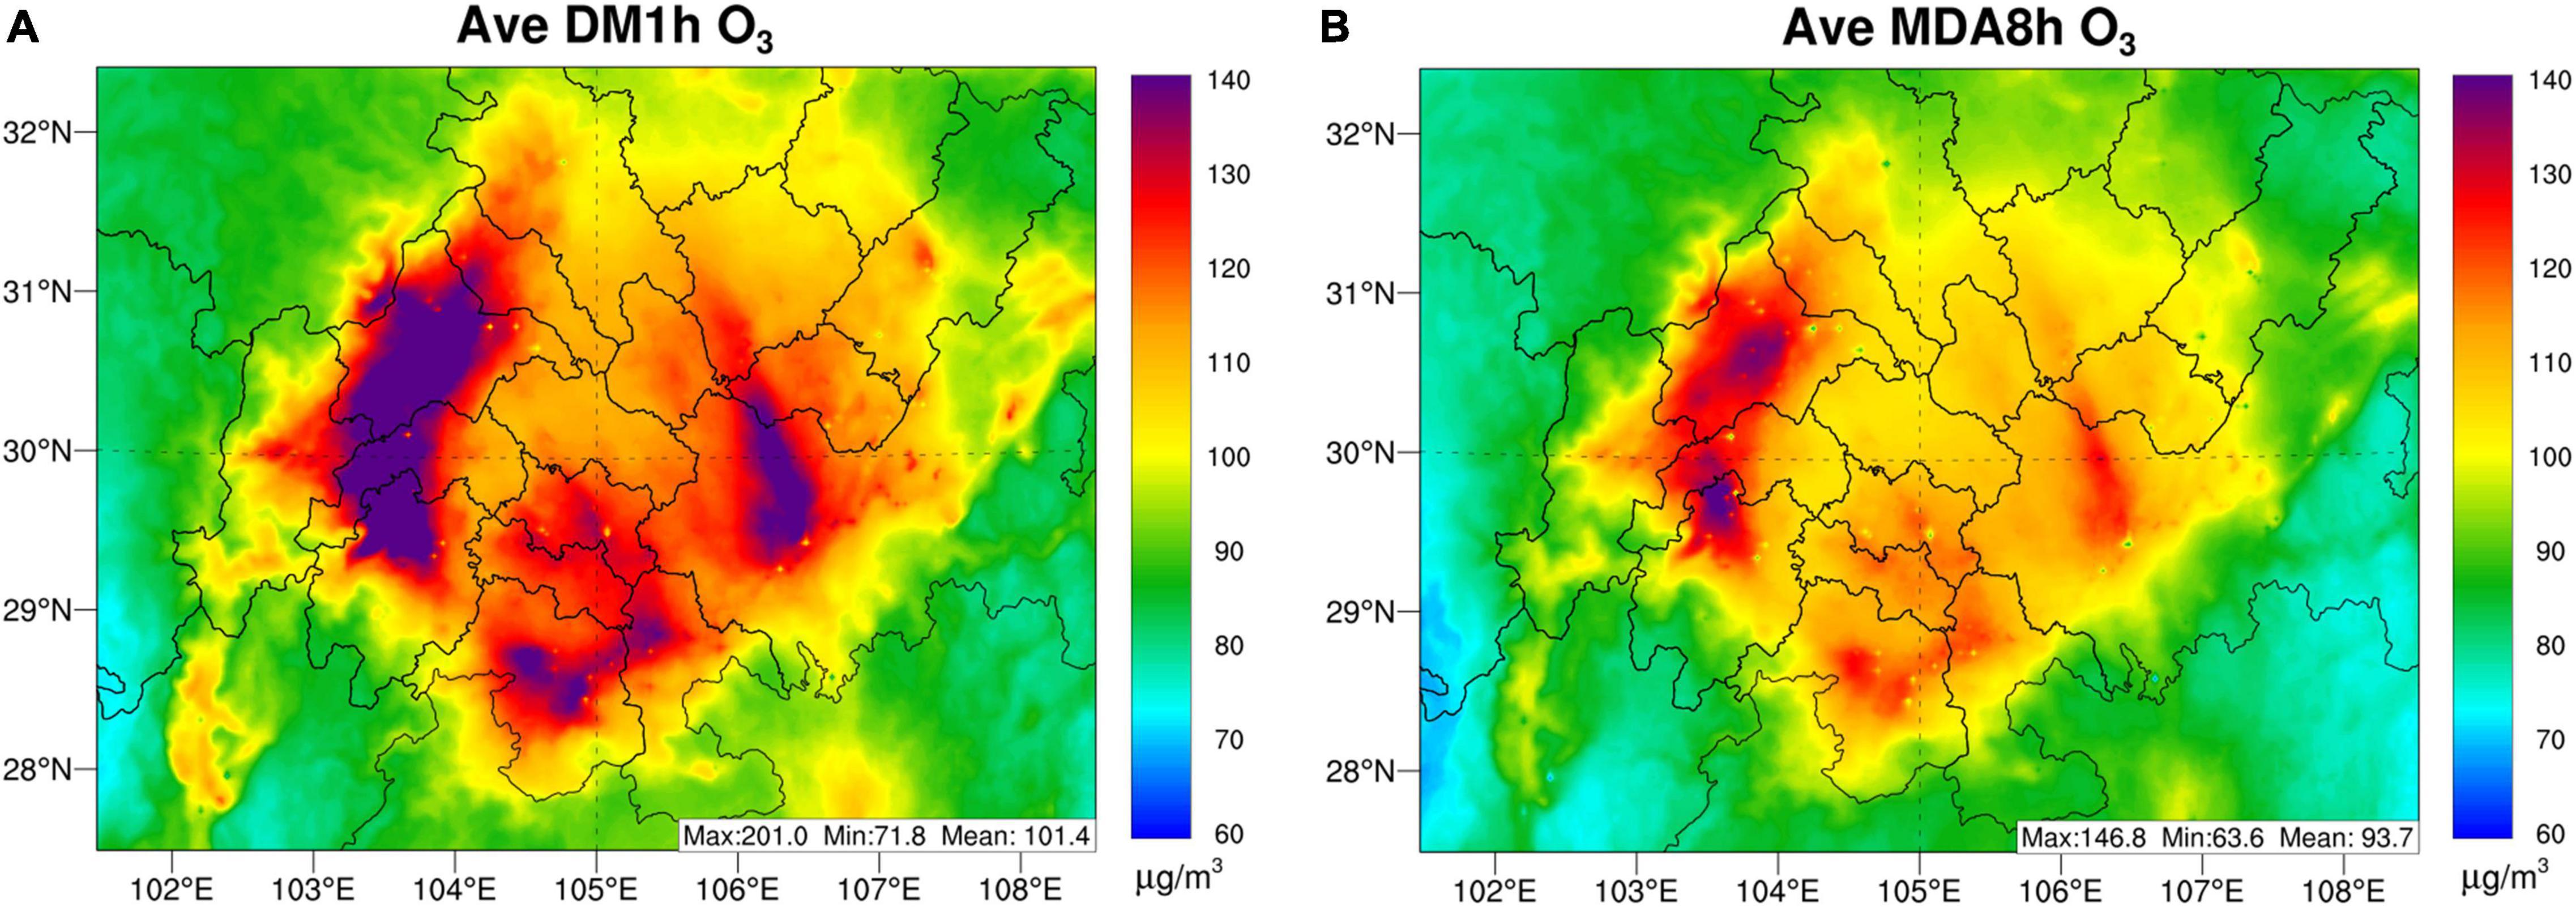
Figure 6. Spatial map of daily maximum hourly O3 concentrations (DM1h O3) and daily maximum 8-h average (MDA8) O3 concentrations in July 2017.
To examine the effects of BVOC on ambient O3 levels across the SCB, we calculated the difference in MDA8 O3 concentrations for July 2017 between the baseline scenario and the nobio scenario (as discussed in section “Model of Emissions of Gases and Aerosols From Nature Model”), as seen in Figure 7. The domain-averaged contribution of BVOC to O3 is found to be 5.6 μg/m3 for DM1h O3 and μ4.2 g/m3 for MDA8h O3, respectively. Spatially, the most prominent contribution of BVOC to ambient O3 was found in southern SCB (Yibin, Luzhou, and Zigong cities) where the amount of BVOC emissions is highest across the model domain, with DM1h O3 and MDA8h O3 over 15 μg/m3 and 11 μg/m3, respectively. In addition, BVOC emissions show a distinct role in O3 formation in Leshan and metropolitan Chongqing with a contribution ranged from 8 to 10 μg/m3. This phenomenon is broadly consistent with the spatial distribution of BVOC emissions (as seen in Figure 3), implying the significant influence of biogenic precursors on local photochemical reactions. Interestingly, while BVOC emissions in Chengdu are comparatively low, there is a considerable impact on DM1h O3 attributed to BVOCs in urban Chengdu. This behavior is largely due to regional transport of BVOC and its oxidation products under synoptic forcing that occurred in summer, which is coincident with findings reported by Tan et al. (2018) and Yang et al. (2020).
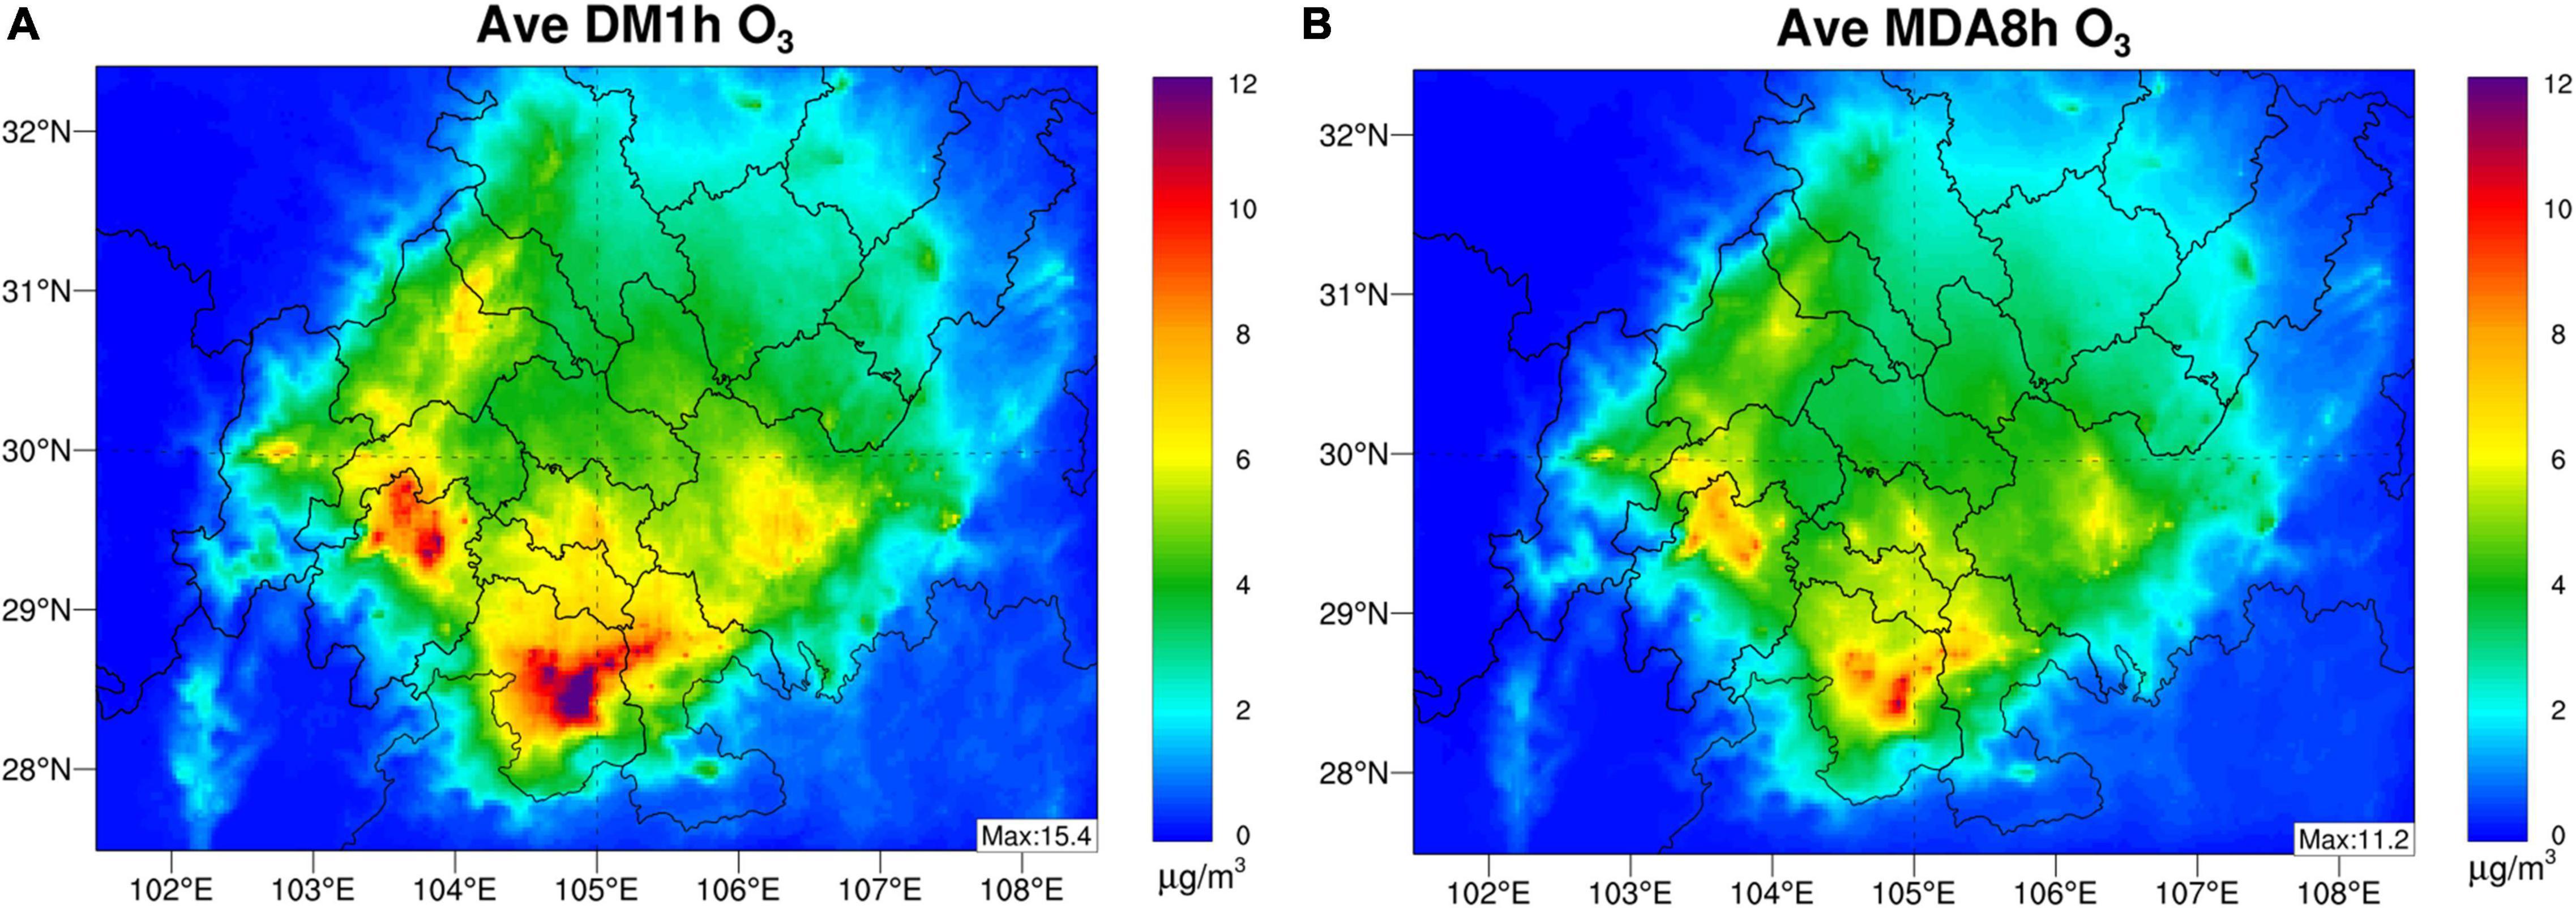
Figure 7. Contribution of BVOC emissions on monthly average daily maximum hourly O3 concentrations (DM1h O3) and daily maximum 8-h average (MDA8) O3 concentrations in July 2017.
Episode of Intense Biogenic Volatile Organic Compounds Emission Triggered O3 Pollution Over Sichuan Basin in July 2017
Although BVOC emissions are of minor importance for summertime mean O3 concentrations, they may act as the key modulating factor which affects the intensity and severity of O3 episodes with a far larger contribution than average values. To probe the effects of enhanced BVOC emissions on extreme O3 exceedance events over the SCB, the WRF-CMAQ model is used to simulate a basin-wide O3 episode over 5–14 July 2017. The O3 episode that took place on 8–13 July 2017 has turned out to be one of the most severe regional O3 events through the SCB in terms of affected area and severity (Yang et al., 2020). It is worth noting that this episode was featured by widely recorded O3 exceedance and extremely high O3 concentrations observed in Chengdu and Deyang cities, which even spiked to 389 and 317 μg/m3.
Figure 8 depicts the spatial pattern of BVOC contributions on MDA8 O3 levels over the period of the episode, where the effects is quantified as the difference between baseline minus nobio. At the initial stage of the episode (8 July), MDA8 O3 concentrations were comparatively low across the SCB and the effects of BVOCs were not significant, with basin-wide contribution of less than 6 μg/m3, suggesting minor effects of BVOC emissions on ambient O3 formation on clean days. On 9 July, the synoptic pattern characterized by a controlling high pressure system triggered a heat wave across the SCB, which caused O3 levels to slightly increase compared with 8th July. It can be clearly seen that there was a hotspot of BVOC contribution (higher than 20 μg/m3) situated on the southern SCB, corresponding to the O3 exceedance in in Meishan and Leshan cities. From 10 to 12 July, the heat wave further intensified, with daytime 2-m temperatures reported in most cities in excess of 36°C. In response to the prolonged heat wave and the unusual dry conditions, estimated BVOC emissions dramatically increased by 60% as compared with 8th July, and subsequently exhibited considerable contributions to elevated O3 concentrations over time, presenting a governing role in determining the distribution of O3. Spatially, the most prominent BVOC impacts (36.5 μg/m3) are found over the southern SCB, where BVOC emissions are most abundant throughout the model domain (as seen in Figure 2). In addition, BVOC emissions significantly contribute to the O3 formation over downwind regions, most notably in the Chengdu Plain with a maximum value reaching 31.2 μg/m3. This phenomenon mainly arises from intense local anthropogenic emissions there, which interact with BVOC and its oxidation products. Under the strong southeasterly wind fields, the outflow from the southern SCB and Chongqing city was transported along the Chengdu Plain, leading to BVOC and its oxidation products originating from upwind areas advected to the downwind regions and reacted alongside the pathway, thus significantly enhancing regional MDA8 O3 reaching 220 μg/m3 in the Chengdu Plain. In contrast, the impacts of BVOC emissions on O3 formation are comparatively low over the northeastern SCB (less than 6 μg/m3) due to relatively low levels of anthropogenic emissions. On 13 July, the basin-wide wind speed slightly decreased and stagnant conditions dominated the Chengdu Plain, leading to a smaller magnitude of BVOC contribution on O3 and making the net effects of BVOC emissions largely limited on a local scale.
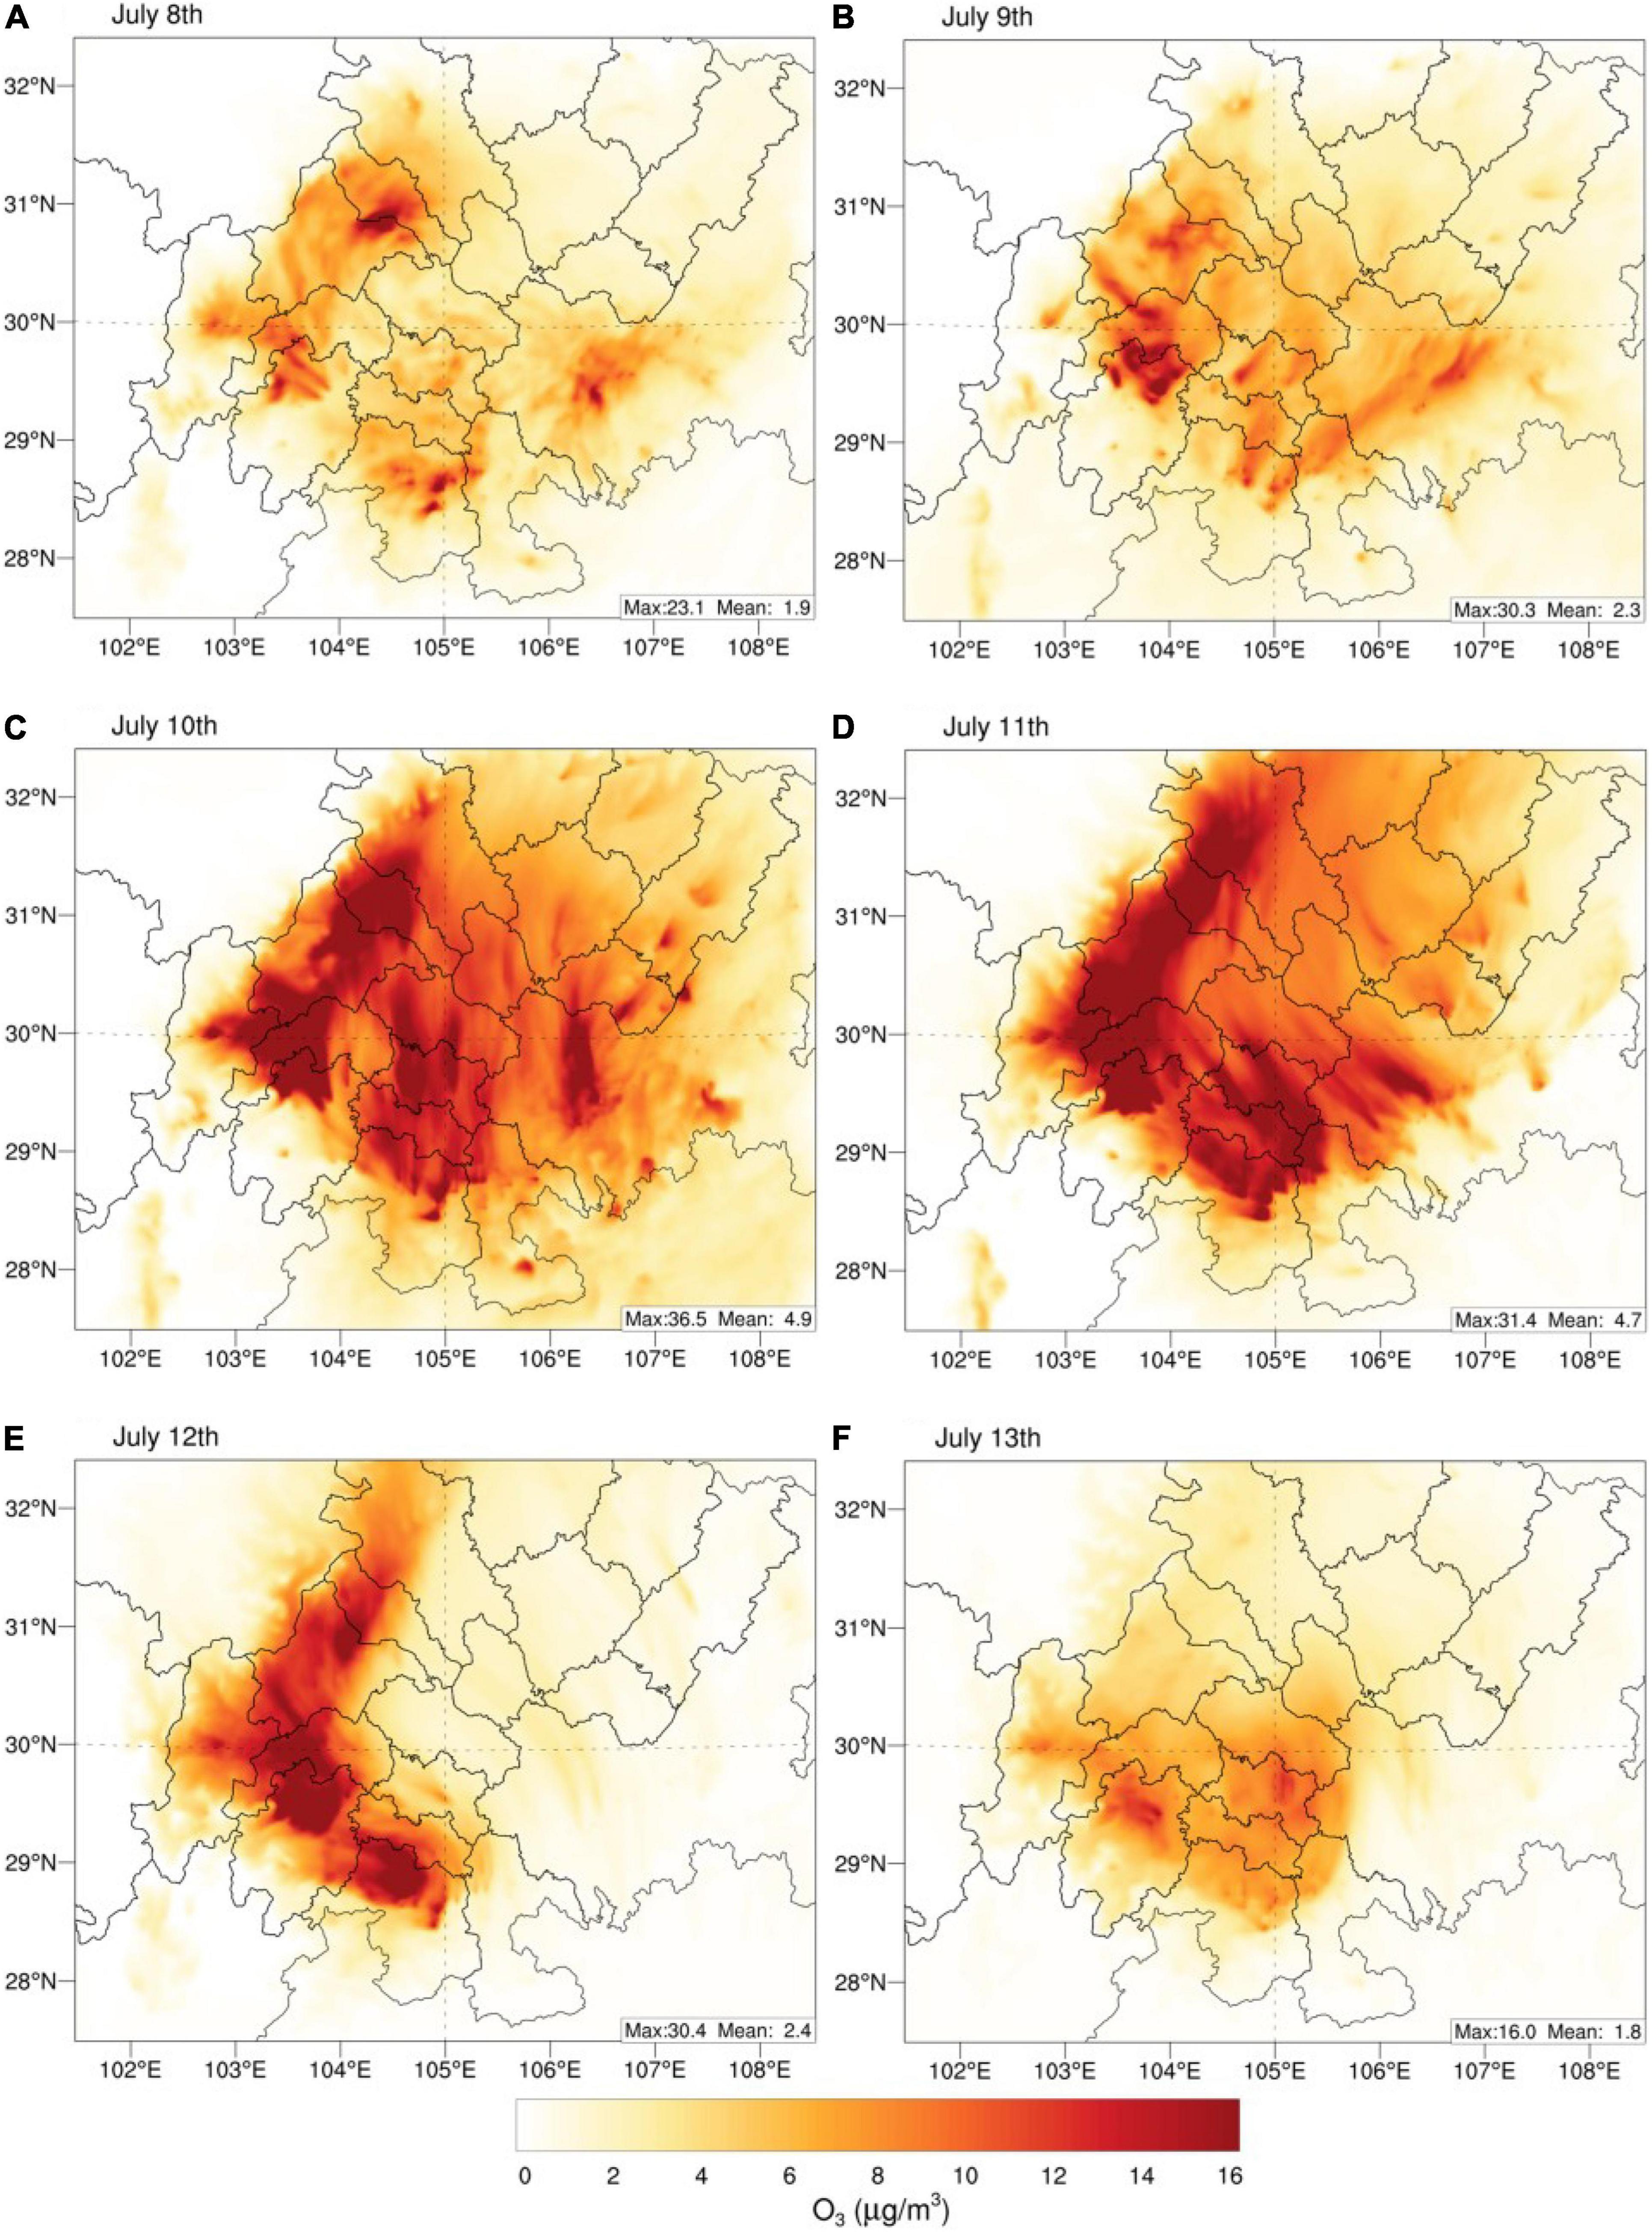
Figure 8. Impacts of BVOC emissions on MDA8 O3 concentrations (i.e., baseline minus nobio) simulated by CMAQ model over SCB during 8–13 July in 2017.
Figure 9 presents the diurnal pattern of O3 levels in Chengdu city during the extreme O3 episode and July. From a monthly perspective, O3 concentrations peak in the afternoon, and MDA8 O3 generally corresponds to 1,200–1,900 LST. O3 levels decreased rapidly after 2,000 LST due to declining air temperature and a lack of solar radiation. In contrast, O3 concentrations showed a distinctly different diurnal pattern during the severe O3 episode that elevated O3 levels persisted through 1,200–2,000 LST and exhibited an explosive increase with the magnitude of peak O3 levels greatly enhanced, indicating that the importance of BVOC emissions increases dramatically on hot summer afternoons, coincident with periods of peak photochemical activity. This observation evidence further demonstrates that the regional transport of BVOCs and their oxidation products modulates the urban atmospheric chemistry with intensified photochemical reactions.
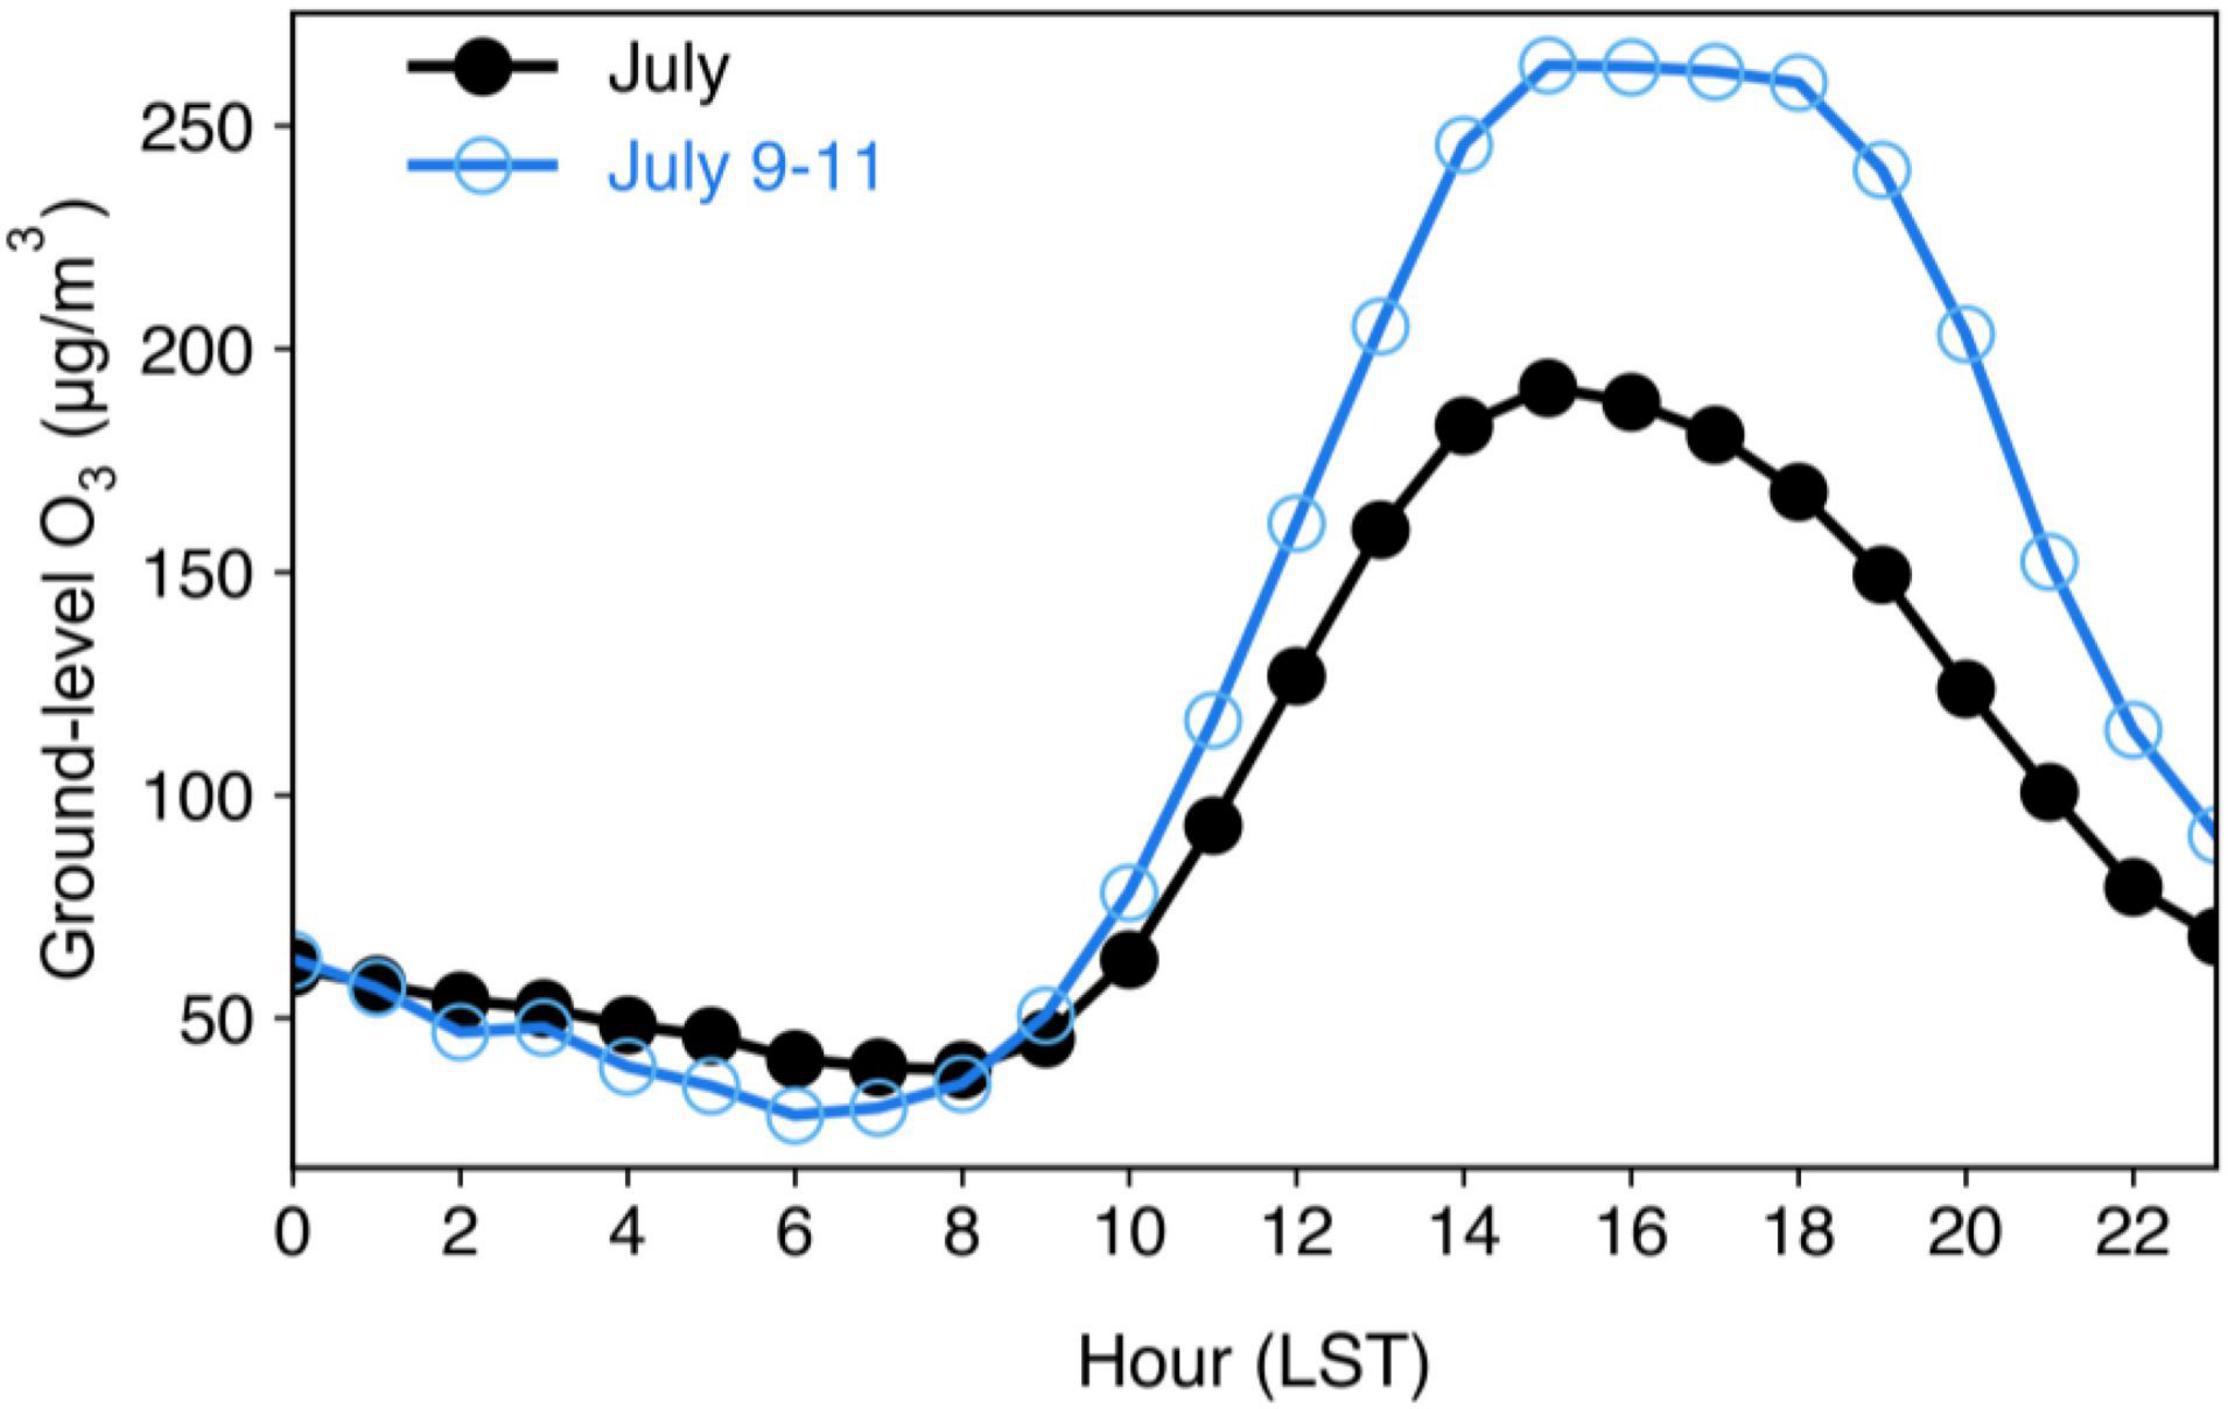
Figure 9. Diurnal pattern of ground-level O3 concentrations observed from CNEMC network in Chengdu.
Conclusion
In this study, we adopted the MEGANv2.1 and MEGANv3.1 models for estimating the BVOC emissions across the SCB for 2017 and distinguished the critical role of BVOC on summer O3 levels and the formation of region-wide O3 episodes through WRF-CMAQ modeling. The annual BVOC emissions over the SCB were estimated to be at 1.8 × 10⁶ tons and 1.2 × 10⁶ tons by MEGANv2.1 and MEGANv3.1, respectively. The incorporation of environmental stress parameterizations and the J-rating scheme in MEGANv3.1 exert a profound influence on the estimated BVOC budget, featured by reduced isoprene emissions and enhanced monoterpene emissions. The spatial pattern of BVOC emissions is largely determined by local vegetation cover and climate conditions. Intense BVOC emissions are mainly found over southern SCB and Chongqing city, while BVOC emissions in the Chengdu Plain and northeastern SCB are comparatively low.
Results of CMAQ model simulations indicate that BVOC contribute considerably to monthly average DM1h O3 (maximum 10%) and MDA8 O3 (maximum 8%) with most prominent impacts on regions with high BVOC emission intensity. Episodic assessment demonstrates that the magnitude of BVOC effects on MDA8 O3 could be substantially enhanced due to the elevated BVOCs emitted by vegetation in response to profound heat waves, subsequently contributing to a basin-wide O3 episode with a peak contribution of 36.5 μg/m3. Furthermore, the prevailing wind fields may amplify the effects of BVOC over downwind areas (Chengdu Plain) via BVOC transport and advection, modulating and facilitating the spike in O3 levels.
The findings of this work provide a quantitative estimation for the SCB and emphasize the importance of biogenic precursors on ambient O3 formation and region-wide O3 episodes. Given the rapidly expanding urban green spaces, BVOC emissions are expected to substantially increase under a warming climate. However, existing O3 mitigation strategies have mainly focused on anthropogenic VOCs and largely neglected these biogenic compounds, so the effectiveness of regulation measures based on cutting anthropogenic VOCs may be overestimated.
Data Availability Statement
The raw data supporting the conclusions of this article will be made available by the authors, without undue reservation.
Author Contributions
SZ designed this work and wrote the original draft. YQL, XY, YW, LY, and LW conducted formal analysis and edited the manuscript. YW, YXL, and YQ contributed to the methodology and software. SW supervised this work and provided project administration. All authors contributed to the manuscript and approved the submission.
Funding
This work was funded by the National Natural Science Foundation of China (Nos. 42175174 and 42005072), the Project (No. PAEKL-2020-C6) supported by the Open Research Fund Program of the Plateau Atmosphere and Environment Key Laboratory of Sichuan Province, and the Scientific Research Foundation of the Chengdu University of Information Technology (No. KYTZ201823).
Conflict of Interest
The authors declare that the research was conducted in the absence of any commercial or financial relationships that could be construed as a potential conflict of interest.
Publisher’s Note
All claims expressed in this article are solely those of the authors and do not necessarily represent those of their affiliated organizations, or those of the publisher, the editors and the reviewers. Any product that may be evaluated in this article, or claim that may be made by its manufacturer, is not guaranteed or endorsed by the publisher.
Acknowledgments
We acknowledge the MEIC team at Tsinghua University for providing the multiscale emission inventory of China. We would like to thank the Chengdu Plain Urban Meteorology and Environment Observation and Research Station of Sichuan Province for ambient monitoring data.
Footnotes
References
Alonzo, M., Bookhagen, B., McFadden, J. P., Sun, A., and Roberts, D. A. (2015). Mapping urban forest leaf area index with airborne lidar using penetration metrics and allometry. Remote Sens. Environ. 162, 141–153. doi: 10.1016/j.rse.2015.02.025
Appel, K. W., Bash, J. O., Fahey, K. M., Foley, K. M., Gilliam, R. C., Hogrefe, C., et al. (2021). The community multiscale air quality (CMAQ) model versions 5.3 and 5.3.1: system updates and evaluation. Geosci. Model Dev. 14, 2867–2897. doi: 10.5194/gmd-14-2867-2021
Carlton, A. G., and Baker, K. R. (2011). Photochemical modeling of the ozark isoprene volcano: megan, beis, and their impacts on air quality predictions. Environ. Sci. Technol. 45, 4438–4445. doi: 10.1021/es200050x
Carlton, A. G., Pinder, R. W., Bhave, P. V., and Pouliot, G. A. (2010). To what extent can biogenic SOA be controlled? Environ. Sci. Technol. 44, 3376–3380. doi: 10.1021/es903506b
Churkina, G., Kuik, F., Bonn, B., Lauer, A., Grote, R., Tomiak, K., et al. (2017). Effect of VOC emissions from vegetation on air quality in Berlin during a heatwave. Environ. Sci. Technol. 51, 6120–6130. doi: 10.1021/acs.est.6b06514
Connop, S., Vandergert, P., Eisenberg, B., Collier, M. J., Nash, C., Clough, J., et al. (2016). Renaturing cities using a regionally-focused biodiversity-led multifunctional benefits approach to urban green infrastructure. Environ. Sci. Policy 62, 99–111. doi: 10.1016/j.envsci.2016.01.013
Demetillo, M. A. G., Anderson, J. F., Geddes, J. A., Yang, X., Najacht, E. Y., Herrera, S. A., et al. (2019). Observing severe drought influences on ozone air pollution in California. Environ. Sci. Technol. 53, 4695–4706. doi: 10.1021/acs.est.8b04852
Ghirardo, A., Xie, J., Zheng, X., Wang, Y., Grote, R., Block, K., et al. (2016). Urban stress-induced biogenic VOC emissions and SOA-forming potentials in Beijing. Atmos. Chem. Phys. 16, 2901–2920. doi: 10.5194/acp-16-2901-2016
Gu, S., Guenther, A., and Faiola, C. (2021). Effects of anthropogenic and biogenic volatile organic compounds on Los Angeles air quality. Environ. Sci. Technol. 55, 12191–12201. doi: 10.1021/acs.est.1c01481
Guenther, A. B., Jiang, X., Heald, C. L., Sakulyanontvittaya, T., Duhl, T., Emmons, L. K., et al. (2012). The model of emissions of gases and aerosols from nature version 2.1 (MEGAN2.1): an extended and updated framework for modeling biogenic emissions. Geosci. Model Dev. 5, 1471–1492. doi: 10.5194/gmd-5-1471-2012
Guenther, A., Tejas, S., Huang, L., Wentland, A., Jung, J., Beardsley, R., et al. (2017). “A Next Generation Modelling System for Estimating Texas Biogenic VOC Emissions,” in Project Report of Texas Commission on Environmental Quality, (Austin: University of Texas).
Jeon, W.-B., Lee, S.-H., Lee, H., Park, C., Kim, D.-H., and Park, S.-Y. (2014). A study on high ozone formation mechanism associated with change of NOx/VOCs ratio at a rural area in the Korean Peninsula. Atmos. Environ. 89, 10–21. doi: 10.1016/j.atmosenv.2014.02.005
Jiang, X., Guenther, A., Potosnak, M., Geron, C., Seco, R., Karl, T., et al. (2018). Isoprene emission response to drought and the impact on global atmospheric chemistry. Atmos. Environ. 183, 69–83. doi: 10.1016/j.atmosenv.2018.01.026
Li, M., Huang, X., Li, J., and Song, Y. (2012). Estimation of biogenic volatile organic compound (BVOC) emissions from the terrestrial ecosystem in China using real-time remote sensing data. Atmos. Chem. Phys. Discuss. 12, 6551–6592. doi: 10.5194/acpd-12-6551-2012
Liu, Y., and Wang, T. (2020). Worsening urban ozone pollution in China from 2013 to 2017 – Part 1: the complex and varying roles of meteorology. Atmos. Chem.Phys. 20, 6305–6321. doi: 10.5194/acp-20-6305-2020
Ma, M., Gao, Y., Wang, Y., Zhang, S., Leung, L. R., Liu, C., et al. (2019). Substantial ozone enhancement over the North China Plain from increased biogenic emissions due to heat waves and land cover in summer 2017. Atmos. Chem. Phys. 19, 12195–12207. doi: 10.5194/acp-19-12195-2019
Messina, P., Lathière, J., Sindelarova, K., Vuichard, N., Granier, C., Ghattas, J., et al. (2016). Global biogenic volatile organic compound emissions in the ORCHIDEE and MEGAN models and sensitivity to key parameters. Atmos. Chemis.Phys. 16, 14169–14202. doi: 10.5194/acp-16-14169-2016
Peñuelas, J., and Staudt, M. (2010). BVOCs and global change. Trends Plant Sci. 15, 133–144. doi: 10.1016/j.tplants.2009.12.005
Pye, H. O. T., Murphy, B. N., Xu, L., Ng, N. L., Carlton, A. G., Guo, H., et al. (2017). On the implications of aerosol liquid water and phase separation for organic aerosol mass. Atmos. Chem. Phys. 17, 343–369. doi: 10.5194/acp-17-343-2017
Ren, Y., Qu, Z., Du, Y., Xu, R., Ma, D., Yang, G., et al. (2017). Air quality and health effects of biogenic volatile organic compounds emissions from urban green spaces and the mitigation strategies. Environ. Pollut. 230, 849–861. doi: 10.1016/j.envpol.2017.06.049
Shrivastava, M., Cappa, C. D., Fan, J., Goldstein, A. H., Guenther, A. B., Jimenez, J. L., et al. (2017). Recent advances in understanding secondary organic aerosol: implications for global climate forcing. Rev. Geophys. 55, 509–559. doi: 10.1002/2016RG000540
Tan, Z., Lu, K., Jiang, M., Su, R., Dong, H., Zeng, L., et al. (2018). Exploring ozone pollution in Chengdu, southwestern China: a case study from radical chemistry to O3-VOC-NOx sensitivity. Sci. Total Environ. 636, 775–786. doi: 10.1016/j.scitotenv.2018.04.286
Unger, N. (2014). On the role of plant volatiles in anthropogenic global climate change. Geophys. Res. Lett. 41, 8563–8569. doi: 10.1002/2014GL061616
Wang, H., Wu, K., Liu, Y., Sheng, B., Lu, X., He, Y., et al. (2021). Role of heat wave-induced biogenic VOC enhancements in persistent ozone episodes formation in pearl river delta. J. Geophys. Res. Atmos. 126. doi: 10.1029/2020JD034317
Wang, Y., Yang, X., Wu, K., Mei, H., Lu, Y., Smedt, I. D., et al. (2022). Long-term trends of ozone and precursors from 2013 to 2020 in a megacity (Chengdu), China: evidence of changing emissions and chemistry. Atmos. Res.
Wu, K., Kang, P., Tie, X., Gu, S., Zhang, X., Wen, X., et al. (2019). Evolution and assessment of the atmospheric composition in hangzhou and its surrounding areas during the G20 Summit. Aerosol. Air Qual. Res. 9, 2757–2769. doi: 10.4209/aaqr.2018.12.0481
Wu, K., Yang, X., Chen, D., Gu, S., Lu, Y., Jiang, Q., et al. (2020). Estimation of biogenic VOC emissions and their corresponding impact on ozone and secondary organic aerosol formation in China. Atmos. Res. 231:104656. doi: 10.1016/j.atmosres.2019.104656
Wu, K., Wang, Y., Qiao, Y., Liu, Y., Wang, S., Yang, X., et al. (2022). Drivers of 2013–2020 ozone trends in the Sichuan Basin, China. impacts of meteorology and precursor emission changes. Environ. Pollut. 300:118914. doi: 10.1016/j.envpol.2022.118914
Xu, L., Du, L., Tsona, N. T., and Ge, M. (2021). Anthropogenic effects on biogenic secondary organic aerosol formation. Adv. Atmos. Sci. 38, 1053–1084. doi: 10.1007/s00376-020-0284-3
Yang, X., Wu, K., Wang, H., Liu, Y., Gu, S., Lu, Y., et al. (2020). Summertime ozone pollution in Sichuan Basin, China: meteorological conditions, sources and process analysis. Atmos. Environ. 226:117392. doi: 10.1016/j.atmosenv.2020.117392
Yang, X., Wu, K., Lu, Y., Wang, S., Qiao, Y., Zhang, X., et al. (2021). Origin of regional springtime ozone episodes in the Sichuan Basin, China: role of synoptic forcing and regional transport. Environ. Pollut. 278:116845. doi: 10.1016/j.envpol.2021.116845
Keywords: BVOCs, air quality, MEGAN, ozone, Sichuan basin
Citation: Zhang S, Lyu Y, Yang X, Yuan L, Wang Y, Wang L, Liang Y, Qiao Y and Wang S (2022) Modeling Biogenic Volatile Organic Compounds Emissions and Subsequent Impacts on Ozone Air Quality in the Sichuan Basin, Southwestern China. Front. Ecol. Evol. 10:924944. doi: 10.3389/fevo.2022.924944
Received: 20 April 2022; Accepted: 18 May 2022;
Published: 27 June 2022.
Edited by:
Shupeng Zhu, University of California, Irvine, United StatesReviewed by:
Haolin Wang, Sun Yat-sen University, ChinaRyan Wu, University of California, Irvine, United States
Copyright © 2022 Zhang, Lyu, Yang, Yuan, Wang, Wang, Liang, Qiao and Wang. This is an open-access article distributed under the terms of the Creative Commons Attribution License (CC BY). The use, distribution or reproduction in other forums is permitted, provided the original author(s) and the copyright owner(s) are credited and that the original publication in this journal is cited, in accordance with accepted academic practice. No use, distribution or reproduction is permitted which does not comply with these terms.
*Correspondence: Yaqiong Lyu, eWFxaW9uZ0BpbWRlLmFjLmNu