
94% of researchers rate our articles as excellent or good
Learn more about the work of our research integrity team to safeguard the quality of each article we publish.
Find out more
METHODS article
Front. Ecol. Evol., 30 August 2022
Sec. Phylogenetics, Phylogenomics, and Systematics
Volume 10 - 2022 | https://doi.org/10.3389/fevo.2022.924941
This article is part of the Research TopicRecent Advances in Museomics: Revolutionizing Biodiversity ResearchView all 16 articles
 Behnaz Balmaki1,2*
 Masoud A. Rostami1,2Tara Christensen1,2Elizabeth A. Leger1,2Julie M. Allen1,2
 Chris R. Feldman1,2
 Matthew L. Forister1,2Lee A. Dyer1,2
Research on plant-pollinator interactions requires a diversity of perspectives and approaches, and documenting changing pollinator-plant interactions due to declining insect diversity and climate change is especially challenging. Natural history collections are increasingly important for such research and can provide ecological information across broad spatial and temporal scales. Here, we describe novel approaches that integrate museum specimens from insect and plant collections with field observations to quantify pollen networks over large spatial and temporal gradients. We present methodological strategies for evaluating insect-pollen network parameters based on pollen collected from museum insect specimens. These methods provide insight into spatial and temporal variation in pollen-insect interactions and complement other approaches to studying pollination, such as pollinator observation networks and flower enclosure experiments. We present example data from butterfly pollen networks over the past century in the Great Basin Desert and Sierra Nevada Mountains, United States. Complementary to these approaches, we describe rapid pollen identification methods that can increase speed and accuracy of taxonomic determinations, using pollen grains collected from herbarium specimens. As an example, we describe a convolutional neural network (CNN) to automate identification of pollen. We extracted images of pollen grains from 21 common species from herbarium specimens at the University of Nevada Reno (RENO). The CNN model achieved exceptional accuracy of identification, with a correct classification rate of 98.8%. These and similar approaches can transform the way we estimate pollination network parameters and greatly change inferences from existing networks, which have exploded over the past few decades. These techniques also allow us to address critical ecological questions related to mutualistic networks, community ecology, and conservation biology. Museum collections remain a bountiful source of data for biodiversity science and understanding global change.
Global change is one of the most pressing issues for modern ecologists, and increases in habitat loss, fragmentation, climate change, invasive species, and pollutants are leading to unprecedented losses of biological diversity and less reticulate ecological networks (Alarcon et al., 2008; Ferrarini et al., 2017; Harrison et al., 2020; Salcido et al., 2020; Wagner et al., 2021). Pollination is one of the essential ecosystem services impacted by global change, but it is difficult to document these impacts without thorough natural history observations of plant-pollinator associations and estimates of network relationships (Seltmann et al., 2017; Balmaki et al., 2022).
Entomopalynology, the study of pollen grains associated with insects, is a relatively new approach developed to track pollination ecology through time and space (Jones and Jones, 2001). This approach has recently received greater attention and has provided more demand for museum specimens because insects collected across different temporal or spatial gradients provide invaluable data for reconstructing networks of insect-pollen interactions. A limited number of studies have used this method to estimate parameters related to bee pollination biology (Silberbauer et al., 2004; Wood et al., 2019). Expanding this approach to other insects that are important pollinators, such as Lepidoptera, can reveal unique aspects of pollen-insect interaction networks, and their sensitivity or resilience to change (Balmaki et al., 2022).
Pollen grains are the common currency of pollination ecology. Insects may consume, passively carry, or actively transport pollen (to a stigma or other plant parts), and pollen grains can cover an insect’s body, either passively through the air column, or actively while an insect is feeding on nectar or pollen (Jones, 2012a,b, 2014). Analysis of pollen grains on the body of a pollinator can reveal dietary associations and patterns of floral visitation. Examining pollen grains on pollinators approximates a measure of pollen availability, and with repeated sampling can illustrate changes in plant-pollinator interactions over time. Tracking these changes is key to understanding the effects of environmental change on pollination ecology. Precise and quantitative descriptions of plant-pollinator interactions are required to make inferences about changing interaction networks, and pollination ecosystem services through time, and analysis of pollen on insect specimens is a powerful approach to address this need (Burkle et al., 2013).
Traditional palynology, the study of pollen grains and spores, depends on morphological characters of pollen grains to identify pollen taxa. Typical morphological traits used to distinguish pollen include general shape, polarity, symmetry, apertures, size, and ornamentation. Nevertheless, the morphological similarities of pollen grains make it difficult to effectively use these features to identify pollen species quickly and accurately. In addition, identifying pollen grains under the microscope is time-consuming and expensive, and the results are typically dependent on partly-subjective criteria for identifications that are associated with a relatively high error rate (Gonçalves et al., 2016; Sevillano et al., 2020). Alternatively, pollen metabarcoding is a high-throughput approach that can characterize multiple taxa in a mixed sample, but is frequently unable to resolve lower taxonomic levels, and is not an effective method for estimating abundance (Bell et al., 2017). While some studies using pollen identification only warrant a coarse level of taxonomic resolution (family), most approaches to insect-pollen networks benefit from finer taxonomic resolution, at the level of species. An effective method for pollen identification should be efficient, precise, and accurate, and machine learning approaches are well suited for this goal. Here, we provide an example using convolutional neural networks (CNN) which is a deep learning algorithm that can be part of an integrated approach to collections-based research. The approach should be especially useful for museums with large herbaria and entomological collections, because pollen can be collected from herbarium specimens as well as insects (Daood et al., 2016; Carranza-Rojas et al., 2017; Romero et al., 2020; Polling et al., 2021).
We analyzed a plant-pollinator interaction network using museum specimens collected in the Great Basin Desert and Sierra Nevada Mountains and stored at the University of Nevada, and our goal here is to present these methods and analytical tools to encourage adoption in other collections. The main objectives of these methodological innovations are to quantify historic and contemporary pollen-butterfly interaction networks, and to use this information for hypothesis testing about changes in pollination networks in response to extreme weather events and other commonly measured parameters of global change. This approach will transform the way we quantify pollinator networks and present an efficient alternative to pollen identification that provides reliable species-level accuracy.
With this integrative approach to studying plant-pollinator interactions using museum specimens, it is possible to address important questions in ecology and conservation biology, such as: How have plant-pollinator interaction networks changed over time? Is climate change associated with changes in interaction networks? How do habitat loss, fragmentation, biological invasions, and other disturbances affect these networks? Can we improve accuracy and decrease the time-consuming methods of pollen grain identifications using deep learning?
The best methods for documenting plant-pollinator species interactions are likely to combine quantitative approaches with well-informed natural history descriptions. Historically, these approaches include flower bagging experiments, observations of floral visitation, and pollen identification from insect specimens as described above. These approaches are rarely combined, and pollination studies are dominated by observational methods and quantitative literature reviews, typically with a focus on flower visitation observations for estimating network parameters (Yamaji and Ohsawa, 2016; Colom et al., 2021; Mendes et al., 2022). Visitation network studies typically consist of observation periods in which the researcher observes and records the visitors to a particular plant in an allotted time period. On its own, this approach falls shorts because it disregards the effectiveness of particular pollinators and treats all floral visitors as pollinators, when some are not (Ballantyne et al., 2015). Additionally, many observation hours over relatively long temporal scales may be required to accurately and adequately characterize these interaction networks (Kaiser-Bunbury et al., 2009). Flower bagging experiments involve isolating inflorescences with bags to assess the effects of pollinator exclusions, and pollination events can be closely monitored upon removal of the bag (Yamaji and Ohsawa, 2016; Aslan et al., 2019). This method is valuable for assessing the effectiveness of individual pollinators, but can be time-consuming, and may be inefficient and impractical for community-level studies.
In recent decades, ecologists have used pollen analysis to study the effects of habitat loss and alteration on pollinators and plants (Silberbauer et al., 2004; Bosch et al., 2009; Jones, 2014; Wood et al., 2019; Balmaki et al., 2022). Pollen collections have typically focused on pollen from sediment or soil cores, but collecting pollen grains directly from the bodies of pollinators is a more recent approach to estimating changes in plant-pollinator interactions (Bosch et al., 2009). In addition, collecting historical ecological data associated with museum specimens can increase the accuracy of pollinator-plant interactions and expand our knowledge of pollination networks through space and time (Kleijn and Raemakers, 2008; Colla et al., 2012; Bartomeus et al., 2013; Balmaki et al., 2022). Natural history museums are underutilized repositories of historical interaction diversity and rapidly declining biodiversity (Johnson et al., 2011; Castillo-Figueroa, 2018; Jones and Daeler, 2018). Data from pollen associated with pollinators stored in museums can be used for the estimation of interaction networks between plants and flower visitors through time and space.
Collecting data from historical museum specimens, especially butterflies, presents a unique set of challenges, particularly with older specimens. Using museum samples precludes us from using the acetolysis technique, in which organic materials, in this case insect tissue, are dissolved to recover pollen from insects and reveal diagnostic characters of pollen grains (Jones, 2014). In order to preserve museum specimens, we use entomological pins under a binocular microscope to manually collect pollen grains from the external surface of pollinators, which can be exacting and delicate work. On Lepidoptera, pollen grains typically aggregate on the proboscis, legs, and compound eyes (Figure 1). Pollen grains can be mounted on glass slides by adding two drops of 2000 cs silicone oil volume. Suspension in silicon oil allows for the rotation of pollen grains under a microscope to examine the dimensions and shape of pollen in different orientations (Cushing, 2011). The next step is sealing the slide with a cover slip and nail polish to protect the slides from damage. This method is prevalent among quaternary researchers who make pollen slides from sediment samples in cores for palynology purposes (Cushing, 2011; Balmaki et al., 2019; Riding, 2021). Once pollen slides are prepared, they can serve as reference slides for identification of pollen grains to the genus or species level. Having pollen reference slides from all plant taxa in our study region increases the accuracy of pollen grain identification. A high-resolution light microscope and camera can create detailed images for pollen morphology, which can illustrate the number of apertures, exine sculpture, and internal texture, to analyze and identify pollen grains. In addition, electron microscopes (SEM) can examine the surface structures for pollen identification. Figure 2 indicates the summary of the procedure, from collecting pollen to analyzing the data.
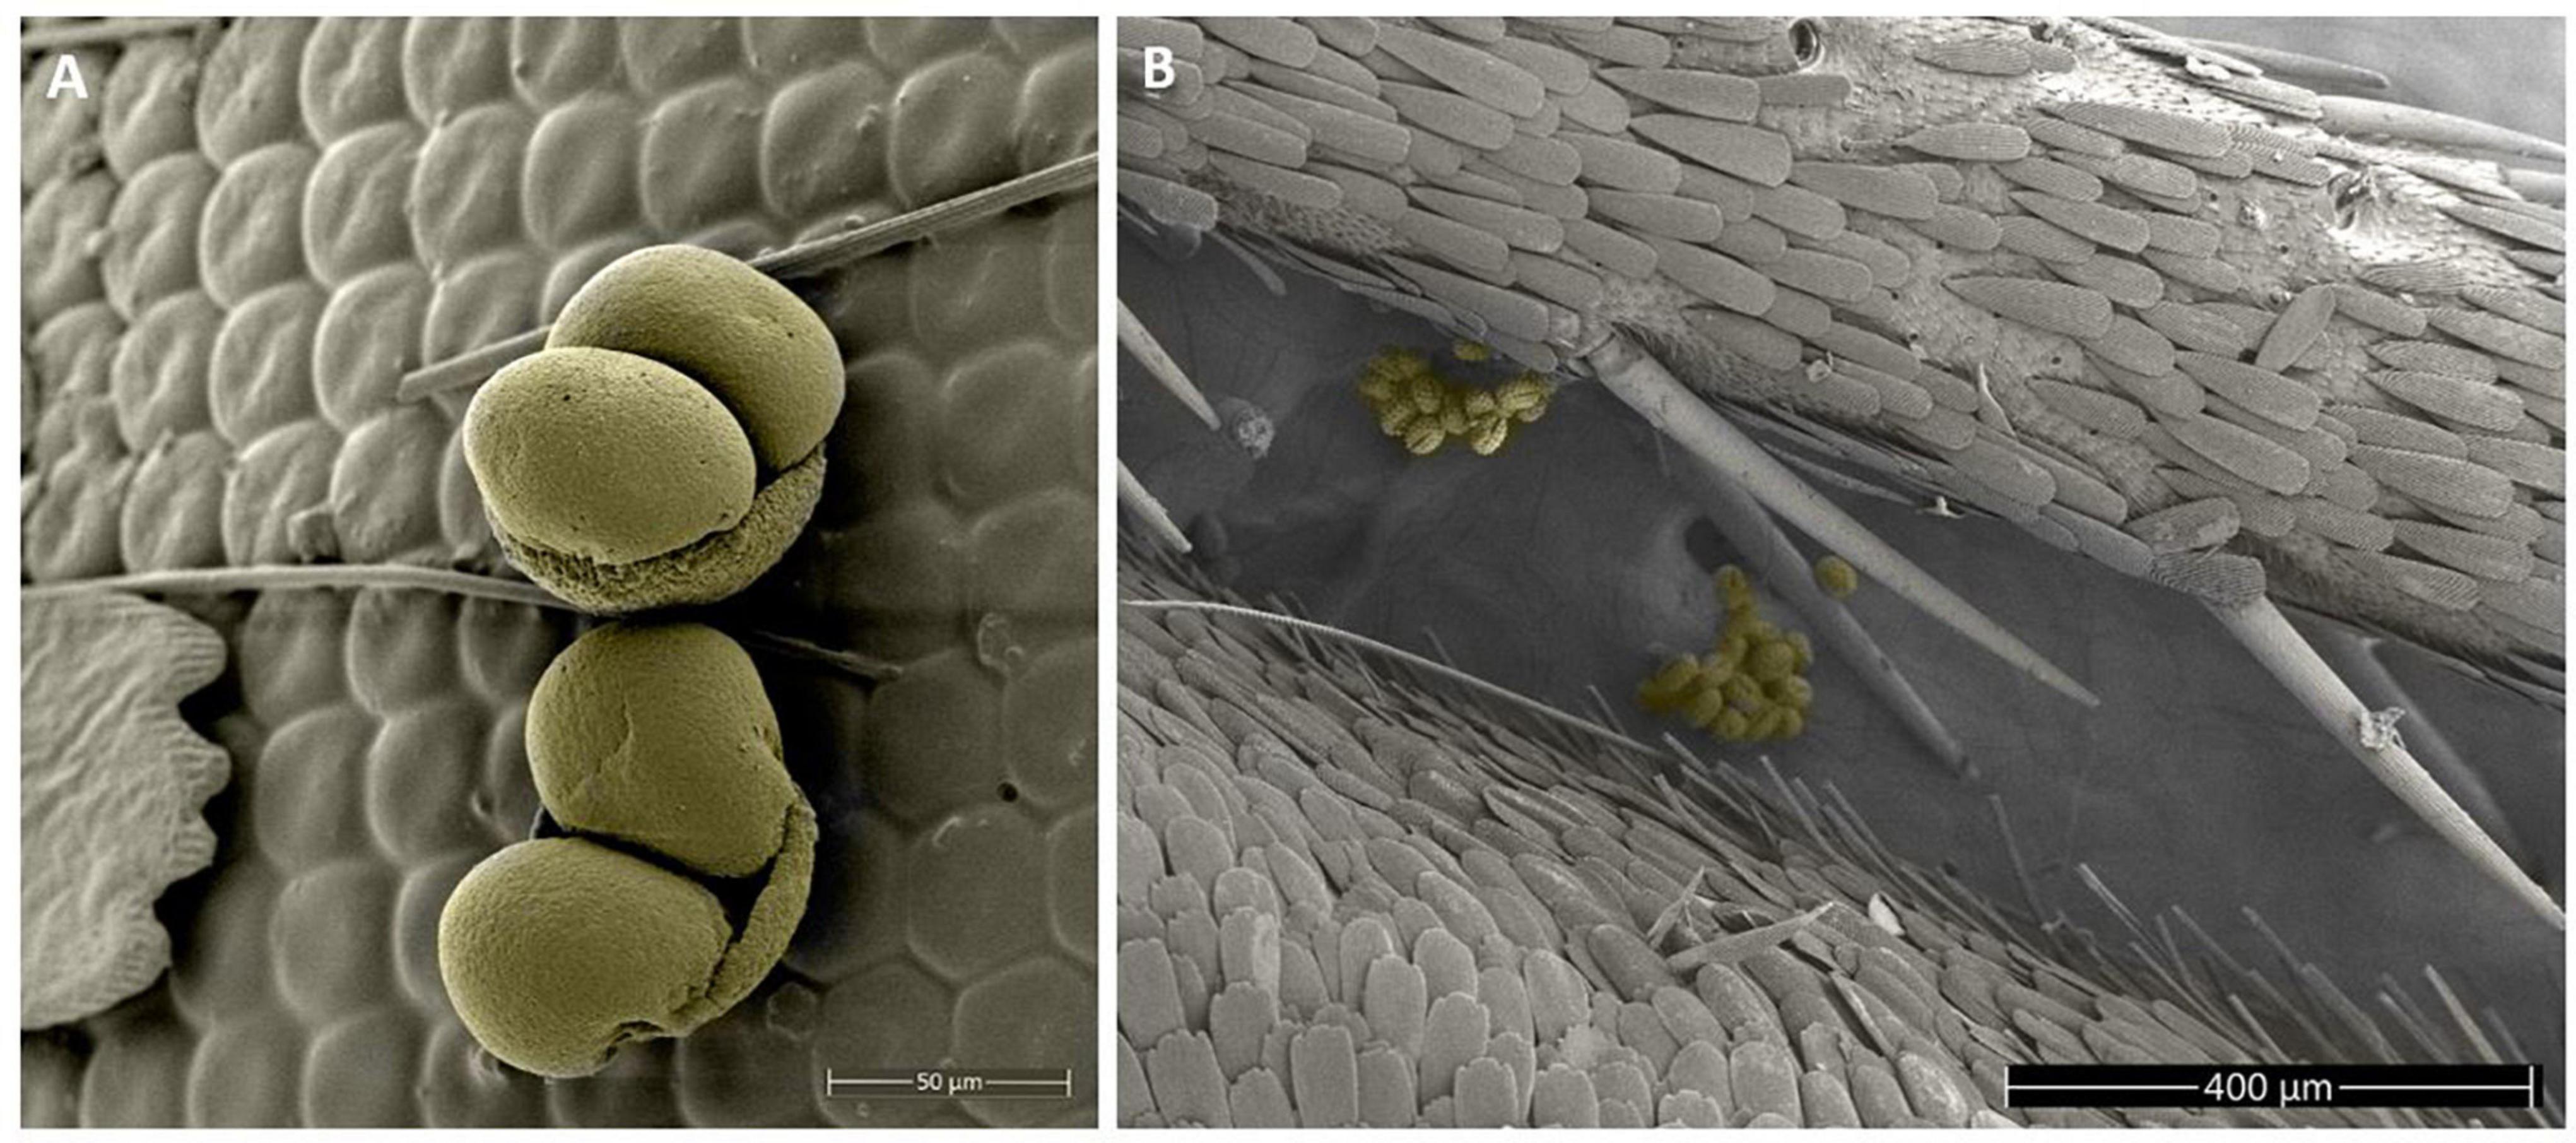
Figure 1. Scanning electron microscope images of pollen grains on the legs and eyes of a skipper (Hesperopsis libya, Hesperiidae) from the entomological collections of the University of Nevada Reno Museum of Natural History (UNRMNH). (A) Pinaceae pollen grains adhered to the butterfly’s eye. (B) Asteraceae pollen grains on the butterfly leg.

Figure 2. Summary of pollen analysis method for plant-pollinator studies. Pollen grains are manually extracted from the insect specimen using an entomology pin under a microscope. The grains are then oriented and slide mounted for pollen identification via machine learning methods. The direct associations between insect and pollen are then combined with similar data from several specimens or several species collected at various spatial or temporal scales for examination via network analysis (or other downstream analyses).
It is useful to quantify species interaction networks because of the importance of biotic interactions for ecosystem functions, from primary productivity to community stability, especially in the context of environmental change (Tylianakis et al., 2010; Losapio et al., 2018; Aslan et al., 2019). The documented relationships between interaction diversity and stability of ecological communities are partly a consequence of the number of network links, their relative strength, nestedness, and degree of specialization (Pawar, 2014; Metelmann et al., 2020). Large disturbances, extreme weather events, and continued global change can decrease the number of potential and realized interactions in mutualistic networks (Balmaki et al., 2022). Extending analyses to examine interaction diversity at multiple scales may provide mechanistic insights into the community and ecosystem-level consequences of climate change. Including interaction diversity and network approaches should contribute to predicting how species interactions will change over time in response to global change as well as across different environmental and disturbance gradients, especially if they are used to construct and validate predictive or forecasting models (Strydom et al., 2021).
Typically, plant-pollinator interaction networks are considered as bipartite, or two-sided networks, in which the nodes indicate plant and pollinator taxa, and the edges represent their interactions. Commonly, the width of the edges represents the frequency of interactions, with wider edges representing higher frequencies of interaction. Dozens of network parameters can be used to summarize bipartite and more complex networks; for example, some useful network metrics for community ecology are connectance, nestedness, and network specialization (H2) (Dormann et al., 2009). Connectance represents the number of links between nodes, and it summarizes the number of realized possible connections (Martinez, 1992). Nestedness describes the degree of subsetting that occurs compared to a random network; in other words, nestedness describes the extent to which more specialized interactions form subsets within more generalized interactions (Bascompte et al., 2003; Pawar, 2014). H2 is an index that quantifies the degree of specialization and is useful for comparisons across multiple networks (Blüthgen et al., 2006).
Deep learning as a subset of artificial intelligence is not a new approach, but it has become more popular in the past decade with the advance of technology, including computational power and the availability of large datasets (Wäldchen and Mader, 2018). Deep learning algorithms are computationally expensive, but for researchers who do not have access to appropriate computational resources and high-speed internet to handle large datasets with many parameters, there are platforms such as Colaboratory by Google (Google Colab), which is a Jupyter notebook-based runtime environment that allows running code entirely on the cloud, that can help train large-scale deep learning models using a standard computer. The main purpose of neural networks in deep learning is to receive a set of inputs, perform complex linear and non-linear calculations on them, and provide output to aid classification or provide classic regression parameter estimates. Deep learning is a technique that enables us to train huge and complex datasets, and applies to many fields, including crop or weed detection (Buddha et al., 2019; Afonso et al., 2020), leaf detection (Younis et al., 2020), detection and classification of plant diseases (Geetharamani and Pandian, 2019; Albattah et al., 2022), species identification (Galanty et al., 2021), and animal counts using camera traps (Norouzzadeh et al., 2018, 2021; Wäldchen and Mader, 2018).
Convolutional neural networks (CNN) are utilized for deep learning (e.g., Norouzzadeh et al., 2018; Astolfi et al., 2020; Polling et al., 2021). A CNN model contains multiple layers, including convolutional layers, pooling, and fully connected (FC) layers (Figure 3). For example, utilizing a pollen image as input, the first layer would include dimensions such as height, width, and color channels (Red, Green, Blue). The neuron in the first convolutional layer transforms this information into a three-dimensional output, yielding non-linear combinations of the input layer or feature extraction. These learned features are utilized as inputs for the next layer, allowing for pooling and data reduction, and at each step, the next node reclassifies the previous node. Learned features become inputs for statistical models, taking advantage of the hierarchical nature of the input data, and summarizing complex patterns using nested patterns that are smaller and simpler. These approaches have rarely been used for pollen identification (Daood et al., 2016; Khanzhina et al., 2018; Sevillano and Aznarte, 2018; Gallardo-Caballero et al., 2019; Astolfi et al., 2020; Romero et al., 2020; Sevillano et al., 2020; Polling et al., 2021), whether the goal is for identifying allergens in the air column or monitoring change in pollinator-plant interactions through time. Whatever the goal, CNN models are ideal for image classification and will be useful for species-level determinations.
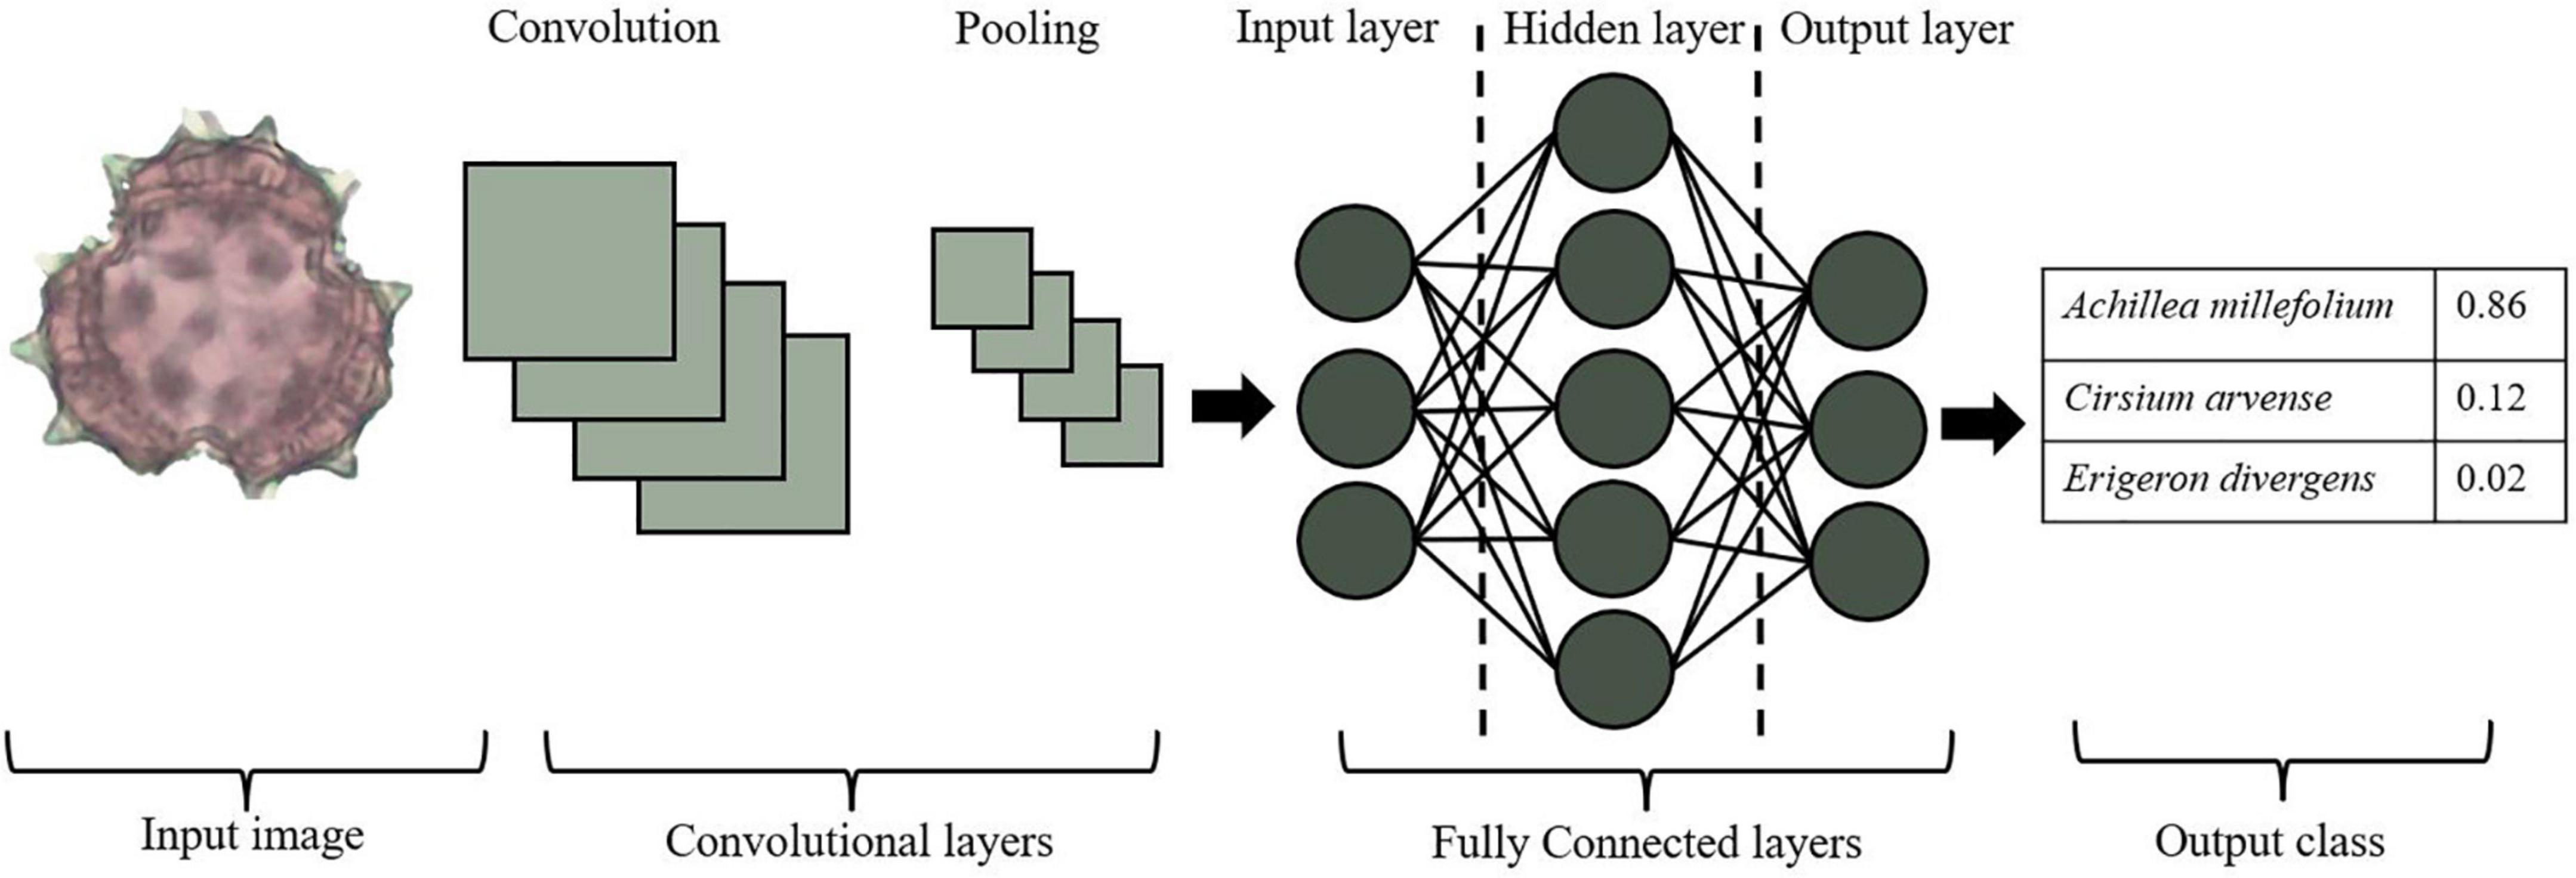
Figure 3. Basic convolutional neural network (CNN) architecture, including an input image, convolutional layers (convolution and pooling), fully connected layers, and output classes.
Convolutional neural networks models often achieve prediction capabilities not seen by any other modeling approach (Flagel et al., 2019; Sevillano et al., 2020; Polling et al., 2021). This is because CNN models contain many filters and neural network layers that can extract low and high-level features from images or data matrices. In fact, the CNN method develops algorithms that automatically extract discriminant features from images without human involvement, in contrast to standard statistical approaches, such as ordination (PCA, NMDS) and Support Vector Machine (SVM) analyses, with extraction and preprocessing steps that require user iterations and are time-consuming (O’Mahony et al., 2019; Alzubaidi et al., 2021). There are several advantages of CNN compared to traditional supervised machine learning methods. The CNN method often achieves a higher accuracy score in tasks such as image classification and object detection (Viertel and Konig, 2022). The CNN can be re-trained which allows us to utilize it in different custom datasets (O’Mahony et al., 2019).
In the example presented here for identification of pollen from the Great Basin Desert and Sierra Nevada Mountains, two popular transfer learning (pertained models) approaches have been used, including AlexNet and VGG19, to create and train our models and extract the critical features automatically from the pollen images (Krizhevsky et al., 2012; Simonyan and Zisserman, 2014). AlexNet was initially created to classify millions of images in 1000 categories in ImageNet datasets (Krizhevsky et al., 2012). It takes input images by size 224 × 224 RGB. This method includes five convolutional layers and three fully connected (FC) layers with around 60 million parameters. Through different layers of the CNN network, the first layer extracts the basic features such as color and edges; then, in the deeper layers, the model learns more convoluted features such as spines and pores in pollen grains. After the convolutional layers and extracting the features, AlexNet has three FC layers with 1000 neurons for each category. The output layer in the AlexNet model is interpreted as the probability of an image belonging to each pollen species category. The VGG (Visual Geometry Group) model takes input images with the size of 224 × 224 RGB. This model has five convolutional blocks with a filter size of 3 × 3, a fixed stride size of 1, and each of these convolutional blocks followed by max-pooling with size 2 × 2 with a stride of 2. Also, the VGG has three FC layers, including Rectified Linear Unit (ReLU) and softmax function in the final layer. The main VGG transfer-learning models are VGG16 and VGG19, and the critical difference between them is the number of convolutional layers which are 16 and 19, respectively (Simonyan and Zisserman, 2014). Here, we used VGG19 for our case study.
The pollen image datasets are divided into training and validation sets to evaluate the training error and prevent overfitting, compromising 80% training set and 20% validation sets. There are several regularization approaches to avoid overfitting, including early stopping, batch normalization, dropout, L1 and L2 regularization, increasing the number of training datasets, and data augmentation. For our approach, we used dropout, increasing the number of training datasets, and data augmentation. Dropout is a regularization strategy that involves randomly excluding some number of layer outputs during the training of the CNN model. It helps to force nodes within a layer to probabilistically take on more or less responsibility for the inputs, decreasing the complexity of the model. The data augmentation method was also used on the training dataset after separating the dataset into two training and validation datasets to prevent overfitting and increase the accuracy of the model. The deep learning models need enormous datasets, and it is one of the most significant challenges that researchers face in the case of collecting a large number of samples (e.g., Najafabadi et al., 2015; Polling et al., 2021).
Data augmentation is an approach commonly used in computer vision to increase the amount of training data by adding slightly modified copies of already existing data, only using information from the training data (Perez and Wang, 2017). This method can act as a regularization strategy, and the model is not able to overfit all the image samples, which allows for greater model generalizations (Perez and Wang, 2017). For the data augmentation, we used several transformation methods, such as resizing the images (all of which were the same size), rotating the images across multiple angles, and horizontal flips. All these transformations generate new images from the original. This approach balances the sample sizes for images of different species, it delivers a wider variety of features found in images of the pollen grains, and it increases the number of images in the training datasets (Figure 4).
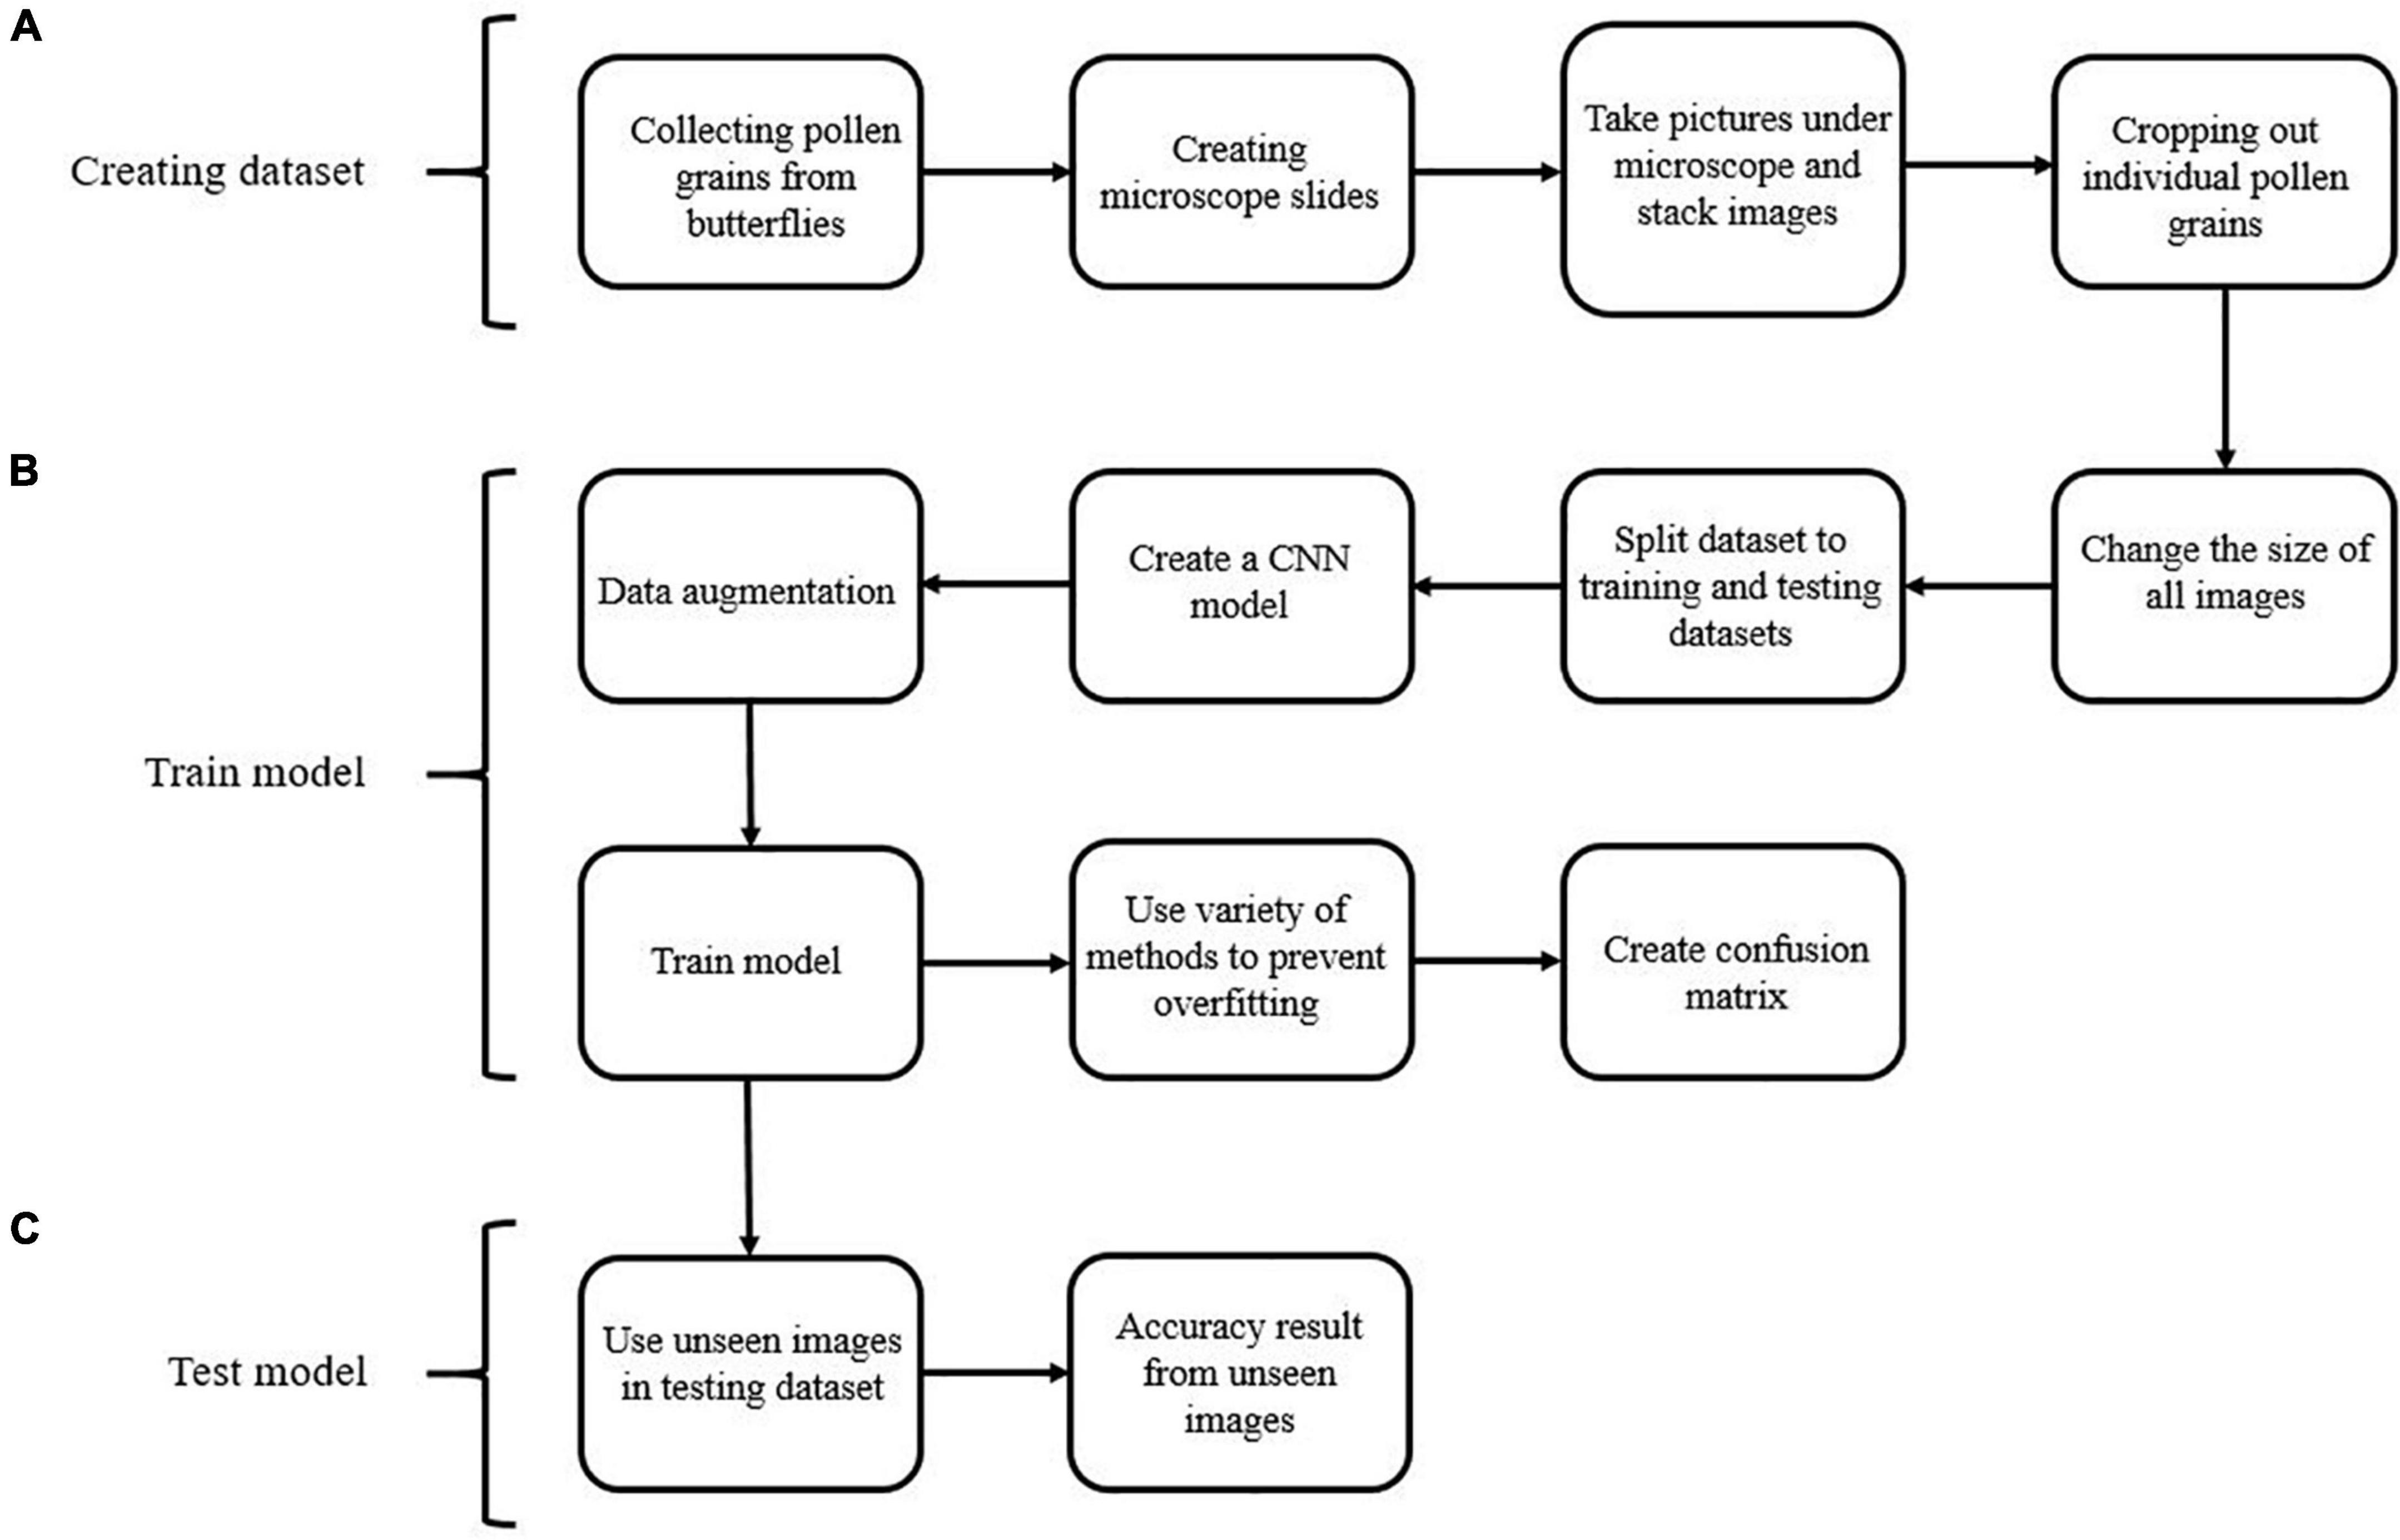
Figure 4. Flowchart showing the pollen image classification process across several steps, including: (A) creating the image dataset; (B) training the model; (C) testing the model.
To evaluate our CNN algorithm, we used the accuracy metric. The accuracy metric equation includes the terms TP (True Positive), TN (True Negative), FP (False Positive), and FN (False Negative) and provides an estimate of how the model performs through all the classes. It calculates the ratio between the number of correct predictions and the total number of predictions.
Our pollen analysis included pollen grains collected from lepidopteran specimens from the UNR Museum of Natural History (UNRMNH) from historic collections dating back to 1910 in the Great Basin and Sierra Nevada Mountains near Reno, NV. Beginning in 2020, we started regular collections of butterflies from three sites to supplement and expand the UNR collections and to improve the resolution of plant-pollinator networks from museum specimens. We selected 266 specimens, including 20 locally abundant native butterfly species from five families in the Great Basin and the Sierra Nevada, for pollen analysis for this study (Supplementary Table 1). Part of the dataset was published recently to reconstruct the butterfly-pollen interaction network in the Great Basin and Sierra Nevada Mountains over the past century (Balmaki et al., 2022); that study used the methods described here, and more specific methods for data collection and statistical analyses are described in that paper. While Balmaki et al. (2022) focused on characterizing changes in pollen-butterfly networks over the past century and comparing these networks to contemporary visitation networks, the current paper focuses more generally on pollinator network methodology with an expanded pollen-butterfly network from the UNRMNH collections.
We prepared more than 400 pollen reference slides from native flowers found in the Reno herbarium (RENO) for cross-validation of pollen identifications. We used a ZEISS, Axiolab 5 light microscope, and Axiocam 208 color microscope camera for pollen identification and photography of pollen grains, and the images were captured using 40× objective lenses and 10× ocular lenses. Z-stack images show the vertical details of pollen grains at various focus levels. To train the model for automating the identification of pollen grains, we cropped all the images using Adobe Photoshop (CS6, 13.0.1.3). We removed images with high levels of noise due to debris, air bubbles, and aggregated pollen.
We then estimated the richness and frequency of butterfly-plant interactions over time and space by bipartite interaction networks, and estimated network parameters using network methods outlined by Dormann et al. (2009). This network provided a summary of butterfly-plant interactions over the last century in the Great Basin Desert and Sierra Nevada Mountains (Figure 5). Using temporal subsets of these networks from 1910 to 2021, Balmaki et al. (2022) demonstrated that there have been shifts in plant species associated with butterflies, with strong shifts in network structure when comparing pre- and post-drought time intervals. For that analysis, pollen species known to be from wind-pollinated plants were excluded. Insect-pollinated plants have spikey, sticky pollen grains that easily attach to butterflies’ bodies when they are foraging for nectar. Wind-pollinated species in the Great Basin Desert and Sierra Nevada Mountains butterfly-pollen network shown here included species in the families of Pinaceae and Poaceae, and insect-pollinated plants are in the Asteraceae, Lamiaceae, Fabaceae, Polemoniaceae, Malvaceae, and Rosaceae. We found pollen grains of these wind-pollinated families were attached to the legs and wings of butterfly specimens, which means they likely were picked up incidentally from the environment (e.g., as butterflies visit or perch on these plants).
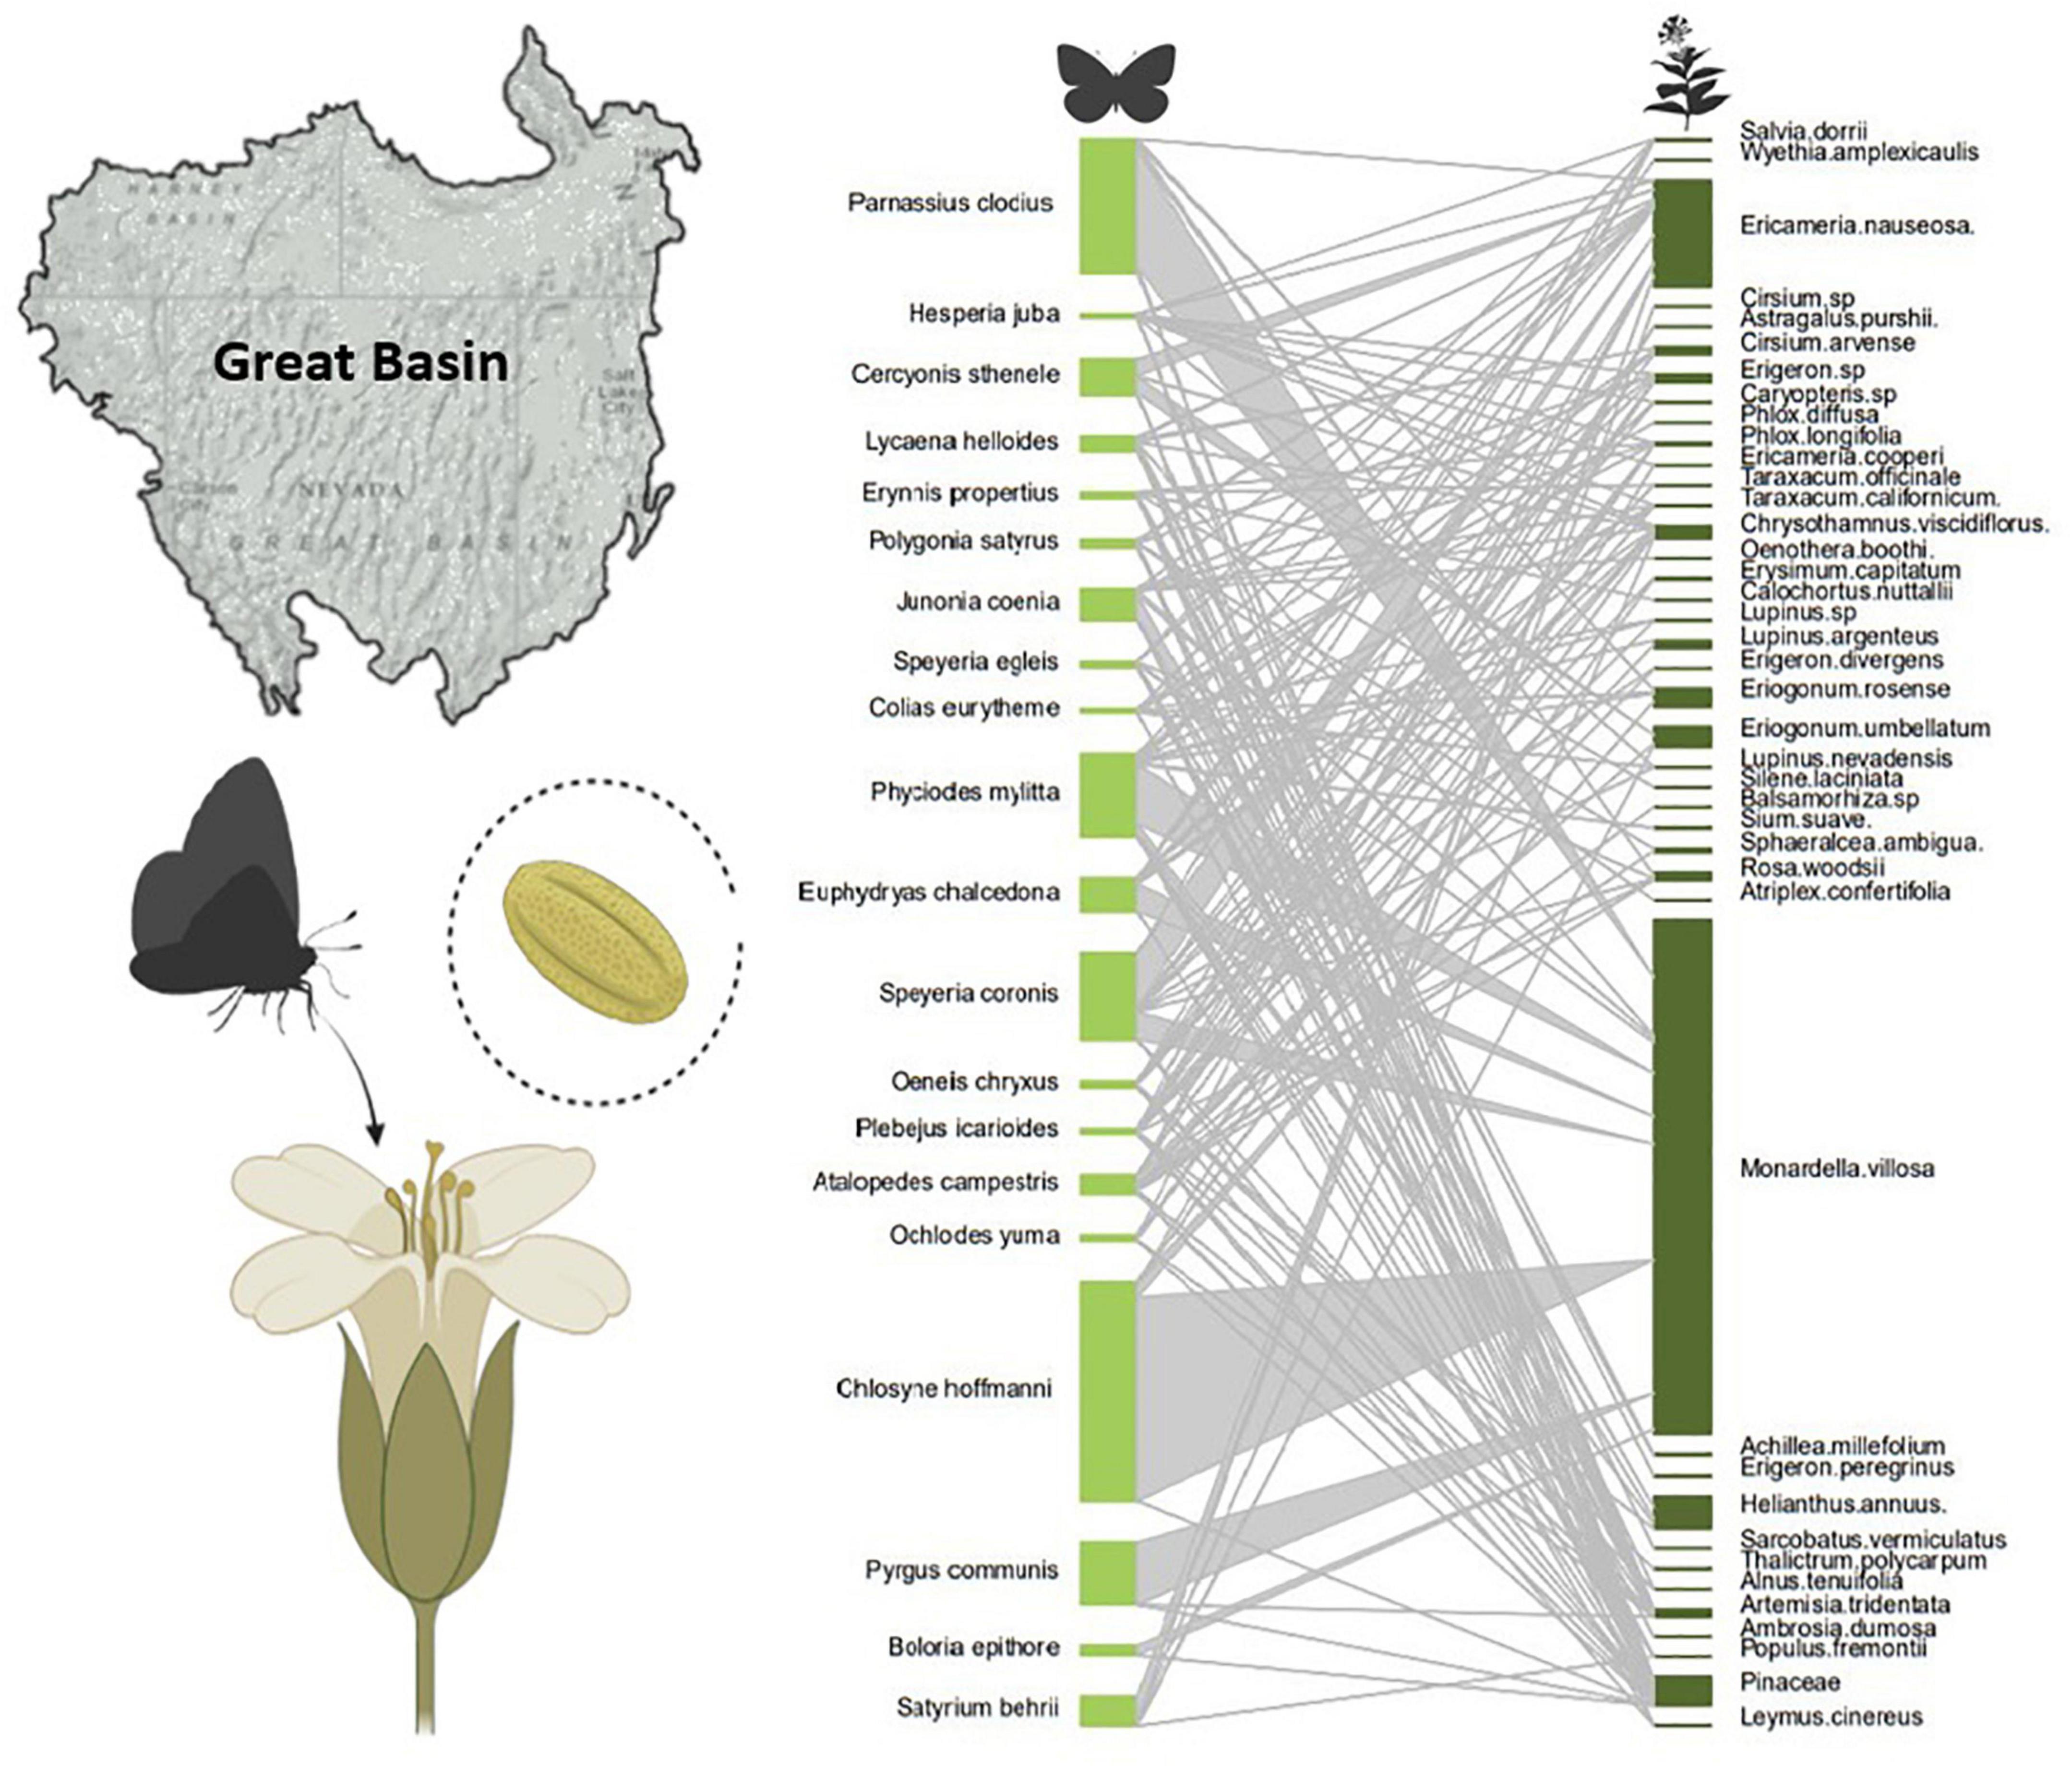
Figure 5. Bipartite pollen-butterfly networks of 20 butterfly species from museum collections of butterflies in the Great Basin Desert and Sierra Nevada Mountains (United States). Light green nodes are butterfly species, dark green nodes pollen species, and the size of the nodes indicate the frequency of those species in the dataset, while the edge thickness (gray) indicates the frequency of interactions (or strength of the association) between the insect and plant species.
Results from Balmaki et al. (2022) indicated that the plant community associated with butterflies is shifting and that this shift is temporally associated with periods of extreme drought in the Western United States. This study also showed that pollen richness associated with butterflies has declined over the past 100 years, which can be a consequence of lower local plant diversity or fewer floral resources (Balmaki et al., 2022). Fewer floral resources could potentially lead to the decline of pollinator species, especially specialized butterflies that may depend on nectar or pollen from a limited number of plant species (Schowalter, 2006). These temporal changes in plant-pollinator interaction networks are an example of how anthropogenic change may be influencing biodiversity.
Anthropogenic climate change has been characterized by increased drought frequency and intensity, and extreme temperatures in the Western United States, and has in some cases been linked to phenological mismatches between pollinators and their food plants (Stemkovski et al., 2020). Museum specimens are one of the best options for examining predicted changes in plant-pollinator interactions over time due to specific global change parameters.
We used two pretrained CNN models (AlexNet and VGG19) to classify the 21 most common pollen species in the Great Basin, including Achillea millefolium, Cirsium arvense, Erigeron divergens, Erigeron peregrinus, Helianthus annus, Taraxacum officinale, Taraxacum californicum, Ericameria nauseosa, Chrysothamnus viscidiflorus (Asteraceae); Erysimum capitatum (Brassicaceae); Astragalus purshii, Lupinus argenters (Fabaceae); Monardella villosa, Salvia dorrii (Lamiaceae); Calochortus nuttallii (Liliaceae); Sphaeralcea ambigua (Malvaceae); Phlox diffusa, Phlox longifolia (Polemoniaceae); Eriogonum umbellatum, Eriogonum rosense (Polygonaceae); Rosa woodsii (Rosaceae). Our pollen image datasets included 5709 images from 21 different pollen species. The number of images per species ranges between 200 and 650, and the majority of the images belong to these four species (E. peregrinus, S. ambigua, P. diffusa, and R. woodsii).
To evaluate the accuracy of our model, we used the validation set, which was composed of unseen images by the model during the training process. These images did not go through the data augmentation, which let us get the realistic accuracy of our model when encountering a new observation. Our AlexNet model achieved the training and validation accuracy of 96.5 and 92.1%, respectively. On the other hand, we acquired higher training and validation accuracy using VGG19, including 98.8 and 93.1%, respectively. This is likely because our VGG19 model architecture, compared to the AlexNet, has a higher number of parameters (VGG19: 102,850,581, AlexNet: 9,459,733) and deeper layers (VGG19: 19, AlexNet:8 layers) which let the VGG19 model better differentiate features within images. The accuracy obtained by the validation dataset was similar to the accuracy obtained by training datasets in the VGG19 model. The low deviation between training and validation accuracy indicates that our model is robust and rules out the possibility of overfitting, which occurs when a model is too complex.
In addition, to see how our VGG19 model acts in different pollen species, we created a confusion matrix that shows just a few mislabeled species (Figure 6). Finally, we believe this accuracy in VGG19 is high enough to build a web and phone application to create an automatic classification system for pollen grains at the species level.
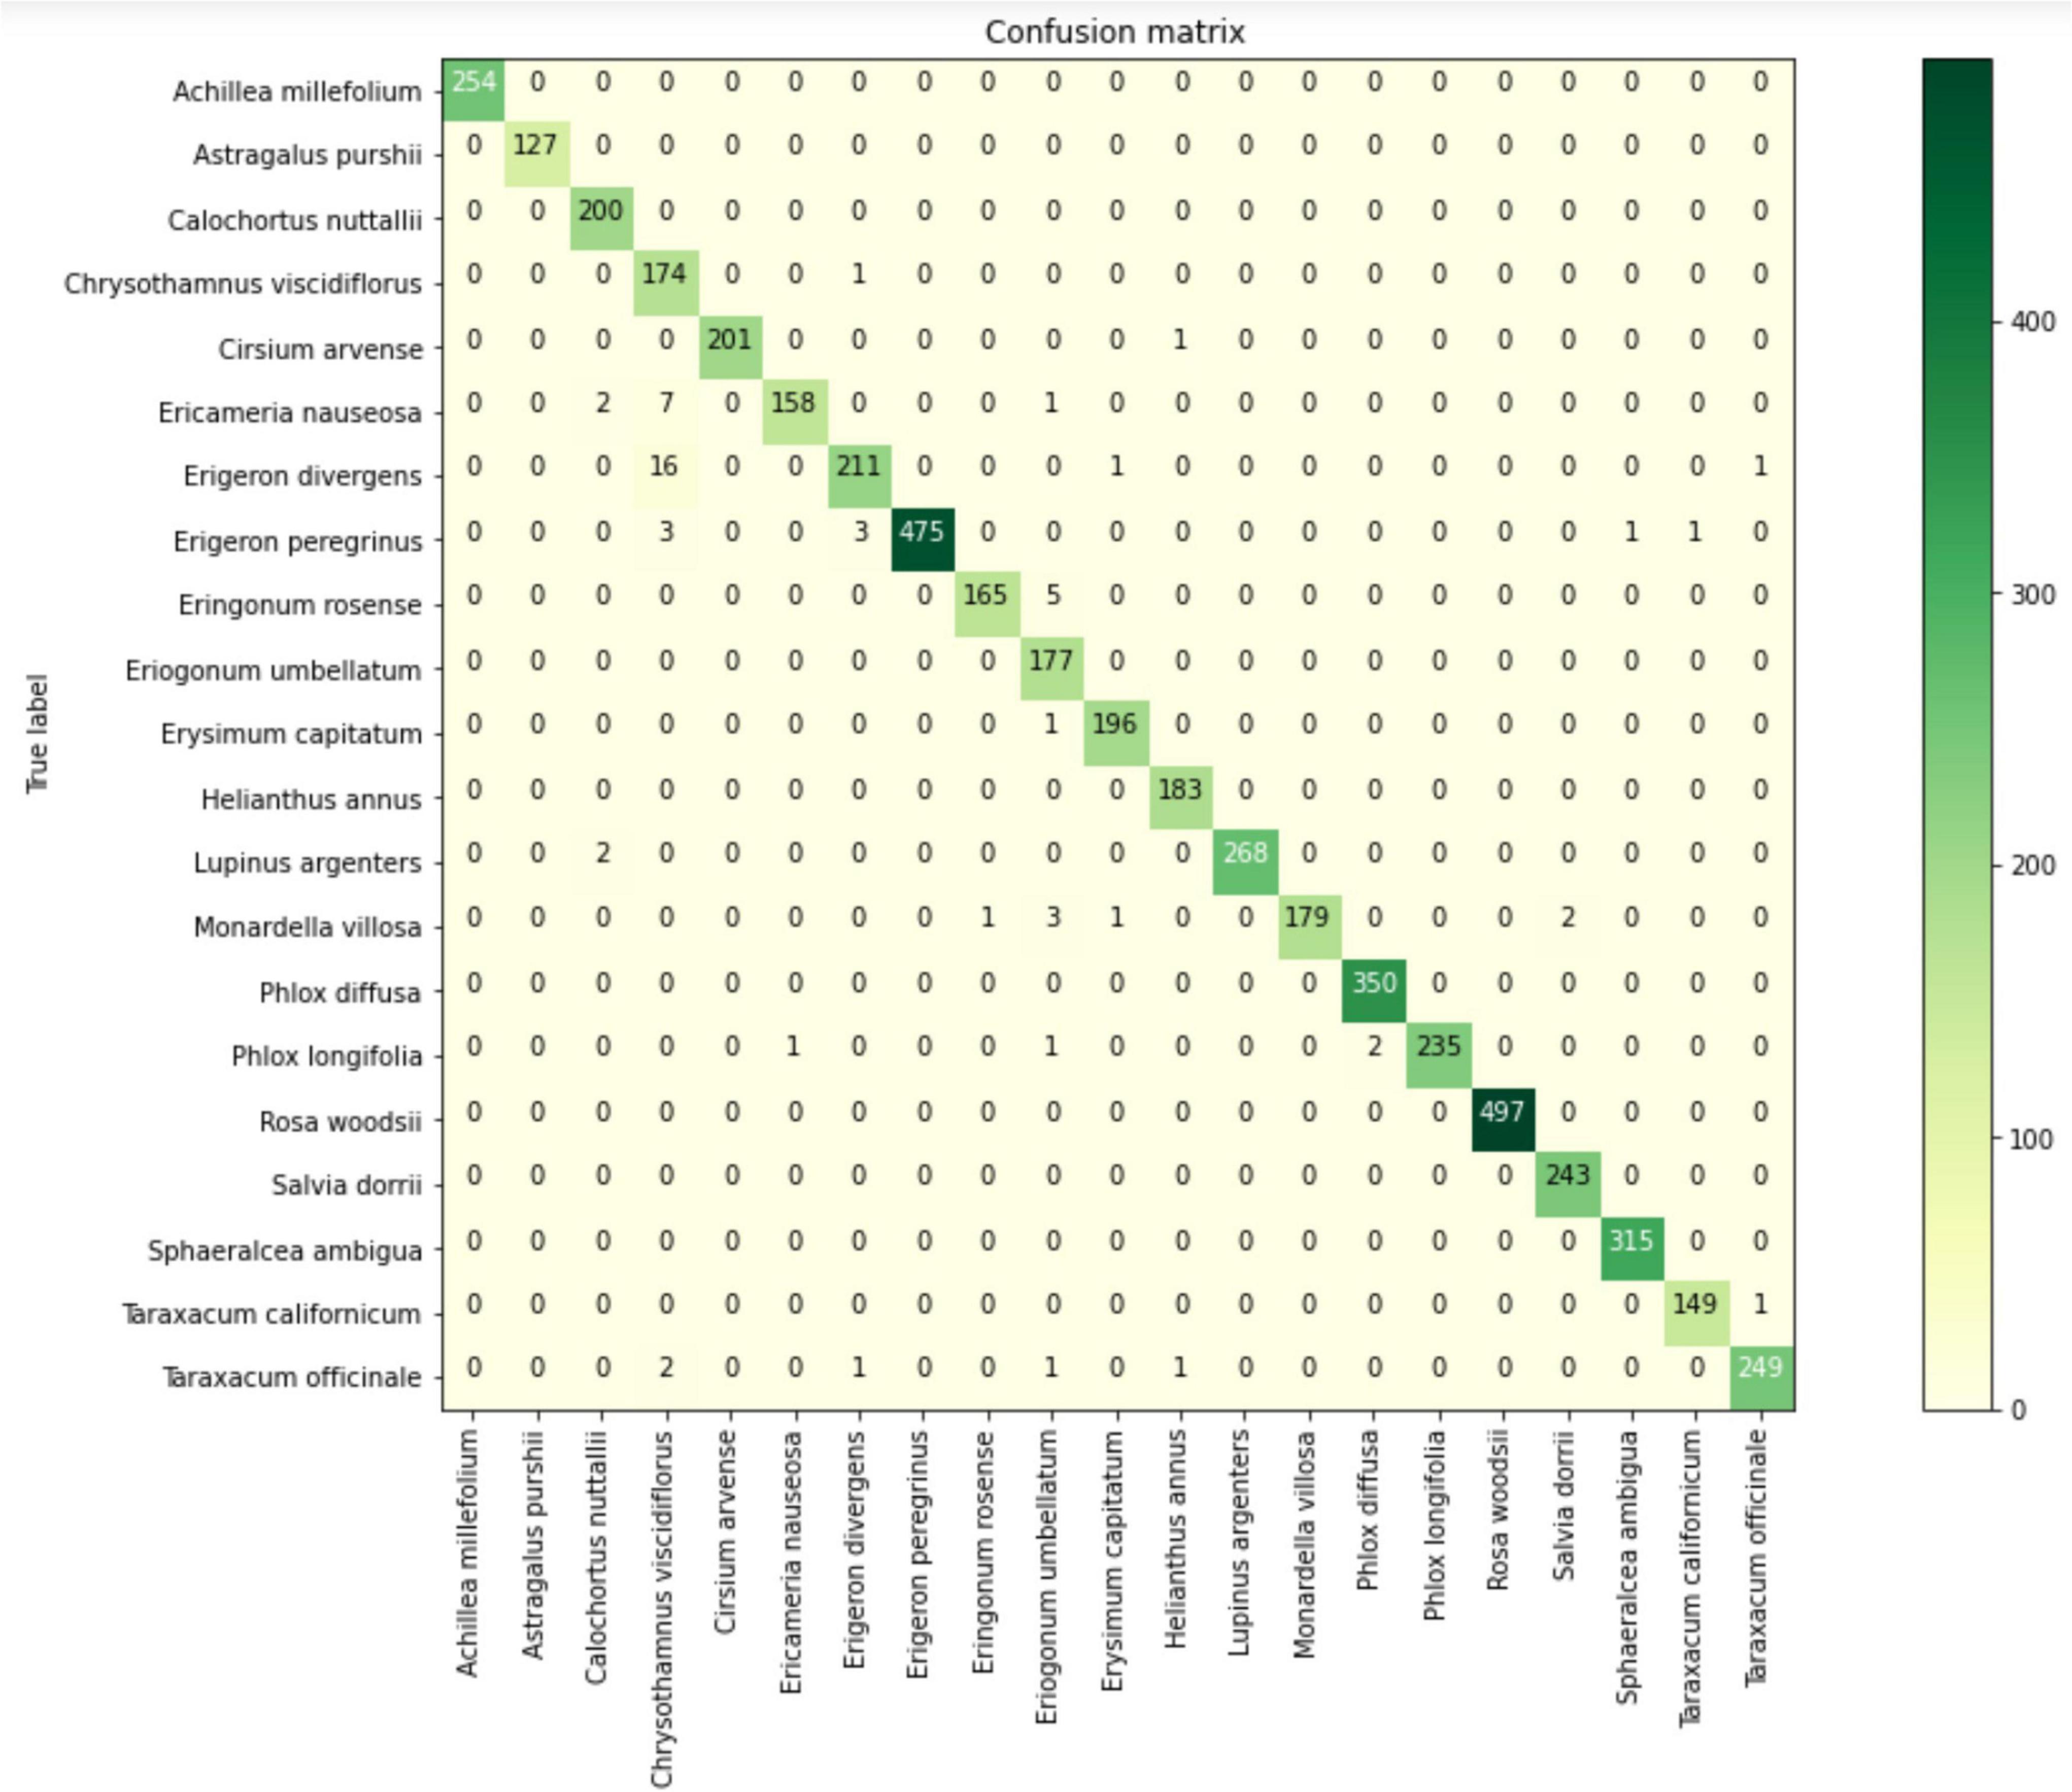
Figure 6. VGG19 confusion matrix for the 21 pollen species used for the training dataset pollen images from the Great Basin. Rows are species identities and columns are convolutional neural network (CNN) species assignments. The color bar indicates frequency, with dark green being most frequent. The diagonal elements are frequency of correctly classified outcomes, while misclassified outcomes are on the off diagonals.
Decades of research have focused on coevolution between plants and insects; these coevolutionary interactions have generated broad-scale geographic patterns of interactions that can be summarized with network parameters (Olesen et al., 2007; Tylianakis et al., 2010; Pellissier et al., 2018). This plant-insect interaction research is often limited by poor natural history data, for which museum collections can serve as an untapped and unparalleled resource. Current challenges include incorrectly inferring relationships from brief visits (i.e., a butterfly landing on a flower implies pollination), assuming interactions are present throughout the geographic range of a species and inferring interactions from literature sources. Consequently, inferences used for ecological networks, for understanding of plant-pollinator coevolution, and for pollinator conservation efforts are formed using incomplete data (Dyer, 2018). Despite the abundance of lepidopterans in collections, their importance as pollinators still lacks rigorous quantification for many taxa. Mining pollinator interaction data from museum specimens can help to fill this critical knowledge gap.
In this time of well-documented declines in pollinators, there is a clear need for innovative methods for studying plant-pollinator interaction networks using museum collections (Potts et al., 2010; Burkle et al., 2013). Species interactions, and their impact on community structure, and ultimately, ecosystem functioning, can be explored through better-informed network methods, which can help us to describe spatial and temporal changes in these dynamics (Burkle and Alarcón, 2011; Campos-Moreno et al., 2021). For example, many specialist pollinators are more susceptible to declines as their more restricted niches provide less redundancy in resource availability (Weiner et al., 2014). It is also likely that the occupancy of specialists across the landscape is low compared to generalists (Sudta et al., 2022) and that more specialized pollinators are less abundant overall (Fort et al., 2016). In either case, there is an expectation of a strong positive correlation between generalization and abundance at some scale, which has conservation implications for threatened specialized plant-pollinator interactions and overall network complexity. It is difficult to assess such network responses without careful networks that are backed by natural history observations and that take into account changes across spatial and temporal gradients. In particular, because museum collections can provide multiple observations over space and time, they can be a more powerful tool for differentiating specialist and generalist pollinators than more limited field observations. Analyzing pollen grains on butterflies from museum collections adds valuable natural history data to specimens and is an efficient and accurate method for documenting the frequency and richness of interactions with plants. These methods should be used to explore how networks have changed over time and may help us predict further network change. Lastly, this approach can help us identify relationships that are most at risk to environmental perturbations and those that are robust to perturbations associated with global change.
The original contributions presented in this study are included in the article/Supplementary material, further inquiries can be directed to the corresponding author. Supplementary data associated with CNN models can be found at this link: https://github.com/masoudrostami/Pollen-Great-Basin.
BB and MR: methodology, conceptualization, laboratory analysis, data analysis, visualization, original draft preparation, and writing – reviewing and editing. TC: methodology, conceptualization, field work, original draft preparation, and writing – reviewing and editing. EL, JA, CF, and MF: methodology, conceptualization, and writing – reviewing and editing. LD: methodology, conceptualization, data analysis, visualization, original draft preparation, and writing – reviewing and editing. All authors contributed to the article and approved the submitted version.
This work was supported by NSF grant DEB 2114942 to LD, EL, and JA and NSF DEB-2114793 to MF and LD.
We appreciate the contributions of Jerry Tiehm, curator of the herbarium (RENO) at the University of Nevada, Reno, Museum of Natural History (UNRMNH) for maintaining this valuable collection.
The authors declare that the research was conducted in the absence of any commercial or financial relationships that could be construed as a potential conflict of interest.
All claims expressed in this article are solely those of the authors and do not necessarily represent those of their affiliated organizations, or those of the publisher, the editors and the reviewers. Any product that may be evaluated in this article, or claim that may be made by its manufacturer, is not guaranteed or endorsed by the publisher.
The Supplementary Material for this article can be found online at: https://www.frontiersin.org/articles/10.3389/fevo.2022.924941/full#supplementary-material
Afonso, M., Fonteijn, H., Fiorentin, F. S., Lensink, D., Mooij, M., Faber, N., et al. (2020). Tomato fruit detection and counting in greenhouses using deep learning. Front. Plant Sci. 11:571299. doi: 10.3389/fpls.2020.571299
Alarcon, R., Waser, N., and Ollerton, J. (2008). Year-to-year variation in the topology of a plant-Pollinator interaction network. Oikos 117, 1796–1807.
Albattah, W., Nawaz, M., Javed, A., Masood, M., and Albahli, S. (2022). Novel deep learning method for detection and classification of plant diseases. Complex Intellig. Syst. 8, 507–524.
Alzubaidi, L., Zhang, J., Humaidi, A. J., Al-Dujaili, A., Duan, Y., Al-Shamma, O., et al. (2021). Review of deep learning: concepts, CNN architectures, challenges, applications, future directions. J. Big Data 8:53. doi: 10.1186/s40537-021-00444-8
Aslan, C. E., Shiels, A. B., Haines, W., and Liang, C. T. (2019). Non-native insects dominate daytime pollination in a high-elevation Hawaiian dryland ecosystem. Am. J. Bot. 106, 313–324.
Astolfi, G., Gonçalves, A. B., Menezes, G. V., Borges, F. S. B., Astolfi, A. C. M. N., Matsubara, E. T., et al. (2020). POLLEN73S: an image dataset for pollen grains classification. Ecol. Inform. 60:101165.
Ballantyne, G., Baldock, K. C. R., and Willmer, P. G. (2015). Constructing more informative plant-pollinator networks: visitation and pollen deposition networks in a heathland plant community. Proc. R. Soc. B 282:1130. doi: 10.1098/rspb.2015.1130
Balmaki, B., Christensen, T., and Dyer, L. A. (2022). Reconstructing butterfly-pollen interaction networks through periods of anthropogenic drought in the Great Basin (USA) over the past century. Anthropocene 37:100325.
Balmaki, B., Wigand, P., Frontalini, F., Shaw, A. T., Avnaim-Katav, S., and Asgharian Rostami, M. (2019). Late holocene paleoenvironmental changes in the seal beach wetland (California, USA): a micropaleontological perspective. Quatern. Int. 530-531, 14–24.
Bartomeus, I., Ascher, J. S., Gibbs, J., Danforth, B. N., Wagner, D. L., Hedtke, S. M., et al. (2013). Historical changes in northeastern US bee pollinators related to shared ecological traits. Proc. Natl. Acad. Sci. U.S.A. 110, 4656–4660. doi: 10.1073/pnas.1218503110
Bascompte, J., Jordano, P., Meliá, N. C. J., and Olesen, J. M. (2003). The nested assembly of plant-animal mutualistic networks. Proc. Natl. Acad. Sci. U.S.A. 100, 9383–9387. doi: 10.1073/pnas.1633576100
Bell, K. L., Fowler, J., Burgess, K. S., Dobbs, E. K., Gruenewald, D., Lawley, B., et al. (2017). Applying pollen dna metabarcoding to the study of plant–pollinator interactions. Appl. Plant Sci. 5:1600124. doi: 10.3732/apps.1600124
Blüthgen, N., Menzel, F., and Blüthgen, N. (2006). Measuring specialization in species interaction networks. BMC Ecol. 6:9. doi: 10.1186/1472-6785-6-9
Bosch, J., Martín Gonzá Lez, A. M., Rodrigo, A., and Navarro, D. (2009). Plant-pollinator networks: adding the pollinator’s perspective. Ecol. Lett. 12, 409–419. doi: 10.1111/j.1461-0248.2009.01296.x
Buddha, K., Nelson, H., Zermas, D., and Papanikolopoulos, N. (2019). “Weed detection 401 and classification in high altitude aerial images for robot-based precision 402 agriculture,” in Proceedings of the 2019 27th Mediterranean Conference on Control and Automation 403 (MED), (Akko: IEEE), 280–285.
Burkle, L. A., and Alarcón, R. (2011). The future of plant-pollinator diversity: understanding interaction networks across time, space, and global change. Am. J. Bot. 98, 528–538. doi: 10.3732/ajb.1000391
Burkle, L. A., Marlin, J. C., and Knight, T. M. (2013). Plant-pollinator interactions over 120 years: loss of species, co-occurrence, and function. Science 340, 1611–1615. doi: 10.1126/science.1232728
Campos-Moreno, D. F., Dyer, L. A., Salcido, D., Massad, T. J., Pérez-Lachaud, G., Tepe, E. J., et al. (2021). Importance of interaction rewiring in determining spatial and temporal turnover of tritrophic (Piper-caterpillar-parasitoid) metanetworks in the Yucatán Península, México. Biotropica 53, 1071–1081.
Carranza-Rojas, J., Goeau, H., Bonnet, P., Mata-Montero, E., and Joly, A. (2017). Going deeper in the automated identification of Herbarium specimens. BMC Evol. Biol. 17:181. doi: 10.1186/s12862-017-1014-z
Castillo-Figueroa, D. (2018). Beyond specimens: linking biological collections, functional ecology and biodiversity conservation. Rev. Peruana Biol. 25, 343–348.
Colla, S. R., Gadallah, F., Richardson, L., Wagner, D., and Gall, L. (2012). Assessing declines of North American bumble bees (Bombus spp.) using museum specimens. Biodivers. Conserv. 21, 3585–3595.
Colom, P., Traveset, A., and Stefanescu, C. (2021). Long-term effects of abandonment and restoration of Mediterranean meadows on butterfly-plant interactions. J. Insect Conserv. 25, 383–393.
Cushing, E. (2011). Longevity of reference slides of pollen mounted in silicone oil. Rev. Palaeobot. Palynol. 164, 121–131.
Daood, A., Ribeiro, E., and Bush, M. (2016). “Pollen grain recognition using deep learning,” in Advances in Visual Computing. Lecture Notes in Computer Science, eds G. Bebis, R. Boyle, B. Parvin, D. Koracin, I. Pavlidis, R. Feris, et al. (Cham: Springer).
Dormann, C. F., Fründ, J., Blüthgen, N., and Gruber, B. (2009). Indices, graphs and null models: analyzing bipartite ecological networks. Open Ecol. J. 2, 7–24.
Dyer, L. A. (2018). Multidimensional diversity associated with plants: a view from a plant-insect interaction ecologist. Am. J. Bot. 105, 1439–1442. doi: 10.1002/ajb2.1147
Ferrarini, A., Alatalo, J. M., Gervasoni, D., and Foggi, B. (2017). Exploring the compass of potential changes induced by climate warming in plant communities. Ecol. Complex 29, 1–9.
Flagel, L., Brandvain, Y., and Schrider, D. R. (2019). The unreasonable effectiveness of convolutional neural networks in population genetic inference. Mol. Biol. Evol. 36, 220–238. doi: 10.1093/molbev/msy224
Fort, H., Vázquez, D. P., and Lan, B. L. (2016). Abundance and generalisation in mutualisticnetworks: solving the chicken-and-egg dilemma. Ecol. Lett. 19, 4–11. doi: 10.1111/ele.12535
Galanty, A., Danel, T., Wegrzyn, M., Podolak, I., and Podolak, I. (2021). Deep convolutional neural network for preliminary in-field classification of lichen species. Biosyst. Eng. 204, 15–25.
Gallardo-Caballero, R., García-Orellana, C. J., García-Manso, A., González-Velasco, H. M., Tormo-Molina, R., and Macías-Macías, M. (2019). Precise pollen grain detection in bright field microscopy using deep learning techniques. Sensors 19:3583. doi: 10.3390/s19163583
Geetharamani, G., and Pandian, A. (2019). Identification of plant leaf diseases using a nine-layer deep convolutional neural network. Comput. Electr. Engineer 76, 323–338.
Gonçalves, A. B., Souza, J. S., Silva, G. G. D., Cereda, M. P., Pott, A., Naka, M. H., et al. (2016). Feature extraction and machine learning for the classification of brazilian savannah pollen grains. PLoS One 11:e0157044. doi: 10.1371/journal.pone.0157044
Harrison, S., Spasojevic, M. J., and Li, D. (2020). Climate and plant community diversity in space and time. Proc. Natl. Acad. Sci. U.S.A. 117, 4464–4470.
Johnson, K. G., Brooks, S. J., Fenberg, P. B., Glover, A. G., James, K. E., Lister, A. M., et al. (2011). Climate change and biosphere response: unlocking the collections vault. BioScience 61, 147–153.
Jones, C. A., and Daeler, C. C. (2018). Herbarium specimens can reveal impacts of climate change on plant phenology; a review of methods and applications. PeerJ 6:e4576. doi: 10.7717/peerj.4576
Jones, G. D. (2012a). Pollen analyses for pollination research, unacetolyzed pollen. J. Pollinat. Ecol. 9, 96–107.
Jones, G. D. (2014). Pollen analyses for pollination research, acetolysis. J. Pollinat. Ecol. 13, 203–217. doi: 10.1590/s1519-566x2009000200005
Jones, G. D., and Jones, S. D. (2001). The uses of pollen and its implication for entomology. Neotrop. Entomol. 30, 341–350.
Kaiser-Bunbury, C. N., Memmott, J., and Müller, C. B. (2009). Community structure of pollination webs of Mauritian heathland habitats. Perspect. Plant Ecol. Evol. Syst. 11, 241–254.
Khanzhina, N., Putin, E., Filchenkov, A., and Zamyatina, E. (2018). “Pollen grain recognition using convolutional neural network,” in Proceedings of the ESANN 2018-Proceedings, European Symposium on Artificial Neural Networks, Computational Intelligence and Machine Learning, (Piscataway, NJ: IEEE), 409–414.
Kleijn, D., and Raemakers, I. (2008). A retrospective analysis of pollen host plant use by stable and declining bumble bee species. Ecology 89, 1811–1823. doi: 10.1890/07-1275.1
Krizhevsky, A., Sutskever, I., and Hinton, G. E. (2012). ImageNet classification with deep convolutional neural networks. NIPS 1, 1–4.
Losapio, G., de la Cruz, M., Escudero, A., Schmid, B., and Schöb, C. (2018). The assembly of a plant network in alpine vegetation. J. Veg. Sci. 29, 999–1006.
Mendes, S. B., Timóteo, S., Loureiro, J., and Castro, S. (2022). The impact of habitat loss on pollination services for a threatened dune endemic plant. Oecologia 198, 279–293. doi: 10.1007/s00442-021-05070-y
Metelmann, S., Sakai, S., Kondoh, M., and Telschow, A. (2020). Evolutionary stability of plant–pollinator networks: efficient communities and a pollination dilemma. Ecol. Lett. 23, 1747–1755. doi: 10.1111/ele.13588
Najafabadi, M. M., Villanustre, F., Khoshgoftaar, T. M., Seliya, N., Wald, R., and Muharemagic, E. (2015). Deep learning applications and challenges in big data analytics. J. Big Data 2, 1–21.
Norouzzadeh, M. S., Morris, D., Beery, S., Joshi, N., Jojic, N., and Clune, J. (2021). A deep active learning system for species identification and counting in camera trap images. Methods Ecol. Evol. 12, 150–161.
Norouzzadeh, M. S., Nguyen, A., Kosmala, M., Swanson, A., Palmer, M. S., Packer, C., et al. (2018). Automatically identifying, counting, and describing wild animals in camera-trap images with deep learning. Proc. Natl. Acad. Sci. U.S.A. 1150, 5716–5725. doi: 10.1073/pnas.1719367115
Olesen, J. M., Bascompte, J., Dupont, Y. L., and Jordano, P. (2007). The modularity of pollination networks. Proc. Natl. Acad. Sci. U.S.A. 104, 19891–19896.
O’Mahony, N., Campbell, S., Carvalho, A., Harapanahalli, S., Velasco-Hernandez, G., Krpalkova, L., et al. (2019). “Deep learning vs. traditional computer vision,” in Proceedings of the Computer Vision and Pattern Recognition Conference, (Piscataway, NJ: IEEE).
Pawar, S. (2014). Why are plant-pollinator networks nested? Mutualistic communities maximize their structural stability. Science 345:282.
Pellissier, L., Albouy, C., Bascompte, J., Farwig, N., Graham, C., Loreau, M., et al. (2018). Comparing species interaction networks along environmental gradients. Biol. Rev. 93, 785–800.
Perez, L., and Wang, J. (2017). The effectiveness of data augmentation in image classification using deep learning. arXiv [preprint]. Available online at: https://arxiv.org/abs/1712.04621 (accessed November, 2021).
Polling, M., Li, C., Cao, L., Verbeek, F., de Weger, L. A., Belmonte, J., et al. (2021). Neural networks for increased accuracy of allergenic pollen monitoring. Sci. Rep. 11, 11357–11367.
Potts, S. G., Biesmeijer, J. C., Kremen, C., Neumann, P., Schweiger, O., and Kunin, W. E. (2010). Global pollinator declines: trends, impacts and drivers. Trends Ecol. Evol. 25, 345–353.
Romero, I. C., Kong, S., Fowlkes, C. C., Jaramillo, C., Urban, M. A., Oboh-Ikuenobe, F., et al. (2020). Improving the taxonomy of fossil pollen using convolutional neural networks and superresolution microscopy. Proc. Natl. Acad. Sci. U.S.A. 117, 28496–28505. doi: 10.1073/pnas.2007324117
Salcido, D. M., Forister, M., Lopez, H. G., and Dyer, L. A. (2020). Loss of dominant caterpillar genera in a protected tropical forest. Sci. Rep. 10:422. doi: 10.1038/s41598-019-57226-9
Seltmann, K. C., Cobb, N. S., Gall, L. F., Bartlett, C. R., Basham, M. A., Betancourt, I., et al. (2017). LepNet: the lepidoptera of north america network. Zootaxa 4247, 73–77. doi: 10.11646/zootaxa.4247.1.10
Sevillano, V., and Aznarte, J. L. (2018). Improving classification of pollen grain images of the polen23e dataset through three different applications of deep learning convolutional neural networks. PLoS One 13:e0201807. doi: 10.1371/journal.pone.0201807
Sevillano, V., Holt, K., and Aznarte, J. L. (2020). Precise automatic classification of 46 different pollen types with convolutional neural networks. PLoS One 15:e0229751. doi: 10.1371/journal.pone.0229751
Silberbauer, L., Yee, M., Socorro, A. D., Weatten, S., Gregg, P., and Bowie, M. (2004). Pollen grains as markers to track the movements of generalist predatory insects in agroecosystems. Int. J. Pest Manag. 50, 165–171.
Simonyan, K., and Zisserman, A. (2014). Very deep convolutional networks for large-scale image recognition. arXiv [Preprint]. Available online at: https://arxiv.org/abs/1409.1556 (accessed November, 2021).
Stemkovski, M., Pearse, W. D., Griffin, S. R., Pardee, G. L., Gibbs, J., Griswold, T., et al. (2020). Bee phenology is predicted by climatic variation and functional traits. Ecol. Lett. 23, 1589–1598.
Strydom, T., Catchen, M. D., Banville, F., Caron, D., Dansereau, G., Desjardins-Proulx, P., et al. (2021). A roadmap towards pre-dicting species interaction networks (across space and time). Philos. Trans. R. Soc. Lond. B Biol. Sci. 376:20210063. doi: 10.1098/rstb.2021.0063
Sudta, C., Salcido, D. M., Forister, M. L., Walla, T. R., Villamarín-Cortez, S., and Dyer, L. A. (2022). Jack-of-all-trades paradigm meets long-term data: generalist herbivores are more widespread and locally less abundant. Ecol. Lett. 25, 948–957. doi: 10.1111/ele.13972
Tylianakis, J. M., Laliberte, E., Nielsen, A., and Bascompte, J. (2010). Conservation of species interaction networks. Biol. Conserv. 143, 2270–2279.
Viertel, P., and Konig, M. (2022). Pattern recognition methodologies for pollen grain image classification: a survey. Mach. Vis. Appl. 33:18.
Wagner, D., Fox, R., Salcido, D. M., and Dyer, L. A. (2021). A window to the world of global insect declines: moth biodiversity trends are complex and heterogeneous. Proc. Natl. Acad. Sci. U.S.A. 118:e2002549117. doi: 10.1073/pnas.2002549117
Wäldchen, J., and Mader, P. (2018). Machine learning for image based species identification. Methods Ecol. Evol. 9, 2216–2225.
Weiner, C. N., Werner, M., Linsenmair, K. E., and Blüthgen, N. (2014). Land-use impacts on plant-pollinator networks: interaction strength and specialization predict pollinator declines. Ecology 95, 466–474. doi: 10.1890/13-0436.1
Wood, T. J., Gibbs, J., Graham, K. K., and Isaacs, R. (2019). Narrow pollen diets are associated with declining Midwestern bumble bee species. Ecology 100:e0193822. doi: 10.1002/ecy.2697
Yamaji, F., and Ohsawa, T. A. (2016). Field experiments of pollination ecology: the case of Lycoris sanguinea var. sanguinea. J. Visual. Exp. 2016:54728. doi: 10.3791/54728
Keywords: plant-pollinator, interaction network, pollen analysis, museum collection, convolutional neural network
Citation: Balmaki B, Rostami MA, Christensen T, Leger EA, Allen JM, Feldman CR, Forister ML and Dyer LA (2022) Modern approaches for leveraging biodiversity collections to understand change in plant-insect interactions. Front. Ecol. Evol. 10:924941. doi: 10.3389/fevo.2022.924941
Received: 20 April 2022; Accepted: 29 July 2022;
Published: 30 August 2022.
Edited by:
Pamela Soltis, University of Florida, United StatesReviewed by:
Hugo Fort, Universidad de la República, UruguayCopyright © 2022 Balmaki, Rostami, Christensen, Leger, Allen, Feldman, Forister and Dyer. This is an open-access article distributed under the terms of the Creative Commons Attribution License (CC BY). The use, distribution or reproduction in other forums is permitted, provided the original author(s) and the copyright owner(s) are credited and that the original publication in this journal is cited, in accordance with accepted academic practice. No use, distribution or reproduction is permitted which does not comply with these terms.
*Correspondence: Behnaz Balmaki, YmJhbG1ha2lAdW5yLmVkdQ==
Disclaimer: All claims expressed in this article are solely those of the authors and do not necessarily represent those of their affiliated organizations, or those of the publisher, the editors and the reviewers. Any product that may be evaluated in this article or claim that may be made by its manufacturer is not guaranteed or endorsed by the publisher.
Research integrity at Frontiers
Learn more about the work of our research integrity team to safeguard the quality of each article we publish.