 Hongying Cao
 Ziwei Wang
 Xiaoyong Liao
 You Li
 Yongbing Zhu
- 1Key Laboratory of Land Surface Pattern and Simulation, Institute of Geographic Sciences and Natural Resources Research, Chinese Academy of Sciences, Beijing, China
- 2Beijing Key Laboratory of Environmental Damage Assessment and Remediation, Beijing, China
- 3University of Chinese Academy of Sciences, Beijing, China
- 4State Key Laboratory of Nuclear, Biological and Chemical (NBC) Protection for Civilian, Beijing, China
The mining and production of mineral resources can directly lead to soil and water pollution, posing a serious threat to human health. In this study, the Taojia River basin, a tributary of the Xiangjiang River, was selected as the study area. Based on the concentrations of heavy metals (As, Cd, Pb, and Zn) in 653 soil/substrate samples collected from 342 points in the study area in 2013 and 2021, the changes in soil heavy metal concentrations in the region were systematically analyzed to assess their environmental risks and impacts on regional environmental quality. The results showed that from 2013 to 2021, the As, Pb, and Zn pollution in regional soil, tailing sand, and surface water was reduced, while the Cd pollution increased. The average soil As, Pb, and Zn concentrations decreased from 3,750, 2,340, and 1,180 mg/kg to 457, 373, and 387mg/kg, respectively, while the Cd concentration increased from 0.11to 1.91 mg/kg; additionally, the overall distribution trend of heavy metal concentrations was high in the south, low in the north, and gradually decreased from upstream to downstream. The single evaluation index of heavy metal pollution risk showed that the percentages of medium to heavy pollution points in the soil As, Pb, and Zn were 84, 57, and 28%, respectively, in 2013, and this index decreased to 38, 37, and 25%, respectively, in 2021. The regional environmental quality was closely related to the intensity of mineral resource development. From 2000 to 2010, frequent mining development activities led to an increase in the area of construction land and a continuous decrease in the area of arable land, grassland, and vegetation cover in the region. During 2010–2020, the area of construction land decreased, and the vegetation coverage increased. The comprehensive evaluation index showed that the overall soil pollution risk in the watershed decreased, and the proportion of heavily polluted points decreased from 80 to 65%. It was shown by principal component analysis and factor analysis that mining development activities were the largest source of heavy metal pollution, in addition to mixed sources of tailings, solid waste, agriculture, and traffic emission sources. The results provide a scientific basis for the management and risk control of heavy metal pollution in the Taojia River basin.
Introduction
Heavy metal pollution and its environmental risks from mineral resource development activities are widely considered a global issue (Hudson-Edwards, 2016). The National Soil Pollution Survey Report (2014) reported that approximately 33.4% of soil samples around metal mines had excessive heavy metal contents (Li et al., 2019). Heavy metal elements (e.g., Pb, Zn, As, Cd, Ni, and Cu) are often discharged into the surrounding environment with media such as dust, tailings, slag, and acidic wastewater generated from mining activities, and these elements are continuously transported and dispersed through paths such as wind erosion, precipitation, surface runoff, groundwater, and artificial foul irrigation, leading to the deterioration of regional soil environmental quality (Ayrault et al., 2014; Liu et al., 2018; Wang P. et al., 2019; Zhao et al., 2020; Zhu et al., 2021). Heavy metals can enter plants and animals through inhalation, dermal contact, and ingestion, and they can accumulate along the food chain, posing serious threats to local ecological safety and human health (Cai et al., 2019; Timofeev et al., 2019; Wang S. et al., 2019).
Hunan is known as the “home of non-ferrous metals in China” and has large-scale mineral deposits in the watershed; the region has had a history of mining, processing, and smelting for over 400 years (Jiang et al., 2017; Liu et al., 2018). For a long time, pollution incidents in the basin have been frequent due to the irrational industrial structure, the sloppy development model, and the lack of supervision and management. Some studies have pointed out that Hunan has one of the highest enrichment rates of Pb, Cd, Zn, and As in the topsoil, with an average As concentration as high as 51.87 mg/kg (Cheng et al., 2015; Zhang et al., 2018). In the face of the increasing spread of soil pollution and the problem of food security under the threat of excessive heavy metal levels, local governments have introduced a series of pollution prevention and control action plans, actively promoted the remediation of legacy waste pollution and other problems in the Xiangjiang River basin, and strengthened the treatment and remediation of contaminated soil.
The exploitation of mineral resources in China is large in scale and intensity, and the accompanying environmental pollution is serious. Therefore, it is of strategic guidance to systematically study the impact of mineral resource development on regional environmental quality and its environmental risks and to resolve the pollution sources for regional soil pollution prevention and control. Pathak et al. (2015) studied the sources and spatial and temporal variations in Al, Fe, Mn, Ti, Ca, and Mg in topsoil collected from an industrial town in Haryana, India, in different seasons of the same year. Huang et al. (2021) studied the pollution around the Xiangjiang River and identified As, Cd, Pb, Cr, and Mg as the main influencing factors affecting human health. Xu Y. et al. (2021) analyzed the sources of heavy metals in the topsoil of Su Xian District, Chenzhou city, identifying four main sources of contamination, namely, dry and wet atmospheric deposition, natural sources, waste from extraction, and mixed industrial sources. However, most of the existing studies have focused on the spatial distribution and source analysis of regional soils under a single time, and few scholars have explored the impact of mineral resource development on heavy metal concentrations, environmental impacts, and their environmental risks in the Xiangjiang River basin under a long-term sequence scale.
Therefore, this study selected the Taojia River basin, a tributary of the Xiangjiang River in Hunan Province, as the study area; field surveys, sample collection, and analysis were carried out in 2013 and 2021 to systematically study the changes in the concentrations of heavy metals in soil, sediment, and surface water in the region. Additionally, the environmental impact affected by mineral resource development was evaluated by analyzing the changes in land use types, vegetation cover, and population density in the region. To assess the environmental risk of heavy metal pollution in the region, the study was carried out over a large sampling period and enabled a follow-up investigation and an analysis of the changes in the soil environment in the mineral resource development area. This research scientifically determined the evolution, the current situation, and the risk of heavy metal pollution in the Taojia River basin, providing a reference for ensuring the safety of people’s production and living in the basin. It also provided a scientific basis and theoretical support for the prevention and management of heavy metal pollution in the Xiangjiang River, affected by industrial and mining development.
Materials and Methods
Overview of the Study Area
The Taojia River is a secondary tributary of the Xiangjiang River and a primary tributary of Chunling River, which is the source of both, originating in the Xianghualing and thirty-six bay areas. The basin is located in southwestern Chenzhou city, Hunan Province, between 25°26′–25°46′ N and 112°2′–112°34′ E, with a total area of 602 km2 (Figure 1). The region has a large concentration of non-ferrous metal mines. The Taojia River basin belongs to the subtropical monsoon humid climate zone, with an average annual rainfall of 1,404 mm, an average annual sunshine time of 1705 h, an average annual humidity of 80%, and an average annual evaporation of 1,603 mm. The terrain of the basin is complex, mostly hilly, and a typical karst hilly landform.
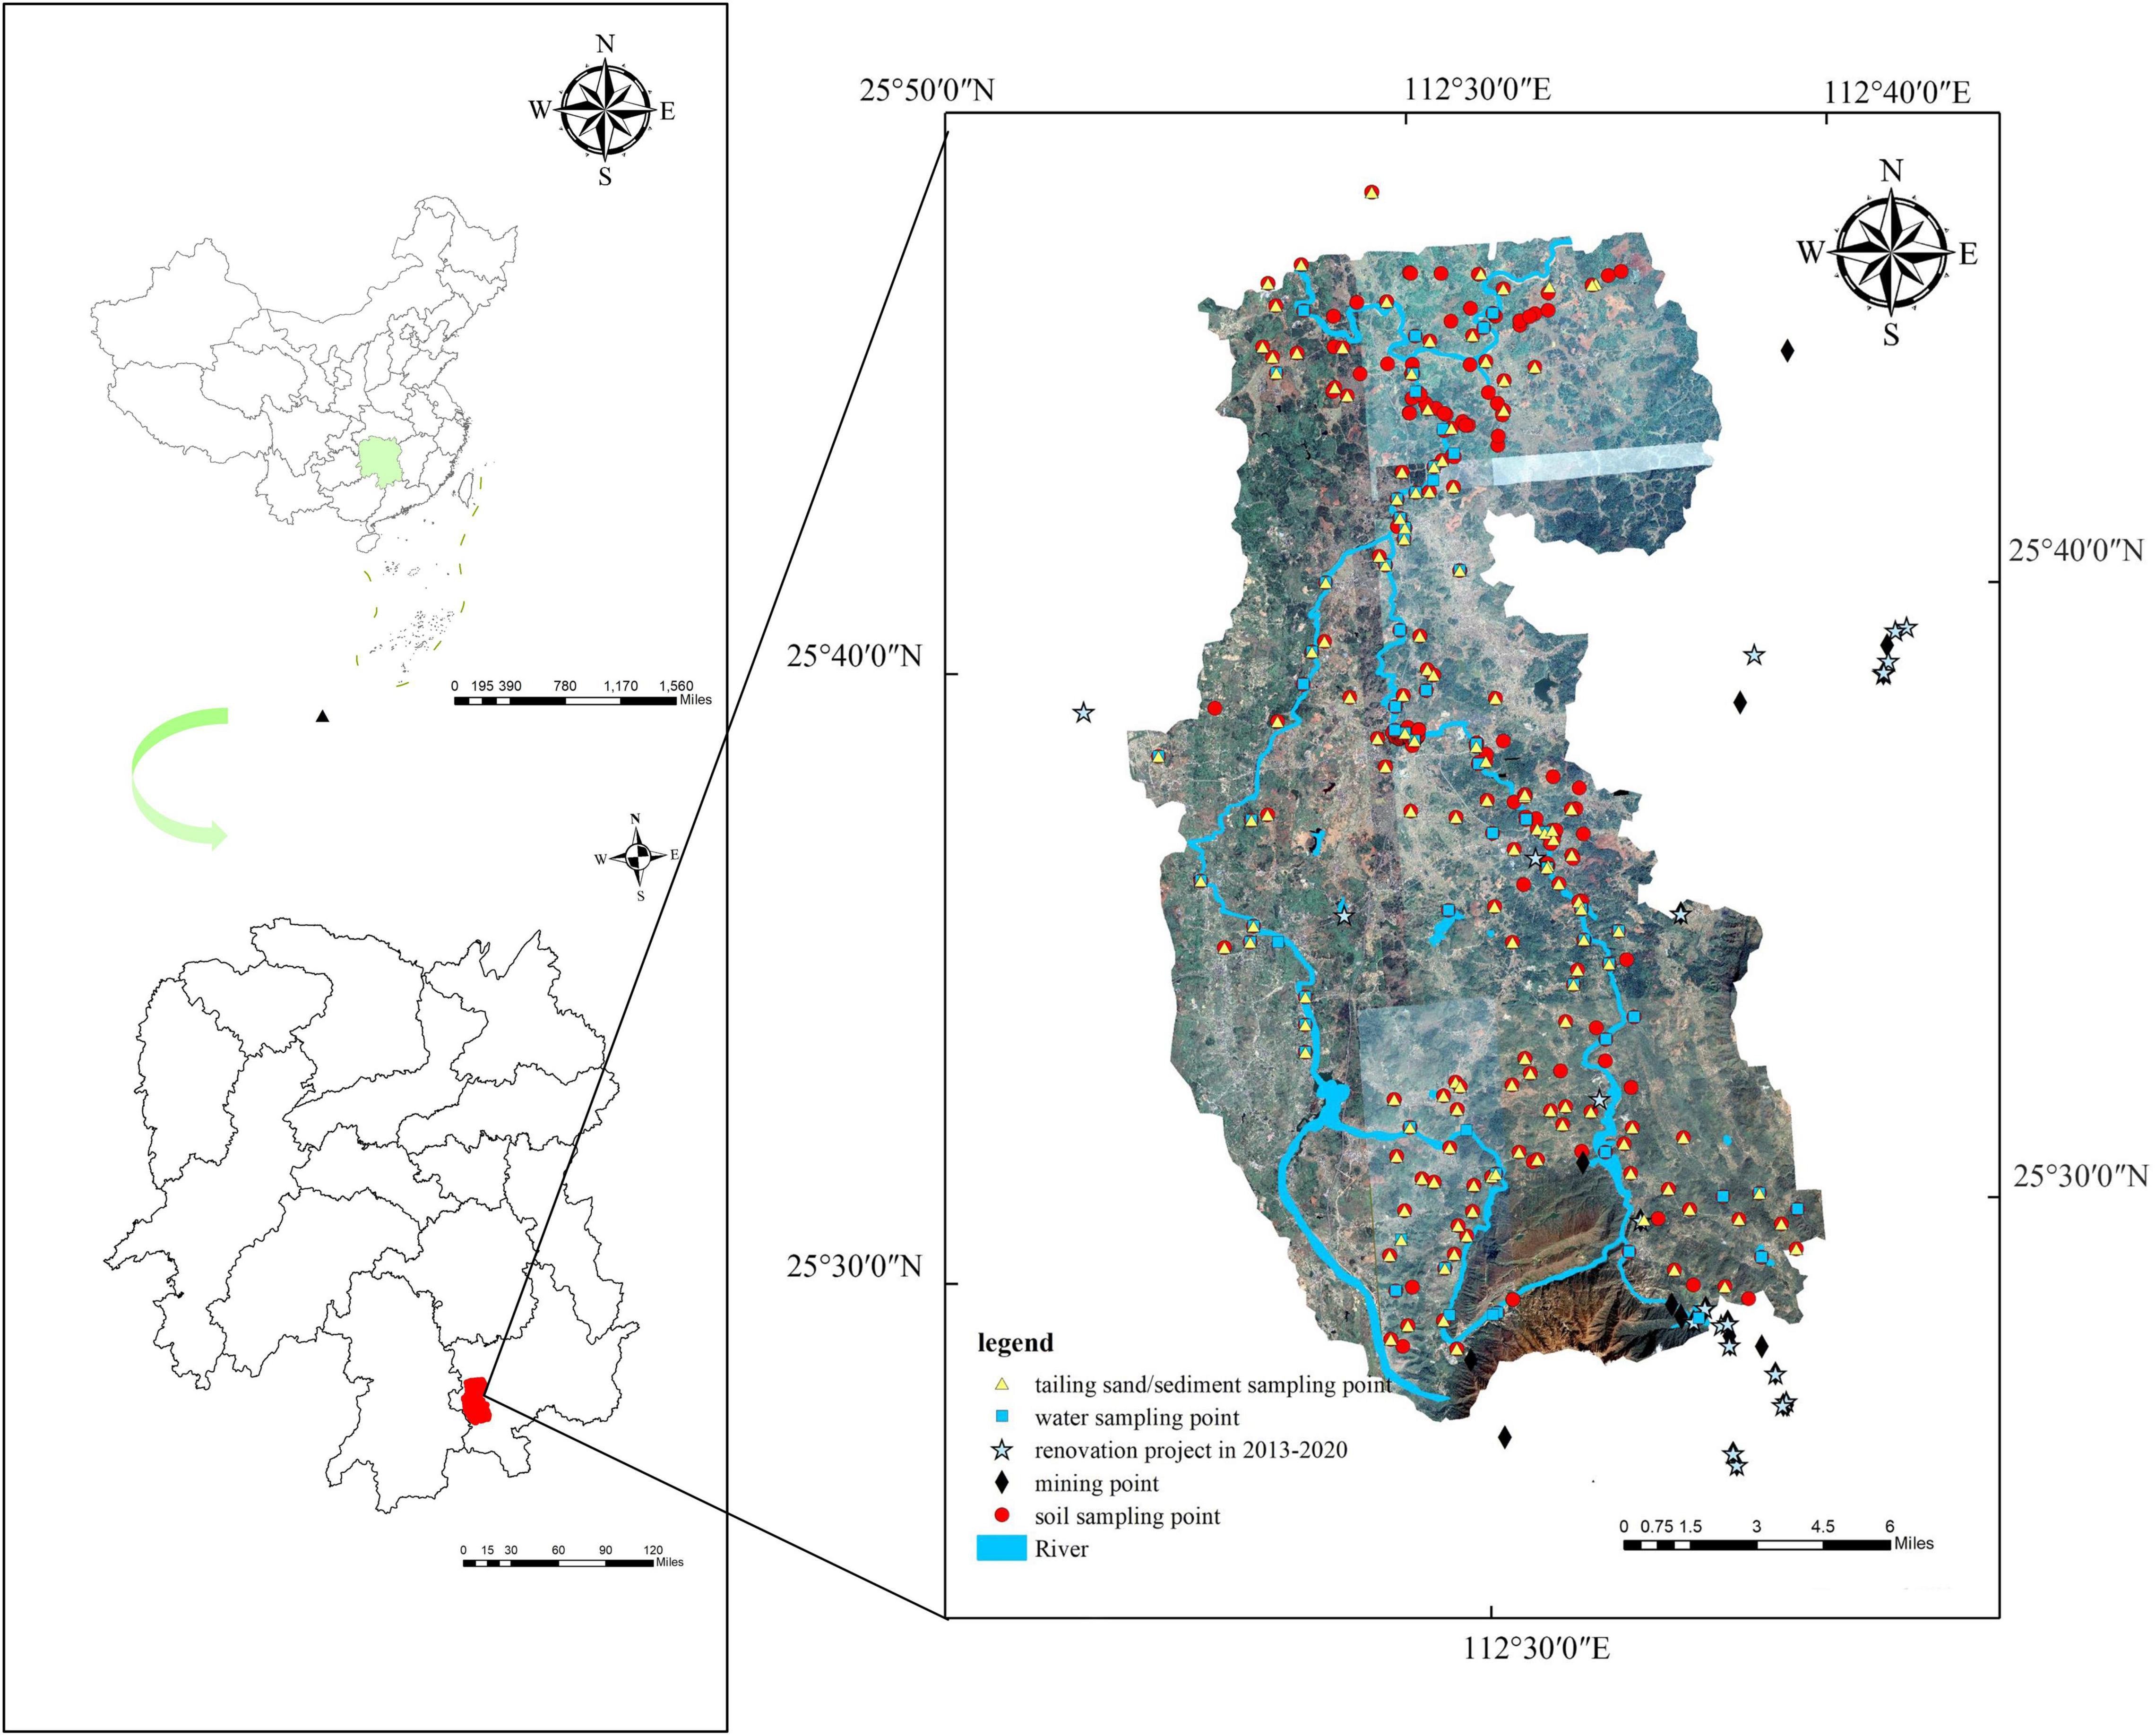
Figure 1. The geographic location and distribution of sampling points along the Taojia River.
Sample Collection and Analysis
Soil surface (0–30 cm) samples were collected from the study area, including tailings, sediments, farmland soil, and woodland soil (Boulet et al., 2020; Edori et al., 2021; Ekwere et al., 2021). Based on a 1 km × 1 km grid layout, points in the key areas and sensitive areas were encrypted, and points with an altitude greater than 1,000 m or a slope of more than 25° were discarded. In addition, obvious spots of pollution, rubbish heaps, and field ridges 100 m from main roads and railways were avoided. A total of 342 sampling points were arranged, with 643 soil supplies collected in 2013 and 2021 (in 2021, 41 sediment sample points located in the center of the river could not be sampled during the flood season). Depending on the field conditions, three sample squares (approximately 30–50 m apart) were selected near the sampling points to collect the soil mixture as the final sample to be tested.
The water samples were taken in a natural flow state without disturbing the water flow and bottom sediments, and 1,000 ml of water was taken from each sample site (2 × 500 ml water bottles). Before filling the water sample bottle, the bottle was washed three times with water from the location to prevent residue in the bottles from affecting assay results.
The collected soil samples were air-dried and demixed at room temperature, ground in a mortar, passed through a 100-mesh sieve, and stored in a refrigerator at 4°C in the dark until testing. Soil and water samples were digested by theHCl-HNO3-HF microwave airtight digestion method, and each sample was set up with 3 parallel samples. The total amount of As was determined by atomic fluorescence spectrometry (AFS), and the detection limit was 0.01 mg/kg. Inductively coupled plasma-mass spectrometry (ICP–MS) was used to determine the total amount of Cd, Pb, and Zn, and the detection limits were 0.01, 1.0, and 1.0 mg/kg, respectively. The calibration of the standard curve was carried out with heavy metal standard solutions to ensure that the measurement error of the instrument was less than 2%. The national standard soil sample GSS series was used for quality control to guarantee that the sample error range was less than 5%, and the standard addition recovery rate was more than 85%.
Evaluation Methods of Heavy Metal Pollution
The geo-accumulation index was used to evaluate the pollution characteristics of a single factor, and the Nemerow composite pollution index (NCP) method was used to assess the composite pollution in the basin (Hu et al., 2019). The limit selection was based on the “Soil Environmental Quality Agricultural Land Soil Pollution Risk Control Standard (GB15618-2018),” and the background value referred to the background value for soils in Hunan Province in “China Element Soil Background Value.”
Data Collection and Analysis
To investigate the impact of mineral resource development on the regional ecological environment, in addition to analyzing and comparing the changes in the heavy metal concentrations of soil, sediment, and water samples, we screened indicators such as land use type, vegetation coverage, and population density for comparative analysis. The basic geographic data used in this study came from the China Resources and Environmental Science Data Center (CRESC), and data included administrative divisions, topography, road traffic, and land use data related to the Taojia River basin. The land use data were obtained from the ASTER GDEM 30 m resolution digital elevation model. The normalized difference vegetation index (NDVI) data came from the Fengyun Satellite Remote Sensing Data Service Network and LAADS WEB, and the data had a spatial resolution of 30 m × 30 m. Statistical values of population data were mainly from the county statistical yearbook and the statistical data provided by local departments. The data analysis and mapping software were OriginPro2020 and MATLAB 2014, and the remote sensing image processing and analysis software included ERDAS, ENVI5.0, and ArcGIS 10.4.
Results and Discussion
Impact of Mineral Resource Development on Changes in Environmental Quality
Changes in Regional Soil Heavy Metal Concentrations
The regional soil heavy metal concentrations varied and are shown in Figure 2. The results showed that the mean concentrations of heavy metals in the soil all exceeded the soil environmental background values and environmental quality standards (except for Cd-2013), and there were significant differences within the 95% confidence interval. The mean values of As, Pb, and Zn in the regional soil decreased from 3,750, 2,340, and 1,180 mg/kg to 457, 373, and 387 mg/kg, respectively, and the peak concentrations remained at high levels. Statistically, the exceedances of As, Pb, and Zn declined from 92, 85, and 68% to 73, 54, and 53%, respectively. It is worth noting that the average Cd concentration increased from 0.11to 1.91 mg/kg, and the exceedance rate increased significantly from 1.3 to 15%. In terms of the coefficient of variation of heavy metal contents, the coefficients of variation of As, Cd, Pb, and Zn in 2013 were 202.1, 162, 241.2, and 114.7%, respectively, while in 2021, the values were 196.9, 230.1, 176.6, and 145.2%, respectively, and the data showed extremely high variability, indicating that regional soil heavy metals have strong spatial heterogeneity.
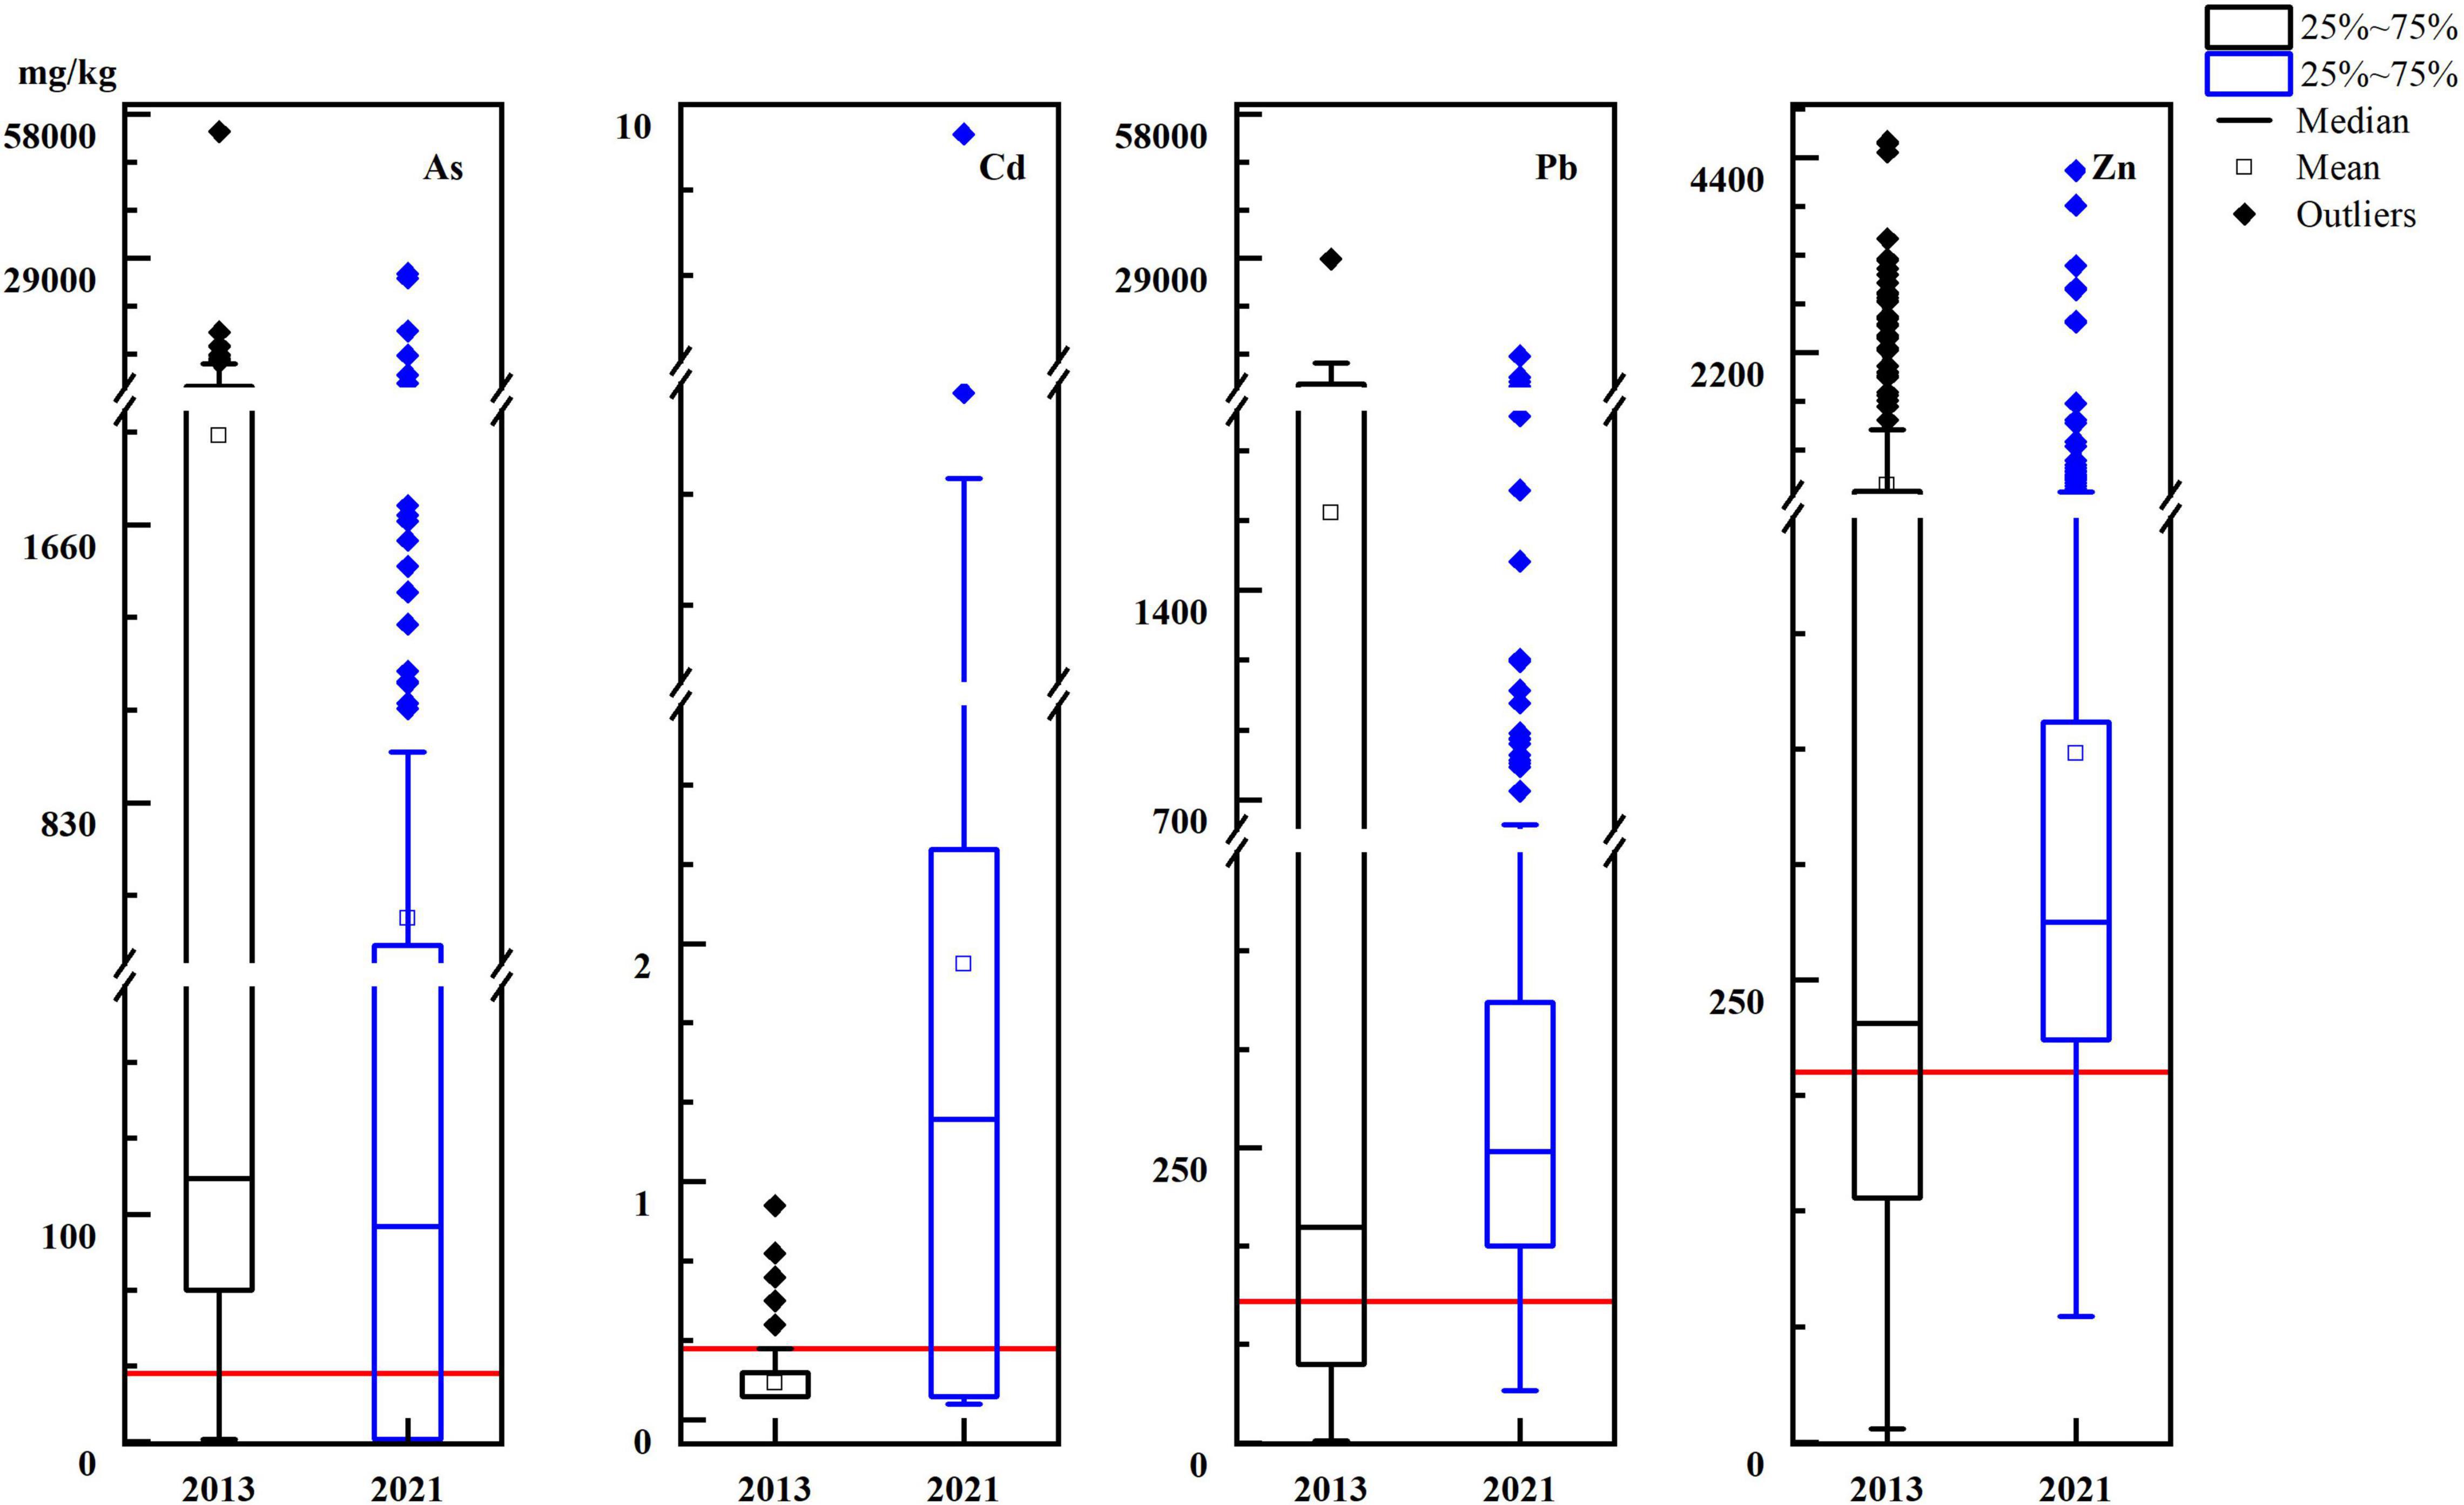
Figure 2. Measured value of soil heavy metals in the study area.
In general, the improvement in regional soil heavy metal (As, Pb, and Zn) pollution between 2013 and 2021 was mainly attributed to a series of comprehensive heavy metal treatment projects and ecological restoration efforts carried out by the state and government within the Taojia River basin. The control engineering measures were mainly river dredging and lining, combined with measures to cover, isolate, and clean up river tailings; these efforts reduced ecological pollution and flooding hazards in the basin to a certain extent. The contents of heavy metals such as Pb and As in the watershed environment are mainly affected by the source input and are easily deposited in solid phases such as tailings and substrates during environmental transportation (Syed et al., 2017). This phenomenon was more pronounced in the regional environment affected by sulfidic mines. Therefore, the source control measures that have been implemented like dredging have been effective in mitigating regional As, Pb Zn, and other pollution. Unlike other heavy metals, the scope of Cd pollution in the region continued to expand, and the degree of pollution increased. This is because Cd mostly exists in the environment in a dissolved state. As a karst landform, the high Cd background value and acidic environmental conditions could further promote the migration, diffusion, and accumulation of Cd in the soils and water in the basin. This phenomenon was also confirmed in previous studies (Shao et al., 2016; Huang et al., 2018).
Variation in Heavy Metal Concentrations in River Sediment
As tailings/sediment in Class II are defined as general solid waste, referring to the Class III standard for surface water/groundwater, and the concentrations of As, Cd, Pb, and Zn all exceeded the limits. Based on the test results (Figure 3), the extreme values of As, Pb, and Zn in the tailings were significantly reduced from 54,500, 28,800, and 8,150 mg/kg, respectively, to 31,300, 4,410, and 3,420 mg/kg, respectively. The exceedance rates of As, Pb, and Zn in water decreased from 67, 65, and 48% to 44, 12, and 22%, respectively. The highest value of Cd in tailings was 1.8 mg/kg, and the exceedance rate of Cd in water increased from 65 to 86%. Concentrated tailings and other related projects, such as dredging, significantly reduced the levels of As, Pb, and Zn contamination in tailings and sediments but did not affect the contamination of Cd (Migaszewski et al., 2022).
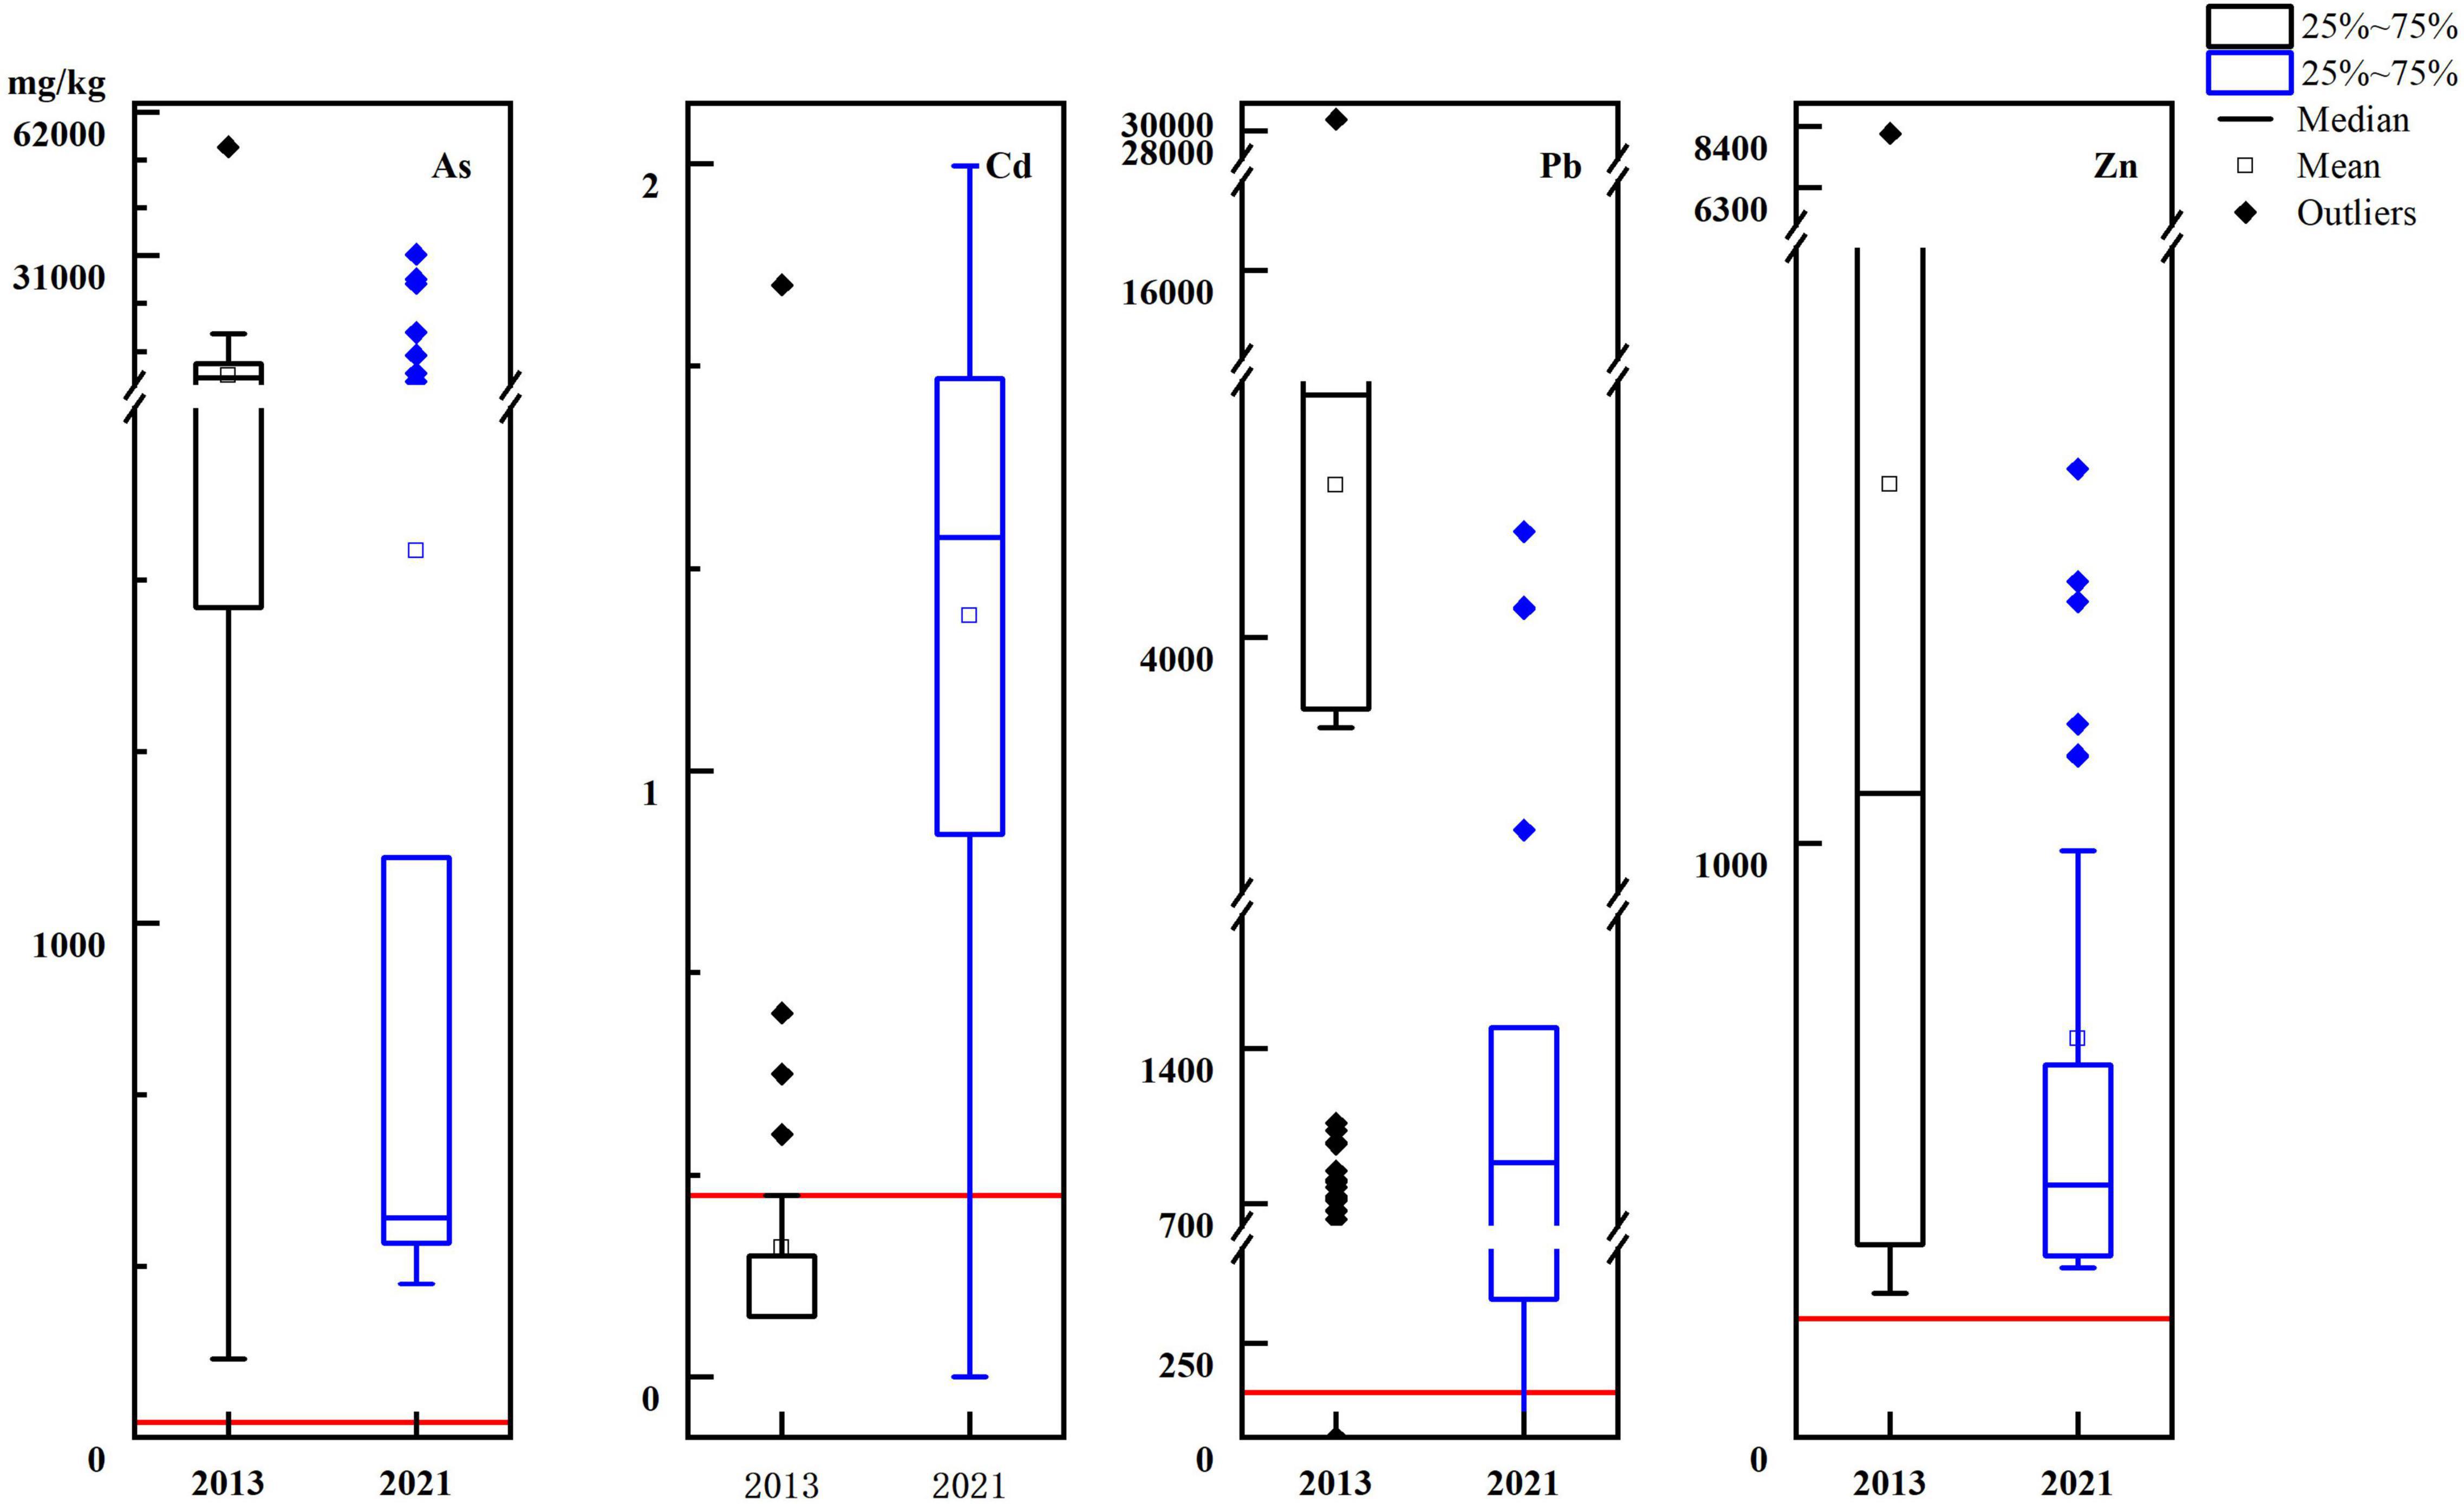
Figure 3. Measured values of heavy metals in tailings sand in the study area.
Changes in Heavy Metal Concentrations in the Waters of the Basin
Descriptive statistical analysis of heavy metal elements was conducted using 77 water samples collected in 2013 and 56 water samples collected in 2021 (Figure 4). In 2013, the concentrations of As, Cd, Pb, and Zn in the surface water of the basin were 1.87–1319, 0.03–84, 0.01–788, and 8.39–4,040 μg/L, respectively, with exceedance rates of 17, 10, 7.8, and 12%, respectively, indicating that the water of the basin was severely polluted. Among water samples from the Taojia River in 2021, the concentration ranges of As, Cd, Pb, and Zn were 0.16–105, 0.04–51.8, 0.06–49.57, and 0.15–220 μg/L, respectively. The concentrations of As, Cd, and Zn exceeded their standards, with exceedance rates of 7.12, 4.16, and 4.71%, respectively. Over time, the water contamination in the basin has improved, and the average concentrations of heavy metal elements have decreased significantly. In particular, none of the water body samples collected in 2021 exceeded the standard for Pb, and the highest reduction rate was observed for Zn, which reached 12.83%. The exceedance rates of Cd and As in the water bodies decreased by 7.29 and 0.68%, respectively.

Figure 4. Measured value of heavy metals in water in the study area.
Based on a comprehensive analysis of the sampling point concentrations and sampling locations, we found that the heavy metal pollution in the basin water was generally higher in the south and lower in the north, with a gradually decreasing distribution trend from upstream (Linwu) to midstream (Jiahe) to downstream (Guiyang). This phenomenon was mainly due to frequent mining activities that occur around the Thirty-Six Bay Mining Area in Linwu County, where the peak levels of As, Cd, Pb, and Zn were concentrated; these activities result in the severe pollution of surface waters, while the dilution effect of waters in the middle and downstream sections effectively reduced the concentrations of different heavy metals. In addition, there were obvious hot spots of heavy metal enrichment in the vicinity of industrial parks where industrial and mining industries are concentrated, with a few high-value areas scattered in the midstream section and the rest of the non-polluted areas. Moreover, the average pH value of the regional water body was 6.721, which was weakly acidic and accelerated the migration of metal elements to the middle and downstream sections.
Impact of Mineral Resource Development on the Regional Ecological Environment
Changes in Land Use Types
The changes in land use types in the region are shown in Figure 5, which indicates that the Taojia River basin is dominated by forestland, arable land, grassland, and construction land. The distribution of forestland in the basin was scattered and mainly included sparse woodland and shrub forest; arable land was scattered along the river, mainly in the mountainous areas located in the center and south, and grassland was mainly distributed in the mountainous areas where mining activities are prosperous in the department and the southern part. Apart from the Taojia River, there are few water sources in the region, including several small reservoirs. The area of industrial and mining land in the Taojia River basin increased rapidly in the first decade. The areas of industrial and mining, grassland, and other construction land far exceeded the areas of cultivated land and forestland in 2010. Among them, the area of industrial and mining land was 104.2 km2, which was twice the area of arable land, and the construction land was scattered in the region.
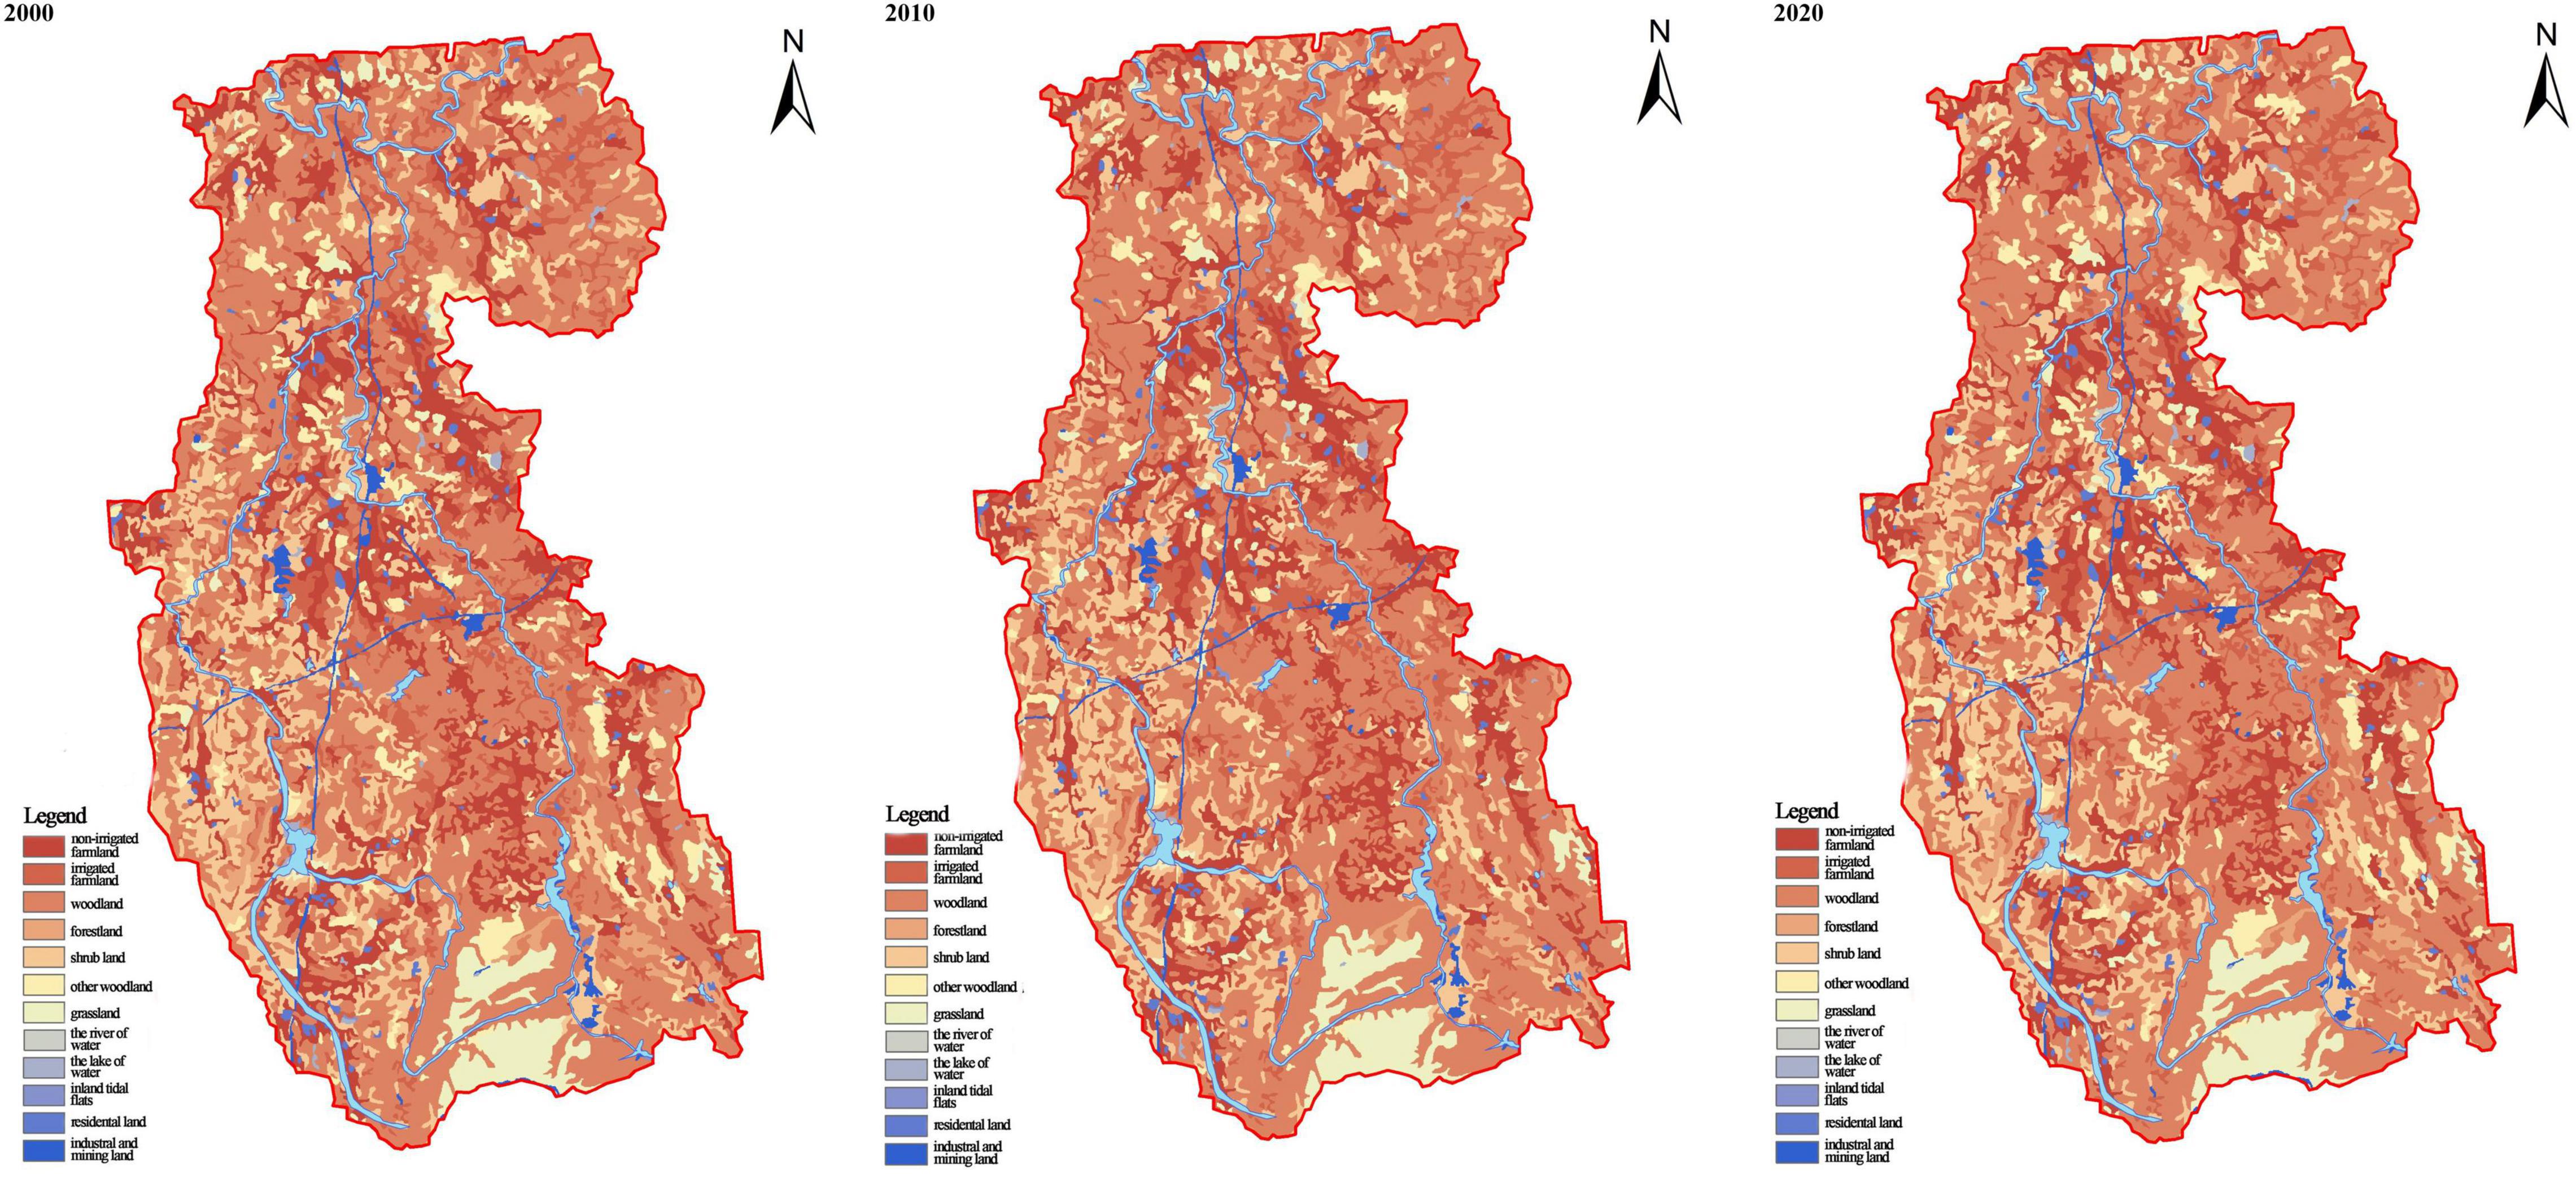
Figure 5. Land use types and distribution maps in the study area.
The land use transfer matrices for the two periods 2000–2010 and 2010–2021 were calculated based on the land use data of the two phases, and the changes in the types and areas of land use transferred out/in for the two periods were counted separately, as shown in Table 1. During the period 2000–2021, the area of arable land continued to decrease, and the area of forestland continued to increase. According to calculations, compared to 2000, the area of cultivated land declined by more than 40% in the past 20 years. In the first decade, the area of construction land increased significantly, and the grassland area decreased, while the opposite trend was observed between 2010 and 2021. The areas of residential land and water area in the region were relatively stable, with small changes. Changes in land use types were closely related to factors such as topography, mineral resource development, and national policies. The continuous decrease in the area of arable land in the region was mainly attributed to frequent mining activities and the flooding of tailings. In addition, the study area is mostly mountainous and hilly, with scattered cultivated land, combined with a low level of mechanization and a low recultivation rate after abandonment. After 2010, the national government formulated a series of targeted environmental protection management efforts and implemented a regional environmental pollution comprehensive remediation action plan, and some of the waste gas mine sites were restored to grassland through comprehensive treatments.
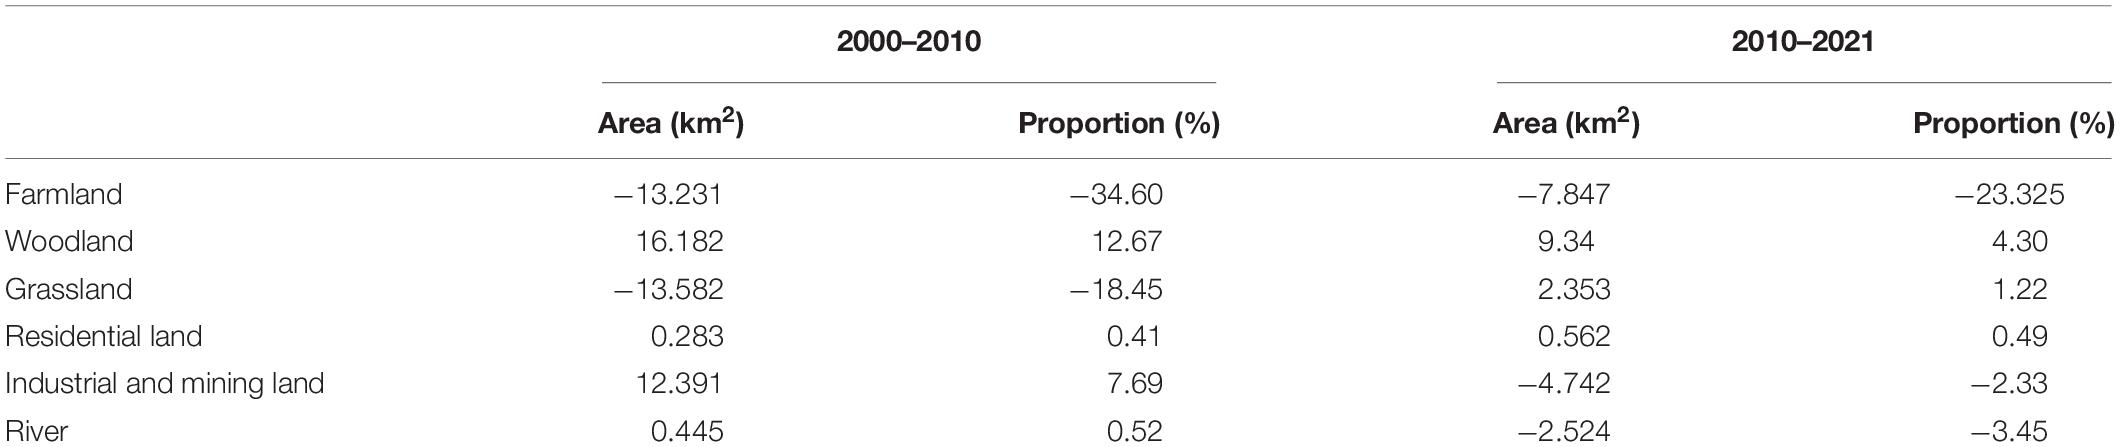
Table 1. The dynamic changes in land use in the study area.
Changes in Vegetation Coverage
Vegetation coverage is an essential indicator for measuring the ecological environment of a watershed. As a component of the ecological environment, vegetation can both directly characterize environmental change processes and interact with other drivers of the natural environment, such as hydrological conditions, soil conditions, and the climatic background. Therefore, the temporal and spatial changes in the correlation index with vegetation are clear indicators of environmental change in the study area. To further explore the spatial distribution of the vegetation coverage NDVI in the study area, the average annual NDVI values from 2001 to 2010 and 2010 to 2021 were calculated to reflect the vegetation growth in the basin. We classified the vegetation cover into the following five classes: 0–0.1 very low cover, 0.1–0.3 low cover, 0.3–0.5 medium cover, 0.5–0.7 medium-high cover, and >0.7 high cover, and the results are shown in Figure 6.
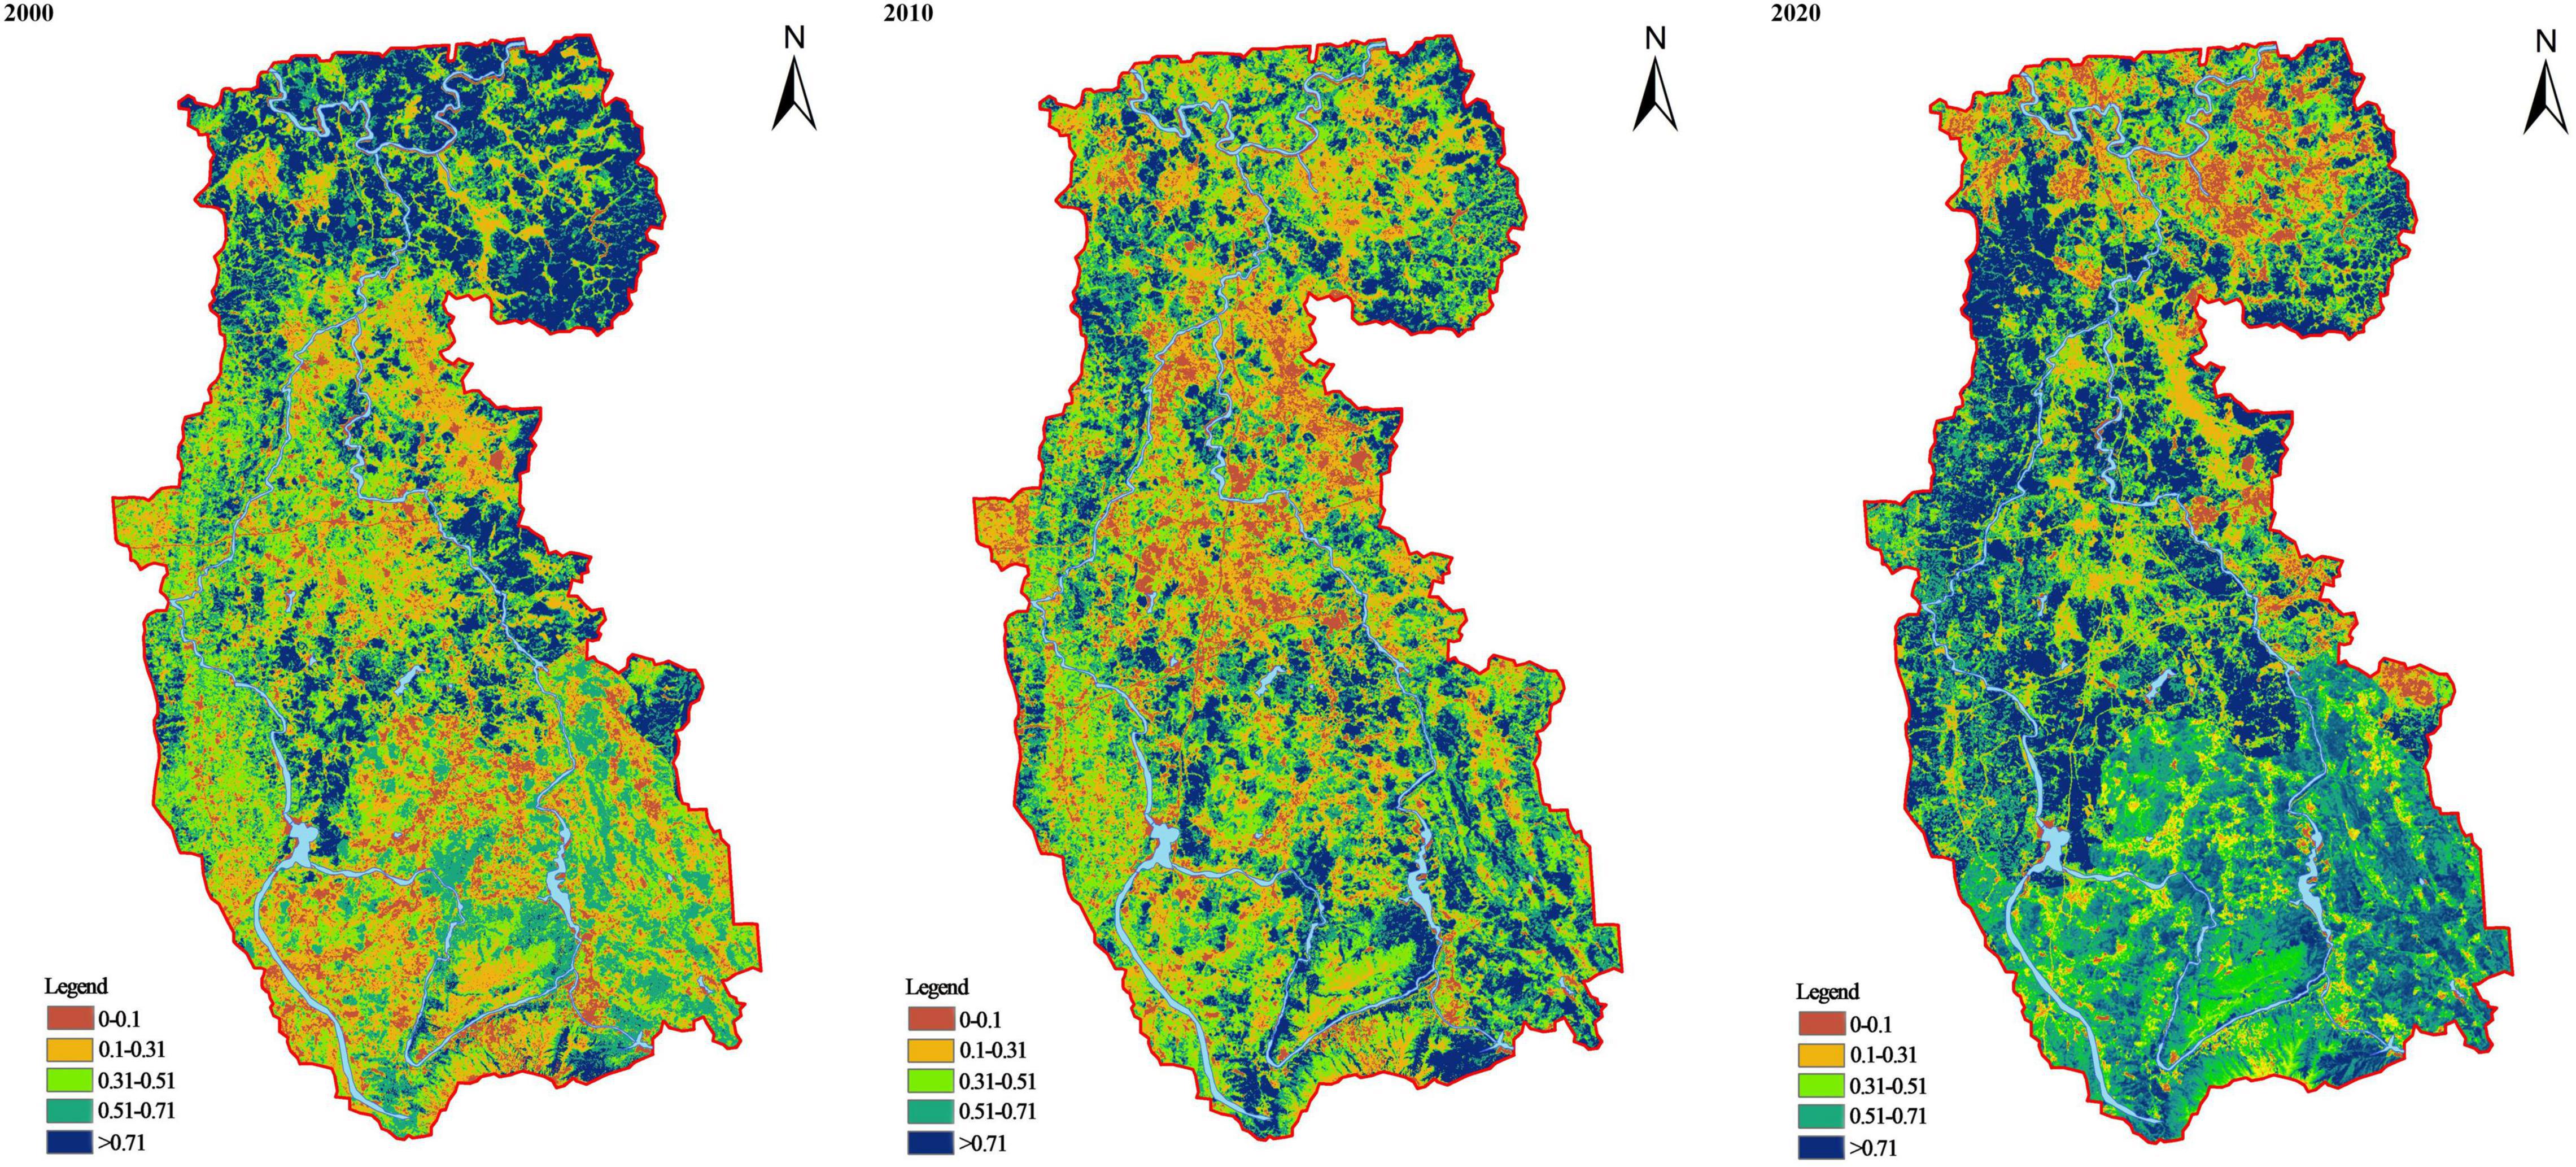
Figure 6. The distribution maps of the NDVI in the study area.
The NDVI distribution of vegetation coverage in the area varied greatly, mainly showing an increasing trend from north to the southeast (Figure 6). The highest NDVI value appeared at the border between Xiang Hua town and Guiyang County, where the main vegetation type was artificially reverted to subtropical deciduous forest, while the lowest value was found in Puman Township of Jiahe County. From 2000 to 2010, the average value of the NDVI was 0.375, and from 2010 to 2021, the average value of the NDVI was 0.483. In general, the area with low NDVI values decreased, and the area with high NDVI values increased, which indicated that the vegetation cover has been improving in the region. The proportion of low cover (0.1–0.3) showed a decreasing trend, with the proportion of very low cover (0–0.1) decreasing from 3.4% in 2000 to 0.2% in 2021. In the southern part of the study area, the vegetation cover in Linwu County improved most significantly, with the proportion of medium or above cover increasing from 30.4 to 60.7%, indicating a significant improvement in vegetation cover in the area, which has had a significant positive effect on the ecological environment of the watershed. The north-eastern part of the study area has an agglomeration of non-ferrous polymetallic mines, and the vegetation coverage declined sharply from 2000 to 2010, while the average vegetation coverage in Guiyang County declined from 0.417 to 0.223. From 2010 to 2021, the vegetation coverage improved due to relevant policy controls and changes in land use types.
Changes in Population Density
The population density was calculated with 1 km × 1 km as the unit area, and inverse distance weighting was used for interpolation. Combined with the population density raster data map identified from the light data, a population density map was drawn (Figure 7). As seen from the figure, the population is mostly concentrated in the central and southern areas of the study area, where the elevation is lower and flatter. In addition, there are concentration hot spots around the sites where large deposits are mined and around hydroelectric power stations. This result is because the study area is mostly hilly and mountainous, with a low level of urbanization and a discrete distribution of administrative villages, and there are clusters of hot spots along rivers and in industrial and mining activities. Although the Xianghualing area of the Thirty-Six Bays has many mining industries, most are located in mountainous areas and have a relatively small population. In particular, the change in administrative planning of the townships in Jiahe County in 2009 and 2015 significantly affected the population density distribution in the central part of the study area.

Figure 7. Population density map in the study area.
Evaluation of the Risk of Integrated Heavy Metal Contamination of Soil in the Taojia River Basin
The geo-accumulation index method was used to calculate the single-factor pollution indices of As, Cd, Pb, and Zn (Table 2), and the classification of pollution levels and their proportions (Figure 8). The results showed that the average values of the As, Pb, and Zn pollution indices in 2021 were lower than those in 2013, the point exceedance rate gradually decreased from upstream to downstream, and the proportion of uncontaminated to moderately contaminated (igeo ≤ 1) increased significantly, indicating that the regional As, Pb, and Zn contamination risks had a decreasing trend. The rate of As exceedance of the standard rate declined significantly, from 97 to 67%. In 2013, the pollution of As (igeo > 1) accounted for 84.04%, and this indicator declined to 37.5% by 2021. At this stage, pollution was mainly mild to moderate (78.75%). The regional Pb exceedance rate was always approximately 90%, the proportion of extremely heavy pollution decreased, and the proportion of mild to moderate pollution increased by 21.02%. The exceedance rate of Zn increased slightly over time, and the proportions of uncontaminated to moderately contaminated (0 < igeo ≤ 1) and extremely contaminated (igeo > 5) increased by 19.89 and 11.46%, respectively. It is worth noting that the Cd exceedance rate increased from 8.78% in 2013 to 41.75% in 2021, and the proportion of contamination (igeo > 0) increased significantly.
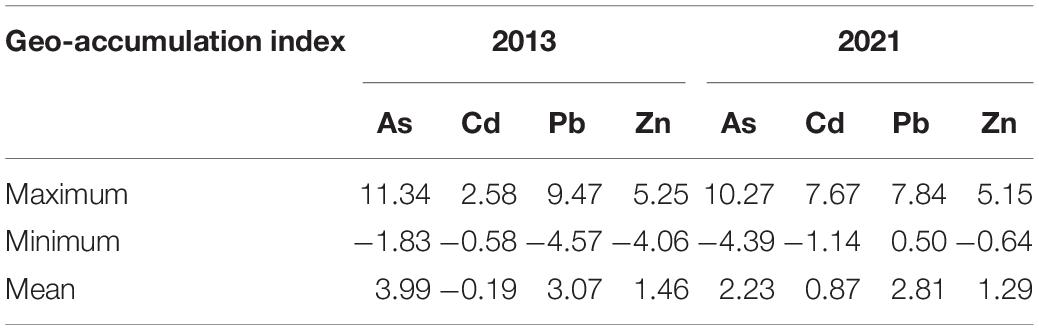
Table 2. Geo-accumulation index of heavy metals.
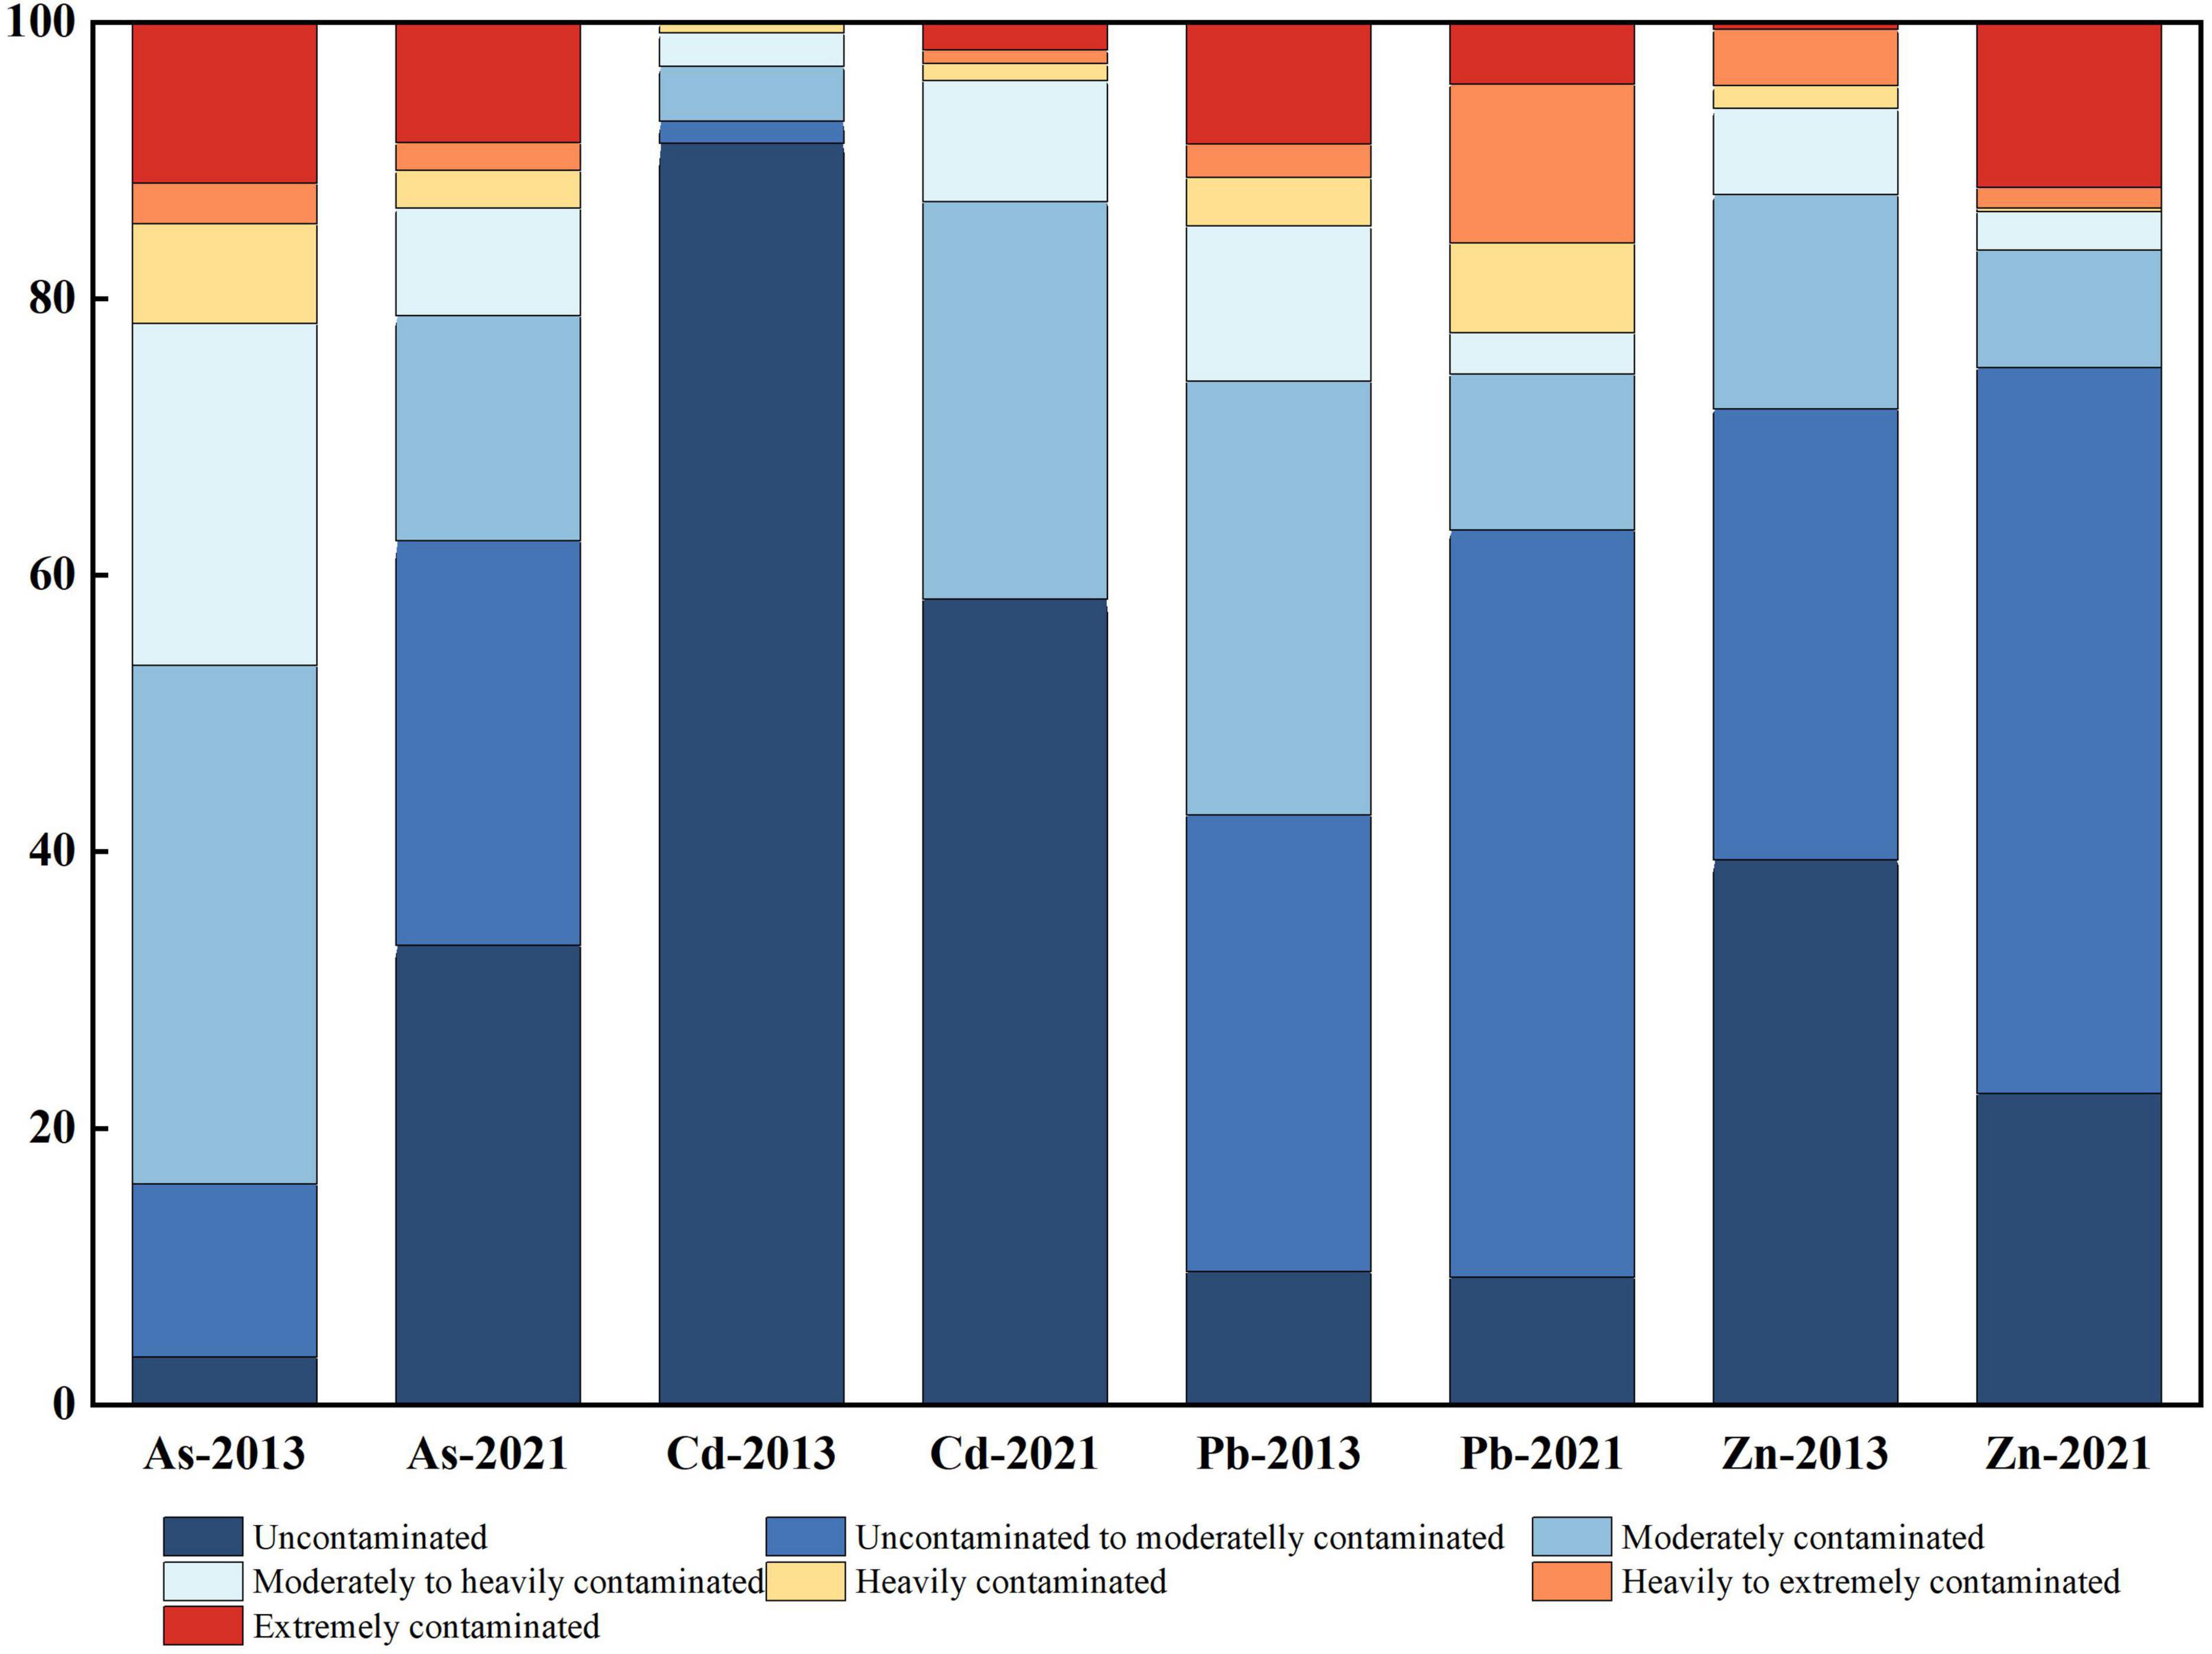
Figure 8. Comparison of pollution results of the cumulative index in the study area.
The Nemerow pollution integrated index method was used to calculate the regional pollution levels under the combined effect of multiple heavy metals. Figure 9 shows the distribution of the integrated pollution index evaluation results, and specifically, the average value of the integrated pollution index in 2013 was 6.78 (0.46∼34.62), with safe points accounting for 4 and 13%, mainly distributed in the central and western parts of the study area. The proportion of serious pollution was as high as 80%, mainly distributed in the north-eastern part of the study area and the southern part of Xianghualing town, Thirty-Six Bay area. The average value of the composite index in 2021 was 4.53 (0.12∼41.66), the ranking of the safety rating remained unchanged, and the pattern of risk distribution was basically the same. The proportion of light pollution was 11 and 16%, and the proportion of serious pollution declined to 65%. Overall, the pollution level of the Taojia River basin improved overall, but it is still necessary to strengthen control and management.
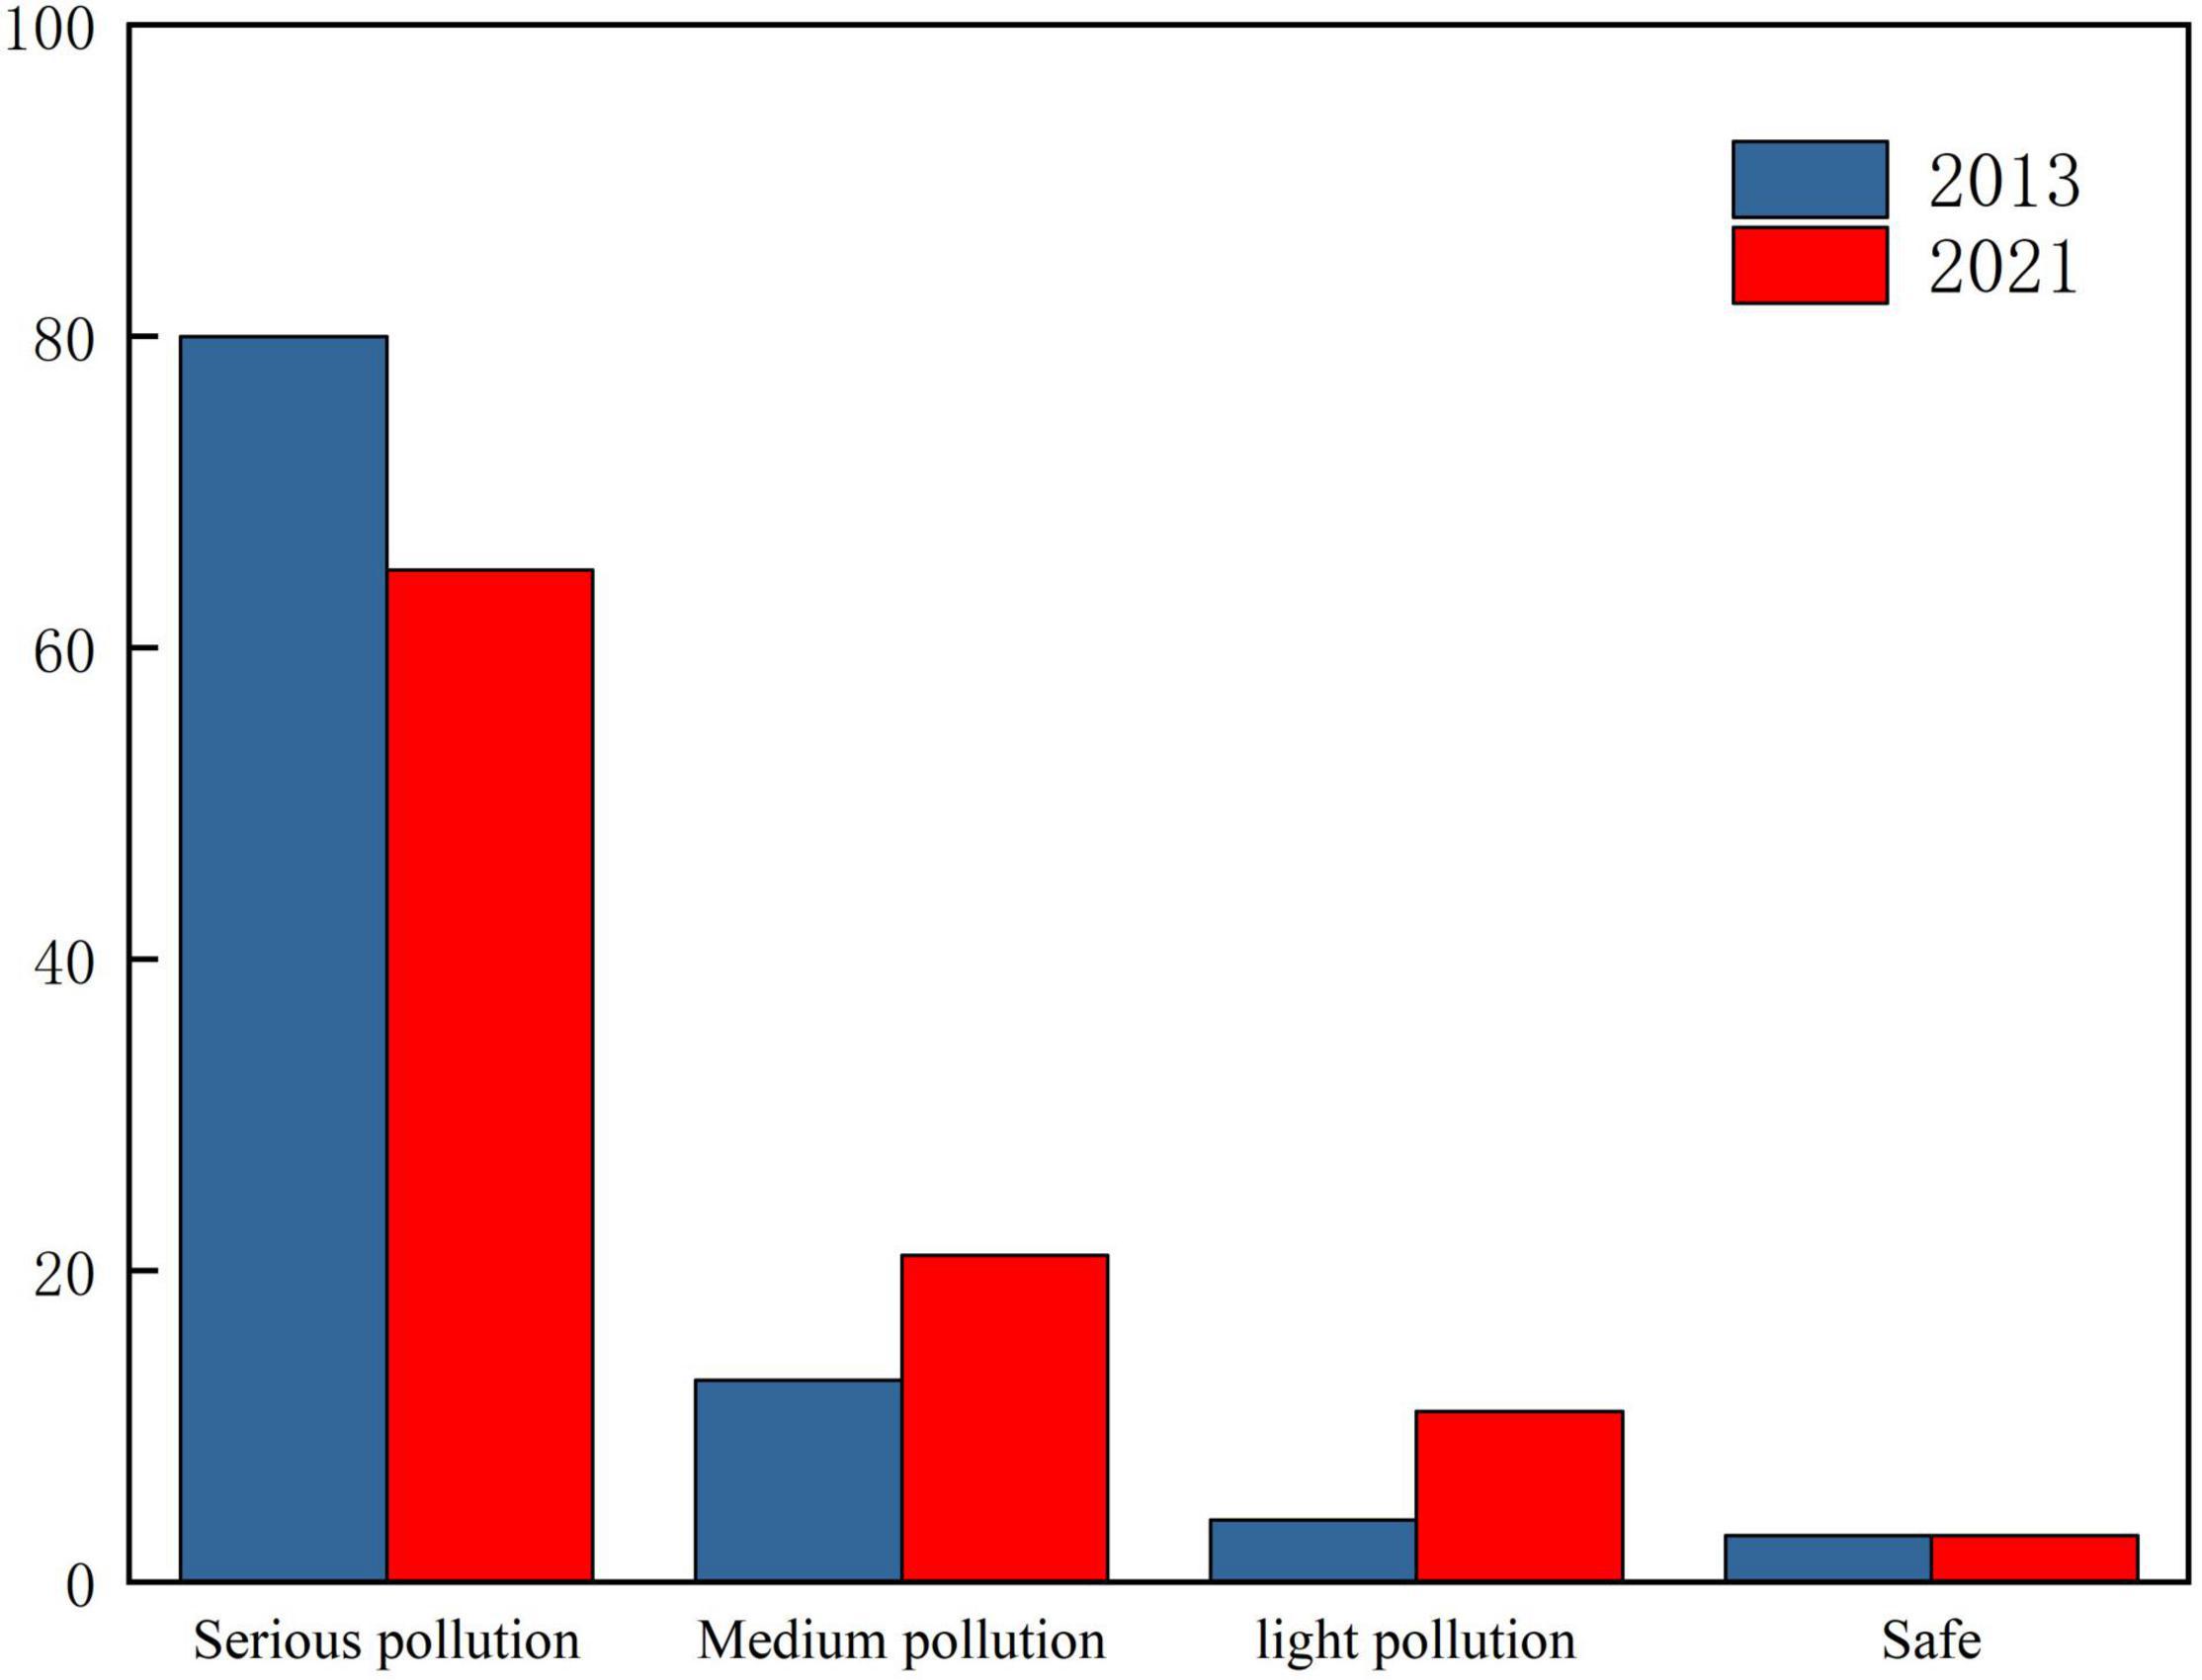
Figure 9. Comparison of the pollution load index results in the study area.
Regional Pollution Source Identification and Analysis
The study area is located in the southern part of Hunan Province, where the background soil content is much higher than other local levels (Zhang et al., 2019; Zhao et al., 2020; Zhong et al., 2020), and the endogenous parent material and natural soil formation processes in karst limestone areas are one of the essential sources of regional heavy metal pollution (Zhang and Wang, 2020; Xu D. M. et al., 2021; Zhu et al., 2021). However, the heavy metal concentration data collected in this study were much higher than the soil background value, indicating that the input of human activities is the main cause of regional heavy metal pollution.
The first three principal components were extracted according to the principle that the eigenvalues of the matrix λ > 1, and they accounted for 95.1% of the total variance (Figure 10). The patterns of the factor loading values of heavy metal elements in 2013 and 2021 were similar, indicating that the year-to-year variation in each heavy metal element pollution source was small (Figure 11). The Exner function values for all factors were less than 0.1, and the cumulative contribution CV values were greater than 95% for the three principal factors selected, indicating a strong correlation between the factors.
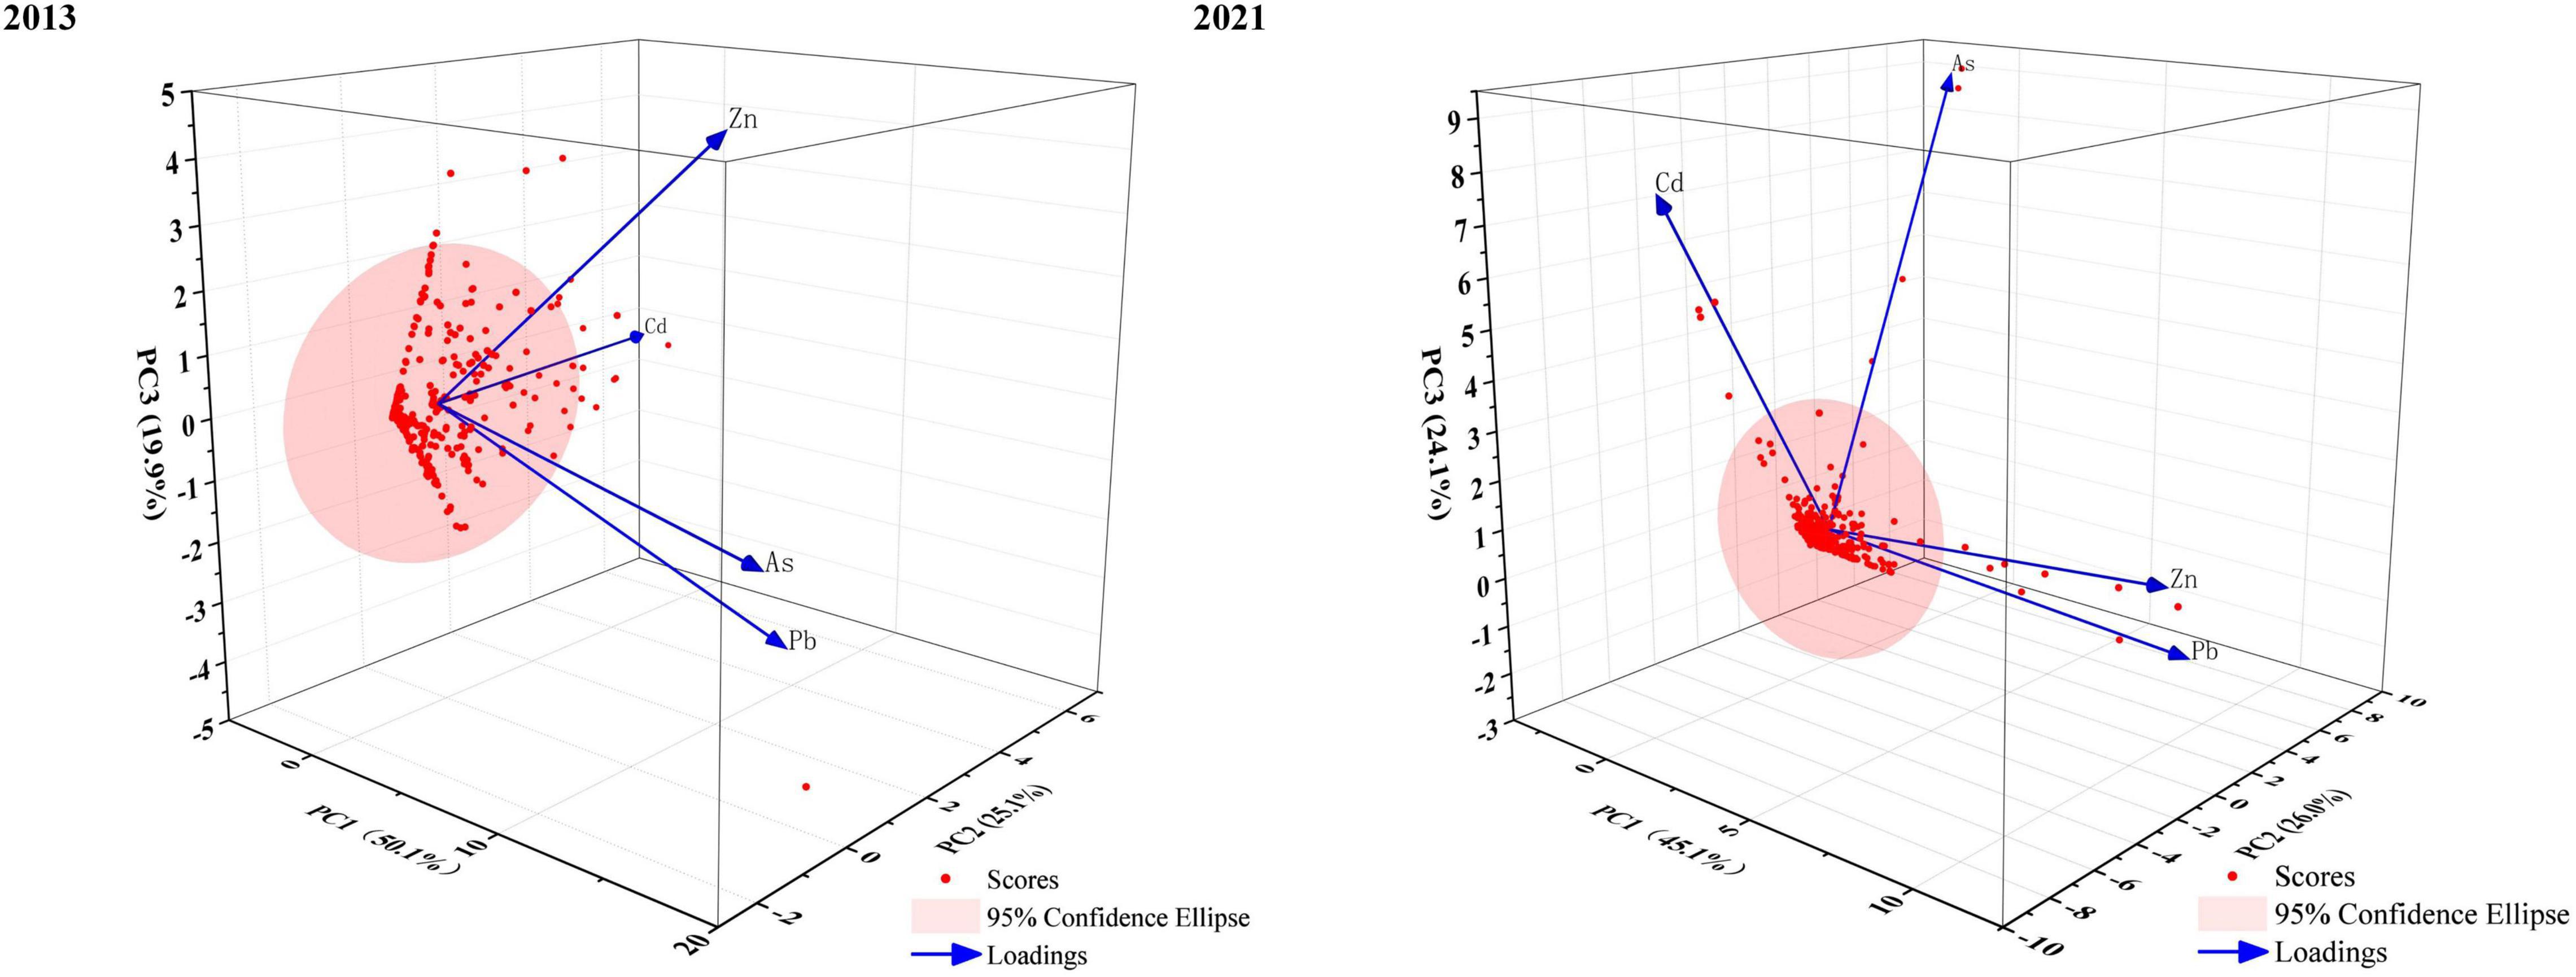
Figure 10. Analysis results of PCA in the study area.
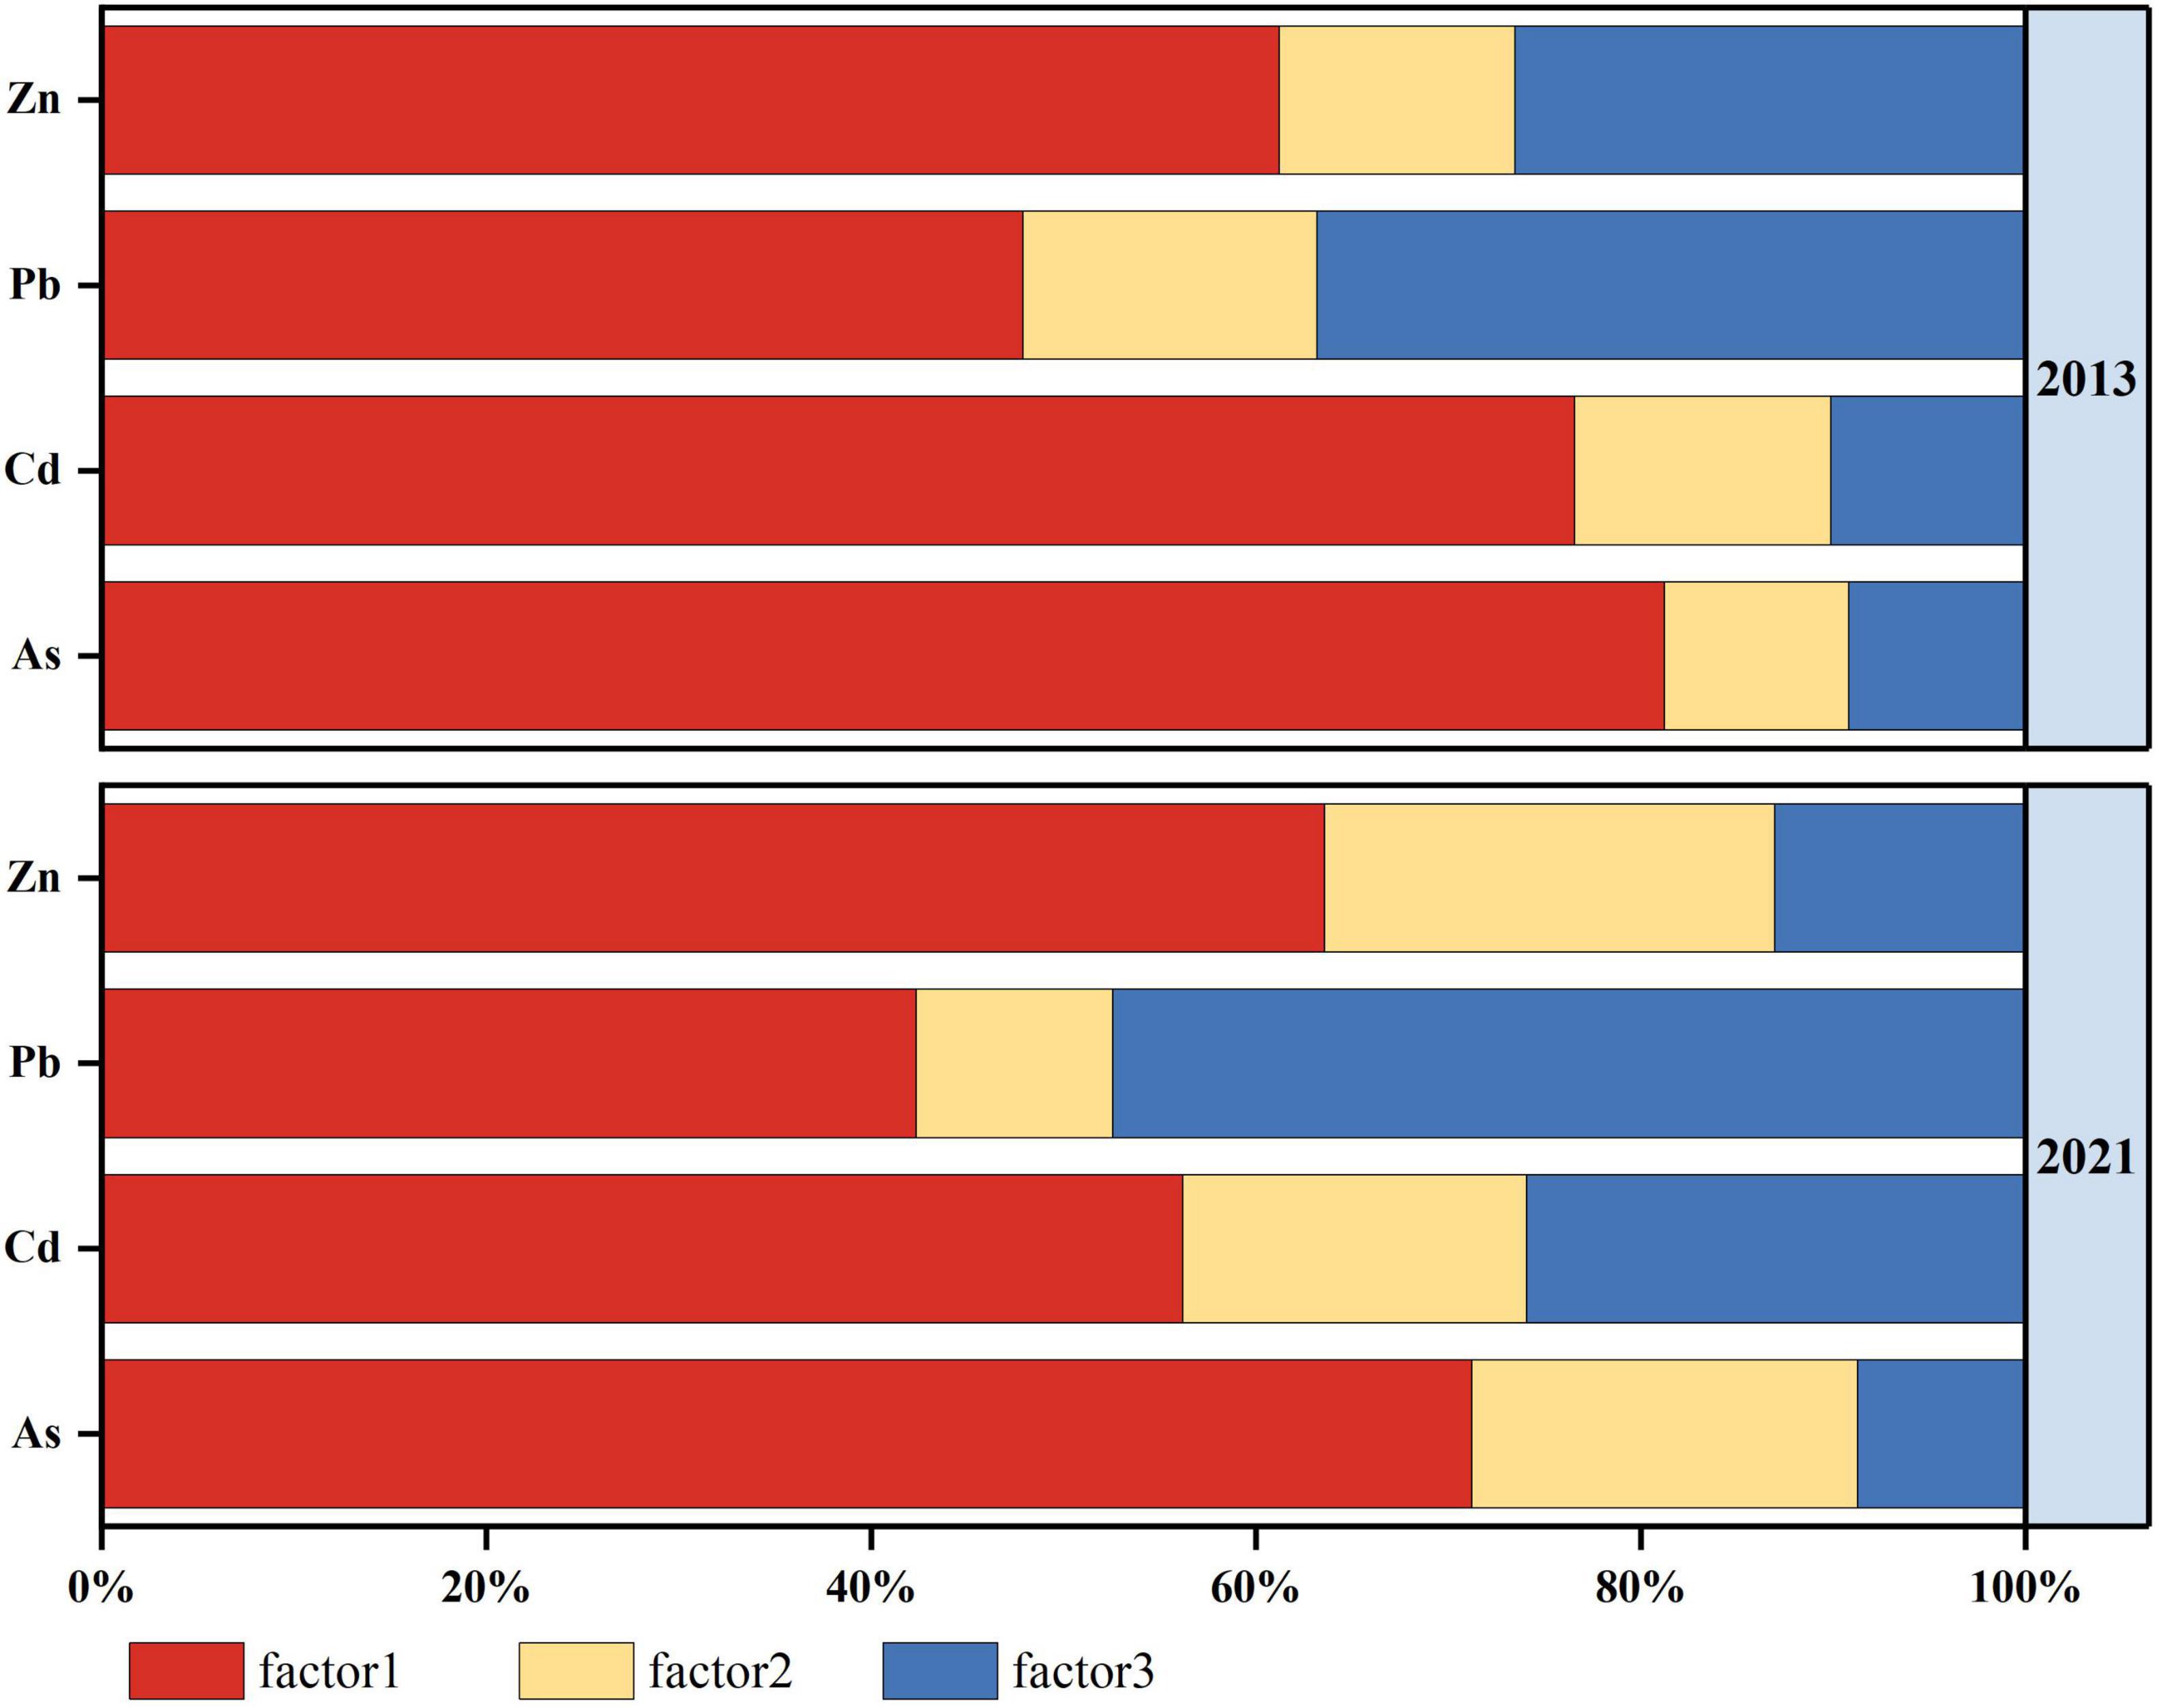
Figure 11. Analysis results of FA-NNC in the study area.
The first principal component (PC1) had a large factor loading value for Pb and Zn in 2013 and contributed a high proportion of pollution to As, Cd, Pb, and Zn, which had values of 71.21–81.21, 56.19–76.58, 42.33–47.88, and 61.02–63.54%, respectively. Based on the comprehensive judgment of factors such as the high pollution value and the location of sampling points, PC1 represented the input source of regional mining development activities and was the most important source of regional heavy metal pollution. Some studies have pointed out that the mining and smelting of non-ferrous metals accounts for approximately 40–73% of the anthropogenic emissions of heavy metals (such as Cd) in southwestern China (Wang and Zhao, 2017; Xiao et al., 2019; Wu et al., 2020). This result is generally consistent with the conclusion obtained in this study. In addition, the Taojia River basin in the study area is a karst landform with many caves, and the oxidation of sulfide minerals in mine tailings forms acidic mine wastewater, which promotes the migration and diffusion of metal elements in the environment and seriously endangers the regional environmental quality (Saby et al., 2009; Wang and Zhao, 2017; Salim et al., 2019).
The second principal component (PC2) had larger loading values for Pb and As in 2021, contributing, on average, 14.83, 15.60, 12.74, and 17.82% to the As, Cd, Pb, and Zn pollution, respectively. The sources of Zn and Pb in the environment had strong homology, mostly caused by wastewater, waste gas, and waste residue discharged from the non-ferrous metal smelting processes (Richard and Oliver, 2007; Xu D. M. et al., 2021). The mining and smelting of Pb-Zn-Tn-Cu polymetallic-associated ore in the Taojia River basin is an important source of Cd and As composite pollution. Elements are generally not precipitated as a concentrate product but are mostly found in tailings and other solid waste. Heavy metals in tailings are often diffused into the surrounding environment through wind and hydraulic transport in the form of wind erosion, dust, surface runoff, rainfall impact, and tailings diffusion (Qiu et al., 2016; Rafique and Tariq, 2016). This study found that regional soils and farmlands often experience mine tailing sand flooding during the flood season, and local residents mostly use water from nearby rivers to irrigate their farmlands. Therefore, pesticide and fertilizer inputs and sewage irrigation are additional main causes of heavy metal pollution in irrigated lands (Hu et al., 2020; Hossain Bhuiyan et al., 2021; Xu Y. et al., 2021). In a comprehensive analysis, the PC2 was categorized as a mixed input source of tailings sand, solid waste, and agriculture.
The third principal component (PC3) had the highest loading factor for Cd. The results of the FA-NNC two-period data model analysis showed that in 2013, the contributions of this factor to Pb and Zn were 36.85 and 26.44%, respectively. In 2021, the contributions of this factor to Cd and Pb were 25.92 and 47.46%, respectively. Cd and Zn are congeners, and in nature, Cd often cooccurs with Zn and Pb, and Cd and Zn are highly mobile. Dust from the friction of Zn containing petrochemical materials and exhaust fumes from the combustion of Pb rich gasoline are often interpreted as one of the main sources of Zn and Pb (Gan et al., 2019; Guan et al., 2019; Guo et al., 2019). Industrial waste gases and vehicle exhaust can pollute the surrounding environment through diffusion by atmospheric dry and wet deposition processes (Fei et al., 2019; Feng et al., 2019; Xu Y. et al., 2021). Therefore, the PC3 was identified as the input source of transportation emissions.
Conclusion
Based on the results of sampling and data research across long time scales, the tracking of pollution changes indicates that, in the last 10 years, the concentrations and pollution exceedance rate of As, Pb, and Zn in soil, tailings/substrate, and surface water all declined significantly, but the concentration of Cd increased and the pollution range expanded. While the spatial distribution of pollution maintains the same trend. The heavily polluted sites mainly gathered in the north-eastern part and the southern Thirty-Six Bay were active with industrial and mining activities.
The intensity of mineral resource development has impacted the regional environmental quality. In the first decade of this century, frequent mining development activities led to an increase in the area of construction land and a continuous decrease in the areas of cultivated land, grassland, and vegetation cover. Due to the implementation of environmental protection policies and industrial upgrading, the area of construction land declined, vegetation coverage increased, and the quality of the regional ecological environment improved significantly from 2010 to 2020.
The risk assessment results showed that the regional environmental risk levels of As, Pb, and Zn decreased, and the proportion of moderate and above pollution declined. The input sources of mining development activities; mixed sources of tailings sand, solid waste, and agriculture; and traffic emission sources were the main pollution sources of heavy metals. Among them, industrial and mining activities still remained the largest source of regional heavy metal pollution inputs. In general, the local historical pollution problems cannot be fully and effectively solved in a short period of time, and it is still necessary to strengthen source management and risk control.
Data Availability Statement
The datasets presented in this study can be found in online repositories. The names of the repository/repositories and accession number(s) can be found in the article/supplementary material.
Author Contributions
HC and XL: conceptualization. YL: methodology and formal analysis. ZW: software and validation. YZ: formal analysis. All authors agreed to be accountable for the content of the work, contributed to the article, and approved the submitted version.
Funding
This research was supported by the Major Project of the National Natural Science Foundation of China (71991483) and the Fund Program of State Key Laboratory of NBC Protection for Civilian (sklnbc2018-17).
Conflict of Interest
The authors declare that the research was conducted in the absence of any commercial or financial relationships that could be construed as a potential conflict of interest.
Publisher’s Note
All claims expressed in this article are solely those of the authors and do not necessarily represent those of their affiliated organizations, or those of the publisher, the editors and the reviewers. Any product that may be evaluated in this article, or claim that may be made by its manufacturer, is not guaranteed or endorsed by the publisher.
References
Ayrault, S., Pape, P., Le, Evrard, O., Priadi, C. R., Quantin, C., Bonte, P., et al. (2014). “Remanence of Lead Pollution in an Urban River System: a Multi-Scale Temporal and Spatial Study in the Seine River Basin, France.”. Environ. Sci. Pollut. Res. 21, 4134–4148. doi: 10.1007/s11356-013-2240-6
Boulet, A. K., Veiga, A., Ferreira, C., and Ferreira, A. (2020). “Quantification of heavy metals in agricultural soils: the influence of sieving in standard analytical methods (No. EGU2020-1487),” in Proceedings of the Copernicus Meetings, EGU General Assembly 2020, Online, 4–8 May 2020. doi: 10.5194/egusphere-egu2020-1487
Cai, L. M., Wang, Q. S., Luo, J., Chen, L. G., Zhu, R. L., Wang, S., et al. (2019). Heavy Metal Contamination and Health Risk Assessment for Children near a Large Cu-Smelter in Central China. Sci. Total Environ. 650, 725–733. doi: 10.1016/j.scitotenv.2018.09.081
Cheng, J., Han, J. C., Wang, H. Y., and Tong, W. (2015). “Background of Land Development and Opportunity of Land Use Transition.”. Asian J. Agric. Res. 7, 45–48.
Edori, E. S., Iyama, W. A., and Edori, O. S. (2021). Application of pollution assessment models in soil contaminated by heavy metals in two steel rods markets, Port Harcourt, Rivers State, Nigeria. GSC Adv. Res. Rev. 9, 025–035.
Ekwere, A. S., Kudamnya, E. A., and Osung, W. E. (2021). Assessment of potentially toxic metals and their mineral species in soils of arable farmlands in the southeastern Niger Delta basin, Nigeria. Soil Environ. 40, 119–126.
Fei, X. F., Xiao, R., Christakos, G., Langousis, A., Ren, Z. Q., Tian, Y., et al. (2019). “Comprehensive Assessment and Source Apportionment of Heavy Metals in Shanghai Agricultural Soils with Different Fertility Levels.”. Ecol. Indic. 106, 105508–105517.
Feng, W., Guo, Z., Xiao, X., Peng, C., Shi, L., Ran, H., et al. (2019). “Atmospheric Deposition as a Source of Cadmium and Lead to Soil-Rice System and Associated Risk Assessment.”. Ecotoxicol. Environ. Saf. 180, 160–167. doi: 10.1016/j.ecoenv.2019.04.090
Gan, Y. D., Huang, X. M., Li, S. S., Liu, N., Li, Y. C., Freidenreich, A., et al. (2019). “Source Quantification and Potential Risk of Mercury, Cadmium, Arsenic, Lead, and Chromium in Farmland Soils of Yellow River Delta.”. J. Clean. Prod. 221, 98–107.
Guan, Q. Y., Zhao, R., Pan, N. H., Wang, F. F., Yang, Y. Y., and Luo, H. P. (2019). “Source Apportionment of Heavy Metals in Farmland Soil of Wuwei, China: comparison of Three Receptor Models.”. J. Clean. Prod. 237, 117792–117802.
Guo, G., Zhang, D., and Wang, Y. (2019). “Probabilistic Human Health Risk Assessment of Heavy Metal Intake Via Vegetable Consumption around Pb/Zn Smelters in Southwest China.”. Int. J. Environ. Res. Public Health 16, 3267–3284. doi: 10.3390/ijerph16183267
Hossain Bhuiyan, M. A., Chandra Karmaker, S., Bodrud-Doza, M., Rakib, M. A., and B. B. Saha. (2021). Enrichment, sources and ecological risk mapping of heavy metals in agricultural soils of dhaka district employing SOM, PMF and GIS methods. Chemosphere 263, 128339–128353. doi: 10.1016/j.chemosphere.2020.128339
Hu, B., Shao, S., Fu, Z., Li, Y., Ni, H., Chen, S., et al. (2019). “Identifying Heavy Metal Pollution Hot Spots in Soil-Rice Systems: a Case Study in South of Yangtze River Delta, China.”. Sci. Total Environ. 658, 614–625. doi: 10.1016/j.scitotenv.2018.12.150
Hu, B., Zhou, Y., Jiang, Y., Ji, W., Fu, Z., Shao, S., et al. (2020). “Spatio-Temporal Variation and Source Changes of Potentially Toxic Elements in Soil on a Typical Plain of the Yangtze River Delta, China (2002-2012).”. J. Environ. Manage. 271, 110943–110958. doi: 10.1016/j.jenvman.2020.110943
Huang, J., Guo, S., Zeng, G. M., Li, F., Gu, Y., Shi, Y., et al. (2018). “A New Exploration of Health Risk Assessment Quantification from Sources of Soil Heavy Metals under Different Land Use.”. Environ. Pollut. 243, 49–58. doi: 10.1016/j.envpol.2018.08.038
Huang, Z. F., Zheng, S. S., Liu, Y., Zhao, X. R., Qiao, X. C., Liu, C. Y., et al. (2021). “Distribution, Toxicity Load, and Risk Assessment of Dissolved Metal in Surface and Overlying Water at the Xiangjiang River in Southern China.”. Sci. Rep. 11:109. doi: 10.1038/s41598-020-80403-0
Jiang, Y., Xuefeng, H. U., Shu, Y., Jiang, Y., and Teng, Q. (2017). “Accumulation of Heavy Metals in the Soil-Rice System and Assessment of Dietary Safety of the Rice Produced in the Paddy Fields—a Case Study of a Town in the Northern Part of Hunan Province,China.”. Acta Pedol. Sin. 54, 410–420.
Li, T. K., Liu, Y., Lin, S. J., Liu, Y. Z., and Xie, Y. F. (2019). “Soil Pollution Management in China: a Brief Introduction.”. Sustainability 11, 556–571. doi: 10.13227/j.hjkx.201612068
Liu, F. Z., Hu, J. L., Liu, J. S., Zhao, Z. Q., Yang, X., Zhang, Y., et al. (2018). “Spatial Distribution and Risk Assessment of Heavy Metals in Soil in the Metal Mining Area of Paojinshan, Hunan, China.”. J. Agro-Environ. Sci. 37, 86–95.
Migaszewski, Z. M., Galuszka, A., Dolegowska, S., and Michalik, A. (2022). “Abundance and Fate of Glass Microspheres in River Sediments and Roadside Soils: lessons from the Swietokrzyskie Region Case Study (South-Central Poland).”. Sci. Total Environ. 821, 153410–153421. doi: 10.1016/j.scitotenv.2022.153410
Pathak, A. K., Kumar, R., Kumar, P., and Yadav, S. (2015). “Sources Apportionment and Spatio-Temporal Changes in Metal Pollution in Surface and Sub-Surface Soils of a Mixed Type Industrial Area in India.”. J. Geochem. Explor. 159, 169–177.
Qiu, K. Y., Xing, W. Q., Scheckel, Kirk G., Cheng, Y. X., Zhao, Z. S., Ruan, X. L., et al. (2016). “Temporal and Seasonal Variations of as, Cd and Pb Atmospheric Deposition Flux in the Vicinity of Lead Smelters in Jiyuan, China.”. Atmos. Pollut. Res. 7, 170–179.
Rafique, N., and Tariq, S. R. (2016). “Distribution and Source Apportionment Studies of Heavy Metals in Soil of Cotton/Wheat Fields.”. Environ. Monit. Assess. 188, 309–319. doi: 10.1007/s10661-016-5309-0
Richard, W, and Oliver, M. A. (2007). Geostatistics for Environmental Scientists. Hoboken: John Wiley & Sons.
Saby, N. P., Thioulouse, J., Jolivet, C. C., Ratie, C., Boulonne, L., Bispo, A., et al. (2009). “Multivariate Analysis of the Spatial Patterns of 8 Trace Elements Using the French Soil Monitoring Network Data.”. Sci. Total Environ. 407, 5644–5652. doi: 10.1016/j.scitotenv.2009.07.002
Salim, I., Sajjad, R. U., Paule-Mercado, M. C., Memon, S. A., Lee, B. Y., Sukhbaatar, C., et al. (2019). “Comparison of Two Receptor Models Pca-Mlr and Pmf for Source Identification and Apportionment of Pollution Carried by Runoff from Catchment and Sub-Watershed Areas with Mixed Land Cover in South Korea.”. Sci. Total Environ. 663, 764–775. doi: 10.1016/j.scitotenv.2019.01.377
Shao, D., Zhan, Y., Zhou, W., and Zhu, L. (2016). “Current Status and Temporal Trend of Heavy Metals in Farmland Soil of the Yangtze River Delta Region: field Survey and Meta-Analysis.”. Environ. Pollut. 219, 329–336. doi: 10.1016/j.envpol.2016.10.023
Syed, J. H., Iqbal, M., Zhong, G., Katsoyiannis, A., Yadav, I. C., Li, J., et al. (2017). “Polycyclic Aromatic Hydrocarbons (Pahs) in Chinese Forest Soils: profile Composition, Spatial Variations and Source Apportionment.”. Sci. Rep. 7, 2692–2702. doi: 10.1038/s41598-017-02999-0
The National Soil Pollution Survey Report (2014). The Report on the National General Survey of Soil Contamination. Beijing: Ministry of Environmental Protection & Ministry of Land and Resources.
Timofeev, I., Kosheleva, N., and Kasimov, N. (2019). “Health Risk Assessment Based on the Contents of Potentially Toxic Elements in Urban Soils of Darkhan, Mongolia.”. J. Environ. Manage. 242, 279–289. doi: 10.1016/j.jenvman.2019.04.090
Wang, J., and Zhao, T. (2017). “Regional Energy-Environmental Performance and Investment Strategy for China’s Non-Ferrous Metals Industry: a Non-Radial Dea Based Analysis.”. J. Clean. Prod. 163, 187–201.
Wang, P., Sun, Z., Hu, Y., and Cheng, H. (2019). “Leaching of Heavy Metals from Abandoned Mine Tailings Brought by Precipitation and the Associated Environmental Impact.”. Sci. Total Environ. 695, 133893–133904. doi: 10.1016/j.scitotenv.2019.133893
Wang, S., Cai, L. M., Wen, H. H., Luo, J., Wang, Q. S., and Liu, X. (2019). “Spatial Distribution and Source Apportionment of Heavy Metals in Soil from a Typical County-Level City of Guangdong Province, China.”. Sci. Total Environ. 655, 92–101. doi: 10.1016/j.scitotenv.2018.11.244
Wu, J. T., Margenot, A. J., Wei, X., Fan, M. M., Zhang, H., Best, J. L., et al. (2020). “Source Apportionment of Soil Heavy Metals in Fluvial Islands, Anhui Section of the Lower Yangtze River: comparison of Apcs–Mlr and Pmf.”. J. Soils Sediments 20, 3380–3393.
Xiao, R., Guo, D., Ali, A., Mi, S., Liu, T., Ren, C., et al. (2019). “Accumulation, Ecological-Health Risks Assessment, and Source Apportionment of Heavy Metals in Paddy Soils: a Case Study in Hanzhong, Shaanxi, China.”. Environ. Pollut. 248, 349–357. doi: 10.1016/j.envpol.2019.02.045
Xu, D. M., Fu, R. B., Liu, H. Q., and Guo, X. P. (2021). “Current Knowledge from Heavy Metal Pollution in Chinese Smelter Contaminated Soils, Health Risk Implications and Associated Remediation Progress in Recent Decades: a Critical Review.”. J. Clean. Prod. 286, 124989–125048.
Xu, Y., Shi, H. D., Fei, Y., Wang, C., Mo, L., and Shu, M. (2021). “Identification of Soil Heavy Metal Sources in a Large-Scale Area Affected by Industry.”. Sustainability 13:511.
Zhang, Q. C., and Wang, C. C. (2020). “Natural and Human Factors Affect the Distribution of Soil Heavy Metal Pollution: a Review.”. Water Air Soil Poll. 231, 350–363.
Zhang, X., Wei, S., Sun, Q., Wadood, S. A., and Guo, B. (2018). “Source Identification and Spatial Distribution of Arsenic and Heavy Metals in Agricultural Soil around Hunan Industrial Estate by Positive Matrix Factorization Model, Principle Components Analysis and Geo Statistical Analysis.”. Ecotoxicol. Environ. Saf. 159, 354–362. doi: 10.1016/j.ecoenv.2018.04.072
Zhang, Z. X., Zhang, N., Li, H. P., Lu, Y., Wang, Q. S., and Yang, Z. G. (2019). “Risk Assessment, Spatial Distribution, and Source Identification of Heavy Metal(Loid)S in Paddy Soils Along the Zijiang River Basin, in Hunan Province, China.”. J. Soils Sediments 19, 4042–4051.
Zhao, K. L., Zhang, L. Y., Dong, J. Q., Wu, J. S., Ye, Z. Q., Zhao, W. M., et al. (2020). “Risk Assessment, Spatial Patterns and Source Apportionment of Soil Heavy Metals in a Typical Chinese Hickory Plantation Region of Southeastern China.”. Geoderma 360, 114011–114022.
Zhong, X., Chen, Z., Li, Y., Ding, K., Liu, W., Liu, Y., et al. (2020). “Factors Influencing Heavy Metal Availability and Risk Assessment of Soils at Typical Metal Mines in Eastern China.”. J. Hazard. Mater. 400, 123289–123327.
Keywords: mineral resource development, heavy metals, environmental quality, risk assessment, source analysis
Citation: Cao H, Wang Z, Liao X, Li Y and Zhu Y (2022) Research on the Regional Environmental Impact and Risk Assessment Affected by Mineral Resource Development: A Case Study of the Taojia River Watershed in Hunan. Front. Ecol. Evol. 10:918446. doi: 10.3389/fevo.2022.918446
Received: 12 April 2022; Accepted: 02 May 2022;
Published: 03 June 2022.
Edited by:
Jun Yang, Northeastern University, ChinaReviewed by:
Dongxue Zhao, The University of Queensland, AustraliaShaohua Wang, Aerospace Information Research Institute (CAS), China
Copyright © 2022 Cao, Wang, Liao, Li and Zhu. This is an open-access article distributed under the terms of the Creative Commons Attribution License (CC BY). The use, distribution or reproduction in other forums is permitted, provided the original author(s) and the copyright owner(s) are credited and that the original publication in this journal is cited, in accordance with accepted academic practice. No use, distribution or reproduction is permitted which does not comply with these terms.
*Correspondence: You Li, bGl5b3VAaWdzbnJyLmFjLmNu