 Markus Franzén
 Yannick Francioli1
 Anders Forsman
- 1Department of Biology and Environmental Science, Center for Ecology and Evolution in Microbial Model Systems (EEMiS), Linnaeus University, Kalmar, Sweden
- 2Calluna AB, Linköping, Sweden
- 3Department of Physics, Chemistry, and Biology (IFM), Linköping University, Linköping, Sweden
It remains unclear to what extent yearly weather variation and spatial variation in microclimate influences the outcome of interacting plant-animal species and whether responses differ between life stages. We collected data over several years on 46 ha on File Hajdar, Gotland, Sweden, and executed a complete mapping of larva nests (n = 776) and imago (n = 5,952) of the marsh fritillary butterfly Euphydryas aurinia and its host plant Succisa pratensis. The phenology of the butterflies and the major nectar plants visited varied among years. The duration of the adult flight period decreased with increasing ambient air temperatures. The density of butterflies, host plants, and host plant leaf size increased between years with increasing precipitation in the preceding year, and decreased with increasing average ambient air temperature in the preceding year. In 2021–2022 we deployed a unmanned aerial vehicle (UAV) with a high-resolution thermal sensor to measure spatial variation in surface temperatures in the study area. We found that survival from the egg to the larva stage increased with increasing surface temperature and host plant density. Host plants and larva nests generally occupied warmer microhabitats compared to imago butterflies. The results further suggested that the relationships linking surface temperature to the densities of imago, larva, host plants, and leaf size differed qualitatively between years. In 2017, larva nests and host plant density increased with increasing surface temperatures, and butterflies showed a non-linear response with a density peak at intermediate temperatures. As a result of the extreme drought in 2018 there was a reduction in maximum leaf size, and in the densities of plants, larvae, and butterflies. Moreover, the slopes of the relationships linking the density of larvae, butterflies, and plants to temperature shifted from linear positive to negative or curvilinear. Our findings demonstrate how yearly weather variation and heterogeneous surface temperatures can drive the spatiotemporal distribution and dynamics of butterflies and their host plants. The context specificity of the responses indicated by our results makes it challenging to project how climate change will affect the dynamics of ecological communities.
Introduction
Abiotic and biotic factors form the ecological niche within which species can exist (May and Arthur, 1972). Temperature plays a key role in governing the rates of biological processes and setting limits on survival, reproduction, and behavior (Clarke, 2017). In response to unfavorable temperature conditions, species and populations can move to more suitable areas, undergo phenology shifts, hide below or above the surface, enter another life stage, adapt, or in the worst case, become extinct (Warren et al., 2001; Walther et al., 2002). There is already evidence of broad-scale changes to ecosystems associated with recent anthropogenic climate change, with the impact expected to continue to increase for the foreseeable future (Parmesan and Yohe, 2003; Parmesan et al., 2013; Hällfors et al., 2021). Due to the rapid modifications of climates and more frequent weather extremes, species are exposed to novel environmental conditions outside their tolerances (Soroye et al., 2020).
Recent studies have examined species vulnerability to climate using extrapolated climate data (Harris et al., 2018; Salgado et al., 2020). Understanding the consequences of habitat heterogeneity, microclimate, and yearly weather variations that may modify larger-scale and longer-term responses to climate change requires different approaches. Butterflies and their host plants are well suited for studying how variation in ambient air and surface temperatures can affect the ecology of species interactions. Adult butterflies are mobile ectotherms that can use a combination of physiological, phenotypic, and behavioral adjustments to regulate their body temperatures (Porter, 1982; Tsai et al., 2020; Hill et al., 2021). Different butterfly species show different tolerances and responses to temperature (Fischer and Karl, 2010). The importance of microclimate for determining species tolerance to temperature change has been thoroughly investigated (Maclean et al., 2015, 2017; Suggitt et al., 2015, 2018; Greenwood et al., 2016) as well as changes in temperature preference across species ranges (Oliver et al., 2009). However, the earlier life stages of butterflies (eggs and larvae) and their host plants are either immobile or less mobile than adults, which should make them more vulnerable to unfavorable temperatures. Comparing responses to surface temperature between different species, life stages, and years can uncover the mechanistic underpinnings of spatiotemporal dynamics of animal-host plant relationships and inform how climate change might affect them.
For animals that lay eggs, such as butterflies, oviposition site selection has direct fitness consequences for both the egg-laying female and the offspring (Heinrich, 1974; Porter, 1982). It will affect the developmental environment of the offspring over a long period, often >99% of the individual lifetime of an insect (Price, 1997). This translates into an important maternal effect (Thompson and Pellmyr, 1991). If females deposit their eggs in the “wrong” places (too warm, too cold, or too wet conditions), the local population may be at risk of extinction (Salgado et al., 2020). The situation is further complicated because thermal preferences and tolerances may differ between sexes (Lailvaux et al., 2003) and among life-stages (Carter and Sheldon, 2020). Compared with highly mobile adult insects, the early life stages of insects (eggs, larvae, and pupae) should be especially sensitive to extreme surface temperatures. By comparison, some plants are better at escaping extreme weather events, as they can enter drought phases, and survive as seeds or perennial roots (Parmesan and Hanley, 2015). The evolutionary adaptations, behavioral strategies, and physiological mechanisms used by ectothermic animals to maintain optimal body temperatures in heterogeneous and changing habitats have for long attracted much scientific attention (Heinrich, 1974). Although there is a growing literature on species susceptibility to climate change (Cloudsley-Thompson, 1962; Willmer, 1982; Ahnesjö and Forsman, 2006; Scherrer and Körner, 2011; Woods et al., 2015; Tougeron et al., 2016; Lehmann et al., 2020; Pincebourde and Woods, 2020; Ma et al., 2021), the consequences of microclimate variation for population processes and the outcome of species interactions are now possible to explore into more detail using technologies that have not been available before (Anderson and Gaston, 2013; Hutton et al., 2020). For example, modern remote sensing technologies provide a powerful means to examine the association between surface temperature and the spatial distribution of plants and animals. More specifically, high-resolution data on microclimate together with monitoring data on the spatial distribution, density, and performance of interacting plants and animals may allow for more realistic predictions of biotic responses to environmental variation and global change (Zellweger et al., 2019). In this respect, an UAV has been deployed to characterize landscapes and identify outbreaks of pests (Faye et al., 2016; Sarron et al., 2018; Fernandez-Carrillo et al., 2020).
In the study reported here, we characterized microclimate using an UAV with a high-resolution longwave infrared (LWIR) thermal sensor and collected geo-referenced field monitoring data on the spatial distribution and abundance of larvae nests and imagoes and nest survival rates, of the marsh fritillary butterfly Euphydryas aurinia and its host plant Devil’s-bit Succisa pratensis. Our overarching aim is to explore and compare the responses of butterflies and their host plants to both yearly weather variation and fine-scale spatial variation in microclimate across life stages. To this end, we used a unique dataset of 776 counted autumn nests and 2,920 individually marked butterflies over 6 years together with yearly estimates of average daily ambient air temperatures and precipitation during the butterfly flight season obtained from a nearby weather station, and high-resolution data on spatial variation in surface temperatures within the study area. Specifically, we use the data to examine whether and how: (i) differences between years in the duration of the adult flight period, and in the density of the butterflies and their host plants was associated with between year variation in weather conditions (ambient air temperature and precipitation); (ii) the species composition of nectar plants used as food by adult butterflies varied across years; (iii) the relationships linking spatial distribution and abundance variation to relative surface temperature differ between the butterfly life stages (larva and imago); (iv) the relationships linking spatial distribution and abundance variation in relation to relative surface temperature differ between butterflies and their host plant; and (v) the variation in density and size of the butterfly host plant is related to spatial variation in relative surface temperature. Lastly, (vi) to evaluate whether effects of variation in microclimate on survival of eggs and larvae might influence the spatial distribution and abundance fluctuations of these butterflies, we examine whether and how the spatial variation in survival of eggs and larva (nest survival) is associated with the variation in relative surface temperature, while statistically controlling for variation in food availability (density of host plants).
Materials and methods
Study species and study area
We thoroughly studied 46 ha on File Hajdar close to Slite on the island of Gotland in the Baltic Sea (Figures 1A,C), Sweden (centered at 57°43’13N, 18°42’15E). Here, the E. aurinia occurs on fens and grasslands, and the whole area has a thin layer of soil cover situated on calcareous bedrocks. These open areas offer suitable habitats for the butterfly, and its host plant is abundant in the study area. Pine forests (Pinus sylvestris), and juniper (Juniperus communis) bushes constitute areas with non-suitable habitats for the butterfly (Supplementary Figure 1). The study area is not grazed and has remained similar over the studied period.
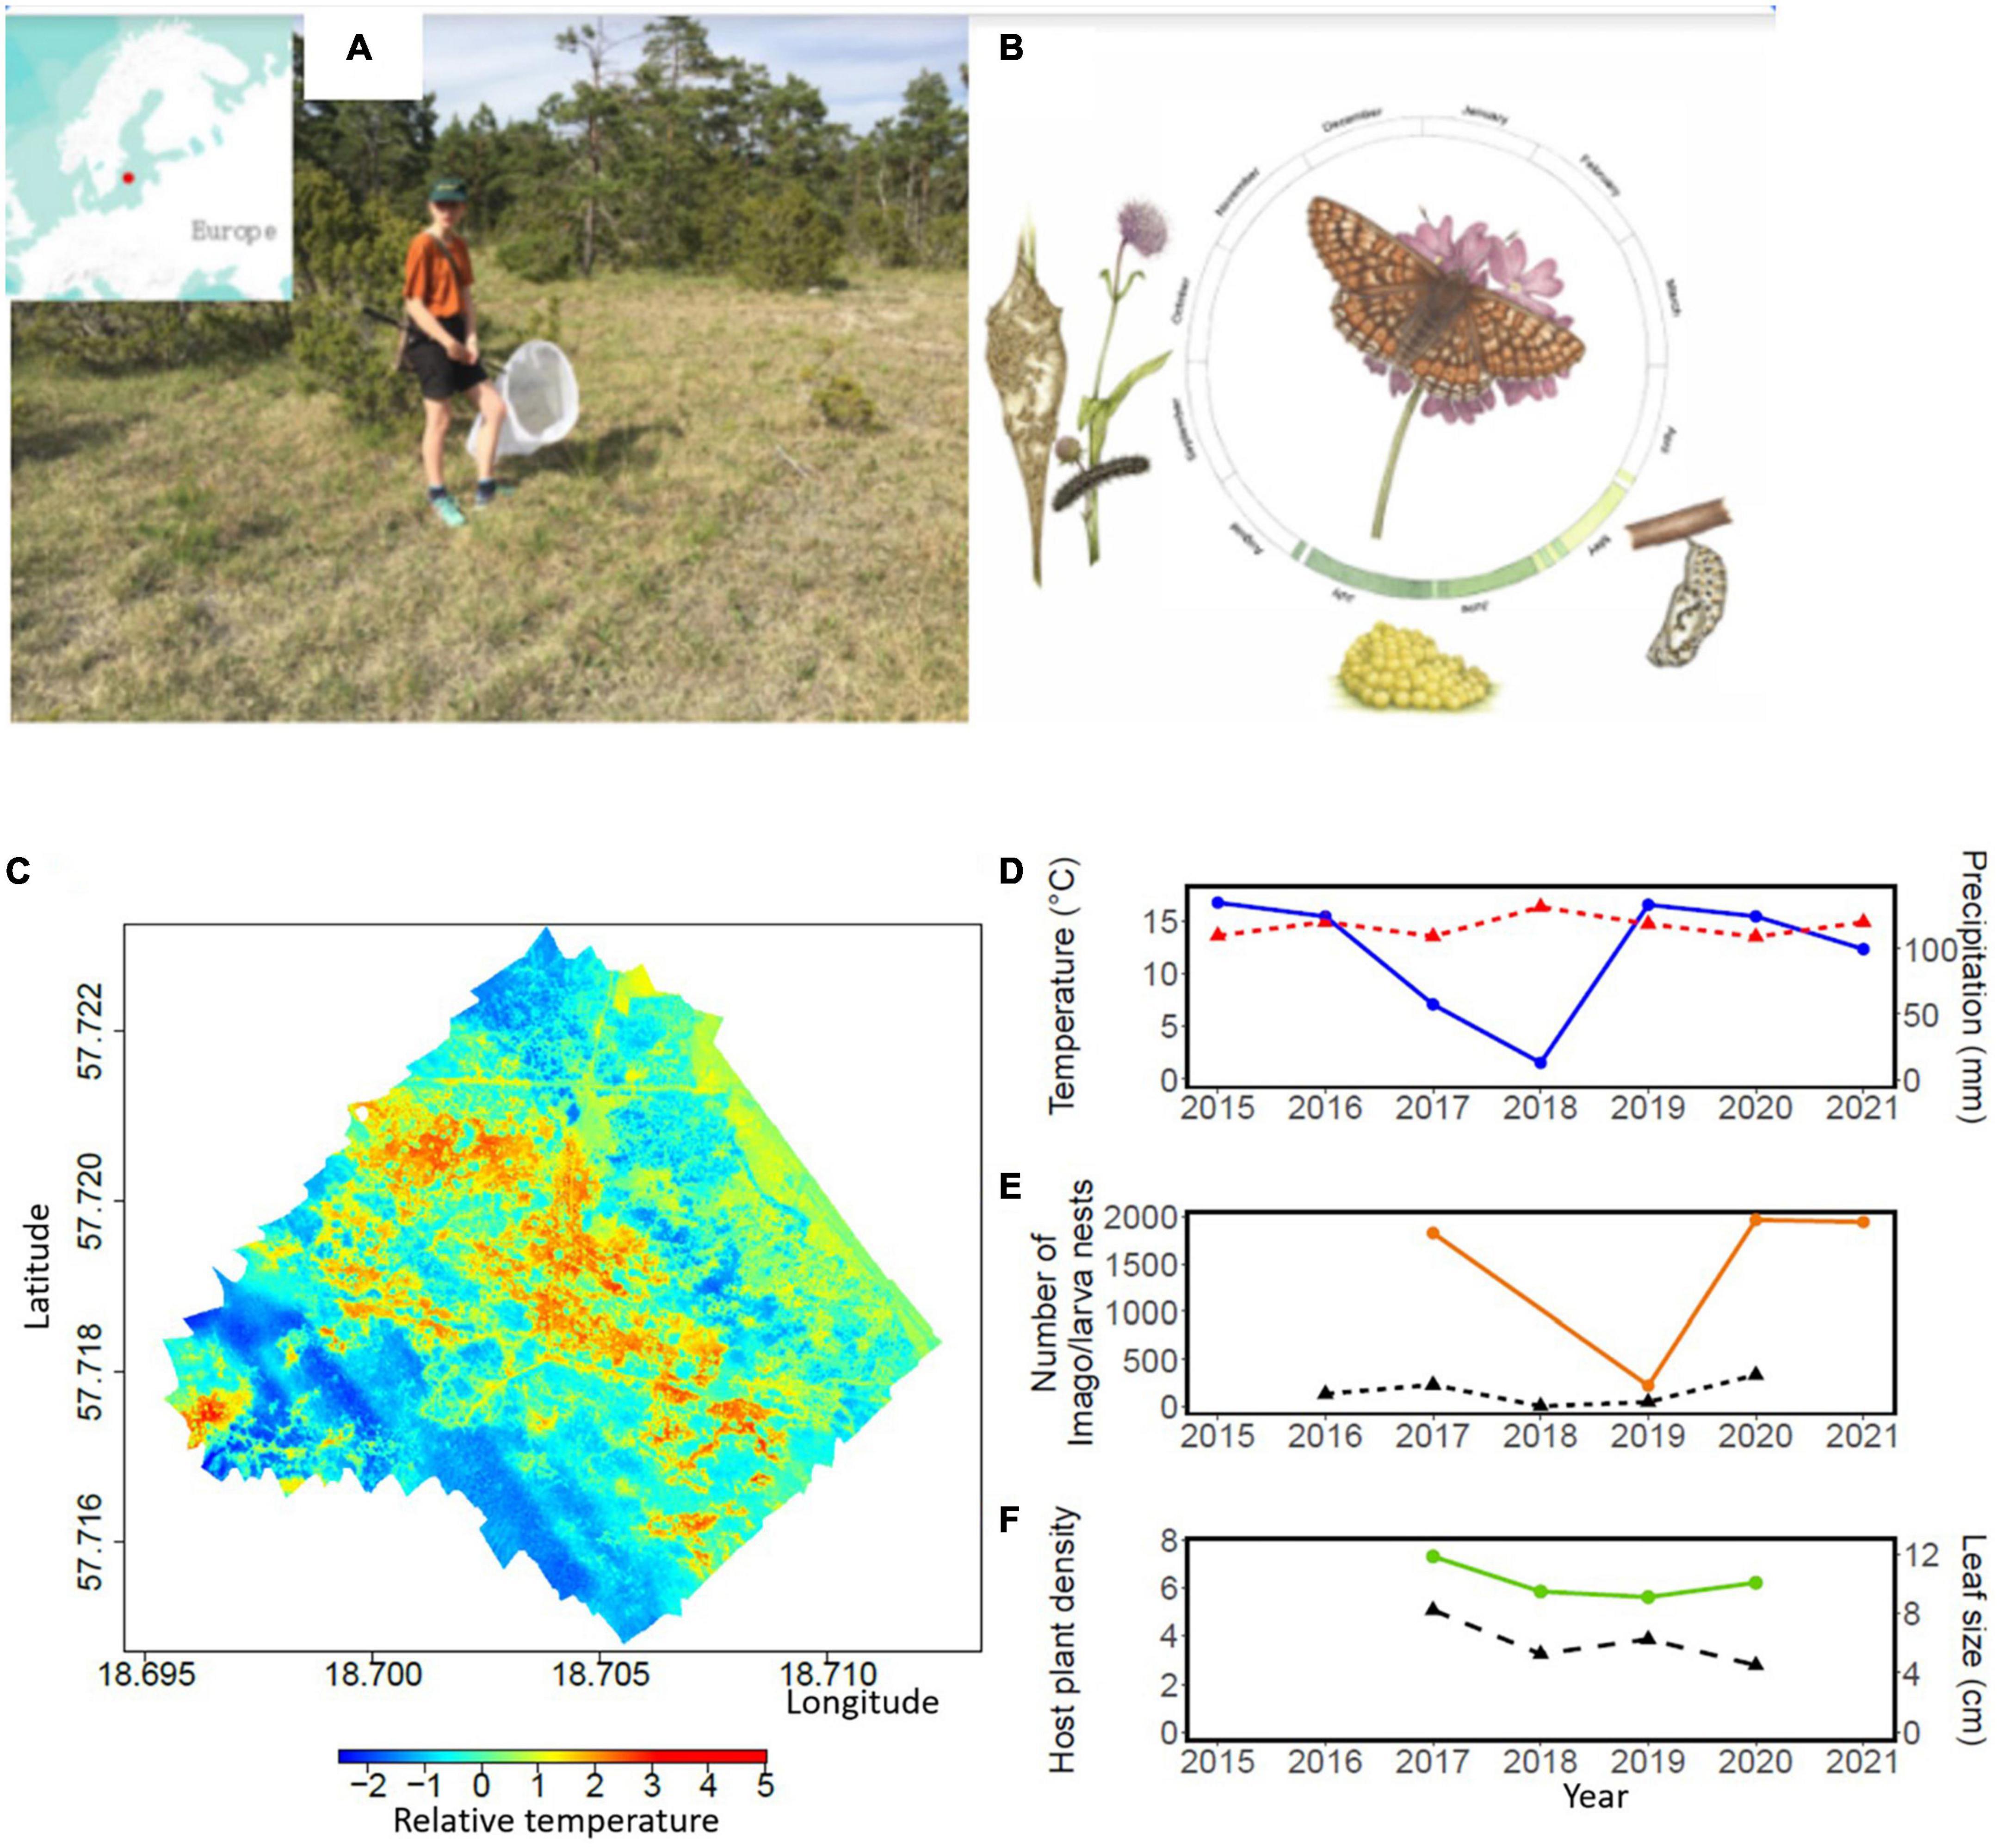
Figure 1. The habitat of Euphydryas aurinia in 2017 at the File Hajdar population on Gotland in South-Eastern Sweden (A) and its life cycle (B). The relative surface temperature in the study area in File Hajdar, South–Eastern Sweden, Drawing Copyright Emma Tinnert (C). The redder, the higher surface temperatures, the bluer, and the lower surface temperatures. Relative surface temperature illustrates scaled temperature values from the highest value to the lowest. Yearly precipitation and temperature averages from 2015 to 2021 based on data from May to July in each year [overall mean and associated 95% confidence interval (CI) for each year]. Blue is precipitation and dashed red temperature (D) Temporal distribution of the number of marked and recaptured imago E. aurinia (brown line) and the number of larva nests per year (dashed line) (E). The density of the host plant Succisa pratensis (dashed line) and the mean maximum leaf size (green line) per year (F).
Our study species, E. aurinia (Figure 1B), is included in the European Habitats Directive Annex II and red-listed in several European countries due to its decrease during the last century (Warren et al., 2021). The species is univoltine, and adults fly from late May to late June. Females lay only one to two egg batches during a lifetime containing 50–300 eggs placed beneath leaves of the host plant S. pratensis. After hatching in July, the larvae spin a silken nest around the host plant. Larvae feed and bask gregariously during sunny days until September, when they enter diapause in a collective nest. The larvae become active again in early spring, resume feeding, leave the nest to feed solitarily in April and pupate in May (Eliasson et al., 2005).
Butterfly data
To determine the onset, termination, and duration of the butterfly flight period; to quantify and compare the locations, spatial distribution, and density of butterflies; and to quantify their temporal activity and foraging behavior we recorded butterflies in the study area each year from the beginning to the end of the flight season (late May to late June). We repeated the same procedure in 2017, 2019, 2020, and 2021. To standardize the butterfly recording we followed a strict sampling protocol whereby the study area was divided in 64 ha grids that were thoroughly searched through, and all butterflies occurring in the grid were recorded with the exact position before approaching the next hectare grid until all hectare grids within the whole study area had been visited (Supplementary Figure 1). The time spent in each hectare grid varied depending on the number of butterflies in the grid and was on average 10 min, with a minimum of 7 min and a maximum of 18 min per hectare grid. Two people covered the entire study area in 1 day. Butterflies were searched for in all suitable habitats (sunny open habitats with the host plant) within the 64 ha grids that intersected the 46 ha large study area (Supplementary Figure 1). Each adult butterfly observed was registered with a GPS coordinate. If the butterfly, when first observed, visited a flower in search of nectar, the plant species were identified to species or genus level. We were interested in the flowers visited by the adult butterflies to study if the flowers visited differed between years. We searched for butterflies from 8 a.m. to 6 p.m. if the weather was suitable (sunny and >17°C). The area was visited 20, 15, 24, and 22 times during different days in 2017, 2019, 2020, and 2021, respectively, with equal coverage across dates. Searches varied between each visit so that different areas were searched through at different times of the day and to reduce the chance of a bias in the locations where individuals were found by the time of day.
To quantify spatiotemporal variation in reproductive output, two of the authors (JA and OK) and one additional field assistant comprehensively searched the same areas for larval nests for two full days between 5th and 12th September each year from 2016 to 2020. Adult butterflies were searched for by the authors (MF, JA, and OK) and trained field assistants. The number of persons that were actively working in the field during the adult butterfly flight period was 14, 9, 12, and 9 in 2017, 2019, 2020, and 2021, respectively. Each person involved in the study was experienced in field biology and trained during half a day how to search for butterflies, how to identify plants, and how to record data.
Host plant data
To evaluate whether the spatiotemporal variation in abundance of butterflies could have been influenced in part by variation in the availability of host plants used by the larvae, we quantified the spatiotemporal variation in density and leaf size of the main host plant. To this end, we randomly placed 0.5 m2 circular vegetation plots across the suitable habitat. The random points were created in ArcGIS pro (version 2.8) and the circular vegetation plot was dropped to the ground when a point was reached. Besides counting the number of main host plant S. pratensis individuals we also measured the length of the longest leaf in each plot. The longer the leaf is, the more food is available for the larvae on each host plant, as the leaves are the major food for the larvae. Thus, the combination of host plant density and leaf size likely provides a proxy for food availability for the butterfly larvae. Host plant data was collected by the authors and trained field assistants mentioned above.
Survival of egg batches
To evaluate whether effects of variation in microclimate on survival of eggs and larvae might influence the spatial distribution and abundance of the butterflies, we examined whether and how the spatial variation in survival of eggs and larva (nest survival) is associated with the variation in relative surface temperature, while statistically controlling for variation in host plant density. In late June 2020 we located 10 different egg batches spread out across the study area, and each egg batch was situated under one leaf of the host plant. The number of eggs was carefully counted and photographed and again re-counted based on the digital images. These 10 egg batches were continuously monitored every second week until overwintering (last visit October 10, 2021) and again visited after overwintering from March 26, 2021, until most larvae had pupated on 15 May 2021. The number of larvae in the larvae nests was counted at each visit. Survival was calculated as the maximum number of larvae counted per nest in 2021 divided by the number of eggs in each egg batch in 2020. The maximum number of larvae observed in 2021 was necessary to use because the nests first appeared above ground at different dates in 2021, and therefore also reached their maximum size at different dates/visits.
Data processing of butterfly, larval, and host plant data
To calculate the density of butterflies, nests, and host plants, a grid square system was created to cover the study area. The grid squares were of 10 m × 10 m and were created in ArcGIS Pro using the Create Fishnet tool. Grid squares of 10 m × 10 m were chosen, as this captures a relevant scale for the larvae and butterflies and how they move around. This resulted in 3,242 grid squares. The density of larvae nests was calculated in these grid squares by summing the number of recorded larvae nests per grid square and year. For adult butterflies, density was calculated the same way and based on 15 complete visits per year to remove any variation from differences in sampling effort between years. As larva nests are easy to detect and were completely mapped in the area, sampling effort is not an issue. To estimate density and leaf size of host plants, we placed out 256, 99, 227, and 232 0.5 m2 circular vegetation plots in 2017, 2018, 2019, and 2020, respectively. Based on these plots host plant density and the maximum leaf size per 10 m × 10 m was calculated. The number of vegetation plots are far above what should be necessary and vary across years depending on the available manpower. The difference in the number of vegetation plots across years should not have any influence on the statistical analyses. If no host plant was present, we excluded leaf size. For each grid square its relative surface temperature was calculated by intersecting the grid square with the relative surface temperature raster data and calculating the average relative surface temperature per 100 m2 grid square.
Quantification of yearly weather variation
We aimed to evaluate whether yearly differences in weather conditions contributed to yearly variation in the phenology and density of larva and adult butterflies, and to yearly variation in density and leaf size of host plants. To that end, to study if the adult flight period is associated with temperature we extracted information on average daily ambient air temperatures during the flight season, from 26 May to 29 June. To study yearly variation in density of larva, adult butterflies, host plants and leaf size we extracted information on average daily ambient air temperatures and precipitation during May and June. Weather data was extracted from the weather station at Fårö (temperature sensor was situated 1.5 m above the ground) situated 25 km toward the Northeast of the study area.
Quantification of surface temperatures using unmanned aerial vehicle equipment and thermal infrared data capture
To be able to evaluate effects on butterflies and their host plants, of spatial variation in microclimatic conditions within the study area we quantified surface temperatures using an UAV. Thermal infrared imaging reveals spatially high-resolution information about surface temperatures, and with the appearance of cost-effective, easy to fly UAVs, a new type of data collection has been enabled: super high-resolution multispectral, precisely georeferenced imagery and point clouds, collected over target areas (Anderson and Gaston, 2013; Hutton et al., 2020). We used a DJI Matrice 300 quadcopter deployed with a MicaSense Altum multispectral sensor. The LWIR thermal band on the Altum sensor is between 8 and 14 μm. We captured surface temperature data on a 170-pixel resolution during a single flight at the height of 100 m over 47 min on June 25, 2021, from 11:57 to 12:44, with sunny weather and a clear sky. For details, information on data processing, and calibration of surface temperature data, see Supplementary Appendix 1.
To evaluate whether the spatial variation in surface temperatures indicated by our data is consistent over time, we performed four additional UAV flights (on May 9, 2022 at 13.00 h, July 19, 2022 at 09.00 h, July 19, 2022 at 13.00 h, and July 19, 2022 at 16.00 h) to collect repeated measures of surface temperature data. Next, we used the five repeated measurements (as obtained in the original flight in 2021 and the four additional flights in 2022) of surface temperature from 55 separate point locations (pixels) throughout the study area to examine whether the spatial heterogeneity of relative surface temperatures remained largely consistent over time or changed drastically between days or depending on time of day. To that end, we estimated measurement repeatability of relative surface temperature using two analytical approaches. The first estimate was obtained using a one-way ANOVA as SB2/(SB2 + SW2), where, SB2 = (MSB MSW)/k, SW2 = MSW, k = number of measurements per unit, and MSW and MSB are the mean squares obtained within and between units, respectively (Sokal and Rohlf, 1995). Prior to this analysis, temperature data obtained from each of the five flights was standardized to mean zero to generate a repeatability estimate of relative surface temperature. To allow comparisons of estimates obtained using different approaches, we also obtained an overall repeatability estimate from a generalized linear mixed model, implemented with procedure MIXED in SAS, using the original (unstandardized) surface temperatures from all five measurements, treating point location as a random factor, and including date and time of day as fixed factors (Dingemanse and Dochtermann, 2013).
The results from our analyses of measurement repeatability indicated that there was significant spatial variation in surface temperature between different point locations in the study area, and that the spatial variation in relative surface temperature was consistent across years, dates, and times of day. Thus, repeatability of independent surface temperature measurements taken at 55 locations (pixels) throughout the study area on five separate occasions (June 25, 2021, plus four flights in 2022) as estimated from a one-way ANOVA, was 0.56 (F54,220 = 7.39, p < 0.0001, R2 = 0.64). This was similar to the estimated overall repeatability (0.55) based on raw temperature data using a linear mixed model, when accounting for variation owing to date and time of day. This result means that point locations in the study area where surface temperatures were relatively high (or low) a given year, date, or time of day had relatively high (or low) surface temperatures also other years, dates, and times of day, relative to other locations in the study area. It can therefore be concluded that the large-scale and high-resolution quantification of spatial variation of surface temperature in the study area obtained using data from the UAV flight on June 25, 2021, that was used to statistically evaluate associations of surface temperature with performance of butterflies and their host plants (see below), provides a representative picture of the thermal heterogeneity in the study area.
Statistical analysis
The statistical analyses excluded areas that had been clear cut from 2016 to 2021, as the surface temperatures in these areas had changed due to changed land use (3.7 ha). The remaining areas were stable, considering gravel, tussocks, bush and tree cover, throughout our study period. The surface temperature was scaled to improve model convergence of the generalized linear models (GLMs) described below and normalize the data distribution, resulting in a mean surface temperature of 0 and a variance of 1. The Roman numerals (i–vi) in the description of the statistical analyses below indicate how the different tests are associated with the six specific objectives.
To test (i) if the duration of the butterfly flight period was associated with the ambient air temperature during the imago flight season, we performed a GLM. Each year, the start and the end of the flight period were based on the 5th and 95th quantile of the flight period. Yearly estimates of average daily ambient air temperature during the flight season, from 26 May to 29 June, as calculated based on information from the weather station at Fårö were used as the predictor variable.
To test (i) whether yearly variation in density of butterflies, density of host plants, and maximum leaf size of the host plant was associated with yearly variation in weather conditions we performed three pairs of General Linear Mixed Model (GLMMs), for density of butterflies, density of host plants, and maximum leaf size, respectively. Each model included average ambient air and total precipitation as predictor variables. Yearly estimates of average daily ambient air temperature for May and June as calculated based on information from the weather station at Fårö were used as the predictor variable. Year was included as a random factor. Due to the low number of years for which we had data, the associations with ambient air temperature and precipitation were evaluated in separate analyses summing up to six GLMMs. Models were fitted with negative binomial error structure and a log link function. A negative binomial error structure was used to correct for the overdispersion (Zuur et al., 2009).
To test (ii) whether the species composition of nectar plants primarily used as food by adult butterflies varied across years we used Fisher’s exact test.
To test (iii, iv) whether imago, larva, and host plant were consistently occurring above the average available surface temperature in the study area, we used the difference between the average available surface temperatures and the average used surface temperatures. Thereafter we tested if the mean distribution of these differences was significantly different from zero with a one-sample t-test. We used data for imago, larva nests, and host plants that intersected with the thermal mapping area and performed separate tests for each group (imago, larva nest, and host plant).
Further, to test (iii, iv) whether the utilized surface temperatures differed across years and between larva, imago, and host plant, we performed a GLM with year and imago/larva/host plant as fixed factors to separate the effects of surface temperature preferences between imago/larva/host plant across years. Models were analyzed for heteroscedasticity using Levene’s tests. As we had missing data in some years (adult butterflies in 2016, 2018, larva nest in 2021, host plant measures in 2016 and 2021), sample sizes across the years and among imago/larva/host plants revealed unbalanced data. Statistical differences across years and between imago/larva host plants were determined by pairwise t-test after Bonferroni multiple testing correction. We set the variance to false, meaning that Welch’s t-test was performed, accounting for unbalanced data. Welch’s t-test has the most power and the lowest type I error rate and is suitable for unequal variances.
To test (iv, v) whether and how the four response variables density of imago, density of larva, density of host plant, and the mean maximum leaf size were associated with surface temperature, we built a single GLM with a Poisson error distribution, the log-link function, and treatment contrasts. We build one GLM for each of the four response variables. The density of butterflies and larvae nests per year in the 3,242 100 m2 grid squares was used, and for plants, the number of grid squares sampled each year was included. The continuous variable relative surface temperature and sampling year (4–5 levels) were included as predictor variables. To explore non-linear responses, we included the quadratic term of the relative surface temperature. To explore if the relationship linking the response to surface temperature was constant or changed over time, we included the interaction between year and surface temperature (a significant interaction indicative of year-dependent responses). We rotated the reference category to examine statistically significant differences between years in the slope of the relationship (year). Each GLM was also tested for spatial autocorrelation and re-run with a spatial structure (Supplementary Appendix 2).
Finally, to test (vi) whether survival (from an egg in summer to the larva in spring) was related to surface temperature and host plant density, we built a GLMM with a binomial error distribution and a logit link function. The egg to larva survival was treated as a binary response variable per egg (1/0), and the surface temperature, host plant density and mean maximum leaf size were the three continuous predictor variables. Egg batch was included as a random term to account for multiple eggs in each batch. GL(M)Ms were performed in the R package glmmTMB (Brooks et al., 2017). Model marginal effects and confidence intervals (CIs) were calculated using the ggeffects package. Model selection was based on the Akaike information criterion (AIC). The three predictor variables, surface temperature, host plant density, and mean maximum leaf size were not correlated (highest Pearson correlation -0.15, p = 0.52, n = 20) and can thus be included in the same GLMM (Dormann et al., 2012). All statistical analysis was performed in R version 4.1.0 (R Core Team, 2021).
Results
Summary statistics
We obtained data for 2,920 imago butterflies and 776 larva nests, with annual counts ranging from 155 to 1,264 adult butterflies in 2019, 2020, and 10–339 larva autumn nests in 2018 and 2020 (Figure 1E and Supplementary Figure 3). The number of imago butterflies per grid square in the 3,242 grids ranged from 0 to 11 (mean = 0.459, SE = 0.007), larva nests from 0 to 4 (mean = 0.048, SE = 0.002), host plant density from 0 to 46 (mean = 3.599, SE = 0.196, Figure 1F), and the longest leaf varied from 2 to 24 cm (mean = 10.421, SE = 0.175, Figure 1F). The density of imago, larva, and host plants were higher in 2017 than after drought conditions in 2018/2019, as evidenced by the intercept of the four models. Butterflies and larvae nests had recovered to similar densities, whereas plant densities remained lower in 2020 compared to 2017. The temperatures utilized by imago, larva, and plants were significantly higher (p < 0.05) than the available surface temperatures (one-sample t-tests, Figure 2 and Supplementary Table 1).
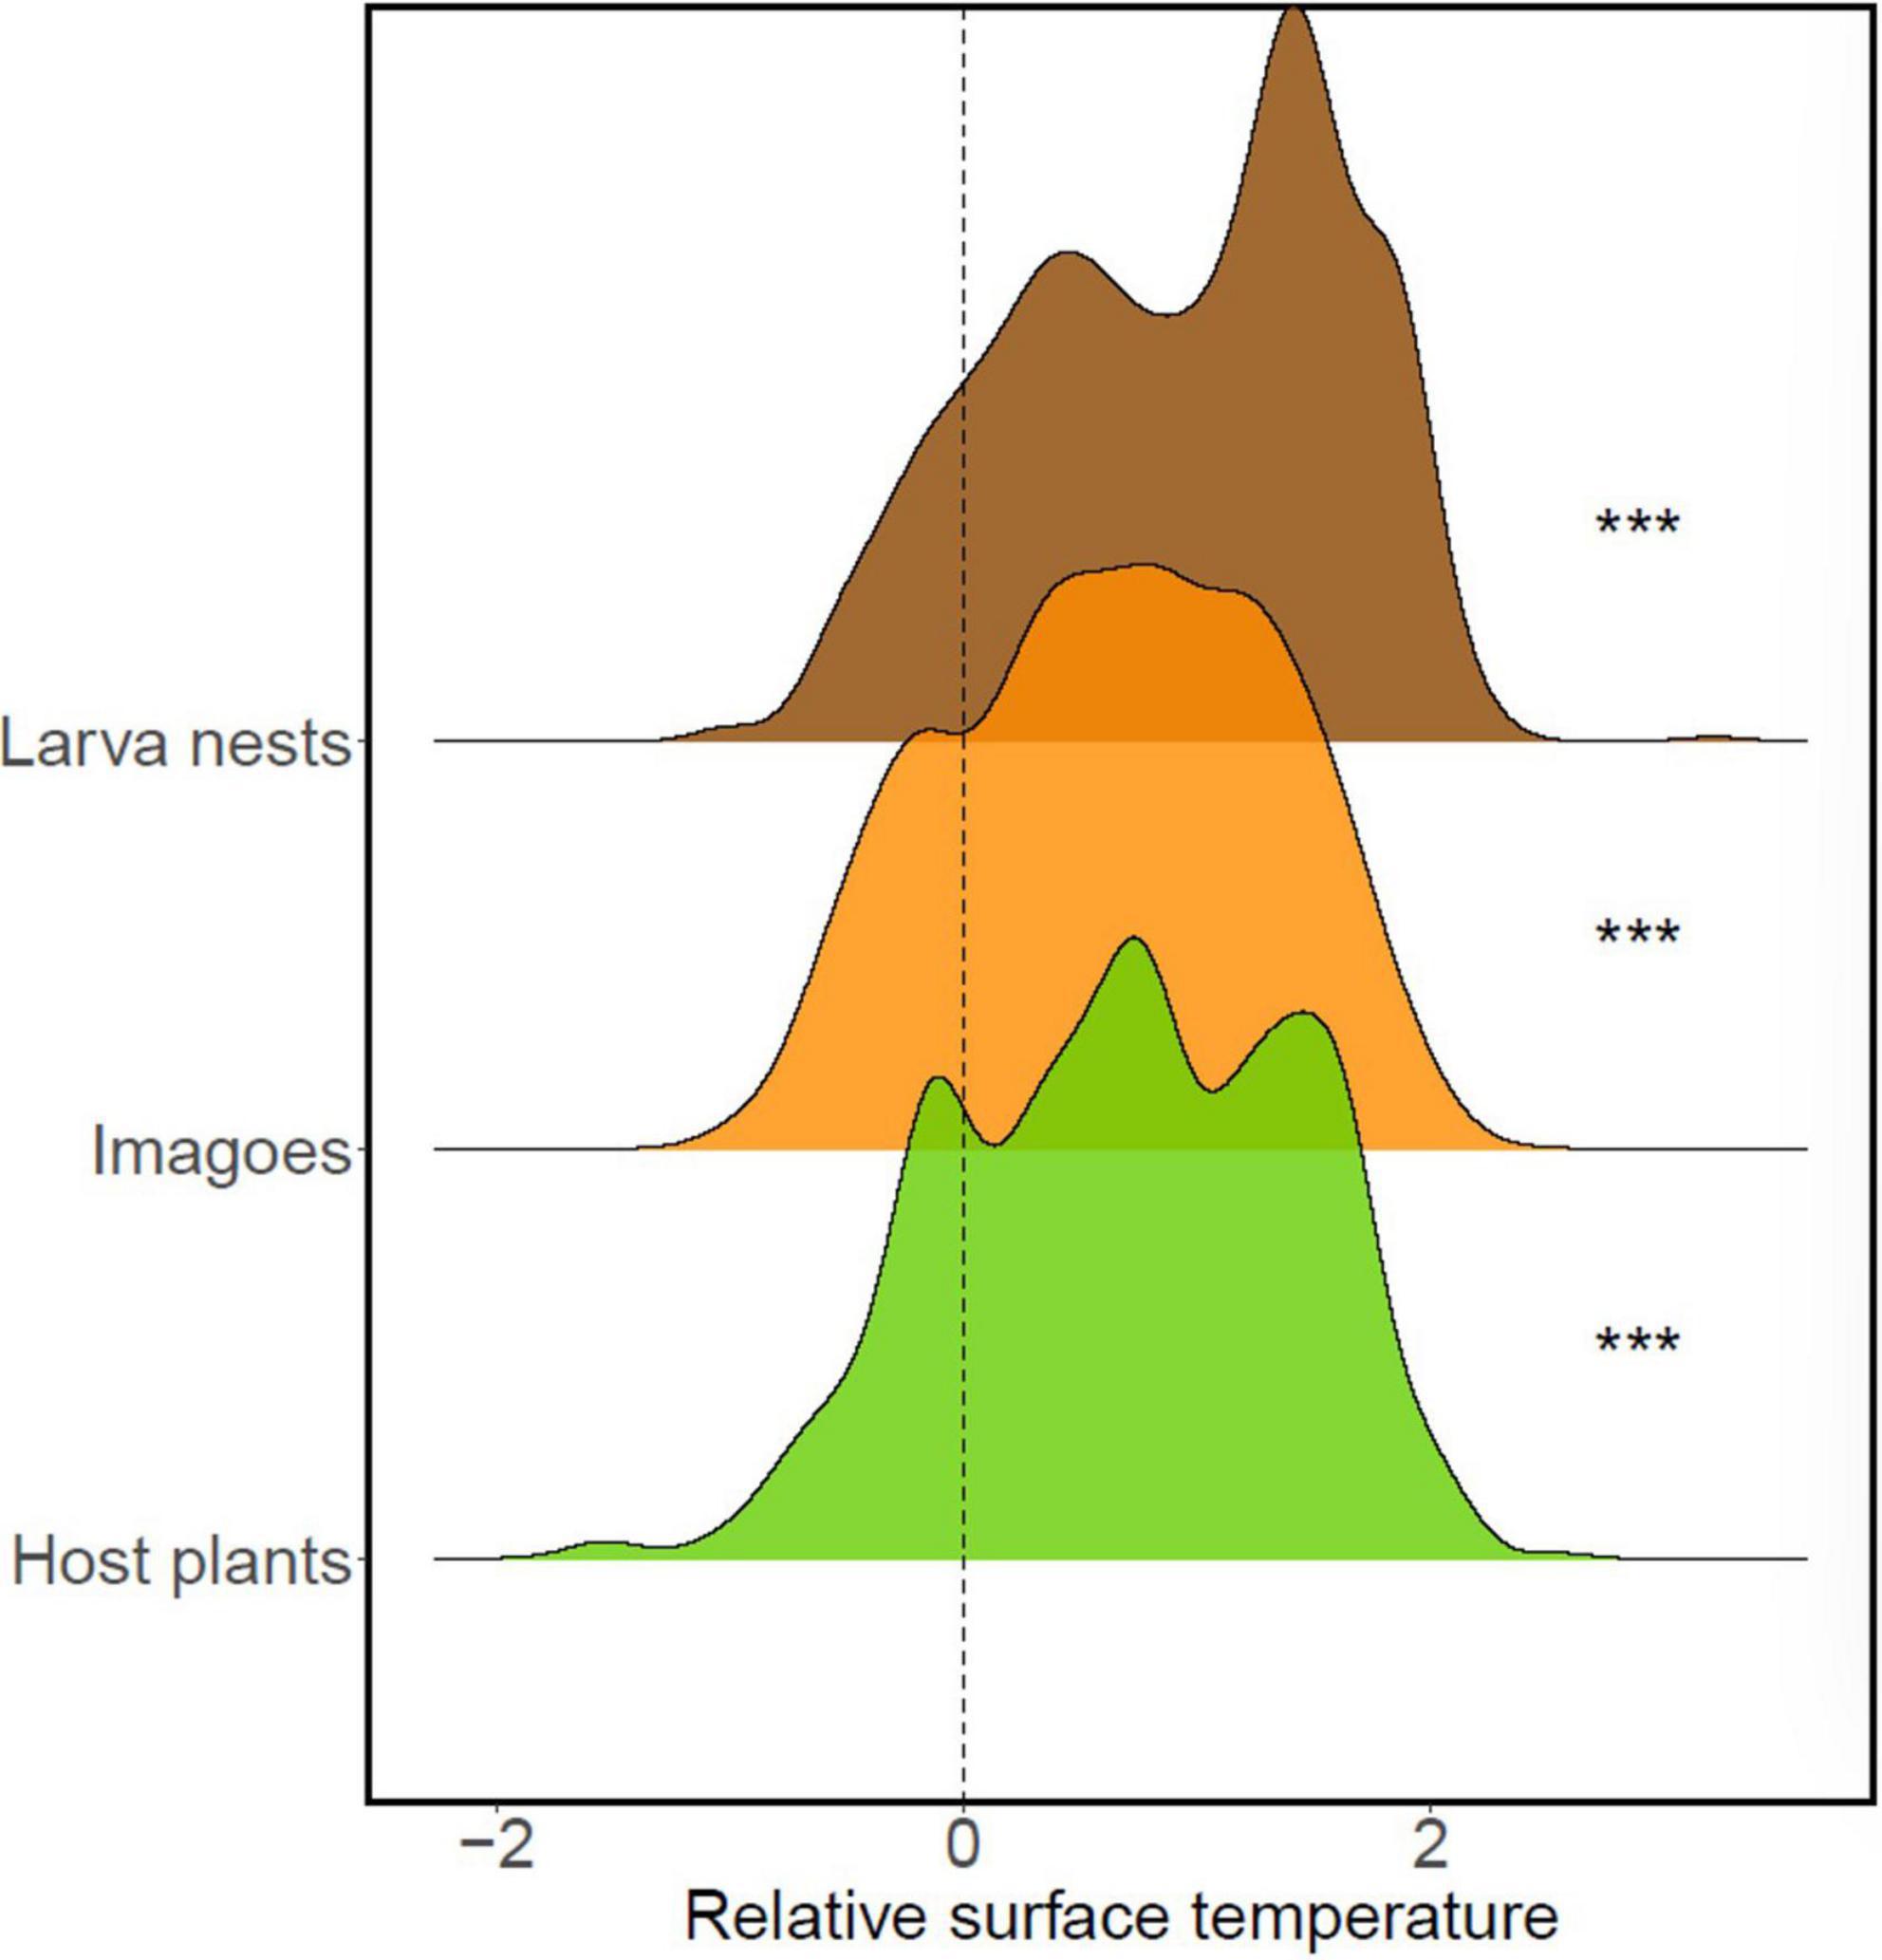
Figure 2. Distribution of utilized vs. the available surface temperatures for imago and larva nest of Euphydryas aurinia and the host plant, the Succisa pratensis in the 46 ha File Hajdar study area, South-Eastern Sweden from 2016 to 2021. Significance levels from one-sample t-test. ***p < 0.0001.
Yearly variation in the duration of the adult flight period, density of butterflies, and density and leaf size of host plants in relation to yearly weather conditions
The duration of the adult flight season of the butterflies varied across years, from 15 days in 2021 to 22 days in 2020 (Figure 3). Among years, the duration of the flight season declined with increasing temperatures (slope estimate = −2.24, R2 = 0.99, p = 0.013, n = 4, Figure 3). Results further indicated that yearly weather variation influenced density of butterflies as well as density and leaf size of the host plant (Table 1). Specifically, the density of adult butterflies increased with increasing precipitation in the preceding year (indicative of a time lag), and decreased with increasing average ambient air temperature in the current and the preceding year (Table 1). Both the density and maximum leaf size of the host plant S. pratensis increased with increasing precipitation in the preceding year (as did butterfly density), and decreased with increasing ambient temperature in the preceding year (Table 1).
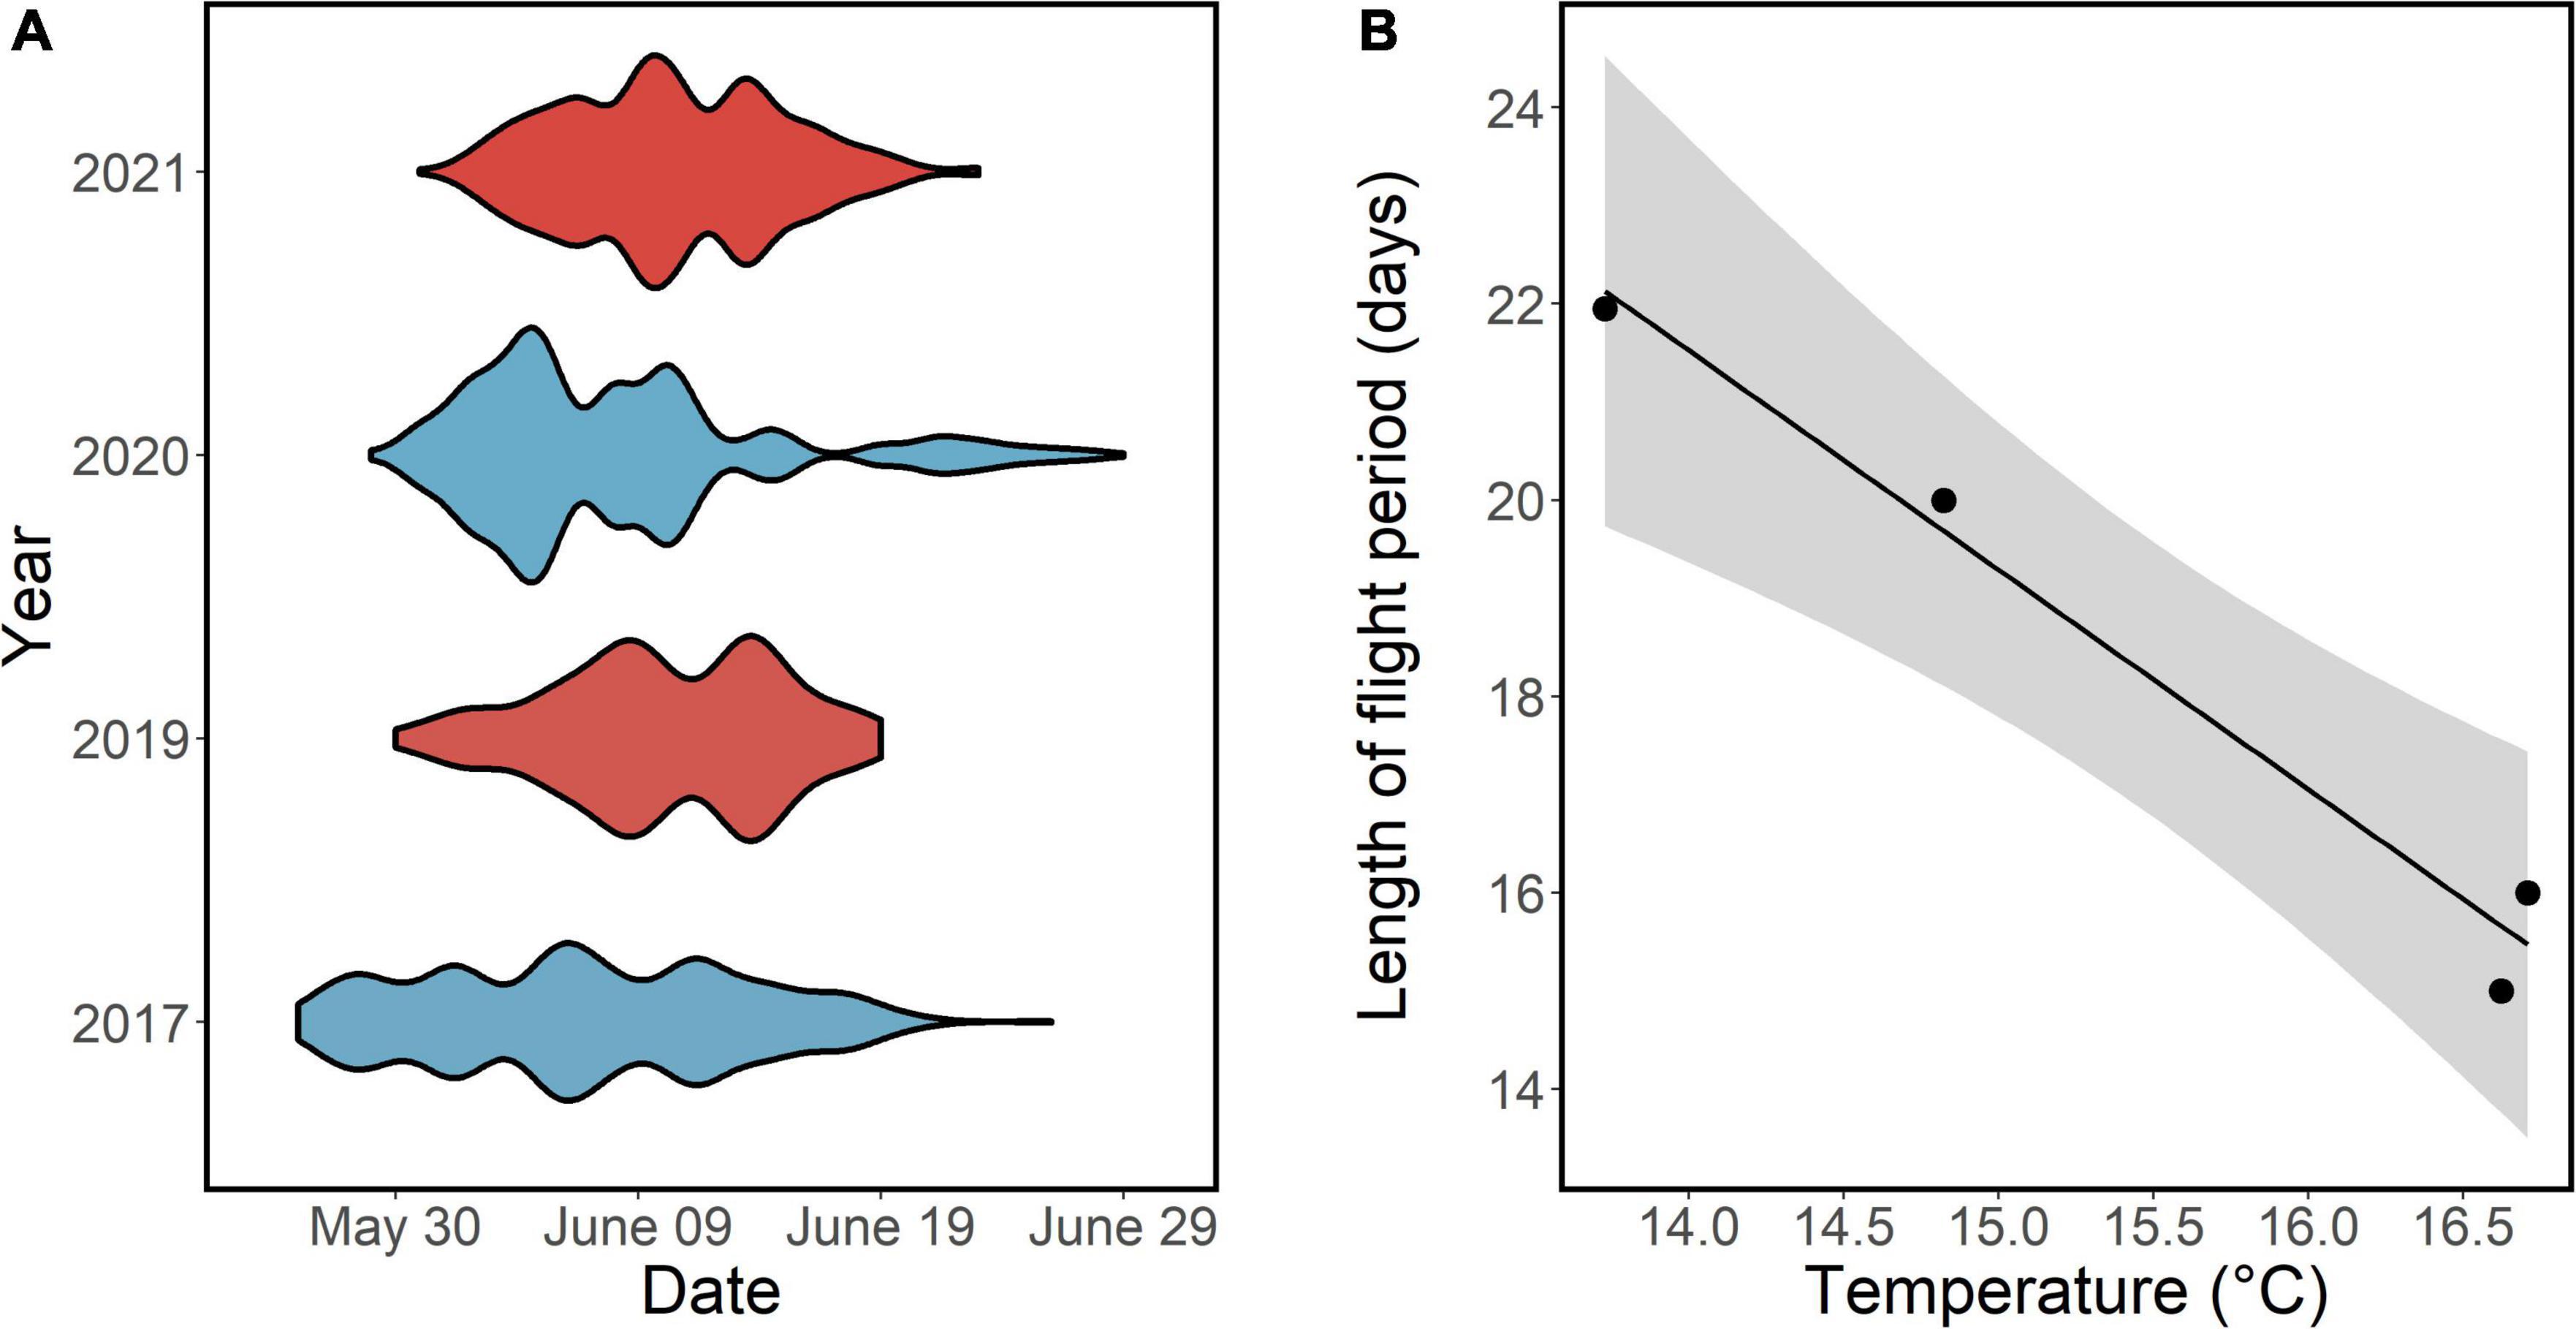
Figure 3. Variation in phenology and duration of flight period of adult butterflies in relation to ambient air temperatures. Violin plot depicting the phenology of adult butterflies across the whole flight period in different years. Blue color denotes lower temperature compared to red during the imago flight period (A). The relationship between mean annual temperature from 26 May to 29 June (during adult flight season) and the length of the adult flight season (Y = 52.8–2.24 × x, R2 = 0.97, p = 0.013) (B).
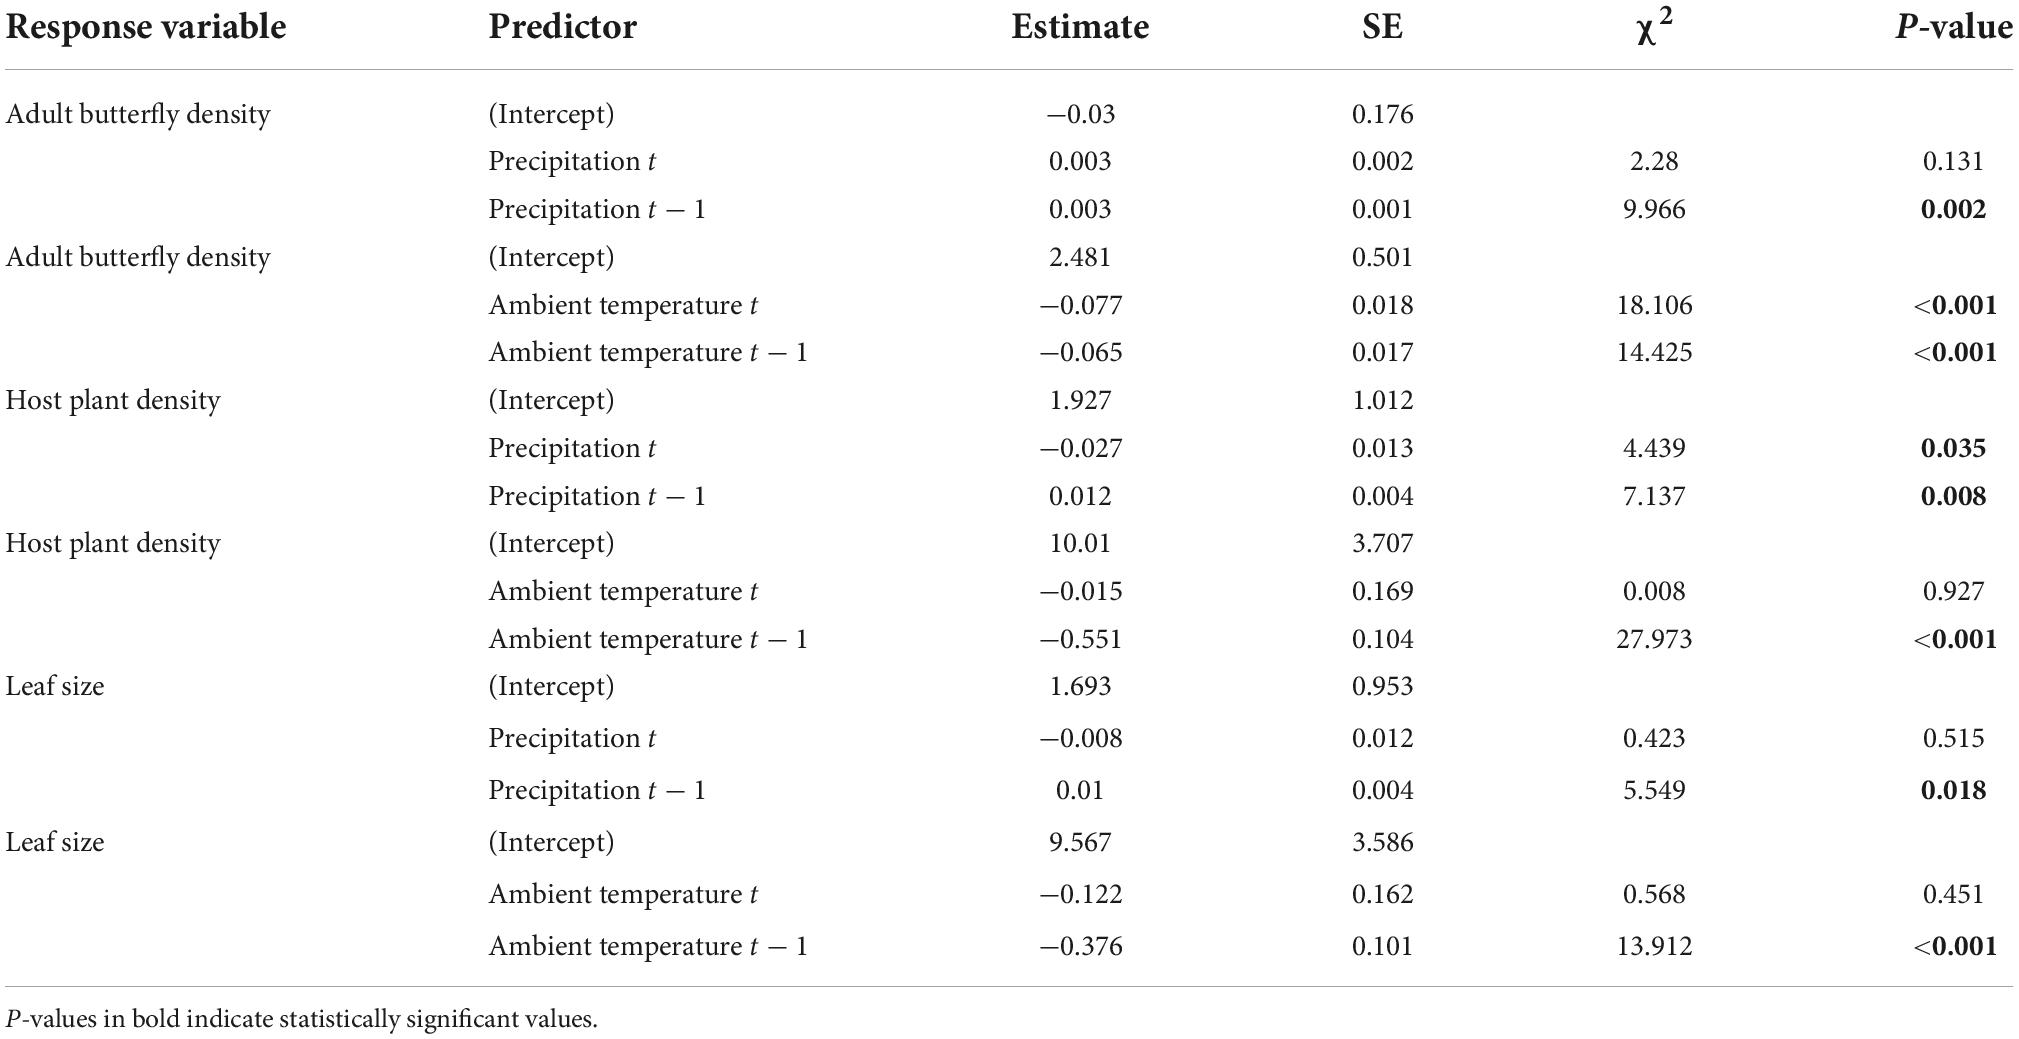
Table 1. Results from generalized linear models’ testing for a relationship between yearly variation in butterfly imago density, host plant density, and average maximum host plant leaf size with yearly weather variation (average ambient air temperature and total precipitation during the butterfly flight period, in year t and year t − 1).
Yearly variation in utilized nectar plants
The nectar plants visited by the imago differed between years, with Primula farinosa dominating in 2017, Allium in 2019, Globularia vulgaris in 2020, and Geranium sanguineum in 2021 (Fisher’s exact test, p < 0.001, Supplementary Figure 4).
Comparisons of yearly abundance variation, spatial distribution in relation to weather variation, and surface temperature between butterfly life stages
Yearly precipitation (mean range mm) and temperatures (mean range °C) fluctuated between years; in 2018, daily temperatures were higher, and precipitation was lower than any other year (Figure 1D and Supplementary Figure 2). Regarding the consequences for butterflies of spatial variation in surface temperature, the GLM revealed that the main effects and the two-way interaction between year and imago/larva/host plant occurrences were statistically significant (Table 2). Larva nests occurred in microhabitats with significantly lower surface temperatures in 2018 compared to 2019. Pairwise comparisons revealed that imagos occurred at significantly higher surface temperatures in 2021 compared to all other years (2017, 2019, and 2020) and in 2017 compared to 2020 (Supplementary Figure 5 and Supplementary Table 1).
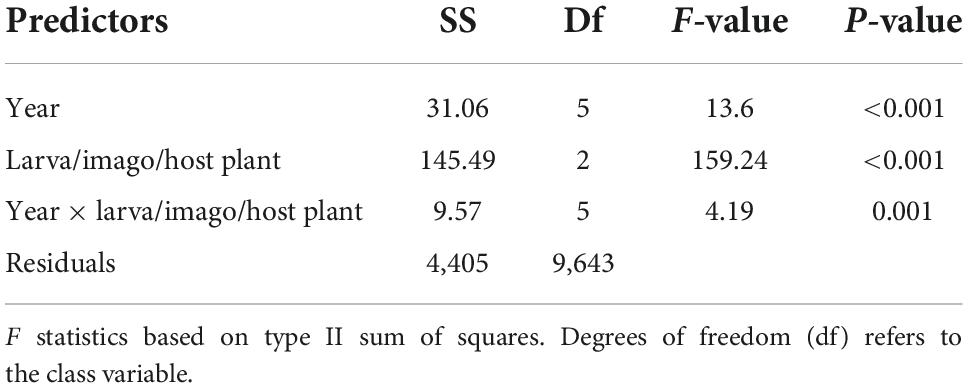
Table 2. Summary of the general linear model testing utilized surface temperatures across years for imago Euphydryas aurinia, larva nests, and the host plant Succisa pratensis.
The relationships linking density to surface temperature varied according to life stage and year. For imago butterflies, the relationship between density and surface temperatures varied qualitatively from curvi-linear with a density optimum at average surface temperatures in 2017 and 2021 to a negative linear relationship in 2019 and 2020 (Figure 4A and Table 3). The negative and curvi-linear slopes were significantly different from each other (Figure 4A and Table 3). The density of autumn larva nests increased with increasing surface temperature in all years except in 2018, when the density of larva nests instead decreased with rising surface temperatures (Figure 4B and Table 3).
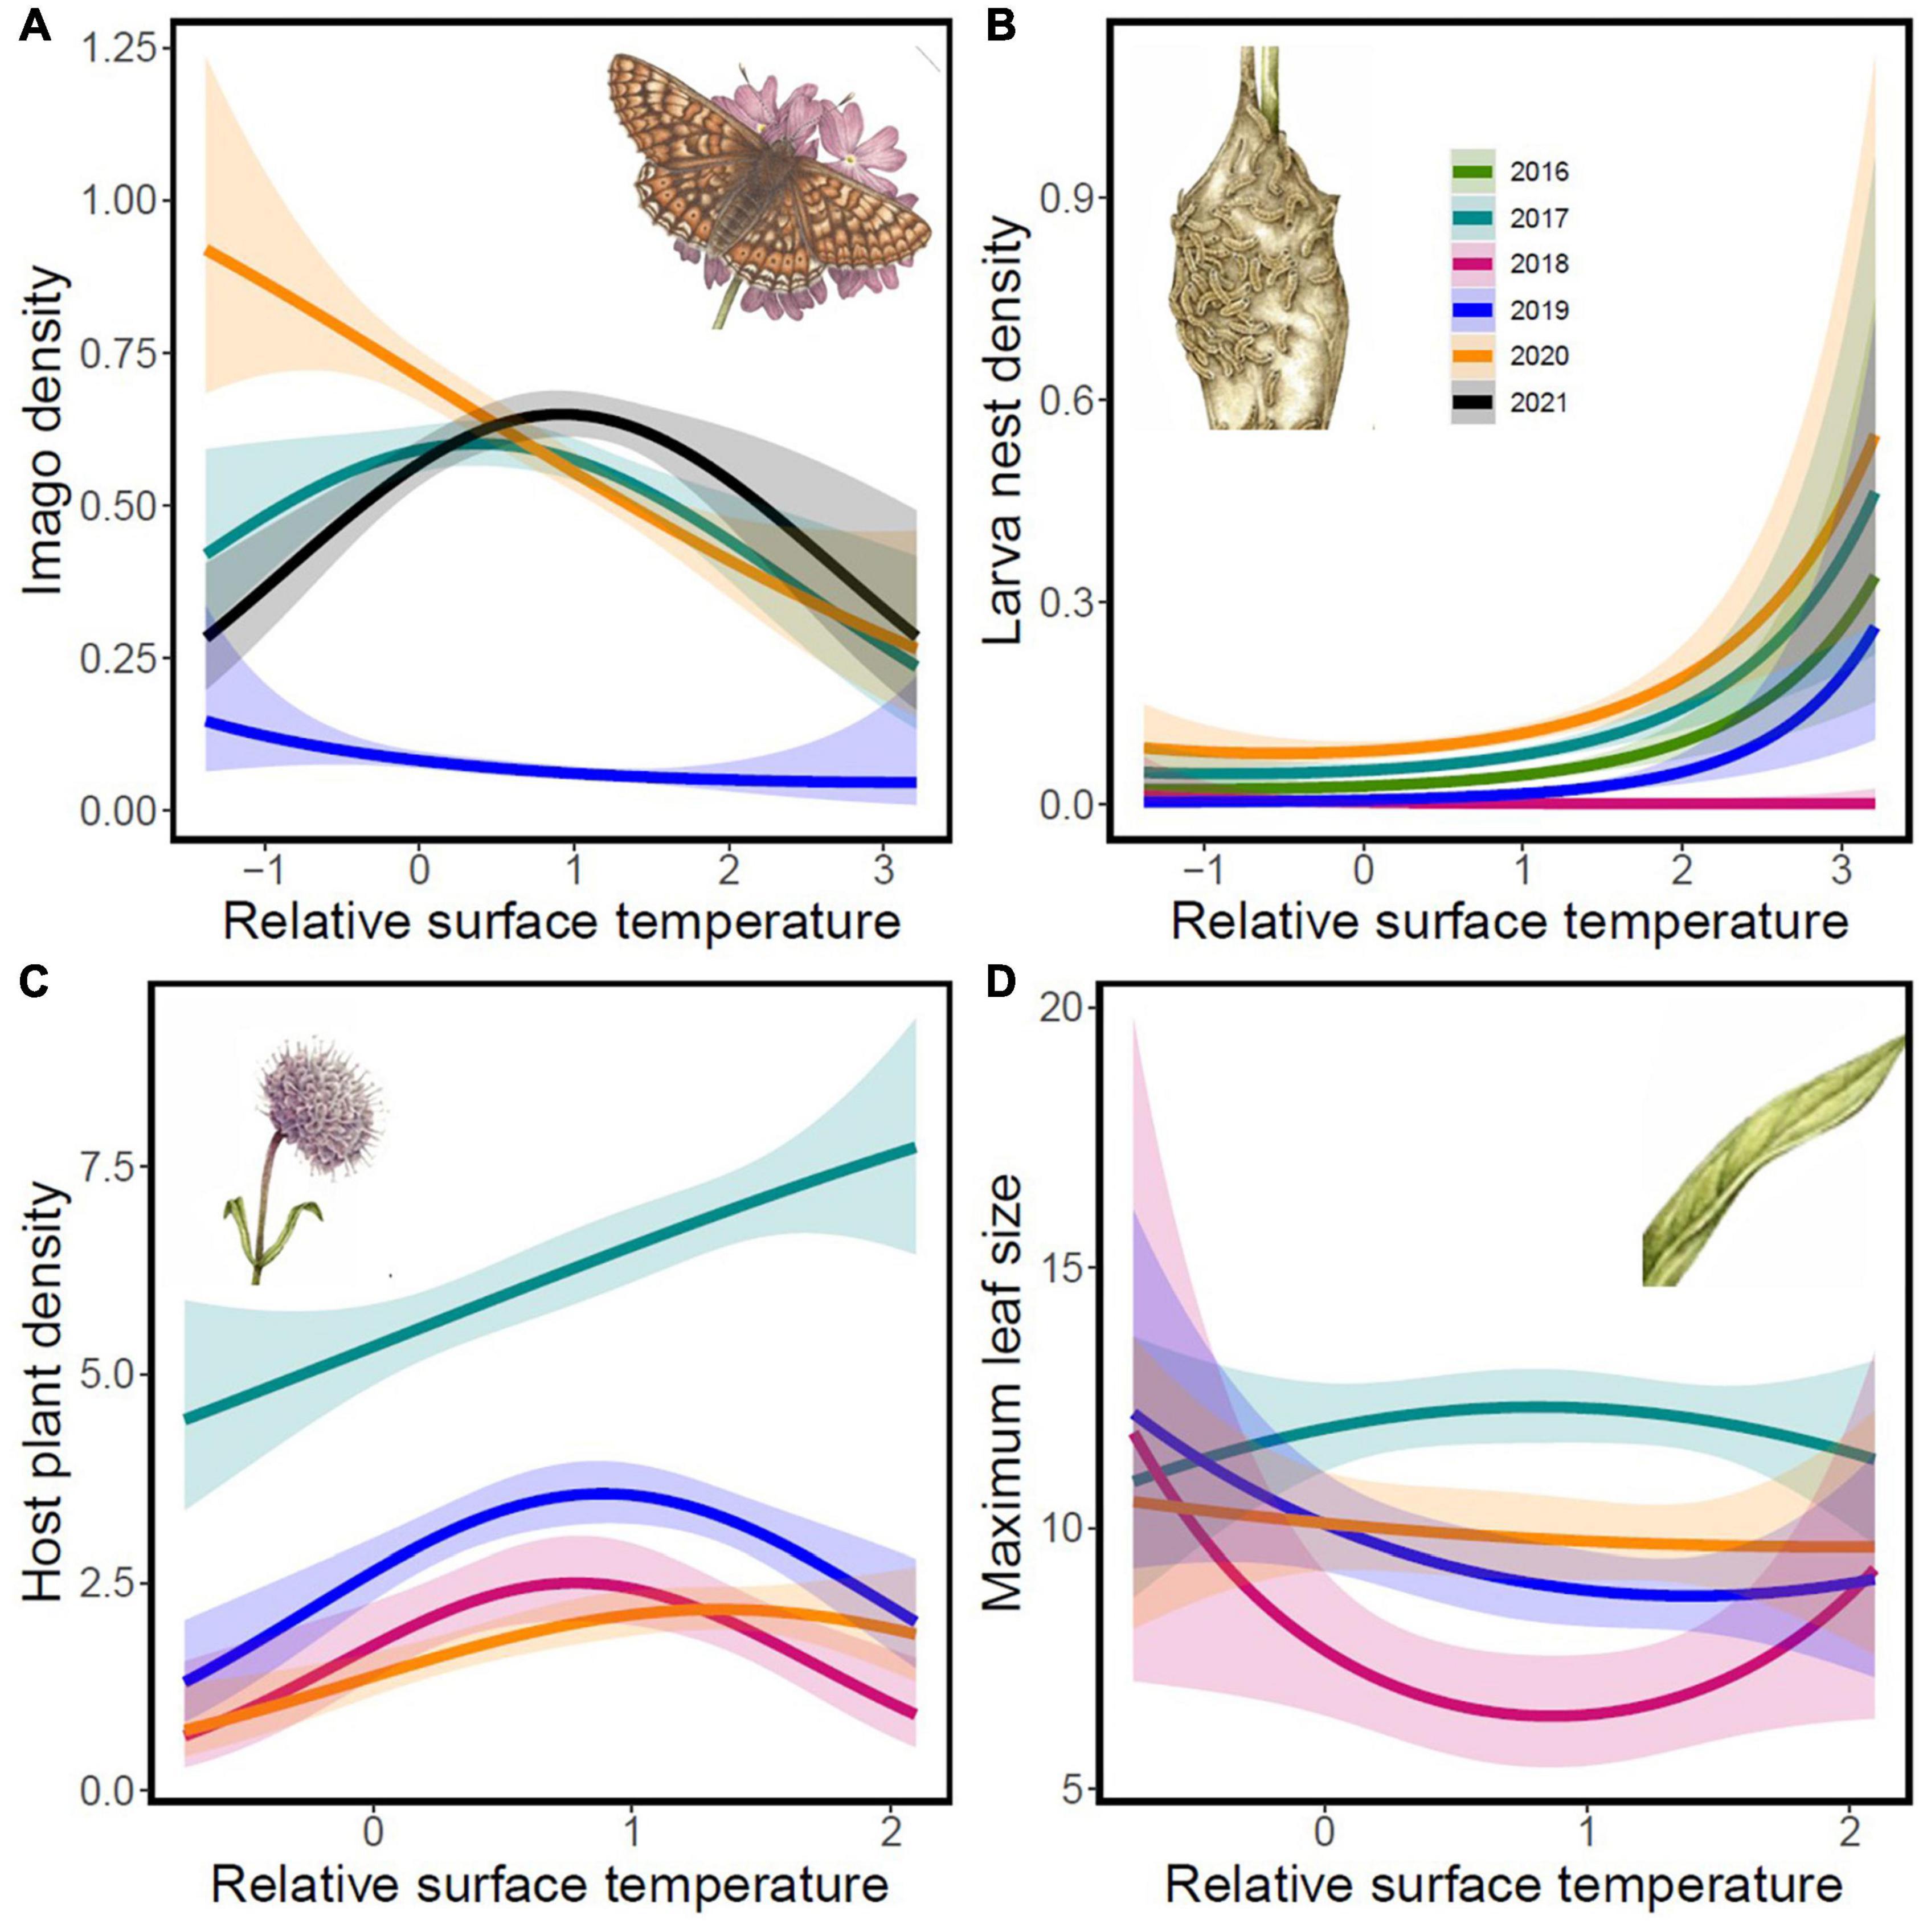
Figure 4. Associations of population densities of imago Euphydryas aurinia (A) and larva (B) and the host plant the Succisa pratensis (C), and the maximum host plant leaf size (D) with the relative surface temperature in different years. The model tests both linear and quadratic terms of relative surface temperature. Results from statistical evaluation of the associations are reported in Table 3. Drawings inserted in the graphs Copyright Emma Tinnert.
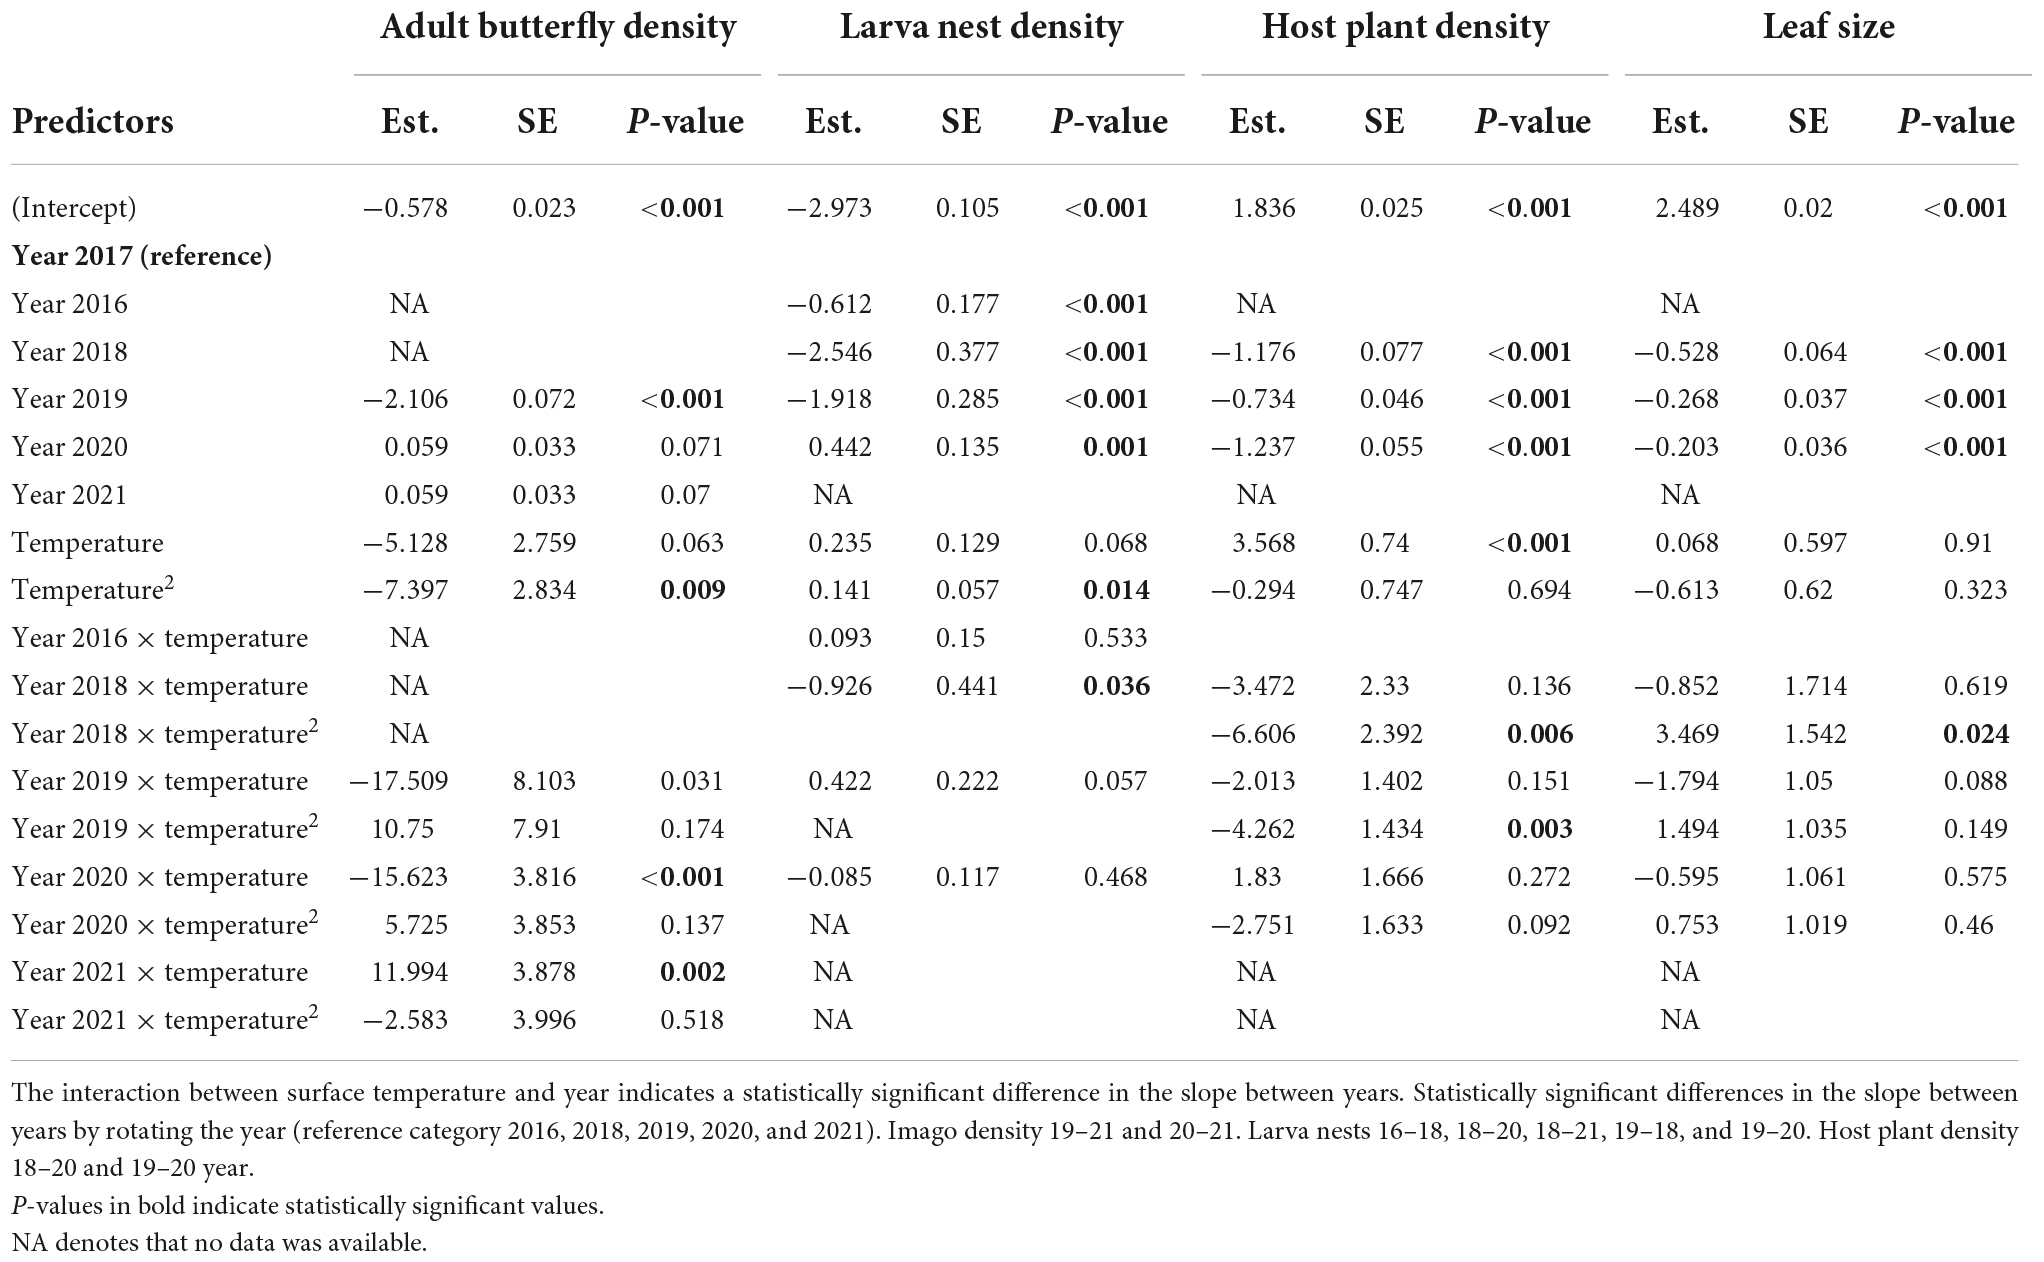
Table 3. Results from generalized linear models’ testing for a relationship between imago density, larva nest density, host plant density, and average maximum leaf size with surface temperature and year.
Comparisons of spatial distribution and abundance variation in relation to surface temperature between butterfly life stages and their host plant
The host plant S. pratensis occurred in microhabitats with significantly higher surface temperatures in 2020 compared to 2019. The host plant and larva autumn nests occurred at significantly higher surface temperatures than adult butterflies in all years (Supplementary Figure 5 and Supplementary Table 1). In 2019, larva nests occurred at significantly higher temperatures than the host plant (Supplementary Figure 5 and Supplementary Table 1).
Yearly and spatial variation in density and size of the butterfly host plant
Besides the associations of yearly variation in the density and size of the host plant with yearly weather conditions (see above and Table 1), results from the analysis of spatial variation showed that host plant density increased with increasing surface temperatures in 2017 and 2020, whereas density showed a curvilinear response with a density peak at average surface temperatures in 2018 and 2019 (Figure 4C and Table 3). Further, the longest leaves were found at average surface temperatures in 2017, while the opposite was found after the drought in 2018 (Figure 4D and Table 2). The models with host plant density and leaf size showed signatures of spatial autocorrelation (Supplementary Appendix 1). Still, the results from the models incorporating spatial structure remain qualitatively similar to the models without spatial structure (Table 3 and Supplementary Table 2).
Spatial variation in survival of butterfly eggs and larvae in relation to surface temperature
The number of eggs in each egg batch in July 2020 varied from 55 to 300 (mean = 211.00, SE = 22.58, n = 10). The number of larvae after overwintering in 2021 varied from 0 to 300 (mean = 42.10, SE = 29.52). After the winter the survival varied from 0 to 1 (mean = 0.17, SE = 0.10). Three out of the 10 colonies did not survive the winter. Survival from the egg in summer to the larval stage in the coming spring increased with increasing surface temperature (GLMM, slope estimate ± SE, 5.20 ± 2.19, p = 0.018) and with increasing host plant density (0.72 ± 0.35, p = 0.042; Figure 5 and Table 4). Mean maximum leaf size was not statistically important and did not enter the model with the lowest AIC.
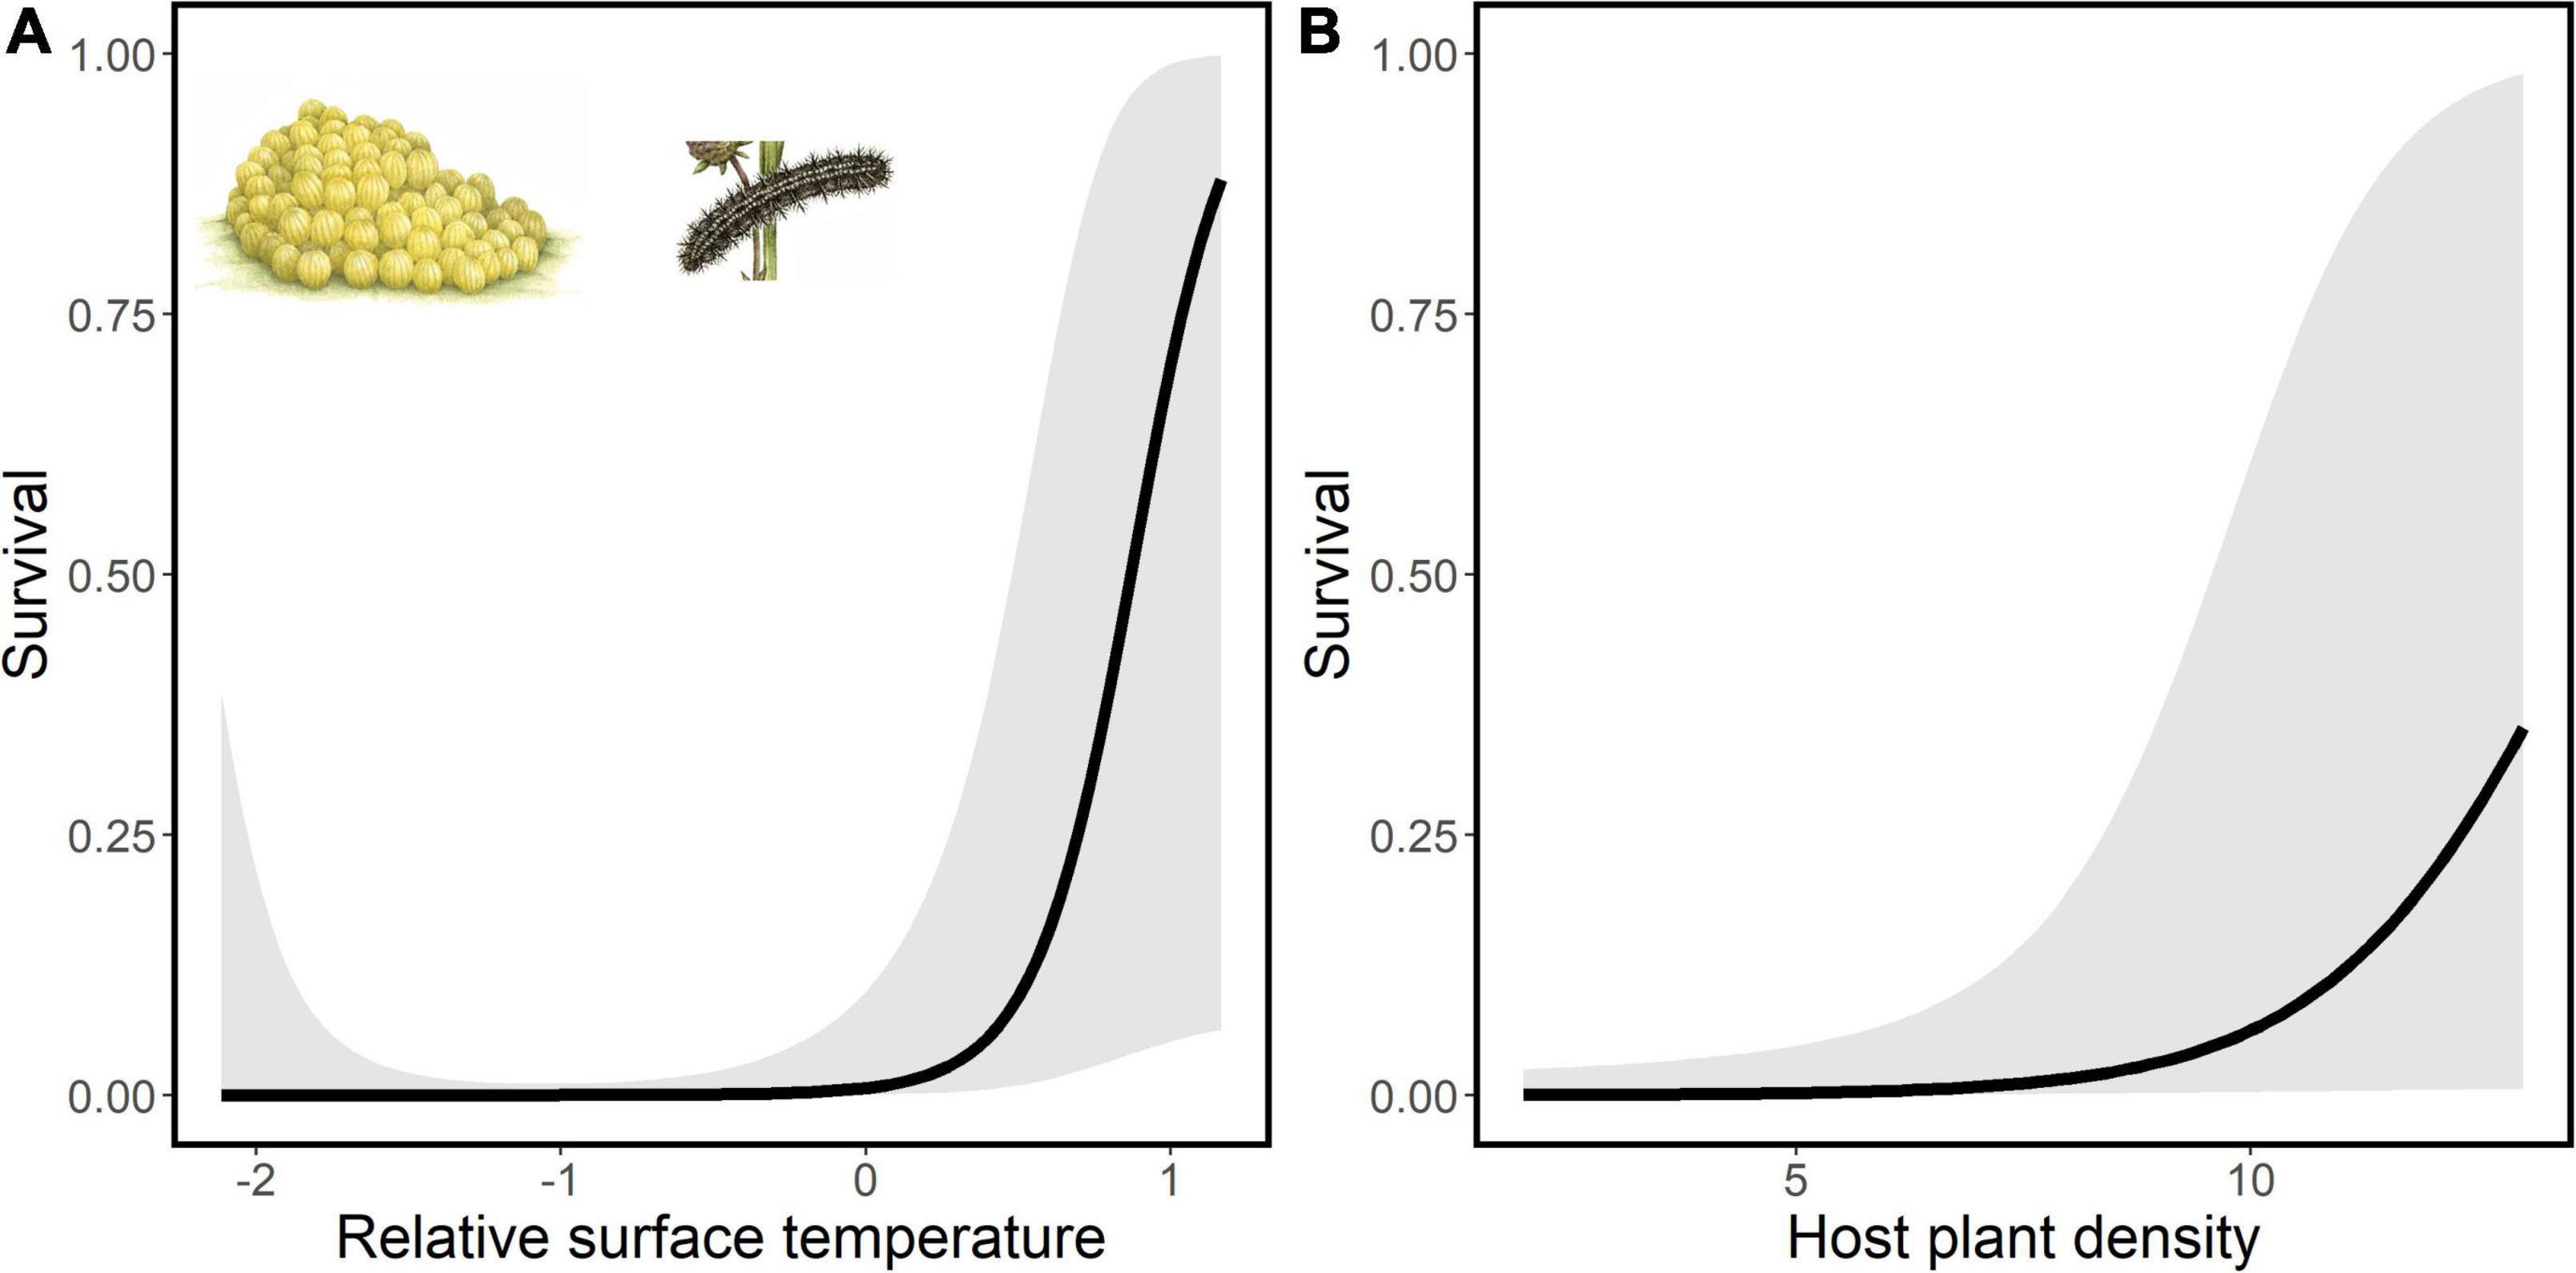
Figure 5. Associations of spatial variation in survival of Euphydryas aurinia eggs with (A) relative surface temperature and (B) density of the host plant Succisa pratensis. Results from statistical evaluation of the associations are reported in Table 4. Drawings of the egg batch and larva Copyright Emma Tinnert.
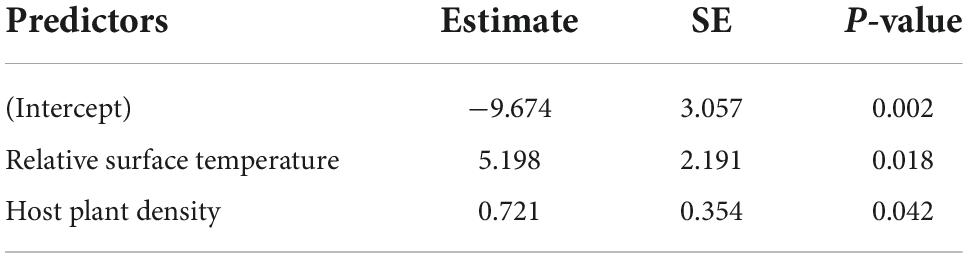
Table 4. The final general linear mixed model (GLMM) testing whether spatial variation in survival (from an egg in summer to the larva in spring) across 10 egg batches was related to surface temperature and host plant density.
Discussion
Our study approach allows for important insights into the complex ways by which yearly variation in weather conditions and spatially heterogeneous microclimates can jointly influence the dynamics and distributions of interacting species. By combining data obtained from a weather station and high-resolution data on spatial variation in microclimate obtained using an infrared sensor equipped on a UAV with geo-referenced field data on distribution and abundance of E. aurinia and its host plant collected over 6 years, we demonstrate that between year changes in weather conditions together with heterogeneous surface temperatures plays a critical role in the spatiotemporal dynamics of these species, and that years with extreme weather conditions can significantly modulate the associations of plant and animal densities with surface temperatures. On a general level, our present findings support conclusions from previous studies that variable weather conditions influence population dynamics of plants and animals (Pollard, 1988; Jamieson et al., 2012). Specifically, we found that the density of butterflies, as well as the density and maximum leaf size of their host plant S. pratensis increased with increasing precipitation in the preceding year and decreased with increasing ambient temperature in the preceding year. These results indicate that the responses of both butterflies and their host plants to variation in yearly weather conditions was qualitatively similar, and that the effects on density and growth were associated with time lags. However, the shared negative effects of high ambient temperatures on this plant-insect study system indicated by our analyses of the responses to yearly weather variation were not paralleled by the observed responses to the spatial variation in surface temperatures, pointing to a high degree of context specificity. Thus, the analyses of spatial variations suggested that the associations with surface temperature varied qualitatively between years, indicating that yearly weather variations modulate the responses to spatial microclimatic heterogeneity. In addition, the associations with surface temperature differed between butterfly life stages, and between butterflies and their host plants. Regarding spatial variation, we found evidence for a disruption in the population density to surface temperature relationship caused by the drought in 2018. Yet, during a period with normal weather conditions, the survival from egg to large larvae increased with increasing surface temperatures in 2020/2021, highlighting the importance of high temperatures. The duration of the flight season decreased among years with increasing temperature, and imagoes utilized different nectar plants in each year, suggesting adult life span and behavior to be year specific. Besides the striking variability across years, our results demonstrate that larvae nests and host plants occurred in warmer microhabitats on average compared to imagoes. These findings exemplify how heterogeneous microclimates combined with yearly weather variation can contribute to the structure and dynamics of biodiversity, as discussed below.
Pros and cons of high temperatures
We found that host plants and larva nests occupied warmer microhabitats compared to imago butterflies. It has been found that larva nests of the closely related Melitaea cinxia are located in areas with high temperatures (Curtis and Isaac, 2015). At high latitude and in cold environments, species that depend on the sun to mate, eat and complete their life cycle rely on warmer microhabitats to increase metabolism and growth rates (Heinrich, 1974; Ratte, 1984; Curtis and Isaac, 2015). Sun basking and choice of warmer microhabitats are therefore common among larvae and imagoes in butterflies and other insects (Clench, 1966; Porter, 1982). High surface temperatures might also reduce parasitism among herbivores and increase plant growth rates (Rausher, 1981). In E. aurinia, the opportunity of the larva to bask reduces the infection rate of post-diapause larvae with parasitoid braconid wasps such as Cotesia spp. (Porter, 1983). Additionally, host plants exposed to high surface temperatures increase plant size and translate into increased larval performance and adult fitness (Williams, 1981; Renwick and Chew, 1994; Ehrlich and Hanski, 2004; Salgado and Saastamoinen, 2019). Drought-stressed plants store nutrients like carbon and nitrogen, increasing herbivore fitness (Mattson and Haack, 1987). Thus there are multiple reasons for females to search for higher temperatures when depositing their eggs. There is no doubt that survival increases with increasing surface temperatures in years with normal weather (Figure 5). In E. aurinia, overwintering is the most crucial step in the life cycle, and a high proportion of the surviving larvae (if not parasitized) will hatch into imago (Radchuk et al., 2013).
Williams (1981) showed that females of Euphydryas gillettii inhabiting a thermally constrained montane habitat choose warmer microsites for egg-laying, resulting in egg clusters clumping on host plant leaves orientated toward the sun. Recently, it was shown that butterflies use their wings to sense visible and infrared radiation and respond with specialized behaviors to prevent overheating their wings (Tsai et al., 2020). However, in our study area, butterflies did not shift their oviposition preferences and lay eggs in colder areas when ambient air temperatures are high, as in 2018. If egg batches have been deposited where temperatures in certain years exceed their temperature tolerance, mortality will be inevitable. We observed this in 2018, one of the warmest and driest summers ever recorded (Peters et al., 2020). As climatic extremes become more prevalent many species might face increased extinction risks in areas where temperatures exceed species tolerances. During the 2018 summer drought, females’ did not adjust their thermal preferences resulting in only 10 larval nests surviving (compared with 139 and 235 the two previous years and 53 and 339 the following years, see Figure 4B and Supplementary Figure 3). Of the 10 larva nests found in 2018, eight seemed to be in bad condition or even abandoned. Six nests were found in surface temperatures within the lowest quartile of all egg batches, underscoring the importance of microhabitat in buffering populations from extreme drought, but only when paired with adequate variety in oviposition preferences (Scheffers et al., 2014). The extreme drought may select for females that oviposit in slightly colder areas, which will improve the offspring’s development and survival under novel temperature conditions (Thompson and Pellmyr, 1991; Martin, 2001). Previous studies of the Hesperia comma butterfly instead suggest that females can change behavior, laying their eggs in areas with lower temperatures when temperatures are high (Davies et al., 2006). These adjustments are critical for tracking ideal circumstances for offspring and mitigating climate change consequences (Scheffers et al., 2014). Also, bush cricket shifted to colder habitats as a response to a drought (Kindvall, 1995), and warblers shifted the location of nests as a result of altered long-term precipitation patterns (Martin, 2001).
Limiting host plant resources
We found that larva survival increased with increasing surface temperatures and increasing host plant density. The number of available host plants could limit larva growth and survival (Dempster, 1983; Weiss et al., 1988; Nieminen et al., 2004; Shreeve et al., 2004). Considering the life cycle of the E. aurinia, the larval instars during the summer live gregariously and consume many leaves. The choice of oviposition sites with high host plant abundances may also reflect the food requirements of the growing post diapause larvae the following spring. The drought in 2018 reduced host plant size and density, and the densities have not yet (in 2021) recovered to pre-drought conditions (Figure 4). Surprisingly, the lower host plant densities following the drought did not seem to have any long-term dramatic negative consequences for the butterfly. The host plant might recover slow after the drought as the plants are perennial and xylem repair can take years (Meinzer and McCulloh, 2013) while the immediate recovery of the butterfly can be a result of the large number of eggs laid per female allowing for an immediate recovery (Johansson et al., 2022).
The population density-surface temperature relationship
We found that the relationship linking population density of butterflies to surface temperature was modulated by the extreme drought in 2018, and long-term effects were evident several years after. Disrupted population responses to climate extremes are expected, and their duration often reaches over several years (Easterling et al., 2000). Before the drought in 2017 and after the drought in 2020, the density of imago butterflies peaked at average surface temperatures. This is expected if butterflies actively avoid too cold and hot surface temperatures (Tsai et al., 2020). During and directly after droughts and extremely high temperatures, conditions for plant growth might be optimal at intermediate surface temperatures although they may be able to withstand the highest temperatures and grow even at lower temperatures albeit at a slower rate (Hatfield and Prueger, 2015), consistent with the results for host plant densities. The host plant had larger leaves at sites with intermediate temperatures before the drought and instead smaller leaves at sites with intermediate temperatures the year after the drought. A possible explanation for this might be that plants in less dense populations could increase their leaf size more than plants in dense areas (Weiner, 1985). Plant density and plant leaf size should ultimately influence the available resources and increase survival of E. aurinia, partly supported by our results. Especially as the studied population seems to experience low levels of predation and parasitism, the amount of host plants might be an important limiting resource (MF personal observation).
Between-year variation in utilization of nectar plants and life span
Plants and animals with distinct life stages are often exposed to different temperatures during each stage (Fenberg et al., 2016). This can influence how such organisms respond to climate change. Our finding that the major nectar plants visited by imagoes varied depending on the year suggests instead that the butterflies foraged in different areas depending on where suitable flower resources were available. Among the most visited plants, Allium, Primula, and Potentilla occur at colder moist microhabitats compared to Geranium, Globularia, and Scorzonera that occur in drier and warmer microhabitats (Tyler et al., 2021). This may have driven the foraging butterflies into areas with lower or higher surface temperatures than their temperature optimum. Such behavioral shifts to thermally unfavorable microhabitats may have incurred physiological stress and contributed to our finding that the duration of the butterfly flight period decreased across years with increasing ambient temperature. Laboratory experiments support this, and in Drosophila, it has been shown that life-shortening is induced by relatively high temperatures (Miquel et al., 1976).
Conclusion and future directions
Our findings illustrate how yearly variation in weather conditions and heterogeneous surface temperatures interactively drive the spatiotemporal dynamics of E. aurinia and its host plant, and thus reinforce the realization that environments that may appear homogeneous to the human eye may be heterogeneous and of varying quality for the plants and animals that live there. Indeed, our analyses of measurement repeatability of thermal heterogeneity indicated that there was significant spatial variation in surface temperature between different point locations in the study area, and that the spatial variation in relative surface temperature was consistent across years, dates, and times of day. In addition, the structural composition of the study area has been intact, such that spatial differences in surface temperatures during sunny days should remain qualitatively unchanged over time during the adult and larvae activity period and across years. Our study confirms that it is now easy, realistic, and cost-efficient to use UAVs deployed with multispectral sensors to capture high-resolution surface temperature data to explain spatial distributions, densities, and survival of butterflies and their larvae, and also host plant densities and leaf sizes. A key finding emerging from our study is that spatial variation in surface temperatures and yearly weather variations can have opposing effects on different life stages in species with complex life histories. As such, the context specificity and variability of responses to changing and variable temperatures and precipitation patterns documented here identifies long-term investigations into the mechanistic underpinnings of how climate warming affects multitrophic interactions as an important field of future research. Similar approaches applied to this and other study systems may inform how yearly weather variation and microclimate jointly influence individual behaviors, population processes, and species interactions. This can advance knowledge about ecological interactions, evolutionary modifications, and ultimately improve the protection of biodiversity.
Data availability statement
The datasets presented in this study can be found in online repositories. The names of the repository/repositories and accession number(s) can be found below: www.artportalen.se.
Author contributions
MF conceived the study. MF and AF wrote the first draft of the manuscript. JA, MF, OK, and VJ coordinated the fieldwork and collected the data. YF analyzed the data under the supervision of MF and AF. All authors commented on the manuscript and approved the final version before submission.
Funding
This study was funded by Cementa AB, the Swedish National Research Program on Climate and Formas (grants to MF and AF Dnr. 2018-02846 and Dnr. 2021-02142), Tryggers stiftelse (grant to MF), and Stiftelsen Oscar och Lili Lamms Minne (grant to VJ Dnr. FO2020-0023).
Acknowledgments
Anders Birgersson, Anna Hassel, Arne Pettersson, Bafraw Karimi, Caspar Ström, Daniela Polic, Demieka Säwenfalk, Emma Djurberg, Emma Drotz, Hanna Norman, Isabel Cardim de Resende, Jan Högvall, Johan Stenberg, Judith Askling, Junia Birgersson, Kaj Svahn, Lovisa Johansson, Martin Lindner, Olle Kindvall, Patrick Gant, Sanna Svanberg Risberg, Sara Nyberg, Stina Juhlin, Tim Nordvall, and Tove Rönnbäck assisted in collecting data in the field. We thank Ed Turner, Insect Ecology Group, University of Cambridge and two reviewers for comments on a previous version of the manuscript. The provincial government of Gotland provided necessary permits for the study.
Conflict of interest
Authors JA, OK, and VJ were employed by Calluna AB.
The remaining authors declare that the research was conducted in the absence of any commercial or financial relationships that could be construed as a potential conflict of interest.
Publisher’s note
All claims expressed in this article are solely those of the authors and do not necessarily represent those of their affiliated organizations, or those of the publisher, the editors and the reviewers. Any product that may be evaluated in this article, or claim that may be made by its manufacturer, is not guaranteed or endorsed by the publisher.
Supplementary material
The Supplementary Material for this article can be found online at: https://www.frontiersin.org/articles/10.3389/fevo.2022.917991/full#supplementary-material
References
Ahnesjö, J., and Forsman, A. (2006). Differential habitat selection by pygmy grasshopper color morphs; interactive effects of temperature and predator avoidance. Evol. Ecol. 20, 235–257.
Anderson, K., and Gaston, K. J. (2013). Lightweight unmanned aerial vehicles will revolutionize spatial ecology. Front. Ecol. Environ. 11:138–146. doi: 10.1890/120150
Brooks, M. E., Kristensen, K., Van Benthem, K. J., Magnusson, A., Berg, C. W., Nielsen, A., et al. (2017). glmmTMB balances speed and flexibility among packages for zero-inflated generalized linear mixed modeling. R J. 9, 378–400.
Carter, A. W., and Sheldon, K. S. (2020). Life stages differ in plasticity to temperature fluctuations and uniquely contribute to adult phenotype in Onthophagus taurus dung beetles. J. Exp. Biol. 223:jeb227884. doi: 10.1242/jeb.227884
Clarke, A. (2017). Principles of thermal ecology: Temperature, energy and life. Oxford: Oxford University Press.
Cloudsley-Thompson, J. (1962). Microclimates and the distribution of terrestrial arthropods. Annu. Rev. Entomol. 7, 199–222.
Curtis, R. J., and Isaac, N. J. B. (2015). The effect of temperature and habitat quality on abundance of the Glanville fritillary on the Isle of Wight: Implications for conservation management in a warming climate. J. Insect Conserv. 19, 217–225. doi: 10.1007/s10841-014-9738-1
Davies, Z. G., Wilson, R. J., Coles, S., and Thomas, C. D. (2006). Changing habitat associations of a thermally constrained species, the silver-spotted skipper butterfly, in response to climate warming. J. Anim. Ecol. 75, 247–256. doi: 10.1111/j.1365-2656.2006.01044.x
Dempster, J. (1983). The natural control of populations of butterflies and moths. Biol. Rev. 58, 461–481.
Dingemanse, N. J., and Dochtermann, N. A. (2013). Quantifying individual variation in behaviour: Mixed-effect modelling approaches. J. Anim. Ecol. 82, 39–54.
Dormann, C. F., Elith, J., Bacher, S., Buchmann, C., Carl, G., Carré, G., et al. (2012). Collinearity: A review of methods to deal with it and a simulation study evaluating their performance. Ecography 36, 27–46. doi: 10.1111/j.1600-0587.2012.07348.x
Easterling, D. R., Meehl, G. A., Parmesan, C., Changnon, S. A., Karl, T. R., and Mearns, L. O. (2000). Climate extremes: Observations, modeling, and impacts. Science 289, 2068–2074.
Ehrlich, P. R., and Hanski, I. (2004). On the wings of checkerspots: A model system for population biology. Oxford: Oxford University Press.
Eliasson, C. U., Ryrholm, N., Holmér, M., Gilg, K., and Gärdenfors, U. (2005). Nationalnyckeln till Sveriges flora och fauna. Fjärilar: Dagfjärilar. Hesperidae - Nymphalidae. Uppsala: ArtDatabanken, SLU.
Faye, E., Rebaudo, F., Yánez-Cajo, D., Cauvy-Fraunié, S., and Dangles, O. (2016). A toolbox for studying thermal heterogeneity across spatial scales: From unmanned aerial vehicle imagery to landscape metrics. Methods Ecol. Evol. 7, 437–446.
Fenberg, P. B., Self, A., Stewart, J. R., Wilson, R. J., and Brooks, S. J. (2016). Exploring the universal ecological responses to climate change in a univoltine butterfly. J. Anim. Ecol. 85, 739–748. doi: 10.1111/1365-2656.12492
Fernandez-Carrillo, A., Patoèka, Z., Dobrovolnı, L., Franco-Nieto, A., and Revilla-Romero, B. (2020). Monitoring bark beetle forest damage in Central Europe. A remote sensing approach validated with field data. Remote Sens. 12:3634.
Fischer, K., and Karl, I. (2010). Exploring plastic and genetic responses to temperature variation using copper butterflies. Clim. Res. 43, 17–30.
Greenwood, O., Mossman, H. L., Suggitt, A. J., Curtis, R. J., and Maclean, I. M. (2016). Using in situ management to conserve biodiversity under climate change. J. Appl. Ecol. 53, 885–894.
Hällfors, M. H., Pöyry, J., Heliölä, J., Kohonen, I., Kuussaari, M., Leinonen, R., et al. (2021). Combining range and phenology shifts offers a winning strategy for boreal Lepidoptera. Ecol. Lett. 24, 1619–1632. doi: 10.1111/ele.13774
Harris, R. M. B., Beaumont, L. J., Vance, T. R., Tozer, C. R., Remenyi, T. A., Perkins-Kirkpatrick, S. E., et al. (2018). Biological responses to the press and pulse of climate trends and extreme events. Nat. Clim. Change 8, 579–587. doi: 10.1038/s41558-018-0187-9
Hatfield, J. L., and Prueger, J. H. (2015). Temperature extremes: Effect on plant growth and development. Weather Clim. Extremes 10, 4–10.
Heinrich, B. (1974). Thermoregulation in endothermic insects. Science 185, 747–756. doi: 10.1126/science.185.4153.747
Hill, G. M., Kawahara, A. Y., Daniels, J. C., Bateman, C. C., and Scheffers, B. R. (2021). Climate change effects on animal ecology: Butterflies and moths as a case study. Biol. Rev. 96, 2113–2126.
Hutton, J., Lipa, G., Baustian, D., Sulik, J., and Bruce, R. (2020). High Accuracy Direct Georeferencing of the Altum Multi-Spectral Uav Camera and its Application to High Throughput Plant Phenotyping. Int. Arch. Photogramm. Remote Sens. Spat. Inf. Sci. 43, 451–456.
Jamieson, M. A., Trowbridge, A. M., Raffa, K. F., and Lindroth, R. L. (2012). Consequences of Climate Warming and Altered Precipitation Patterns for Plant-Insect and Multitrophic Interactions. Plant Physiol. 160, 1719–1727. doi: 10.1104/pp.112.206524
Johansson, V., Kindvall, O., Askling, J., Säwenfalk, D. S., Norman, H., and Franzén, M. (2022). Quick recovery of a threatened butterfly in well-connected patches following an extreme drought. Insect Conserv. Divers. 15, 572–582. doi: 10.1111/icad.12574
Kindvall, O. (1995). The impact of extreme weather on habitat preference and survival in a metapopulation of the bush-cricket Metrioptera bicolor in Sweden. Biol. Conserv. 73, 51–58.
Lailvaux, S. P., Alexander, G. J., and Whiting, M. J. (2003). Sex-based differences and similarities in locomotor performance, thermal preferences, and escape behaviour in the lizard Platysaurus intermedius wilhelmi. Physiol. Biochem. Zool. 76, 511–521. doi: 10.1086/376423
Lehmann, P., Ammunét, T., Barton, M., Battisti, A., Eigenbrode, S. D., Jepsen, J. U., et al. (2020). Complex responses of global insect pests to climate warming. Front. Ecol. Environ. 18:141–150. doi: 10.1002/fee.2160
Ma, C. S., Ma, G., and Pincebourde, S. (2021). Survive a warming climate: Insect responses to extreme high temperatures. Annu. Rev. Entomol. 66, 163–184.
Maclean, I. M., Hopkins, J. J., Bennie, J., Lawson, C. R., and Wilson, R. J. (2015). Microclimates buffer the responses of plant communities to climate change. Glob. Ecol. Biogeogr. 24, 1340–1350.
Maclean, I. M., Suggitt, A. J., Wilson, R. J., Duffy, J. P., and Bennie, J. J. (2017). Fine-scale climate change: Modelling spatial variation in biologically meaningful rates of warming. Glob. Change Biol. 23, 256–268. doi: 10.1111/gcb.13343
Martin, T. E. (2001). Abiotic vs. biotic influences on habitat selection of coexisting species: Climate change impacts? Ecology 82, 175–188.
Mattson, W. J., and Haack, R. A. (1987). The role of drought in outbreaks of plant-eating insects. Bioscience 37, 110–118.
May, R. M., and Arthur, R. H. M. (1972). Niche overlap as a function of environmental variability. Proc. Natl. Acad. Sci. U. S. A. 69, 1109–1113.
Meinzer, F. C., and McCulloh, K. A. (2013). Xylem recovery from drought-induced embolism: Where is the hydraulic point of no return? Tree Physiol. 33, 331–334. doi: 10.1093/treephys/tpt022
Miquel, J., Lundgren, P. R., Bensch, K. G., and Atlan, H. (1976). Effects of temperature on the life span, vitality and fine structure of Drosophila melanogaster. Mech. Ageing Dev. 5, 347–370. doi: 10.1016/0047-6374(76)90034-8
Nieminen, M., Siljander, M., and Hanski, I. (2004). “Structure and dynamics of Melitaea cinxia metapopulations,” in On the wings of checkerspots: A model system for population biology, eds P. R. Ehrlich and I. Hanski (New York, NY: Oxford University Press), 63–91.
Oliver, T., Hill, J. K., Thomas, C. D., Brereton, T., and Roy, D. B. (2009). Changes in habitat specificity of species at their climatic range boundaries. Ecol. Lett. 12, 1091–1102.
Parmesan, C., and Hanley, M. E. (2015). Plants and climate change: Complexities and surprises. Ann. Bot. 116, 849–864. doi: 10.1093/aob/mcv169
Parmesan, C., and Yohe, G. (2003). A globally coherent fingerprint of climate change impacts across natural systems. Nature 421, 37–42. doi: 10.1038/nature01286
Parmesan, C., Burrows, M. T., Duarte, C. M., Poloczanska, E. S., Richardson, A. J., Schoeman, D. S., et al. (2013). Beyond climate change attribution in conservation and ecological research. Ecol. Lett. 16, 58–71. doi: 10.1111/ele.12098
Peters, W., Bastos, A., Ciais, P., and Vermeulen, A. (2020). A historical, geographical and ecological perspective on the 2018 European summer drought. Philos. Trans. R. Soc. Lond. Series B Biol. Sci. 375:20190505. doi: 10.1098/rstb.2019.0505
Pincebourde, S., and Woods, H. A. (2020). There is plenty of room at the bottom: Microclimates drive insect vulnerability to climate change. Curr. Opin. Insect Sci. 41, 63–70. doi: 10.1016/j.cois.2020.07.001
Porter, K. (1982). Basking behaviour in larvae of the butterfly Euphydryas aurinia. Oikos 38, 308–312.
Porter, K. (1983). Multivoltinism in Apanteles bignellii and the influence of weather on synchronisation with its host Euphydryas aurinia. Entomol. Exp. Appl. 34, 155–162.
R Core Team (2021). R: A Language and Environment for Statistical computing. Vienna: R Foundation for Statistical Computing.
Radchuk, V., Turlure, C., and Schtickzelle, N. (2013). Each life stage matters: The importance of assessing the response to climate change over the complete life cycle in butterflies. J. Anim. Ecol. 82, 275–285. doi: 10.1111/j.1365-2656.2012.02029.x
Ratte, H. T. (1984). “Temperature and insect development,” in Environmental Physiology and Biochemistry of Insects, ed. K. H. Hoffmann (Berlin: Springer), 33–66.
Rausher, M. D. (1981). Host plant selection by Battus philenor butterflies: The roles of predation, nutrition, and plant chemistry. Ecol. Monogr. 51, 1–20.
Renwick, J. A. A., and Chew, F. S. (1994). Oviposition Behavior in Lepidoptera. Annu. Rev. Entomol. 39, 377–400. doi: 10.1146/annurev.en.39.010194.002113
Salgado, A. L., and Saastamoinen, M. (2019). Developmental stage-dependent response and preference for host plant quality in an insect herbivore. Anim. Behav. 150, 27–38. doi: 10.1016/j.anbehav.2019.01.018
Salgado, A. L., DiLeo, M. F., and Saastamoinen, M. (2020). Narrow oviposition preference of an insect herbivore risks survival under conditions of severe drought. Funct. Ecol. 34, 1358–1369. doi: 10.1111/1365-2435.13587
Sarron, J., Malézieux, É., Sané, C. A. B., and Faye, É. (2018). Mango yield mapping at the orchard scale based on tree structure and land cover assessed by UAV. Remote Sens. 10:1900.
Scheffers, B. R., Edwards, D. P., Diesmos, A., Williams, S. E., and Evans, T. A. (2014). Microhabitats reduce animal’s exposure to climate extremes. Glob. Change Biol. 20, 495–503.
Scherrer, D., and Körner, C. (2011). Topographically controlled thermal-habitat differentiation buffers alpine plant diversity against climate warming. J. Biogeogr. 38, 406–416.
Shreeve, T. G., Dennis, R. L. H., and van Dyck, H. (2004). Resources, habitats and metapopulations - whither reality? Oikos 106, 404–408.
Sokal, R. R., and Rohlf, F. J. (1995). Biometry: The Principles and Practice of Statistics in Biological Research. New York, NY: Freeman.
Soroye, P., Newbold, T., and Kerr, J. (2020). Climate change contributes to widespread declines among bumble bees across continents. Science 367, 685–688. doi: 10.1126/science.aax8591
Suggitt, A. J., Wilson, R. J., August, T. A., Fox, R., Isaac, N. J., Macgregor, N. A., et al. (2015). Microclimate affects landscape level persistence in the British Lepidoptera. J. Insect Conserv. 19, 237–253.
Suggitt, A. J., Wilson, R. J., Isaac, N. J., Beale, C. M., Auffret, A. G., August, T., et al. (2018). Extinction risk from climate change is reduced by microclimatic buffering. Nat. Clim. Change 8, 713–717. doi: 10.1111/gcb.14712
Thompson, J. N., and Pellmyr, O. (1991). Evolution of oviposition behavior and host preference in Lepidoptera. Annu. Rev. Entomol. 36, 65–89.
Tougeron, K., Van Baaren, J., Burel, F., and Alford, L. (2016). Comparing thermal tolerance across contrasting landscapes: First steps towards understanding how landscape management could modify ectotherm thermal tolerance. Insect Conserv. Divers. 9, 171–180.
Tsai, C. C., Childers, R. A., Nan Shi, N., Ren, C., Pelaez, J. N., Bernard, G. D., et al. (2020). Physical and behavioral adaptations to prevent overheating of the living wings of butterflies. Nat. Commun. 11:551. doi: 10.1038/s41467-020-14408-8
Tyler, T., Herbertsson, L., Olofsson, J., and Olsson, P. A. (2021). Ecological indicator and traits values for Swedish vascular plants. Ecol. Indicat. 120:106923. doi: 10.1016/j.ecolind.2020.106923
Walther, G. R., Post, E., Convey, P., Menzel, A., Parmesan, C., Beebee, T. J. C., et al. (2002). Ecological responses to recent climate change. Nature 416, 389–395.
Warren, M. S., Hill, J. K., Thomas, J. A., Asher, J., Fox, R., Huntley, B., et al. (2001). Rapid responses of British butterflies to opposing forces of climate and habitat change. Nature 414, 65–69. doi: 10.1038/35102054
Warren, M. S., Maes, D., van Swaay, C. A. M., Goffart, P., Van Dyck, H., Bourn, N. A. D., et al. (2021). The decline of butterflies in Europe: Problems, significance, and possible solutions. Proc. Natl. Acad. Sci. U. S. A. 118:e2002551117. doi: 10.1073/pnas.2002551117
Weiner, J. (1985). Size Hierarchies in Experimental Populations of Annual Plants. Ecology 66, 743–752. doi: 10.2307/1940535
Weiss, S. B., Murphy, D. D., and White, R. R. (1988). Sun, slope, and butterflies: Topographic determinants of habitat quality for Euphydryas editha. Ecology 69, 1486–1496.
Williams, E. H. (1981). Thermal influences on oviposition in the montane butterfly Euphydryas gillettii. Oecologia 50, 342–346. doi: 10.1007/BF00344974
Willmer, P. (1982). Microclimate and the environmental physiology of insects. Adv. Insect Physiol. 16, 1–57.
Woods, H. A., Dillon, M. E., and Pincebourde, S. (2015). The roles of microclimatic diversity and of behavior in mediating the responses of ectotherms to climate change. J. Thermal Biol. 54, 86–97. doi: 10.1016/j.jtherbio.2014.10.002
Zellweger, F., De Frenne, P., Lenoir, J., Rocchini, D., and Coomes, D. (2019). Advances in microclimate ecology arising from remote sensing. Trends Ecol. Evol. 34, 327–341.
Keywords: drought, plant–animal interactions, populations, climate change, longwave infrared (LWIR) sensor
Citation: Franzén M, Francioli Y, Askling J, Kindvall O, Johansson V and Forsman A (2022) Yearly weather variation and surface temperature drives the spatiotemporal dynamics of a threatened butterfly and its host plant. Front. Ecol. Evol. 10:917991. doi: 10.3389/fevo.2022.917991
Received: 11 April 2022; Accepted: 20 September 2022;
Published: 13 October 2022.
Edited by:
Juergen Pilz, University of Klagenfurt, AustriaReviewed by:
Jofre Carnicer, University of Barcelona, SpainJonathan Bennie, University of Exeter, United Kingdom
Copyright © 2022 Franzén, Francioli, Askling, Kindvall, Johansson and Forsman. This is an open-access article distributed under the terms of the Creative Commons Attribution License (CC BY). The use, distribution or reproduction in other forums is permitted, provided the original author(s) and the copyright owner(s) are credited and that the original publication in this journal is cited, in accordance with accepted academic practice. No use, distribution or reproduction is permitted which does not comply with these terms.
*Correspondence: Markus Franzén, bWFya3VzLmZyYW56ZW5AbG51LnNl