- 1Key Laboratory of Water and Sediment Science of Ministry of Education, School of Environment, Beijing Normal University, Beijing, China
- 2School of Resources and Environmental Engineering, Ludong University, Yantai, China
- 3Yellow River Engineering Consulting Co., Ltd., Zhengzhou, China
The Yellow River Basin is of great significance to China’s economic and social development and ecological security. The Yellow River Basin is not only an important ecological barrier but also an important economic zone. In this article, natural hydrological conditions were taken as a reference, a habitat simulation model of the key sections of the Yellow River was constructed based on the MIKE 21 model, and an ecological water requirement assessment method for river ecological integrity combined with habitat simulation and features of the hydrological reference group was established, which took account of the survival and reproduction of indicator species. The suitable flow rates for the spawning period (i.e., April to June) of Silurus lanzhouensis in Lanzhou (LZ) and Cyprinus carpio in Longmen (LM) were 350–720 and 260–400 m3/s, respectively. Therefore, high pulse flow with a low flow peak should be guaranteed in mid- to late April. The peak flow should be at least approximately 1,000 m3/s to ensure that fish receive spawning signals, with a high pulse flow process occurring 1–2 times in May to June. The annual ecological water requirement of the Lanzhou and Longmen section was 9.1 × 10⁹–11 × 109 and 4.7 × 10⁹–11.3 × 10⁹ m3. The model quantitatively simulated the changes in ecological water requirement of indicator fishes in key sections of the Yellow River, and an effective and realistic tool for ecological water requirement accounting of the Yellow River was provided.
Key Points
- A new assessment method of ecological water requirement process was proposed to maintain the ecological integrity of the Yellow River.
- The ecological water requirement process and pulse flow process were determined based on the ecological flow elements.
- The changes of ecological water requirement of the Yellow River in different periods have been simulated quantitatively and effectively.
Introduction
With the continuous improvement in human understanding of river ecosystems, ecological problems caused by human activities, such as the construction of water conservancy structures, have become increasingly serious. Thus, the concept of “river health” has begun to emerge and has been accepted throughout the world in order to solve the problems of river pollution and the deterioration of water ecosystems, which have attracted wide attention from various countries (Richter, 1997; Norris and Thoms, 1999; Norris and Hawkins, 2000; Wu and Chen, 2018; Virkki et al., 2021). The ecological water requirement of a river is one of the important indicators of its health status (Thame, 2003; Rolls and Bond, 2017). With the emergence of flood disasters, river outages, and water pollution, research on ecological water requirement has generally been carried out for river ecosystems, mainly focusing on minimum and optimal flow according to the physical requirements of the river (e.g., the characteristics of fish) (Bartschi, 1976; Tennant, 1976; Bovee, 1996; Bunn and Arthington, 2002). In recent years, relevant studies have begun to consider the vertical connection of river flows, the integrity of river ecosystems has been paid attention to, the adaptability of river ecosystems has been analyzed from the perspective of flow changes, the limitations of river ecosystem types in related research have been overcome, and comprehensive analysis of different ecosystem types has gradually expanded (Hughes, 1999, 2001; Yang et al., 2020; Liu et al., 2022). A large number of studies on ecological water requirement have been carried out based on the preferences of species for certain habitats, and a habitat simulation method considering the direct relationships between runoff and organisms was established to evaluate ecological water requirement. The physical mechanism was clear, and it can provide the ecological water requirement process with dry and wet changes rather than a fixed minimum ecological water requirement (Nikghalb et al., 2016; Poff, 2018), which has been widely used in ecological water requirement assessments (Hao and Shang, 2008; Cai et al., 2010; Sun et al., 2013; Theodoropoulos et al., 2018; Wang et al., 2018; Shang et al., 2020). However, habitat simulation has mainly focused on the flow conditions in order to shape the biological habitat, and the life rhythm signals that trigger key life activities have been ignored, such as high flow pulses. Despite decades of research, the process of maintaining the ecological water requirement of the indigenous aquatic communities of rivers has not been effectively solved (Edwards and Twomey, 1982; Baumgartner et al., 2014; Brown and Williams, 2016; Arthington et al., 2018).
The Yellow River Basin is very important for China’s economic and social development and ecological security. The basin is not only an important ecological barrier but also an important economic zone in China. However, water supply to ecological environment along the Yellow River has been occupied by industrial or agricultural activities through the process of urbanization in recent years, and the amount of water in the main channel of the Yellow River cannot maintain the health of the channel. Earlier studies on the ecological water requirement of the Yellow River were focused on discussing the ecological water requirement “quantity,” which did not involve analysis of the specific flow process, duration, and frequency and other river hydrological conditions, and the connection and response relationship between the river ecological water requirement process and runoff elements have not been established (Zhang et al., 2008; Zhao et al., 2011; Wang et al., 2020). Research on the ecological requirements of the middle and upper reaches of the main stream of the Yellow River has mainly focused on ecosystem protection, and research on the downstream area has mainly focused on sediment water transport (Huang et al., 2004; Hao et al., 2006; Ma et al., 2007; Liu, 2009; Wang et al., 2009). Furthermore, subsequent research was based on the actual status of the ecological environment and ecological protection goals of the Yellow River, improving the accuracy of ecological water requirement models. However, the relationship between the ecological hydrological process of the river and the response of the ecosystem has not been fully clarified (Lian et al., 2011; Zhao et al., 2011; Ma et al., 2014; Huang et al., 2016).
This research aims to maintain the integrity of the indigenous communities in the Yellow River. Habitat simulation was performed, and the natural hydrological conditions were taken as a reference. The characteristic values of the natural hydrology were extracted to supplement and modify the habitat simulation results. Specifically, the MIKE 21 model was used to construct a habitat simulation model, and the changes in the water level and flow rate of the important section of the main stream of the Yellow River were analyzed and simulated. The features of the hydrological reference group were extracted according to the natural runoff conditions, and an ecological water requirement assessment method for river ecological integrity was established by supplementing and modifying the habitat simulation results with the features of the hydrological reference group. The new method proposed in this article was helpful for quantitatively simulating the changes in the ecological water requirement of indicator fish in key sections of the Yellow River, and an effective tool was provided for the actual calculation of ecological water requirement.
Study Area
The Yellow River is the second longest river in China, with a length of 5,464 km and a drainage area of 752,000 km2. It originates from the Qinghai-Tibet Plateau (northwest) and flows to the Bohai Sea (east) (Figure 1). The average annual precipitation in the entire Yellow River Basin is approximately 466 mm, showing a decreasing trend from southeast to northwest. The source of the Yellow River to Hekou town in Inner Mongolia is the upper reaches of the Yellow River, with a channel length of approximately 3,472 km and a watershed area of approximately 428,000 km2. The length from Hekou town to Taohuayu in Zhengzhou encompasses the middle reaches of the Yellow River, with a channel length of approximately 1,206 km and a drainage area of approximately 344,000 km2. The middle reaches are the main sources of floods and sediments in the Yellow River. Below Taohuayu in Zhengzhou is the lower Yellow River, with a channel length of approximately 786 km and a watershed area of approximately 23,000 km2.
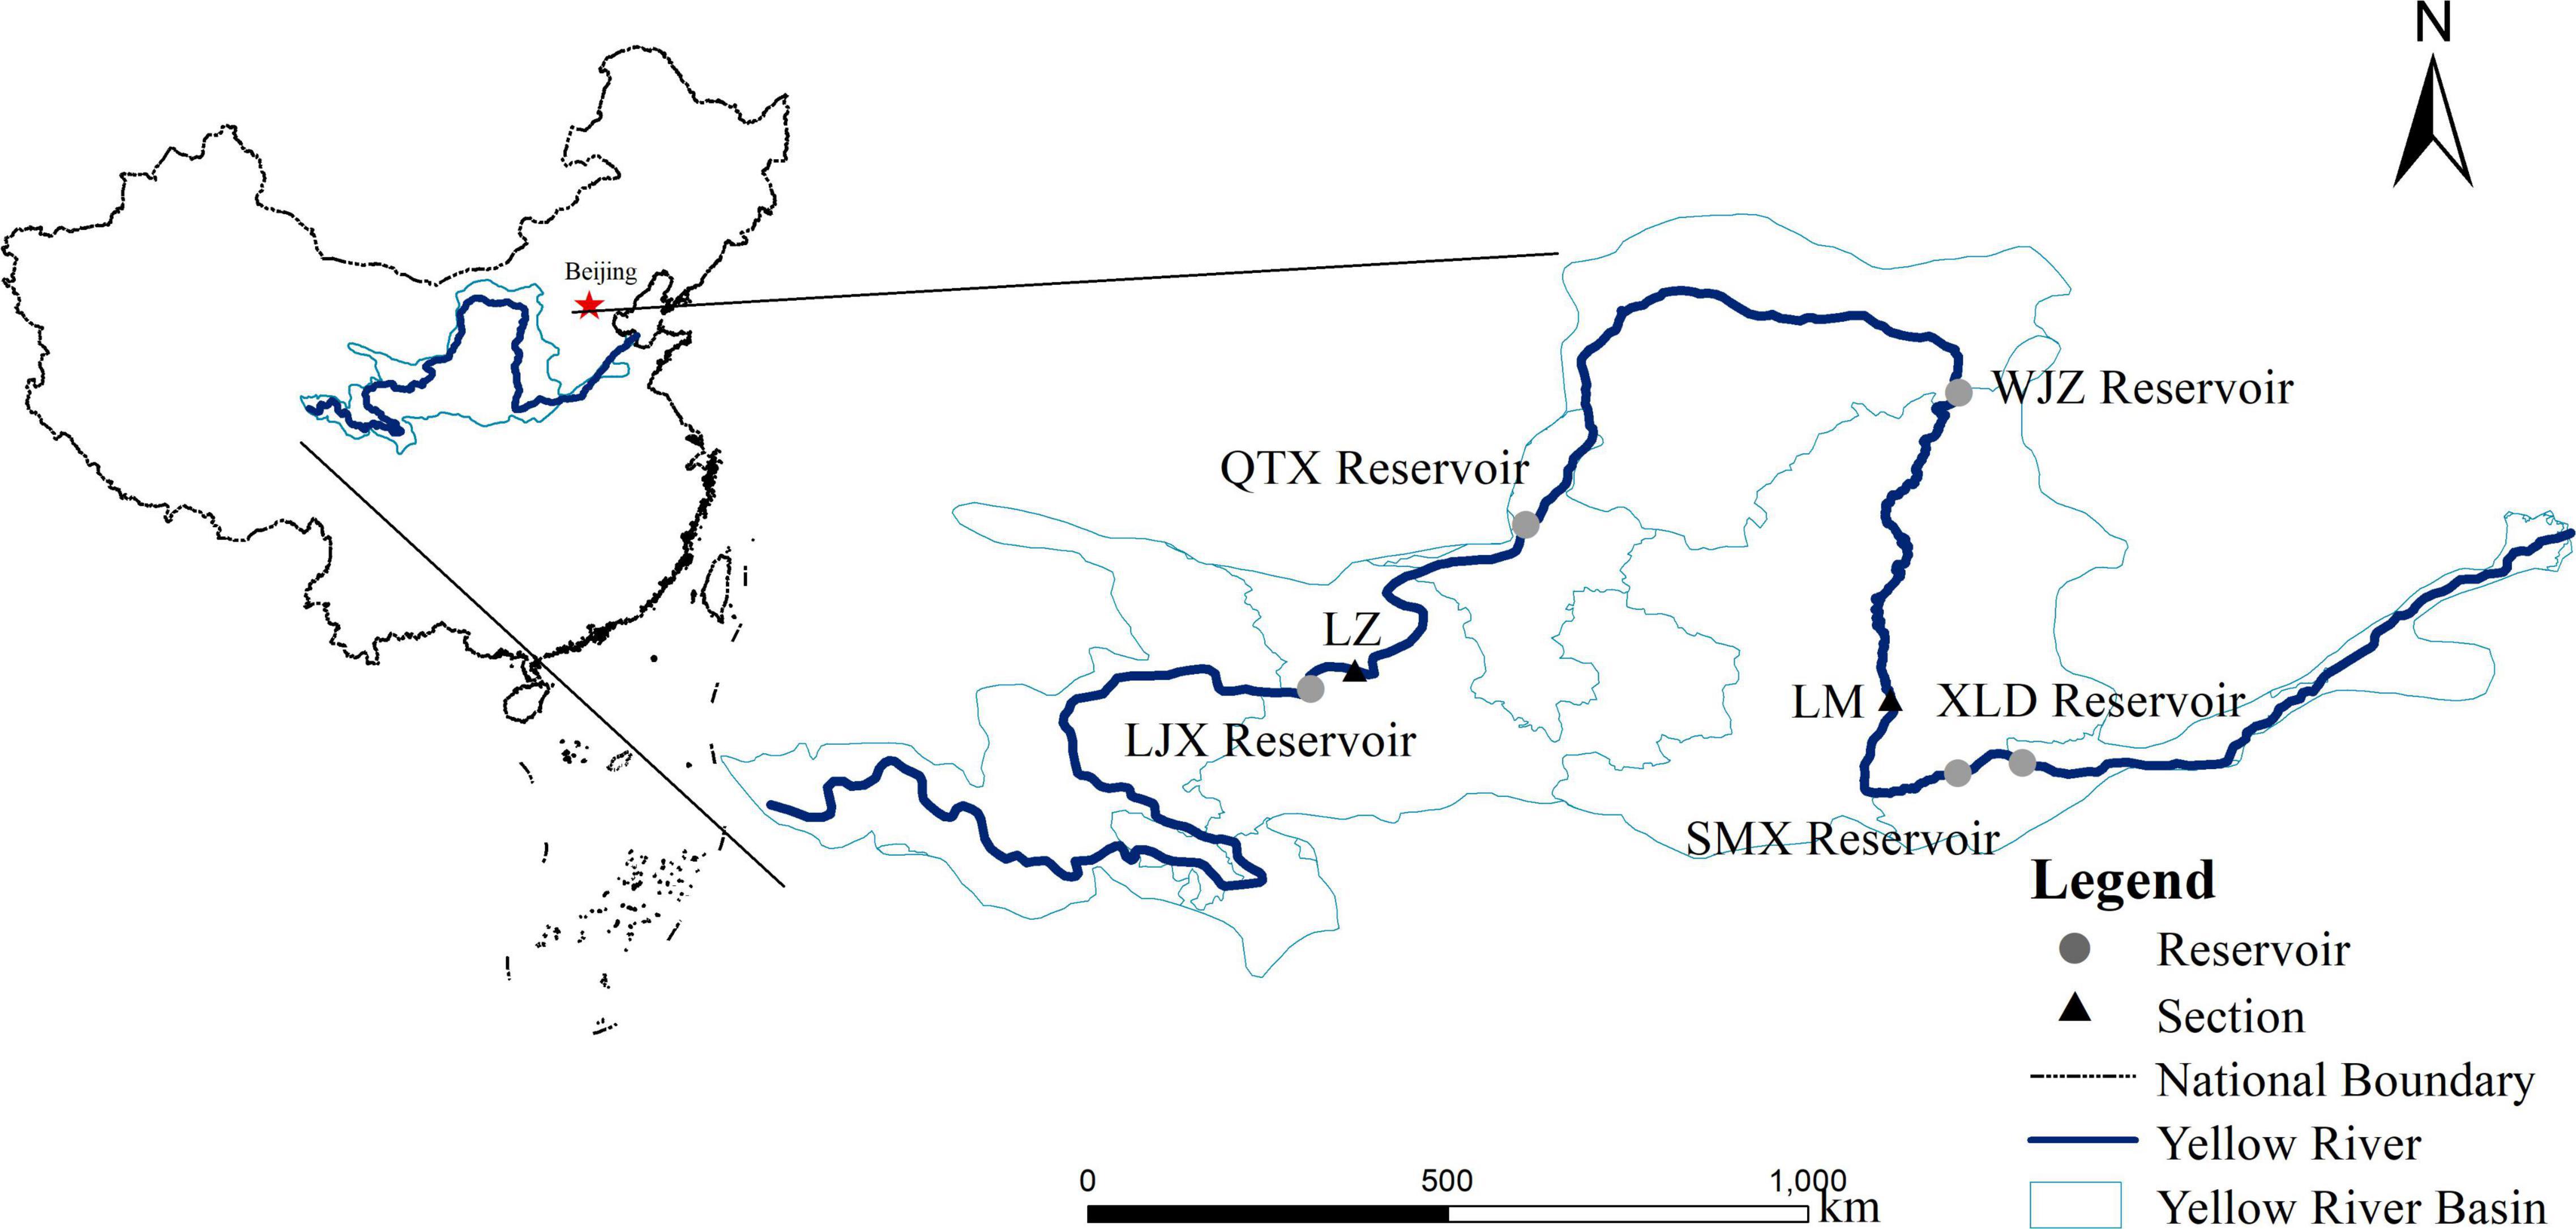
Figure 1. The main stations of the Yellow River Basin (YRB). LZ, Lanzhou; LM, Longmen; H LJX reservoir, Liujiaxia reservoir; QTX reservoir, Qingtongxia reservoir; WJZ reservoir, Wanjiazhai reservoir; SMX reservoir, Sanmenxia reservoir; XLD reservoir, Xiaolangdi reservoir.
In the past 30 years, the features of fish species in the Yellow River have changed significantly due to the dramatic impact of human activities (Feng, 2010). There are few species in the upper reaches of the Yellow River, and the community is relatively simple (Ru et al., 2010; Wang et al., 2020). The species in the middle and lower reaches are more abundant than the ones in the upper reaches. The number of species gradually increases from the upper reaches to the lower reaches (Wu et al., 2006; Huang et al., 2016; Wang et al., 2017).
Materials and Methods
The ecological water requirement in the upper reaches of the Yellow River were analyzed by selecting the LZ section in the upper reaches, the LM section in the middle reaches. Moreover, Silurus lanzhouensis (the Lanzhou Amur catfish) was selected as the indicator species of the LZ and XHY sections, while Cyprinus carpio (the Yellow River carp) was selected as the indicator species of the TDG, LM, and HYK sections.
The approach for ecological water requirement accounting of the key sections of main stream of the Yellow River is shown in Figure 2. The MIKE 21 model, regarded as one of professional engineering software for simulating the current, wave, sediment and environment of rivers (Dhi, 2011) was used to construct a habitat simulation (Dai et al., 2010; Xu, 2010; Doummar et al., 2012; Zhang et al., 2016). The changes in the water level and flow rate in the important sections of the main stream of the Yellow River were analyzed and simulated based on the MIKE 21 model. The features of the hydrological reference group were extracted according to the natural runoff conditions. An ecological water requirement assessment method for river ecological integrity was established by supplementing and modifying the habitat simulation results with the features of the hydrological reference group.
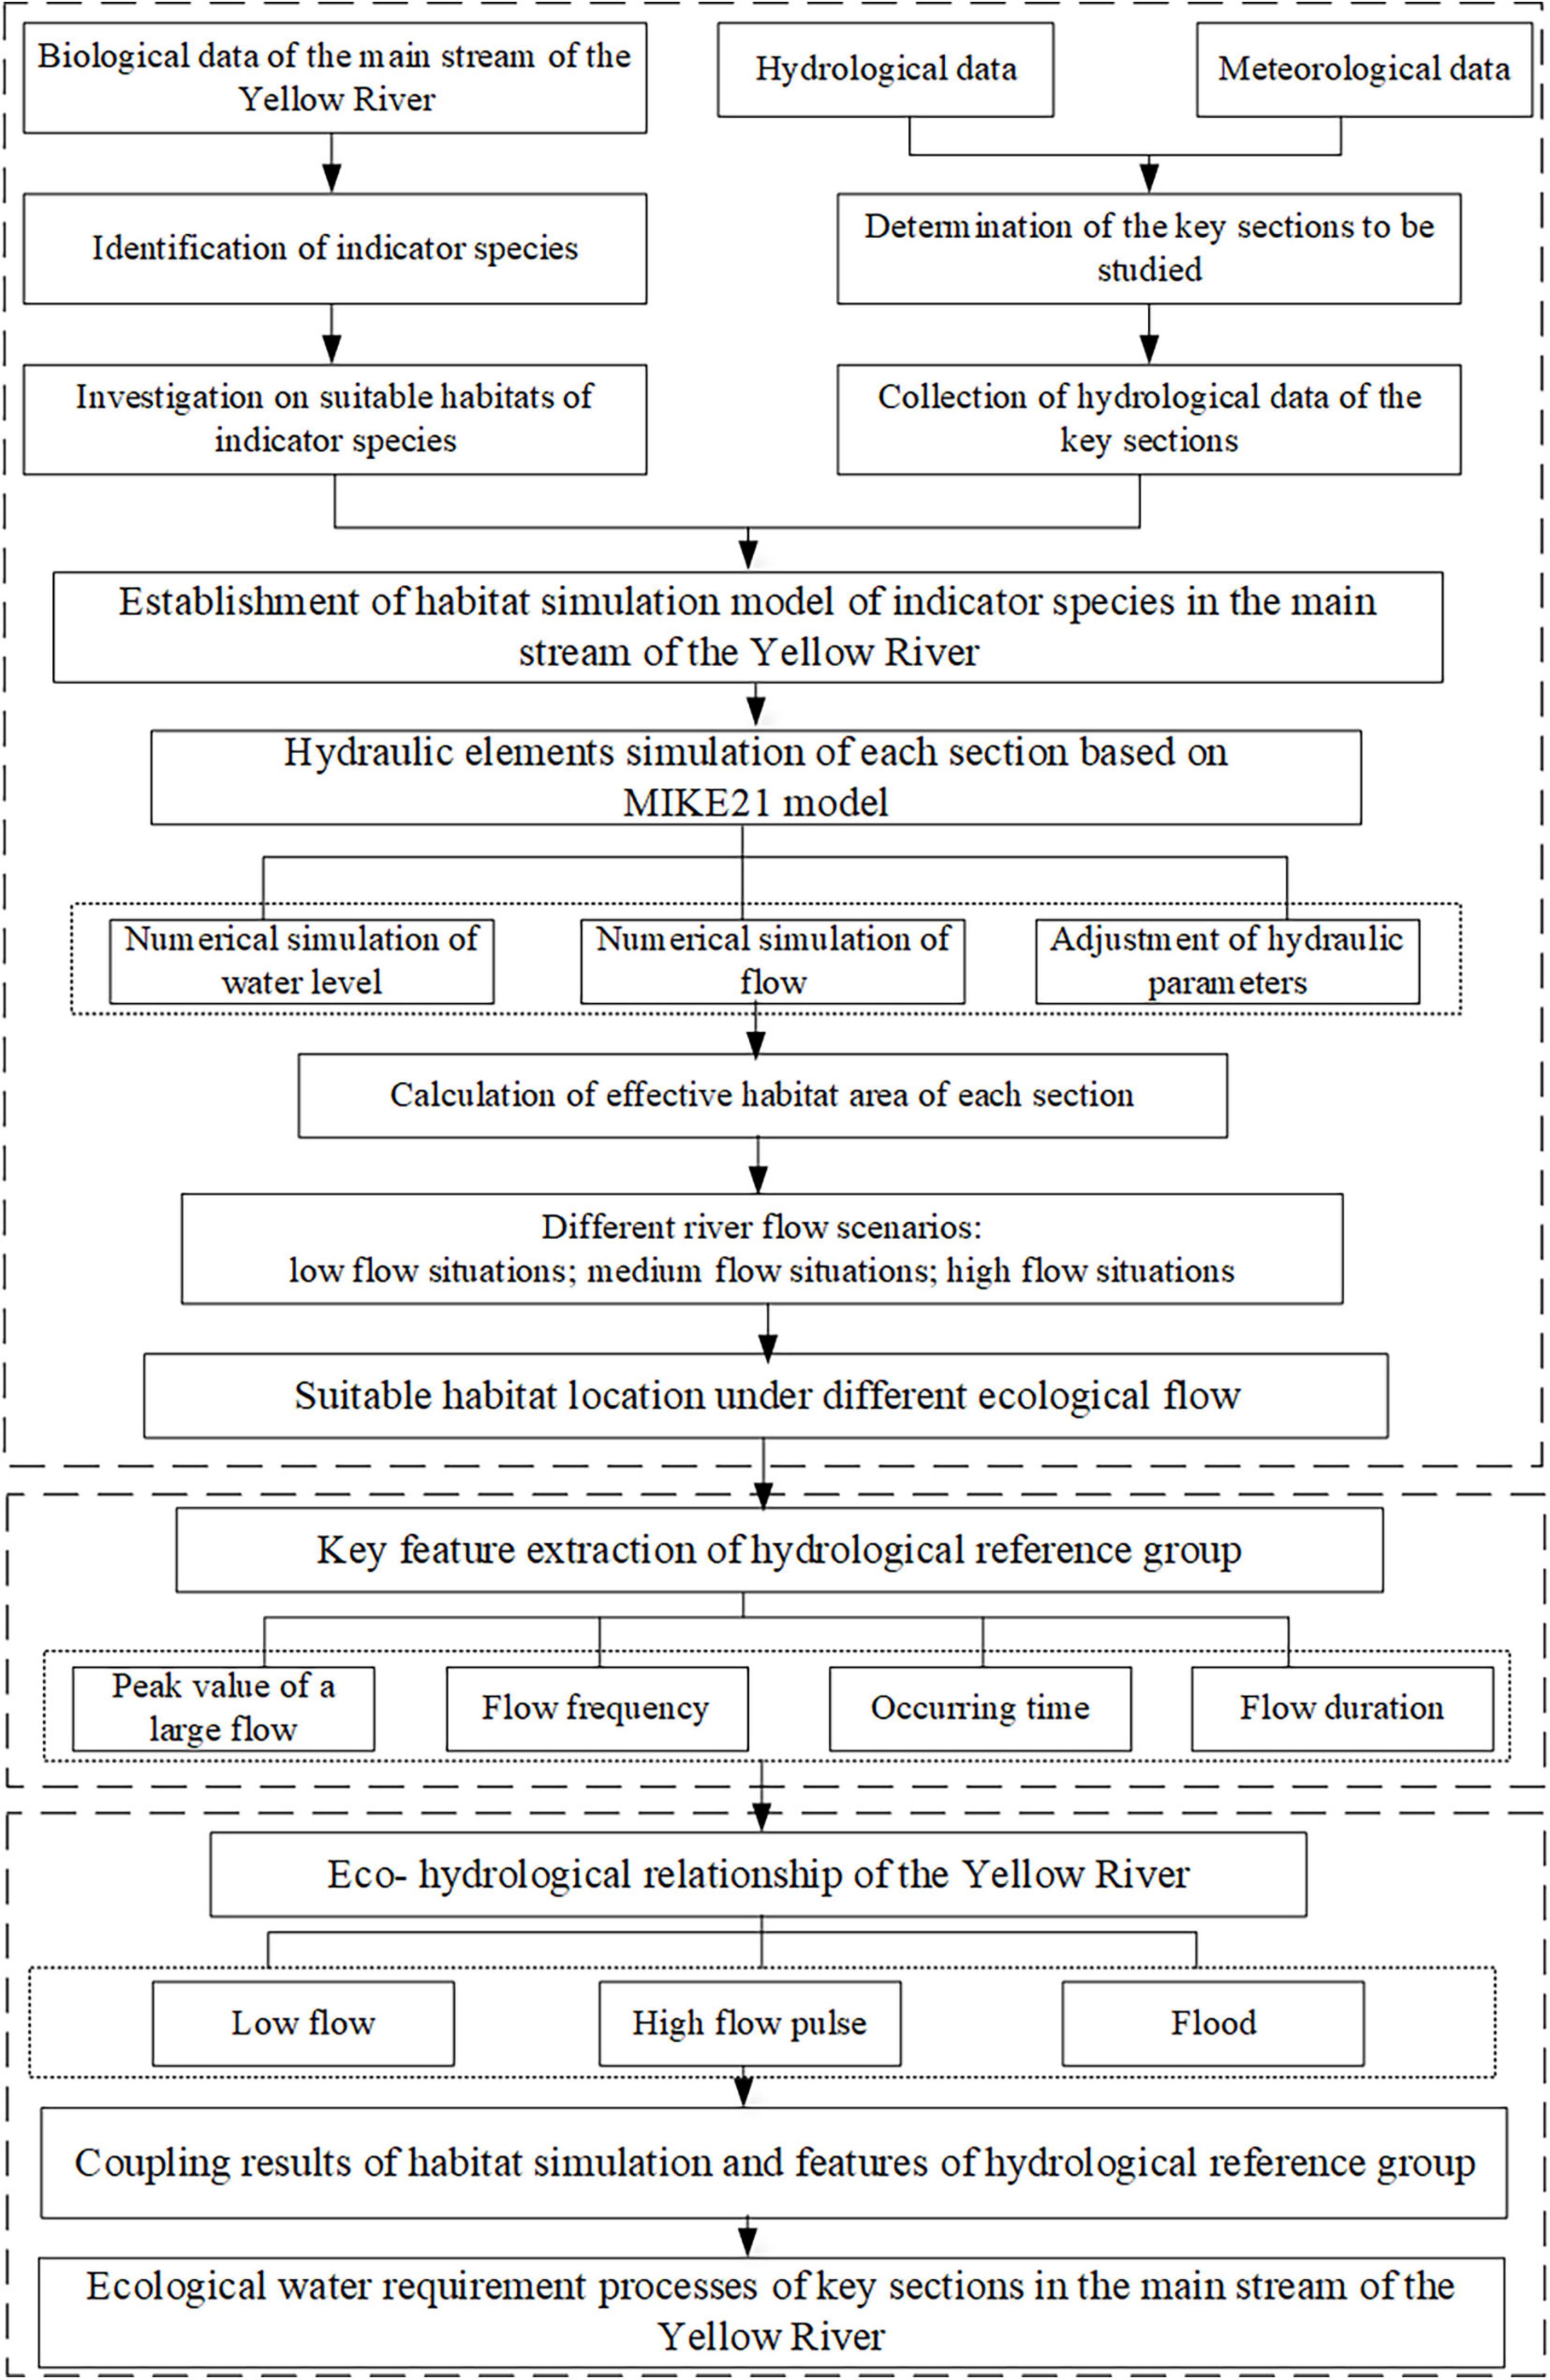
Figure 2. The framework for ecological water requirement accounting from the perspective of habitat conservation.
Process for Determining Ecological Water Requirement
The process for ecological water requirement included the ecological base flow, the ecological flow during the fish spawning period, and the flood pulse maintaining the stability of the river channel during the flood season (Poff et al., 1997; Nikghalb et al., 2016; Wang, 2017; Poff, 2018; Wang et al., 2018). River ecological base flow aims to maintain the vertical connectivity of the river, provide nutrients to the wetland, maintain an appropriate water surface width of the river fish habitat, and ensure the smallest living water area available for fish. A certain flow rate is required during the fishes spawning period in order to provide guidance, and the flow pulse surge is required to ensure that fish are stimulated by the flow required for spawning at an appropriate time. The flood process in the flood season mainly scoured the riverbed sediment, stabilized the river channel structure, and provided a migration channel for fish.
Assessment of the Ecological Water Requirement Process of Indicator Species
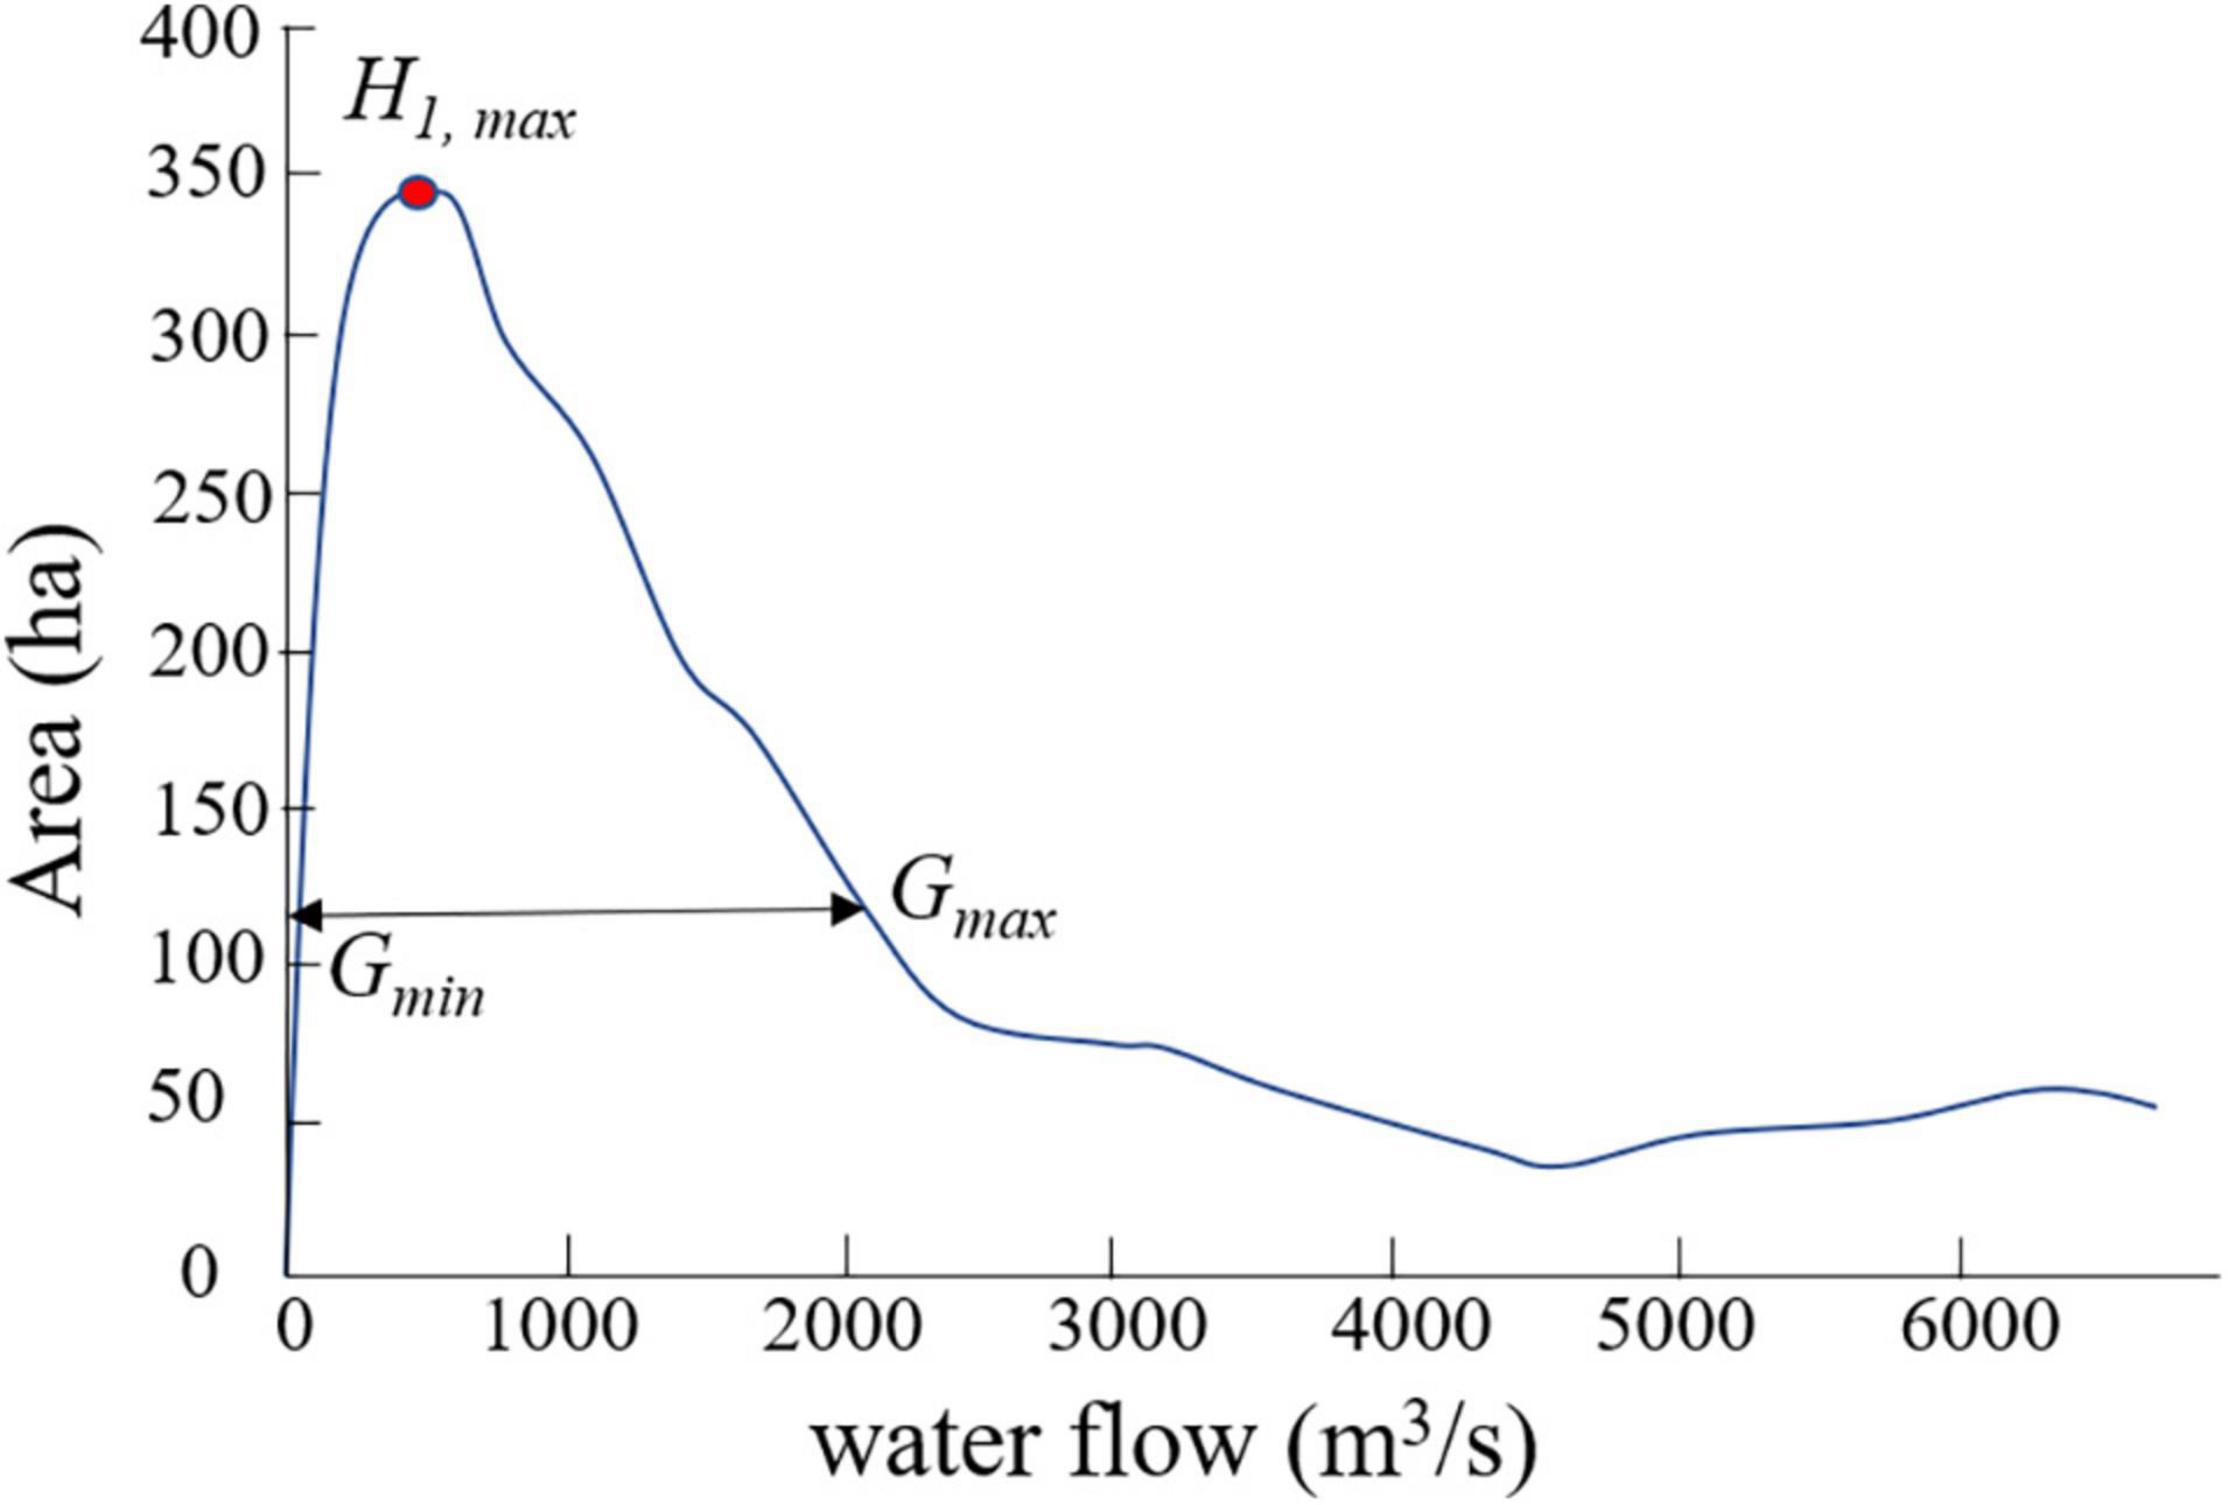
Combined with the basic hydrological and meteorological data of the river and the life habits in different life cycles (Morrison et al., 1992; Jiang et al., 2005; Liu et al., 2008; Dudgeon, 2010; Jiang and Wang, 2012; Shang et al., 2020), the MIKE 21 model was used to simulate the changes in the river hydrological process, the changes in the habitat of the indicator species under different flows were analyzed, and the ecological water requirement process of the indicator species were evaluated through habitat simulation. The peak value of the habitat area during the growth period of the indicator species was H1,max. In this article, we specified that when the area of the habitat (i.e., Hmax) was 1/3, the minimum flow range suitable for the survival and development of the indicator species was GminGmax (Figure 3; Wang et al., 2020). Meanwhile, the peak value of the habitat area of the indicator species in the overwintering period was H2,max, the minimum flow range suitable for winter was WminWmax, the peak value of habitat area in the spawning period was H3,max, and the minimum flow range was SminSmax.
Extraction of Key Features of the Hydrological Reference Group
When the reservoir had not been built upstream of the hydrological station, the measured hydrological conditions were used as a proxy for the natural hydrological conditions, and the measured daily runoff series during this period was used as the hydrological reference group (Ma et al., 2014). The characteristic values of the hydrological reference group mainly focused on the minimum flow and the high flow pulse.
The minimum value of natural flow Nmin was considered to be the lower limit of flow that all indigenous aquatic organisms could tolerate. The minimum flows in the growth, overwintering and spawning periods were NG, min, NW, min, and NS, min, respectively. Statistics of the characteristics of high-flow pulses under natural conditions were used to evaluate the high-flow pulses among the ecological water requirement. To calculate the variation range of the high flow pulse duration, peak flow, rise rate, and fall rate under natural conditions, the interval from the 1/3 quantile to the 2/3 quantile was taken as the suitable range of the ecological water requirement of high flow pulse duration (Pd), peak flow rate (Pmax), rising rate (Prate,r), and falling rate (Prate,f). The average flow rate of high-flow pulses under natural conditions was taken as the appropriate value of the average flow of the ecological water requirement of high-flow pulses (Pmean).
Determination of Ecological Water Requirement by Coupling Results of the Habitat Simulation and Features of the Hydrological Reference Group
Ecological base flow was provided throughout the year, and the overlapping range of the flow range suitable for the indicator species and the natural flow range was taken as the base flow variation range Eb,minEb,max, as shown in equations 1, 2.
A high flow pulse process based on the hydrological reference group was focused on. The overlapping range of the flow range suitable for spawning of the indicator species and the range of low flow changes in the flooding period under natural conditions were used to estimated the reproduction flow Es,minEs,max, as shown in equations 3, 4.
To maintain the safety of life and properties in the floodplain area, only non-floods are considered in this study. Based on the flow-habitation area curve, a high-flow range suitable for indicating the habitat of adult and larval species was selected.
Establishment of a Habitat Simulation Model
Determination of Model Parameters
Solution Format
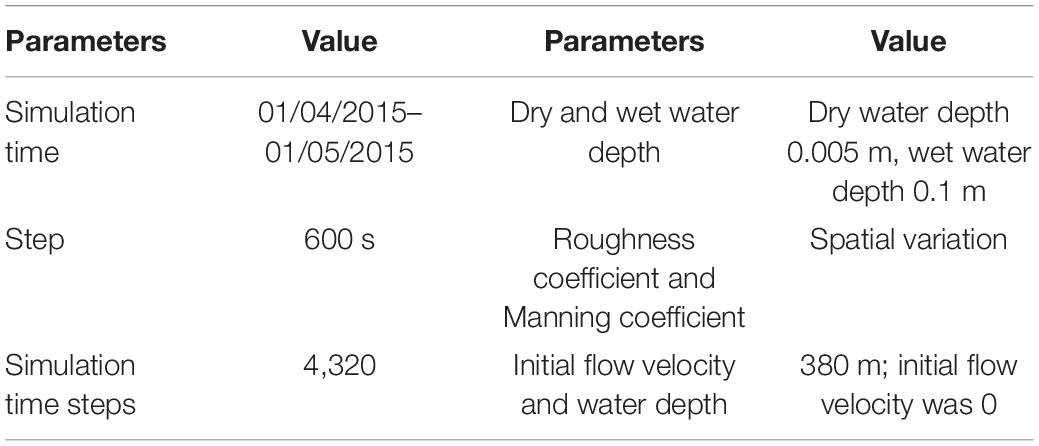
This study aimed to simulate water flow changes. The low-order spatially discrete format could meet the accuracy required for the simulation results and saved program run time. Therefore, the low-order numerical calculation method was selected. The minimum and maximum number of time step sets in this model were 0.005 and 6000, respectively.
Wet and Dry Water Depths
In terms of dry and wet areas, it was necessary to set the dry water depth, wet water depth, and submerged depth to avoid or reduce the instability of the model. In this article, the recommended values of dry water depth hdry, submerged water depth hflood, and wet water depth hwet are 0.005, 0.05, and 0.1 m, respectively.
Vortex Viscosity Coefficient
In the model, the concept of “vortex viscosity” was used to describe the integral of the fluid particles. In this article, the form of the eddy viscosity coefficient was set as a constant in the simulation area, and the default value of the program was 0.28.
Roughness of the Bed Bottom
Roughness was one of the main parameters of the hydrodynamic model. Whether its value was appropriate or not directly affected the accuracy of the model and played a vital role in the hydrodynamic model. Therefore, in this study, the change in water depth was an important process, and the Manning coefficient should be selected as the bed bottom roughness. The land use map was used to refer to the roughness table to extract the most suitable Manning coefficient map.
Establishment of a MIKE 21 Hydrodynamic Model of the Yellow River
The main steps for constructing the MIKE 21 hydrodynamic model include splitting the terrain grid, creating boundary conditions, calibrating sensitive parameters, and verifying model results. The terrain grid file (*. mesh), time series file (*. dfs0), result file (*. dfsu), and control file (*. m21) were all indispensable files for building the model.
The quality of terrain meshing directly affects the accuracy of the simulation results. MIKE Zero’s Mesh Generator was applied for meshing terrain. The grid generator generates an ASCII file that includes the geographic coordinates of each grid point, elevation data, and the topological relationship between the grid cells. The grid division needs to first determine the simulation area of the model and the resolution of the terrain grid, and then, the land boundary and the open boundary were defined. After the grid division, the existing elevation data were used for terrain interpolation.
Calibration and Verification of the Model
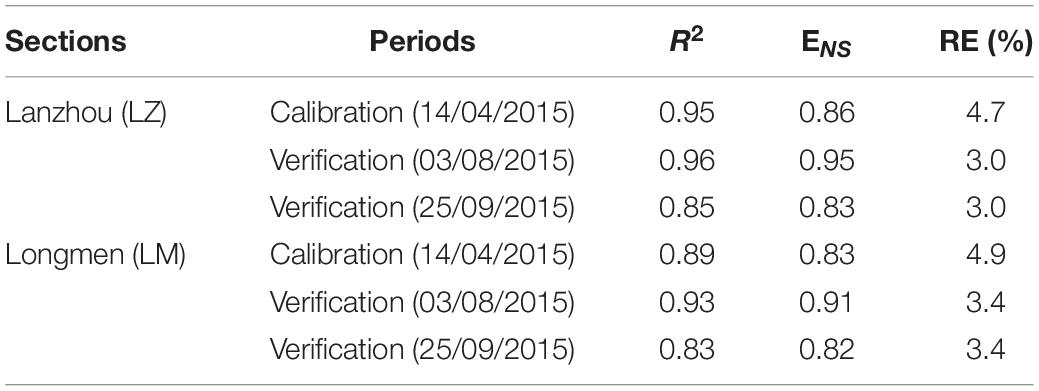
The model is calibrated using the flow velocity measured in 2015 to determine the simulated flow velocity and water depth. The simulation time step was 600 s, the roughness coefficient and Manning coefficient of the water area adopt the default value of the model, and the roughness coefficient and Manning coefficient of the reed area assigned according to the relevant research results. The calibration period and the verification periods were shown in Table 1, the calibration period was from 01/04/2015 to 01/05/2015, and the verification was divided into the following two periods: the fish spawning period (15/07/2015 to 14/08/2015) and flood period (01/09/2015 to 01/10/2015). The calibration parameters were shown in Table 2. In this study, the fitting coefficient R2, Nash Sutcliffe (ENS) and the relative error (RE) between the measured value and the simulated value have been used to evaluate the simulation accuracy of the model. The value of ENS was between – ∞ and 1. When it closer to 1, the reliability of the model was higher; when it was much less than 0, the model result was not credible. The magnitude of R2 determined the close correlation between measured and simulated values. When R2 was closer to 1, it means that the simulated value was closer to the measured value, and the error between them was small.
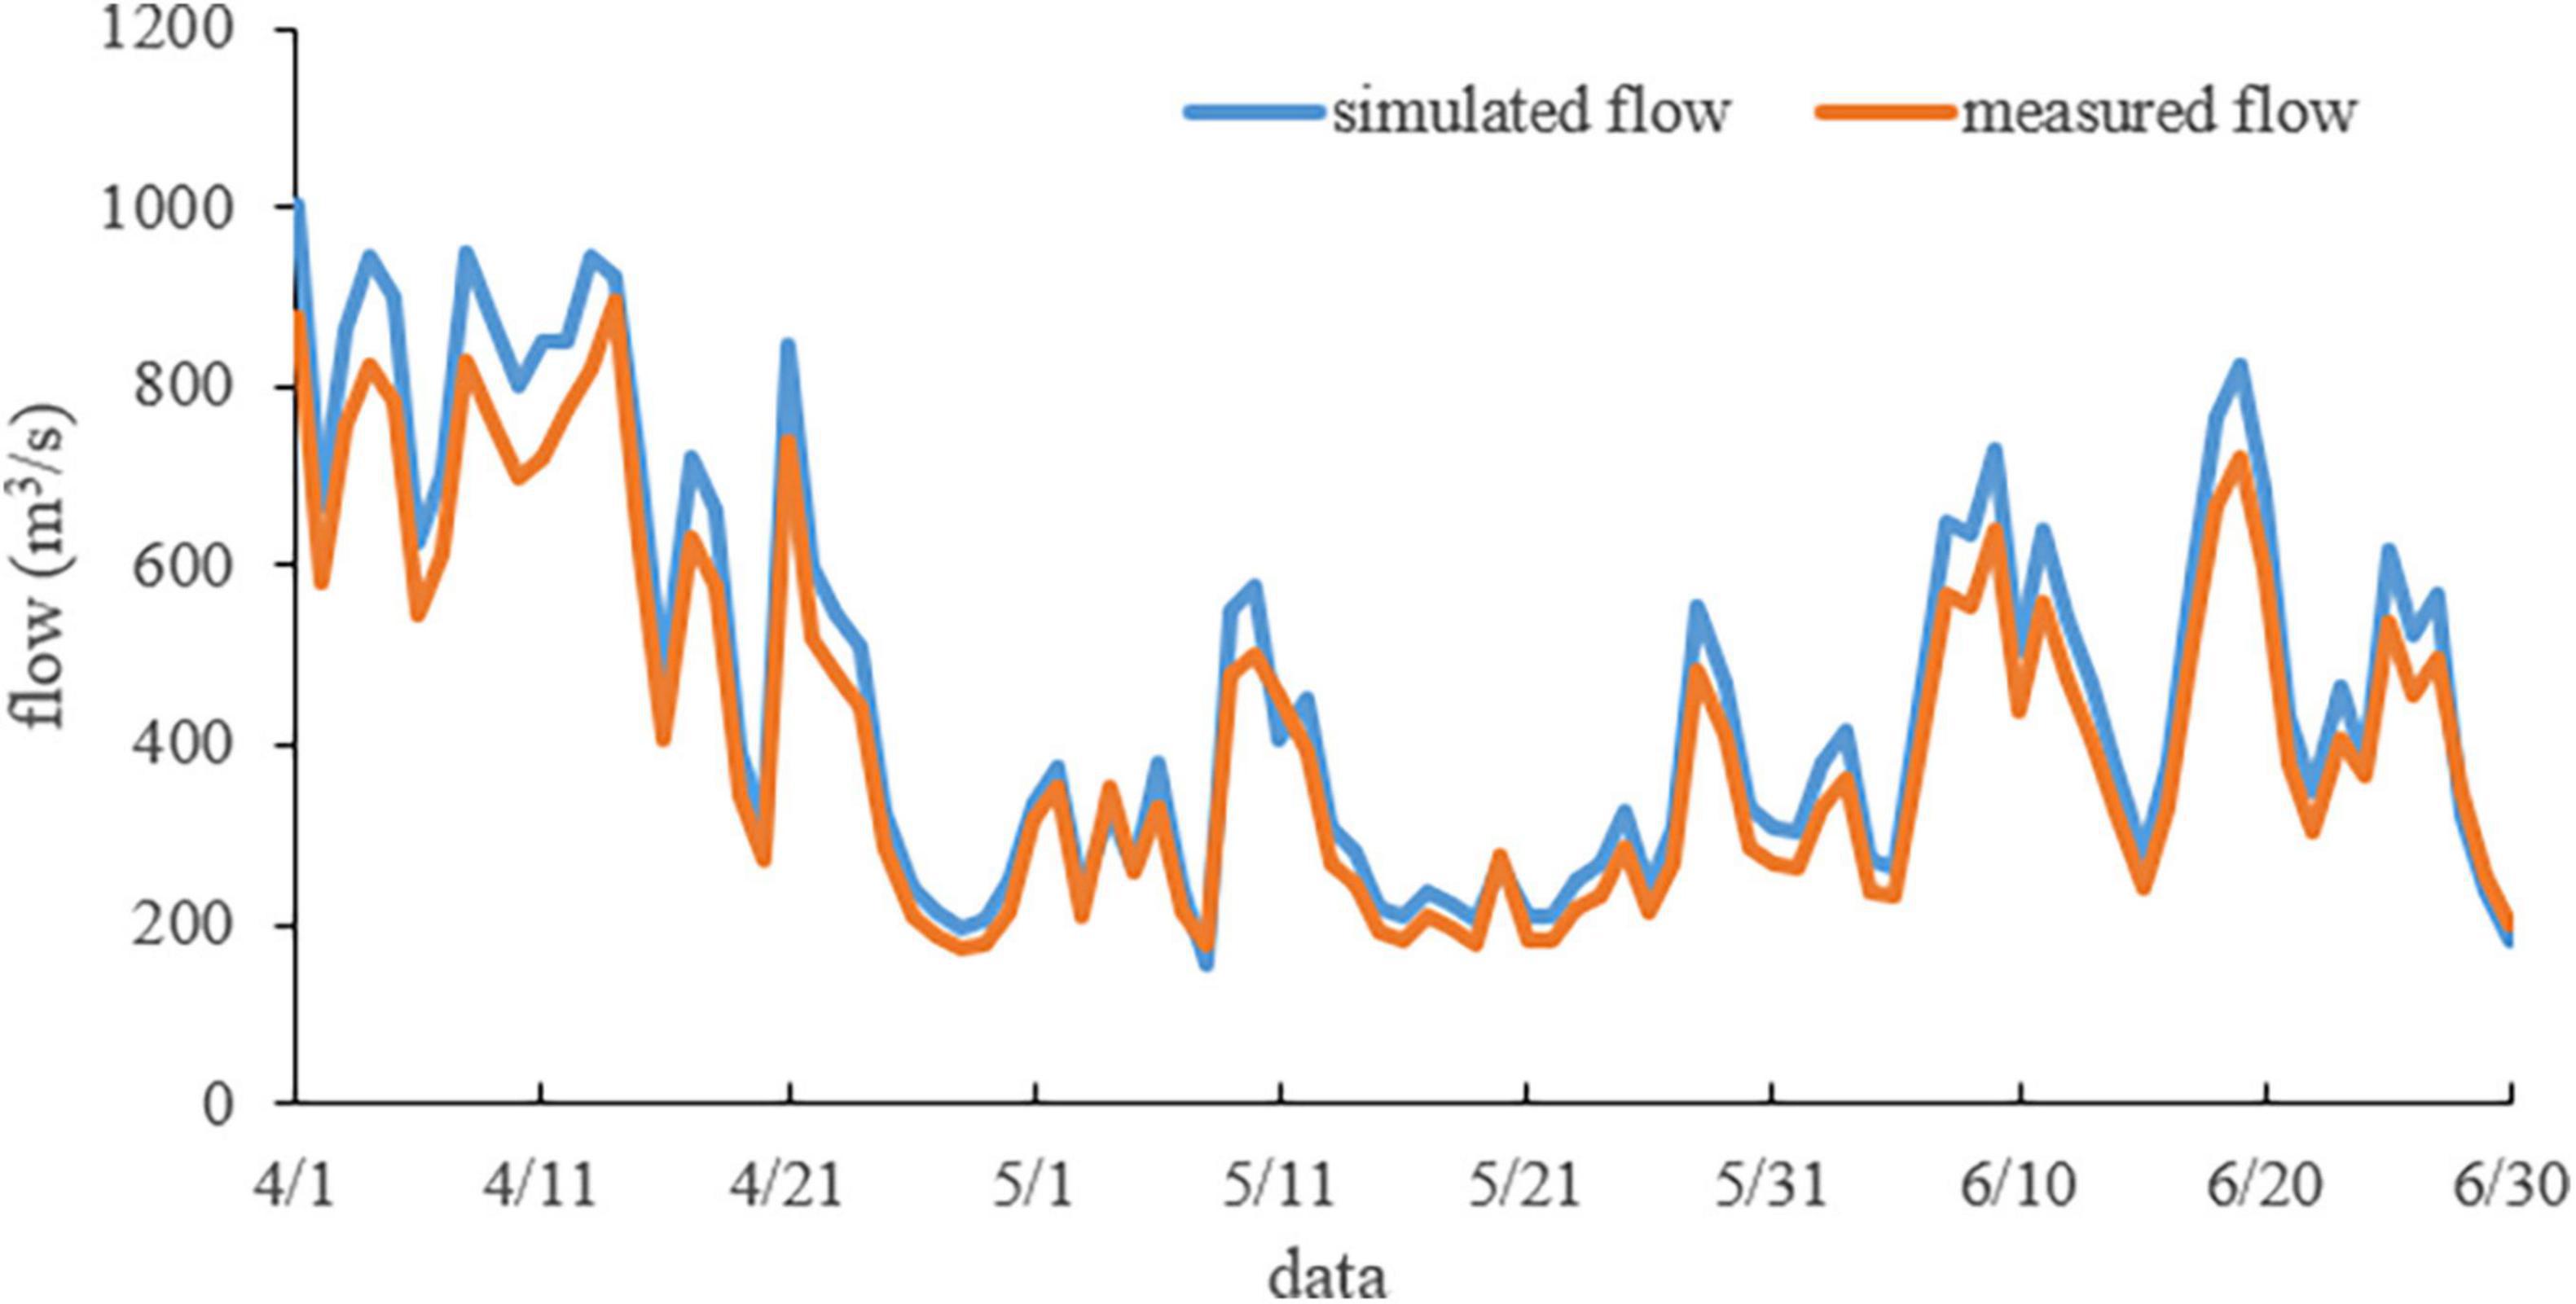
By comparing the simulated flow with the measured flow, it was found that the fitting coefficient R2 was 0.83–0.96, the ENS was 0.82–0.95, and the RE was less than ±5% (Table 3). The verification results are shown in Figure 4. The above results were generally reasonable. The established calculation model was consistent with the characteristics of the basin’s flood evolution, and the model’s calibration parameters could meet the requirements. The model can be used to evaluate the ecological water requirement.
Data Source
Meteorological Data
The precipitation, evaporation and wind speed data were obtained from the China Meteorological Data website,1 specifically, the n/)poration and wind speed data were obtained from the China Meteorological DatV3.0),” which contained the daily values pressure, temperature, precipitation, evaporation, relative humidity, wind direction, wind speed, sunshine hours and 0 cm ground temperature elements of the 166 stations in China since January 1951.
Land Use Data
The land use data were obtained based on the actual land use maps already available for the Yellow River Basin.2 The land use maps included categories such as dry land, rural settlements, sandy land, forested land, marshland, lakes, and other land use types.
The Manning coefficient was a very important parameter in the hydrodynamic model, and the rationality of its value directly affected the accuracy of the model simulation results. To make the results of the model more realistic, it was usually necessary to select different Manning coefficients as objects of simulation to determine the appropriate Manning coefficient. In the HD module of the MIKE 21 hydrodynamic model, a suitable Manning coefficient map was extracted from the land use map to refer to the roughness table.
DEM Data
The DEM data of the study area were extracted from the existing DEM database (Geospatial Data Cloud3). The DEM used in this article had a resolution of 30 m × 30 m.
Hydrological Data and Aquatic Biological Data
The hydrological data (1946-1956) of the study area were collected from the Yellow River Water Conservancy Commission.4 The aquatic biological data of the study area were extracted from the data published in Wu et al. (2006), Huang et al. (2016), and Wang (2017).
Results and Discussion
The ecological water requirement in the upper reaches of the Yellow River was analyzed by selecting the LZ section in the upper reaches, the LM section in the middle reaches. The runoff of the QTX reservoir before construction (before 1958) and WJZ reservoir before construction (before 1994) was regarded as approximately natural runoff, and the measured daily runoff characteristics of the section from 1946 to 1956 were counted. Moreover, S. lanzhouensis was selected as the indicator species of the LZ section (Figure 5A), and C. carpio was selected as the indicator species of the LM section (Figure 5B) to simulate the process of the ecological water requirement in different periods.
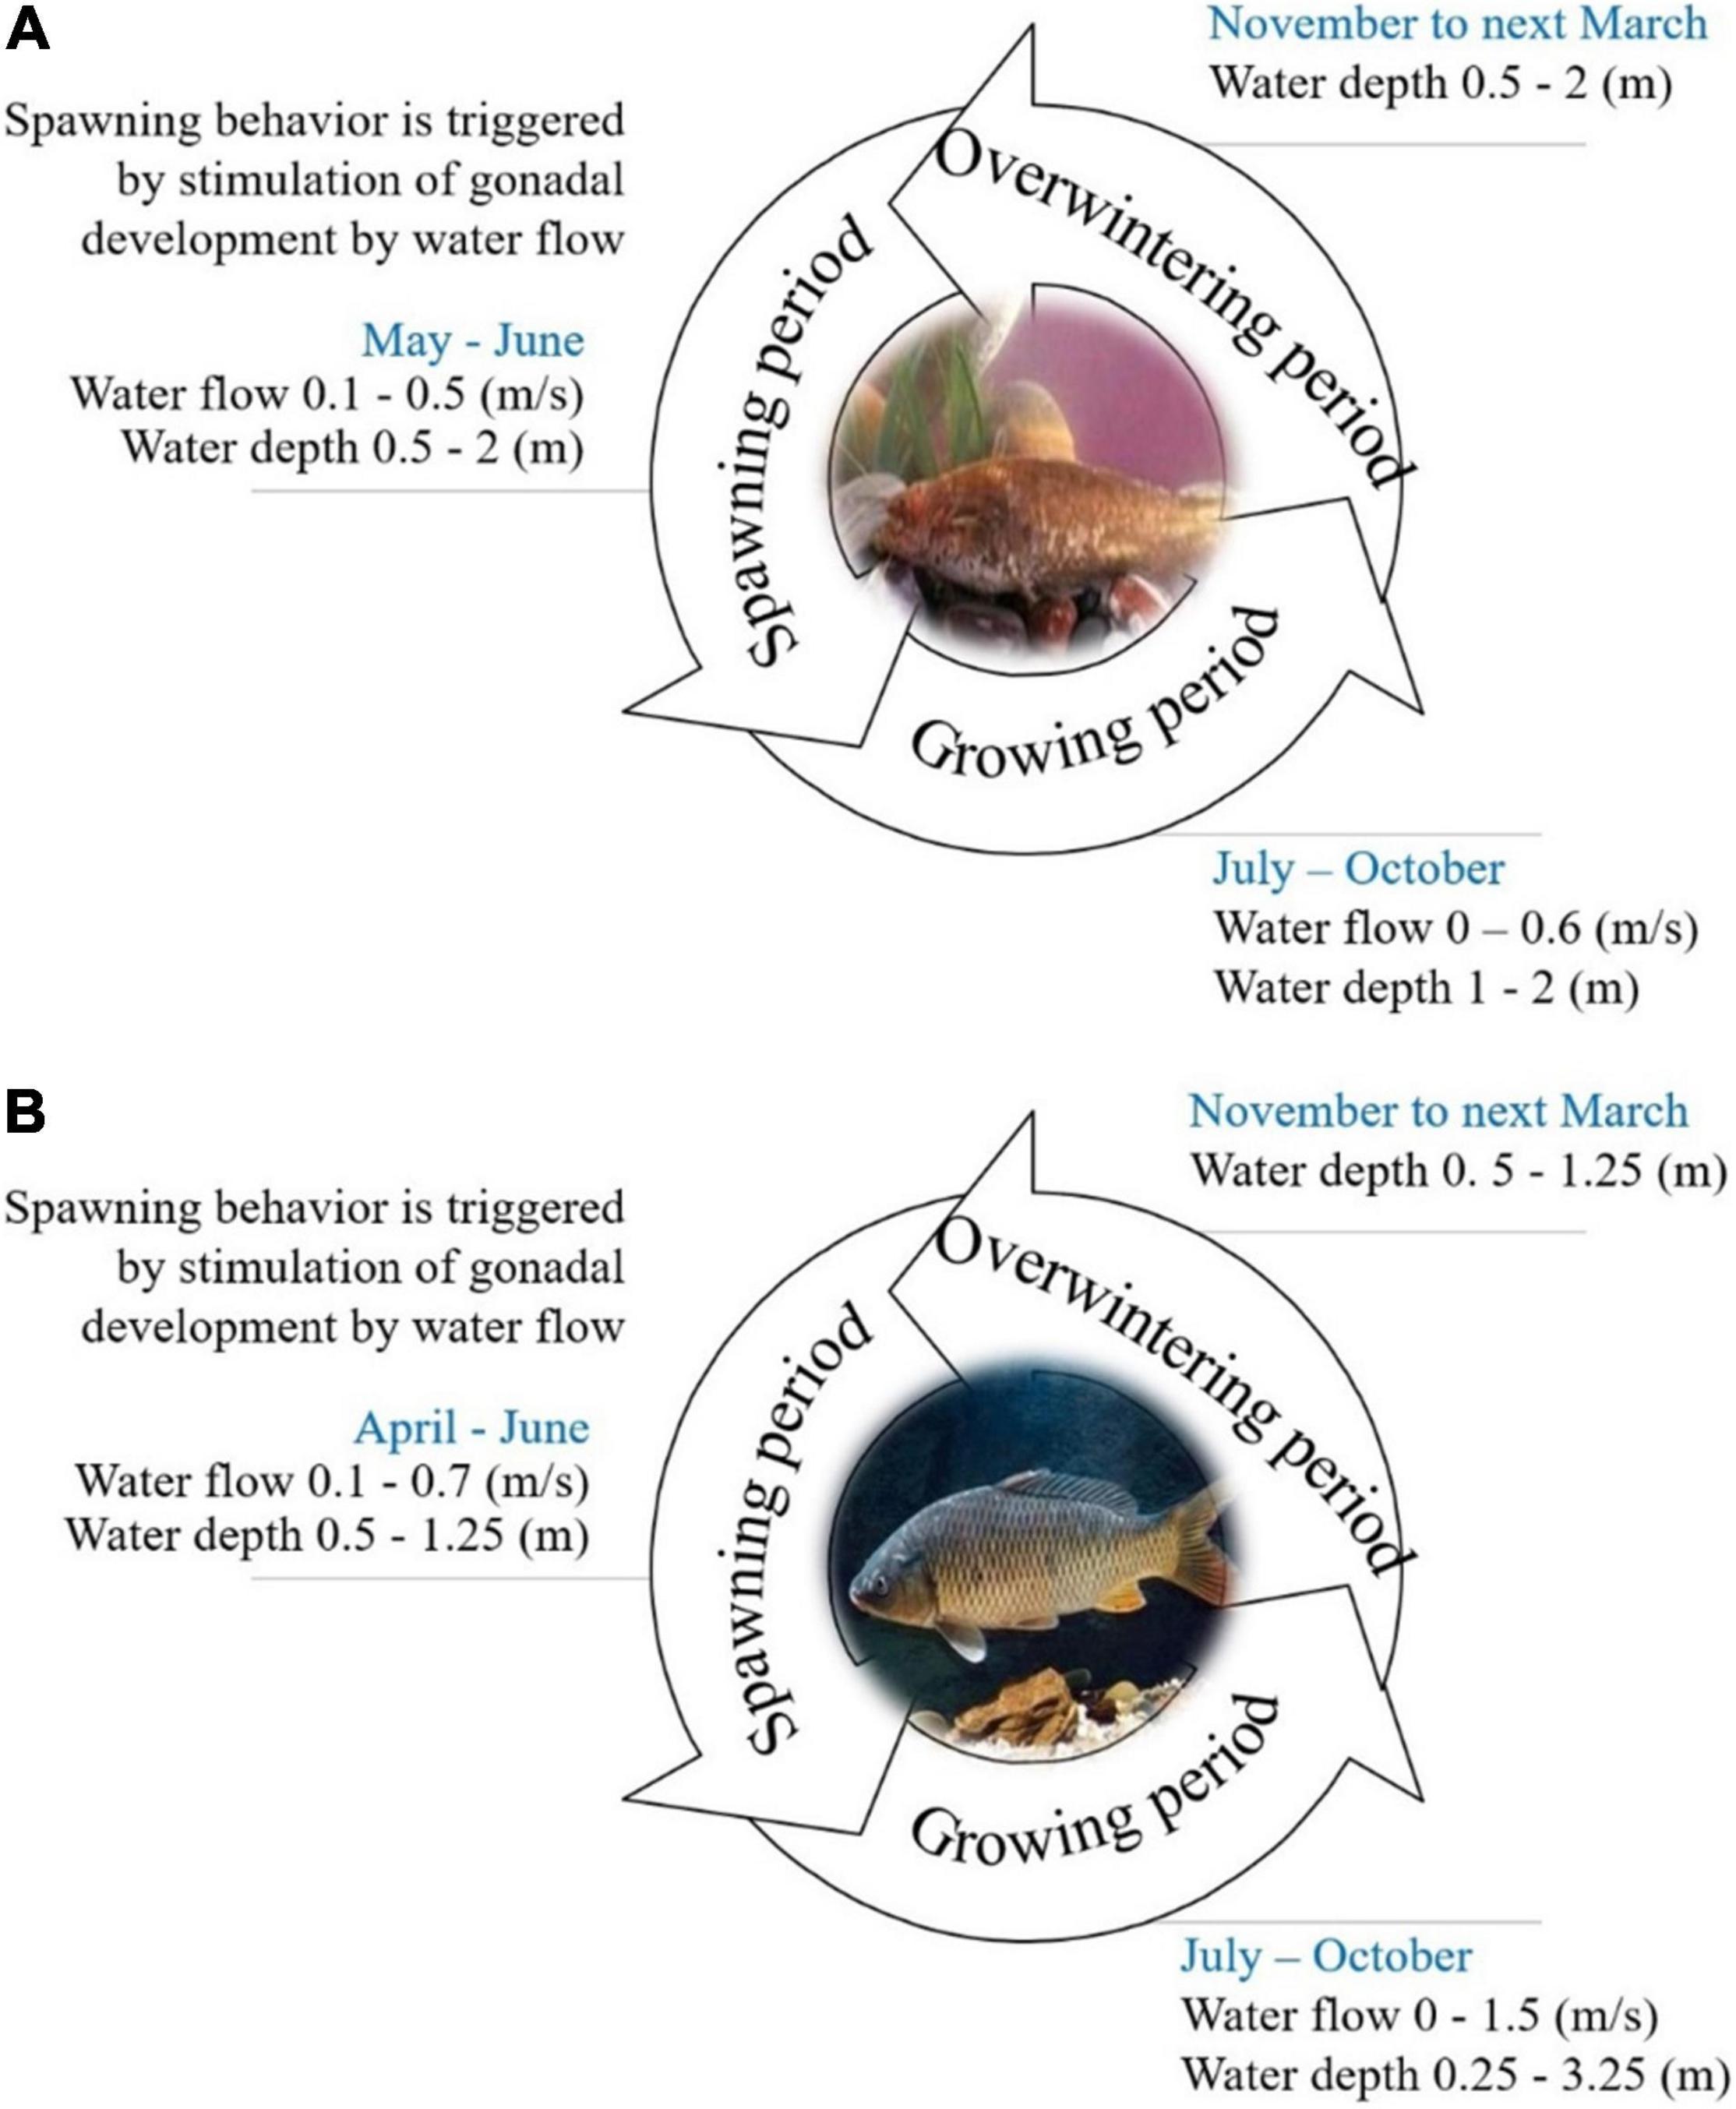
Figure 5. Environmental factors of fish habitat in the Yellow River (Wu et al., 2006; Huang et al., 2016; Wang, 2017). (A) The environmental factors of Silurus lanzhouensis habitat in the Yellow River. (B) The environmental factors of Cyprinus carpio habitat in the Yellow River.
The Habitat Distribution of the Main Stream of the Yellow River
A habitat simulation model was established by the MIKE 21 model to simulate the habitat distribution of S. lanzhouensis in different stages under different ecological flows (Figure 6). The ecological water requirement process was obtained based on the results of habitat simulation and features of the hydrological reference group.
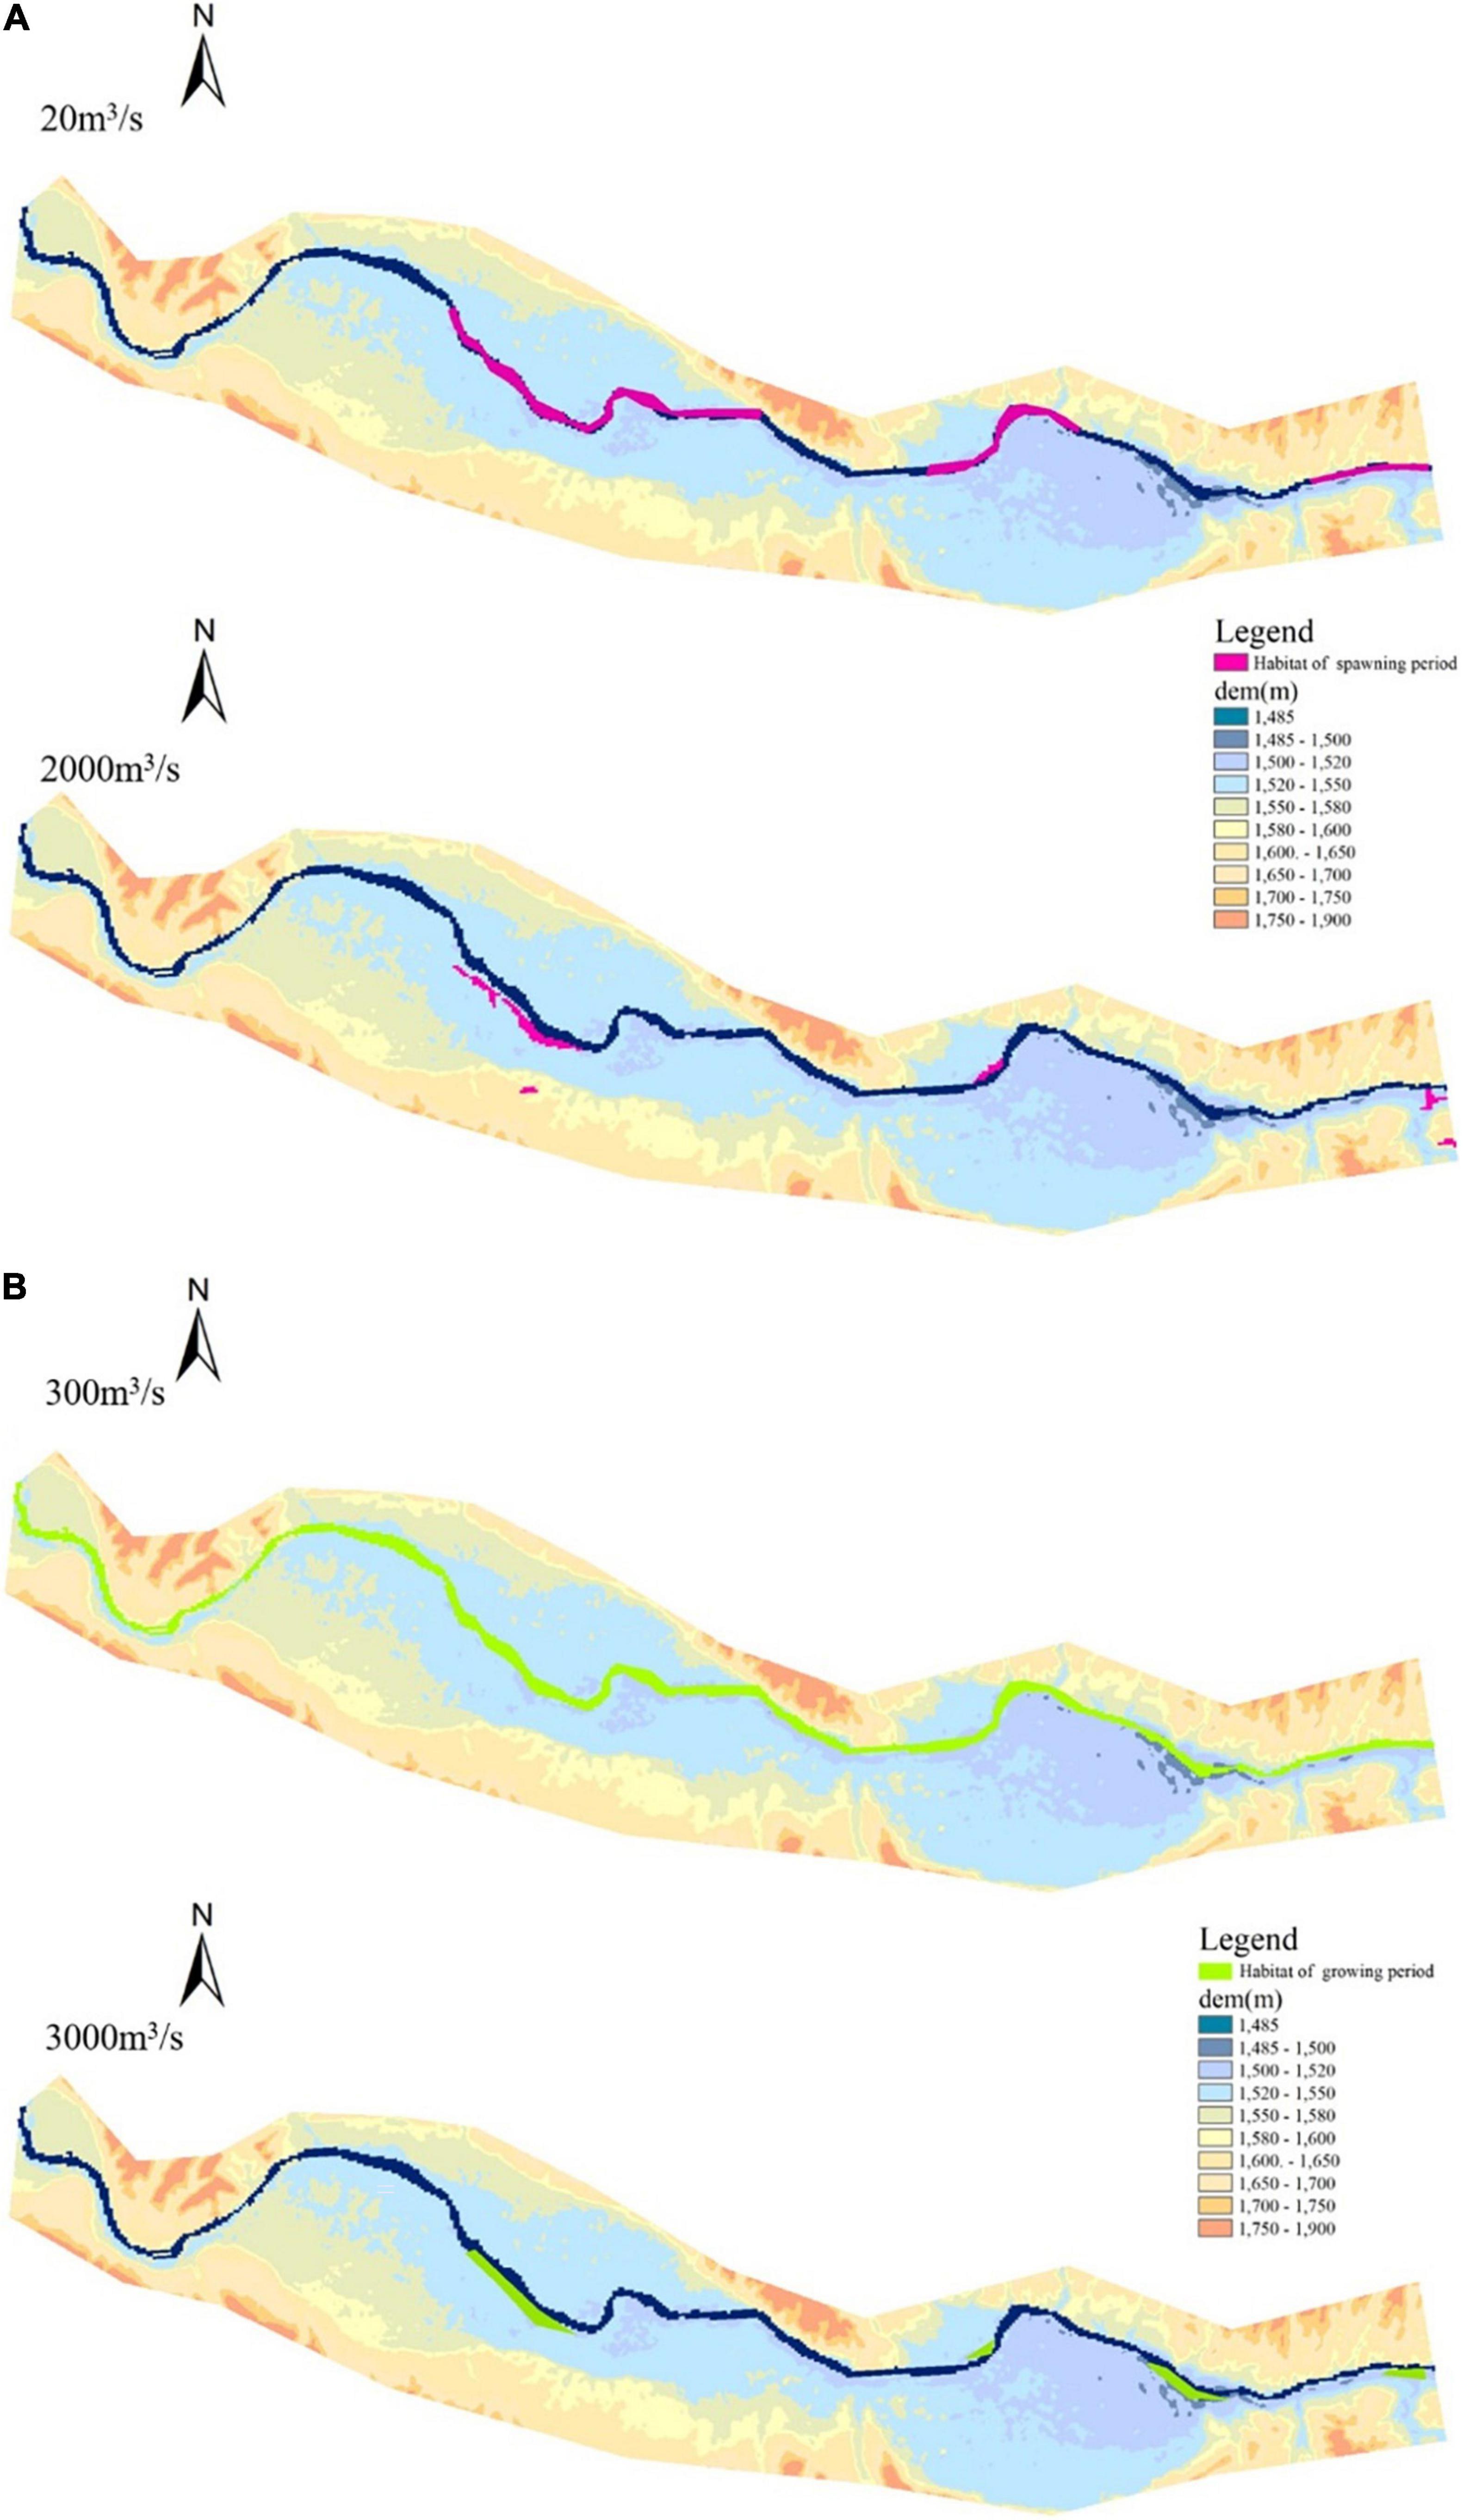
Figure 6. The habitat distribution of Silurus lanzhouensis at different flow rates of LZ. (A) Habitat distribution in spawning period. (B) Habitat distribution in growing period.
A habitat simulation model was established by using the MIKE 21 model to simulate the habitat distribution of C. carpio at different stages under different flows (Figure 7). An ecological water requirement assessment method that coupled the results of habitat simulation and features of the hydrological reference group was used to obtain the ecological water requirement process.
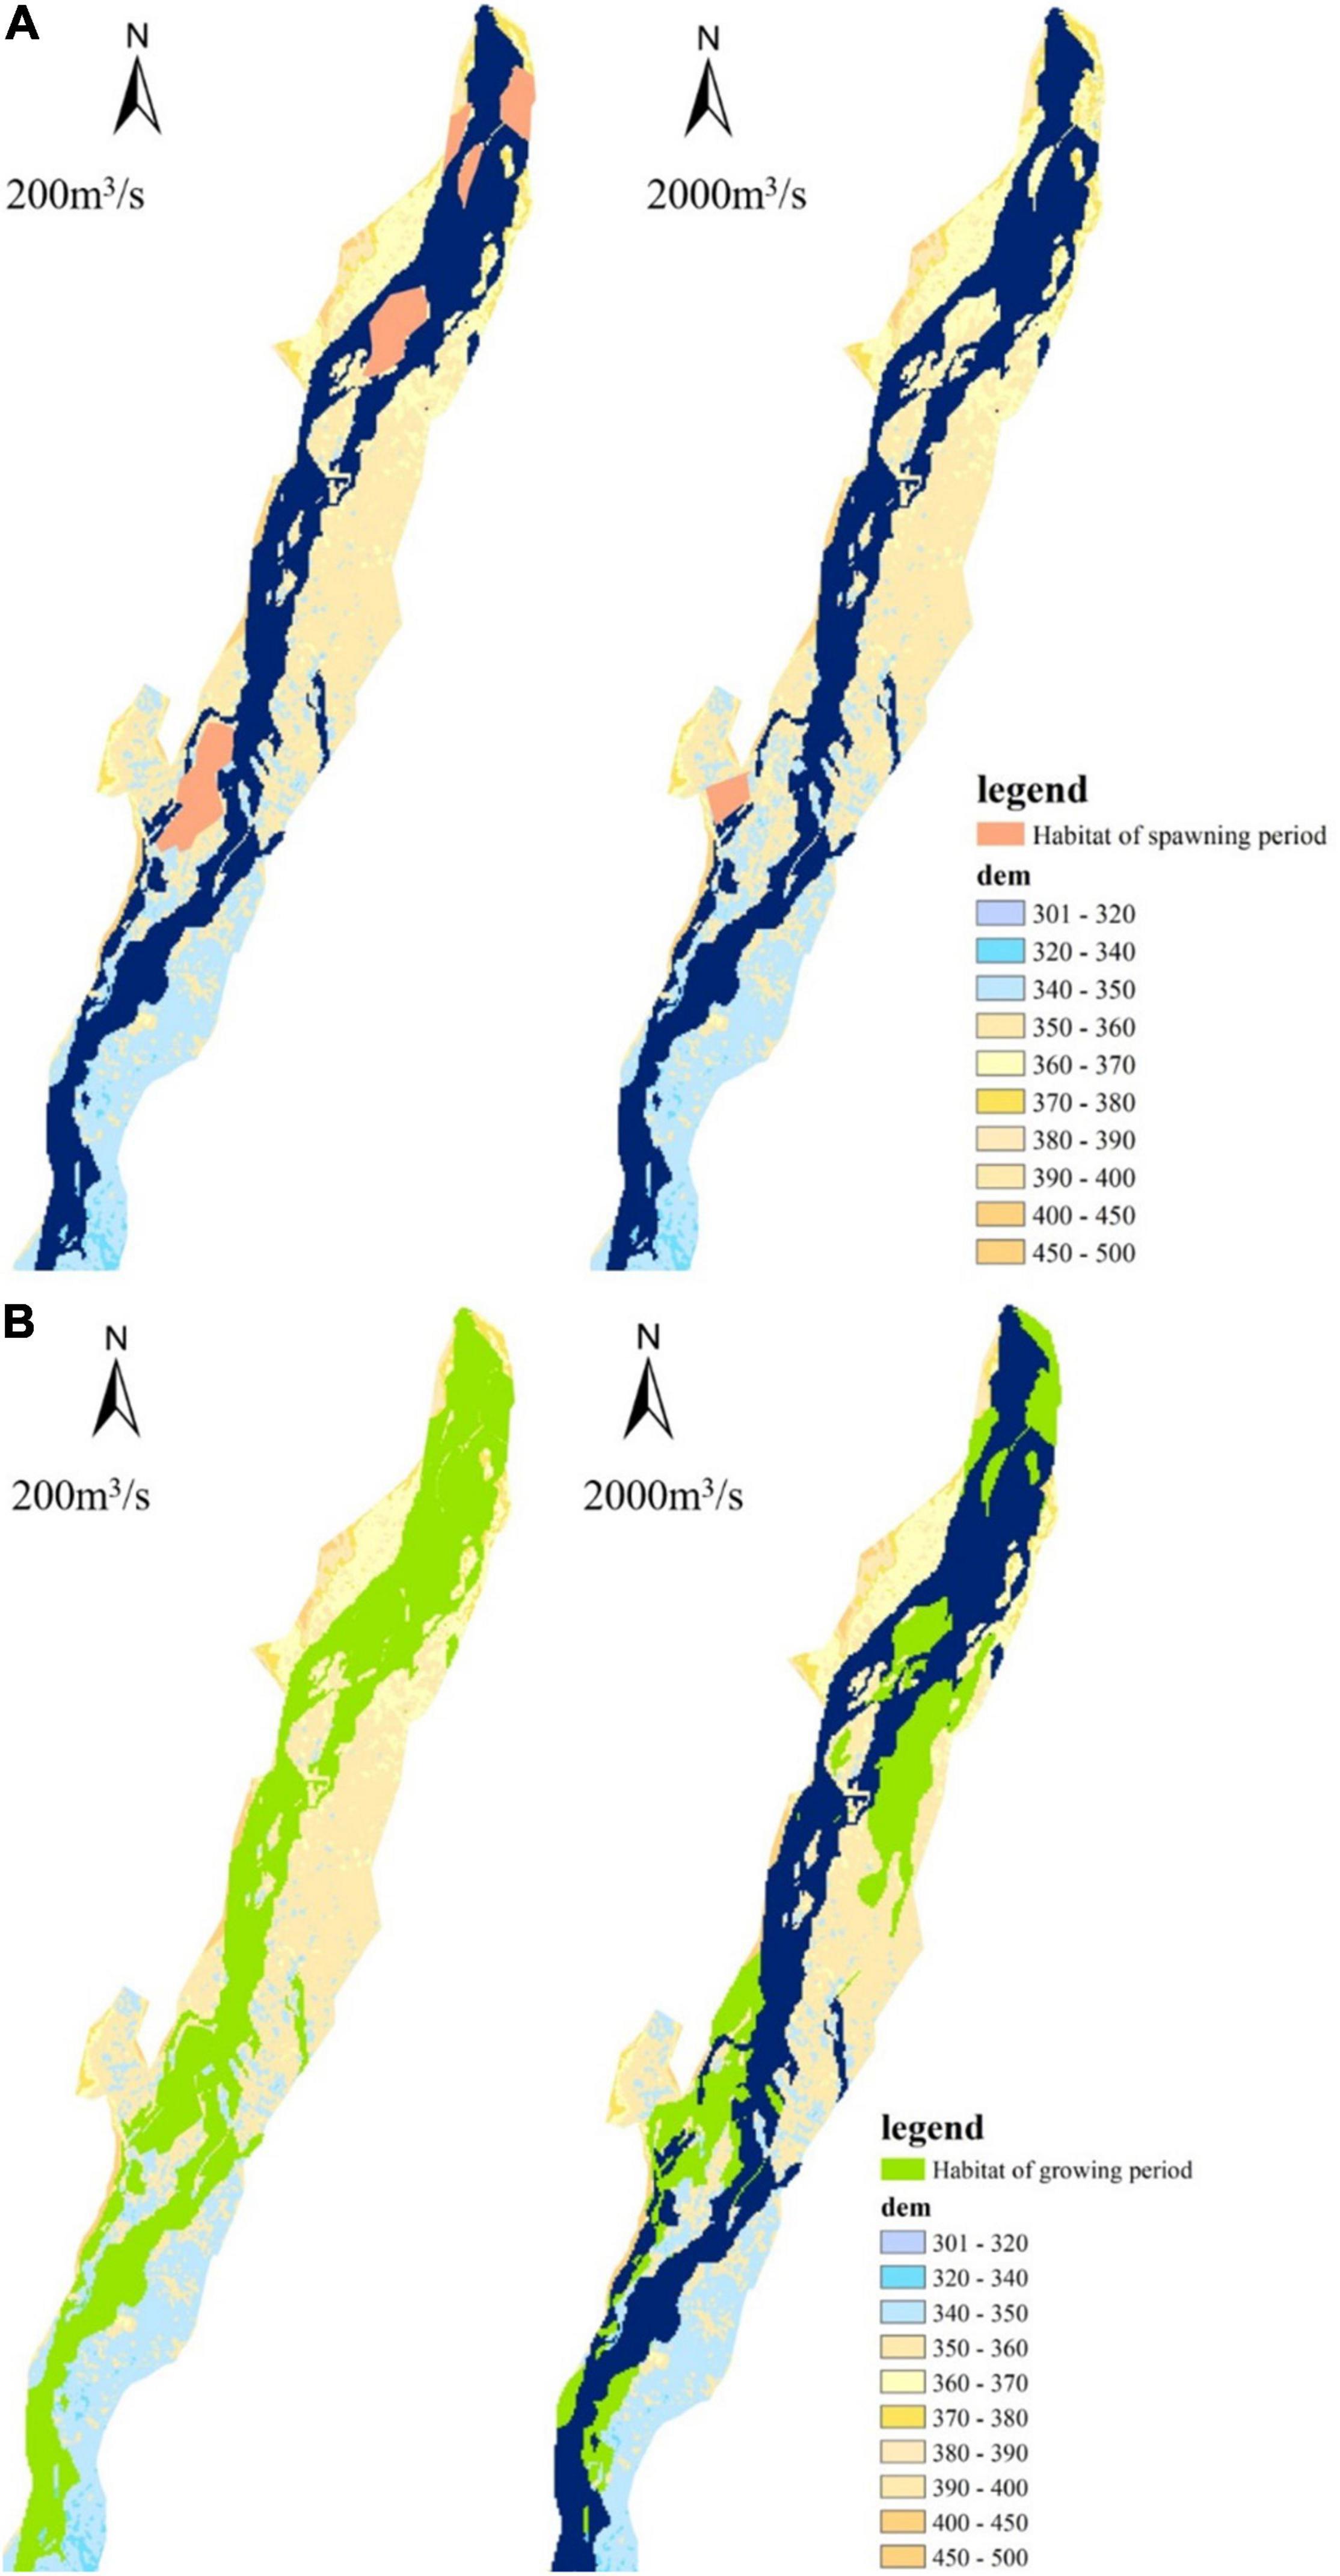
Figure 7. The habitat distribution of Cyprinus carpio at different stages under different flows of LM. (A) Habitat distribution in spawning period. (B) Habitat distribution in growing period.
The Key Features of the Hydrological Reference Group
The river runoff before the construction of the LJX reservoir (before 1958), the QTX reservoir (before 1958), the WJZ reservoir (before 1994) and the SMX reservoir (before 1957) was approximated as the natural river runoff, and the measured daily runoff characteristics of the Lanzhou section from 1946 to 1956 were obtained. The characteristic values of the hydrological reference group mainly focused on the minimum flow and the high flow pulse.
For the LZ section, under natural conditions, the minimum flow during the growing period of S. lanzhouensis (July to October) was 614 m3/s, the minimum flow during the overwintering period (November-next March) was 206 m3/s, and the minimum flow during the spawning period (April to June) was 296 m3/s.
The rising period of the main stream of the Yellow River was from April to June. The daily average flow process of the Lanzhou section from 1946 to 1956 showed that the high-flow pulses were mainly concentrated in April and early to mid-June. Flow events with a flow rate exceeding 1,180 m3/s (flow rate with a cumulative frequency of 25% during the flood period in the natural period) and a duration of more than 3 days are regarded as high flow pulses. The occurrence of high flow pulses in the LZ and LM section is shown in Tables 4, 5.
The Ecological Water Requirement Process of the Main Stream of the Yellow River
The ecological water requirement process of the key sections of the main stream of the Yellow River was obtained by coupling the results of habitat simulation and the features of the hydrological reference group (Figure 8).
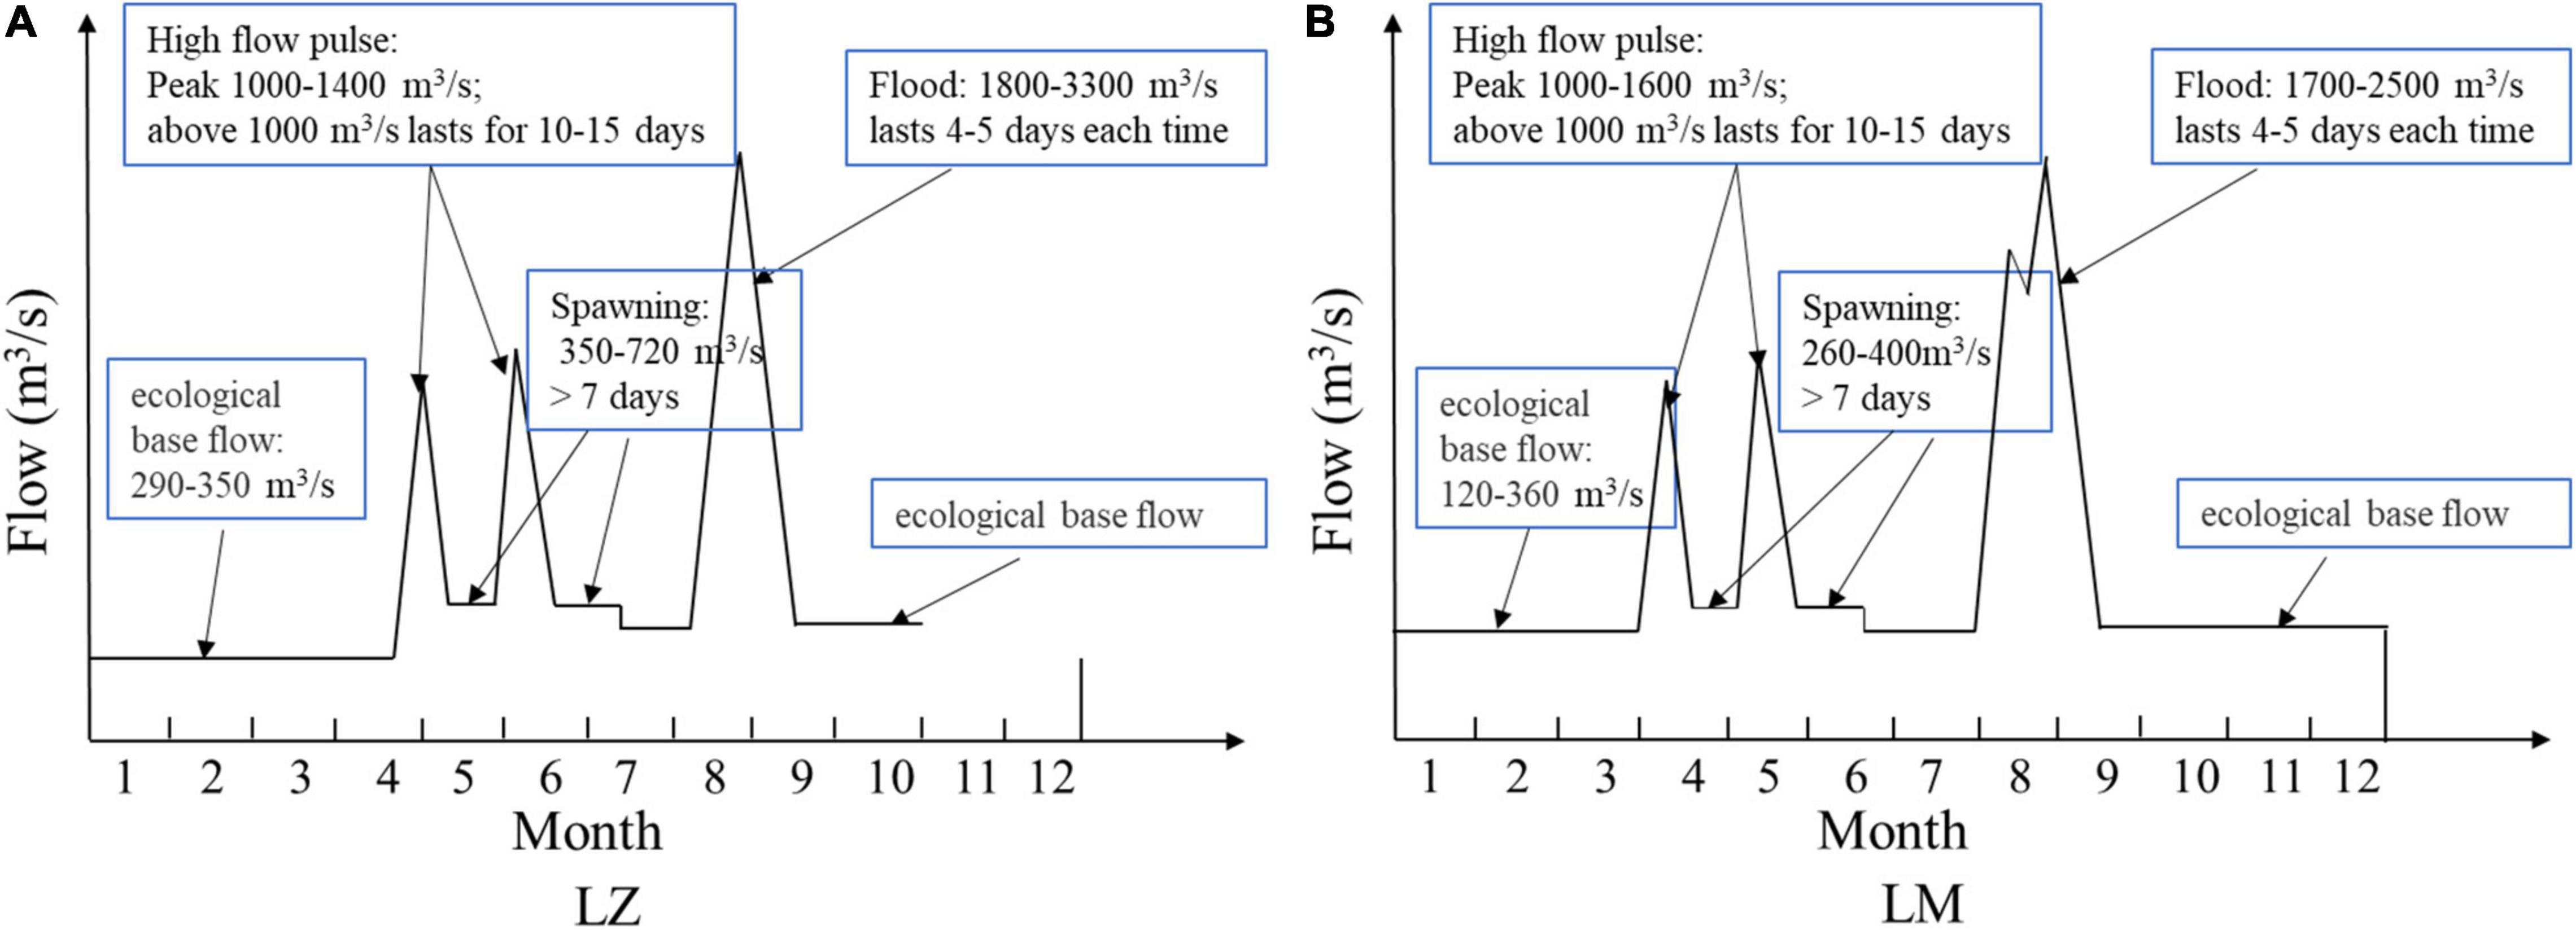
Figure 8. The ecological water requirement process of the key sections of the main stream of the Yellow River.
Lanzhou Section
The habitat spread throughout the main trough when the flow was small, the habitat area gradually decreased as the flow increased, and the habitat mainly spread in the caves or aquatic plants on the edge of the water or in the middle of the river with a suitable flow rate of 300–3,000 m3/s. The spawning season was from late May to early July, and the suitable flow was 350–720 m3/s during the spawning season. During the period from November to the next March, the river mainly provides a winter habitat for fish, and a flow of 120–200 m3/s could be fully satisfied.
Longmen Section
The habitat spread throughout the main trough when the flow was small, the habitat area gradually decreased with the increase in flow, and the habitat gradually concentrated on the edge of the water area. The back-beach area of the floodplain formed a suitable habitat, and the suitable flow range was 200–1,800 m3/s. For the spawning ground, the habitat area increased significantly when the flow was 300 m3/s during the spawning period (April–June), which indicated that the river section was suitable for the spawning of the C. carpio, for which the flow should reach 300 m3/s. During the period from November until the next March, the river mainly provides a winter habitat for fish, and a flow of 120–260 m3/s could be fully satisfied. In addition, considering the actual conditions of the Yellow River water volume and the demand for fish survival, the minimum flow condition for meeting the water requirement of C. carpio in the LM section was approximately 200 m3/s.
The Yellow River is famous for having a small amount of water and a large amount of sand, and the amount of sediment transport is an important part of its ecological water requirement. As shown in Table 6, the suitable flow rates in the growing period in the LZ and LM section were 300–3,000 and 200–1,800 m3/s; the suitable flow rates in the spawning period in the LZ and LM section were 350–720 and 260–400 m3/s; the suitable flow rates in the overwintering period in the LZ and LM section were 120–200 and 120–260 m3/s, and the annual ecological water requirement of the LZ and LM section was 9.1–11 × 109 and 4.7–11.3 × 10⁹ m3, respectively.
According to the comprehensive planning of the Yellow River Basin approved by the State Council points out that the minimum ecological water requirement of Longmen section from April to June was 180 m3/s, and the suitable ecological water requirement was 240 m3/s (Yellow River Water Resources Commission, 2013). In addition, it is proposed that the early warning flow of Longmen section was 100 m3/s, and the minimum ecological flow of each period obtained in this study was higher than the early warning flow, and the results of ecological water requirement were reasonable.
Conclusion
To maintain the ecological integrity of the river, a new assessment method of ecological water requirement was proposed by coupling the results of habitat simulation with the features of the hydrological reference group, which was helpful for quantitatively simulating the changes in the ecological water requirement of indicator fish in key sections of the Yellow River, and it was effective for identifying the variations of the ecological water requirement.
An ecological hydrological model of the main stream of the Yellow River was constructed. Five cross-sections of the Yellow River were selected to construct the eco-hydrological horizontal pattern of the main stream of the Yellow River according to the hydrological characteristics of different sections. The effective habitat area of indicator fish under different characteristic flows was simulated.
A method for the calculation of ecological water requirement was proposed, combining habitat simulation results, hydrological characteristics and the flood pulse. The ecological water requirement process of indicator fish in the main stream of the Yellow River was evaluated. The pulse flow process during the spawning period from April to June was determined based on the ecological flow elements from the simulation of daily runoff processes in the LZ and LM sections from 1946 to 1956. For LZ section, a high pulse flow process with a low flow peak should be guaranteed in mid- to late May, and the peak flow should be at least approximately 1,000 m3/s to provide spawning signals for fish; the peak flow (i.e., from 1,200 to 1,600 m3/s) was 1 to 2 time during the high pulse flow process in May to June. For LM section, a high pulse flow process with a low flow peak should be guaranteed in mid- to late April, and the peak flow should be at least approximately 1,000 m3/s to provide spawning signals for fish; the peak flow (i.e., from 1,000 to 1,600 m3/s) was 1 to 2 time during the high pulse flow process in May to June.
According to comprehensive habitat simulation of indicator fish and the ecological water requirement process based on the features of the hydrological reference group, the recommended plans for meeting the ecological water requirement process of the key sections of the main stream of the Yellow River have been determined, including the flow peak, distribution time and duration. The suitable flow rates in the growing period in LZ and LM were 300–3,000 and 200–1,800 m3/s, respectively. The suitable flow rates in the spawning period in LZ and LM were 350–720 and 260–400 m3/s, respectively. The suitable flow rates in the overwintering period in LZ and LM were 120–200 and 120–260 m3/s, respectively. The annual ecological water requirement of the LZ, and LM section was 9.1 × 10⁹–11 × 109 and 7.9 × 10⁹–15.4 × 10⁹ m3, respectively.
The approach quantitatively simulated the changes in the ecological water requirement of indicator fish in key sections of the Yellow River. The approach was proven to be an effective and realistic tool for the ecological water requirement accounting in the Yellow River. Habitat simulation required a large amount of basic river data and quantitative biological data, which limited the application of this approach to a certain extent. It is recommended that the simulation results should be compared with actual measurement results to verify the reliability and accuracy of the approach.
Data Availability Statement
The original contributions presented in the study are included in the article/supplementary material, further inquiries can be directed to the corresponding author.
Author Contributions
FZ, CL, and WS conceived and designed the manuscript. FZ and XZ analyzed the data. XW, QL, and JB contributed reagents, materials, and analysis tools. FZ wrote the manuscript. All authors contributed to the article and approved the submitted version.
Funding
This study was supported by the Key Laboratory of Water and Sediment Science, Ministry of Education fund (SS202102) and the National Key Research and Development Program (2017YFC0404401 and 2018YFC0407403).
Conflict of Interest
WS and XZ were employed by Yellow River Engineering Consulting Co., Ltd.
The remaining authors declare that the research was conducted in the absence of any commercial or financial relationships that could be construed as a potential conflict of interest.
Publisher’s Note
All claims expressed in this article are solely those of the authors and do not necessarily represent those of their affiliated organizations, or those of the publisher, the editors and the reviewers. Any product that may be evaluated in this article, or claim that may be made by its manufacturer, is not guaranteed or endorsed by the publisher.
Acknowledgments
We would like to thank the editor and reviewers for all their detailed comments and valuable suggestions in greatly improving the quality of this manuscript.
Footnotes
References
Arthington, A. H., Bhaduri, A., Bunn, S. E., Jackson, S. E., Tharme, R. E., Tickner, D., et al. (2018). The Brisbane declaration and global action agenda on environmental flows (2018). Front. Env. Sci. 6:45. doi: 10.3389/fenvs.2018.00045
Bartschi, D. K. (1976). A habitat-discharge method of determining instream flows for aquatic habitat. In Symposium on Instream Flow Needs. Bethseda: American Fisheries Society, 285–294.
Baumgartner, L. J., Conallin, J., Wooden, I., Campbell, B., Gee, R., Robinson, W. A., et al. (2014). Using flow guilds of freshwater fish in an adaptive management framework to simplify environmental flow delivery for semi−arid riverine systems. Fish Fish. 15, 410–427. doi: 10.1111/faf.12023
Bovee, K. D. (1996). A comprehensive overview of the instream flow incremental methodology. Virginia: National Biological Service, Fort Collins, Corporation.
Brown, E. D., and Williams, B. K. (2016). Ecological integrity assessment as a metric of biodiversity: Are we measuring what we say we are? Biodiv. Conserv. 25, 1011–1035. doi: 10.1007/s10531-016-1111-0
Bunn, S. E., and Arthington, A. H. (2002). Basic principles and ecological consequences of altered flow regimes for aquatic biodiversity. Environ. Manag. 30, 492–507. doi: 10.1007/s00267-002-2737-0
Cai, Y. P., Wan, L., Yang, Y., Zhang, X. M., and Li, Y. J. (2010). Analysis on the environmental flow requirements for natural reproduction of Chinese Sturgeon based on habitat simulation methods. J. Hydroecol. 3, 1–6. doi: 10.5194/hess-14-1033-2010
Dai, Z., Li, C., Trettin, C., Sun, G., Amatya, D., and Li, H. (2010). Bi-criteria evaluation of the MIKE SHE model for a forested watershed on the South Carolina coastal plain. Hydrology and Earth System Sciences 14, 1033–1046. doi: 10.5194/hess-14-1033-2010
Doummar, J., Sauter, M., and Geyer, T. (2012). Simulation of flow processes in a large-scale karst system with an integrated catchment model (Mike She)–Identification of relevant parameters influencing spring discharge. J. Hydrol. 426, 112–123. doi: 10.1016/j.jhydrol.2012.01.021
Dudgeon, D. (2010). Prospects for sustaining freshwater biodiversity in the 21st century: linking ecosystem structure and function. Curr. Opin. Env. Sust. 2, 422–430. doi: 10.1016/j.cosust.2010.09.001
Edwards, E. A., and Twomey, K. (1982). Habitat suitability index models: common carp. Boston, MA: Western Energy and Land Use Team, Office of Biological Services, Fish and Wildlife Service, US Department of the Interior.
Feng, H. J. (2010). Community diversity and growth characteristic of fish between Ningxia and Inner Mongolia in the main stream of Yellow River. Kirkland, WA: Northwest university. doi: 10.7666/d.y1679009
Hao, F. Q., Huang, J. H., Gao, C. D., Wang, X. G., and Zhang, J. J. (2006). Overview on study of eco-environmental water demand for main stream of Yellow River. (in Chinese) Water Resour. Hydrop. Eng. 37, 60–63. doi: 10.3969/j.issn.1000-0860.2006.02.013
Hao, Z. C., and Shang, S. H. (2008). Multi-objective assessment method based on physical habitat simulation for calculating ecological river flow demand. J. Hydraul. Eng. 39, 557–561. doi: 10.3321/j.issn:0559-9350.2008.05.007
Huang, J. H., Hao, F. Q., Gao, C. D., Wang, X. G., and Zhang, J. J. (2004). Preliminary Approach to Water Demand of Ecological Environment of the Yellow River. (in Chinese) Yellow River 26, 26–27. doi: 10.3969/j.issn.1000-1379.2004.04.012
Huang, J. H., Wang, R. L., and Ge, L. (2016). Study on the functional continuous flow index of the important reaches of the main and tributaries of the Yellow River (in Chinese). Zhengzhou: Yellow River Water Conservancy Press.
Hughes, D. A. (1999). Towards the incorporation of magnitude-frequency concepts into the building block methodology used for quantifying ecological flow requirements of south African rivers. Water South Afr. 5, 279–284.
Hughes, D. A. (2001). Providing hydrological information and data analysis tools for the determination of ecological instream flow requirements for south African rivers. Hydrology 241, 140–151. doi: 10.1016/S0022-1694(00)00378-4
Jiang, X., Liu, X., Zhang, S., and Cai, Q. (2005). Distinguishing Key Species of Aquatic Ecosystem of the Main Yellow River. (in Chinese) Yellow River 27, 1–3.
Jiang, X. H., and Wang, H. Z. (2012). Change of structural characteristics and health assessment of aquatic ecosystems along the mainstream of the Yellow River. J. Hydraul. Eng. 43, 991–998.
Lian, Y., Wang, X. G., Wang, R. L., and Ge, L. (2011). Study on the protection target and ecological water requirements of the Yellow River Ecosystem (in Chinese). Zhengzhou: Yellow River Water Conservancy Press.
Liu, C., Wang, Z. Y., and Sui, J. Y. (2008). Variation of flow and sediment of the Yellow River and their influential factors. Advances in Science and Technology of Water resources 28, 1–7.
Liu, W., Zhan, J. Y., Zhao, F., Wang, C., Zhang, F., Teng, Y. M., et al. (2022). Spatio-temporal variations of ecosystem services and their drivers in the Pearl River Delta, China. J. Clean. Prod. 2022:130466. doi: 10.1016/j.jclepro.2022.130466
Liu, X. Y. (2009). Environmental Flows of the Yellow River. Zhengzhou: Yellow River Water Conservancy Press, 5–8. doi: 10.1142/9789814280969_0002
Ma, G. H., Xia, Z. Q., Guo, L. D., Li, J., and Guo, Z. (2007). Ecological runoff for different cross-sections of the main stream of Yellow River (in Chinese). J. Hohai Univ. 35, 496–500.
Ma, Z. Z., Wang, Z. J., Xia, T., Gippel, C. J., and Speed, R. (2014). Hydrograph-Based Hydrologic Alteration Assessment and Its Application to the Yellow River. J. Env. Inform. 23:1. doi: 10.3808/jei.201400252
Morrison, M. L., Marcot, B. G., and Mannan, R. W. (1992). Wildlife−Habitat Relationships. Concepts and Applications. Madison, WI: The University of Wisconsin press.
Nikghalb, S., Shokoohi, A., Singh, V. P., and Yu, R. (2016). Ecological regime versus minimum environmental flow: comparison of results for a river in a semi-Mediterranean region. Water Resour. Manag. 30, 4969–4984. doi: 10.1007/s11269-016-1488-2
Norris, R. H., and Hawkins, C. P. (2000). Monitoring River health. Hydrobiology 435, 5–17. doi: 10.1023/A:1004176507184
Norris, R. H., and Thoms, M. C. (1999). What is river health? Freshw. Biol. 41, 197–209. doi: 10.1046/j.1365-2427.1999.00425.x
Poff, N. L. (2018). Beyond the natural flow regime? Broadening the hydro−ecological foundation to meet environmental flows challenges in a non−stationary world. Freshw. Biol. 63, 1011–1021. doi: 10.1111/fwb.13038
Poff, N. L., Allan, J. D., Bain, M. B., Karr, J. R., Pres-tegaard, K. L., Richter, B. D., et al. (1997). The natural flow regime: a paradigm for river con-servation and restoration. BioScience 47, 769–784. doi: 10.2307/1313099
Richter, B. D. (1997). How much water does a river need? Freshw. Biol. 32, 231–2496. doi: 10.1046/j.1365-2427.1997.00153.x
Rolls, R. J., and Bond, N. R. (2017). Environmental and ecological effects of flow alteration in surface water ecosystems. Water for the Environment. Cambridge, MA: Academic Press, 65–82. doi: 10.1016/B978-0-12-803907-6.00004-8
Ru, H. J., Wang, H. J., Zhao, W. H., Shen, Y. Q., Wang, Y., and Zhang, X. K. (2010). Fishes in the mainstream of the Yellow River: assemblage characteristics and historical changes (in Chinese). Biodiv. Sci. 18, 169–174. doi: 10.3724/SP.J.1003.2010.179
Shang, W. X., Peng, S. M., Wang, Y., Zheng, X. K., and Liu, B. J. (2020). Research on the ecological integrity-oriented environmental flow regime of the Lower Yellow River. J. Hydraul. Eng. 51, 367–370. doi: 10.1016/j.scitotenv.2022.153205
Sun, J.N., Zhang, S. Q., Zhu, D.Z., and Fu, J.J. (2013). Simulative evaluation of fish habitat of backwater tributary of Baihetan Reservoir. Water Resourc. Hydropower Eng. 44, 17–22. doi: 10.3969/j.issn.1000-0860.2013.10.004
Tennant, D. L. (1976). Instream flow regimens for fish, wildlife, recreation and related environmental resources. Fisheries 1, 359–373. doi: 10.1577/1548-8446(1976)001<0006:IFRFFW>2.0.CO;2
Thame, R. (2003). A global perspective on environmental flow assessment: emerging trends in the development and application of environmental flow methodologies. River Res. Appl. 19, 397–441. doi: 10.1002/rra.736
Theodoropoulos, C., Skoulikidis, N., Rutschmann, P., and Stamou, A. (2018). Ecosystem−based environmental flow assessment in a Greek regulated river with the use of 2D hydrodynamic habitat modelling. River Res. Appl. 34, 538–547. doi: 10.1002/rra.3284
Virkki, V., Alanärä, E., Porkka, M., Ahopelto, L., Gleeson, T., and Mohan, C. (2021). Environmental flow envelopes: quantifying global, ecosystem–threatening streamflow alterations. Hydrol. Earth Syst. Sci. Dis. 2021, 1–31. doi: 10.5194/hess-2021-260
Wang, G. X., Chen, M. J., Feng, H. L., Wang, L. Q., and Huang, C. S. (2009). Ecological flow regime in middle and lower reaches of the Yellow River. J. Sun Yat-sen Univ. 48, 125–130.
Wang, H., Wang, H., Hao, Z. C., Wang, X., Liu, M., and Wang, Y. L. (2018). Multi-objective assessment of the ecological flow requirement in the upper Yangtze national nature reserve in China using PHABSIM. Water 10:326. doi: 10.3390/w10030326
Wang, P. F., Shen, Y. X., Wang, C. T., Hou, J., Qian, J., Yu, Y., et al. (2017). An improved habitat model to evaluate the impact of water conservancy projects on Chinese sturgeon (Acipenser sinensis) spawning sites in the Yangtze River, China. Ecolog. Eng. 104, 165–176. doi: 10.1016/j.ecoleng.2017.03.021
Wang, R. L., Huang, J. H., Ge, L., Feng, H. J., Li, R. N., and Shen, H. B. (2020). Study of ecological flow based on the relationship between cyprinusy carpio habitat hydrological and ecological response in the lower Yellow River. J. Hydraul. Eng. 51, 1175–1187. doi: 10.13243/j.cnki.slxb.20200184
Wang, Y. (2017). Polymorphism of SSR and analysis with growth traits in Silurus Lanzhouensis. Yinchuan: Ningxia University.
Wu, M., and Chen, A. (2018). Practice on ecological flow and adaptive management of hydropower engineering projects in China from 2001 to 2015. Water Pol. 20, 336–354. doi: 10.2166/wp.2017.138
Wu, X. D., Zhang, Q., Zhao, H. X., Hou, Y., and Zhang, W. (2006). A new species of catfish in Ningxia-Silurus Lanzhouensis and its intensive morphological description. Freshw. Fish. 36, 26–29.
Xu, T. (2010). Calculation Principle and Application Example of a Two-dimensi onal Flow Model-MIKE21 HD. Water Conserv. Sci. Technol. Econ. 16, 867–869.
Yang, W., Zhao, Y. W., Liu, Q., and Sun, T. (2020). A systematic literature review and perspective on water-demand for ecology of Lake Baiyangdian. J. Lake Sci. 32, 294–308. doi: 10.18307/2020.0202
Yellow River Water Resources Commission (2013). Comprehensive Planning of the Yellow River Basin (2012–2030). Jinan: Yellow River Water Resources Commission.
Zhang, W. G., Huang, Q., and Jiang, X. H. (2008). Study on instream ecological flow based on physical habitat simulation. Adv. Water Sci. 19, 192–197.
Zhang, Z., Huang, Y., Xu, C. Y., Chen, X., Moss, E. M., Jin, Q., et al. (2016). Analysis of Poyang Lake water balance and its indication of river–lake interaction. Spring. Plus 5, 1–15. doi: 10.1186/s40064-016-3239-5
Keywords: ecological water requirement (EWR), habitat simulation, MIKE 21 model, ecological water requirement process, the main stream of the Yellow River
Citation: Zhao F, Li C, Shang W, Zheng X, Wang X, Liu Q and Bu J (2022) Ecological Water Requirement Accounting of the Main Stream of the Yellow River From the Perspective of Habitat Conservation. Front. Ecol. Evol. 10:907162. doi: 10.3389/fevo.2022.907162
Received: 29 March 2022; Accepted: 29 April 2022;
Published: 16 June 2022.
Edited by:
Fan Zhang, Institute of Geographic Sciences and Natural Resources Research (CAS), ChinaReviewed by:
Wencong Yue, Dongguan University of Technology, ChinaYufeng Wang, Northwest A&F University, China
Meng Xu, Zhejiang University of Finance and Economics, China
Copyright © 2022 Zhao, Li, Shang, Zheng, Wang, Liu and Bu. This is an open-access article distributed under the terms of the Creative Commons Attribution License (CC BY). The use, distribution or reproduction in other forums is permitted, provided the original author(s) and the copyright owner(s) are credited and that the original publication in this journal is cited, in accordance with accepted academic practice. No use, distribution or reproduction is permitted which does not comply with these terms.
*Correspondence: Fen Zhao, emhhb2ZAbGR1LmVkdS5jbg==; Chunhui Li, Q2h1bmh1aWxpQGJudS5lZHUuY24=
 Fen Zhao
 Chunhui Li
 Wenxiu Shang
 Xiaokang Zheng
 Xuan Wang
 Qiang Liu
 Jiuhe Bu