 Javed Mallick
 Mohammed K. Almesfer2
 Nabil Ben Kahla
95% of researchers rate our articles as excellent or good
Learn more about the work of our research integrity team to safeguard the quality of each article we publish.
Find out more
ORIGINAL RESEARCH article
Front. Ecol. Evol. , 03 June 2022
Sec. Environmental Informatics and Remote Sensing
Volume 10 - 2022 | https://doi.org/10.3389/fevo.2022.905799
This article is part of the Research Topic Earth Observation Systems for the Urban Environment and Climate Change View all 5 articles
Urbanization and land-use change are significant contributors to cumulative greenhouse gas emissions, causing climate change and environmental damage. Research on land-use-derived carbon storage and sequestration capability is crucial for emission reduction strategy and sustainable development. Because cities are becoming significant sources of carbon emissions, an accurate assessment of city-level carbon storage and sequestration is now required. This study intended to estimate the carbon storage and sequestration capabilities using the InVEST model under different land use land cover (LULC) classes in Abha, Saudi Arabia. We used a support vector machine (SVM) for LULC mapping. For the future forecasting of the LULC map, we employed cellular automata (ANN-CA). Expansion of built-up land is the primary source of CO2. From 1990 to 2040, agriculture lost 145 megagram of carbon per hectare (Mg C/ha), whereas vegetation lost 34,948.15 Mg C/ha. Vegetation would get 17,363.7 Mg C/ha during the same period, whereas urban areas would receive 3924.1 Mg C/ha. Approximately 17,000 Mg C/ha would be lost from the vegetation area in future periods. The approaches outlined in this paper may add a new dimension to carbon emission analyses and provide helpful information for low-carbon city.
Human benefits obtained from ecosystems are categorized into four types: regulating, provisioning, cultural, and supporting ecosystem services (Yirsaw et al., 2017). Changes in land cover and climate are examples of natural ecosystem regulatory services (Jiang et al., 2019). Contributing to or removing greenhouse gases from the atmosphere, like carbon sequestration, are vital for climate regulation (Sil et al., 2017). Climate change, global warming, food scarcity, and sustainable development have made carbon a trendy research issue (Lal, 2016). Carbon sequestration is the long-term storage of carbon in soil, plants, and other forms to prevent climate change (Gallant et al., 2020). Terrestrial ecosystems like forests and farmland are crucial to carbon cycling (Sil et al., 2017). Agriculture often releases greenhouse gases, although forests and orchards frequently sequester atmospheric carbon (Xiong et al., 2014; Liang et al., 2021). Forests can store enormous quantities of atmospheric CO2 (IPCC., 2005). Forested regions store carbon during photosynthesis (Hauck et al., 2015). Forests and orchards depletion may hasten climate change because of the release of carbon from the depleted plant (Gibbs et al., 2007; Sil et al., 2017). Climate change reduces the availability and value of climate-regulating services. Winkler et al. (2010) claim that climate regulation services account for almost half of the value of the main terrestrial biomes (forests, grasslands, and woodlands). Carbon management has become a need because of human encroachment on natural resources. During the 19th and 20th-century industrial revolutions, the global carbon cycle and reserves suffered significant losses (Lal, 2008). Consequently, scientists are very interested in the present carbon cycle, its interactions with carbon stocks, and human involvement.
Population growth, industrialization, urbanization, deforestation, and conversion of natural vegetation into cultivable land contribute to soil CO2 emissions, increased atmospheric carbon, and depletion of the terrestrial carbon pool (Molotoks et al., 2018; Lal, 2019). Rapid urbanization threatens natural habitats, including forest cover, agriculture, and wetlands, affecting terrestrial carbon storage (Wu et al., 2018). Changes in carbon storage (Fattah et al., 2021) may affect the human and natural environment with socioeconomic well-being. Thus, converting natural and semi-natural landscapes into built-up regions has influenced urban thermal behavior (Jiang et al., 2015; Rousta et al., 2018). Because of this, the urban heat island effect has become one of the most critical climate change issues (Lauwaet et al., 2016). According to the United Nations, the worldwide urban population will rise from 50% in 2010 to 70% in 2050 (Huang et al., 2019). Increasing the urban population will lead to more urban development and diversity, altering the future climate. Degradation of the terrestrial carbon pool leads to low soil fertility, erosion, and food shortages (Lal, 2014). Thus, monitoring carbon stock decline is crucial to ecosystem sustainability.
Al-Maamary et al. (2017) reported that temperatures increased by 4°C in Saudi cities in just 50 years, with 2–2.75°C projected at coastal locations. Summer temperatures surpass 52°C because of pollution from cars and cities (Abubakar and Aina, 2018). CO2 emissions grew from 14.3 million tonnes in 2000 to 19.5 million tonnes in 2014. The energy sector contributed the most (about 90% of total emissions), followed by industrial sectors (8%) and agriculture (2%). According to Field et al. (2014), temperatures have risen by 0.40°C in Saudi Arabia. Globally, the average temperature increase by 2040 is 2.2–2.7°C (Abubakar and Aina, 2018). Climate change is a matter of worry for Saudi Arabia. The urbanization rate in Saudi Arabia is around 80% (in seven major cities) (Darfaoui and Al, 2010). In the last 40 years, migration has resulted in tremendous urban population growth. However, infrastructure and sustainable urban planning efforts are lacking. Taking Jeddah as an example: the city has exceeded its existing infrastructure. Other cities, including Riyadh and Abha, have seen significant population growth recently (Addas et al., 2020; Addas and Maghrabi, 2020).
On the other hand, the unavailability of high-quality data and appropriate modeling approaches in developing nations, such as Saudi Arabia, has hampered prior ES modeling and environmental analyses. The previous study ignored changes in natural ecosystems and their roles throughout time (Yavari and Bahreini, 2001). Evaluation of the spatiotemporal repercussions of land use land cover (LULC) policies on ESs, such as carbon sequestration and storage, is essential for historical patterns and future prediction scenarios (Babbar et al., 2021).
Several scientific groups from across the globe recommended that the InVEST model be used to assess the effectiveness of the ES model (Pechanec et al., 2018). Researchers quantified and mapped carbon storage and sequestration as one of the most prominent regulating activities, and they found it to be particularly effective (Fekadu Hailu et al., 2021). In spite of the fact that past research has linked LUCC to carbon storage and sequestration, the focus of these studies has been on cities and forest ecoregions (Chu et al., 2019), mountainous ecoregions (Sil et al., 2017), and floodplains (Chu et al., 2019; Gaglio et al., 2019). InVEST, on the other hand, has not been utilized to evaluate carbon sequestration in dry agro-urban environments (Zhou et al., 2020; Zhu et al., 2021). The present research evaluated four carbon pools for calculating carbon storage and sequestration: aboveground biomass, belowground biomass, soil organic carbon, and dead organic matter. Aboveground biomass was the most abundant carbon pool, followed by belowground biomass and dead organic matter. Similarly, Tayebi et al. (2021), investigated the effects of climate change on soil organic carbon storage and belowground biomass storage (Deng et al., 2014). Therefore, based previous research it can be stated that carbon storage and sequestration modeling with their valuation is rare studies. Also, future forecasting of carbon storage and sequestration with their valuation is a novel work for proposing sustainable urban management plans. In the present study, we performed all modeling and statistical analysis with open source software so that the researchers from developing nations can do this study. To the best of authors’ knowledge, this is first study ever have been done in the study area. In this work, we used a machine learning approach called the support vector machine (SVM) to map multi-temporal LULC changes. In addition, we forecasted the LULC and carbon storage and sequestration using CA-ANN and InVest software. Therefore, based on the research gaps, the objective of the study is to model the multi-temporal analysis of carbon storage and sequestration under the changing LULC patterns in Abha city, Saudi Arabia.
The area chosen for this study is Abha (Figure 1) in Saudi Arabia’s south-western province. The high hills near the urban area are a main tourist destination with the most diverse flora and fauna in the Asir region and the Saudi Arabia (Vincent, 2008). The study site covers an area of 1291 km2 and is dominated by J. procera trees, Acacia origena, and A. gerrardii trees. Geographically, Abha extend between 18°9′33.126″N to 18°30′56.566″N latitude and 42°23′52.477″E to 42°51′42.832″E longitude and the elevation varies from 1560 to 2735 m with the mean of 2100 m MSL. The research area, according to the Saudi Geological Society, is composed of hard silt, mild clay, and sedimentary soil. In terms of terrain complexity, the research area has a heterogeneous landscape. It is located in a vital zone of Afromontane, where the city’s environment is characterized by cold and semi-arid temperatures (Bindajam and Mallick, 2020). The average rainfall during the last 55 years (1965–2019) is 245 millimeters, with the majority of precipitation falling between February and June, while the mean minimum and maximum air temperatures are 9.4 and 30.8°C, respectively. High-intensity rainfall is common in the study area, and some rural communities experience flash flooding during the winter season (Mallick et al., 2019).
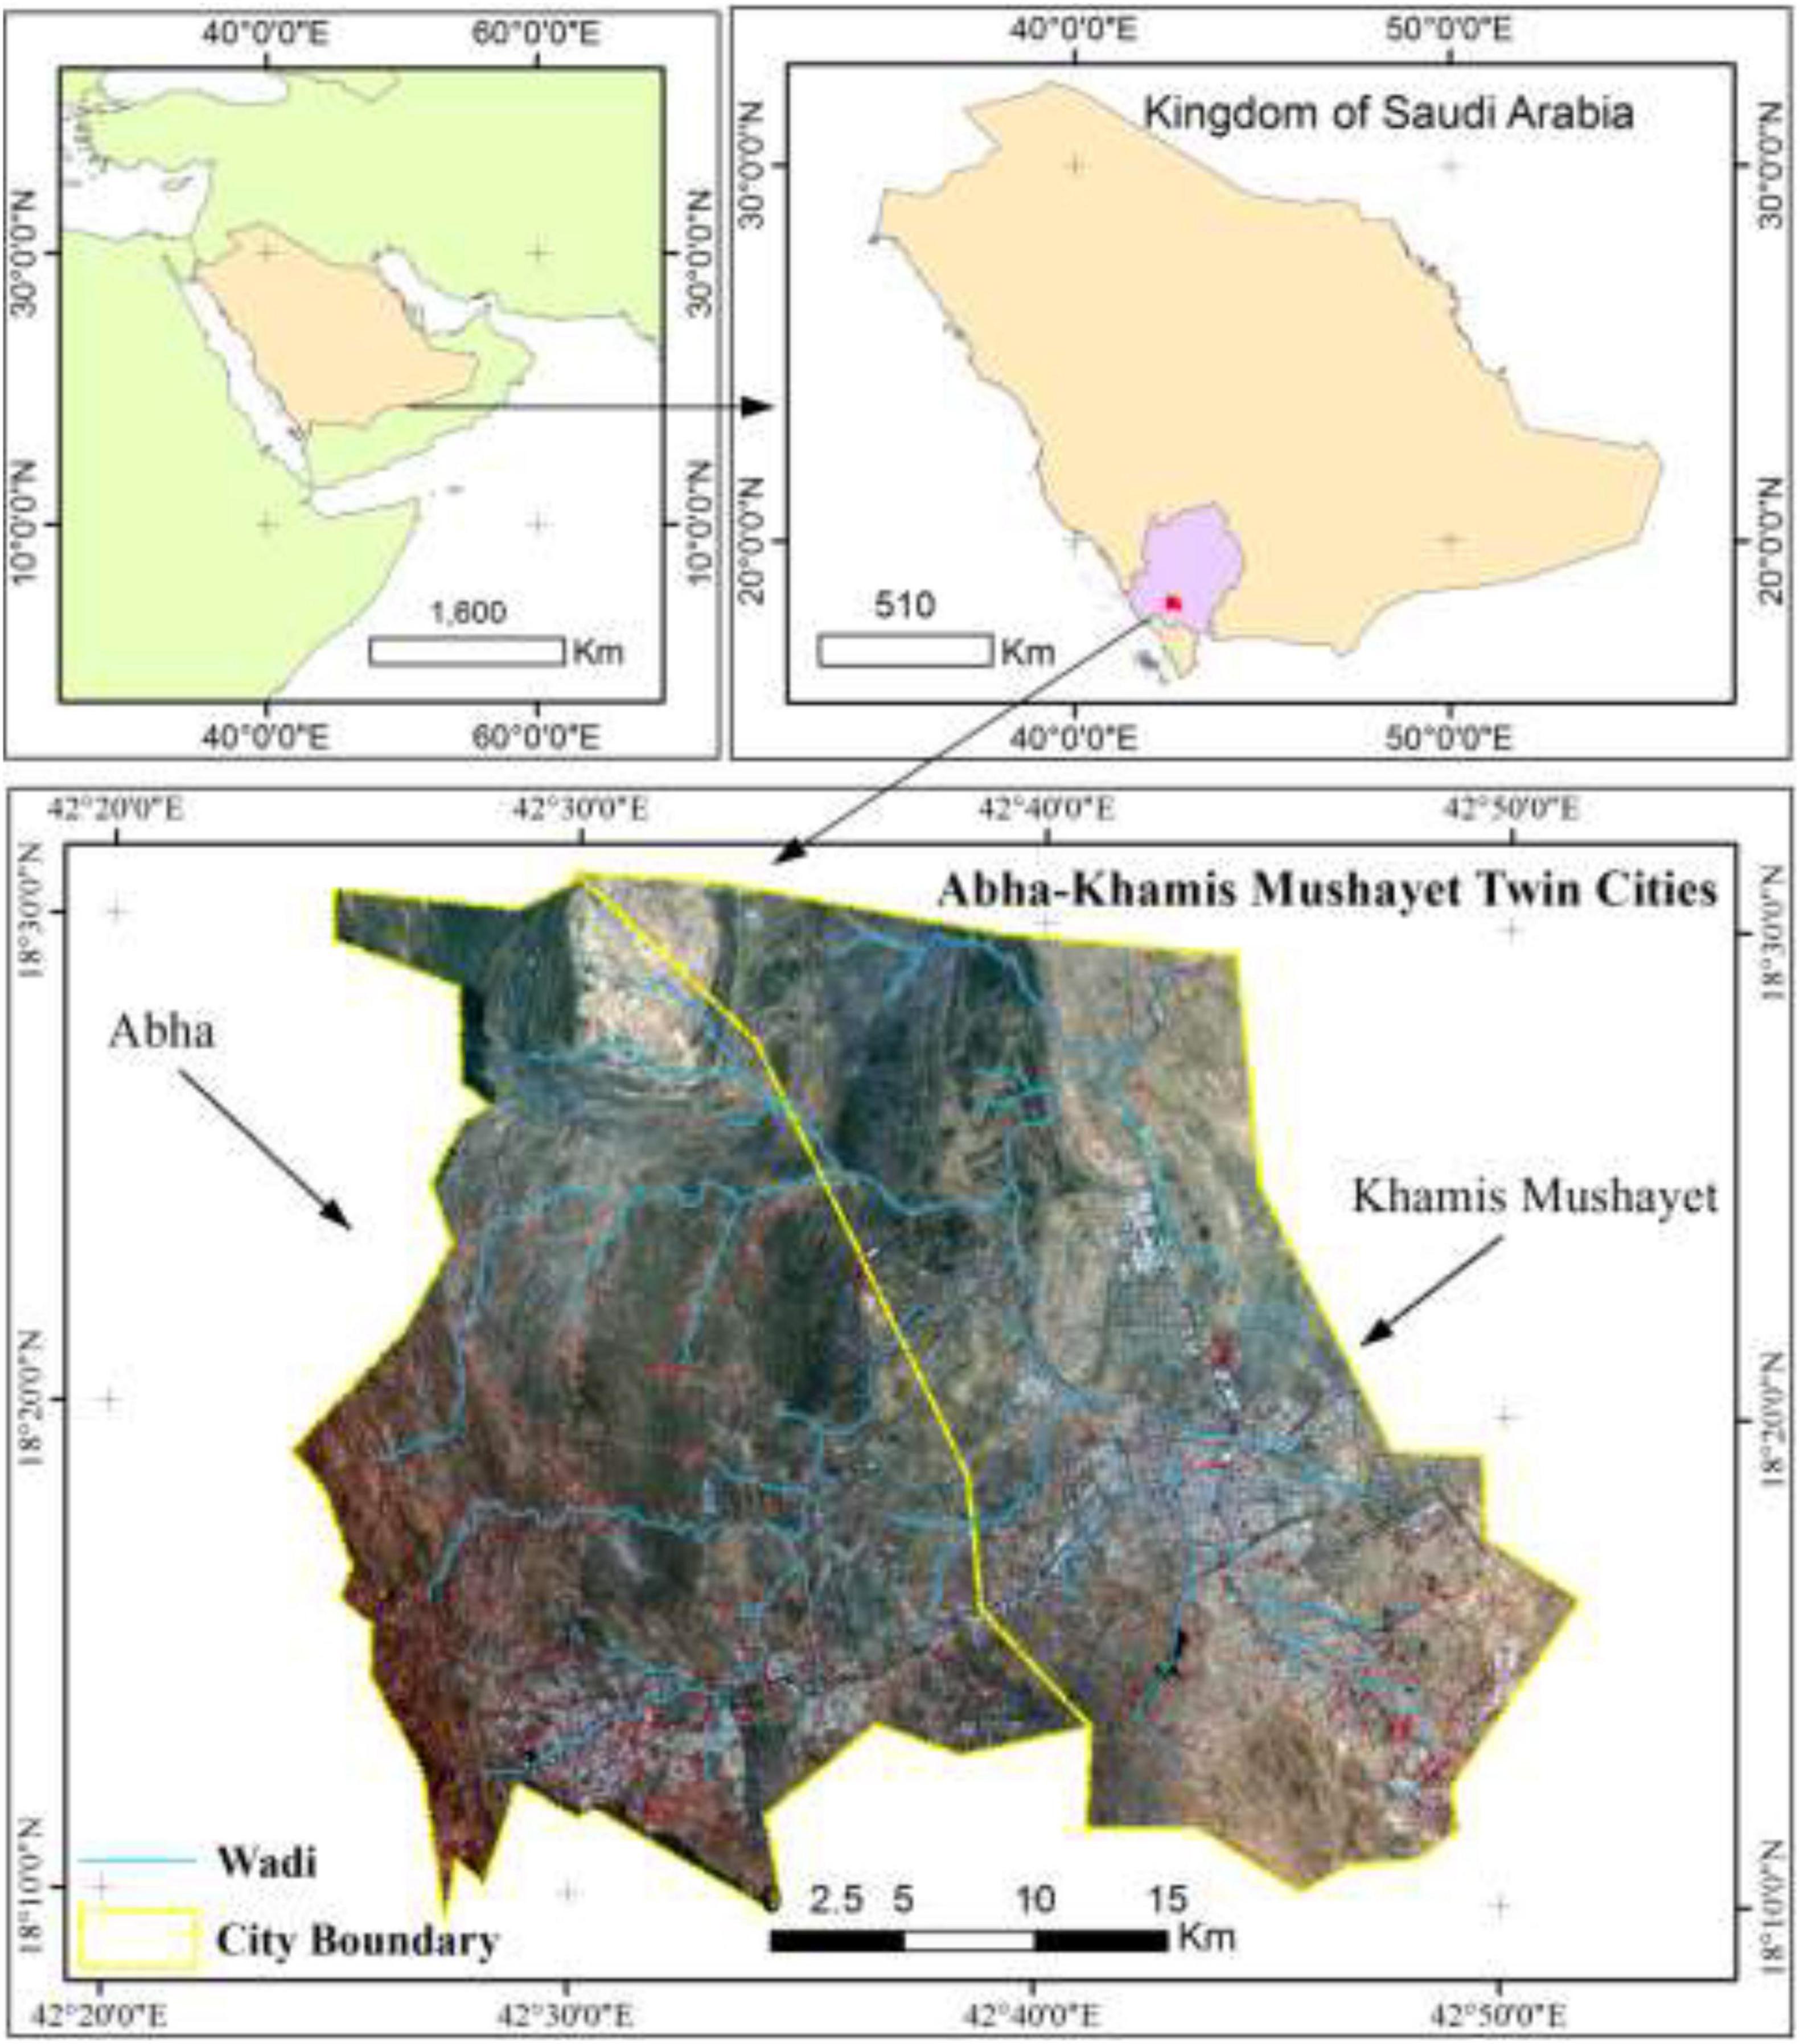
Figure 1. Study area.
The data gleaned was divided into auxiliary information and satellite images. We used satellite images to examine temporal variations and construct the study region’s LULC and carbon storage maps. The training and testing datasets were created using auxiliary data. A topographic map [Abha (West) Sheet 4218-32] and Google Earth data were among the auxiliary data. The toposheet was from 1975 and had a scale of 1:50,000. The sheet was scanned and converted to a digital map, which was saved in .jpg format. The collected G were then geo-referenced and projected to the WGS 1984 Geographic (Lat/Lon) datum. For 1990, 2000, and 2020, data from Landsat 5 TM and 8 OLI (path/row: 138/44 and 138/45, and spatial resolution: 30 m) were acquired from the USGS Earth Explorer website.1 NASA’s Earth Science Data Systems provided the ALOS PALSAR radiometrically terrain corrected (RTC) Digital Elevation Model (DEM) at a spatial resolution of 12.5 m. data. From October to January, these cloud-free satellite images were taken. For these datasets, simple pre-processing of satellite datasets was conducted.
The SVM classifier was used to categorize the LULC maps in this work for the years 1990, 2000, and 2020. Because it is one of the most adaptable and accurate supervised classifier alternatives, the SVM beat other classifiers such as fuzzy logic, radial basis function, neural network, and random forest (Talukdar et al., 2020). Because of its unique ability to extract conclusions even with limited training data, SVM is a supervised, non-linear, non-parametric classification method often used in remote sensing (Talukdar et al., 2020). Melgani and Bruzzone (2004) classified AVIRIS hyperspectral data with SVMs and compared their results to those obtained with radial basis function neural networks and the K-nearest neighbor classifier. SVMs outperformed the other approaches, indicating that they are a valid and effective alternative to standard pattern recognition algorithms for remote sensing data, according to the researchers (Talukdar et al., 2021). Ibrahim Mahmoud et al. (2016) have utilized the approach to track urbanization in Abuja, Nigeria. Schneider (2012) evaluated the maximum likelihood classifier (ML), decision tree (DT), and SVM algorithms for tracking land change in urban and peri-urban areas using Landsat satellite data. The DT and SVM classifiers beat the ML classifier in terms of overall accuracy in this investigation. Waske (2014) compared SVM classification results to those of other algorithms like DT and ML. According to the findings, SVMs exhibited the highest overall accuracies of all approaches when categorizing multispectral data formulations based on SVM, on the other hand, are not without problems. The most important issue is kernel selection. Despite this drawback, SVMs are more widely used than traditional techniques and produce more accurate classification results (Tehrany et al., 2014; Lamine et al., 2018; Parida and Mandal, 2020). The theoretical background of the SVM is described as follows:
The SVM algorithm is a non-parametric machine learning technique that classifies data based on statistical learning (Talukdar et al., 2020). It uses the structural risk minimization (SRM) idea, which separates and maximizes the hyper-plane and data points closest to the hyper-spectral plane’s angle mapper (SAM). It also uses a hyper-spectral plane to split the data points into many groups. The vectors guarantee that the margin width is maximized during this operation (Lamine et al., 2018). Multiple continuous and categorical variables, as well as linear and non-linear samples in many classes, are supported by the SVM. Support vectors are the training samples that demarcate the margin or hyper-plane of SVM (Singh et al., 2014).
To explore the LULC dynamics, the post-category or delta change (move tabulation) method was used in conjunction with the MOLUSCE plug-in in QGIS software (Mallick et al., 2021). These post-type alteration detection algorithms are generally based on pixel-to-pixel analysis, which computes the quantity and geographical distribution of LULC class changes. The Markov version was used to assign LULC changes from t to t + 1. It implies that the range of pixels was expected to convert from any LULC class to any other at some point throughout the specified range of tine units. The following matrix p was proposed for the depiction of chances:
where p represents the probability of transition from i to j.
An artificial neural network (ANN) captures complicated interactions between inputs and outputs. It is a network of connecting nodes inspired by the brain’s neuron simplicity. The neurons or nodes operate in parallel to categorize the incoming data. Input, hidden layers and output are the three layers of an ANN. Each layer contains neurons depending on the network’s use. In the next layer, each neuron is directly coupled to another. Weighted connections reflect the intensity of incoming signals (Varoonchotikul, 2003). The network to use for an ANN application depends on the issue and data availability. The multilayer perceptron (MLP) is perhaps the most used network in hydrological modeling (Bindajam et al., 2021). There are three layers in MLP: input, processing (hidden) layer (two hidden layers are used in complicated topologies), and output. The ANN-MLP was used to simulate transitional probability in this investigation. Land use transitional probability-conditioning parameters for 2000, and 2020 LULC maps were constructed. QGIS 3.2 used the Euclidean distance tool on the retrieved data to compute proximity parameters.
The CA comprises identical components, such as cells, arranged in a regular and defined area. CA’s fundamental premise is that each cell or pixel’s LULC change may be investigated by its present condition and changes in its neighbors. This combines the transformation rule with the Markov model. Transform rules clarify the possibility of considering initial and subsequent situations. The CA–Markov model builds a cell or pixel’s situation from its beginning state, nearby cell or pixel circumstances, and transition rules. Given the proximity concept, this shows the difficulty of transition, favoring LULC groups’ separation for locations next to present LULC areas. The CA–Markov model predicts complicated spatiotemporal patterns using a set of transformation principles. The program employs ANN-based suitability maps for each kind of LULC to provide accurate future predictions.
Terrestrial ecosystems now store four times more carbon than the atmosphere and are vital in reducing the effects of climate change. Changing land cover because of logging, fire, or deforestation may affect carbon storage. Protecting terrestrial carbon supplies requires land management practices (Eastman, 2015). Aboveground biomass, subsurface biomass, soil organic matter, and dead organic matter (Penman et al., 2003) all contribute to the amount of carbon stored in a terrestrial parcel. Each of these sources has separate sections that store carbon. Leaves and seeds are examples of aboveground biomass (living biomass top of the soil surface). Belowground biomass comes from subterranean roots’ living biomass. Soil organic matter comprises microbial biomass, fresh and partly digested wastes, and humus. Dead or particulate organic matter comprises soil and leaf litter (Eastman, 2015). The InVest software uses a simplified carbon cycle to predict carbon storage and degraded biomass in woody areas (Eastman, 2015). ESM needs raster land cover maps and a database of carbon pools (*.csv) that match column codes (Eastman, 2015; Wang et al., 2018).
The following definitions of stored carbon and precipitated carbon help distinguish between the two terms. Short-term stored carbon is the quantity of carbon in each carbon pool, while long-term stored carbon is the amount (Eastman, 2015). To map the carbon stored in the study area, the amount of carbon stored in four major carbon pools for all land cover classes must be determined. Data from elevation classes, human disturbances, and landscape dynamics may be helpful here (Eastman, 2015). The techniques resulted in three maps, as shown below: carbon sequestered (Mg), total carbon sequestered per acre, and their valuation.
Comparing present and projected land cover carbon yields the amount. It shows the amount of carbon sequestration, with positive numbers signifying sequestration and negative values representing carbon emitted into the atmosphere.
The existing land cover and the market price of carbon calculate the present value of carbon stored in the landscape in dollars.
For each pixel of the T1 (present) to T2 (future) land cover scenario, the value of sequestered carbon is shown in USD or other currencies.
The ESM model can expect net changes in carbon stock using current and future land cover maps. This method will determine the total amount of carbon sequestered throughout the study period and its economic value (Eastman, 2015).
There are four carbon pools: above, below, soil, and dead. Due to a shortage of carbon data, the IPCC report provides carbon density statistics. Determining the carbon capture densities of carbon pools that can be employed to sustain the carbon sequestration of forest landscapes in each grid is also disregarded. In this study, the IPCC data were utilized instead of calculating each land cover class’s biomass carbon stock.
Data from prior literature and data collection utilizing half-life of wood product to determine average decay rate are included in the IPCC report on climate change. Chapter HWP of the 2006 IPCC Guidelines for National Greenhouse Gas Inventories report introduces suitable techniques for calculating carbon stored in wood, such as decay rate and half-life. If the wood is utilized to make other items, the slowest half-life should be chosen (Twisa et al., 2020).
In this study, we utilized the SVM model to classify the LULC based on the training sample and layer stacked input variables. We used C-support vector classification to run the model. The SVM is executed with the parameters of; the penalty parameter (C) of 1, Nu of 0.5, P of 0.5, radial basis function based kernel, coefficient 0 of 1, degree of 0.5, gamma of 1. Based on this optimized parameters, the LULC has been classified for three times, such as 1990, 2000, and 2020 (Figure 2). The LULC has been classified into five classes, such as vegetation (including dense, sparse, and scrubland), cropland, built-up, waterbodies, and bare soil with exposed rock.
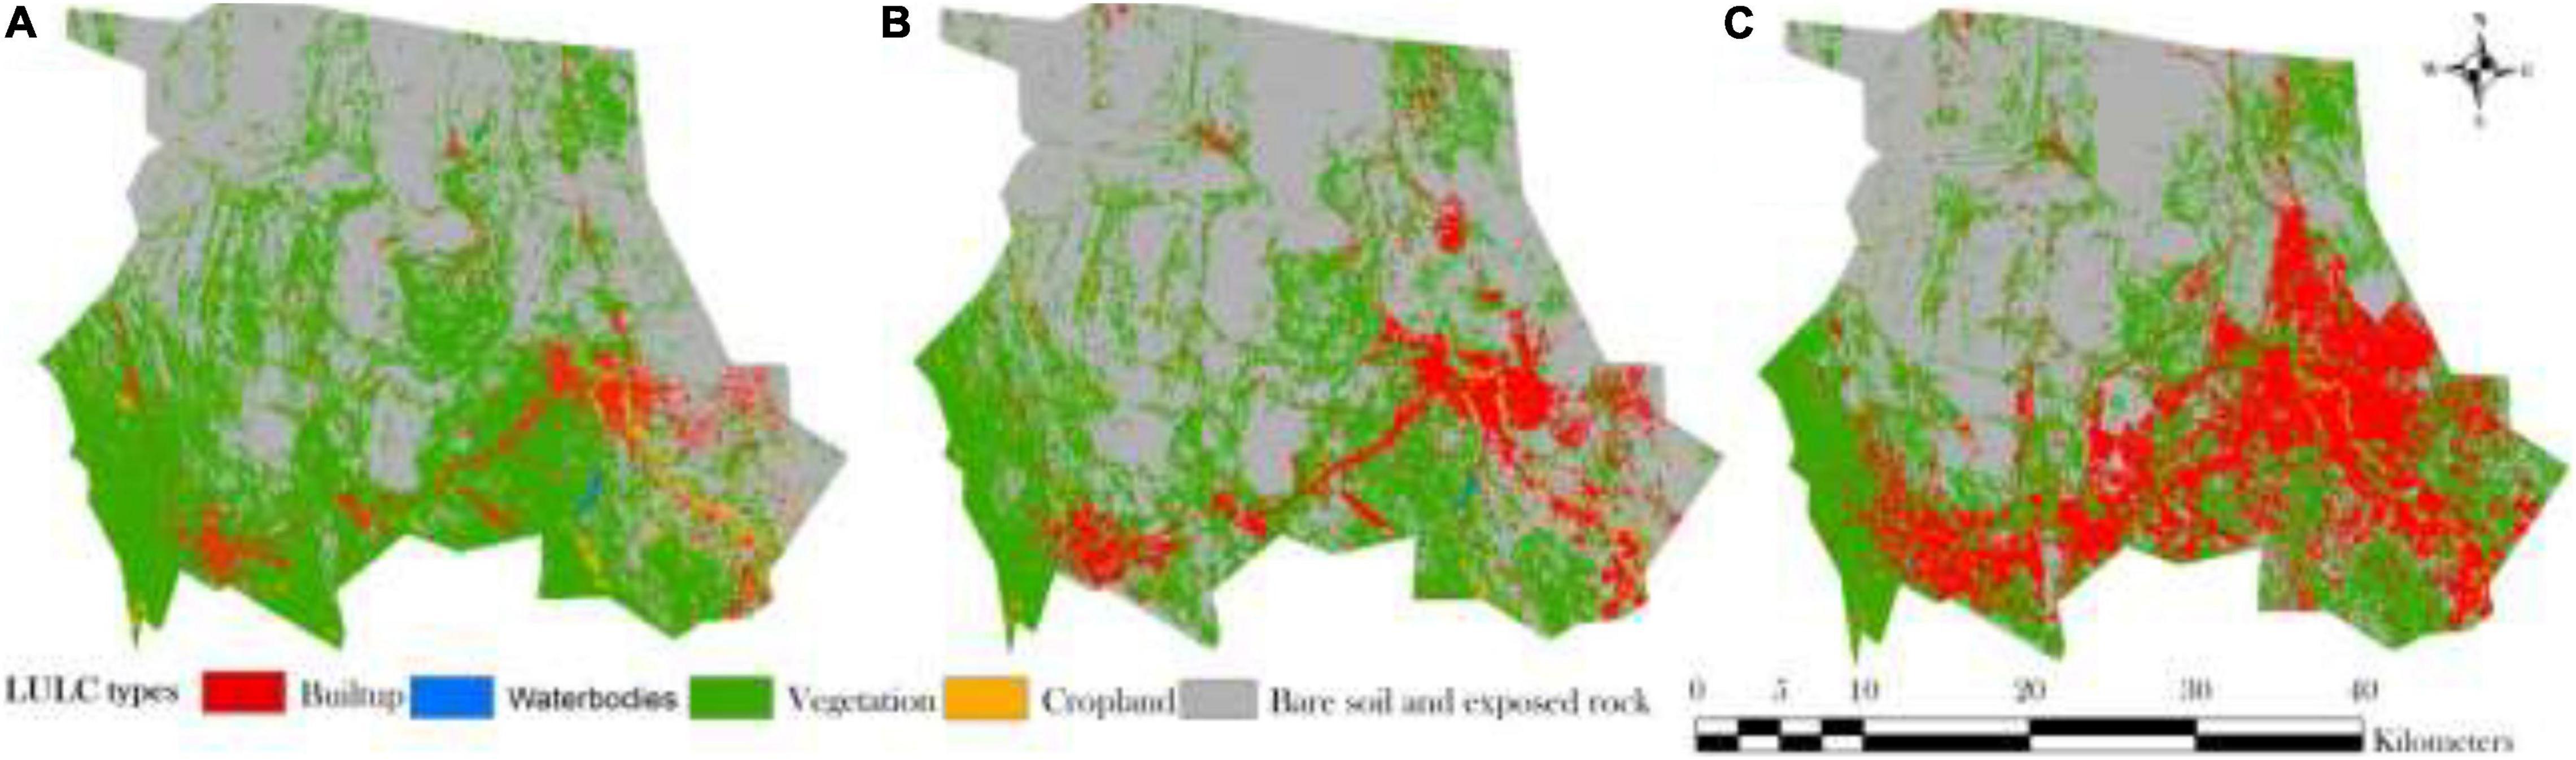
Figure 2. Land use land cover classification using SVM for (A) 1990, (B) 2000, and (C) 2020 of Abha city.
In the present study, the validation of the LULC maps is a most crucial part because of their reliability. The LULC maps were verified using the user, producer, and conditional, overall accuracy, and kappa coefficient. The heatmap was used three times to depict the validation process of each LULC class (Figure 3). Figure 3A depicts the user accuracy of three different LULC classes. It was discovered that the built-up area had a higher user accuracy of 94% in 1990, then 91 and 92% in 2000 and 2020, implying a very satisfactory LULC categorization. Furthermore, in 1990, 2000, and 2020, the water-bodies achieved 92, 93, and 94% user accuracy. In contrast, the lowest user accuracy with vegetation has been recorded by 84%, 90% in 1990, 2000, and 2020.
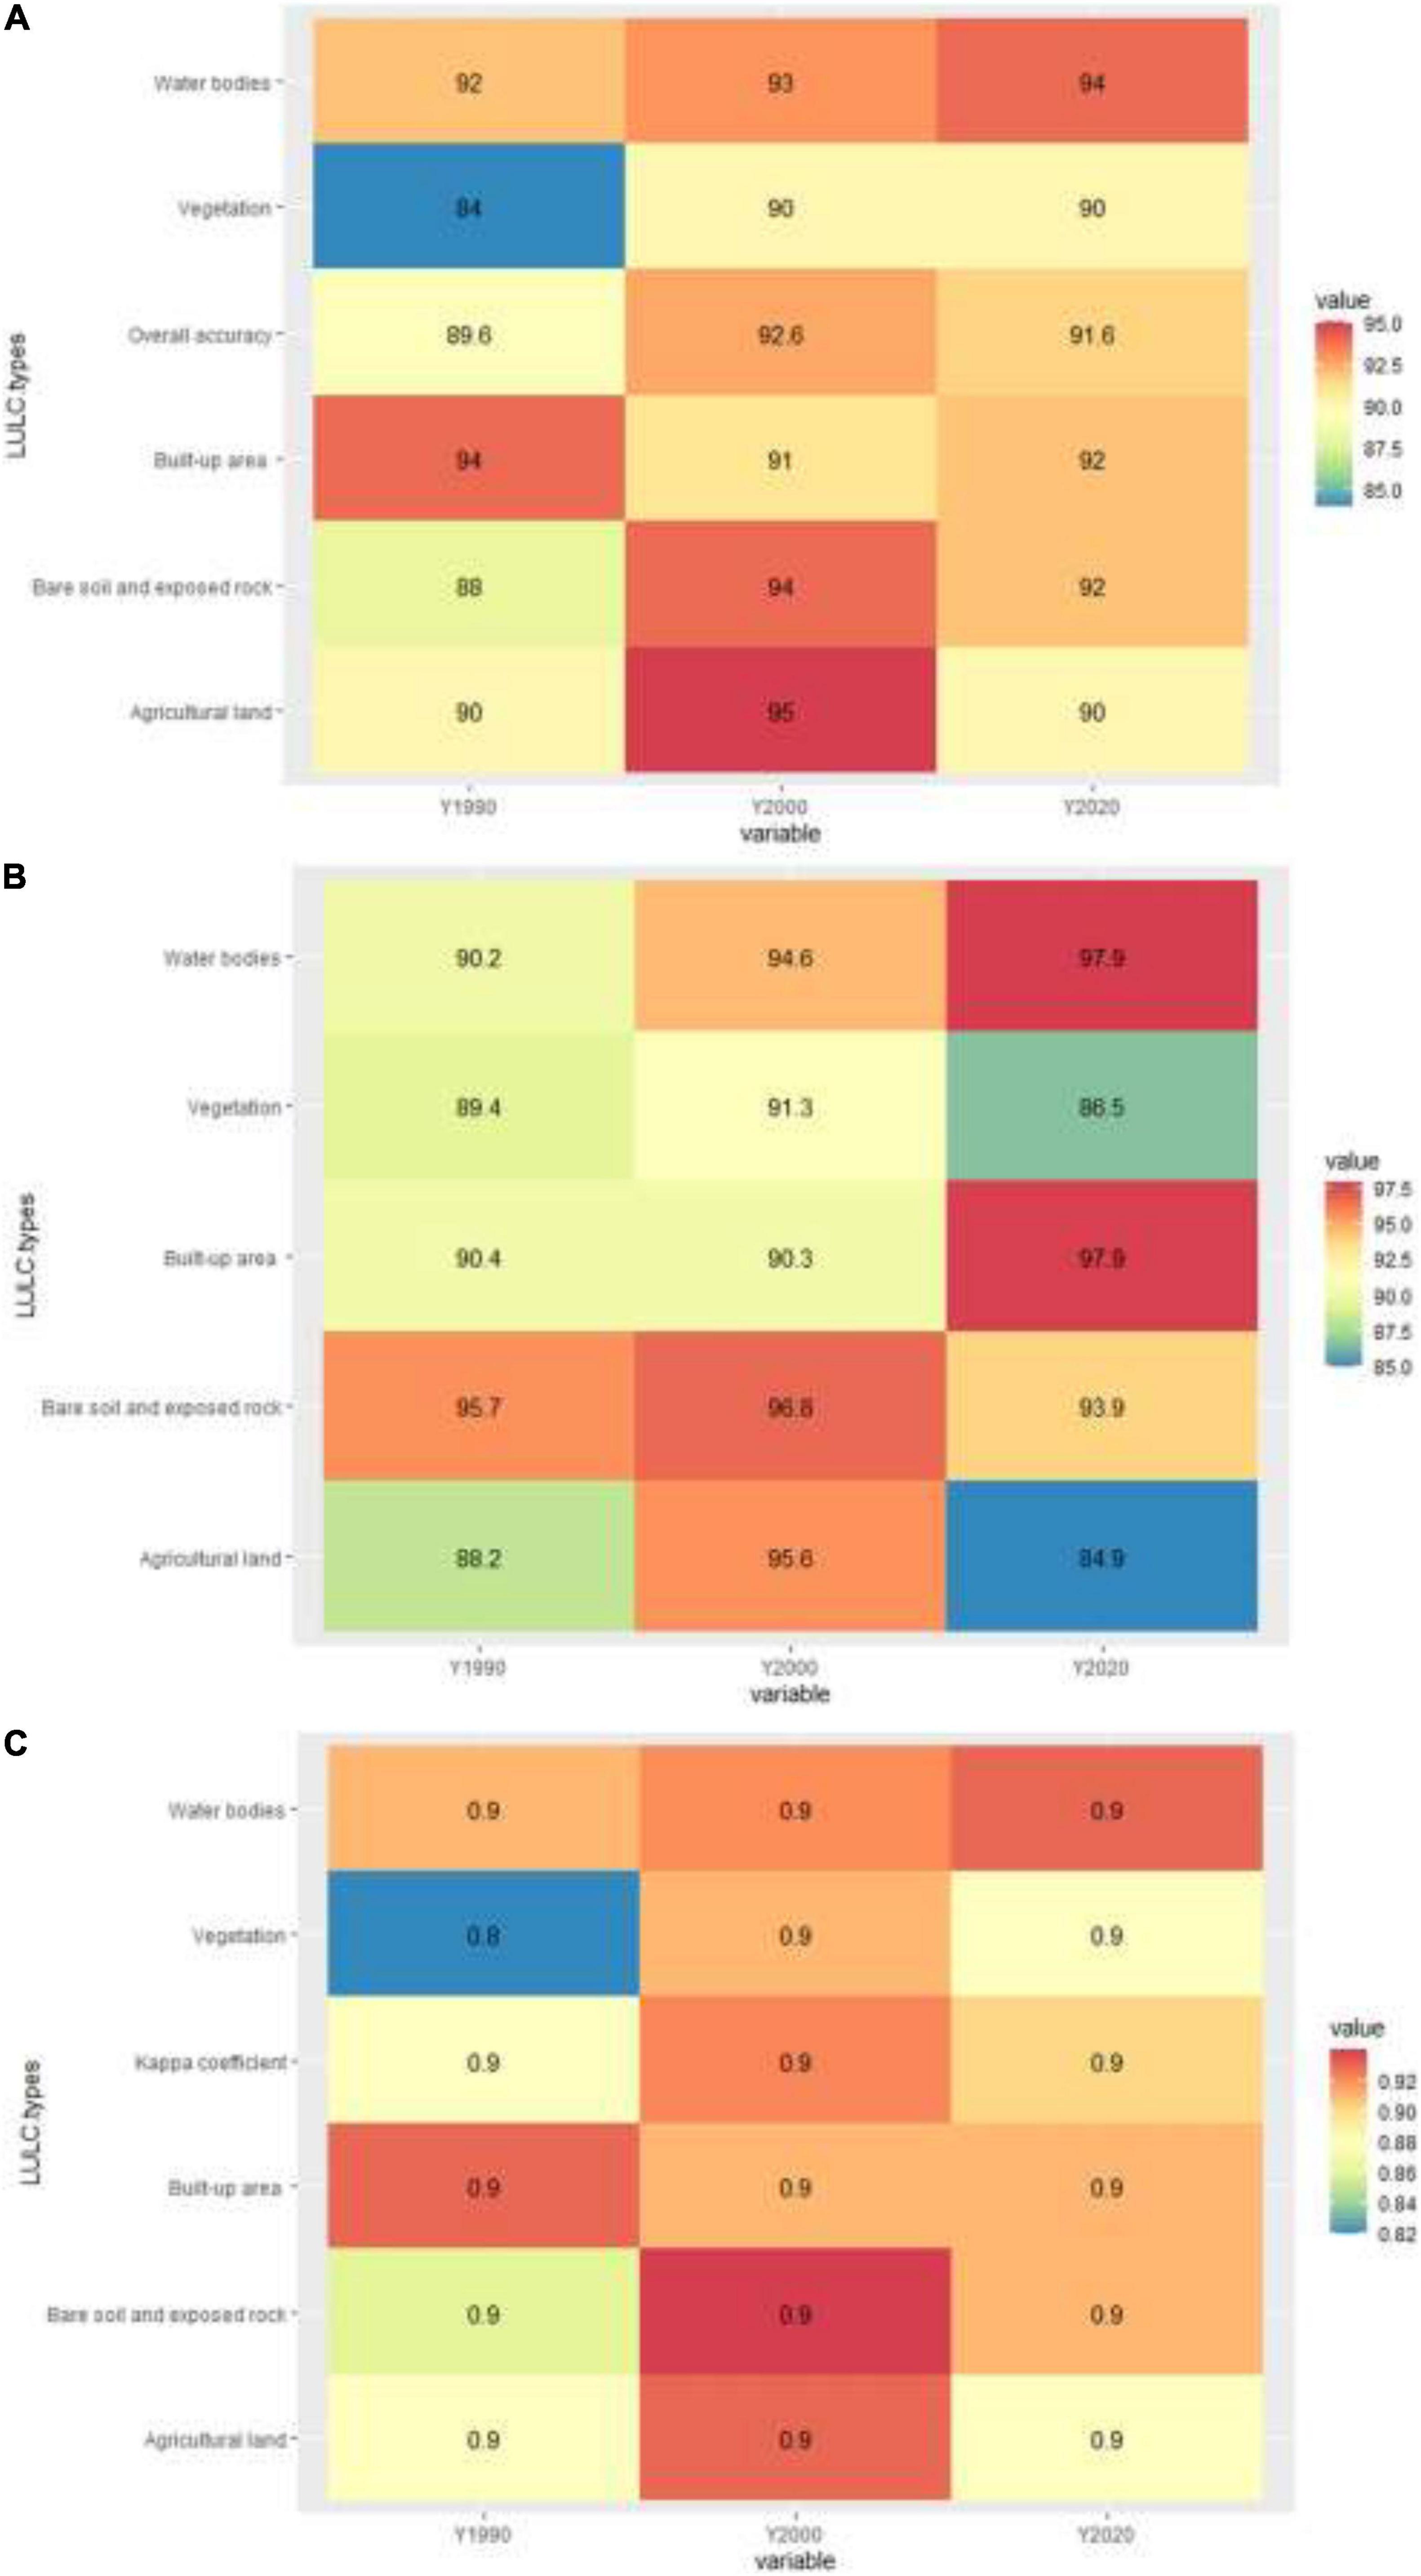
Figure 3. The accuracy assessment of LULC maps of 1990, 2000, and 2018 using (A) user accuracy, (B) producer accuracy, and (C) conditional accuracy with kappa coefficient.
We computed the producer accuracy of each LULC class for three periods (Figure 3B). It revealed that in 1990, bare soil and exposed rock had the greatest producer accuracy of 95.7%, followed by built-up area (90.4%), water bodies (90.2%), vegetation (89.4%), and agricultural land (88.2%). In the year 2000, bare soil and exposed rock earned the greatest producer accuracy of 96.8%, followed by agricultural land (95.6%), water bodies (94.6%), vegetation (91.3%), and built-up area (91.3%) (90.3%). Furthermore, in 2020, water bodies and built-up areas had the greatest producer accuracy (97.9%), followed by bare soil and exposed rock (93.9%), vegetation (86.5%), and agricultural land (84.9%).
Figure 3C depicts the conditional accuracy of each LULC class of three time periods. It revealed that in 1990, water bodies, built-up areas, bare soil, exposed rock, and agricultural land had a conditional accuracy of 0.9. In comparison, vegetation had a conditional accuracy of 0.8. The kappa coefficient of the 1990 LULC map was 0.9, showing that the LULC map was highly accurate. In 2000 and 2020, all LULC classes had a conditional accuracy of 0.9, including the kappa coefficient. As a result, all LULC maps could be accurate because of the robust performance of the SVM model.
From 1990 to 2018, the region covered by LULC maps was determined. We prepared a Sankey diagram to show the dynamics of LULC maps for 1990–2020 (Figure 4). According to the 1990 LULC map, most areas of the study area are covered by bare soil and exposed rock (61,897.05 ha), followed by vegetation (55,983.06 ha), built-up (6237.36 ha), crops (2809.8 ha), and water-bodies (135.99 ha) (Figure 4A). The bare soil and exposed rock covered most of the study area (72,837.27 ha) with the LULC of 2000, followed by vegetation (41,380.56 ha), built-up area (10,503.63 ha), farmland (2220.12 ha), and water-bodies (112.68 ha). The 2018 LULC map contained 57,058.47 ha of bare soil and exposed rock, followed by vegetation (41,529.78 ha), built-up area (27,124.92 ha), crops (1769.76 ha), and water-bodies (52.02 ha). Consequently, in the previous 28 years, the built-up area has risen substantially in southeastern, extreme southern, and some part of southwestern parts of the study area, this due to the economic and commercial hub, and also the suitable homogenous land.
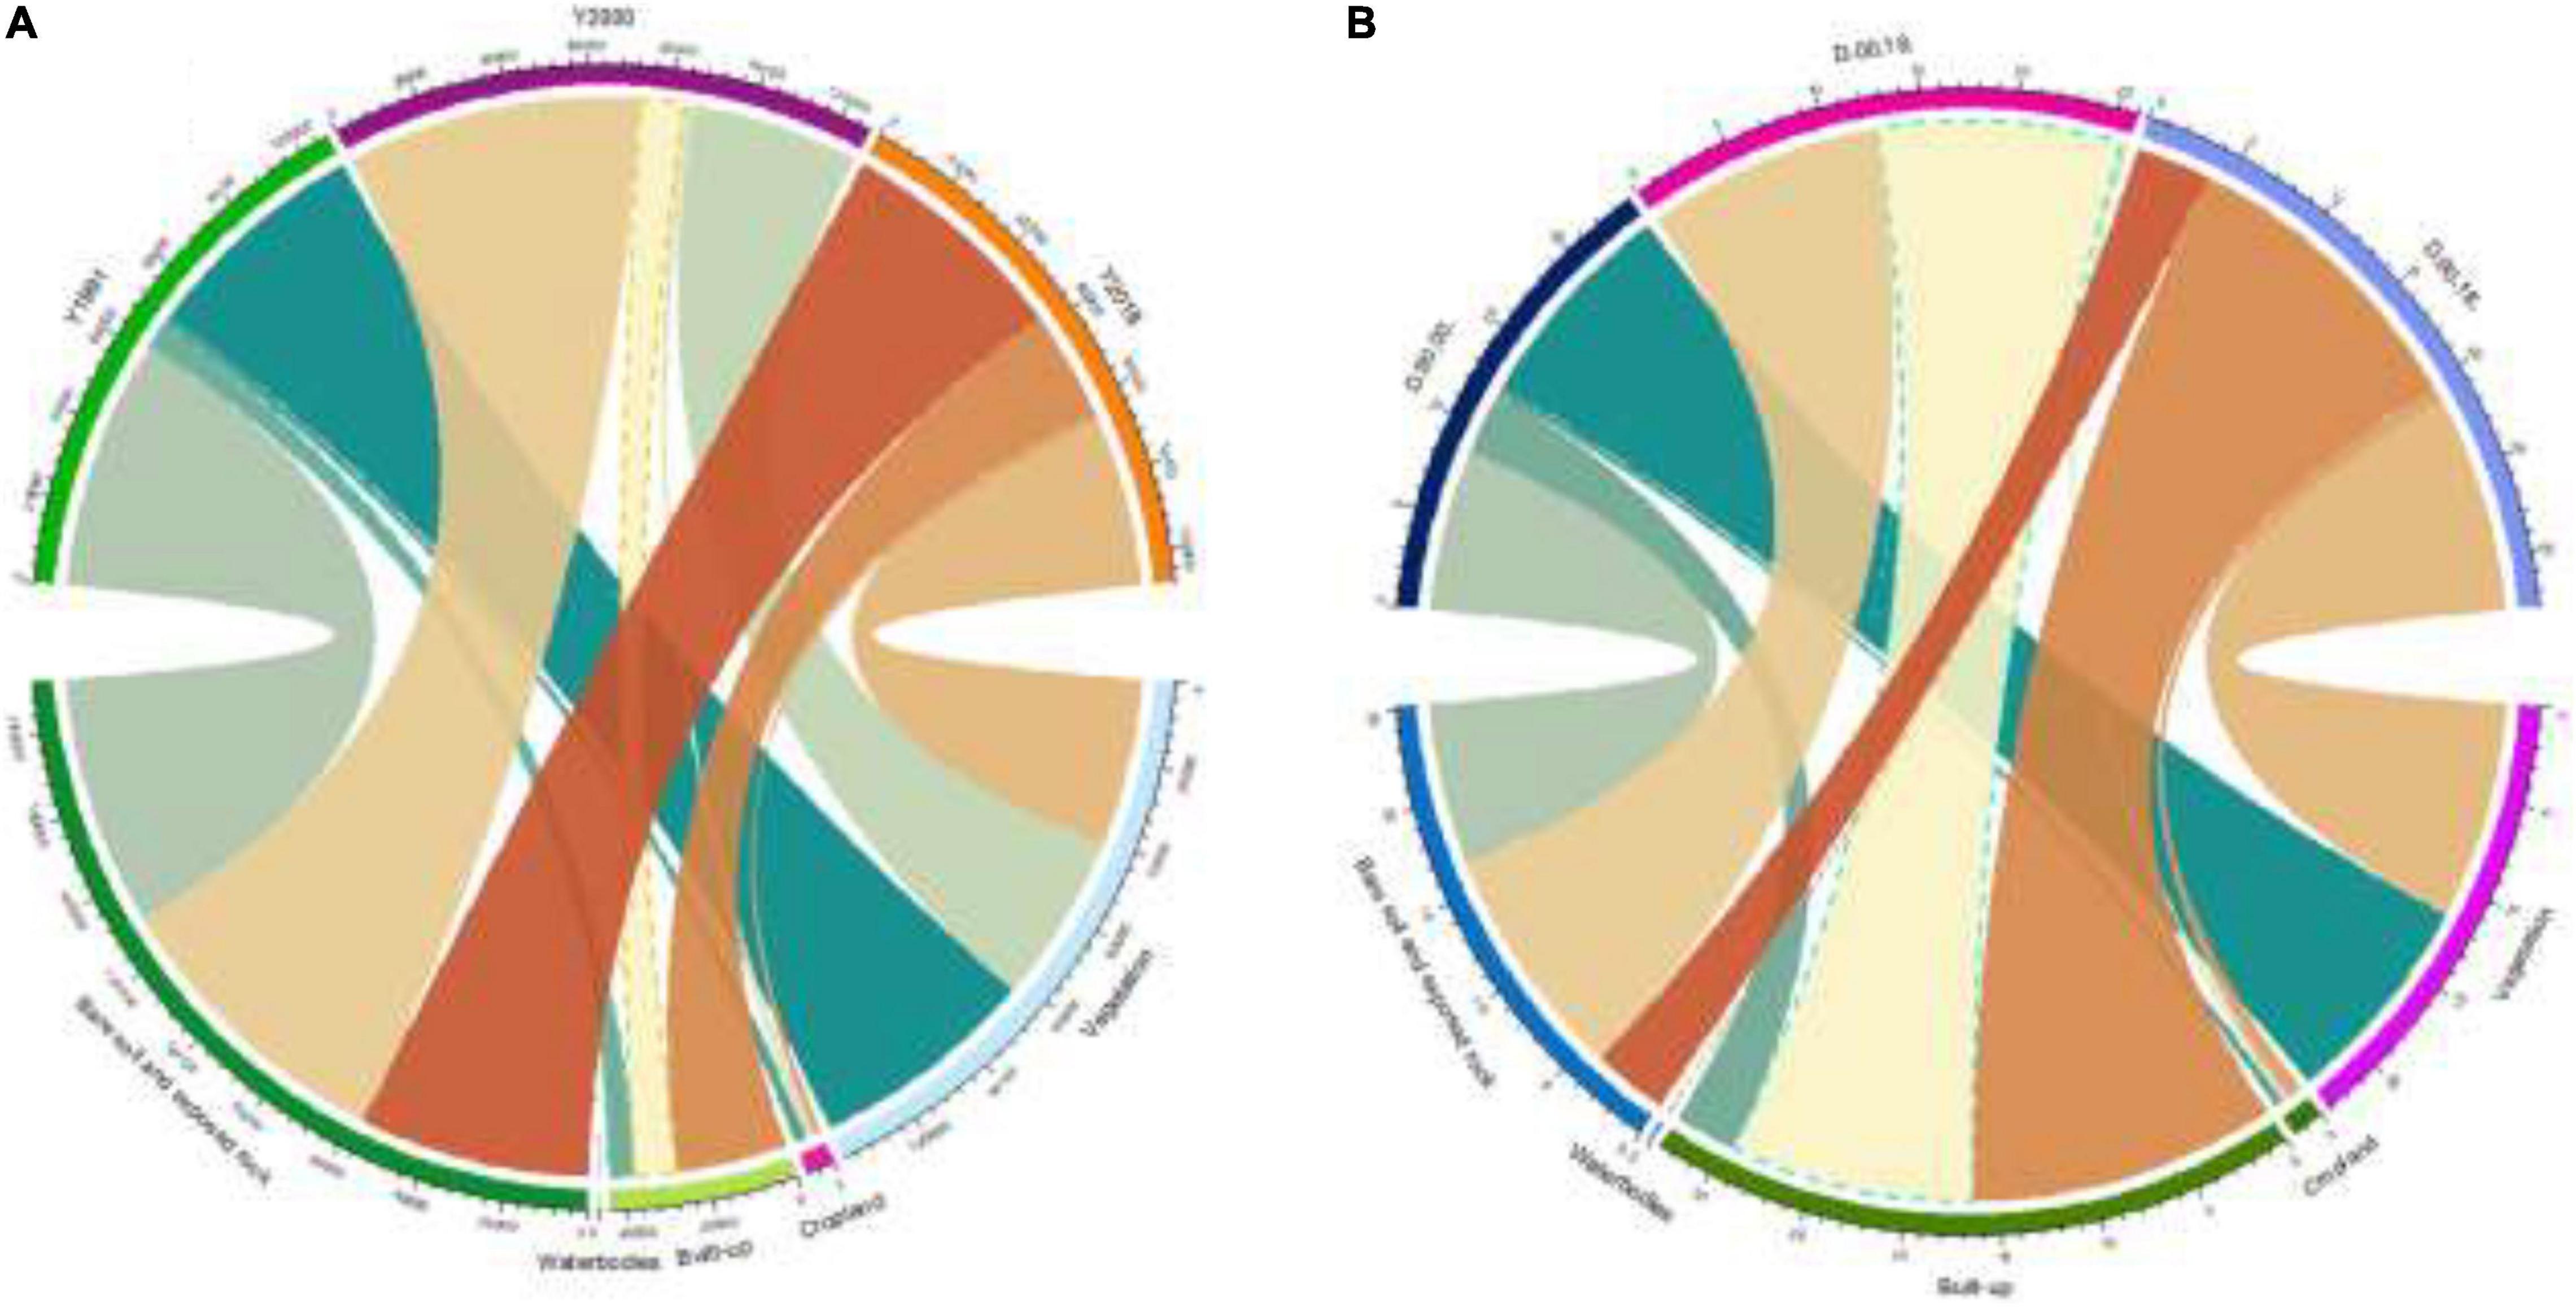
Figure 4. Land use land cover dynamics analysis during the period of 1990–2020 using (A) absolute change, and (B) delta change (%).
The present study also computed the LULC change using delta change rate (%) from 1990 to 2020 and presented it in the Sankey diagram (Figure 4B). During 1990–2000, the results showed that the vegetation had lost 11.49% area, followed by cropland (0.46%) and water-bodies (0.02%). The built-up area has gained 3.36% area, followed by bare soil and exposed rock (8.61%) during the same period. Similarly, the built-up area has gained a significant area by 13.03% during 2000–2018 because of the urbanization process. While the bare soil and exposed rock have lost 12.57% area during the same period and other land-use types have lost very insignificant area. From 1990 to 2018, we observed that the built-up area had gained 16.4%. While, the vegetation has lost 11.54% area, followed by bare soil and exposed rock (3.97%) and cropland (0.82).
A markovian transitional probability matrix was used to assess the LULC change trend objectively. It represents the likelihood that each cell in a land-use category will be converted to another land-use type. We computed the transitional probability matrices for the LULC of 1990–2000, 2000–2020, and 1990–2020. An alluvial map showed the LULC transition throughout different periods (Figure 5). Figure 5A shows an alluvial plot of the transitional probability matrix between the LULC maps of 1990 and 2000. Each land-use class has a probability value of 100%; how much transition value has gone to other land uses is computed for five layers, corresponding to five LULC classes. Exposed rock (located in the value range of 0–100 and represented by watermelon color), bare soil (represented by deep brown color), and vegetation (represented by violet color) in Figure 5 had 87.69, 81, and 4.9% of likelihood to be changed. Similarly, water bodies (with values ranging from 100 to 200) may retain 66.71% of their area (represented by orange color), while flora (violet color) can gain 23.56% of their area, followed by bare soil and exposed rock (3.84%). Furthermore, built-up area (value range 200–300, depicted by light blue) may keep 74.67% of its area. Cropland, on the other hand (placed in the value range of 300–400 and represented by light green color), can maintain 29.88% of its area, from which flora may gain 46.8%, followed by bare soil and exposed rock (18.28%). Finally, vegetation (placed in the 400–500 value range and represented by violet color) may maintain 62.51% of its area, while bare soil and exposed rock can acquire 30.61%.
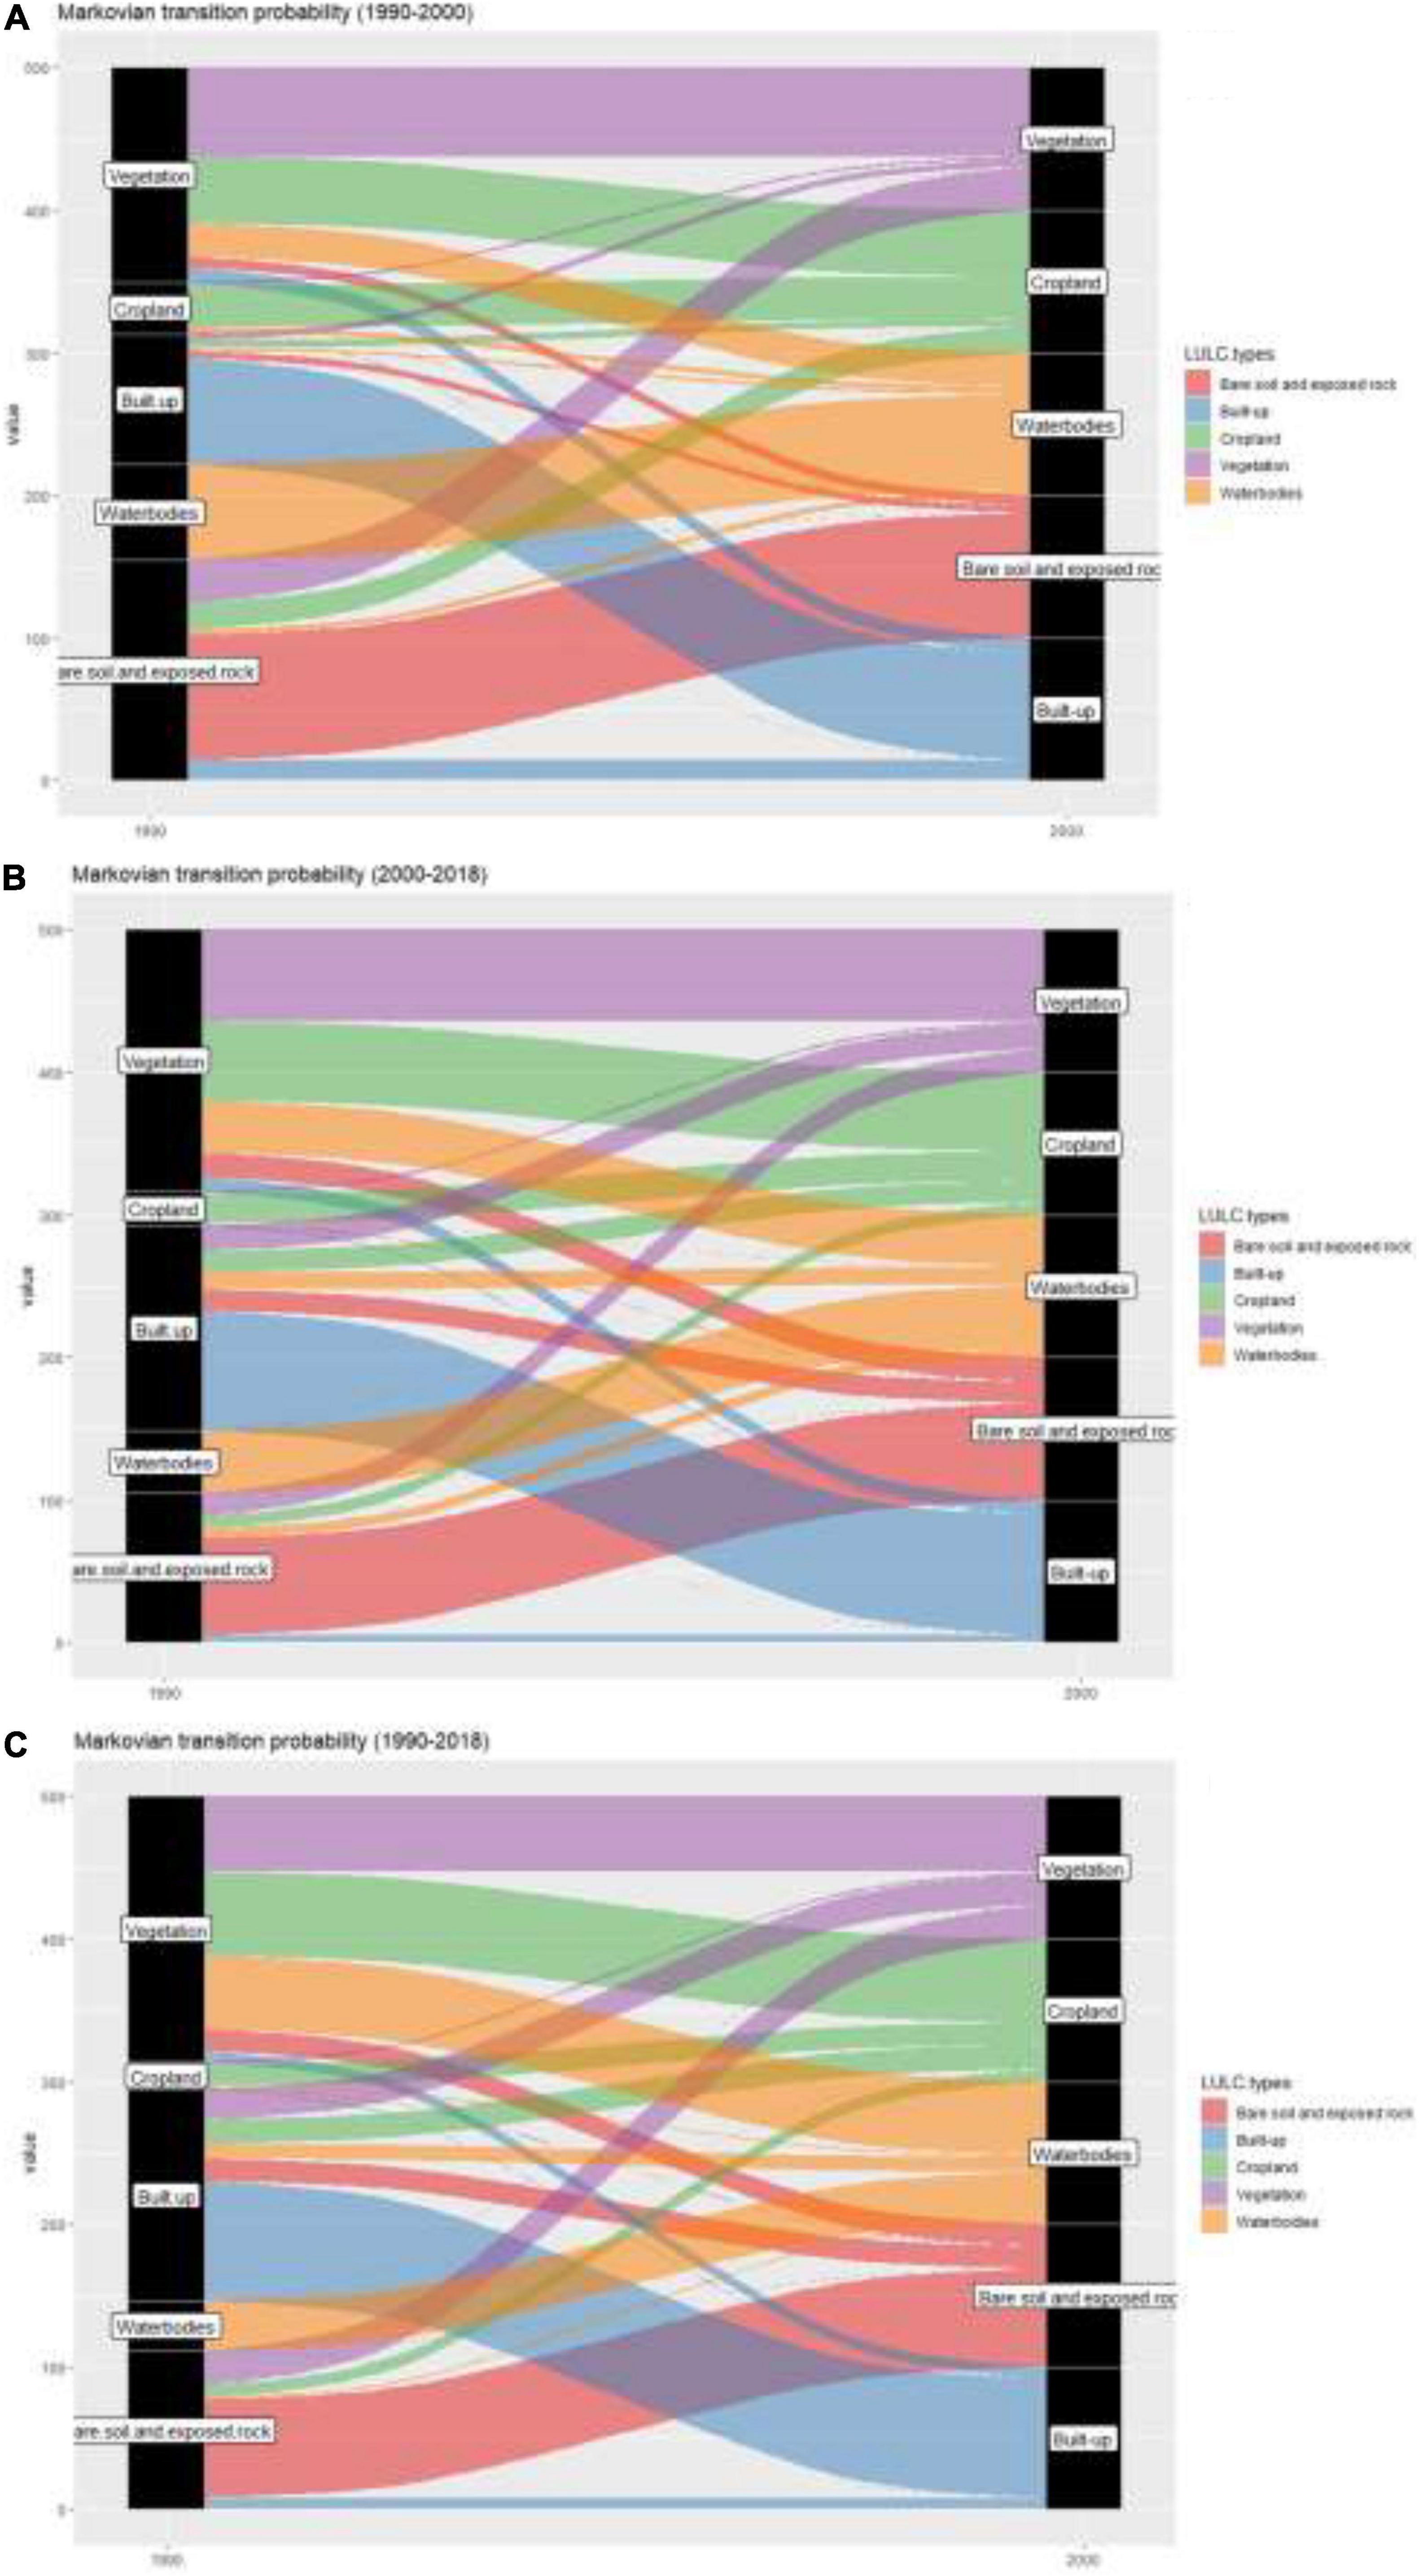
Figure 5. A markovian transitional probability analysis for LULC dynamics for the period of (A) 1990–2000, (B) 2000–2020, and (C) 1990–2020.
During the period 2000–2020, exposed rock in Figure 5B (placed in the value range of 0–100) has 67.77% stability, with 16.87% of its area capable of transforming into vegetation, followed by built-up areas (14.77%). While water bodies (with values ranging from 100 to 200) may keep 43.77% of their area, vegetation and built-up areas gain 36.34 and 12.38% of their area, respectively. In addition, built-up area (value range 200–300) may retain 83.73% of its area. Cropland, on the other hand (valued between 300 and 400), may retain 20.69% of its area, from which vegetation can acquire 55.68%, followed by built-up areas (15%). Finally, vegetation (valued between 400 and 500) may keep 64.6% of its area, while built-up areas can take 17.26%.
During the period 1990–2020, exposed rock in Figure 5C has 68% stability, with 15.63% of its area capable of transforming into built-up, followed by vegetation (15.13%). While water bodies may keep 35.1% of their area, vegetation and built-up areas gain 51.6 and 10.5% of their area, respectively. In addition, built-up area may retain 83.6% of its area. Cropland, on the other hand, may retain 15.3% of its area, from which vegetation can acquire 58.85%, followed by built-up areas (17.2%). Finally, vegetation may keep 53.2% of its area, while built-up areas can take 20.88%, followed by bare soil and exposed rock (24.2%).
Based on the carbon storage model findings for three periods (1990, 2000, and 2020), forest land had the greatest carbon stock with 12.69 Mg H, followed by cultivated land with 3.15 Mg C, and wetlands area had the lowest with 1.26 Mg C, followed by built-up area (2.97 Mg C). The carbon stock distribution between 2000 and 2020 was quite comparable, with 12.69, 3.15, 1.26, and 2.97 Mg C, respectively (Figure 6). However, the carbon stocks have altered as a result of the LULC adjustment. The vegetation cover of the study area has 710,425 Mg C in 1990, 525,119.3 Mg C in 2000, and 527,012.9 Mg C in 2020. On the other hand, built-up area has 18,524.96 Mg C in 1990, which increased to 31,195.78 Mg C in 2000, and 80,561.01 Mg C in 2020. During 1990–2000, carbon storage of 12.69 Mg C lost 11.5% of its area, followed by farmland with 3.15 Mg C (0.46%) and water bodies with 1.26 Mg C (0.02%). The built-up area increased by 3.36%, and carbon storage decreased from 12.69 and 3.15 to 2.97 Mg C. The significant region does not have carbon storage because of the stony terrain. Similarly, between 2000 and 2018, the built-up area increased by 13.03% because of urbanization, resulting in an enormous loss of carbon storage. During the same period, bare soil and exposed rock lost 12.6% of their area to built-up areas, which witnessed little carbon storage. From 1990 to 2018, the built-up area increased by 16.5%, resulting in a decline in carbon storage because of the conversion of vegetation by 11.54% area and farmland (0.82). According to our estimates, carbon stocks in aboveground biomass were the greatest among the three fundamental carbon pools under varied land coverings. Despite significant disparities in soil carbon stocks among terrestrial land cover types, the quantity of carbon stored in cultivated land was relatively modest when compared to carbon stored in forest biomass. Carbon stores on cultivated land were relatively low as compared to carbon stocks in forest biomass, built-up area, and wetland biomass.
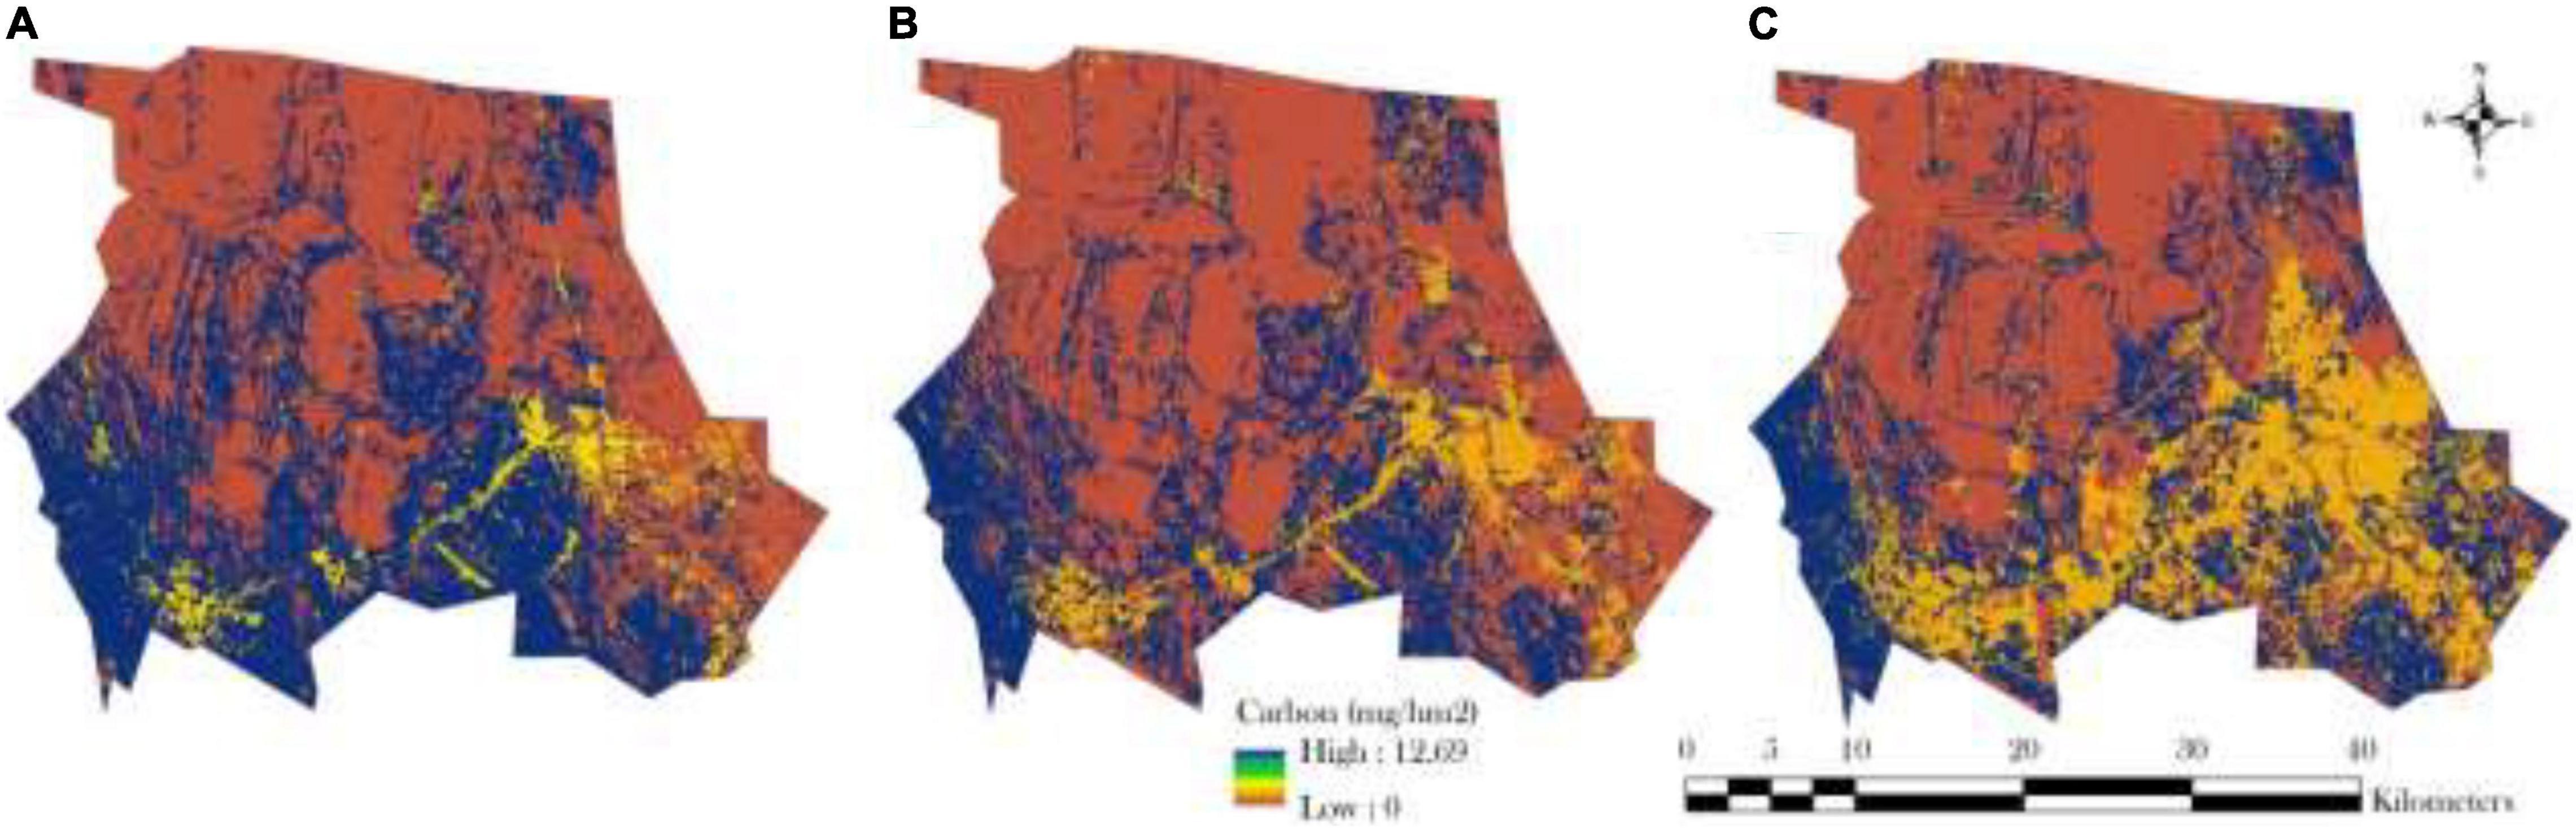
Figure 6. Carbon storage modeling with InVest software for (A) 1990, (B) 2000, and (C) 2020.
In this analysis, we set the price of carbon per metric tonne at US$43. As a result, we valued carbon storage across three time periods (1990, 2000, and 2020) in the current research. In 1990, forest land had the greatest carbon worth of 545.67 million USD, followed by cultivated land with 135.45 million USD, the built-up area with 127.7 million USD, and wetlands area with 2.32 million USD. As a result, the total vegetation of the study area had 30,548,276.35 million USD in 1990, which decreased to 22,580,130.18 million USD in 2000, and 22,661,555.05 million USD in 2020 (Figure 7), while the built-up area had 796,510.872 million USD in 1990, which increased by 1,341,313.551 million USD in 2000, and 3,463,852.284 million USD in 2020. This demonstrated that the constructed environment had increased the carbon value over time. However, according to the scientific explanation, carbon storage and valuation would be greater if the built-up region had more green space rather than just built-up area.
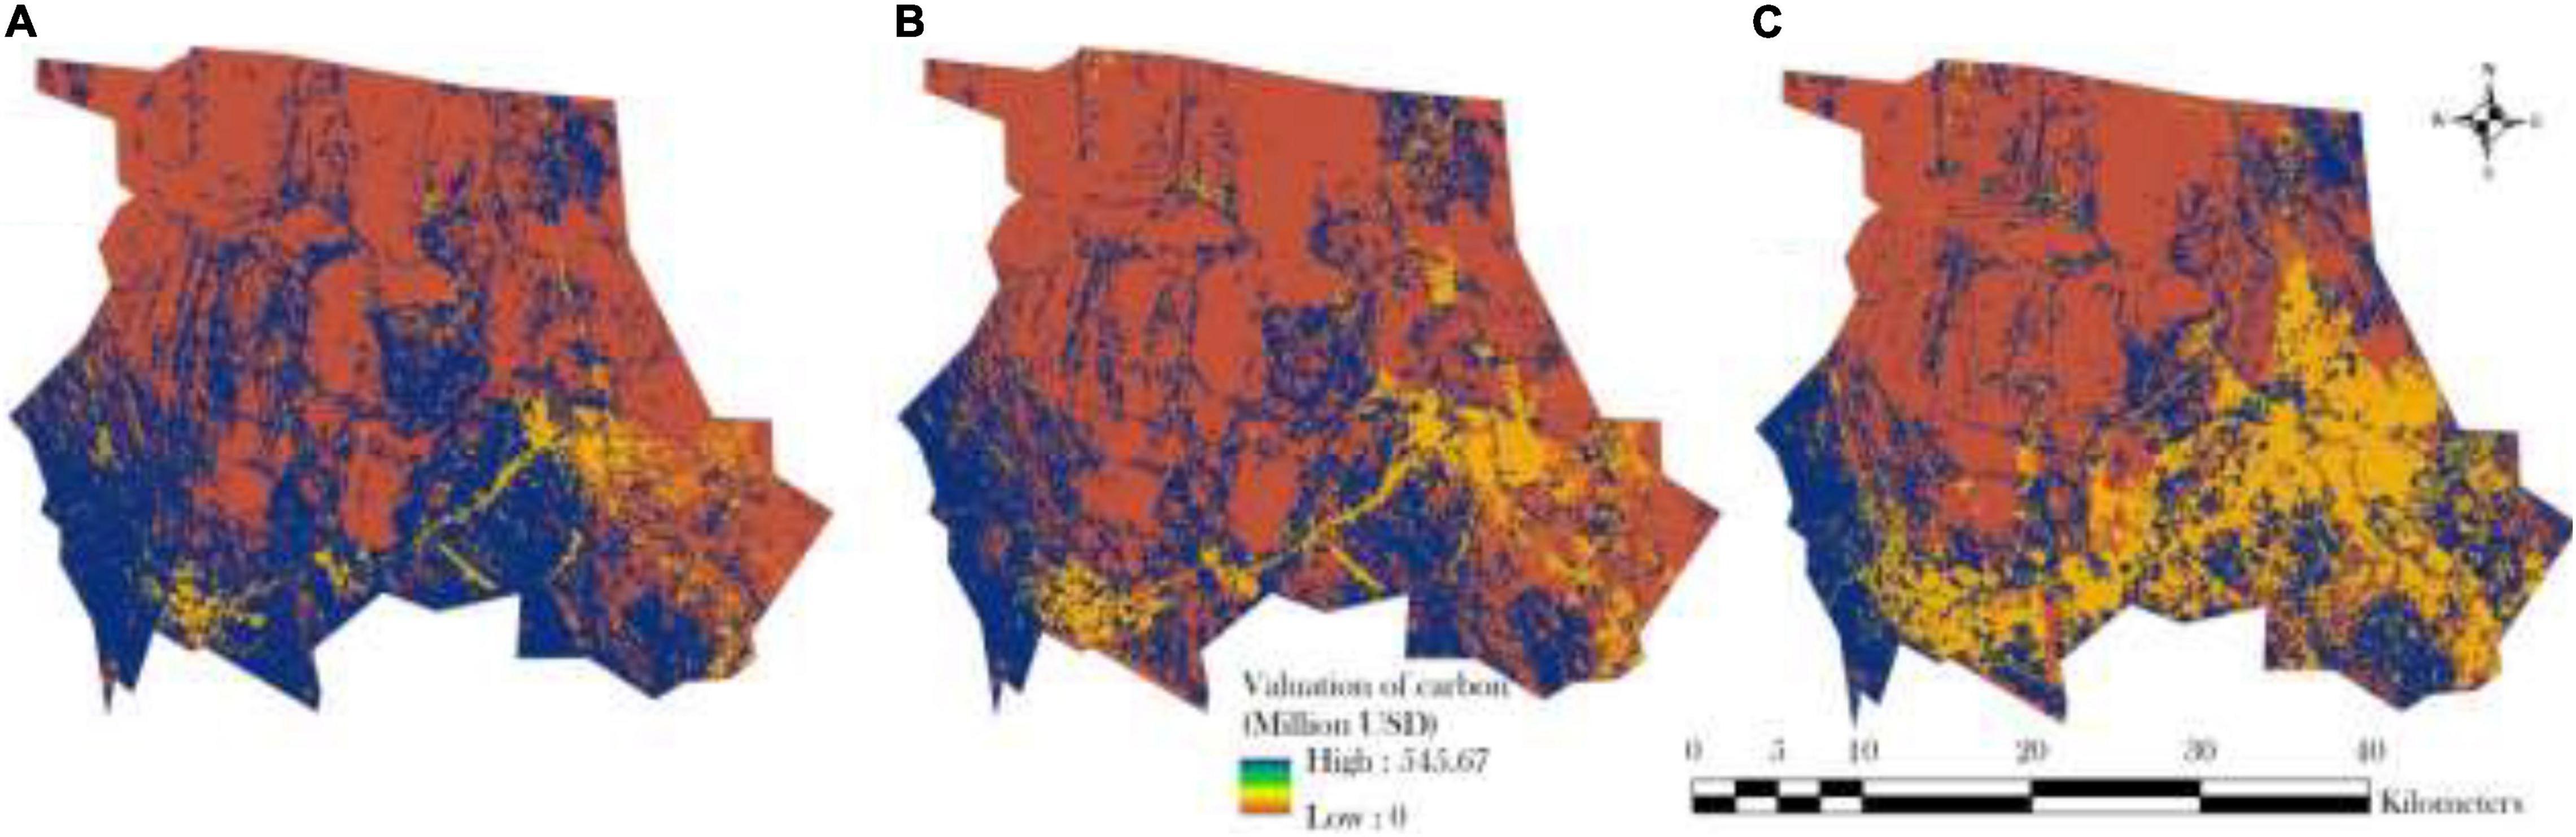
Figure 7. Valuation of carbon storage modeling with InVest software for (A) 1990, (B) 2000, and (C) 2020.
The goal was to forecast the LULC of 2040 using historical LULC maps and LULC dynamics. If the prediction model works well, it may forecast future LULC maps. Predicting the present LULC map is critical to assessing the model’s effectiveness. The 2020 LULC map was first simulated and then reviewed. Seven LULC change conditioning factors for 2020 and 2020 were defined: elevation, slope, urban area proximity, agricultural land, scrubland, dispersed vegetation, and water bodies. The same parameters were used for both LULC projections. Lower altitudes and slopes promote economic development. In contrast, territories near metropolitan regions are more likely to be urbanized. Distances from vegetation, water bodies, and agricultural land were crucial to urban growth. The LULC change driving factors have been prepared for predicting and forecasting of LULC for 2020 and 2040 (Figures 1, 2). The MOLUSCE plugin has an inbuilt way to calculate the correlation between the LULC change conditioning parameters for 2000 and 2020. Between 2000 and 2020, all indicators are moderate to highly connected. After acquiring change maps and transition probabilities between LULC for 1990–2000 and 2000–2020 using QGIS, the ANN model was used to estimate the LULC transitional probability map. The QGIS MOLUSCE plugin has a framework for collecting training and assessment datasets. The ANN model generated a land-use transitional probability model based on the training datasets. Several model parameters must be specified during ANN model performance testing. We fine-tuned the ANN model parameters through trial and error. The optimum LULC settings were 1000 iterations, 0.001 learning rate, 0.02, momentum, and 10px neighborhood.
After obtaining an ANN land use likelihood or suitability model, CA simulation was used to forecast LULC. We employed regular cell lattices. Each cell might have a few states, depending on nearby cells. It operated on one cell of linked pixels. The CA simulation needed much iteration to alter a pixel or cell. A threshold value was chosen to monitor the pace of change so that LULC transitions happened gradually. The pixel or cell was not converted if the maximum transitional probability was below the threshold value of any LULC type, which was 0.8 in the trial-and-error study. The threshold value was set at 0.8 to maintain the LULC conversions consistent in each cycle. So we optimized the CA model. The model predicts the next decade in the first iteration (20 years).
The CA model was used to build the 2020 and 2040 LULC maps using the ANN land suitability model. The simulated LULC map of 2020 was compared to the original LULC map of 2020 to assess or validate the ANN-CA model performance for prediction. The prediction change, correlation coefficient, and kappa coefficient for the 2020 LULC map were 75%, 0.832, and 80%, respectively, indicating good model results. The LULC map for 2040 was generated using the same optimized model utilizing the 2020 LULC transition conditioning settings and the validated 2020 LULC map. We did not change any parameters of the structure of the model for simulating the LULC of 2040 without any undesirable consequences. Then, the simulated 2020 and predicted 2040 LULC maps were generated based on the same methodology in QGIS software. Also, we did not validate the LULC of 2040 because future data is unavailable. Therefore, simulated LULC must be judged with the original LULC. If the simulated LULC and original LULC had higher similarity, then the same configured model can be applied for forecasting of future LULC.
From 1990 to 2028, the built-up area would be 34,372 ha, while, the vegetation would be 44,171.28 ha. The cropland would be 1757.88 ha and water bodies would reduce to 32.94 ha. The bare soil and exposed rock would reduce from 6,189,705 to 46,729.53 ha (Figure 8).
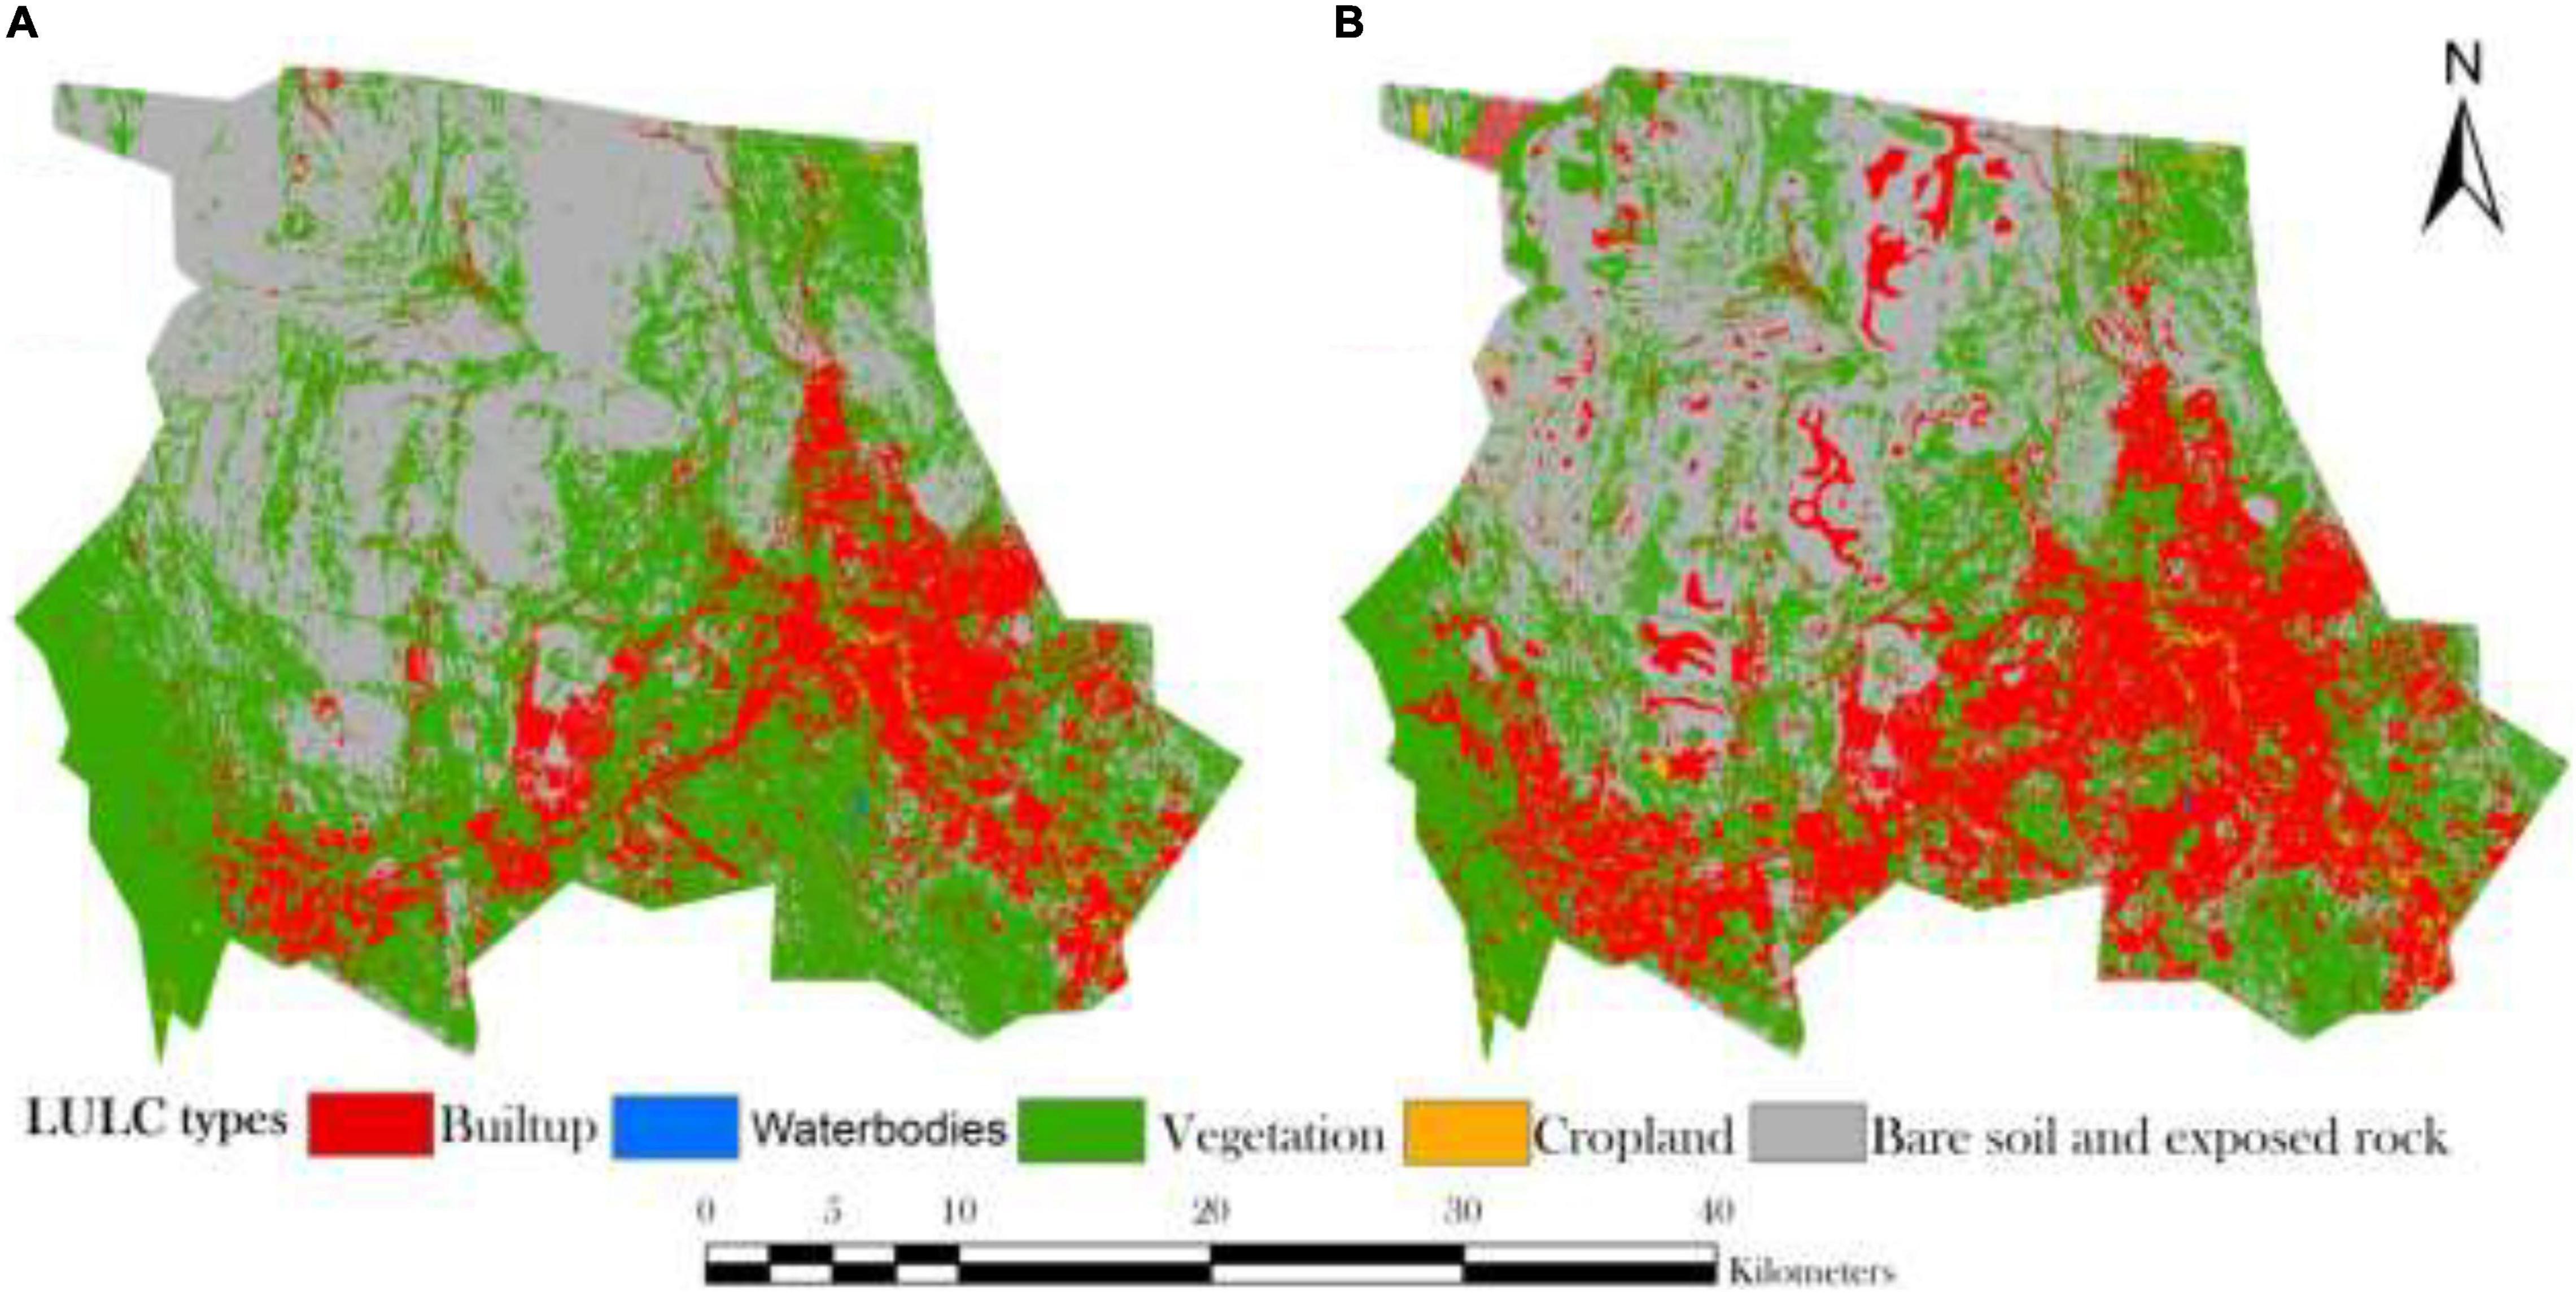
Figure 8. The prediction of LULC using ANN-CA model for (A) simulating 2020, and (B) forecasting 2040 LULC.
The carbon sequestered throughout the specified period is calculated as the difference in carbon stored (in Mg/ha) between the future and present landscapes. This work calculated carbon sequestration for 1990–2040, 2000–2040, and 2020–2040. Areas with high negative or positive values should have tremendous changes in LULC, i.e., less vegetation and vice versa. This model excludes carbon emissions from management operations, which are often dynamic. Positive numbers in the model output imply that carbon storage would grow, while negative values suggest that carbon storage would decrease. Between 1990 and 2040, vegetation cover lost 34,948.15 Mg C, whereas agriculture lost 145 Mg C. During the same period, vegetation would gain 17,363.7 Mg C, whereas built-up areas would gain 3924.1 Mg C (Figure 9). As a result, it is possible to estimate that the vegetation area would lose about 17,000 Mg C. On the other hand, between 2000 and 2040, and again between 2020 and 2040, the built-up region would absorb more carbon than before. As a result, carbon in built-up areas would gain at the expense of vegetation and farmland, a warning indicator of future climate change because forest loss indicates the green house emission rather than stored. The simulation created a raster with the economic worth (dollar per pixel) of the sequestered carbon in the current and future scenarios using economic data (Figure 9). The overall economic value of Abha’s carbon sequestration service was assessed to be $1,706,070.28 USD every 20 years. According to the geographical distribution of the economic value of sequestered carbon, there may be clusters of places with high values clustered around new built-up areas with a high potential for carbon sequestration, where economic value loss may be detected along with the vegetation. As a result of the loss of vegetation and crops and the increase in the built-up area, greenhouse gas emissions have risen throughout time.
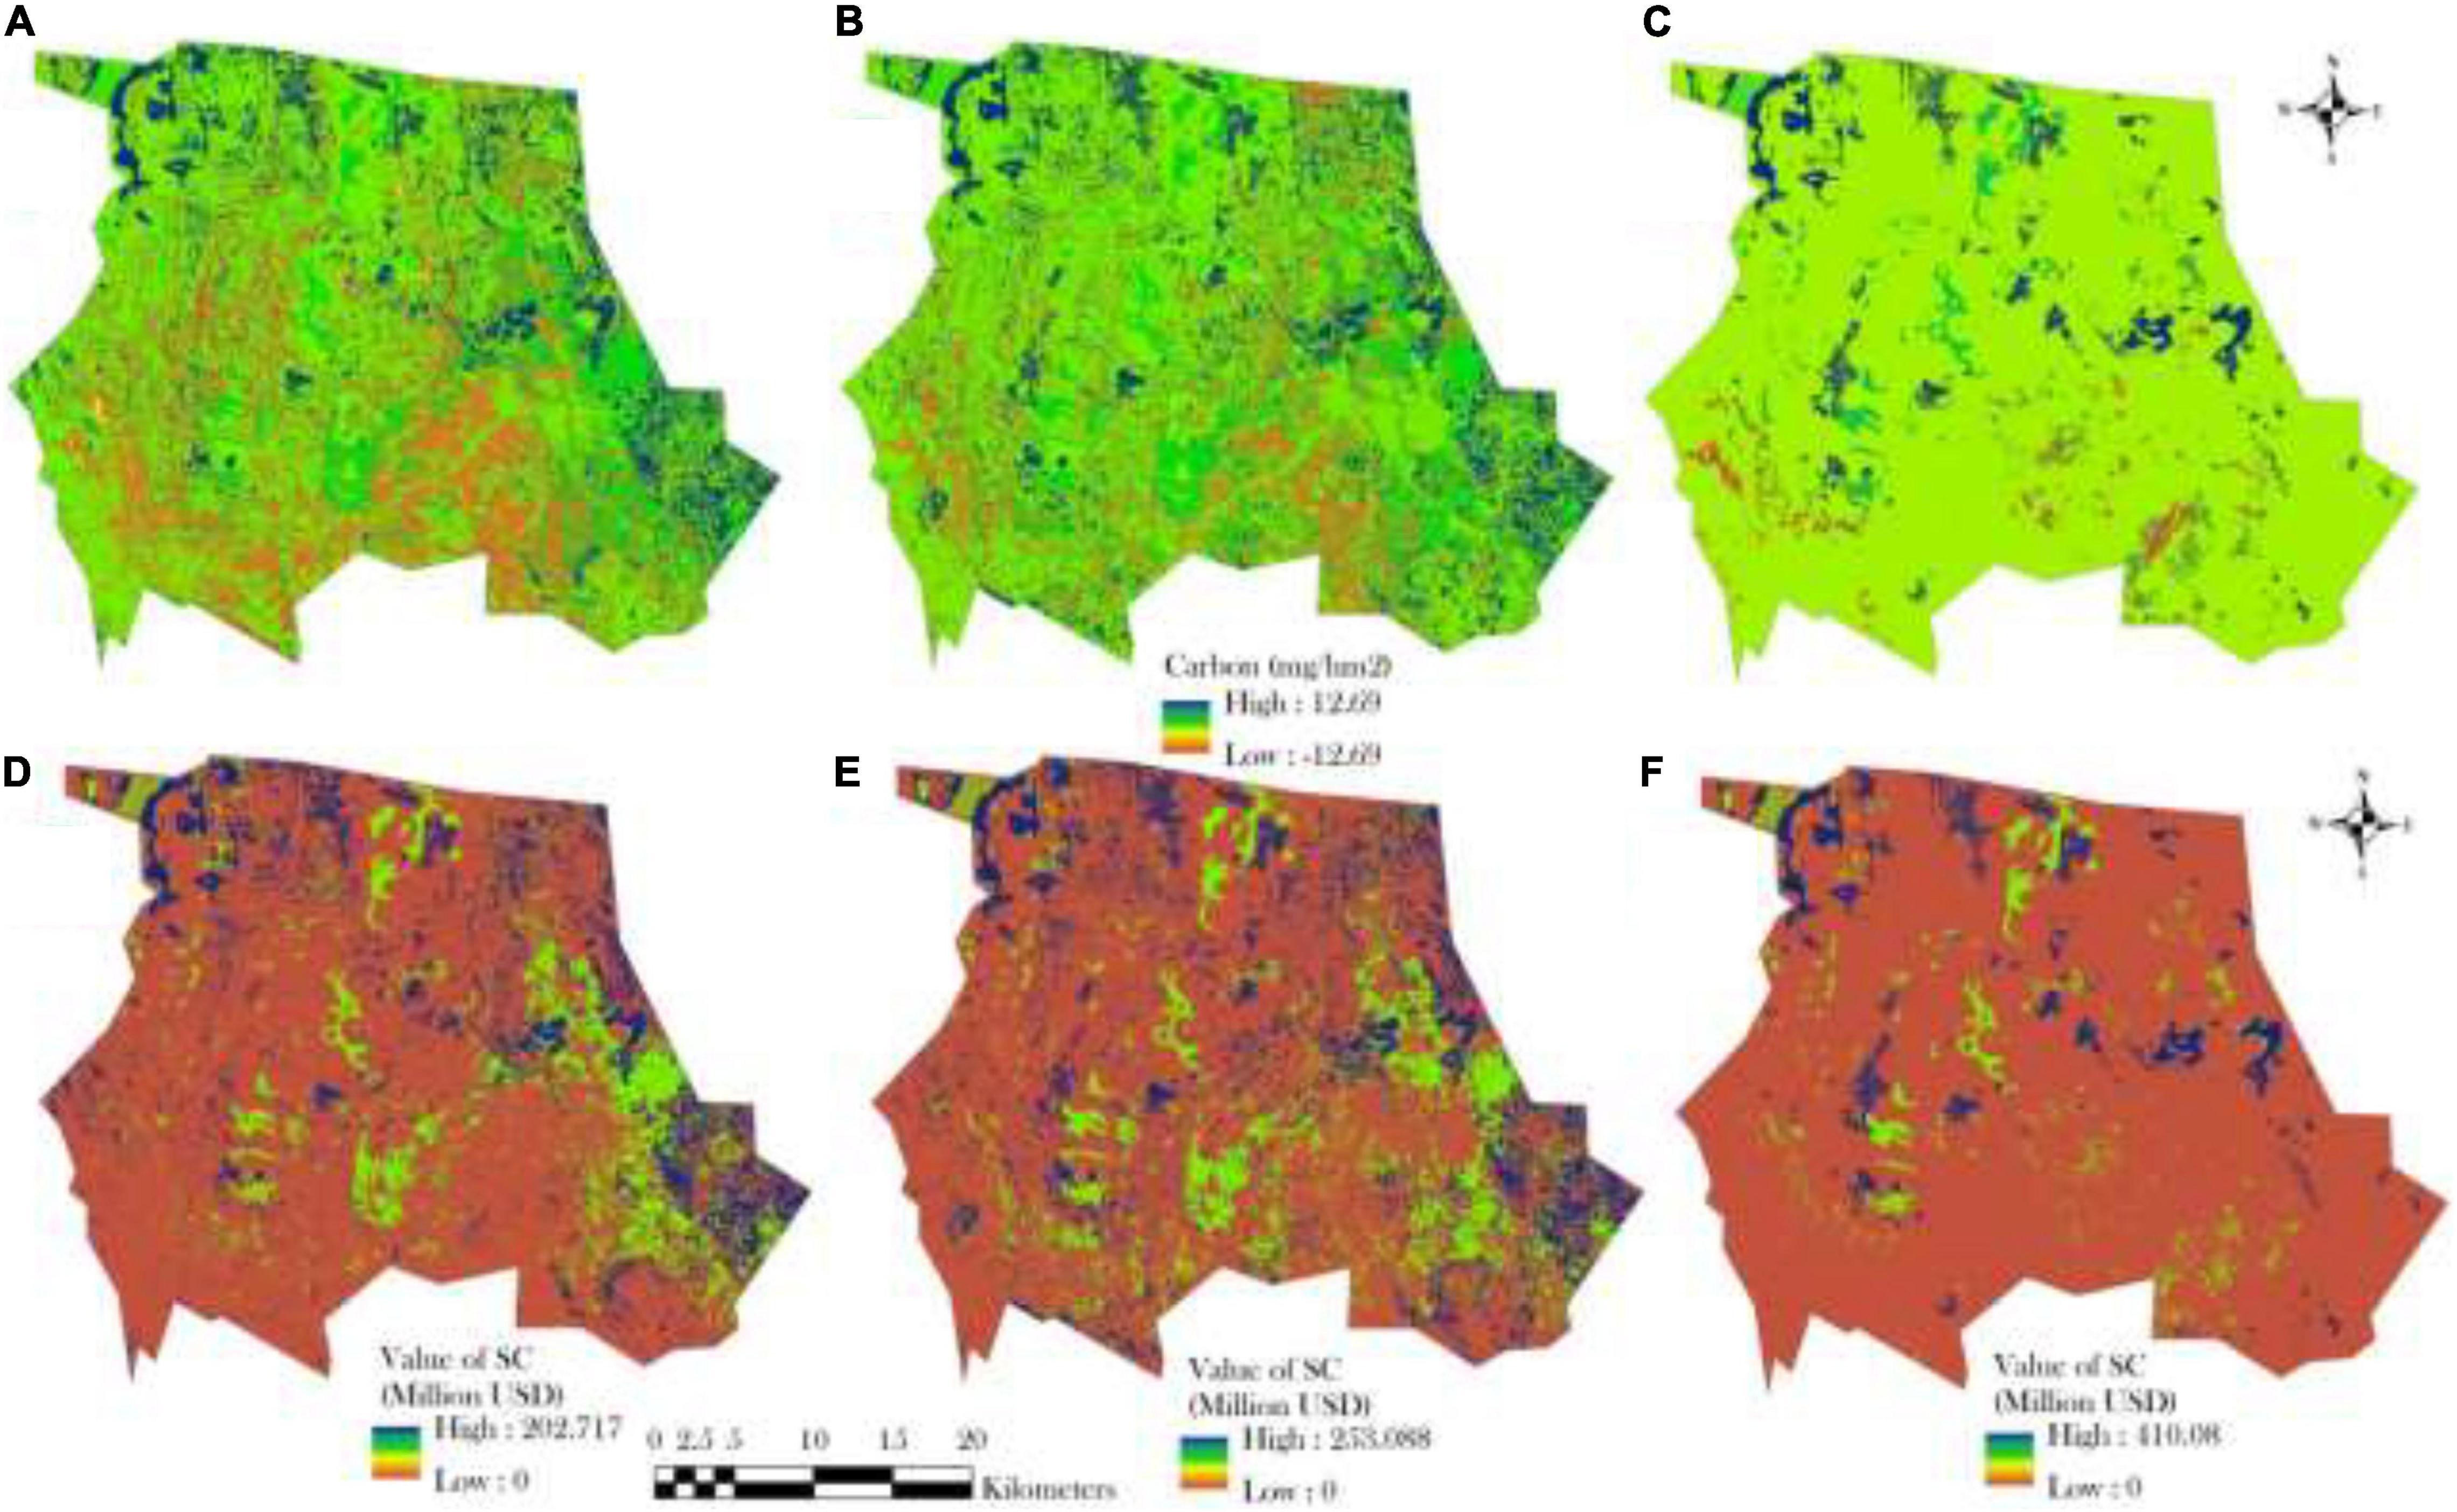
Figure 9. Modeling of carbon sequestration using InVest model during (A) 1990–2040, (B) 2000–2040, and (C) 2020–2040; valuation of carbon sequestration during (D) 1990–2040, (E) 2000–2040, and (F) 2020–2040.
Stakeholders such as managers, decision-makers, and landowners might benefit from using cross-technologies to quantify, spatialize, and monetize carbon storage and sequestration. This straightforward depiction and utilization of data and knowledge help to analyze that, in many circumstances, how vital is the ecosystem service in the city for a sustainable and healthy environment. The primary goal of this research was to evaluate carbon storage and sequestration models and identify viable management solutions for creating a low-carbon city. Because Abha is Saudi Arabia’s most prominent city, it works as a catalyst for urbanization (Mallick et al., 2021). Furthermore, the availability of a wide range of socioeconomic prospects, decent accessibility, and high quality of life are key catalysts for urbanization (Middleton et al., 2012). As a result, rising urbanization leads to increased carbon emissions (Piyathilake et al., 2021). Although the city is surrounded by dense forest, environmentalists and planners are concerned about the concentration of carbon excess on a local scale (Sil et al., 2017). As a result, the current research incorporated various viable methodologies to predict carbon sequestration and storage and future insight. Furthermore, LULC maps were created to depict the land change pattern in Abha and simulate future LULC change projections.
In Abha, the land use-based InVEST model was used to calculate carbon sequestration. The goal of employing a comprehensive InVEST model was to assess carbon sequestration in the current situation, determine carbon sequestration capability by various LULC classes, and calculate the city’s emission-sequestration balance. As predicted, carbon sequestration potential was higher in places under forest land (Li et al., 2017). Carbon sequestration is one of the most significant regulatory ecosystem services (Aðralı et al., 2018; Lyu et al., 2019); therefore it may assist planners and urban managers in implementing forest conservation plans and management measures. Because forest land change rates are negative and the development rate of the built-up area is fast expanding, the rates of change of carbon storage capacity were determined to be negative (Figure 8). In 1990, the research area’s vegetation cover was 710,425 Mg C, 525,119.3 Mg C in 2000, and 527,012.9 Mg C in 2020. On the other hand, the built-up area had 18,524.96 Mg C in 1990, climbed to 31,195.78 Mg C in 2000, and increased by 80,561.01 Mg C in 2020. Vegetation cover dropped 34,948.15 Mg C between 1990 and 2040; whereas agriculture lost 145 Mg C. Vegetation would receive 17,363.7 Mg C during the same period, whereas built-up areas would gain 3924.1 Mg C (Figure 9). As a consequence, it is conceivable to predict that around 17,000 Mg C would be lost from the vegetation area. On the other hand, the built-up area would absorb more carbon between 2000 and 2040, then again between 2020 and 2040. As a consequence, carbon in urban areas will rise at the cost of vegetation and farms, signaling future climate change since forest loss implies greenhouse gas emissions rather than storage (Zhao et al., 2019).
Carbon loss happens in general when natural land covers, especially forests, shift to anthropogenic land covers such as cultivated land, barren land, transportation infrastructure, residential areas, or natural land covers such as rangeland (Han et al., 2018). Because the quantity of carbon stored in lands covered by dispersed dry farming is minimal, converting them to residential areas will result in more carbon storage than scattered dry farming. The amount of carbon storage and sequestration offered by Abha city as an ecosystem service has been severely decreased as a consequence of forest degradation and the growth of man-made land covers, corroborating similar findings from other regions of the globe (Hui et al., 2014; Chun et al., 2019; Lahiji et al., 2020; Lu et al., 2020; Abdo, 2021; Dida et al., 2021).
From an economic standpoint, Abha is a significant city and urban center; thus, it is unworthy of compromising the city’s economic growth and infrastructural development. Because urbanization processes are developing at a quicker rate, adaptive plans and regulations may prove difficult to implement in the near future. According to Keith et al. (2020), building urban resilience capability rather than short-term urban management would be more helpful. Furthermore, it may build a balance between the environment’s self-regulation capabilities and human management initiatives.
This work aims to offer a positive addition to the study of carbon storage, its interaction with changing land use patterns, and the implications of these changes for future carbon dynamics. Using the land change modeler and the InVEST model, a multitemporal study of the Konar catchment area was carried out. The results show the changing dimensions of land use in that area and provide a conceptualization of the past, present, and future scenarios of carbon sequestration and remaining carbon stocks in that area, along with an economic valuation of those stocks. Although the circumstance revealed by the job is forbidding, the effort’s product is fulfilling. According to current estimates, this region is still predicted to lose 66,050.24 Mg C, with a corresponding economic value of around $US 9.73 million. This effort is an attempt to bring this bleak prospect to the forefront of the public’s attention to implement preventative steps as soon as possible. It aims to present literature that supports and contributes to the promotion of mitigation plans for carbon management at the local level by presenting reliable information to the best of its ability regarding the amount of carbon stock, the amount of available remaining carbon pools and their potential, along with any carbon loss or gain associated with land-use change. However, in the present work, some limitations were present, which can be overcome in the future research to improve the robustness of the analysis. In present research, we used coarse resolution satellite image, like Landsat data, global carbon pool data instead of field survey based data, application of traditional machine learning algorithms, instead of deep learning models. These issues should be overcome in the future research, especially the calculation of carbon pool from the specific study area. Despite of these limitation, the present work provides a foundation work for making carbon free urban area with sustainable development. This study can be applied other areas for computing and forecasting of the carbon storage and sequestration for urban management.
The raw data supporting the conclusions of this article will be made available by the authors, without undue reservation.
JM: conceptualization, data curation, funding acquisition, software, validation, and writing – original draft. JM, MAh, and MKA: formal analysis. MAl, NB, and MAh: investigation. JM and MAl: methodology. JM, MAl, and MKA: project administration. MAh and NB: resources. MAl and MKA: supervision. MAh: visualization. MAl, NB, MAh, and MKA: writing – review and editing. All authors contributed to the article and approved the submitted version.
The authors declare that the research was conducted in the absence of any commercial or financial relationships that could be construed as a potential conflict of interest.
All claims expressed in this article are solely those of the authors and do not necessarily represent those of their affiliated organizations, or those of the publisher, the editors and the reviewers. Any product that may be evaluated in this article, or claim that may be made by its manufacturer, is not guaranteed or endorsed by the publisher.
The authors extend their appreciation to the Deputyship for Research and Innovation, Ministry of Education in Saudi Arabia for funding this research work through the project number IFP-KKU-2020/13.
Abdo, Z. A. (2021). Modeling urban dynamics and carbon sequestration in Addis Ababa. Ethiopia, using satellite images. Arab. J. Geosci. 14, 1–8.
Abubakar, I. R., and Aina, Y. A. (2018). “Achieving sustainable cities in Saudi Arabia: Juggling the competing urbanization challenges,” in E-planning and Collaboration: Concepts, Methodologies, Tools, and Applications, ed. B. Umar (Hershey, PA: IGI Global), 234–255. doi: 10.4018/978-1-5225-5646-6.ch011
Addas, A., Goldblatt, R., and Rubinyi, S. (2020). Utilizing remotely sensed observations to estimate the urban heat Island effect at a local scale: case study of a University campus. Land 9:191. doi: 10.3390/land9060191
Addas, A., and Maghrabi, A. (2020). A Proposed Planning Concept for Public Open Space Provision in Saudi Arabia: a Study of Three Saudi Cities. Int. J. Environ. Res. Public Health 2020:5970. doi: 10.3390/ijerph17165970
Aðralı, S., Üçtuð, F. G., and Türkmen, B. A. (2018). An optimization model for carbon capture & storage/utilization vs. carbon trading: a case study of fossil-fired power plants in Turkey. J. Environ. Manage. 215, 305–315.
Al-Maamary, H. M., Kazem, H. A., and Chaichan, M. T. (2017). The impact of oil price fluctuations on common renewable energies in GCC countries. Renew. Sustain. Energy Rev. 75, 989–1007. doi: 10.1016/j.rser.2016.11.079
Babbar, D., Areendran, G., Sahana, M., Sarma, K., Raj, K., Sivadas, A., et al. (2021). Assessment and prediction of carbon sequestration using Markov chain and InVEST model in Sariska Tiger Reserve. Ind. J. Cleaner Prod. 278:123333. doi: 10.1016/j.jclepro.2020.123333
Bindajam, A. A., and Mallick, J. (2020). Impact of the Spatial Configuration of Streets Networks on Urban Growth: a Case Study of Abha City. Saudi Arab. Sustain. 5:1856. doi: 10.3390/su12051856
Bindajam, A. A., Mallick, J., Talukdar, S., Islam, A. R. M., and Alqadhi, S. (2021). Integration of artificial intelligence–based LULC mapping and prediction for estimating ecosystem services for urban sustainability: past to future perspective. Arab. J. Geosci. 14, 1–23.
Chu, X., Zhan, J., Li, Z., Zhang, F., and Qi, W. (2019). Assessment on forest carbon sequestration in the Three-North Shelterbelt Program region. Chin. J. Cleaner Prod. 215, 382–389. doi: 10.1371/journal.pone.0158173
Chun, J., Kim, C. K., Kang, W., Park, H., Kim, G., Lee, W. K., et al. (2019). Sustainable Management of Carbon Sequestration Service in Areas with High Development Pressure: considering Land Use Changes and Carbon Costs. Sustainability 11:5116. doi: 10.3390/su11185116
Darfaoui, E. M., and Al, A (2010). A. Response to Climate Change in the Kingdom of Saudi Arabia. a Report Prepared for the Food and Agriculture Organization; United Nation. Available online at : http://www.fao.org/forestry/29157-0d03d7abbb7f341972e8c6ebd2b25a181.pdf (accessed on 12 April 2021)
Deng, L., Shangguan, Z. P., and Sweeney, S. (2014). “Grain for Green” driven land use change and carbon sequestration on the Loess Plateau. Chin. Sci. Rep. 4, 1–8. doi: 10.1038/srep07039
Dida, J. J. V., Tiburan, C. L. Jr., Tsutsumida, N., and Saizen, I. (2021). Carbon stock estimation of selected watersheds in Laguna. Philipp. Using InVEST. Philipp. J. Sci. 150, 501–513.
Eastman, J. R. (2015). “Chapter Nine: Ecosystem Services Modeler,” in TerrSet Manual; Clarklabs, (Worcester, MA), 249–252.
Fattah, M. A., Morshed, S. R., and Morshed, S. Y. (2021). Impacts of land use-based carbon emission pattern on surface temperature dynamics: experience from the urban and suburban areas of Khulna. Bangl. Rem. Sens. Appl. Soc. Environ. 22:100508. doi: 10.1016/j.rsase.2021.100508
Fekadu Hailu, A., Soremessa, T., and Warkineh Dullo, B. (2021). Carbon sequestration and storage value of coffee forest in Southwestern Ethiopia. Carb. Manage. 12, 531–548. doi: 10.1080/17583004.2021.1976676
Field, C. B., Barros, V. R., Mastrandrea, M. D., Mach, K. J., Abdrabo, M. K., Adger, N., et al. (2014). “Summary for policymakers,” in PClimate change 2014: Impacts, Adaptation, and Vulnerability. Part A: Global and Sectoral Aspects. Contribution of Working Group II to the Fifth Assessment Report of the Intergovernmental Panel on Climate Change, (Cambridge: Cambridge University Press), 1–32. doi: 10.18772/22008034792.11
Gaglio, M., Aschonitis, V., Pieretti, L., Santos, L., Gissi, E., Castaldelli, G., et al. (2019). Modelling past, present and future Ecosystem Services supply in a protected floodplain under land use and climate changes. Ecol. Model. 403, 23–34. doi: 10.1016/j.ecolmodel.2019.04.019
Gallant, K., Withey, P., Risk, D., van Kooten, G. C., and Spafford, L. (2020). Measurement and economic valuation of carbon sequestration in Nova Scotian wetlands. Ecol. Econ. 171:106619. doi: 10.1016/j.ecolecon.2020.106619
Gibbs, H. K., Brown, S., Niles, J. O., and Foley, J. A. (2007). Monitoring and estimating tropical forest carbon stocks: making REDD a reality. Environ. Res. Lett. 2:045023. doi: 10.1088/1748-9326/2/4/045023
Han, Y., Kang, W., and Song, Y. (2018). Mapping and quantifying variations in ecosystem services of urban green spaces: a test case of carbon sequestration at the district scale for Seoul. Korea (1975–2015). Int. Rev. Spat. Planning Sustain. Dev. 6, 110–120. doi: 10.14246/irspsd.6.3_110
Hauck, J., Völker, C., Wolf-Gladrow, D. A., Laufkötter, C., Vogt, M., Aumont, O., et al. (2015). On the Southern Ocean CO2 uptake and the role of the biological carbon pump in the 21st century. Glob. Biogeochem. Cycl. 29, 1451–1470. doi: 10.1002/2015gb005140
Huang, K., Li, X., Liu, X., and Seto, K. C. (2019). Projecting global urban land expansion and heat island intensification through 2050. Environ. Res. Lett. 14:114037. doi: 10.1088/1748-9326/ab4b71
Hui, H., Zhang, J. J., Xu, Q., and Luo, G. F. (2014). The impact of land use change on ecological carbon sequestration of mining city. Legisl. Technol. Prac. Mine Land Reclam. 1:6.
Ibrahim Mahmoud, M., Duker, A., Conrad, C., Thiel, M., and Shaba Ahmad, H. (2016). Analysis of settlement expansion and urban growth modelling using geoinformation for assessing potential impacts of urbanization on climate in Abuja City. Nigeria. Rem. Sens. 8:220. doi: 10.3390/rs8030220
IPCC. (2005). IPCC Special Report on Carbon Dioxide Capture and Storage. Prepared by Working Group III of the Intergovernmental Panel on Climate Change. Cambridge: Cambridge University Press.
Jiang, L., Li, C. Y., Song, B., and Li, S. S. (2015). Impacts of land use/cover changes on carbon storage in Beijing 1990–2010. Int. J. Environ. Stud. 72, 972–982. doi: 10.1080/00207233.2015.1054140
Jiang, Z., Sun, X., Liu, F., Shan, R., and Zhang, W. (2019). Spatio-temporal variation of land use and ecosystem service values and their impact factors in an urbanized agricultural basin since the reform and opening of China. Environ. Monitor. Assess. 191, 1–14. doi: 10.1007/s10661-019-7896-z
Keith, M. O’Clery, N., Parnell, S., and Revi, A. (2020). The future of the future city? The new urban sciences and a PEAK Urban interdisciplinary disposition. Cities 105:102820.
Lahiji, R. N., Dinan, N. M., Liaghati, H., Ghaffarzadeh, H., and Vafaeinejad, A. (2020). Scenario-based estimation of catchment carbon storage: linking multi-objective land allocation with InVEST model in a mixed agriculture-forest landscape. Front. Earth Sci. 14:637–646. doi: 10.1007/s11707-020-0825-1
Lal, R. (2014). “Abating climate change and feeding the world through soil carbon sequestration,” in Soil as World Heritage, ed. D. Dent (Dordrecht: Springer), 443–457. doi: 10.1007/978-94-007-6187-2_47
Lal, R. (2016). Why Carbon Sequestration in Agricultural Soils. In Agricultural Practices and Policies for Carbon Sequestration in Soil. Florida: CRC Press, 45–54.
Lal, R. (2019). Eco-intensification through soil carbon sequestration: Harnessing ecosystem services and advancing sustainable development goals. J. Soil Water Conserv. 74, 55A–61A.
Lamine, S., Petropoulos, G. P., Singh, S. K., Szabó, S., Bachari, N. E. I., Srivastava, P. K., et al. (2018). Quantifying land use/land cover spatio-temporal landscape pattern dynamics from Hyperion using SVMs classifier and FRAGSTATS§. Geocarto Int. 33, 862–878. doi: 10.1080/10106049.2017.1307460
Lauwaet, D., De Ridder, K., Saeed, S., Brisson, E., Chatterjee, F., Van Lipzig, N. P. M., et al. (2016). Assessing the current and future urban heat island of Brussels. Urban Clim. 15, 1–15. doi: 10.1016/j.uclim.2015.11.008
Li, Z., Zhong, J., Sun, Z., and Yang, W. (2017). Spatial pattern of carbon sequestration and urban sustainability: analysis of land-use and carbon emission in Guang’an. Chin. Sustain. 9:1951. doi: 10.3390/su9111951
Liang, Y., Hashimoto, S., and Liu, L. (2021). Integrated assessment of land-use/land-cover dynamics on carbon storage services in the Loess Plateau of China from 1995 to 2050. Ecol. Indicat. 120:106939. doi: 10.1016/j.ecolind.2020.106939
Lu, Y. N., Yao, S., Ding, Z., Deng, Y., and Hou, M. (2020). Did government expenditure on the grain for green project help the forest carbon sequestration increase in Yunnan. China?. Land 9:54. doi: 10.3390/land9020054
Lyu, R., Mi, L., Zhang, J., Xu, M., and Li, J. (2019). Modeling the effects of urban expansion on regional carbon storage by coupling SLEUTH-3r model and InVEST model. Ecol. Res. 34, 380–393. doi: 10.1111/1440-1703.1278
Mallick, J., Khan, R. A., Ahmed, M., Alqadhi, S. D., Alsubih, M., Falqi, I., et al. (2019). Modeling Groundwater Potential Zone in a Semi-Arid Region of Aseer Using Fuzzy-AHP and Geoinformation Techniques. Water 12:2656. doi: 10.3390/w11122656
Mallick, J., Singh, V. P., Almesfer, M. K., Talukdar, S., Alsubhi, M., Ahmed, M., et al. (2021). Spatio-Temporal Analysis and Simulation of Land Cover Changes and Their Impacts on Land surface Temperature in Urban Agglomeration of Bisha Watershed. Saudi Arabia: Geocarto International, 1–27.
Melgani, F., and Bruzzone, L. (2004). Classification of hyperspectral remote sensing images with support vector machines. IEEE Transac. Geosci. Remote Sens. 42, 1778–1790. doi: 10.1109/tgrs.2004.831865
Middleton, R. S., Kuby, M. J., Wei, R., Keating, G. N., and Pawar, R. J. (2012). A dynamic model for optimally phasing in CO2 capture and storage infrastructure. Environ. Model. Soft. 37, 193–205. doi: 10.1016/j.envsoft.2012.04.003
Molotoks, A., Stehfest, E., Doelman, J., Albanito, F., Fitton, N., Dawson, T. P., et al. (2018). Global projections of future cropland expansion to 2050 and direct impacts on biodiversity and carbon storage. Glob. Change Biol. 24, 5895–5908. doi: 10.1111/gcb.14459
Parida, B. R., and Mandal, S. P. (2020). Polarimetric decomposition methods for LULC mapping using ALOS L-band PolSAR data in Western parts of Mizoram. Northeast Ind. SN Appl. Sci. 2, 1–15.
Pechanec, V., Purkyt, J., Benc, A., Nwaogu, C., Štìrbová, L., and Cudlín, P. (2018). Modelling of the carbon sequestration and its prediction under climate change. Ecol. Inform. 47, 50–54. doi: 10.1016/j.ecoinf.2017.08.006
Penman, J., Gytarsky, M., Hiraishi, T., Krug, T., Kruger, D., Pipatti, R., et al. (2003). Land-Use Change and Forestry. Rio de Janeiro: United Nations Climate change.
Piyathilake, I. D. U. H., Udayakumara, E. P. N., Ranaweera, L. V., and Gunatilake, S. K. (2021). Modeling Predictive Assessment of Carbon Storage using InVEST model in Uva province. Sri Lanka: Modeling Earth Systems and Environment, 1–11.
Rousta, I., Sarif, M. O., Gupta, R. D., Olafsson, H., Ranagalage, M., Murayama, Y., et al. (2018). Spatiotemporal analysis of land use/land cover and its effects on surface urban heat island using Landsat data: a case study of Metropolitan City Tehran (1988–2018). Sustainability 10:4433. doi: 10.3390/su10124433
Schneider, A. (2012). Monitoring land cover change in urban and peri-urban areas using dense time stacks of Landsat satellite data and a data mining approach. Remote Sens. Environ. 124, 689–704.
Sil, Â, Fonseca, F., Gonçalves, J., Honrado, J., Marta-Pedroso, C., Alonso, J., et al. (2017). Analysing carbon sequestration and storage dynamics in a changing mountain landscape in Portugal: insights for management and planning. Int. J. Biodivers. Sci., Ecosyst. Serv. Manage. 13, 82–104. doi: 10.1080/21513732.2017.1297331
Singh, S. K., Srivastava, P. K., Gupta, M., Thakur, J. K., and Mukherjee, S. (2014). Appraisal of land use/land cover of mangrove forest ecosystem using support vector machine. Environ. Earth Sci. 71, 2245–2255. doi: 10.1007/s12665-013-2628-0
Talukdar, S., Eibek, K. U., Akhter, S., Ziaul, S. K., Islam, A. R. M. T., and Mallick, J. (2021). Modeling fragmentation probability of land-use and land-cover using the bagging, random forest and random subspace in the Teesta River Basin. Banglad. Ecol. Indic. 126:107612. doi: 10.1016/j.ecolind.2021.107612
Talukdar, S., Singha, P., Mahato, S., Pal, S., Liou, Y. A., and Rahman, A. (2020). Land-use land-cover classification by machine learning classifiers for satellite observations—A review. Rem. Sens. 12:1135. doi: 10.3390/rs12071135
Tayebi, M., Fim Rosas, J. T., Mendes, W. D. S., Poppiel, R. R., Ostovari, Y., Ruiz, L. F. C., et al. (2021). Drivers of organic carbon stocks in different LULC history and along soil depth for a 30 years image time series. Rem. Sens. 13: 2223. doi: 10.3390/rs13112223
Tehrany, M. S., Pradhan, B., and Jebuv, M. N. (2014). A comparative assessment between object and pixel-based classification approaches for land use/land cover mapping using SPOT 5 imagery. Geocarto Int. 29, 351–369. doi: 10.1080/10106049.2013.768300
Twisa, S., Mwabumba, M., Kurian, M., and Buchroithner, M. F. (2020). Impact of land-use/land-cover change on drinking water ecosystem services in Wami River Basin. Tanzania. Res. 9:37. doi: 10.3390/resources9040037
Wang, Y., Dai, E., Yin, L., and Ma, L. (2018). Land use/land cover change and the effects on ecosystem services in the Hengduan Mountain region. Chin. Ecosyst. Serv. 34, 55–67. doi: 10.1016/j.ecoser.2018.09.008
Waske, B. (2014). “Synergies from SAR-optical data fusion for LULC mapping,” in Land use and Land Cover Mapping in Europe, (Dordrecht: Springer), 179–191. doi: 10.1007/978-94-007-7969-3_11
Winkler, M., Abernethy, R., Nicolo, M., Huang, H., Wang, A., Zhang, S., et al. (2010). “November. The dynamic aspect of formation storage use for CO2 sequestration,” in SPE International Conference on CO2 Capture, Storage, and Utilization, (Palisades Creek: OnePetro).
Wu, J., Chen, B., Mao, J., and Feng, Z. (2018). Spatiotemporal evolution of carbon sequestration vulnerability and its relationship with urbanization in China’s coastal zone. Sci. Total Environ. 645, 692–701. doi: 10.1016/j.scitotenv.2018.07.086
Xiong, X., Grunwald, S., Myers, D. B., Ross, C. W., Harris, W. G., and Comerford, N. B. (2014). Interaction effects of climate and land use/land cover change on soil organic carbon sequestration. Sci. Total Environ. 493, 974–982. doi: 10.1016/j.scitotenv.2014.06.088
Yavari, A. R., and Bahreini, H. (2001). Functional Programming with Simple Methods of Zoning. J. Environ. Stud. 27, 79–97.
Yirsaw, E., Wu, W., Shi, X., Temesgen, H., and Bekele, B. (2017). Land use/land cover change modeling and the prediction of subsequent changes in ecosystem service values in a coastal area of China, the Su-Xi-Chang Region. Sustainability 9:1204. doi: 10.3390/su9071204
Zhao, M., He, Z., Du, J., Chen, L., Lin, P., and Fang, S. (2019). Assessing the effects of ecological engineering on carbon storage by linking the CA-Markov and InVEST models. Ecol. Indic. 98, 29–38. doi: 10.1016/j.ecolind.2018.10.052
Zhou, J., Zhao, Y., Huang, P., Zhao, X., Feng, W., Li, Q., et al. (2020). Impacts of ecological restoration projects on the ecosystem carbon storage of inland river basin in arid area. Chin. Ecol. Indic. 118:106803. doi: 10.1016/j.ecolind.2020.106803
Keywords: carbon storage, carbon sequestration, land use change, machine learning, cellular automata
Citation: Mallick J, Almesfer MK, Alsubih M, Ahmed M and Ben Kahla N (2022) Estimating Carbon Stocks and Sequestration With Their Valuation Under a Changing Land Use Scenario: A Multi-Temporal Research in Abha City, Saudi Arabia. Front. Ecol. Evol. 10:905799. doi: 10.3389/fevo.2022.905799
Received: 27 March 2022; Accepted: 29 April 2022;
Published: 03 June 2022.
Edited by:
Atiqur Rahman, Jamia Millia Islamia, IndiaReviewed by:
Shahfahad Shahfahad, Jamia Millia Islamia, IndiaCopyright © 2022 Mallick, Almesfer, Alsubih, Ahmed and Ben Kahla. This is an open-access article distributed under the terms of the Creative Commons Attribution License (CC BY). The use, distribution or reproduction in other forums is permitted, provided the original author(s) and the copyright owner(s) are credited and that the original publication in this journal is cited, in accordance with accepted academic practice. No use, distribution or reproduction is permitted which does not comply with these terms.
*Correspondence: Javed Mallick, am1hbGxpY2tAa2t1LmVkdS5zYQ==
Disclaimer: All claims expressed in this article are solely those of the authors and do not necessarily represent those of their affiliated organizations, or those of the publisher, the editors and the reviewers. Any product that may be evaluated in this article or claim that may be made by its manufacturer is not guaranteed or endorsed by the publisher.
Research integrity at Frontiers
Learn more about the work of our research integrity team to safeguard the quality of each article we publish.