- Department of Oceanography and Coastal Sciences, Louisiana State University, Baton Rouge, LA, United States
Dredging to create canals and channels in wetlands is widespread and is a major cause of dramatically high wetland loss rates in coastal Louisiana. The dredged material placed alongside the canal forms continuous levees and can be dragged back into the canal to start wetland restoration (backfilling) but is rarely done. Thirty-three canals backfilled in the 1980s as opportunistic permit requirements were examined to determine their re-vegetation after 39 years. Sixteen of the 33 disturbed areas are now mostly restored to wetlands, and seventeen were compromised by re-dredging and other factors such as being surrounded by other canals or embedded within water level control structures. Success occurred where the natural hydrology was not artificially constrained by these structures. The re-vegetation of these 16 canals were compared to backfilled canals in the Barataria Preserve of the Jean Lafitte Historical National Park. The spoil bank was restored wetland habitat within a few years, and the open water of the canal was 70% re-vegetated after 39 years if there was no soil “plug” placed at the canal entrance during backfilling. Backfilling canals can be done on the 27 thousand abandoned canals across this coast for a low cost compared to other restoration strategies.
Introduction
Wetland conservation and restoration projects create wildlife habitat and carbon sinks, protect and enhance cultural heritage, resilience, and economic values and are now numerous (Costanza et al., 2014; United Nations General Assembly [UNGA], 2019; United Nations Environment Programme [UNEP], 2021; zu Ermgassen et al., 2021) the arguments for them are now forceful and there is intense interest to conserve and restore wetlands to something near to their pre-disturbed conditions. These restorations potentially include dredged channels in wetlands that were built throughout the world for a variety of reasons including agriculture, forestry, colonial expansion, and disease reduction (Rippon, 2000; Mann, 2008; Ash, 2017). Restoring canals in coastal Louisiana goes to the heart of concerns about the consequences of dredging the 35,163 canals for oil and gas extraction existing on land in 14 coastal parishes as of 2017. Dredging these canals also created 33,705 km of levee (spoil banks) built from the dredged materials after it was placed laterally on both sides of the canal and are no longer wetland habitat. Those levees have a cumulative length long enough to cross the coast from east to west 79 times equivalent to two round trips from New Orleans, Louisiana to Lucerne, Switzerland. The height of the spoil bank is multiples of the tidal range and the compression of soils they overlay block 50% of the water exchange that is belowground (Swenson and Turner, 1987). Restoring wetlands is focused on mitigating these blockages to the water flow above- and belowground because they create both longer flooding periods and longer drying cycles; as a result a dose-response relationship between canals and land losses occurs over time and space (Turner and McClenachan, 2018). The volume of oil and gas extracted thousands of meters beneath the canal can be high enough to cause soil subsidence at the surface that results in unhealthy flooding of emergent plants (Stagg et al., 2019; Turner and Mo, 2021). A logical case can be made, based on these cause-and-effect relationships and others, that canals and their levees, and the fluid extraction made possible beneath them are a major cause of Louisiana’s coastal wetlands from the 1930s to the present (Turner and McClenachan, 2018). Similar conclusions about the effect of oil and gas canals are described in the Niger delta by Ohimain and Eteh (2021). Water bodies in the Benin River wetlands (36.4 km2), Niger Delta, that originally accounted for 1.17% of the study area in 1980 increased to 22% in 2020. These conversions were directly related to canal density in time and space from 1980 to 2020 as they are in Louisiana.
Most canals dredged in Louisiana over the last 50 years required wetland restoration of the canal and associated spoil bank upon canal abandonment, but it was not done. Although there were 27,483 dry and abandoned oil and gas wells on land in the coastal parishes by 2017, fewer than 40 have had their dredged spoil material scraped back into the canal, a process called “backfilling.” Thirty-three canals were backfilled in the early 1980s, and there are others in the Barataria Preserve of the Jean Lafitte National Historical Park and Preserve (the “Park”) near New Orleans, Louisiana, that were done from 2001 to 2002 and in 2010. Information on the restoration success of these few backfilled sites is important, not only because of the paucity of information but also because spoil banks may last 100 years (Turner and Swenson, 2020). The influences of the accelerating sea level rise across the coast, of course, may override restoration efforts at the local and regional scale (e.g., Horton et al., 2018; Turner et al., 2018; Schepers et al., 2020).
The restoration of these 33 canals backfilled in the 1980s was last documented in 2004 by Baustian and Turner (2006) who made field-based measurements of the canal depth, percent marsh vegetation on the spoil bank and in the canal, and the percent vegetative restoration. They found that the success of backfilling was controlled by the amount of spoil returned to the canal, and that 95% of the spoil area was restored when the spoil bank was properly removed, but only 5% where spoil removal was poor. Soil bulk density, water content and plant community restoration, which was up to 90% or more, was also dependent on the amount of spoil removal. This study compared vegetative recovery as estimated by the percent cover after an additional 15 years and compared the restoration rates in canals backfilled in the Park in 2001 and 2010, including one that had a sediment slurry added during the backfilling. A distinction is made between the restoration rates in canals closed at their entrance using earthen or shell plugs after being backfilled and those that are not closed with a plug.
Materials and Methods
Backfilled Canals
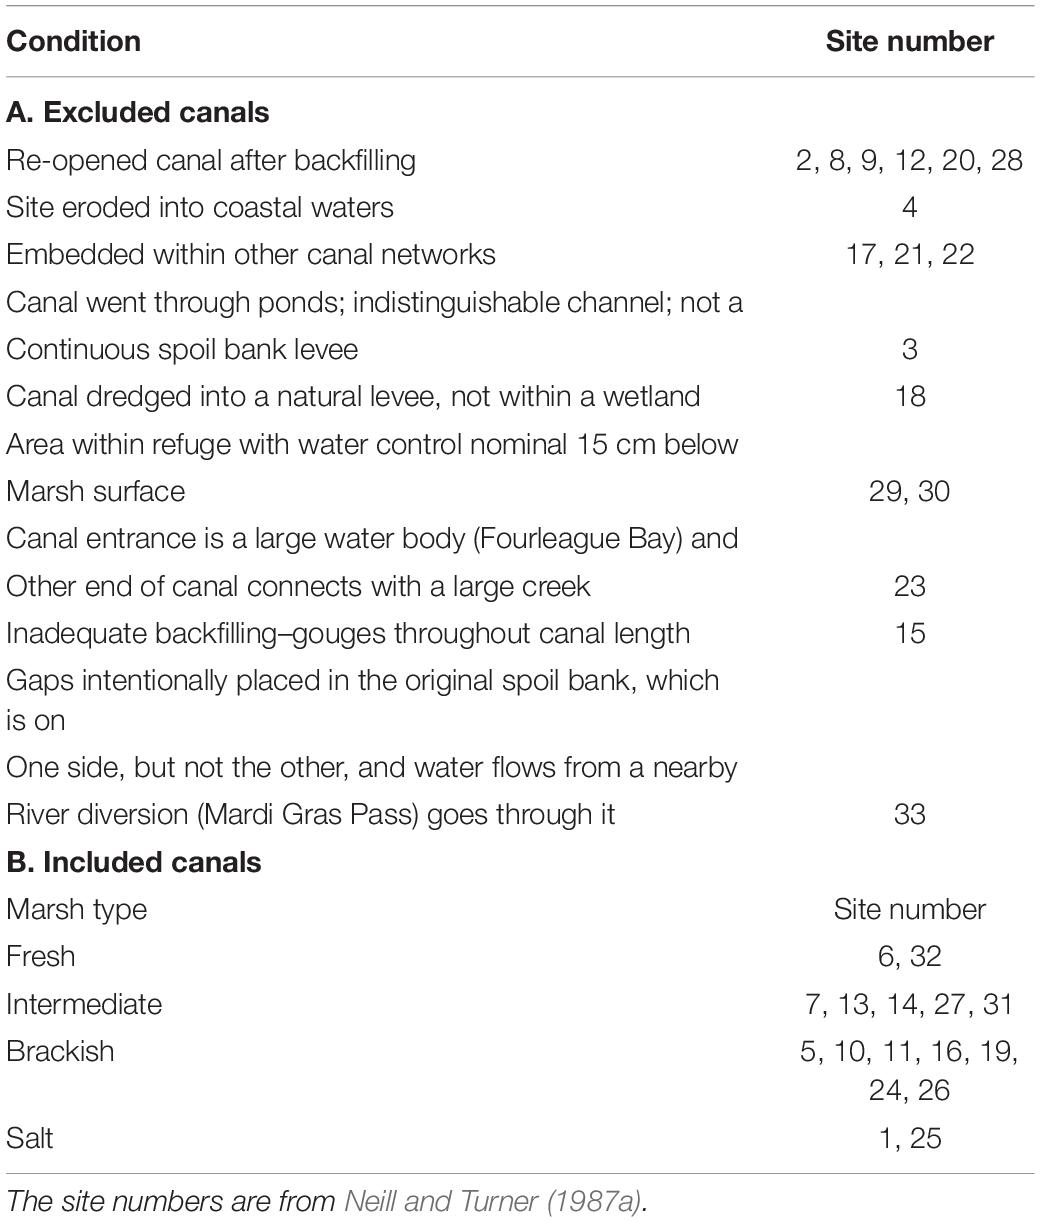
I examined three groups of backfilled sites in Louisiana whose cumulative number are all those known to exist, other than when backfilling was done immediately after pipeline canal placements (i.e., Abernethy and Gosselink, 1988). The largest and oldest group, Group 1, consisted of 33 backfilled sites first studied by Neill and Turner (1987a) whose backfilling occurred between 1979.6 and 1984 and had an average date of 1982.1 ± 0.2 year (mean ± 1 s.e.). The backfilled sites were identified by the State of Louisiana’s Office of Coastal Zone Management as part of their permitting process and were not part of a scientific experiment; rather, they were sites of opportunity required in the permit if there was no gas or oil reservoir discovered. These sites represented all the backfilled sites known at the time and are in fresh, intermediate, brackish and salt marshes. The site numbering, site names, open water area of the canal when dredged, the size of the spoil bank formed by the dredged material, and habitat recovery 5 years after backfilling were reported by Neill and Turner (1987a). Wetland restoration in these canals and on spoil banks was subsequently examined by Turner et al. (1994) and Baustian and Turner (2006), 9 and 20 years after backfilling, respectively. Re-vegetation was measured in all 33 canals in this study (see below), but only sixteen of these thirty-three canals were used to measure wetland restoration success (Figure 1). Information on the location and condition of these sixteen appropriate sites is in Supplementary Material 1 which includes a recent satellite image and site characteristics on location, canal construction and backfilling date, and restoration success. The other seventeen canals were inappropriate sites to measure success for reasons summarized in Table 1; examples are in Figure 2. Briefly, six of these seventeen canals were not used because they were re-opened after backfilling; three canals were impounded by other canals surrounding them to create expansive open water areas whose water level fluctuations would be constrained by the spoil banks; two canals had weirs and levees keeping water levels within 3 cm of the marsh surface. Six other canals were not included because: (1) one site eroded into coastal waters, (2) the entrance to a short canal was at the edge of a large lake and the distal end connected to a creek, (3) more than half of the spoil banks at one canal were gouged indicating that the canal was poorly backfilled, (4) one canal was dredged within a network of ponds making measurements of canal area impossible, (5) one canal was dredged into a natural levee (not a wetland), and (6) another canal had the spoil bank intentionally constructed to be discontinuous—unlike the others—and because it became a conduit for water from a nearby river diversion (Mardi Gras Pass) to go through it at its distal end.
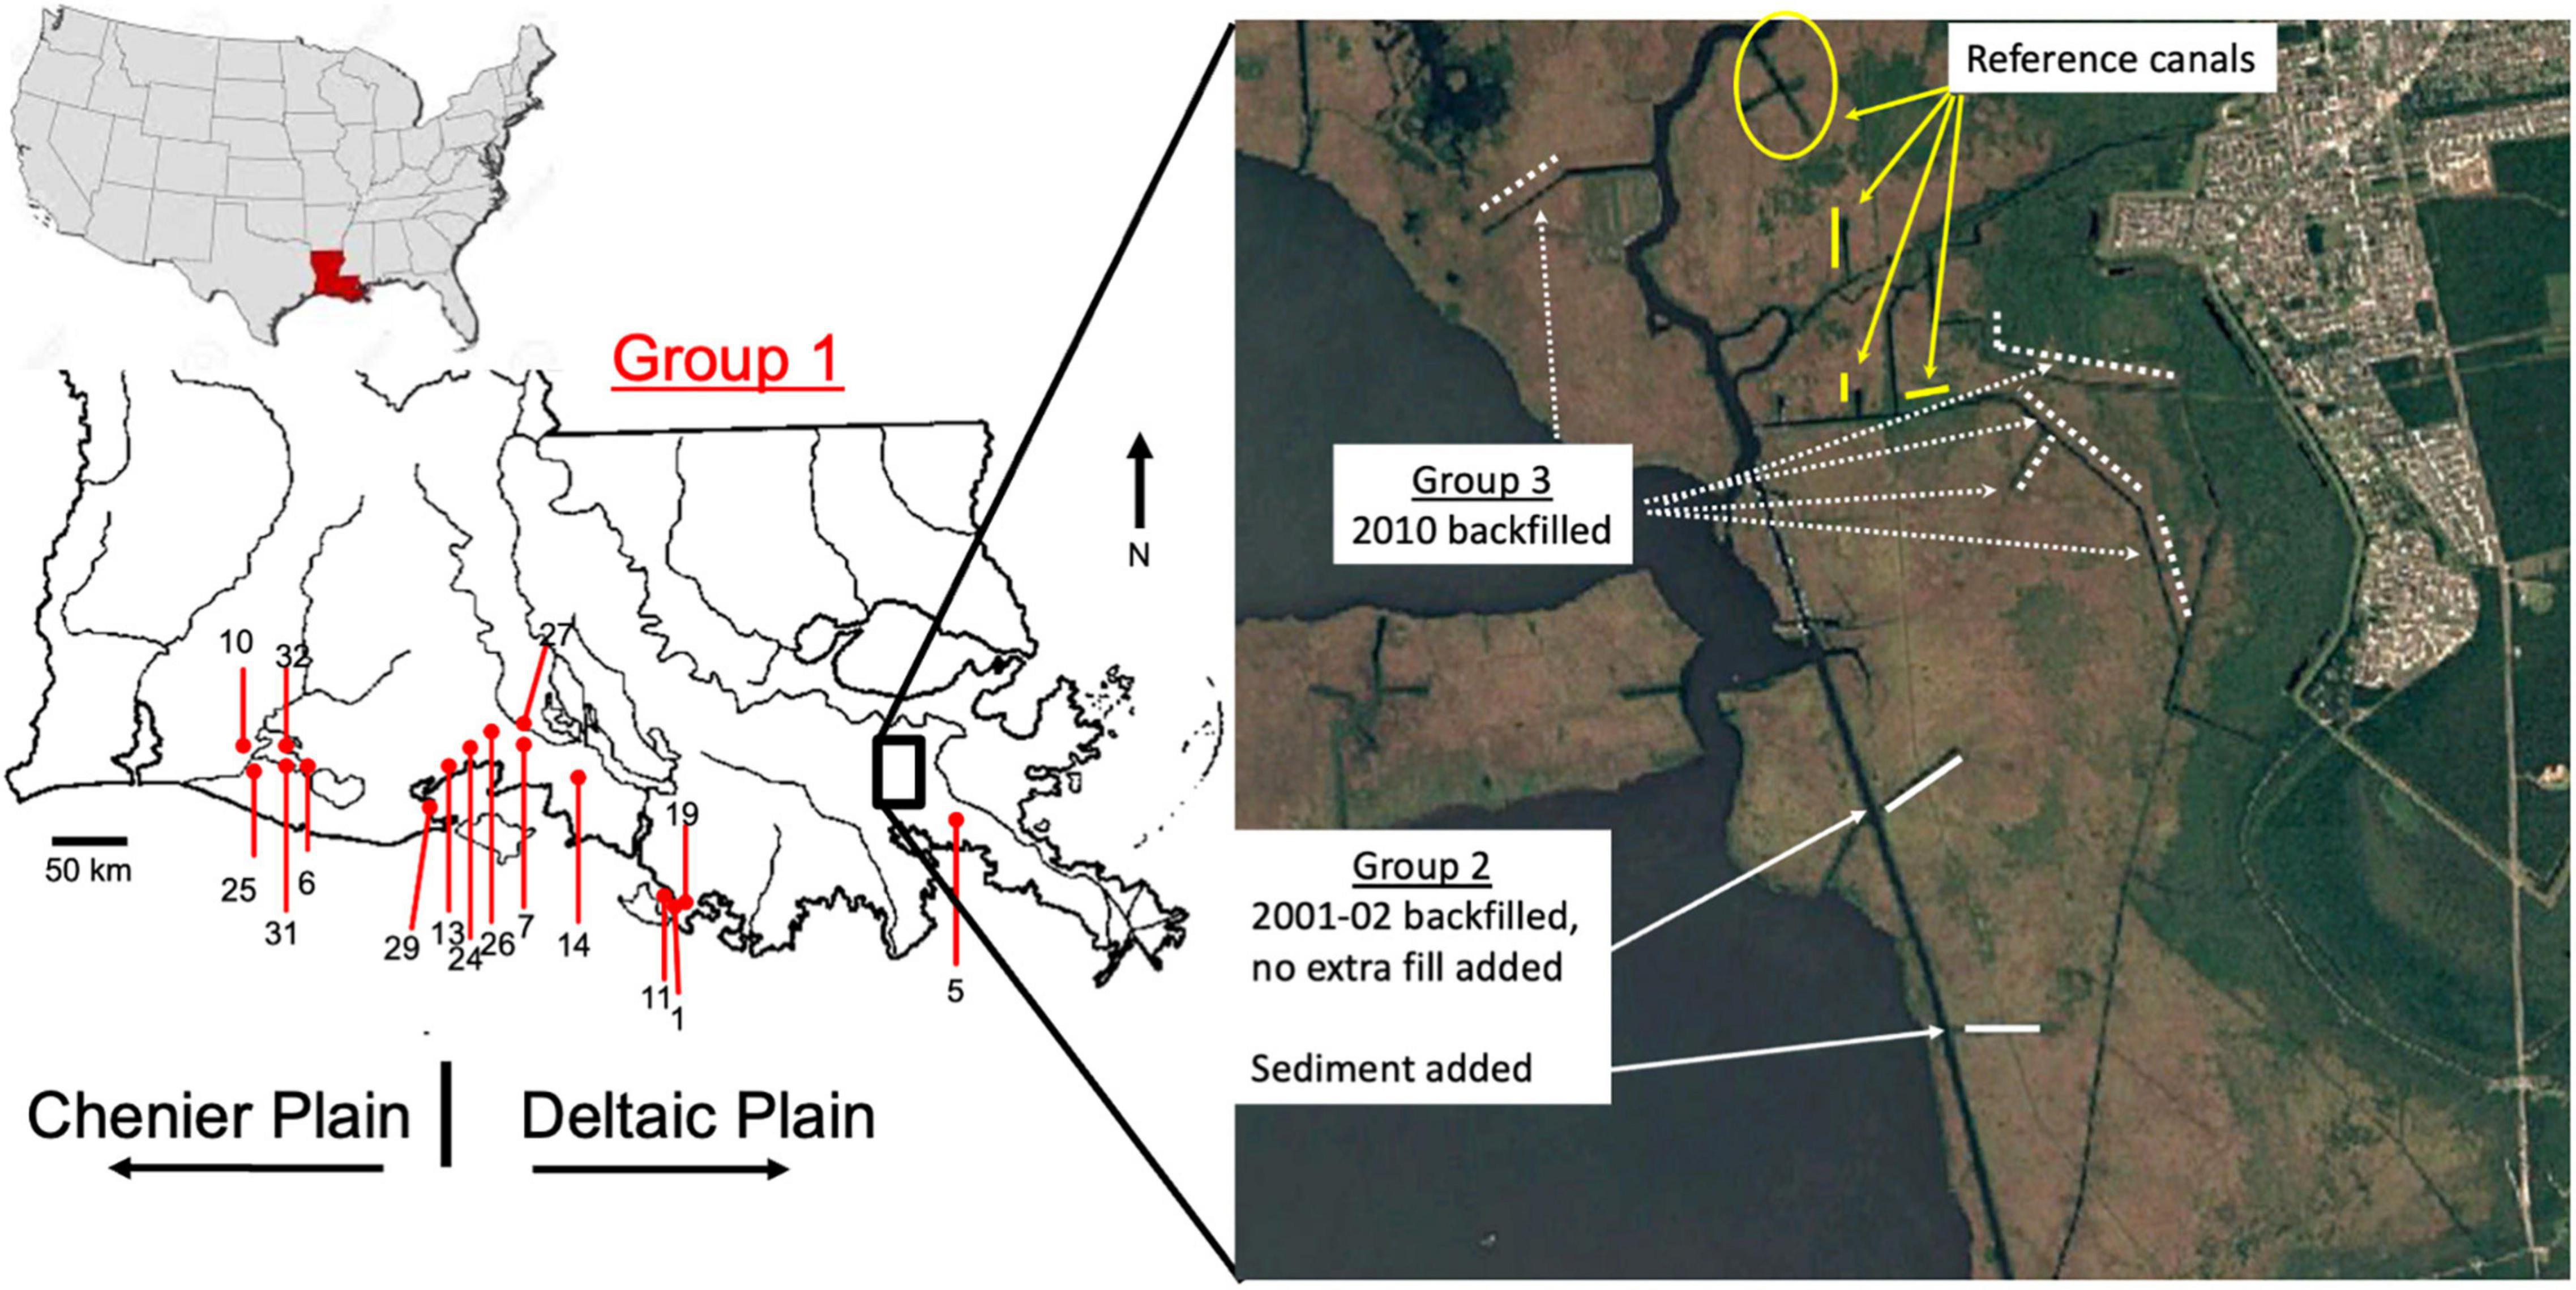
Figure 1. Location of the sixteen across the Louisiana coast (Group 1) and the backfilled canals in the Jean Lafitte Park (Groups 2 and 3).
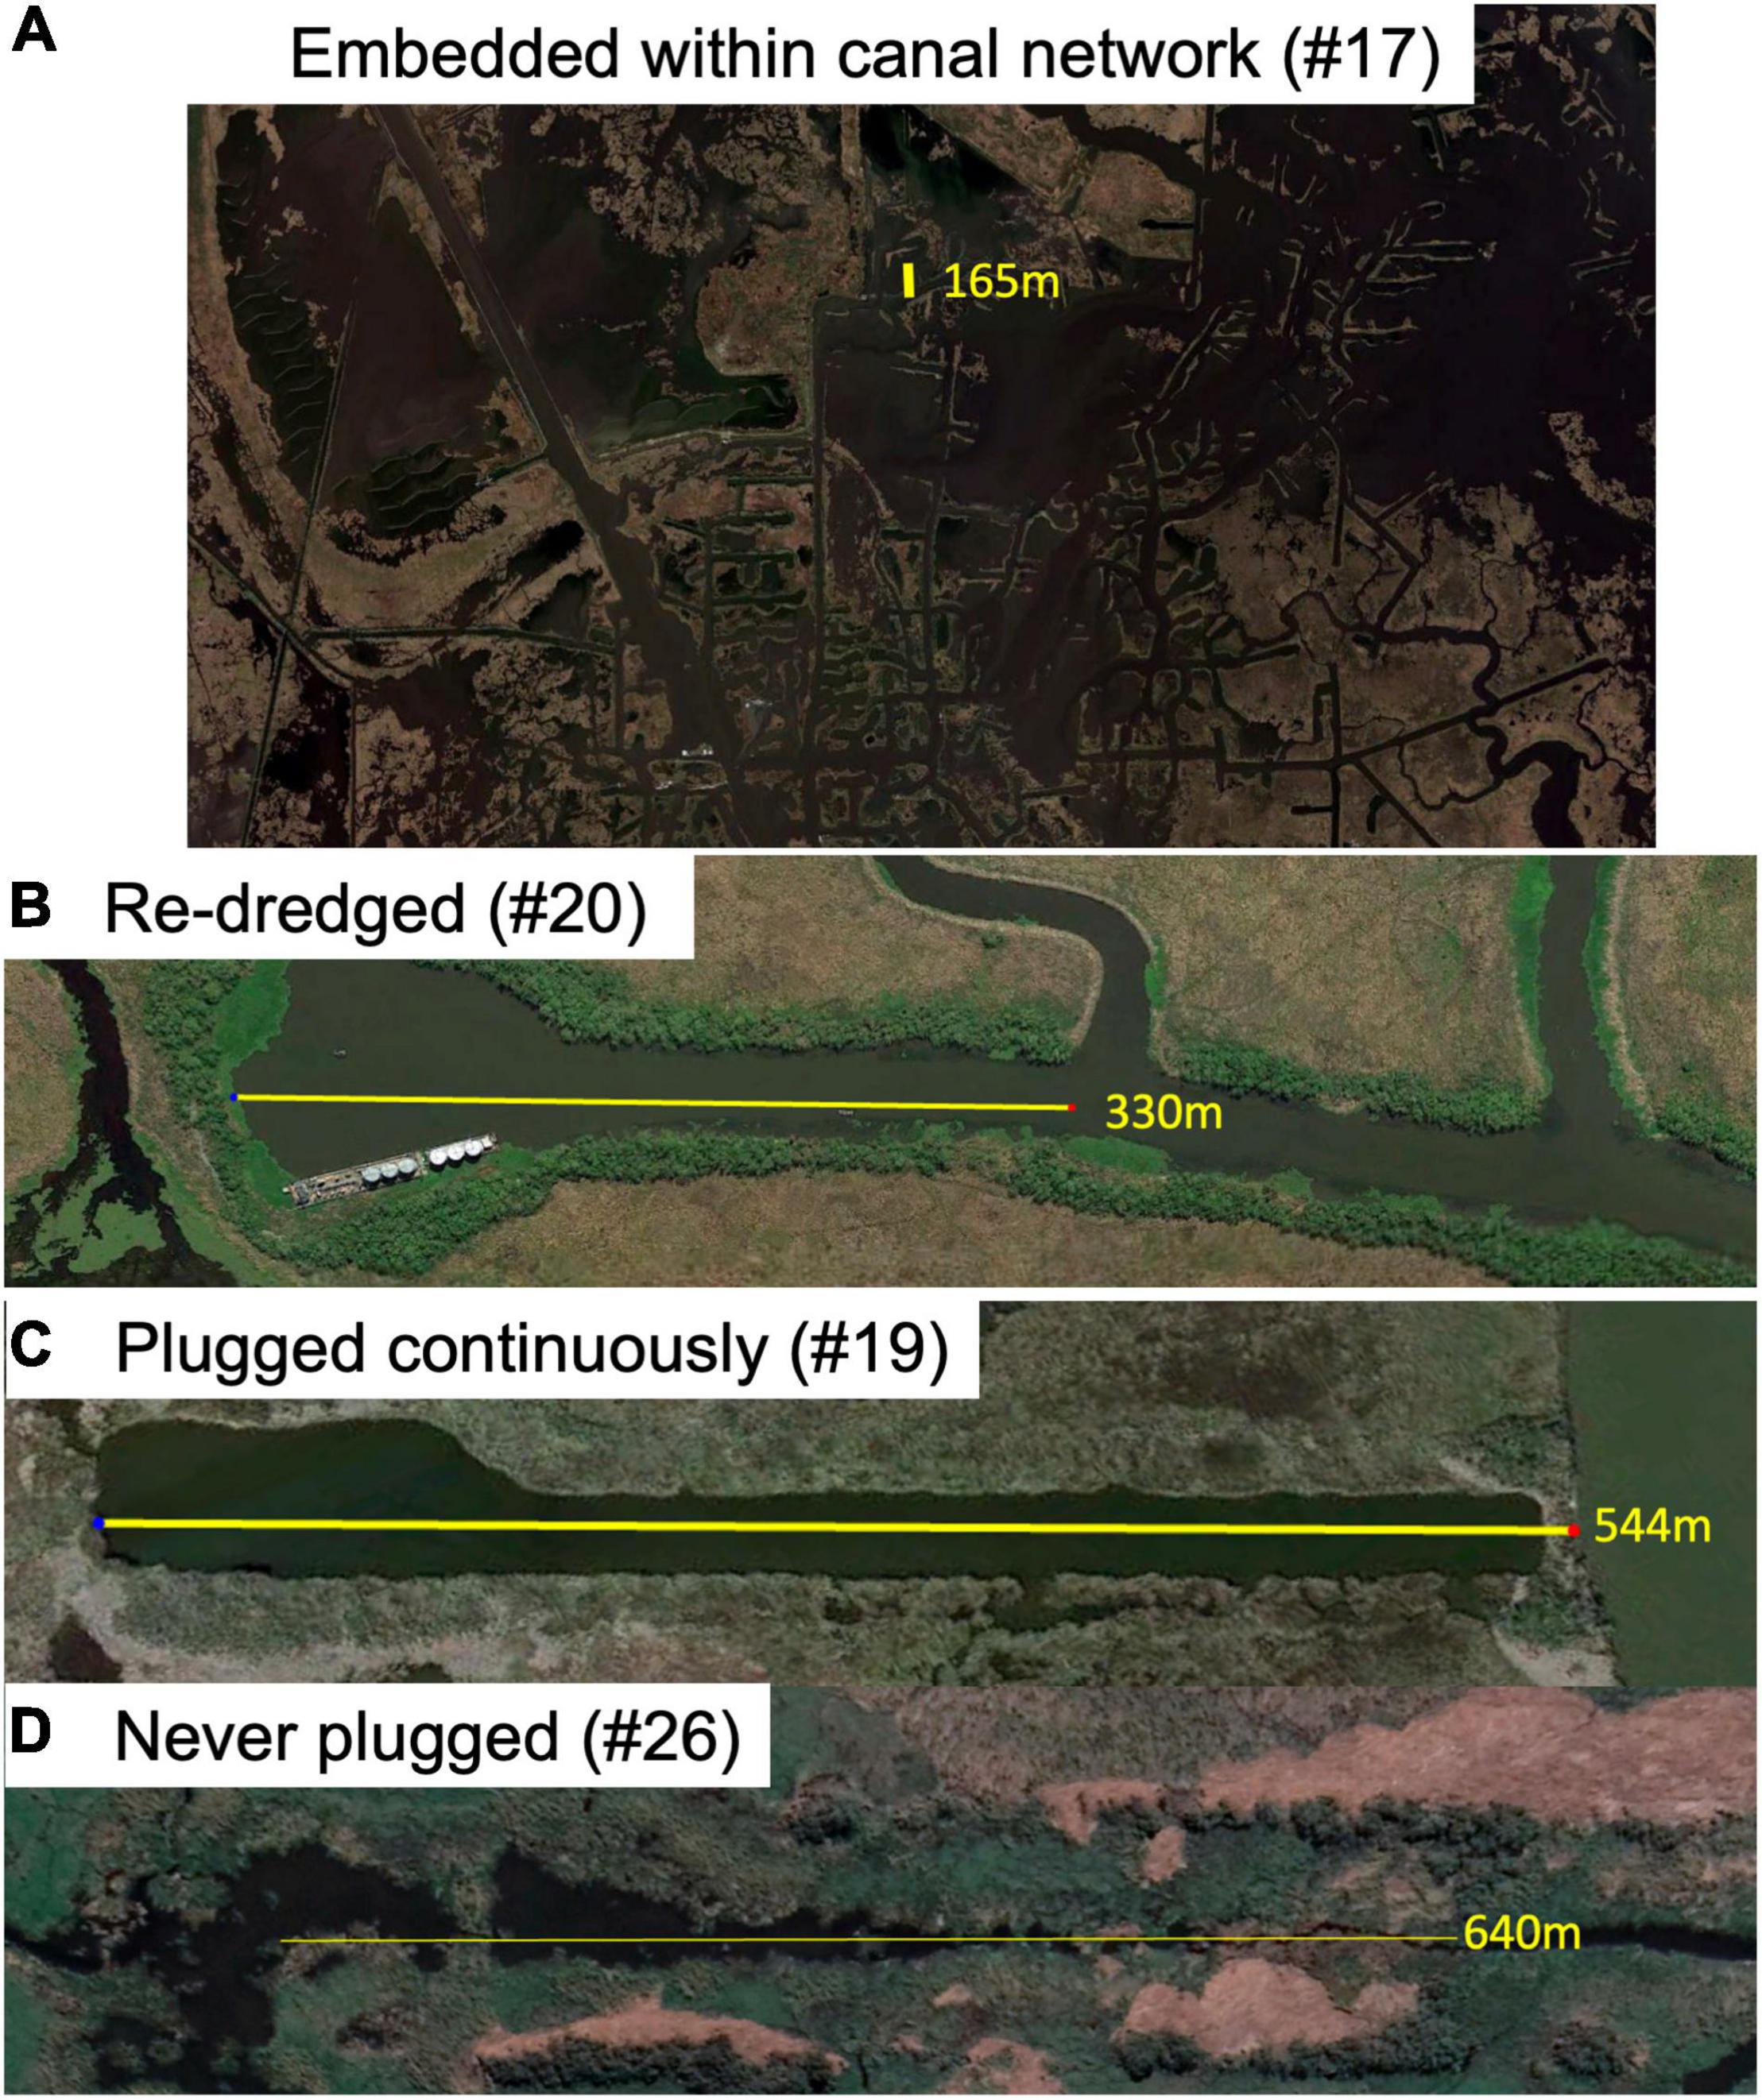
Figure 2. Examples of canals backfilled under different conditions. (A) Backfilled canal #19 is surrounded by multiple layers of other canals, spoil banks and natural levees. Much of the former wetland is now open water. (B) Backfilled canal #20 was later re-dredged and spoil bank placed on either side in a continuous line, as before backfilling. (C) Canal #19 was plugged when backfilled and the plug remained decades later. (D) Canal #26 was never plugged. A yellow line goes down the center of each canal and its length is identified.
Backfilled sites in Group 2 are in the Barataria Preserve of the Jean Lafitte Historical National Park located 15 km south of New Orleans, Louisiana, and in the Barataria basin. The 8,097 ha Park is comprised of bottomland hardwood forest, bald cypress swamp, and fresh or intermediate peat marshes and interconnected canals and waterways. The canals were in fresh to intermediate wetlands overlying organic soils that are sometimes floating (Swarzenski, 1992). Backfilling canals in National Parks is intended to restore the natural conditions, per National Park Service guidelines (National Park Service, 2000). Two canals that are 2 km apart from each other were backfilled between December 2001 and February 2002 (Figure 2) by putting the trees, shrubs, and remaining spoil bank levee material into the open canal using a small dredge. The northern one was formed in 1954 and the southern one in 1958. The southern canal had material from a nearby lake bottom added to fill the canal during backfilling. The percent restoration of wetland vegetation in the two canals and on the spoil banks after 5 years was compared in Baustian and Turner (2006).
Backfilling sites in Group 3 are also in the Park and were completed in 2010. Group 3 canals were compared to restoration in reference canals in the area that were not backfilled and that are within 3 km of each other and of similar vegetation (Figure 1).
Satellite Imagery
The satellite imagery is from Google Earth Pro (build date 7.3.3.7786) and I used its measuring tool to estimate the open water area and canal length in satellite images dated from 1998 to the latest posted image, which had an average date of 2019.9 ± 0.2 for Group I sites. The area of mudflats was easily recognizable, but floating vegetation could not be confidently distinguished from emergent vegetation in all parts of the images. I made measurements of the area and covariance for 1, 2, 3, 4, 5, and 6 estimates of three images and determined that one measurement was within ± 1 Std. Dev. of six measurements of the same image. The Coefficient of Variance for the same six estimates was less than 2% (Supplementary Material 2). One measurement of open water area was therefore deemed acceptable and used for each image.
The percent open water in the latest image was compared to the area of disturbance at the time of backfilling that was determined by Neill and Turner (1987a) whose estimates were based on field visits and inspection from a small plane. Whether a plug at the canal entrance was visible or not in the latest image and whether it was required in the permit was noted by them. The height of the plug’s surface above water could not be determined from satellite images and was only occasionally described in permit applications, and rarely mentioned in field inspections in State and Federal Agency reports from that era. The open water in the backfilled and reference canals in the Park was measured for images from 1998, 2004, 2006, 2013, 2019, and 2020. The images are from the National Aeronautics and Space Administration/United States Geological Program Landsat Program. Wetland restoration of a canal or spoil bank was based on the appearance of emergent vegetative cover.
A 2 km radius (1,257 ha) circle was centered in the expanded area at the end of each of the canals in Group 1 (the “keyhole”) visible in the most recent imagery available in Google Earth Pro. The area within the circle included all land but excluded the open water if it was the ocean, estuarine bay or Gulf Intracoastal Waterway. Satellite images of all sites are in the Supplementary Material 3. The canal length (km) per km2 land and the percent land in the hydrologic unit containing that land was measured using a point count method that included at least 100 points within the 4 km diameter circle.
Statistical Analyses
All statistical analyses used Prism 8.0c software© 2020 (GraphPad Software, Inc., La Jolla, California) to calculate the mean ± 1 standard error (μ ± 1 s.e.) and simple linear regressions. I used an unpaired t-test with Welch’s correction to compare the restoration success in canals with and without plugs for Group 1 canals. The level of significance was p < 0.05. A linear regression described the relationship between canal density (canal length/land area; km km–2) and the percent land in the circle.
Results
Canal Density and Percent Land
The percent land in the 2 km circles of the Group I backfilled sites is directly related to canal density (Figure 3). The equation for the simple linear regression of percent land vs. canal density is Y = −24.52*X + 101.1 (R2 = 0.34; F = 16.47, p < 0.001). This result is anticipated because of the direct conversion of land to water as a result of dredging the canal and the indirect losses from hydrologic factors. Turner and McClenachan (2018) described a similar correlation between the total indirect + direct land loss vs. percent canal area in 15 min quadrangle maps of the deltaic plain from the 1930s to 1990.
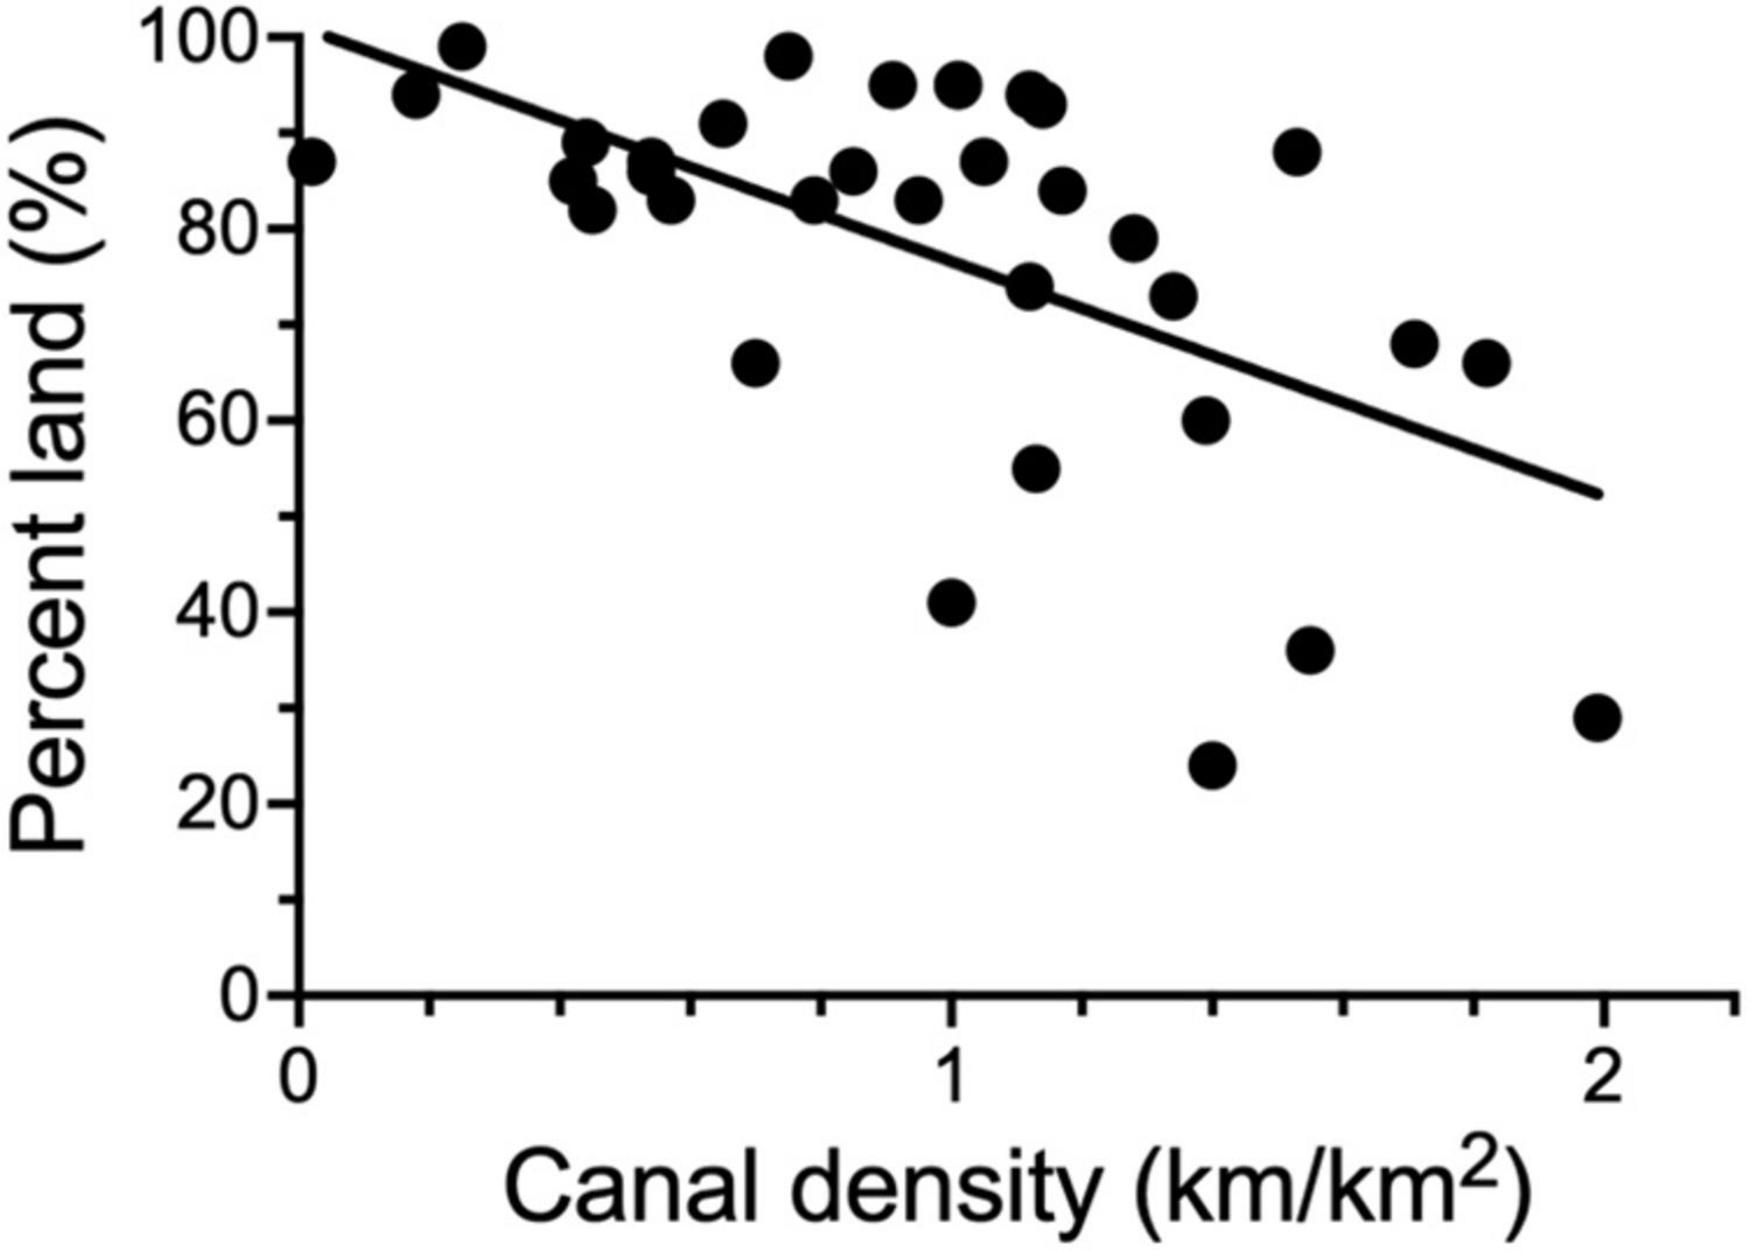
Figure 3. The relationships between the percent land and canal density (canal length/land area) in 2 km diameter circles in Group 1 as of circa 2020. A simple linear regression of the data is shown.
Group 1 Characteristics
The average size of all 33 backfilled canals when dredged was 1.41 ± 0.12 ha, and 1.68 ± 0.21 ha for the sixteen backfilled canals that were not compromised by re-dredging or hydrologic conditions (Table 1). There were 2, 5, 7, and 2 sites in fresh, intermediate, brackish, and salt marshes, respectively. The canal areas were 30 and 29% of the total disturbed area (spoil bank + canal) for all 33 sites in Group 1 and in the 16 site subset, respectively. The average size and disturbed area of the subset of 16 backfilled canals, therefore, was not different from the size of the 33 backfilled canals immediately after backfilling.
Groups 2 and 3 Characteristics
Backfilling canals in the Park occurred over two different time periods. The addition of sediments to one canal backfilled in 2001–2002 was about 40% higher 20 years later than of a nearby canal backfilled at the same time but without sediments added (Figure 4A). There was a 20% restoration of the canals backfilled in 2010 within 10 years, which compared to a 4% restoration in the reference canals (Figure 4B).
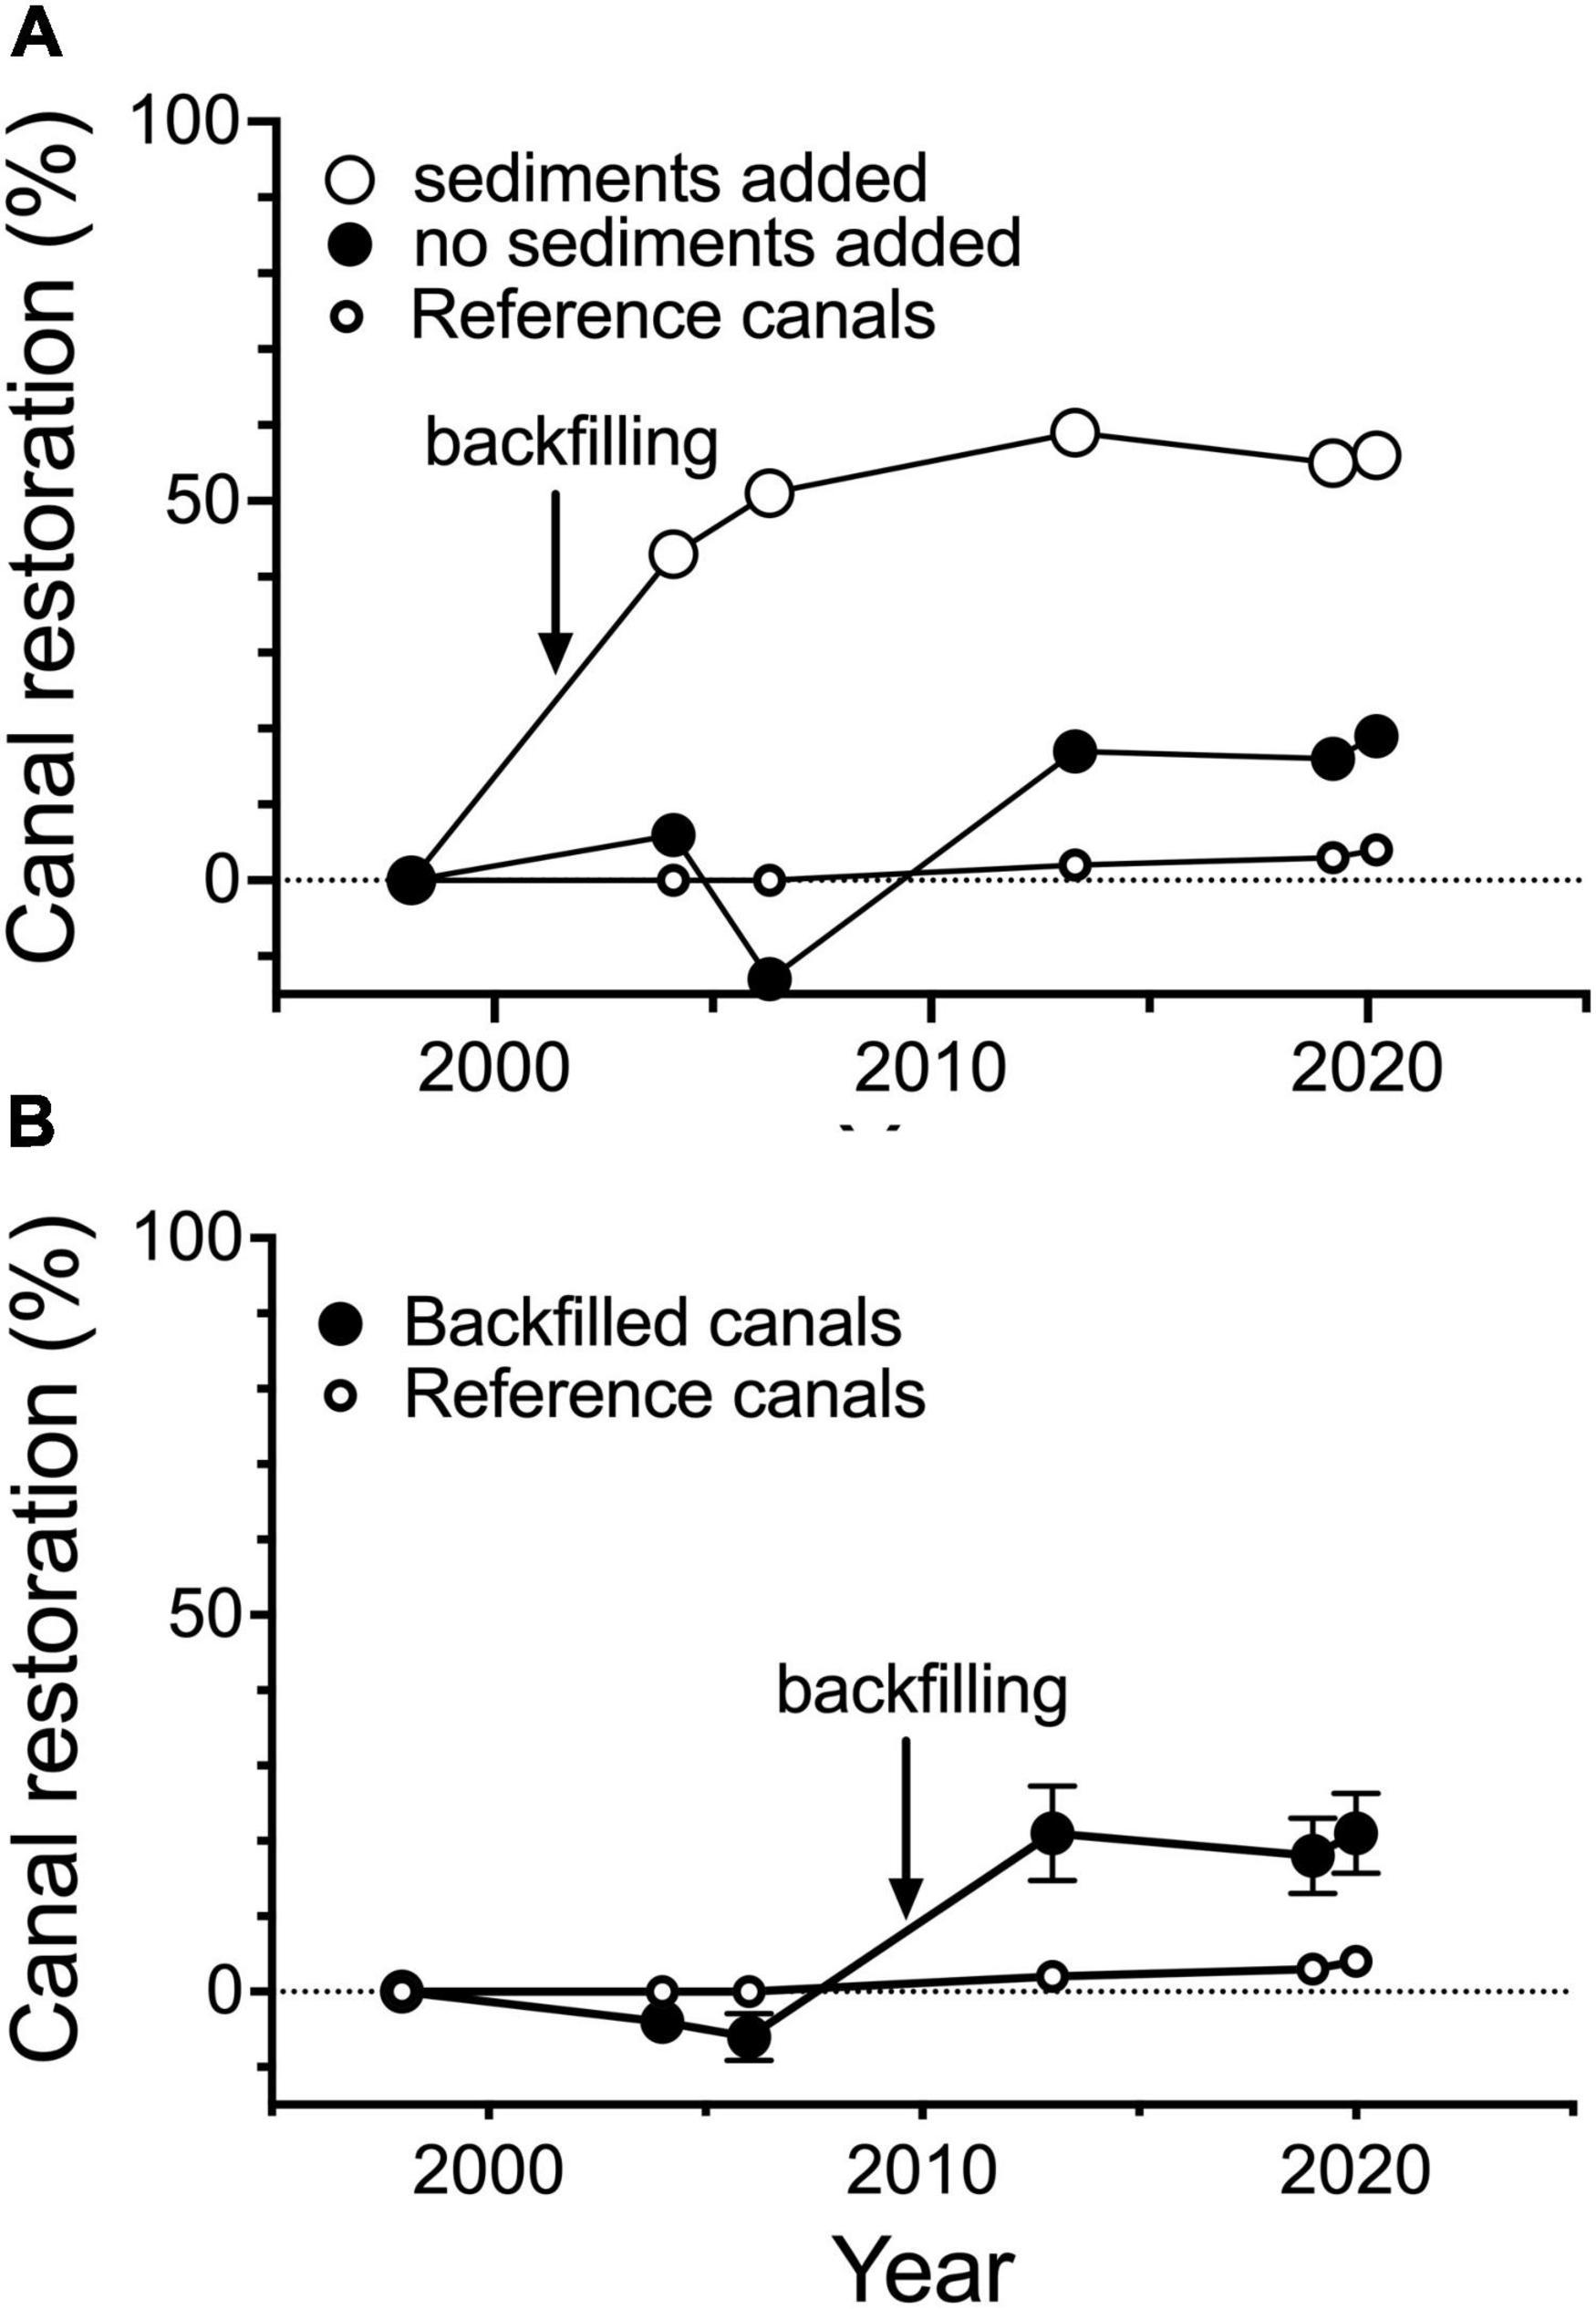
Figure 4. The wetland restoration of the open water of backfilled canals in the Park. (A) Restoration in a single canal backfilled in 2001–2002 and another nearby reference canal that was also backfilled and a sediment slurry was added to fill the canal. (B) Wetland restoration (percent) in canals backfilled in 2010 and nearby reference canals that were not backfilled. The standard error is covered by the symbols.
Restoration of Spoil Banks and Canals
A comparison of the restoration on spoil bank and canals shows a rapid wetland re-vegetation of the spoil bank (> 80% within 5 years) and a slower wetland re-vegetation of the open water (about 20% after 39 years) in all 16 canals from Group 1 (Figure 5A). The spoil bank area is 2.3 times larger than the canal area and so the total restoration for spoil bank + canal area was 75% after 39 years. The wetland restoration of the open water in canals without a plug was more than twice the average at all sites. When only canals without plugs are included, then the equation for the simple linear regression of percent restoration in canals vs. year is Y = 1.68*years–4.94 (Figure 5B; R2 = 0.91; F = 48.9, DFn = 5; p < 0.001). The addition of sediment during backfilling reached about the same restoration rate after 9 years that all unplugged backfilled sites reached in 30–40 years (Figure 5B).
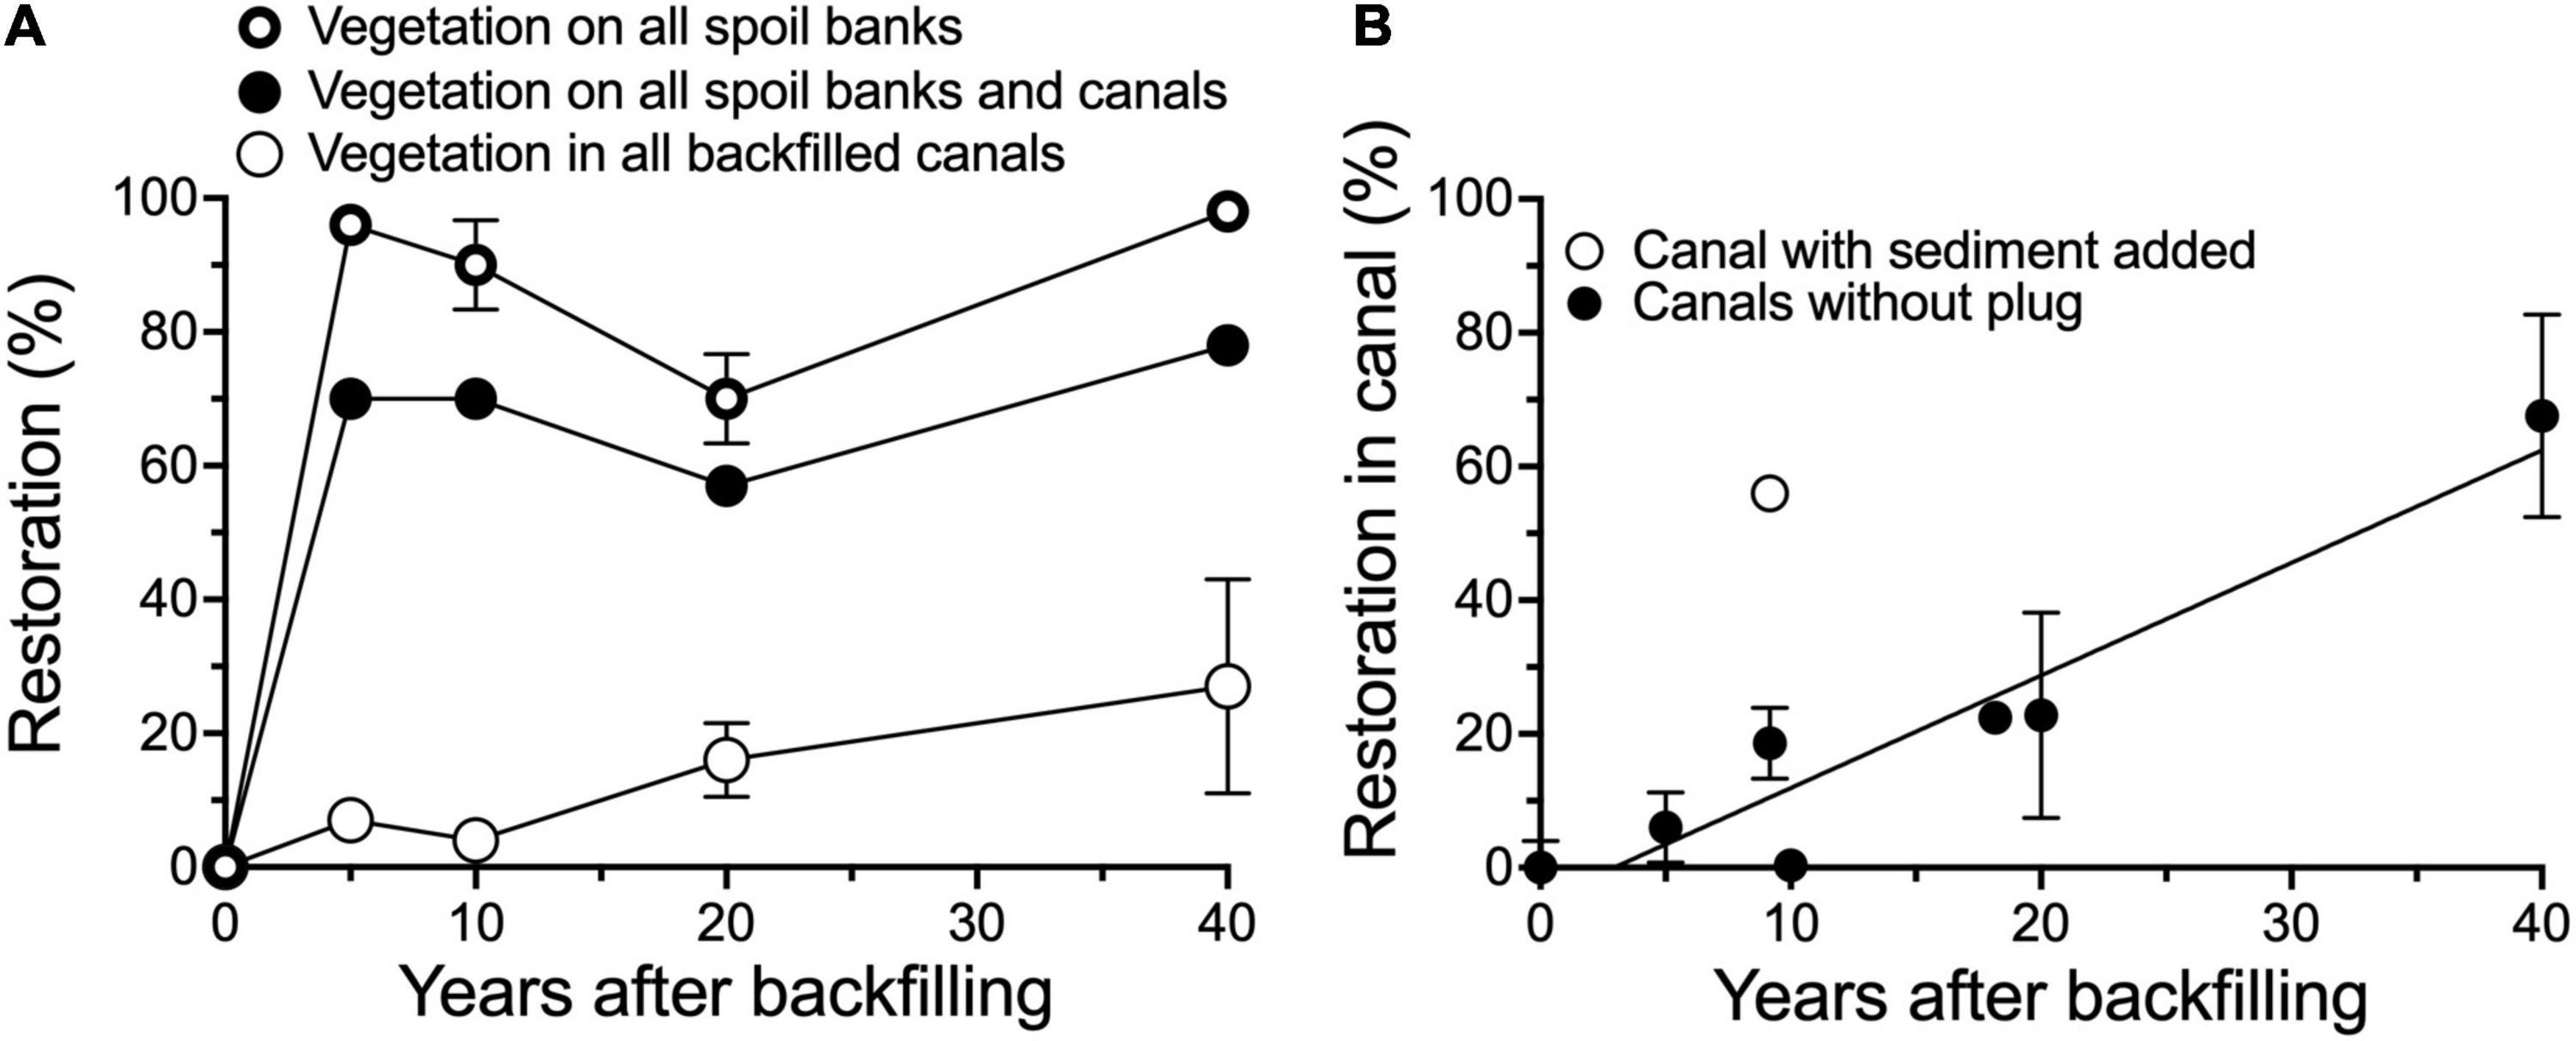
Figure 5. The wetland restoration in the 16 backfilled canals (μ ± 1 s.e.). (A) Restoration on spoil banks, in canals and total disturbed area for all backfilled canals. (B) The wetland restoration of the differently aged, backfilled canals where there was not a complete plug after backfilling. One canal (open circle) had sediment added as part of the backfilling. A simple linear regression line is shown in (B). The dots are the mean ± 1 s.e.
Canal Restoration
The wetland restoration of the open water in backfilled canals after 39 years was 68 ± 15% (n = 5) for canals without plugs at the time of backfilling and 6 ± 20% (n = 11) for canals that had a plug after backfilling (Figure 6). The difference between the plugged and unplugged data sets was significant at p = 0.026 (F = 3.74). The excluded canals had an expansion of the canal beyond that at the time of the initial dredging. The general tendency was that the hydrologic restrictions from water control and surrounding canals and spoil banks led to no restoration (and higher wetland losses) and that plugging canals inhibited wetland restoration in the canals.
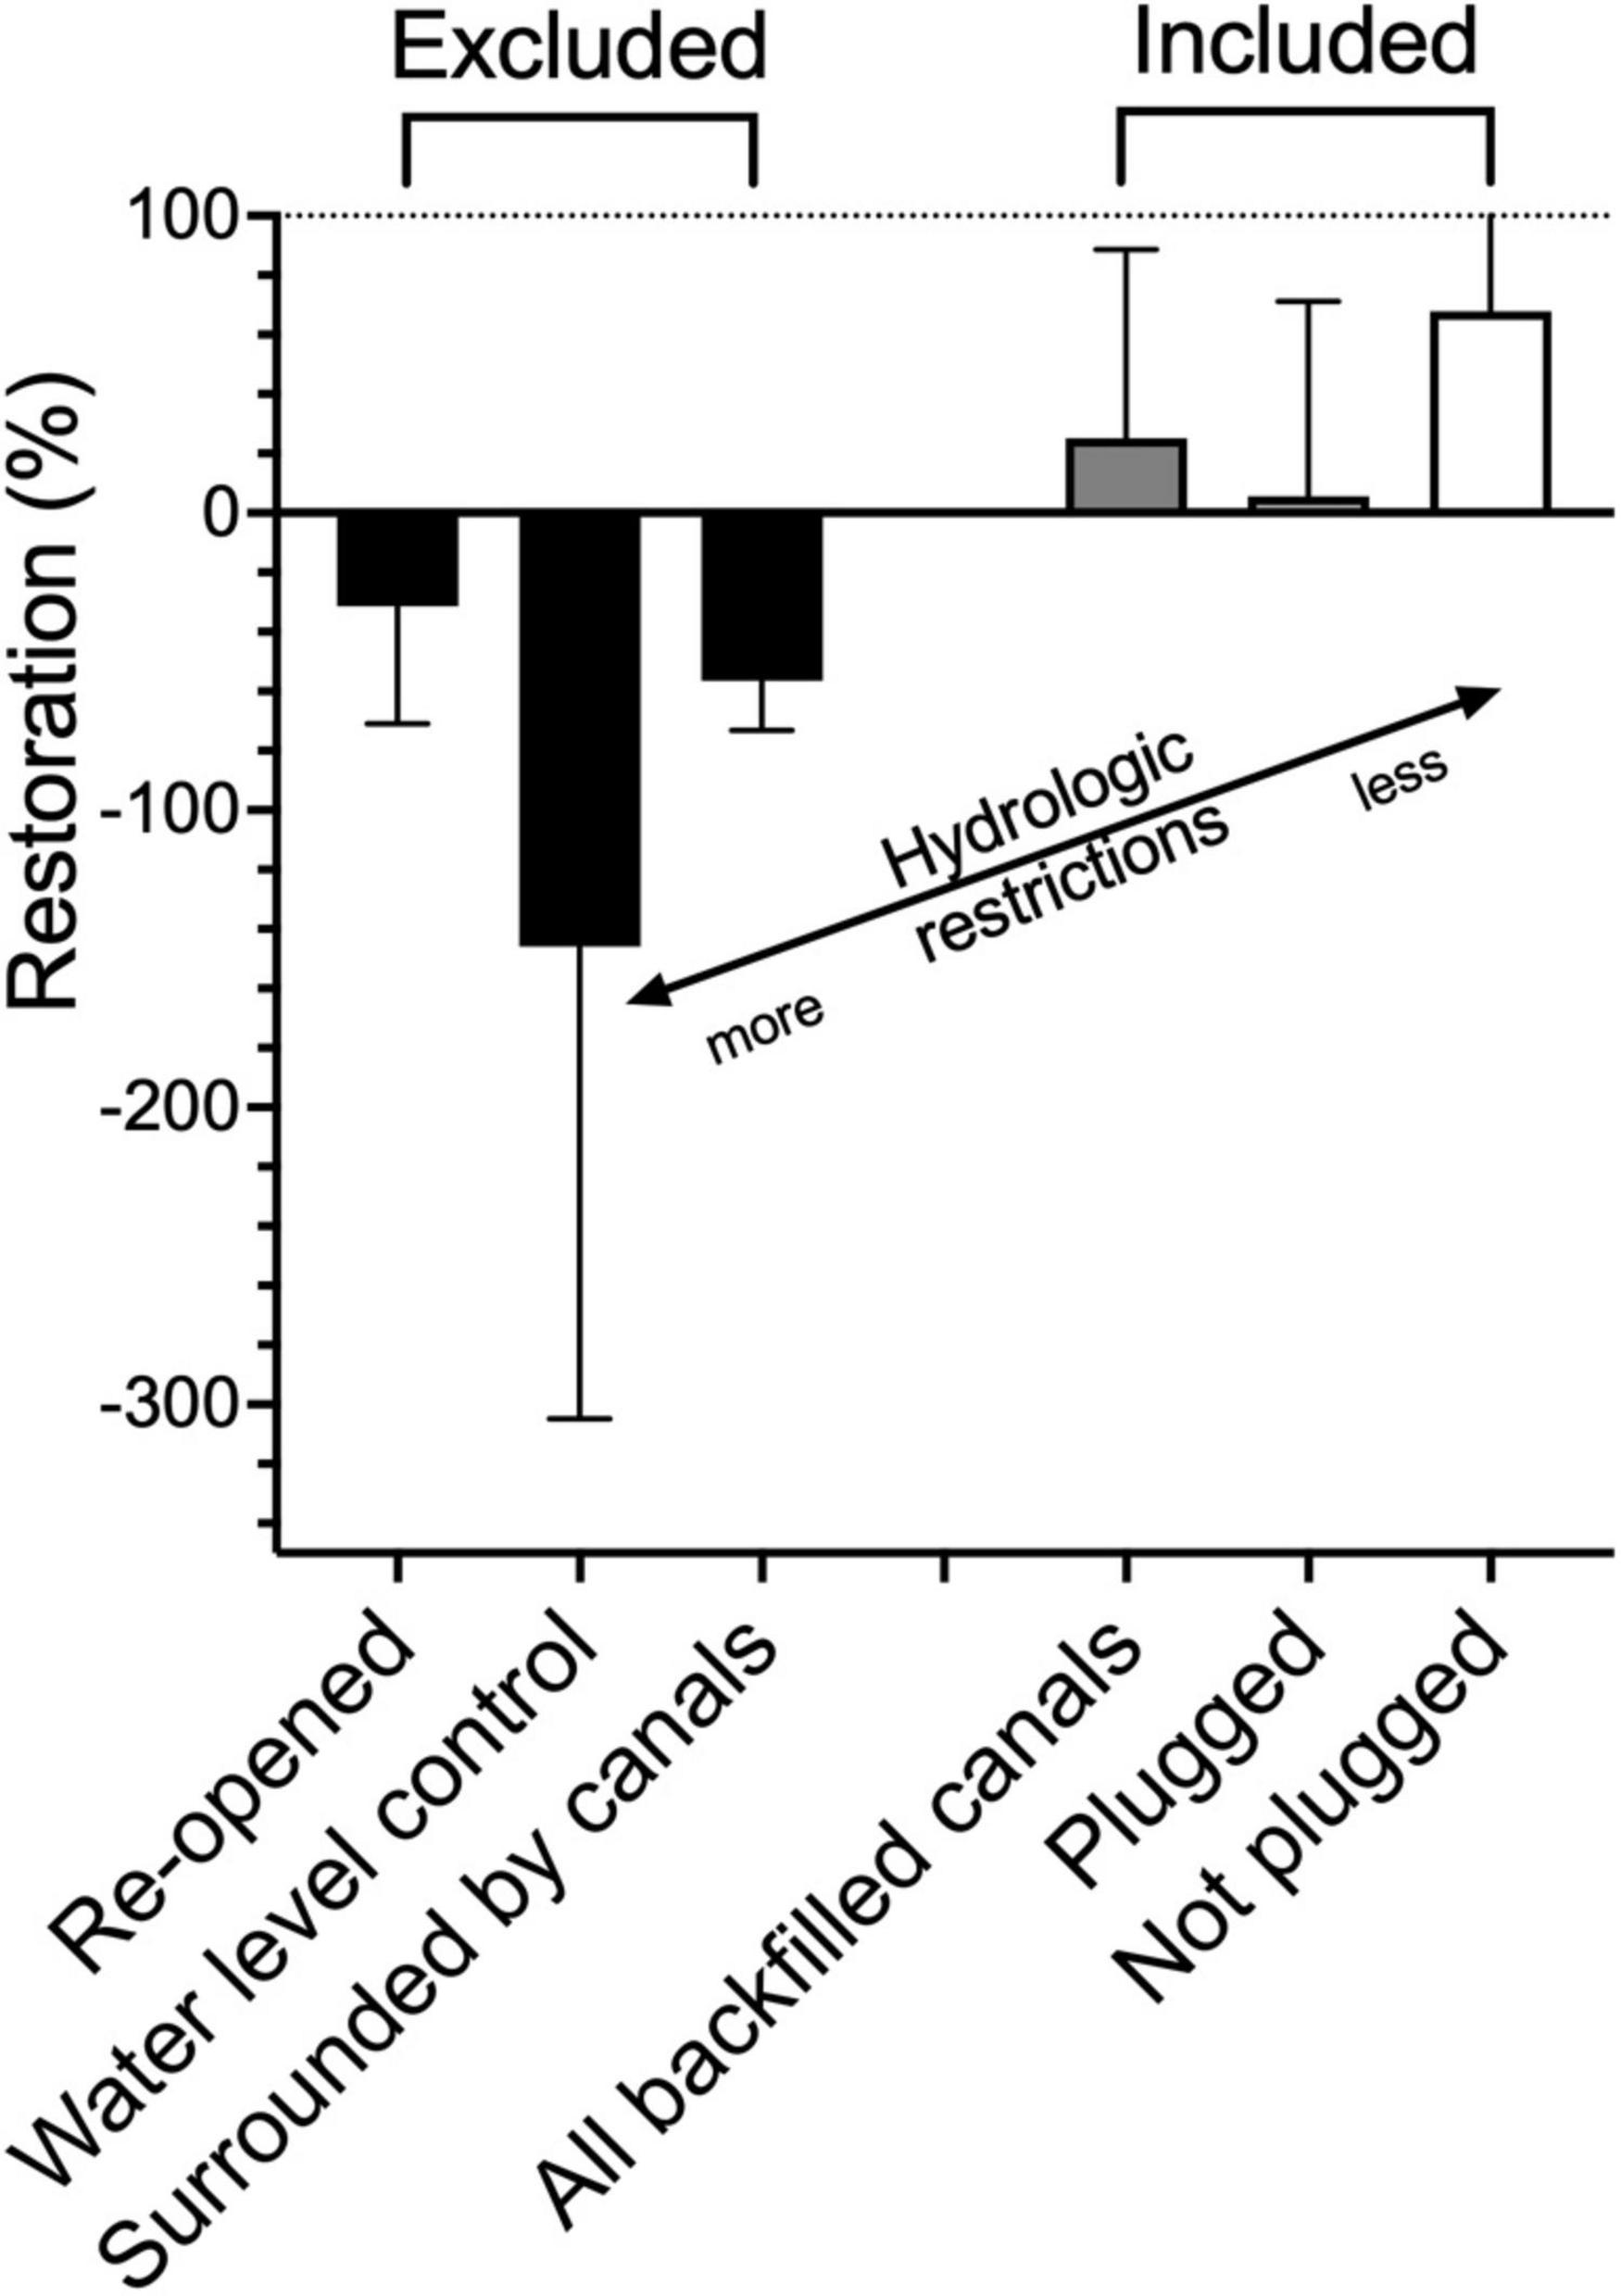
Figure 6. A summary of the percent wetland restoration of open water in the Group 1 backfilled canals after 39 years. The excluded sites had mostly no restoration, and the average was negative. The wetland restoration in the plugged canals was significantly lower than in canals without a fully closed plug after backfilling.
Discussion
The backfilled canal size and marsh types are suitable restoration exemplars for this coast because: (1) the average open water area of the canals dredged between the 1930s to 1990 was 1.59 ha (Turner and McClenachan, 2018) which is about the same as the average backfilled canal in the Neill and Turner (1987a) data set and the subset of 16 canals from Group 1 that was used here; (2) the amount of land within 2 km diameter circles surrounding backfilled canals declines with increasing canal density (km km2) as it does for the deltaic coast; and, (3) the 16 canals are found within all marsh types and are spread across the coast (Figure 1). These backfilled canals are useful, therefore, to predict wetland restoration success of future backfilled sites.
Restoration
Restoration after backfilling was a uniformly positive outcome for the well-situated backfilled canals in Louisiana and are a model for canal restoration elsewhere. There was almost complete re-vegetation on the spoil bank at all backfilled sites after 39 years, which proceeded faster than in the canal’s open water area. The re-vegetation in the open water area of the canal was slowed if the canal was plugged at the entrance when backfilled and was about one-tenth that of unplugged canals. Unplugged canals were 68% restored after 39 years and the total area disturbed by dredging (canal + spoil bank area) was 75% restored after 39 years. The difference is due to the reduced water exchange between canal and surrounding landscape that is blocked by plugs at the entrance of the canal and because the spoil banks made of the high-density mineral soils that were put on top of the marsh compresses the underlying material (Turner and Swenson, 2020); a “bathtub” of standing water is created with minimal drainage. Migratory fish do not have access to the canal, but grassbeds may be more abundant there that birds may be attracted to Neill and Turner, 1987a,b. A plug, however, blocks boat access which may help reduce erosion because of boat wakes at the canal’s entrance (Turner and Mo, 2021).
The open water area of backfilled canals within hydrologically compromised locations (water control structures or dense canal networks) did not revegetate but expanded. Hydrologic control reduces water level fluctuations (Swenson and Turner, 1987) and raises average water levels, particularly when passive weirs are used (Cowan et al., 1988). Pond formation from 1955 to 1978 in the Biloxi marshes of southeastern Louisiana was three times higher in marshes with weirs than without weirs (Turner et al., 1989) and pond formation is directly related to their distance to canals (Turner and Rao, 1990). A key inhibiting agent of restoration results from spoil banks blocking belowground flow and inhibiting aboveground flows (Turner and Swenson, 2020) and occurs in forested wetlands too. Megonigal et al. (1997), for example, described how artificial controls on natural flooding reduced the aboveground productivity of forested bottomland forests. Trepagnier et al. (1995) showed how restoration of abandoned agricultural impoundments in coastal Louisiana wetlands increased when as little as 5% of the levees impounding them failed. Part of the problem is caused by soil subsidence in organic soils behind weirs and levees—this subsidence increases with partial or complete reduction in flooding (Turner, 2004). These examples of the consequences of restricting hydrologic flows in coastal wetlands are why wetland restoration efforts remove the hydrologic barriers (e.g., Burdick et al., 1996; Turner and Lewis, 1996; Galatowitsch, 2012).
Sediment Additions
There is only one well-documented case of using sediment additions to enhance backfilling success and it demonstrated a strong, positive influence on re-vegetation which may higher or lower elsewhere. Cost is a factor to consider because adding sediment to a site may cost as much as backfilling another seven canals (Baustian et al., 2009). The binary choice for finances seems to be whether to restore more wetlands at a slower rate, or to restore fewer wetlands a faster rate. Randolph (2018) quotes academic and a non-governmental organization erroneously saying that sediment additions to the canal are necessary for backfilling. Sediment additions will assist restoration based on the one example from the Park but clearly restoration occurs without sediment addition.
Implementation Issues
Backfilling can be done immediately all across the coast to quickly create wetland habitat and store carbon in the process. There is no shortage of canals to backfill, it is not a complex undertaking, the equipment is broadly available, and maintenance is inconsequential. The wetland habitat restoration sustains economies based on subsistence living, including those by Sovereign Native American Nations. Unlike some other methods, the resident dolphin population is not threatened (Marine Mammal Commission [MMC], 2021)1 and flooding of nearby wetlands, homes and recreational camps is not increased.
The cost to backfill canals at the Park, adjusted for inflation, was $8,954 ha–1 for the canal and spoil bank combined (Baustian et al., 2009), which is relatively inexpensive compared to other approaches. This compares, for example, to the five times higher cost of building land using large diversions of river water (Turner and McClenachan, 2018). But backfilling is not included in the State’s Master Plan to restore the coast (Coastal Protection and Restoration Authority [CPRA], 2017). The upper limit to restoring wetlands in all of the abandoned 27,483 canals presently in coastal wetlands is that it would cost about $400 million, although not all canals are suitable for backfilling; this dollar amount is a small portion of the State’s $50 billion restoration plan (Turner and McClenachan, 2018).
Recommendations
Louisiana’s coastal land loss from 2010 to 2016 was zero after peaking in the 1960s (Couvillion et al., 2017), which is consistent with the empirical relationships of direct and indirect consequences of dredging on coastal land losses in time and space (Turner and McClenachan, 2018). This recent stability is perhaps a temporary condition in light of the expected further acceleration in sea level rise and resulting increased flooding of emergent plants. There is still time to restore canals and spoil banks before sea level rise overwhelms the ability of wetlands to sustain an equilibrium position. These findings demonstrate that actions on the < 10 ha scale damages wetlands and that restoring the natural hydrology at the same scale can restore those damages. But backfilling, often required as part of the permit, was rarely done after the first canal was dredged, or after the Coastal Zone Management Program started in 1980. Perhaps each parish could administer a de-centralized program that would have a nuanced knowledge of land ownership, safe anchorages, sunken boats, and disposal of materials from dredging channels, etc.; they could decide when and which canals to backfill, monitor and build local histories of success more effectively than the agencies that have chosen to ignore backfilling. Backfilling decisions made at a local level would benefit from the existing consensus agreement to restore wetlands that is held by the local communities who have a shared social-ecological understanding of the system in need of restoration (Cote et al., 2021).
Data Availability Statement
The original contributions presented in the study are included in the article/Supplementary Material, further inquiries can be directed to the corresponding author/s.
Author Contributions
RT designed, conducted all research, wrote, and edited the manuscript.
Funding
Financial support was provided to the Lowland Center by the National Estuary Program Coastal Watersheds Grant Program (Contract #NEPCWG-20) and Lowlander and National Fish and Wildlife Foundation (Grant NA20NOS4730027).
Conflict of Interest
The author declares that the research was conducted in the absence of any commercial or financial relationships that could be construed as a potential conflict of interest.
Publisher’s Note
All claims expressed in this article are solely those of the authors and do not necessarily represent those of their affiliated organizations, or those of the publisher, the editors and the reviewers. Any product that may be evaluated in this article, or claim that may be made by its manufacturer, is not guaranteed or endorsed by the publisher.
Acknowledgments
Joseph J. Baustian, James M. Lee, Giovanna McClenachan, Charles S. Milan, David Muth, Christopher Neill, Dusty Pate, Erick M. Swenson, and Nancy F. Walters participated in various backfilled projects over the last 45 years to provide a foundation for this analysis. The Canal Group Team of the Lowlander Center is gratefully thanked for their upright and thoughtful contributions to the common good. Lauris Hollis and Julie Torres provided many helpful comments on the manuscript.
Supplementary Material
The Supplementary Material for this article can be found online at: https://www.frontiersin.org/articles/10.3389/fevo.2022.899596/full#supplementary-material
Footnotes
- ^ https://media.fisheries.noaa.gov/dam-migration/mmpawavierconsultation_mmccomments_12march2018_opr1.pdf
References
Abernethy, R. K., and Gosselink, J. G. (1988). Environmental conditions of a backfilled pipeline canal four years after construction. Wetlands 8, 109–121.
Ash, E. H. (2017). The Draining of the Fens: Projectors, Popular Politics, and State Building in Early Modern England. Johns Hopkins Studies in the History of Technology. Baltimore: Johns Hopkins University Press.
Baustian, J., and Turner, R. E. (2006). Restoration success of backfilling canals in coastal Louisiana marshes. Restor. Ecol. 14, 634–644. doi: 10.1111/j.1526-100X.2006.00175.x
Baustian, J., Turner, R. E., Walters, N. F., and Muth, D. (2009). Restoration of dredged canals in wetlands: a comparison of methods. Wetl. Ecol. Manag. 17, 445–453. doi: 10.1007/s11273-008-9122-6
Burdick, D. M., Dionne, M., Boumans, R. M., and Short, F. T. (1996). Contrasts in ecological responses to tidal restoration of two New England salt marshes. Wetl. Ecol. Manag. 4, 129–144. doi: 10.1007/BF01876233
Coastal Protection and Restoration Authority [CPRA] (2017). Louisiana’s Comprehensive Master Plan for a Sustainable Coast (2017). Baton Rouge, LA: Coastal Protection and Restoration Authority.
Costanza, R., de Groot, R., Sutton, P., van der Ploeg, S., Anderson, S. J., Kubiszewski, I., et al. (2014). Changes in the global value of ecosystem services. Glob. Environ. Change 26, 152–158. doi: 10.1016/j.gloenvcha.2014.04.002
Cote, D., Van Leeuwen, T. E., Bath, A. J., Gonzales, E. K., and Cote, A. L. (2021). Social–ecological management results in sustained recovery of an imperiled salmon population. Restor. Ecol. 29:e13401.
Couvillion, B. R., Beck, H., Schoolmaster, D., and Fischer, M. (2017). Land area Change in Coastal Louisiana (1932 to 2016). Pamphlet to Accompany U.S. Geological Survey Scientific Investigations Map 3381. Reston, VA: U.S. Geological Survey.
Cowan, J. H. Jr., Turner, R. E., and Cahoon, D. R. (1988). Marsh management plans in practice: do they work in coastal Louisiana? Environ. Manag. 12, 37–53.
Horton, B. P., Shennan, I., Bradley, S. L., Cahill, N., Kirwan, M., Kopp, R. E., et al. (2018). Predicting marsh vulnerability to sea-level rise using Holocene relative sea-level data. Nat. Commun. 9, 1–7. doi: 10.1038/s41467-018-05080-0
Mann, C. C. (2008). Ancient earthmovers of the Amazon. Science 142, 1148–1152. doi: 10.1126/science.321.5893.1148
Marine Mammal Commission [MMC] (2021). Letter to Louisiana Trustee Implementation Group. Maryland: Marine Mammal Commission.
Megonigal, J. P., Conner, H., Kroeger, S., and Sharitz, R. R. (1997). Aboveground production in southeastern floodplain forests: a test of the subsidy-stress hypothesis. Ecology 78, 370–384.
National Park Service (2000). Management Policies 2001. Washington DC: Department of the Interior, National Park Service.
Neill, C., and Turner, R. E. (1987a). Backfilling canals to mitigate wetland dredging in Louisiana coastal marshes. Environ. Manag. 11, 823–836.
Neill, C., and Turner, R. E. (1987b). Comparisons of fish communities in open and plugged backfilled canals in Louisiana coastal marshes. N. Am. J. Fish. Manag. 7, 57–62.
Ohimain, E. I., and Eteh, D. (2021). Canalization induced topographic, hydrologic, and land use changes in Olero Creek, Benin River owing to petroleum exploration activities. Environ. Monit. Assess. 193, 1–14. doi: 10.1007/s10661-021-09319-0
Randolph, N. (2018). License to extract: how Louisiana’s Master Plan for a Sustainable Coast is sinking it. Lateral 7:2. doi: 10.25158/L7.2.8
Rippon, S. (2000). The Transformation of Coastal Wetlands: Exploitation and Management of Marshlands Landscapes in North West Europe during the Roman and Medieval Periods. Oxford: Oxford University Press.
Schepers, L., Brennand, P., Kirwan, M. L., Guntensbergen, G. R., and Temmerman, S. (2020). Coastal marsh degradation into ponds induces irreversible elevation loss relative to sea level in a microtidal system. Geophys. Res. Lett. 47:e2020GL089121. doi: 10.1002/lno.10381
Stagg, C. L., Osland, M. J., Moon, J. A., Hall, C. T., Feher, L. C., Jones, W. R., et al. (2019). Quantifying hydrologic controls on local- and landscape-scale indicators of coastal wetland loss. Ann. Bot. 125, 365–376. doi: 10.1093/aob/mcz144
Swarzenski, C. M. (1992). Marsh Mat Movement in Coastal Louisiana Marshes – Effect of Salinity and Inundation on Nutrients and Vegetation. Ph.D. thesis. Norfolk, VA: Old Dominion University.
Swenson, E. M., and Turner, R. E. (1987). Spoil banks: effects on a coastal marsh water-level regime. Estuar. Coast. Shelf Sci. 24, 599–609.
Trepagnier, C. M., Kogas, M. A., and Turner, R. E. (1995). Evaluation of wetland gain and loss of abandoned agricultural impoundments in South Louisiana from 1978 to 1988. Restor. Ecol. 3, 299–303. doi: 10.1111/j.1526-100X.1995.tb00097.x
Turner, R. E. (2004). Coastal wetland subsidence arising from local hydrologic manipulations. Estuaries 27, 265–272.
Turner, R. E., Day, J. W., and Gosselink, J. G. (1989). Weirs and their effects in coastal wetlands (exclusive of fisheries). Proc. Louisiana Geological Survey/US Fish Wildlife Serv. Marsh Manag. Symp. Biol. Rep. 89, 151–163.
Turner, R. E., Kearney, M. S., and Parkinson, R. W. (2018). Sea level rise tipping point of delta survival. J. Coast. Res. 34, 470–474. doi: 10.2112/JCOASTRES-D-17-00068.1
Turner, R. E., Layne, M., Mo, Y., and Swenson, E. M. (2019). Net land gain or loss for two Mississippi River diversions: caernarvon and Davis Pond. Restor. Ecol. 27, 1231–1240. doi: 10.1111/rec.13024
Turner, R. E., Lee, J. M., and Neill, C. (1994). Backfilling canals to restore wetlands: empirical results in coastal Louisiana. Wetl. Ecol. Manag. 3, 63–78. doi: 10.1007/BF00177297
Turner, R. E., and Lewis, R. R. III (1996). Hydrologic restoration of coastal wetlands. Wetl. Ecol. Manag. 4, 65–72.
Turner, R. E., and McClenachan, G. (2018). Reversing wetland death from 35,000 cuts: opportunities to restore Louisiana’s dredged canals. PLoS One 13:e0207717. doi: 10.1371/journal.pone.0207717
Turner, R. E., and Mo, Y. (2021). Salt marsh elevation limit determined after subsidence from hydrologic change and hydrocarbon extraction. Remote Sens. 13:49. doi: 10.3390/rs13010049
Turner, R. E., and Rao, Y. S. (1990). Relationships between wetland fragmentation and recent hydrologic changes in a deltaic coast. Estuaries 13, 272–281.
Turner, R. E., and Swenson, E. M. (2020). The life and death and consequences of canals and spoil banks in salt marshes. Wetlands 40, 1957–1965. doi: 10.1007/s13157-0(20-01354-w
United Nations Environment Programme [UNEP] (2021). Becoming #GenerationRestoration: Ecosystem Restoration for People, Nature and Climate. Nairobi: United Nations Environment Programme.
United Nations General Assembly [UNGA] (2019). United Nations Decade on Ecosystem Restoration (2021–2030), Resolution 73/284, Adopted by the General Assembly. New York, NY: United Nations General Assembly.
Keywords: wetlands, restoration, canals, dredging, backfilling, Louisiana
Citation: Turner RE (2022) Wetland Restoration Progress 39 Years After Canal Backfilling. Front. Ecol. Evol. 10:899596. doi: 10.3389/fevo.2022.899596
Received: 18 March 2022; Accepted: 01 June 2022;
Published: 20 June 2022.
Edited by:
Susan Galatowitsch, University of Minnesota Twin Cities, United StatesReviewed by:
A. Rita Carrasco, University of Algarve, PortugalTom Langen, Clarkson University, United States
Gary Shaffer, Southeastern Louisiana University, United States
Copyright © 2022 Turner. This is an open-access article distributed under the terms of the Creative Commons Attribution License (CC BY). The use, distribution or reproduction in other forums is permitted, provided the original author(s) and the copyright owner(s) are credited and that the original publication in this journal is cited, in accordance with accepted academic practice. No use, distribution or reproduction is permitted which does not comply with these terms.
*Correspondence: R. Eugene Turner, ZXV0dXJuZUBsc3UuZWR1
 R. Eugene Turner