Abstract
The tree Schima superba is important for afforestation and fire prevention in southern China. The wood of this tree can also be used for furniture and buildings. However, the lack of genetic background and genomic information for this species has lowered wood yield speed and quality improvement. Here, we aimed to discover genome-wide single nucleotide polymorphisms (SNPs) in 302 S. superba germplasms collected from southern China and to use these SNPs to investigate the population structure. Using genotyping by sequencing, a total of 785 high-quality SNP markers (minor allele frequency [MAF] ≥ 0.05) were identified from 302 accessions collected from seven geographical locations. Population structure analyses and principal coordinate analyses (PCoAs) indicated that these germplasm resources can be clearly separated into different populations. The S. superba accessions originating from Yunnan (YN) and Guangxi (GX) fell into the same population, separate from the accessions originating from Guangdong (GD), which indicated that these two regions should be regarded as major provenances of this species. In addition, two independent core germplasm sets with abundant genetic polymorphisms were constructed to support the breeding work. The identification of SNP markers, analyses of population genetics, and construction of core germplasm sets will greatly promote the molecular breeding work of S. superba.
Introduction
Schima superba is a precious and cultivated evergreen broad-leaved tree that is naturally distributed in southern China (Zhang et al., 2019). This species is valued commercially for its timber because the hardness of its wood is higher than most tree species, which is suitable for furniture and buildings (Wang et al., 2018). In addition, this species is used as fire breaks and thus helps to protect forests from fires (Zhou et al., 2006; Zhang et al., 2013; Yang et al., 2017a,b). Finally, it is important for afforestation projects in southern China because it has superior growing speed in this region and has a long history of cultivation, which makes it suitable for carbon fixation on a large scale (Wang et al., 2018; Xu et al., 2018). Therefore, S. superba plays important roles in forestry products and ecological protection systems. Germplasm resources are the most important basis for carrying out molecular breeding work and obtaining filial generations with superior phenotypes. Due to the long breeding cycle of woody trees using a conventional method, it is urgent to carry out the latest technical measures to accelerate the breeding work (Isik, 2014). Furthermore, the wide geographical distribution of S. superba in southern China laid a good foundation to carry out the relevant study.
To better characterize the current level of available S. superba diversity for future breeding efforts, large-scale population genetics analyses, using advanced molecular genotyping strategies, are needed. Marker-assisted selection (MAS) is a useful tool that accelerates the breeding cycle and has thus been used for many decades (Bernardo, 2008). Therefore, a large scale of molecular markers are needed to better realize molecular breeding. Across all types of molecular markers, single nucleotide polymorphisms (SNPs) are the most widely used, due to their ubiquity, uniform distribution, and high heritability (Verma et al., 2015; Luo et al., 2019). As next-generation sequencing (NGS) technologies have advanced, it has become easier to obtain large numbers of SNPs for modern breeding programs (Elshire et al., 2011; Manimekalai et al., 2020). Due to the advantages of low cost and high efficiency in mining SNPs, a method called genotyping by sequencing (GBS) has been successfully applied for population structure and population genetic diversity analyses in a wide range of crop plants and trees, such as Arachis hypogaea (Zheng et al., 2018), Rubus (Ryu et al., 2018), Fraxinus pennsylvanica (Wu et al., 2019), Picea (Elleouet and Aitken, 2019; Haselhorst et al., 2019), Camellia sinensis (Niu et al., 2019), Eleaeis guineensis (Babu et al., 2019), Pinus tabuliformis (Xia et al., 2018), and Quercus suber (Pina-Martins et al., 2019). Until now, large-scale genome-wide SNP identification and population genetics have not been reported in S. superba, except for a genetic map construction using a full-sib family (Zhang et al., 2019). Therefore, a small number of related studies and a lack of the molecular genetic background of germplasm resources hindered the development of S. superba molecular breeding work. The use of SNPs in germplasm resource populations will aid in thorough genomic assessments of population structure and inform MAS strategies for S. superba.
Here, NGS technologies were employed to confirm the genotypes of 302 S. superba accessions originating from Guangdong province, Yunnan province, and Guangxi Zhuang Autonomous Region in southern China. A set of high-quality SNPs were identified from the S. superba genome and used to confirm the SNP genotypes of these germplasm resources. Then, investigation and analyses of population genetic diversity, population structure, genetic relationship, genetic distance, and construction of core germplasm sets were conducted to better understand these resources. Our results not only describe the genetic diversity and population structure of collected and conserved S. superba accessions, the construction of a core germplasm set that can effectively promote crossbreeding, and the formation of high-quality offspring but also provide a framework for future breeding programs.
Materials and Methods
Plant Material
The 302 superior trees of S. superba were collected from Guangdong (GD), Guangxi (GX), and Yunnan (YN) provinces in southern China in 2003 and preserved in a resource nursery in Gaoyao District, Zhaoqing (22°59′9″N and 112°35′58″E) in Guangdong province using the grafting method (Supplementary Table S1). Mature leaves were collected from each accession on 31 October 2018 and stored at −80°C until DNA extraction.
DNA Extraction and GBS
Genomic DNA was extracted from a 0.5 g leaf sample from each accession using the DP320 DNAsecure Plant Kits (Tiangen, China), following the manufacturer's protocols. The concentrations of 302 extracted DNA samples were measured using a NanoDrop-2000 spectrophotometer (Thermo Fisher Scientific, USA). Each quantified DNA sample was diluted to 20 μg·μl−1 and stored at −20°C until use. Individual GBS libraries for each DNA sample were prepared using the restriction enzymes Hae III and EcoR I as described (Elshire et al., 2011). The purified samples were amplified using PCR, with the Phusion Master Mix (NEB) universal primer and the index primer. The PCR products were purified using Agencourt AMPure XP (Beckman) and pooled and then run on 2% agarose gels. DNA fragments 375–400 bp long (such as, indexes and adaptors) were isolated using a Gel Extraction Kit (Qiagen). The isolated DNA fragments were purified using Agencourt AMPure XP (Beckman) and then diluted for sequencing. Paired-end (PE) 150 bp sequencing was performed using the NovaSeq 6000 platform (Illumina, San Diego, CA, USA).
Genotyping and Quality Control (QC)
Sequences were associated with samples based on the sample-specific barcodes. To ensure that reads were reliable and without artificial bias, the raw data were processed using a series of quality control (QC) procedures implemented by in-house C scripts. The QC scripts removed all reads with ≥10% unidentified nucleotides (N); all reads with >50% bases having Phred quality <5; and all reads with >10 nt aligned to the adapter, allowing ≤ 10% mismatches. The samples with the most tags (SS222 and SS234) were used as reference genomes (Paris et al., 2017). GATK and SAMtools were used for SNP calling (Li et al., 2009; McKenna et al., 2010). SNPs with integrity <0.8 and minor allele frequency (MAF) ≤ 0.01 were discarded.
Population Structure
Population structure was estimated using a Bayesian Markov Chain Monte Carlo (MCMC) model implemented in Structure v2.3.4 (Pritchard et al., 2000). The admixture model without the LOCPRIOR option was used in this study. Furthermore, 10 replicate runs were performed for each value of K between 1 and 10, based on the number of sampled populations. Burn-in and MCMC replicates were both set to 100,000 for each run. The most probable value of K was determined with Structure Harvester (Earl and VonHoldt, 2012), using the log probability of the data [LnP(D)] and delta K (ΔK), based on the rate of change in [LnP(D)] between successive K-values. In addition, ADMIXTURE and fastSTRUCTURE were also used to conduct the K values of population structure. Different numbers of clusters (K = 1–10) for the dataset were tested using 10 replicate runs per K (Alexander et al., 2009; Raj et al., 2014). The optimal K value was assessed by cross-validation error with the lowest value and marginal likelihood with the highest value. GenAlEx v6.503 was used to calculate the Nei's genetic distances between pairs of accessions (Peakall and Smouse, 2012). Principal coordinate analysis (PCoA) was performed based on the genetic distances. An unrooted phylogenetic tree (i.e., we did not assume an evolutionary hierarchy) was constructed using the maximum likelihood method in MEGA 6.0 with 1,000 bootstrap replicates (Tamura et al., 2013).
Analysis of Molecular Variance (AMOVA) and Genetic Diversity
Analysis of molecular variance (AMOVA) was performed and calculated using seven geographical subpopulations in GenAlEx v6.503 (Peakall and Smouse, 2012). Based on the results of AMOVA, the fixation index (Fst) and haploid number of migrants (Nm) within the population were obtained. Fst measures the amount of genetic variance that can be explained by population structure based on Wright's F-statistics (Wright, 1965): an Fst value of 0 indicates no differentiation among subpopulations, while a value of 1 indicates complete differentiation. Several other genetic indices were calculated for each subpopulation using GenAlEx v6.503, such as the number of loci with private alleles, the number of different alleles (Na), the number of effective alleles (Ne), Shannon's information index (I), observed heterozygosity (Ho), and expected heterozygosity (He).
Construction of Core Germplasm Set
Core Hunter 3 was used to select core germplasm set based mainly on the genetic distance metrics calculated by SNP molecular markers (De Beukelaer et al., 2018). The most important standard for filtering the core germplasms is to keep the highest average genetic distance to maintain the genetic diversity of core germplasm set. A comparative PCoA was conducted for two core germplasm sets with/without consideration of geographical information.
Results
Identification and Characterization of SNPs
According to the geographical environment and distribution of these germplasm resources, the collections were divided into seven subpopulations: [Yunnan and Guangxi (YN/GX), Western Guangdong (WG), Northwestern Guangdong (NWG), Central Guangdong (CG), Northern Guangdong (NG), Northeastern Guangdong (NEG), and Eastern Guangdong (EG)] (Figure 1). Average numbers of 5,516,738 raw reads and 5,516,633 clean reads were obtained from 302 S. superba accessions sequenced and genotyped using GBS (Supplementary Table S1). The average coverage was 86.18% with an average number of 4,758,675 clean reads, the ratio of >Q30 nucleotide was 87.99%, the average GC content ratio was 37.08%, and the average tag sequencing depth was 12.95 × (Supplementary Table S1). Then, 1,085,853 unfiltered SNPs were identified from these sequenced tags. After QC and SNP filtering (MAF ≥ 0.01), a total of 10,661 SNPs were obtained across the S. superba genomes. Characteristics of the identified SNPs were described in Table 1. Transition SNPs (7,191 SNPs; 67.45%) were two times as common as transversion SNPs (3,470 SNPs; 32.55%). A/G transitions were the most common SNP type (34.28%), while G/C transversions were the least common SNP type (5.78%). The two types of transitions occurred with similar frequency (A/G: 34.28% and C/T: 33.17%). The most common transversion was A/T (9.80%), followed by A/C (8.61%), G/T (8.36%), and G/C (5.78%). In the next step, the SNP markers were further filtered by MAF ≥ 0.05. A total of 785 high-quality SNP markers were obtained and used for the following bioinformatics analyses. The values of He, polymorphic information content (PIC), and MAF of the filtered SNPs (MAF ≥0.05) were calculated and displayed in Figure 2. The values of He of SNP markers in the population varied from 0.1 (422 SNPs) to 0.5 (130 SNPs) with an average of 0.237, the PIC values varied from 0.1 (465 SNPs) to 0.4 (155 SNPs) with an average of 0.201, and the MAF values varied from 0.05 (386 SNPs) to 0.5 (44 SNPs) with an average of 0.156 (Figure 2).
Figure 1
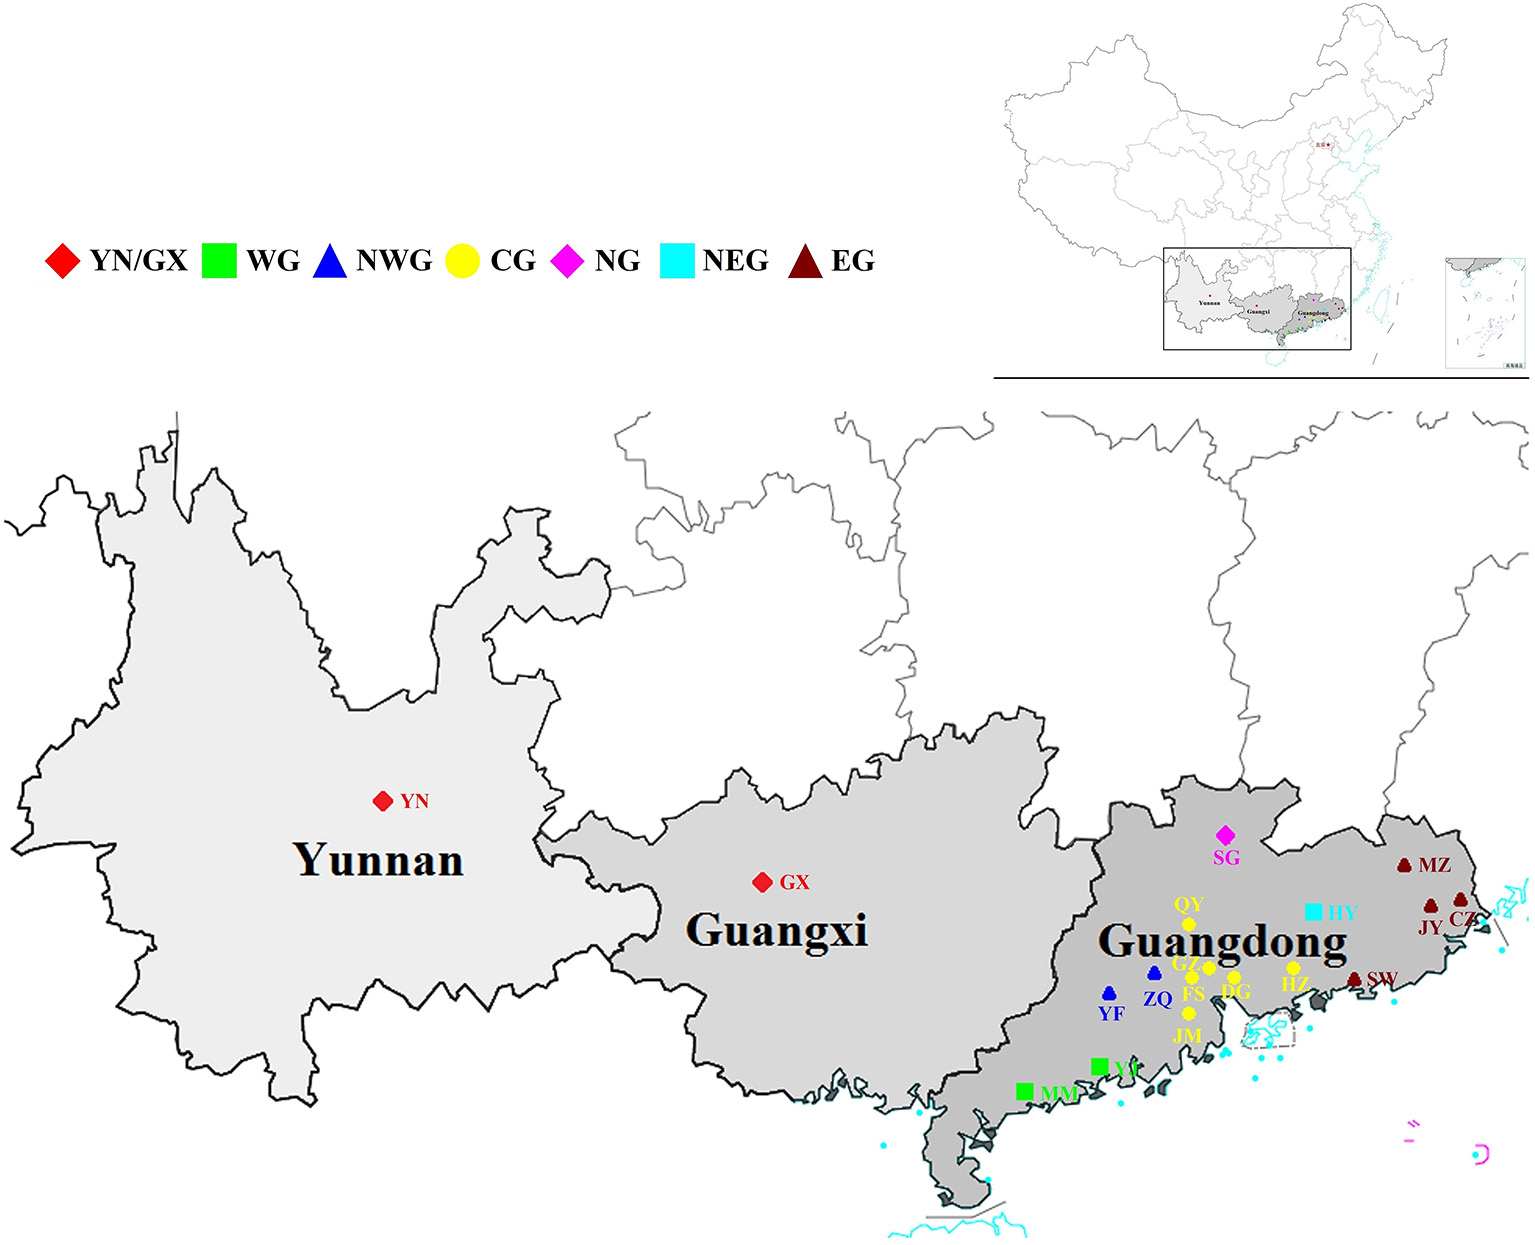
Geographical distribution of the collected Schima superba accessions. All the accessions were collected from 18 geographical sites and can be summarized into seven subpopulations according to the environment. The subpopulations were marked with seven different colors. The map was obtained from the official website of the Ministry of Natural Resources of China (http://bzdt.ch.mnr.gov.cn/index.html) .
Table 1
| SNP type | Transition SNPs | Transversion SNPs | ||||
|---|---|---|---|---|---|---|
| A/G | C/T | A/T | A/C | G/T | G/C | |
| Number of allelic sites | 3,655 | 3,536 | 1,045 | 918 | 891 | 616 |
| % Frequency | 34.28 | 33.17 | 9.80 | 8.61 | 8.36 | 5.78 |
| Total (percent of total) | 7,191 (67.45%) | 3,470 (32.55%) | ||||
Percentage of transition and transversion single nucleotide polymorphisms (SNPs) across the Schima superba genome.
The capital letter on the left side of the SNP variation type represents the major allele and the capital letter on the right side of the SNP variation type represents the minor allele.
Figure 2
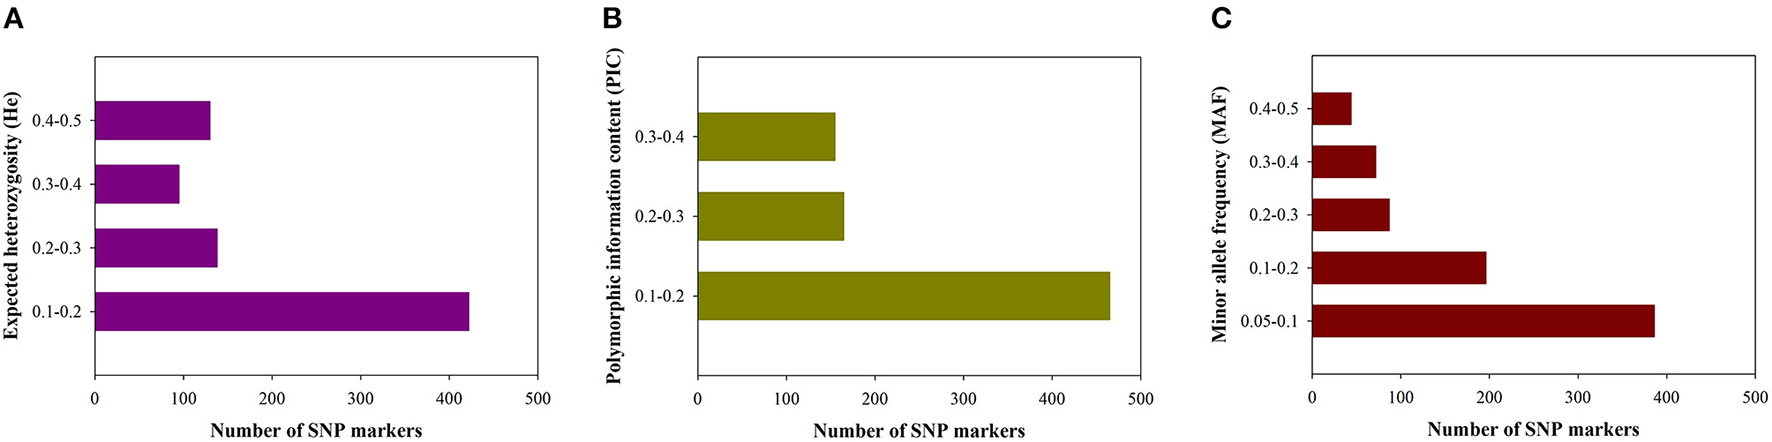
Distribution of genetic diversity for putative single nucleotide polymorphisms (SNPs). (A) Expected heterozygosity (He). (B) Polymorphic information content (PIC). (C) Minor allele frequency (MAF).
Population Structure
The most likely number of populations (K) was estimated based on the genome-wide genotypic data for the 302 S. superba accessions using Structure Harvester, ADMIXTURE, and fastSTRUCTURE. The results of Structure Harvester showed that the Delta K value was highest at K = 2 and rapidly declined from 3 to 10 (Figures 3A,B), suggesting that these accessions should be clustered into two populations. However, the ADMIXTURE cross-validation error was lowest at K = 3 (Supplementary Figure S1A), indicating the best K of three. fastSTRUCTURE marginal likelihood values fluctuated somewhat, and the highest marginal likelihood was observed at K = 2 (Supplementary Figure S1B). Considering that most of the samples were collected from GD (91.39%) and the major geographical distance between GD and other two regions, population of the total collections conforms to the characteristics of geographical distribution. According to the results of population structure in Figure 3C, one common population on the left side consisted of accessions collected from GX and YN in the K values between 2 and 4. In addition, the result of sample composition in this population was identical among different structure analyses.
Figure 3
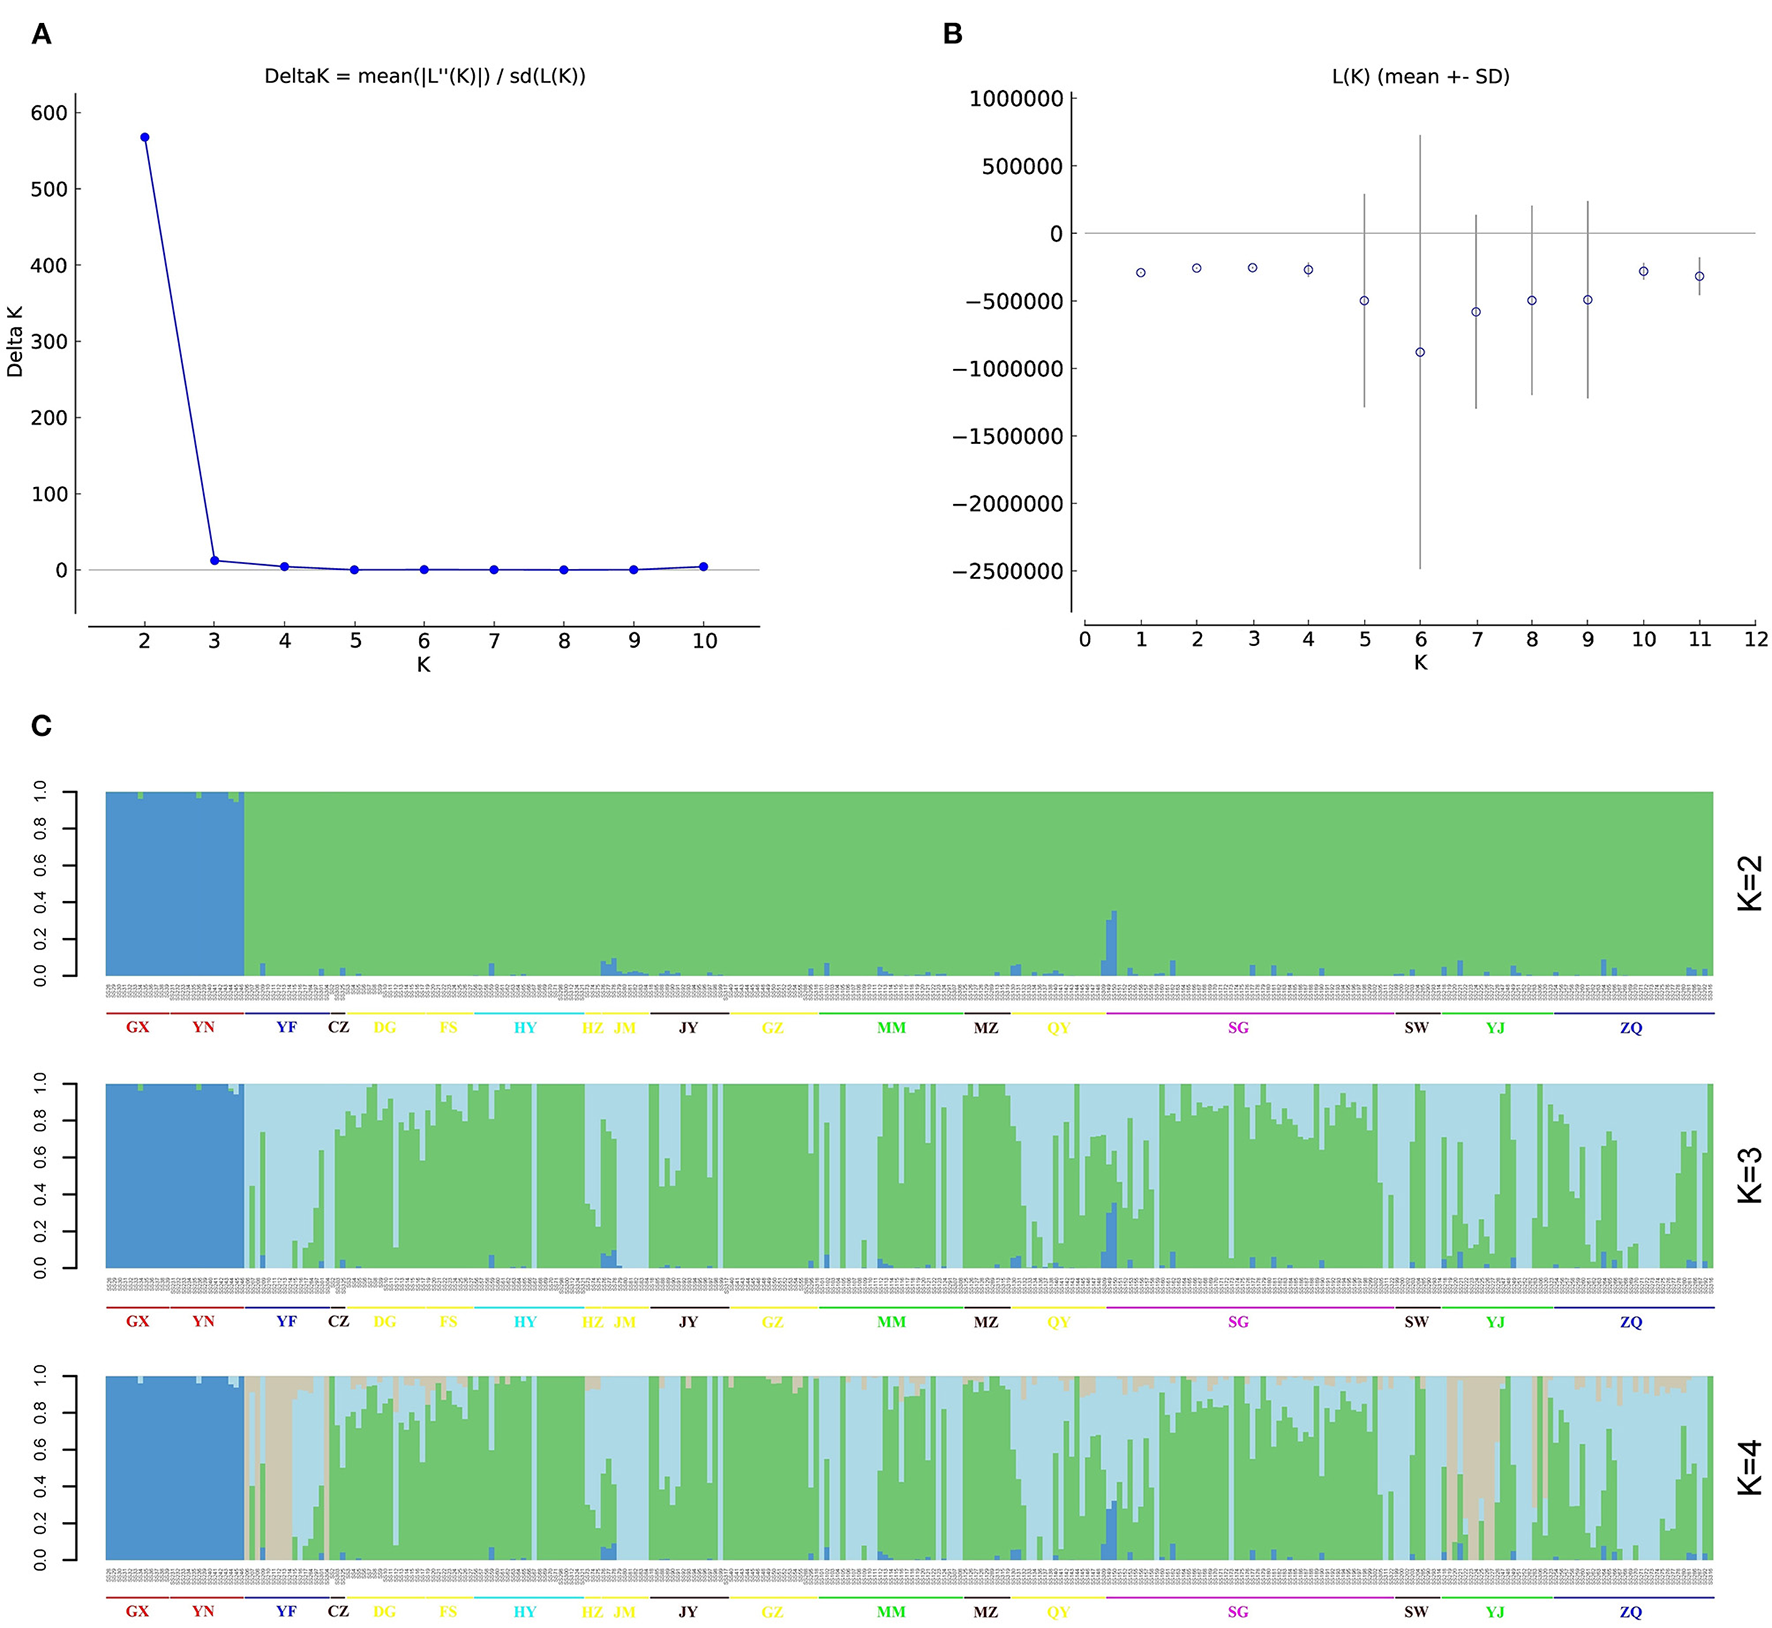
Population structure of 302 S. superba accessions. (A) Delta K values for different numbers of clusters (K = 1–10) using Structure v2.3.4, the Delta value was highest at K = 2. (B) Average log-likelihood of each value of K. (C) Population structure of 302 S. superba accessions at K = 2–4.
According to the seven subpopulations determined by geographical locations, PCoA plot was drawn based on the pairwise genetic distance matrix for 302 S. superba accessions (Figure 4A). Population 1 in the plot was similar to the common population produced by population structure analysis, comprising 26 accessions originating from YN/GX. Most accessions in GD were clustering into a major group, with the exception of several samples, especially SS149 and SS150 from NG. The clustering result of population structure was consistent with the PCoA plot and also closely related to the geographical distributions. For example, the result that accessions in YN clustered with GX were consistent with the geographically adjacent relationship. However, samples from GD cannot be divided into different populations.
Figure 4
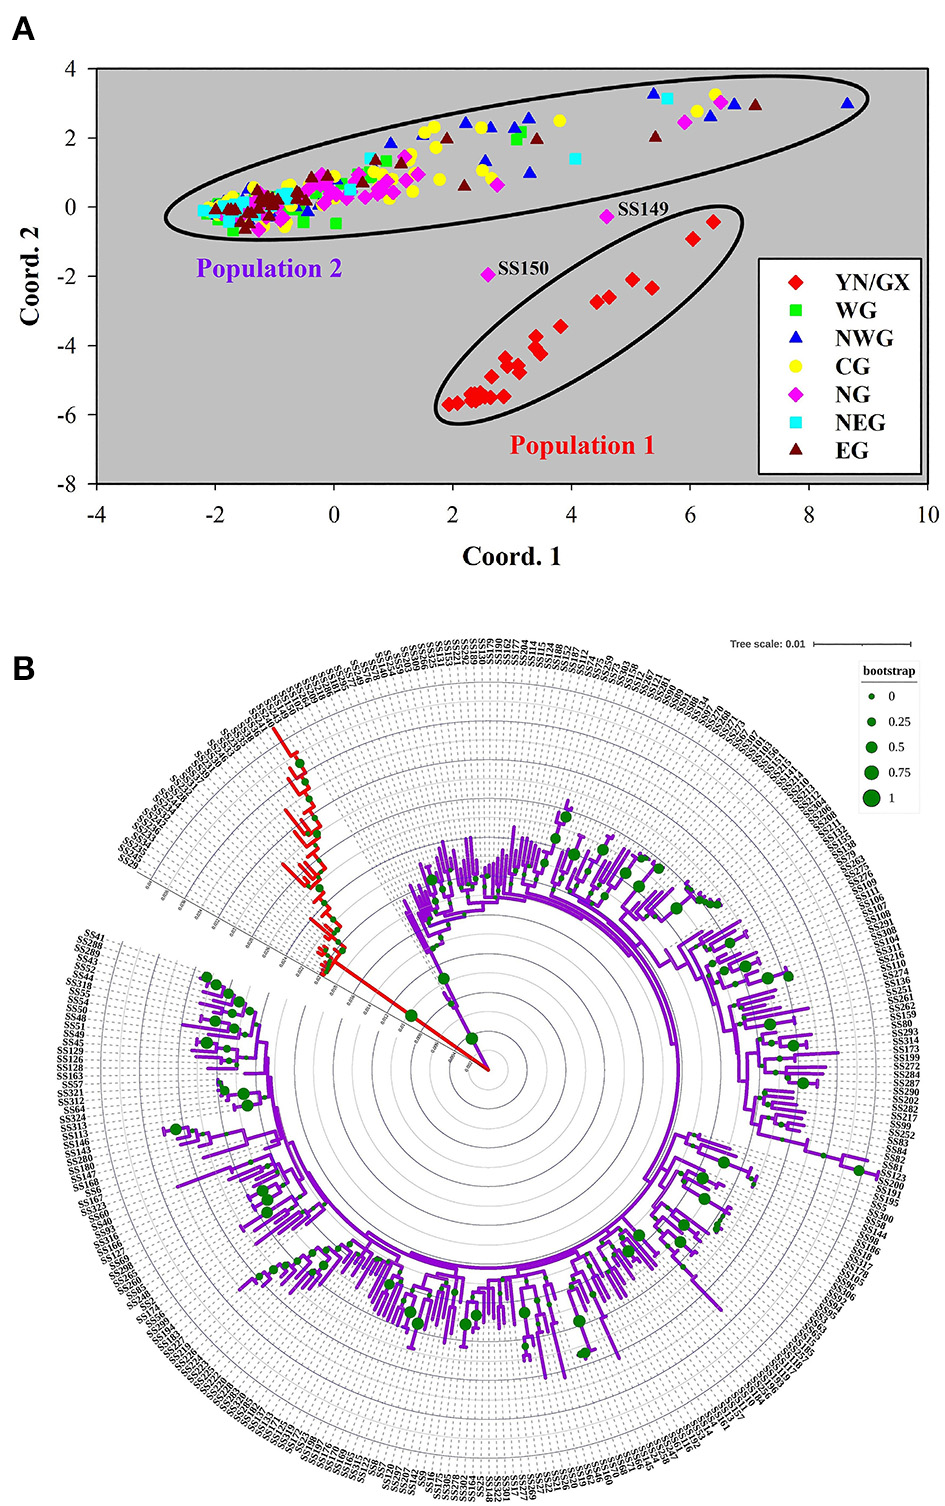
Principal coordinates analysis (PCoA) of 302 S. superba accessions. (A) Genetic distance was used to conduct PCoA. The samples were colored into seven subpopulations according to the geographical distribution in Figure 1. (B) Phylogenetic tree of 302 accessions. The tree was constructed using the maximum likelihood method in MEGA 6.0 with 1,000 bootstrap replicates. Major differentiations existed among the branches with different colors.
Genetic Differentiation and Relationships Among Populations
Analysis of molecular variance of the seven geographical subpopulations found that 7.73% of the total variation was among subpopulations, while 92.27% of the total variation was within subpopulations (Table 2). In addition, Nei's genetic distance analysis indicated that Nm was high (2.985) among these subpopulations. We also found a substantial genetic divergence between YN/GX and other subpopulations (Supplementary Table S2). Reflecting geographical distributions, pairwise Fst values of YN/GX displayed a higher average Fst (0.307) than other sites (Supplementary Table S2). In contrast, Fst values among the other subpopulations were much lower, ranging from 0.001 to 0.016. Consistent with this, genetic distance was highest and genetic identity was lowest between YN/GX and other subpopulations (genetic distance: 0.200–0.227 and genetic identity: 0.797–0.819; Supplementary Tables S3, S4).
Table 2
| Source | df | Sum of squares | Mean square | Estimated variance | Percentage of total variance (%) |
|---|---|---|---|---|---|
| Among Populations | 6 | 8563.51 | 1427.25 | 13.83 | 7.73 |
| Among Individuals | 295 | 76962.91 | 260.89 | 95.80 | 53.54 |
| Within Individuals | 302 | 20925.50 | 69.29 | 69.29 | 38.73 |
| Total | 603 | 106451.92 | 178.92 | 100.00 |
Analyses of molecular variance (AMOVA) among and within seven subpopulations of Schima superba.
The overall mean values of Na and Ne for seven subpopulations were 1.854 and 1.316, respectively; the values of Na and Ne for YN/GX (Na: 1.554 and Ne: 1.183) were lower than those of the other six subpopulations (Na: ≥1.833 and Ne: ≥1.329; Supplementary Table S5). The overall mean values of I, He, and uHe for seven subpopulations were 0.330, 0.205, and 0.210, respectively; the values of I, He, and uHe for YN/GX (I: 0.189; He: 0.117; and uHe: 0.134) were lower than those of the other six subpopulations (I: ≥ 0.342; He: ≥ 0.216; and uHe: ≥ 0.218; Supplementary Table S5).
The phylogenetic tree of all 302 S. superba accessions supported the monophyly of Population 1 in the structure analysis and PCoA: all 26 accessions in this population were recovered in the same clade (Figure 4A). However, the remaining accessions cannot be divided into different populations. To clarify the genetic relationship among all the collected accessions, a phylogenetic tree using the maximum likelihood method was constructed and indicated genetic information (Figure 4B). In addition, phylogenetic analyses based on the sample geographic distribution information suggested that the accessions in GX and YN were separated from GD (Supplementary Figure S2).
Construction of Core Germplasm Set
Due to the potential redundancy of genetic information in the total collections, the construction of a compressed core germplasm set is an important work in modern plant breeding work. To keep genetic diversity of the core germplasm set, average genetic distance is the most important standard in selecting members. By using Core Hunter, two core germplasm sets containing 60 accessions, with/without considering the geographical location, were constructed (Figure 5). Comparative PCoA plots of the two core sets displayed major difference in member compositions of the seven subpopulations. The core set without considering the geographical location showed unequal distributions in seven subpopulations. For instance, only one individual originated from YN/GX and NEG, respectively, which may lead to a loss of genetic information in this region. The core set, considering the geographical location, avoided imbalance in geographical distributions. Detailed compositions of two core sets are listed in Supplementary Tables S6, S7.
Figure 5
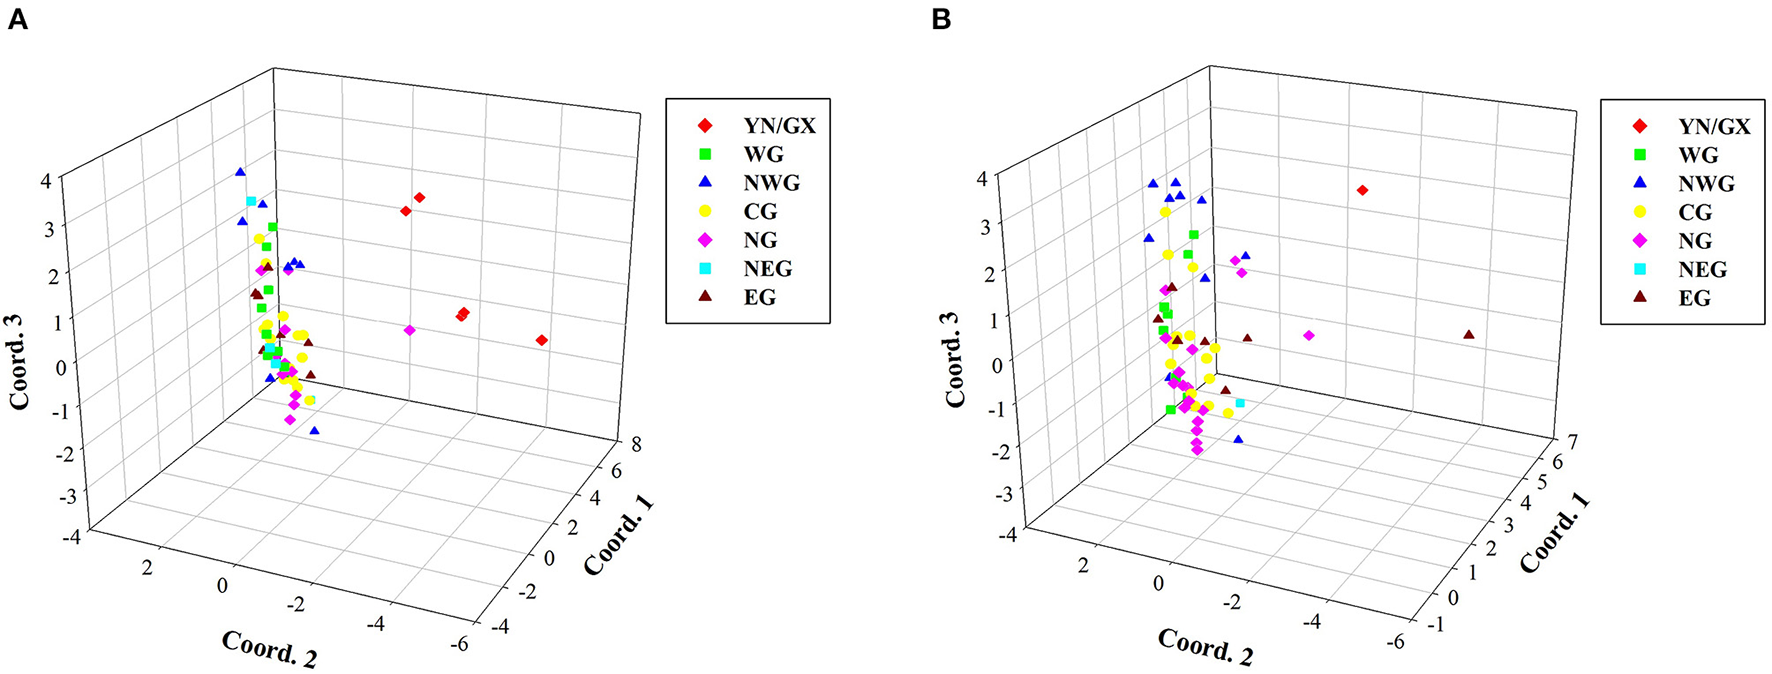
Comparative PCoA plots of core germplasm sets. (A) A core set of 60 confirmed accessions considering the geographical location. (B) A core set of 60 confirmed accessions without considering the geographical location.
Discussion
Due to the importance of S. superba in terms of wood production and forest fire protection, it is urgent to carry out a molecular breeding strategy to obtain superior individuals. Therefore, GBS technology was employed to study the molecular genetics and evolution of 302 S. superba germplasm resources collected from southern China. The genotypic data of these accessions were used for analyses of genetic diversity, population structure, etc. These analyses are important for the characterization of evolutionary history of this species, as well as the genetic relationships among these populations or individuals (Luo et al., 2019). Across the SNPs identified in 302 S. superba accessions, transitions were more frequent than transversions, consistent with findings in several other plant species (Morton et al., 2006; Park et al., 2010; Huang et al., 2013). This suggests that transitions are better tolerated than transversions in the expansion and diversification process of this species (Guo et al., 2017).
Population structure reflects genetic diversity within a species and supports genome-wide studies of the associations between molecular markers and traits (Sonah et al., 2015; Pais et al., 2020). The 302 accessions used in this study originated from three major geographical regions: GX, YN, and GD. However, it was unclear whether population structure would reflect these geographical distinctions. Our various population structure analyses indicated that the 302 accessions are possibly clustered into two, three, or four populations. However, because 91.39% of the accessions originated from GD and because larger numbers of populations may also help to maintain population diversity during breeding work (Chen et al., 2017; Alemu et al., 2020), we chose to classify the accessions into seven subpopulations according to the geographical distribution. Notably, in all analyses, the accessions from GX and YN were recovered in the same cluster (although these populations were only represented by a few accessions each). This might suggest that genetic exchange occurred between these adjacent geographical regions. Thus, our results suggest that the S. superba accessions from GX and YN may represent superior genotypes for inclusion in future breeding programs (Zhang et al., 2006; Zhou et al., 2006). However, except for the above sample collection regions, there are also several geographical distribution regions in southern China, which are also important provenances of S. superba. Therefore, a more extensive collection of S. superba germplasm resources is especially necessary to increase the scale of number and genetic diversity of this species.
The population structure of S. superba in GD was similar to that of Pinus massoniana, another important forestry species in southern China (Bai et al., 2019). That is, in both species, genetic distances among accessions did not completely correlate with geographic distance in GD. Consistent with our genetic analysis results, the phenotypic variation of S. superba in the GD province was shown to be high, reflecting abundant genetic diversity (Yan et al., 2013; Wang et al., 2018). Similarly, previous studies have shown that the genetic diversity of S. superba was high in Jianou and Longquan (Yang et al., 2016). Due to the long history of S. superba cultivation and afforestation in these regions, such high levels of genetic diversity and admixture are not surprising.
The fixation index is an important measure of population differentiation (Luo et al., 2019). Here, Fst values indicated that YN/GX was genetically divergent from the other subpopulations; conversely, Fst values were low among the six subpopulations in GD, suggesting that these subpopulations were closely genetically related. Thus, YN–GX accessions and GD accessions may represent two independent sources of S. superba diversity. However, most of the total variation among accessions was within subpopulations (92%), while only 8% of the total variation was among subpopulations. In addition, the Nm of the seven subpopulations was high (2.925), indicating a high rate of genetic exchange and gene flow among subpopulations (Eltaher et al., 2018; Luo et al., 2019), particularly in six subpopulations in GD. This may explain why the different software programs we used (Structure, ADMIXTURE, and fastSTRUCTURE) returned different values of K for the 302 accessions.
Genetic indices, such as He, reflect genetic diversity within subpopulations (Emanuelli et al., 2013). He values for WG, NWG, CG, NG, NEG, and EG were similar (0.196–0.218), but the He value for YN/GX was much lower (0.104). This might suggest that YN/GX was less diverse than the other subpopulations. However, the low He value might also merely reflect the lower number of samples in YN/GX, as He depends on both the number of alleles and the abundance of alleles in a population (Luo et al., 2019). Thus, in analyses of population diversity, it is important to consider not only the geographical origin but also the number of samples in each region. Therefore, sample numbers of the collected regions also need to be increased to obtain more accurate genetic parameters. Nevertheless, the genetic diversity analyses in this study will support the generation of new strategies for S. superba breeding.
Open pollination and hybridization have been common phenomena throughout evolutionary history (Payseur and Rieseberg, 2016). It has also been used in hybrid progeny acquisition in forestry breeding. While obtaining superior phenotypic offspring of a specific economic trait, a small number of germplasm resources with high quality is usually necessary for the breeding work. Therefore, core germplasm resources are extremely important for hybridization programs and germplasm creation (Khaing et al., 2013; Xu et al., 2017; Pereira-Lorenzo et al., 2018). In this study, we constructed two sets containing 60 S. superba core germplasms, which potentially provide a simplified and compressed genetic resource for the current resources of S. superba. These selected germplasm resources cover a wide genetic and geographic range and therefore should be suitable for diversity generation through hybridization (Bai et al., 2019). Although few accessions were collected from GX and YN, the high Fst values associated with this population indicated importance of the S. superba accessions from these regions. However, more GX and YN S. superba accessions should be collected to enhance the overall genetic diversity of our germplasm collection. Concurrently, the importance of accessions from GD should be somewhat deprecated in breeding works and germplasm resource collection to avoid decreasing phenotypic and genetic diversity. Finally, further genetic information, for example, from plastid, transcriptome sequencing, and whole-genome scales, is required for further investigations of the genetic relationships among S. superba germplasms (Zhao et al., 2018). An improved understanding of the population structure and genetic diversity of S. superba accessions will facilitate and guide molecular breeding works in the future. In addition, genome-wide association studies (GWASs) of specific economic traits are very important in MAS, whether they use GBS-GWAS or whole genome-GWAS. It is also required in S. superba molecular work in the future.
Conclusion
In this study, a total of 785 SNPs (MAF ≥ 0.05) were identified and used to explore the genetic diversity and population structure of 302 S. superba accessions from southern China. Based on the SNP markers, the S. superba accessions were divided into two major populations by structure and PCoA. Accessions collected from GD differed noticeably from those collected from YN and GX. AMOVA indicated that 92.27% of the variance appeared within, not among, seven subpopulations separated by geographical location. Our results provided important genetic data for S. superba germplasm resources. The construction of two germplasm sets considering the geographical distribution and genetic diversity information will facilitate and guide molecular breeding work. To improve the genetic diversity of current resources, more geographical distribution regions should be considered in the collection of germplasm resources in the future. In addition, GWAS and MAS are necessary for the selection of individuals with superior phenotypes.
Funding
This research was supported by the Natural Science Foundation of Guangdong Province (No. 2021A1515012452), the Forestry Science and Technology Innovation Program of Guangdong Province (No. 2018KJCX015), and the Key-Area Research and Development Program of Guangdong Province (No. 2020B020215002).
Publisher's Note
All claims expressed in this article are solely those of the authors and do not necessarily represent those of their affiliated organizations, or those of the publisher, the editors and the reviewers. Any product that may be evaluated in this article, or claim that may be made by its manufacturer, is not guaranteed or endorsed by the publisher.
Statements
Data availability statement
The datasets presented in this study can be found in online repositories. The names of the repository/repositories and accession number(s) can be found below: NCBI [accession: PRJNA674494].
Author contributions
QB designed the project and drafted the manuscript. YC and HL originally collected the germplasm resources of Schima superba. BH, YC, DL, and QZ assisted in the analytical work. QB and YW reviewed the manuscript. All authors read and approved the final manuscript.
Acknowledgments
The authors thank Yiqun Chen and Jielian Chen for their help of plant material collection.
Conflict of interest
The authors declare that the research was conducted in the absence of any commercial or financial relationships that could be construed as a potential conflict of interest.
Supplementary material
The Supplementary Material for this article can be found online at: https://www.frontiersin.org/articles/10.3389/fevo.2022.879512/full#supplementary-material
References
1
Alemu A. Feyissa T. Letta T. Abeyo B. (2020). Genetic diversity and population structure analysis based on the high density SNP markers in Ethiopian durum wheat (Triticum turgidum ssp. durum). BMC Genet. 21:18. 10.1186/s12863-020-0825-x
2
Alexander D. H. Novembre J. Lange K. (2009). Fast model-based estimation of ancestry in unrelated individuals. Genome Res.19, 1655–1664. 10.1101/gr.094052.109
3
Babu B. K. Mathur R. K. Ravichandran G. Anitha P. Venu M. V. B. (2019). Genome-wide association study for leaf area, rachis length and total dry weight in oil palm (Eleaeis guineensis) using genotyping by sequencing. PLoS ONE14:e0220626. 10.1371/journal.pone.0220626
4
Bai Q. Cai Y. He B. Liu W. Pan Q. Zhang Q. (2019). Core set construction and association analysis of Pinus massoniana from Guangdong province in southern China using SLAF-seq. Sci. Rep.9, 13157. 10.1038/s41598-019-49737-2
5
Bernardo R.. (2008). Molecular markers and selection for complex traits in plants: learning from the last 20 years. Crop Sci.48, 1649–1664. 10.2135/cropsci2008.03.0131
6
Chen W. Hou L. Zhang Z. Pang X. Li Y. (2017). Genetic diversity, population structure, and linkage disequilibrium of a core collection of Ziziphus jujuba assessed with genome-wide SNPs developed by genotyping-by-sequencing and SSR Markers. Front. Plant Sci.8:575. 10.3389/fpls.2017.00575
7
De Beukelaer H. Davenport G. F. Fack V. (2018). Core Hunter 3: flexible core subset selection. BMC Bioinform.19, 203. 10.1186/s12859-018-2209-z
8
Earl D. A. VonHoldt B. M. (2012). STRUCTURE HARVESTER: a website and program for visualizing STRUCTURE output and implementing the Evanno method. Conserv. Genet. Resour.4, 359–361. 10.1007/s12686-011-9548-7
9
Elleouet J. S. Aitken S. N. (2019). Long-distance pollen dispersal during recent colonization favors a rapid but partial recovery of genetic diversity in Picea sitchensis. New Phytol.222, 1088–1100. 10.1111/nph.15615
10
Elshire R. J. Glaubitz J. C. Sun Q. Poland J. A. Kawamoto K. Buckler E. S. et al . (2011). A robust, simple genotyping-by-sequencing (GBS) approach for high diversity species. PLoS ONE6:e19379. 10.1371/journal.pone.0019379
11
Eltaher S. Sallam A. Belamkar V. Emara H. A. Nower A. A. Salem K. F. M. et al . (2018). Genetic diversity and population structure of F-3:6 Nebraska winter wheat genotypes using genotyping-by-sequencing. Front. Genet.9:76. 10.3389/fgene.2018.00076
12
Emanuelli F. Lorenzi S. Grzeskowiak L. Catalano V. Stefanini M. Troggio M. et al . (2013). Genetic diversity and population structure assessed by SSR and SNP markers in a large germplasm collection of grape. BMC Plant Biol.13:39. 10.1186/1471-2229-13-39
13
Guo C. McDowell I. C. Nodzenski M. Scholtens D. M. Allen A. S. Lowe W. L. et al . (2017). Transversions have larger regulatory effects than transitions. BMC Genom.18:394. 10.1186/s12864-017-3785-4
14
Haselhorst M. S. H. Parchman T. L. Buerkle C. A. (2019). Genetic evidence for species cohesion, substructure and hybrids in spruce. Mol. Ecol.28, 2029–2045. 10.1111/mec.15056
15
Huang S. Deng L. Guan M. Li J. Lu K. Wang H. et al . (2013). Identification of genome-wide single nucleotide polymorphisms in allopolyploid crop Brassica napus. BMC Genom.14:717. 10.1186/1471-2164-14-717
16
Isik F.. (2014). Genomic selection in forest tree breeding: the concept and an outlook to the future. New For.45, 379–401. 10.1007/s11056-014-9422-z
17
Khaing A. A. Moe K. T. Chung J.-W. Baek H.-J. Park Y.-J. (2013). Genetic diversity and population structure of the selected core set in Amaranthus using SSR markers. Plant Breed.132, 165–173. 10.1111/pbr.12027
18
Li H. Handsaker B. Wysoker A. Fennell T. Ruan J. Homer N. et al . (2009). The sequence alignment/map format and SAMtools. Bioinformatics25, 2078–2079. 10.1093/bioinformatics/btp352
19
Luo Z. Brock J. Dyer J. M. Kutchan T. Schachtman D. Augustin M. et al . (2019). Genetic diversity and population structure of a Camelina sativa spring panel. Front. Plant Sci.10:184. 10.3389/fpls.2019.00184
20
Manimekalai R. Suresh G. Govinda Kurup H. Athiappan S. Kandalam M. (2020). Role of NGS and SNP genotyping methods in sugarcane improvement programs. Crit. Rev. Biotechnol.40, 865–880. 10.1080/07388551.2020.1765730
21
McKenna A. Hanna M. Banks E. Sivachenko A. Cibulskis K. Kernytsky A. et al . (2010). The genome analysis toolkit: a MapReduce framework for analyzing next-generation DNA sequencing data. Genome Res.20, 1297–1303. 10.1101/gr.107524.110
22
Morton B. R. Bi I. V. McMullen M. D. Gaut B. S. (2006). Variation in mutation dynamics across the maize genome as a function of regional and flanking base composition. Genetics172, 569–577. 10.1534/genetics.105.049916
23
Niu S. Song Q. Koiwa H. Qiao D. Zhao D. Chen Z. et al . (2019). Genetic diversity, linkage disequilibrium, and population structure analysis of the tea plant (Camellia sinensis) from an origin center, Guizhou plateau, using genome-wide SNPs developed by genotyping-by-sequencing. BMC Plant Biol.19:328. 10.1186/s12870-019-1917-5
24
Pais A. L. Whetten R. W. Xiang Q.-Y. (2020). Population structure, landscape genomics, and genetic signatures of adaptation to exotic disease pressure in Cornus florida L.—insights from GWAS and GBS data. J. Syst. Evol.58, 546–570. 10.1111/jse.12592
25
Paris J. R. Stevens J. R. Catchen J. M. (2017). Lost in parameter space: a road map for stacks. Methods Ecol. Evolut.8, 1360–1373. 10.1111/2041-210x.12775
26
Park S. Yu H.-J. Mun J.-H. Lee S.-C. (2010). Genome-wide discovery of DNA polymorphism in Brassica rapa. Mol. Genet. Genom.283, 135–145. 10.1007/s00438-009-0504-0
27
Payseur B. A. Rieseberg L. H. (2016). A genomic perspective on hybridization and speciation. Mol. Ecol.25, 2337–2360. 10.1111/mec.13557
28
Peakall R. Smouse P. E. (2012). GenAlEx 6.5: genetic analysis in Excel. Population genetic software for teaching and research-an update. Bioinformatics28, 2537–2539. 10.1093/bioinformatics/bts460
29
Pereira-Lorenzo S. Maria Ramos-Cabrer A. Ferreira V. Belen Diaz-Hernandez M. Carnide V. Pinto-Carnide O. et al . (2018). Genetic diversity and core collection of Malus × domestica in northwestern Spain, Portugal and the Canary Islands by SSRs. Sci. Hortic.240, 49–56. 10.1016/j.scienta.2018.05.053
30
Pina-Martins F. Baptista J. Pappas G. Paulo O. S. (2019). New insights into adaptation and population structure of cork oak using genotyping by sequencing. Glob. Chang. Biol.25, 337–350. 10.1111/gcb.14497
31
Pritchard J. K. Stephens M. Donnelly P. (2000). Inference of population structure using multilocus genotype data. Genetics155, 945–959. 10.1093/genetics/155.2.945
32
Raj A. Stephens M. Pritchard J. K. (2014). fastSTRUCTURE: variational inference of population structure in large SNP data sets. Genetics197, 573–U207. 10.1534/genetics.114.164350
33
Ryu J. Kim W. J. Im J. Kim S. H. Lee K. S. Jo H. J. et al . (2018). Genotyping-by-sequencing based single nucleotide polymorphisms enabled Kompetitive Allele Specific PCR marker development in mutant Rubus genotypes. Electron. J. Biotechnol.35, 57–62. 10.1016/j.ejbt.2018.08.001
34
Sonah H. O'donoughue L. Cober E. Rajcan I. Belzile F. (2015). Identification of loci governing eight agronomic traits using a GBS-GWAS approach and validation by QTL mapping in soya bean. Plant Biotechnol. J.13, 211–221. 10.1111/pbi.12249
35
Tamura K. Stecher G. Peterson D. Filipski A. Kumar S. (2013). MEGA6: molecular evolutionary genetics analysis version 6.0. Mol. Biol. Evol.30, 2725–2729. 10.1093/molbev/mst197
36
Verma S. Gupta S. Bandhiwal N. Kumar T. Bharadwaj C. Bhatia S. (2015). High-density linkage map construction and mapping of seed trait QTLs in chickpea (Cicer arietinum L.) using genotyping-by-sequencing (GBS). Sci. Rep. 5, 17512. 10.1038/srep17512
37
Wang Y. Chen Y. Cai Y. Lian H. He B. Zeng L. et al . (2018). Genotypic characteristics of Schima superba resources from Guangdong province. J. Cent. South Univ. For. Technol.38, 75–83. 10.14067/j.cnki.1673-923x.2018.06.012
38
Wright S.. (1965). The interpretation of population-structure by F-statistics with special regard to systems of mating. Evolution19, 395–420. 10.2307/2406450
39
Wu D. Koch J. Coggeshall M. Carlson J. (2019). The first genetic linkage map for Fraxinus pennsylvanica and syntenic relationships with four related species. Plant Mol. Biol.99, 251–264. 10.1007/s11103-018-0815-9
40
Xia H. H. Wang B. S. Zhao W. Pan J. Mao J. F. Wang X. R. (2018). Combining mitochondrial and nuclear genome analyses to dissect the effects of colonization, environment, and geography on population structure in Pinus tabuliformis. Evol. Appl.11, 1931–1945. 10.1111/eva.12697
41
Xu Q. Lin L. Xue C. Deng D. Zhong H. Lei Y. (2018). Component specific carbon contents and storage of Schima superba in Guangdong province. J. Cent. South Univ. For. Technol.38, 71–78. 10.14067/j.cnki.1673-923x.2018.10.012
42
Xu Q. Zeng X. Lin B. Li Z. Yuan H. Wang Y. et al . (2017). A microsatellite diversity analysis and the development of core-set germplasm in a large hulless barley (Hordeum vulgare L.) collection. BMC Genet.18:102. 10.1186/s12863-017-0563-x
43
Yan L. Zhang F. Pan W. Xu B. Zhu B. Wang Y. (2013). Variation of morphologic characteristics of Schima superba leaf in Guangdong province. Guangdong For. Sci. Technol.29, 35–38. 10.3969/j.issn.1006-4427.2013.05.007
44
Yang H. Zhang R. Song P. Zhou Z. (2017a). The floral biology, breeding system and pollination efficiency of Schima superba Gardn. et Champ. (Theaceae). Forests8, 404. 10.3390/f8100404
45
Yang H. Zhang R. Zhou Z. (2016). Genetic diversity and mating system in a seed orchard of Schima superba. Sci. Silvae Sin.52, 66–73. 10.11707/j.1001-7488.20161208
46
Yang H. Zhang R. Zhou Z. (2017b). Pollen dispersal, mating patterns and pollen contamination in an insect-pollinated seed orchard of Schima superba Gardn. et Champ. New For.48, 431–444. 10.1007/s11056-017-9568-6
47
Zhang P. Zhou Z. Jin G. Fan H. Hu H. (2006). Genetic diversity analysis and provenance zone allocation of Schima superba in China using RAPD markers. Sci. Silvae Sin.42, 38–42. 10.11707/j.1001-7488.20060207
48
Zhang R. Yang H. Zhou Z. Shen B. Xiao J. Wang B. (2019). A high-density genetic map of Schima superba based on its chromosomal characteristics. BMC Plant Biol.19:41. 10.1186/s12870-019-1655-8
49
Zhang R. Zhou Z. Luo W. Wang Y. Feng Z. (2013). Effects of nitrogen deposition on growth and phosphate efficiency of Schima superba of different provenances grown in phosphorus-barren soil. Plant Soil370, 435–445. 10.1007/s11104-013-1644-x
50
Zhao P. Zhou H.-J. Potter D. Hu Y.-H. Feng X.-J. Dang M. et al . (2018). Population genetics, phylogenomics and hybrid speciation of Juglans in China determined from whole chloroplast genomes, transcriptomes, and genotyping-by-sequencing (GBS). Mol. Phylogenet. Evol.126, 250–265. 10.1016/j.ympev.2018.04.014
51
Zheng Z. Sun Z. Q. Fang Y. J. Qi F. Y. Liu H. Miao L. J. et al . (2018). Genetic diversity, population structure, and botanical variety of 320 global peanut accessions revealed through tunable genotyping-by-sequencing. Sci. Rep.8, 10. 10.1038/s41598-018-32800-9
52
Zhou Z. Fan H. Jin G. Wang Y. Chen Y. Rao L. (2006). Geographic genetic variation and preliminary selection of superior provinance in Schima superba. For. Res.19, 718–724. 10.3321/j.issn:1001-1498.2006.06.008
Summary
Keywords
Schima superba , genotyping by sequencing, population structure, genetic diversity, analysis of molecular variance, core germplasm set
Citation
Bai Q, He B, Cai Y, Lian H, Zhang Q, Liang D and Wang Y (2022) Genetic Diversity and Population Structure of Schima superba From Southern China. Front. Ecol. Evol. 10:879512. doi: 10.3389/fevo.2022.879512
Received
19 February 2022
Accepted
26 May 2022
Published
24 June 2022
Volume
10 - 2022
Edited by
Genlou Sun, Saint Mary's University, Canada
Reviewed by
Raj Kumar, Central Soil Salinity Research Institute (ICAR), India; Hiroshi Shinouzuka, La Trobe University, Australia
Updates
Copyright
© 2022 Bai, He, Cai, Lian, Zhang, Liang and Wang.
This is an open-access article distributed under the terms of the Creative Commons Attribution License (CC BY). The use, distribution or reproduction in other forums is permitted, provided the original author(s) and the copyright owner(s) are credited and that the original publication in this journal is cited, in accordance with accepted academic practice. No use, distribution or reproduction is permitted which does not comply with these terms.
*Correspondence: Qingsong Bai baiqingsong1707@163.com
This article was submitted to Evolutionary and Population Genetics, a section of the journal Frontiers in Ecology and Evolution
Disclaimer
All claims expressed in this article are solely those of the authors and do not necessarily represent those of their affiliated organizations, or those of the publisher, the editors and the reviewers. Any product that may be evaluated in this article or claim that may be made by its manufacturer is not guaranteed or endorsed by the publisher.