 Zongxi Qu
 Yongzhong Sha1,2*
 Yutong Li
95% of researchers rate our articles as excellent or good
Learn more about the work of our research integrity team to safeguard the quality of each article we publish.
Find out more
ORIGINAL RESEARCH article
Front. Ecol. Evol. , 02 May 2022
Sec. Environmental Informatics and Remote Sensing
Volume 10 - 2022 | https://doi.org/10.3389/fevo.2022.875000
This article is part of the Research Topic Artificial Intelligence-Based Forecasting and Analytic Techniques for Environment and Economics Management View all 21 articles
The outbreak of Coronavirus disease 2019 (COVID-19) has become a global public health event. Effective forecasting of COVID-19 outbreak trends is still a complex and challenging issue due to the significant fluctuations and non-stationarity inherent in new COVID-19 cases and deaths. Most previous studies mainly focused on univariate prediction and ignored the uncertainty prediction of COVID-19 pandemic trends, which may lead to insufficient results. Therefore, this study utilized a novel intelligent point and interval multivariate forecasting system that consists of a distribution function analysis module, an intelligent point prediction module, and an interval forecasting module. Aimed at the characteristics of the COVID-19 series, eight hybrid models composed of various distribution functions (DFs) and optimization algorithms were effectively designed in the analysis module to determine the exact distribution of the COVID-19 series. Then, the point prediction module presents a hybrid multivariate model with environmental variables. Finally, interval forecasting was calculated based on DFs and point prediction results to obtain uncertainty information for decision-making. The new cases and new deaths of COVID-19 were collected from three highly-affected countries to conduct an empirical study. Empirical results demonstrated that the proposed system achieved better prediction results than other comparable models and enables the informative and practical quantification of future COVID-19 pandemic trends, which offers more constructive suggestions for governmental administrators and the general public.
Risk prevention and control of major infectious diseases are essential for human health and social stability. In recent years, with global warming, the deterioration of the ecological environment, and the acceleration of urbanization, an increasing number of pathogenic microorganisms have mutated, leading to the outbreak of major infectious diseases more frequently (Wu et al., 2017). In December 2019, infectious pneumonia caused by a novel coronavirus disease (COVID-19) was discovered and quickly spread to more than 200 countries worldwide. With the global novel coronavirus epidemic becoming more serious, the World Health Organization raised the global risk of the COVID-19 epidemic to the highest level.
The COVID-19 epidemic was non-linear, dynamic, and fuzzy, thereby increasing the difficulty of prevention and control decision-making. Practical modeling approaches to predict the spread of a novel virus in the population play an essential role in the preparation and formulation of health and economic policies of any government or authority figure. When new cases increase at rates of thousands per day, health care systems of even the most developed countries are overwhelmed and unable to handle influxes of such large numbers of patients. In overwhelming situations, timely outbreak forecasting supports responsible agencies in being prepared and in managing the response effectively. For example, by targeting exclusion zones and scheduling economic activities, managing medical resources, and planning for emergency hospitals, effective forecasting is strategically essential for decision-makers (Swapnarekha et al., 2020).
Recently, various models have been developed to forecast the upcoming number of COVID-19 cases and its spread in the near future. Epidemiological models have been widely adopted in predicting COVID-19 cases and deaths. Many of these models were based on the traditional SEIR model and have been widely adopted (Li et al., 1999; Barmparis and Tsironis, 2020; He et al., 2020; Ndaïrou et al., 2020; Pandey et al., 2020). Additionally, statistical forecasting models, artificial intelligence (AI) models, and hybrid forecasting models have also been practical for epidemic prediction. For example, Ceylan (2020) applied auto regressive integrated moving average model (ARIMA) to forecast the epidemiological trend in Italy, Spain, and France. Ghosal et al. (2020) used linear and multiple linear regression methods to predict the number of deaths in India over a short period of 6 weeks. Moftakhar and Seif (2020) used the ARIMA model to forecast the number of patients with COVID-19 in Iran in the next 30 days. Ala’raj et al. (2021) developed a dynamic hybrid model based on SEIRD and ARIMA models to provide long- and short-term forecasts with confidence intervals. Ly (2020) employed an Adaptive Neuro-Fuzzy Inference System (ANFIS) to predict COVID-19 cases in the United Kingdom. The results showed that data from Spain and Italy increased the ability to forecast COVID-19 cases in the United Kingdom. Borghi et al. (2021) used a machine learning model based on the multilayer Perceptron artificial neural network structure, which effectively predicted the behavior of four time series (accumulated infected cases, new cases, accumulated deaths, and new deaths). Parbat and Chakraborty (2020) used support vector regression (SVR) for a 60-day forecast of COVID-19 cases in India based on time-series data reported from March 01, 2020, to April 30, 2020. Meanwhile, the combination and mixing of different models have also regarded as effective ways to improve prediction, including applications in different fields, such as economic modeling and policy-making [18,19] (Stock and Watson, 2004; McAdam and McNelis, 2005), electricity price forecasting (Yang et al., 2022), environmental pollution (Hao et al., 2021), and COVID-19 forecasting (Castillo and Melin, 2020).
Although these methods have contributed significantly to the field of COVID-19 prediction, most of the models mainly focused on deterministic forecasts and ignored the uncertain information in the forecasts, resulting in the inability of the government disease control department to assess and manage epidemic risk. Additionally, one area of research has been on the impact of air pollution on new cases and deaths from COVID-19. It is known that air pollution can result in several diseases, including chronic respiratory diseases, stroke and cardiovascular problems. Recent studies have identified links between air pollution (mainly nitrogen oxides NO2 and PM2.5) and deaths and cases of COVID-19. Travaglio et al. (2021) explored potential links between air pollutants and COVID-19 mortality and infectivity. They found that air pollutant concentrations, especially nitrogen oxides and PM2.5, were positively associated with COVID-19 mortality and infectivity. Konstantinoudis et al. (2021) used high geographical resolution to investigate the effect of long-term exposure to NO2 and PM2.5 on COVID-19 mortality in England. They found some evidence of an association of NO2 with COVID-19 mortality, while the effect of long-term exposure to PM2.5 remained uncertain. Lian et al. (2021) reported that urban lockdown was an effective method to reduce the number of new cases, and nitrogen dioxide (NO2) concentrations can be used as an indicator of environmental lockdown to assess the effectiveness of lockdown measures. In some studies, the influence of meteorological parameters on the transmission of COVID-19 was discussed, and it was found that weather factors could affect the spread of COVID-19 (Malki et al., 2020; Shi et al., 2020). For example, Wu et al. (2020) analyzed the relationship between temperature change and n COVID-19 pneumonia and its impact on 166 countries. Wang et al. (2020) demonstrated that temperature can significantly modify the spread of COVID-19 to a certain extent and that there may be an optimal temperature for virus transmission. The above studies have pointed out the effects of environmental and meteorological factors on the survival and spread of the virus. A tremendous number of studies support that both nitrogen oxides and temperature play an important role in the spread and infection of COVID-19, motivating the current study to take environmental and meteorological factors into account in the prediction of COVID-19. We sought to determine whether the addition of these variables would improve the outbreak prediction.
Hence, by taking into consideration the results of the above works, this study utilized a novel point and interval data-driven forecasting model consisting of a distribution function analysis module, an intelligent point prediction module, and an interval forecasting module. First, several distribution functions (DFs) optimized by a metaheuristic algorithm were effectively designed to analyze the characteristics of the COVID-19 series. Furthermore, we used environmental features, such as nitrogen dioxide (NO2) and temperature, as inputs to the multivariable hybrid prediction model, which is a combination of the sine cosine algorithm (SCA) and least square support vector machine (LSSVM). Based on the DFs and point forecasting results, interval forecasting was designed to obtain uncertain information. The new case and new death series collected from the top three affected countries were used for the empirical study. We compared the performance of the best data-driven univariate model and the best multivariate model in an attempt to generate better predictions.
Our main contributions are as follows:
1 A practical epidemic analysis and prediction tool based on distribution function analysis, intelligent point prediction, and interval forecasting modules are proposed for the government and the public.
2 Environmental variables, such as NO2 and temperature, were selected as inputs to construct a multivariable hybrid prediction model.
3 Interval forecasting based on DFs and point forecasting results can provide more uncertainty information for decision-making.
The rest of the paper is organized as follows. Section “Methodology” introduces the related Methodologies. Section “A Framework of the Developed Hybrid Forecasting System” describes the primary process of the proposed framework of the developed hybrid system. Section “Data Description and Evaluation Criteria” describes the research datasets and the evaluation criteria of this study. Section “Experimental Results and Analysis” discusses the forecasting results of the proposed model and the comparative results with other models. Finally, Section “Conclusion” concludes the critical conclusions of this paper.
Some related methodologies are introduced in this section, including LSSVM, SCA, DFs, and interval prediction theory.
The support vector machine (SVM) proposed by Vapnik is an essential method in machine learning that effectively resolved pattern identification and classification tasks. The support vector machine is aimed at a small sample problem, is based on structural risk minimization, better solves the previous machine learning model overlearning, non-linear, dimensional disaster and local minimum problems, and has a good generalization ability. However, this method has some defects, such as slow training speed and poor stability when training samples on a large scale, limiting its application scope (quadratic programming problem needs to be solved in the learning process). Therefore, Suykens and Vandewalle (1999) proposed the least squares support vector machine (LSSVM) based on SVM, which significantly reduced the algorithm’s computational complexity and improved the training speed. The LSSVM is an extension of the standard SVM. The algorithm transforms the solution of the support vector machine from a quadratic programming problem to linear equations. More details on the LSSVM can be found in Suykens and Vandewalle (1999).
It is worth noting that different types of kernel functions can be used in the LSSVM model, such as sigmoid, polynomial, and radial basis function (RBF), which are commonly used in the LSSVM model. RBF is a general choice of the kernel function proposed in Keerthi and Lin (2003), requiring fewer parameters and superior performance in applications. Accordingly, this study identifies RBF as the appropriate kernel function:
Mirjalili (2016) proposed the SCA, which is based on sine and cosine functions to explore different regions of the search space. It can effectively avoid local optimization, converge to global optimization, and effectively use the promising area of the search space during optimization. In SCA, the search space dimension is determined by the number of parameters required for optimization. The SCA creates different initial random agent solutions and requires them to use mathematical models based on sine and cosine functions to swing outward or toward the best solution.
where is the current position at the tth iteration in the ith dimension, is the targeted optimal global solution and rand1, rand2, rand3 ∈ [0,1] are random numbers. Eqs. (2) and (3) use 0.5 ≤ rand4 < 0.5 conditions for exploitation and exploration.
The probability distribution function has played an essential role in time series analysis, resource evaluation, and interval prediction in recent years. Researchers have tried to fit the basic characteristics of historical data by various DFs, hoping to mine the relevant characteristics, thereby deeply understanding data uncertainty. This study used the weibull distribution, gamma distribution, lognormal distribution, and Rayleigh DFs to study the statistical characteristics of new Covid-19 cases and deaths in three countries. The above DFs are shown in Table 1.

Table 1. Four distribution functions.
Based on deterministic prediction, many studies (Song et al., 2015; Xu et al., 2017; Tian and Hao, 2020) have proposed interval prediction technology that can reflect the uncertain trend of future values to provide uncertain information about time series, such as air pollutants, wind energy, macroeconomic economy, and carbon trading prices. This type of interval prediction is a dynamic interval prediction method that calculates the uncertain information of future values based on point prediction and DFs. Therefore, the performance of the interval prediction model depends on the accuracy of the point prediction and the estimation of the distribution function. To be specific, assuming that the observation is Yt, at the significance level α, the probability formula for the lower limit: L and upper limit: U can be expressed:
The above formula can also be described by the following equation.
Additionally, we suppose that the forecasting values possess similar DFs with the historical datasets. Therefore, once the DFs of the original time series are determined, the estimated variance can be obtained. As a result, the values of the upper and lower bounds can be calculated with a certain confidence levelα.
The above equation can also be expressed as:
This section describes the details of the developed hybrid architecture framework, as shown in Figure 1. The framework consists of three modules: distribution function analysis, intelligent point prediction with environmental features, and interval forecasting.
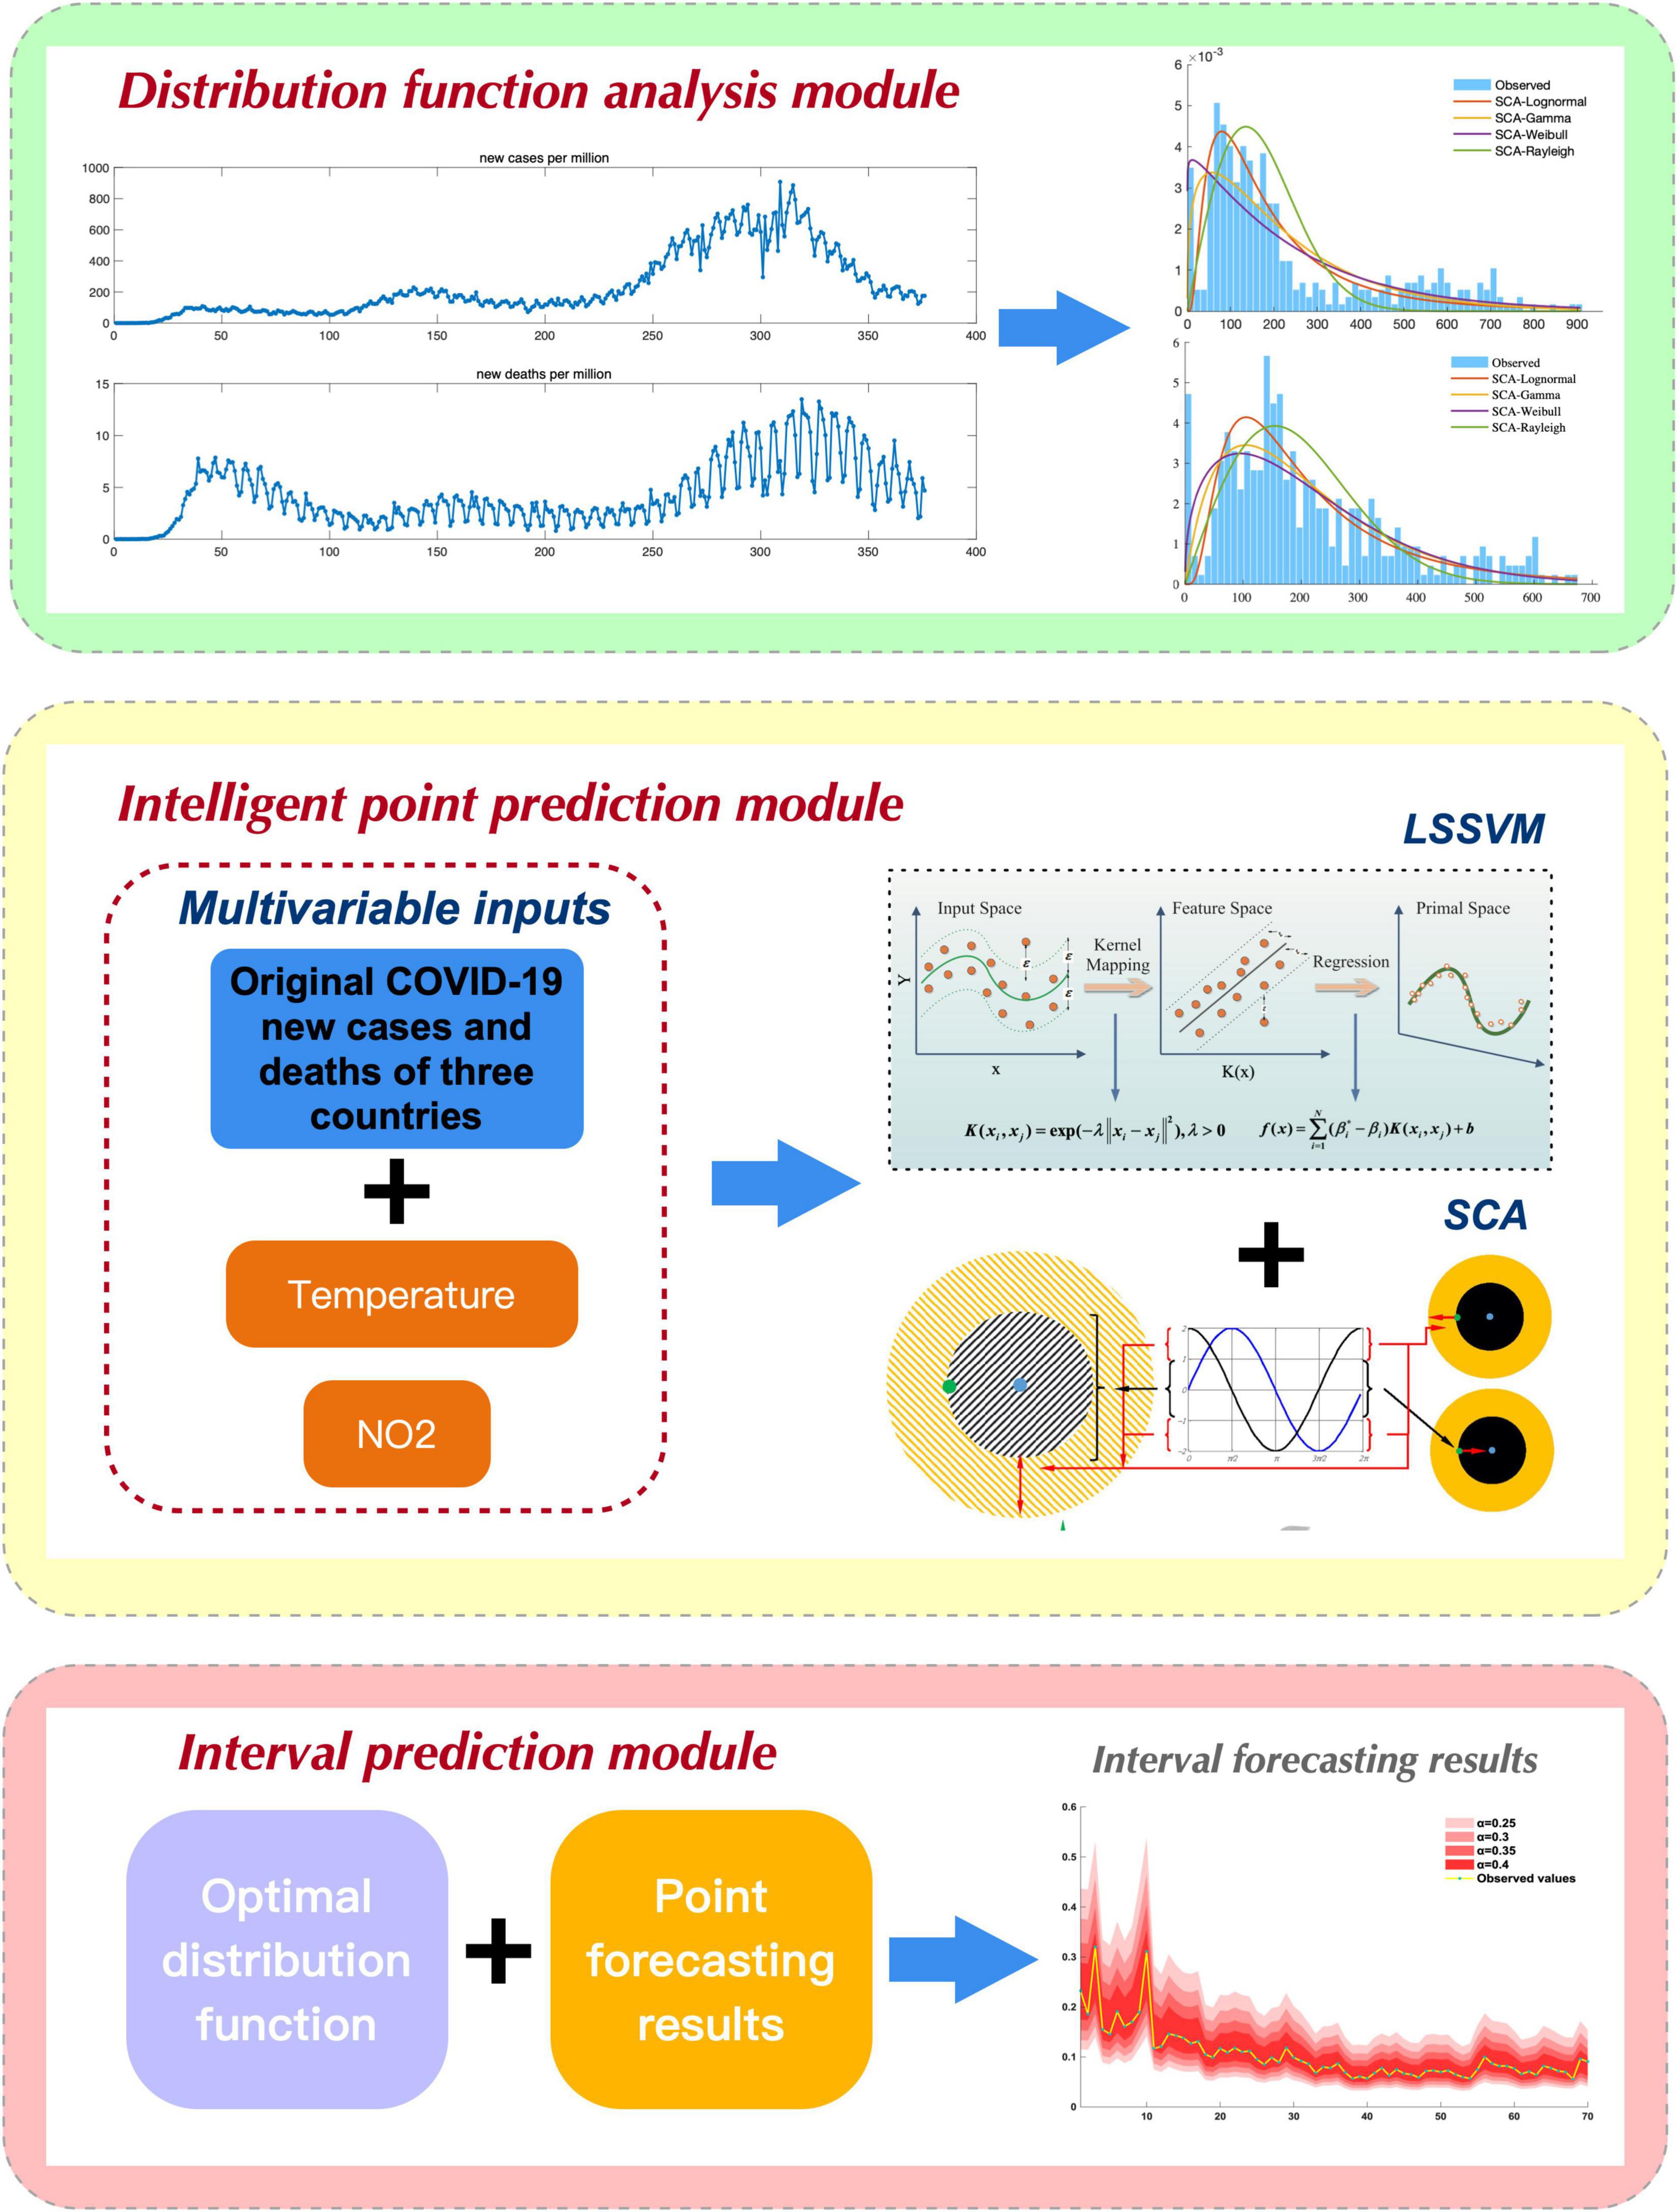
Figure 1. The main procedure of the proposed system.
This module mainly implements characteristic data analysis of raw epidemic data. First, the Weibull distribution, Rayleigh distribution, Lognormal distribution, and Gamma distribution are introduced to fit the epidemic time series. To obtain the optimal estimation of model parameters, two different estimation methods, namely, maximum likelihood estimation (MLE) and a robust heuristic algorithm (SCA), are applied to evaluate the parameters of different DFs. Finally, the most suitable epidemic sequence distribution function is obtained by comparing the fitting ability of 8 hybrid probability DFs.
The volatility and non-linearity of new cases and new deaths of COVID-19 make modeling very difficult. A successful predictive model requires optimization as well as sufficient data to drive it. Previous studies have shown that some environmental variables are highly correlated with epidemic changes, especially nitrogen dioxide and temperature, which have a significant impact on the epidemic trend of COVID-19 (Bauwens et al., 2020; Shi et al., 2020; Wang et al., 2020; Travaglio et al., 2021). Thus, we took environmental features, such as nitrogen dioxide (NO2) and temperature, as inputs to construct a multivariable hybrid prediction model. To develop an intelligent point prediction model, we designed a LSSVM prediction model based on SCA optimization, namely, the hybrid SCA-LSSVM. Specifically, the SCA was introduced when training the LSSVM model, and the parameters (i.e., α, γ) of the LSSVM model were optimized by the SCA algorithm to achieve high-performance forecasting.
According to interval forecasting theory, interval prediction of the COVID-19 epidemic can be achieved based on the appropriate distribution function and point prediction values of COVID-19.
The accuracy of the prediction mainly depends on the quality of the data and requires sufficient historical data. This study collected the data from the open dataset Our World in Data [Coronavirus (COVID-19) Cases – Our World in Data], which contains global daily data from the European Center for Disease Prevention and Control (ECDC). Due to the significant fluctuations and non-stationarity inherent in COVID-19, new case and death series bring great challenges to predictions. To verify the performance of the model, we used new cases per 100 thousand of the population per day as one of the predictive variables:
The new deaths per thousand of the population calculated according to Equation (10) were also predicted based on available data.
The World Air Quality Index project (WAQI) (Covid-19 Worldwide Air Quality data) provides a dataset covering air quality for more than 130 countries, updated daily starting in the first quarter of 2020. The dataset contains the data of each air pollutant, i.e., CO, NO2, O3, SO2, PM10, and PM2.5, as well as meteorological data including humidity and temperature.
We focused on the three major countries that have been most strongly affected by COVID-19: the United States, India, and Brazil. The data of new cases and new deaths per 100 thousand of the population for the three countries, as well as the data of NO2 and temperature for the same period, were selected as input variables for the outbreak modeling. Notably, the first observation time (or start time) and the length of the time series are different for each country. Sample data from the United States were collected from February 29, 2020, to March 10, 2021. Sample data from India were collected from March 18, 2020 to March 10, 2021. Sample data from Brazil were collected from March 17, 2020, to March 10, 2021. Sample data were divided into two parts: a training subset and a testing subset. We used 80% of the total data as the training subset and the remaining 20% as the test subset.
This study considered eight evaluation criteria to effectively evaluate the model’s performance, as shown in Table 2. Specifically, the MAE, RMSE, and R2 were chosen as error criteria to determine the fitting level of these DFs. The MAE, RMSE, MAPE, IA, DA, and R2 were used to reflect the prediction performance of the point forecasting models. The PIAW and PICP were used to measure the validity of the interval prediction.
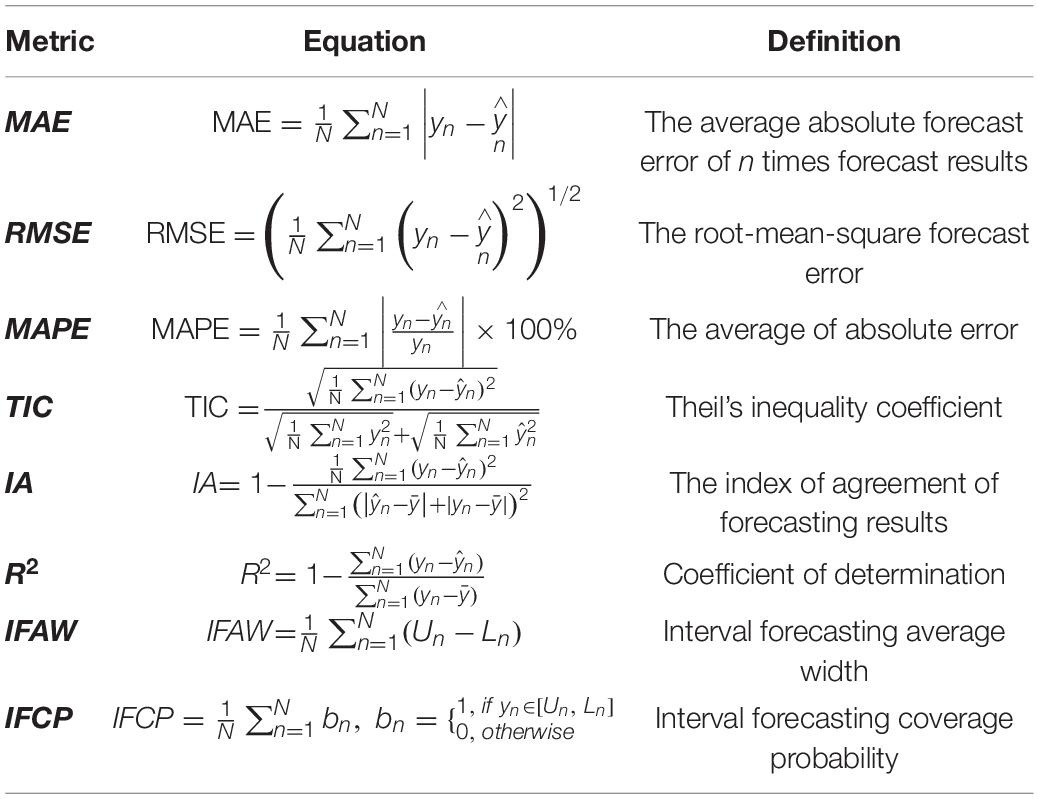
Table 2. Eight evaluation rules.
Here yn and represent the actual and predicted values at time n, respectively. N denotes the sample size. Ln and Un are the lower and upper values of the interval forecasting, and bn means a Boolean value.
In this section, we establish three experiments (Experiment I: DFs of COVID-19 cases; Experiment 2: point prediction of COVID-19 cases; Experiment 3: interval prediction of COVID-19 cases) to illustrate that the proposed hybrid system can effectively analyze the deterministic and uncertain information of COVID-19. Specifically, Experiment I used four probability DFs (Weibull, Rayleigh, Lognormal, and Gamma) to fit the distribution of epidemic cases. The parameters of the four probability DFs were optimized using the SCA algorithm. In experiment II, a hybrid model with environmental features, TN-SCA-LSSVM, was proposed for the point prediction of new cases and deaths from COVID-19. Three countries were selected as experimental cases and compared with the benchmark model to verify the prediction accuracy of the proposed model. To show the superior forecast performance of the hybrid model, five benchmark models, namely, ARIMA, back propagation neural network (BPNN), general regression neural network (GRNN), LSSVM, and SCA-LSSVM, were introduced. Experiment III calculated the interval prediction of new cases and new deaths in three countries based on the best distribution function determined in Experiment I and the point prediction results with the highest accuracy in Experiment II. Details are shown in the following sections.
To obtain the characteristics of the COVID-19 series and determine the optimal distribution function, four DFs (Weibull, Rayleigh, Lognormal, and Gamma), were used to calculate the distribution function of new COVID-19 cases and deaths. In addition, the parameter assessment of DFs was an essential step. Traditionally, the MLE method is used for parameter estimation of DFS. However, this study employed a robust optimization algorithm SCA to optimize the relevant parameters, and MLE was used as a comparison method to illustrate the optimization performance of SCA. Table 3 shows the estimated parameters of the different DFs determined by the MLE and SCA methods. To further select the optimal DFs, the MAE, RMSE, and R2 were chosen as error criteria to determine the fitting level of these DFs. Table 4 shows the values of the error results for the different distributions of new cases and new deaths of the epidemic in the three countries, and the bold values are the optimal results. Among the four DFs of all datasets, the R2 determined by the SCA algorithm was significantly larger than that of the MLE method. At the same time, the SCA algorithm determined that the values of MAE and RMSE were also smaller than those of the MLE method. Thus, the SCA algorithm used in this paper had better optimization performance and simulated the distribution of the epidemic data exactly.
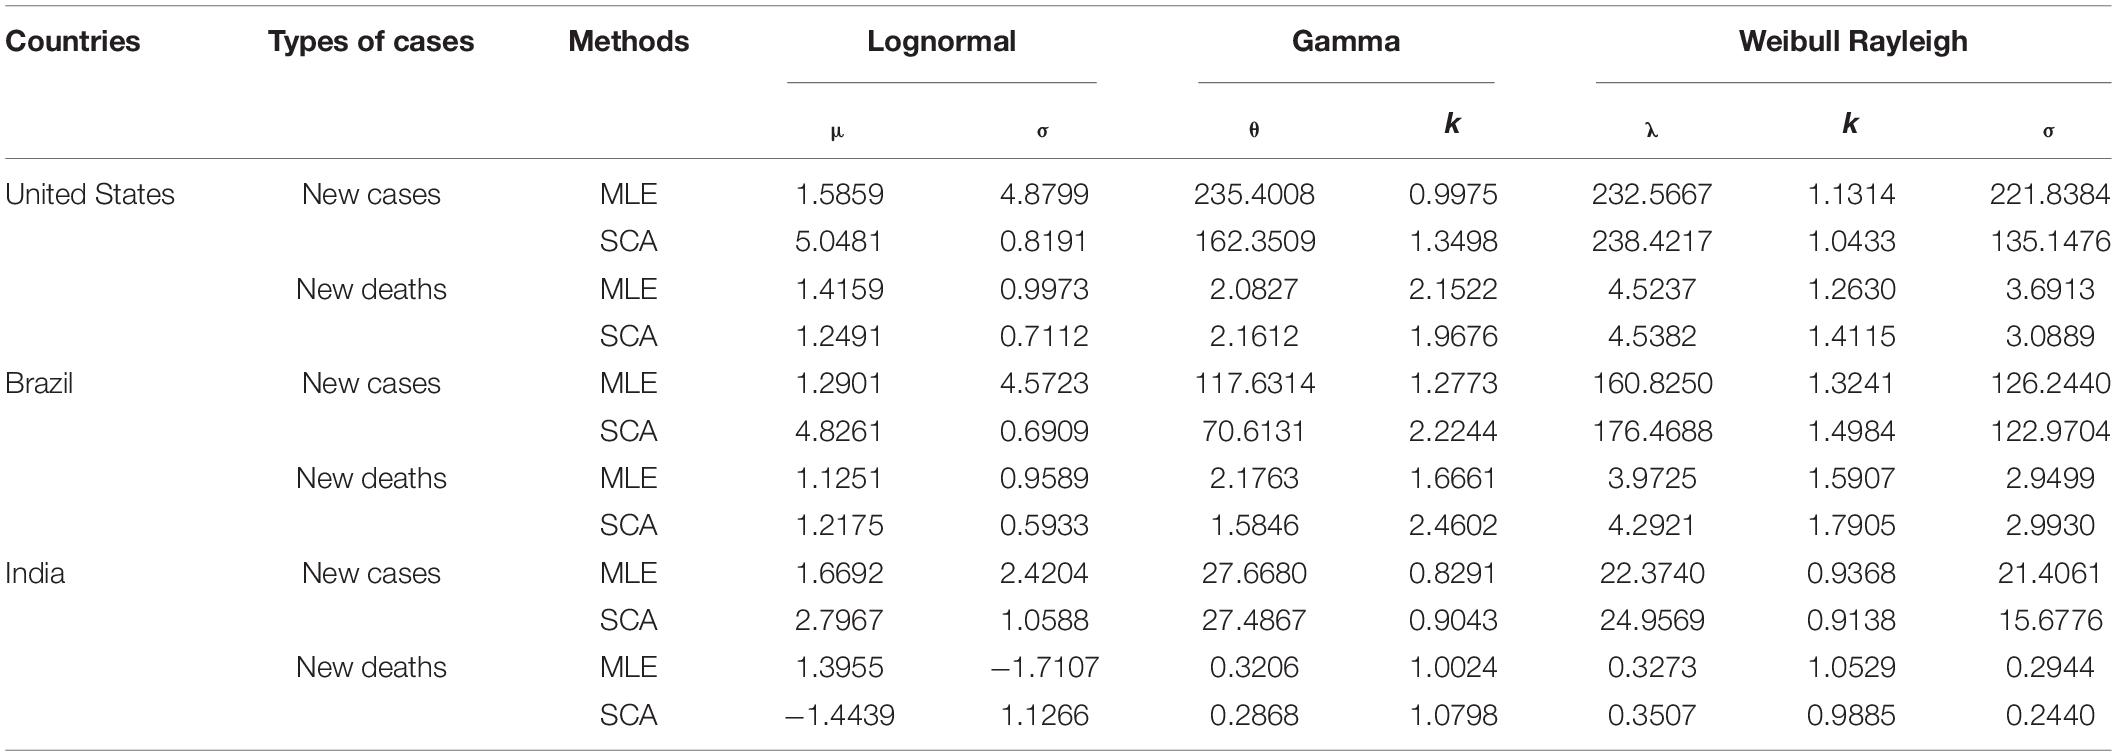
Table 3. The parameters values of the different distribution functions are determined by MLE and SCA.
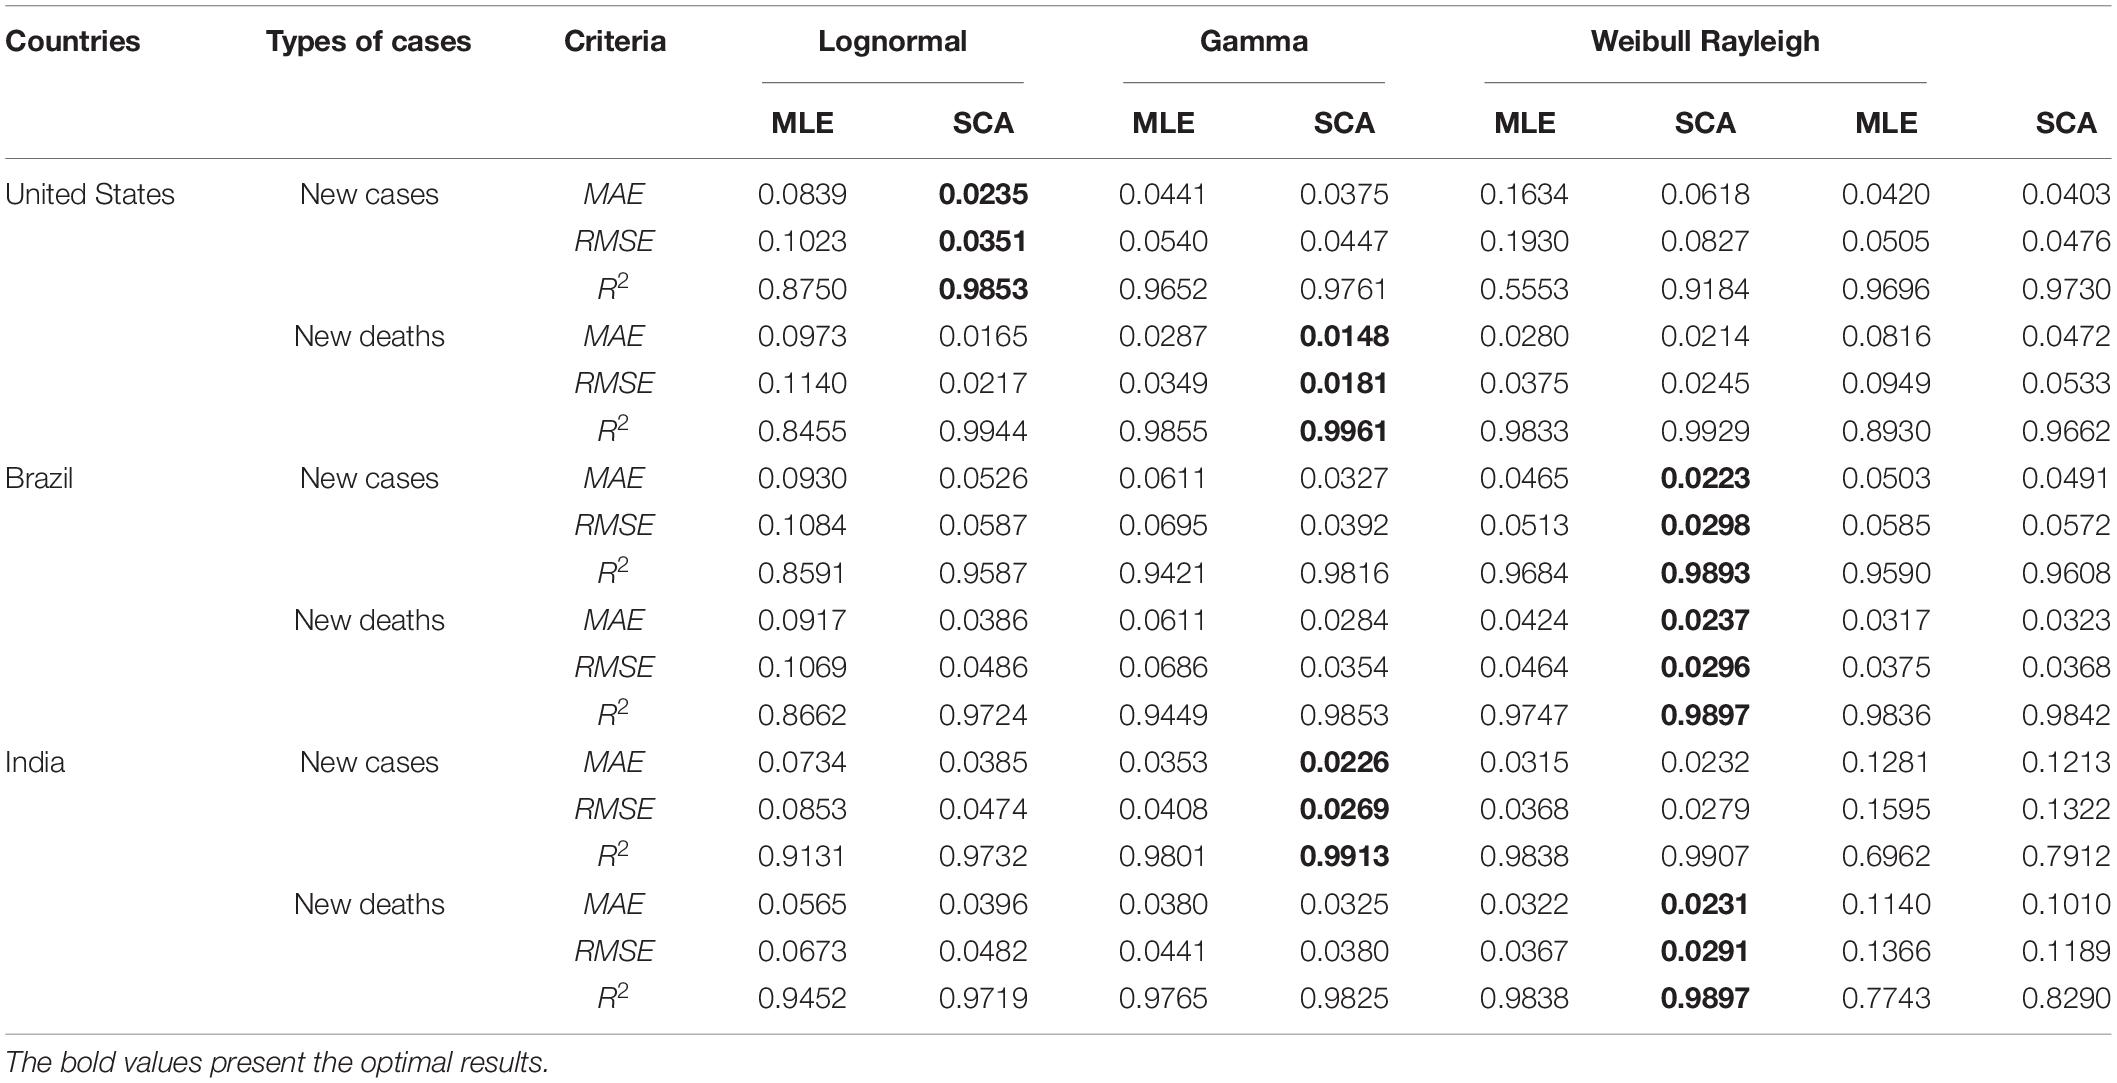
Table 4. The criteria values of different distribution functions of six datasets.
Furthermore, among the four DFs optimized by SCA, SCA-Lognormal only achieved optimal simulation capability for the new cases in the United States. SCA-Gamma achieved optimal simulation performance for both the new deaths in the United States and the new cases in India. SCA-Weibull obtained optimal simulation ability for new cases and new deaths in Brazil and India.
In this experiment, an intelligent hybrid prediction model coupled with environmental variables (TN-SCA-LSSVM) was used to perform a point prediction analysis of new cases and new deaths in three countries. The new cases and new deaths of COVID-19 and the environmental variables (temperature and NO2) were taken as inputs of the multivariable point prediction. Thus, the number of input neurons of LSSVM was set to 4. To evaluate the predictive advantages of the proposed hybrid model, five univariate approaches, namely, ARIMA, BPNN, GRNN, LSSVM, and SCA-LSSVM, were selected as benchmark models for comparison. In addition, six evaluation criteria (MAE, RMSE, MAPE, IA, DA, and R2) were used to reflect the prediction performance of the models; the results are shown in Tables 5, 6. The boldly marked values indicate the best values of the model in different evaluation metrics, and the optimal point prediction model is selected accordingly. Figure 2 shows the predicted and observed values between the proposed model and other models. Further discussion of the experimental results follows.
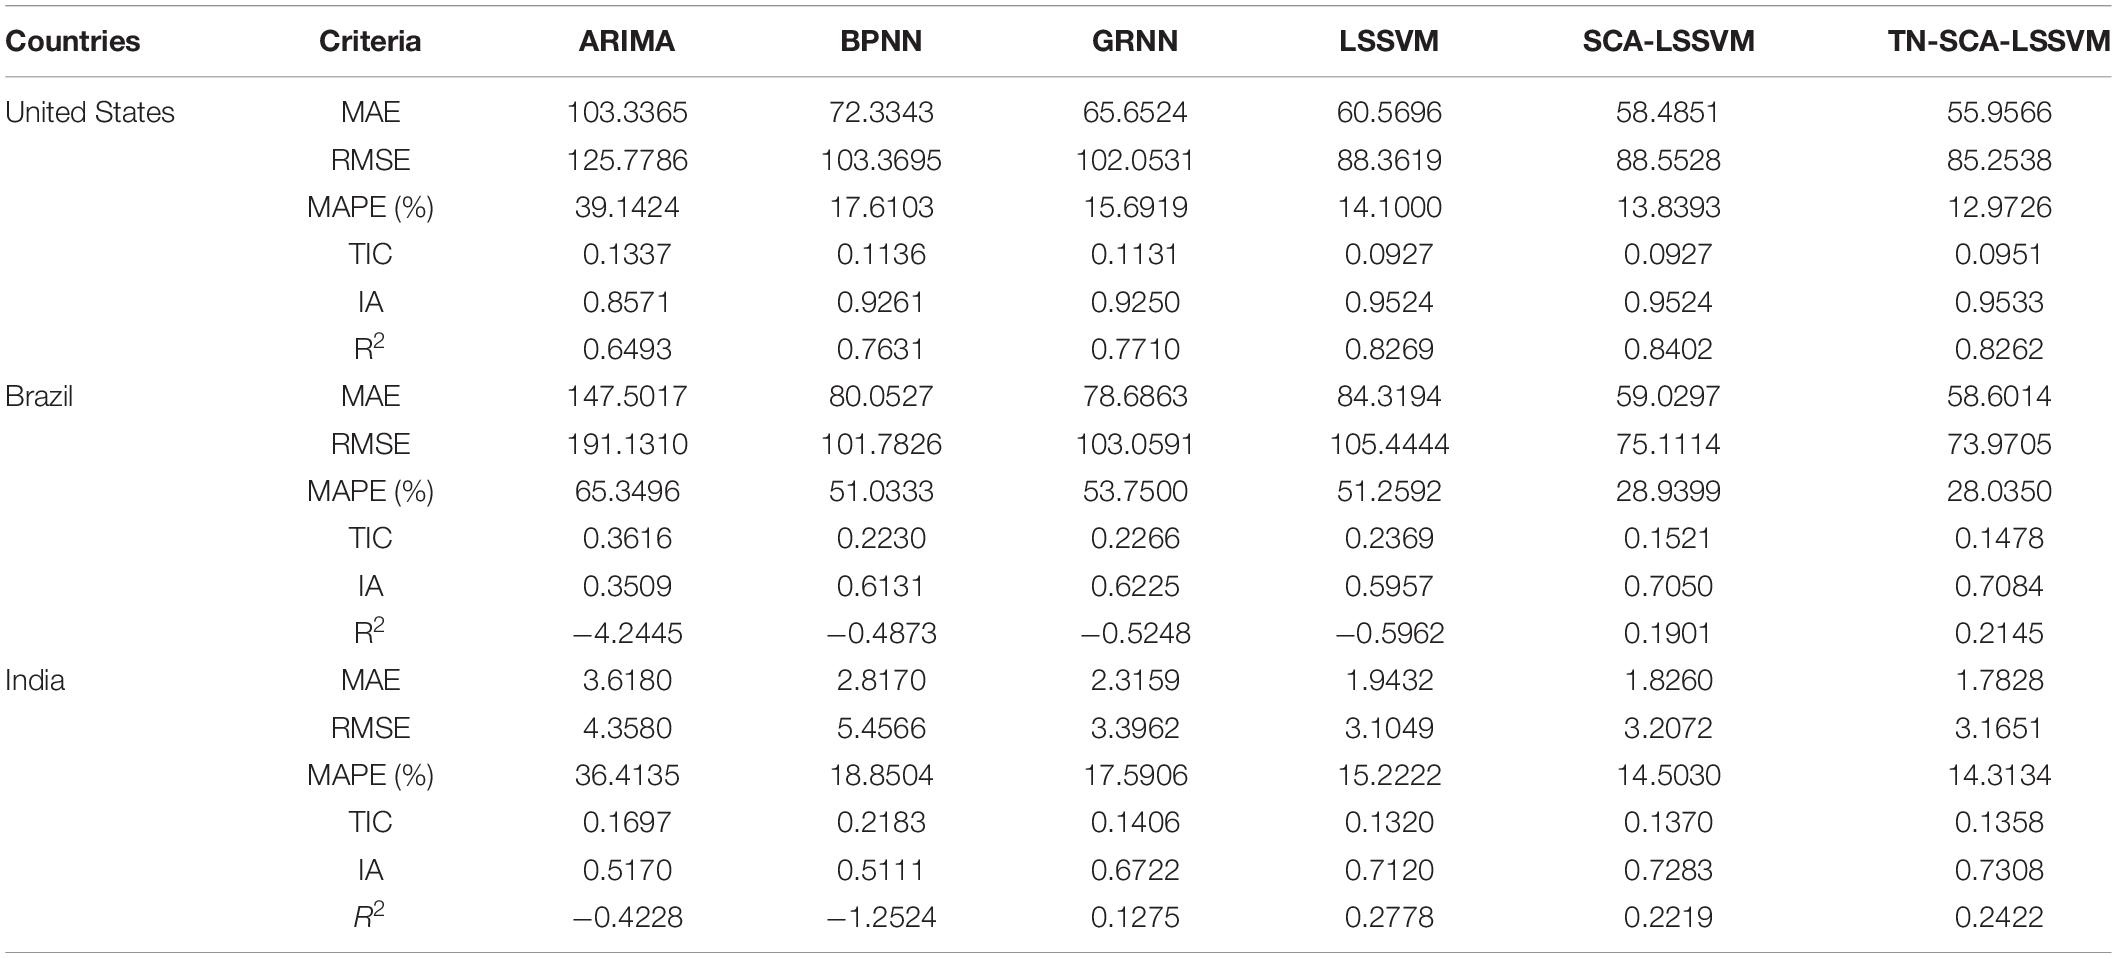
Table 5. The comparative forecasting error of different models for COVID-19 new cases.
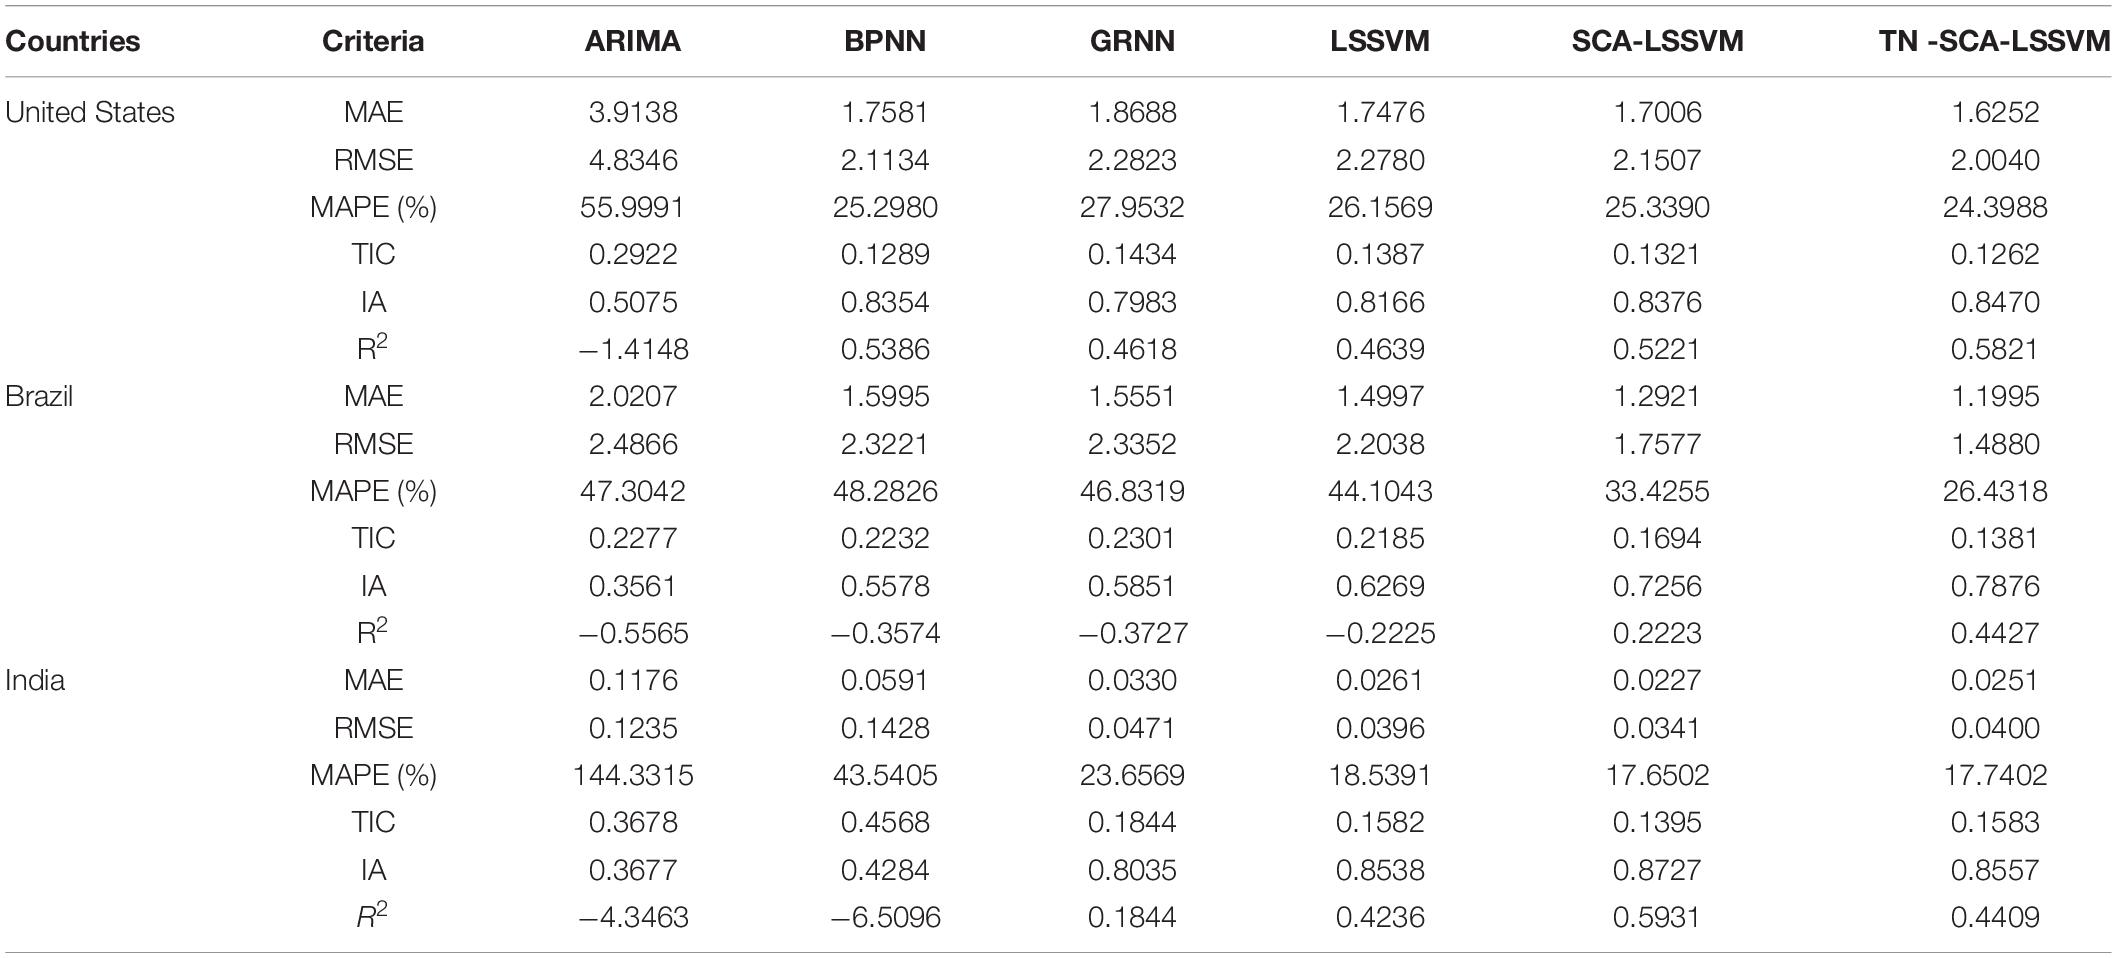
Table 6. The comparative forecasting error of different models for COVID-19 new death cases.
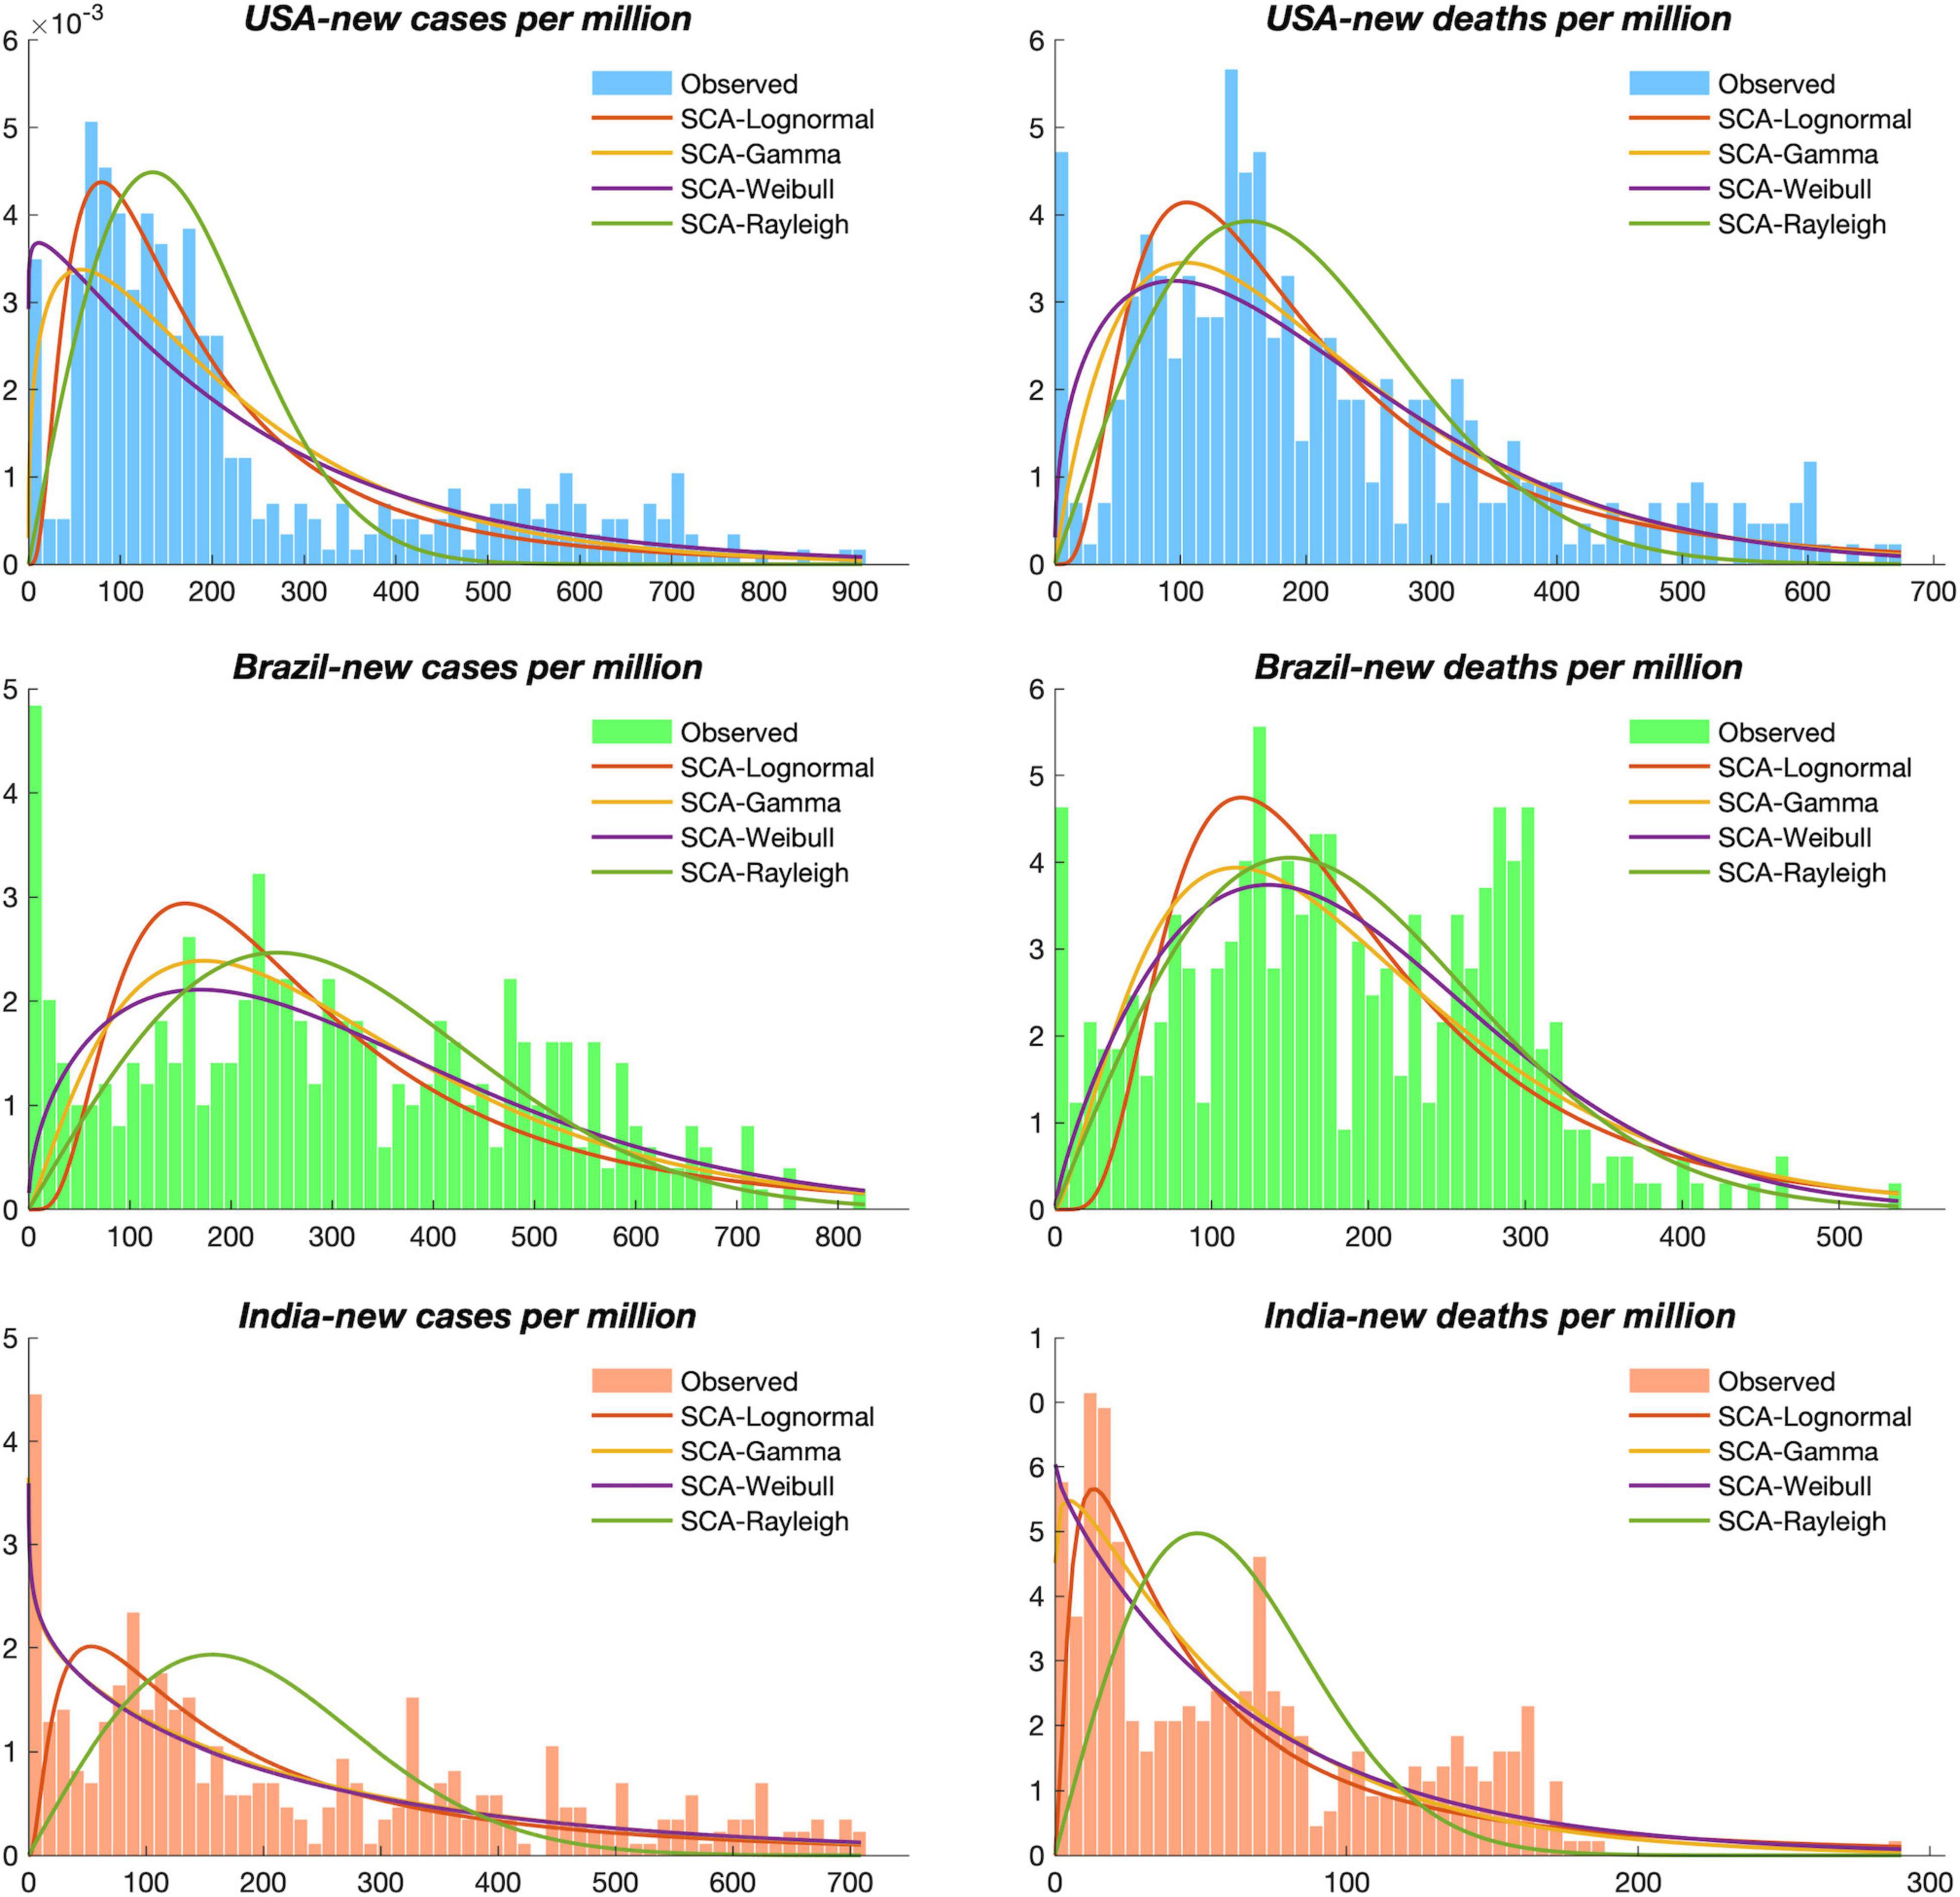
Figure 2. The observed sequences and probability density functions of four distributions in the United States, Brazil, and India.
From Table 5, we can draw the following conclusions:
For the single model comparisons, including ARIMA, BPNN, GRNN, LSSVM, it can be seen from Table 5 and Figure 3 that LSSVM had more accurate prediction accuracy than other single models and had the best performance among a variety of error indicators of MAE, RMSE, MAPE, IA, DA, and R2. For instance, the MAPE of new cases predicted by ARIMA, BPNN, GRNN, and LSSVM in the United States were 39.1424, 17.6103, 15.6918, and 14.1000%, respectively. In Brazil, the MAPE values of ARIMA, BPNN, GRNN, and LSSVM were 65.3496, 51.0333, 53.7500, and 51.2592%, respectively. In India, the MAPE values of ARIMA, BPNN, GRNN, and LSSVM were 36.4135, 18.8504, 17.5906, and 15.2222%, respectively.
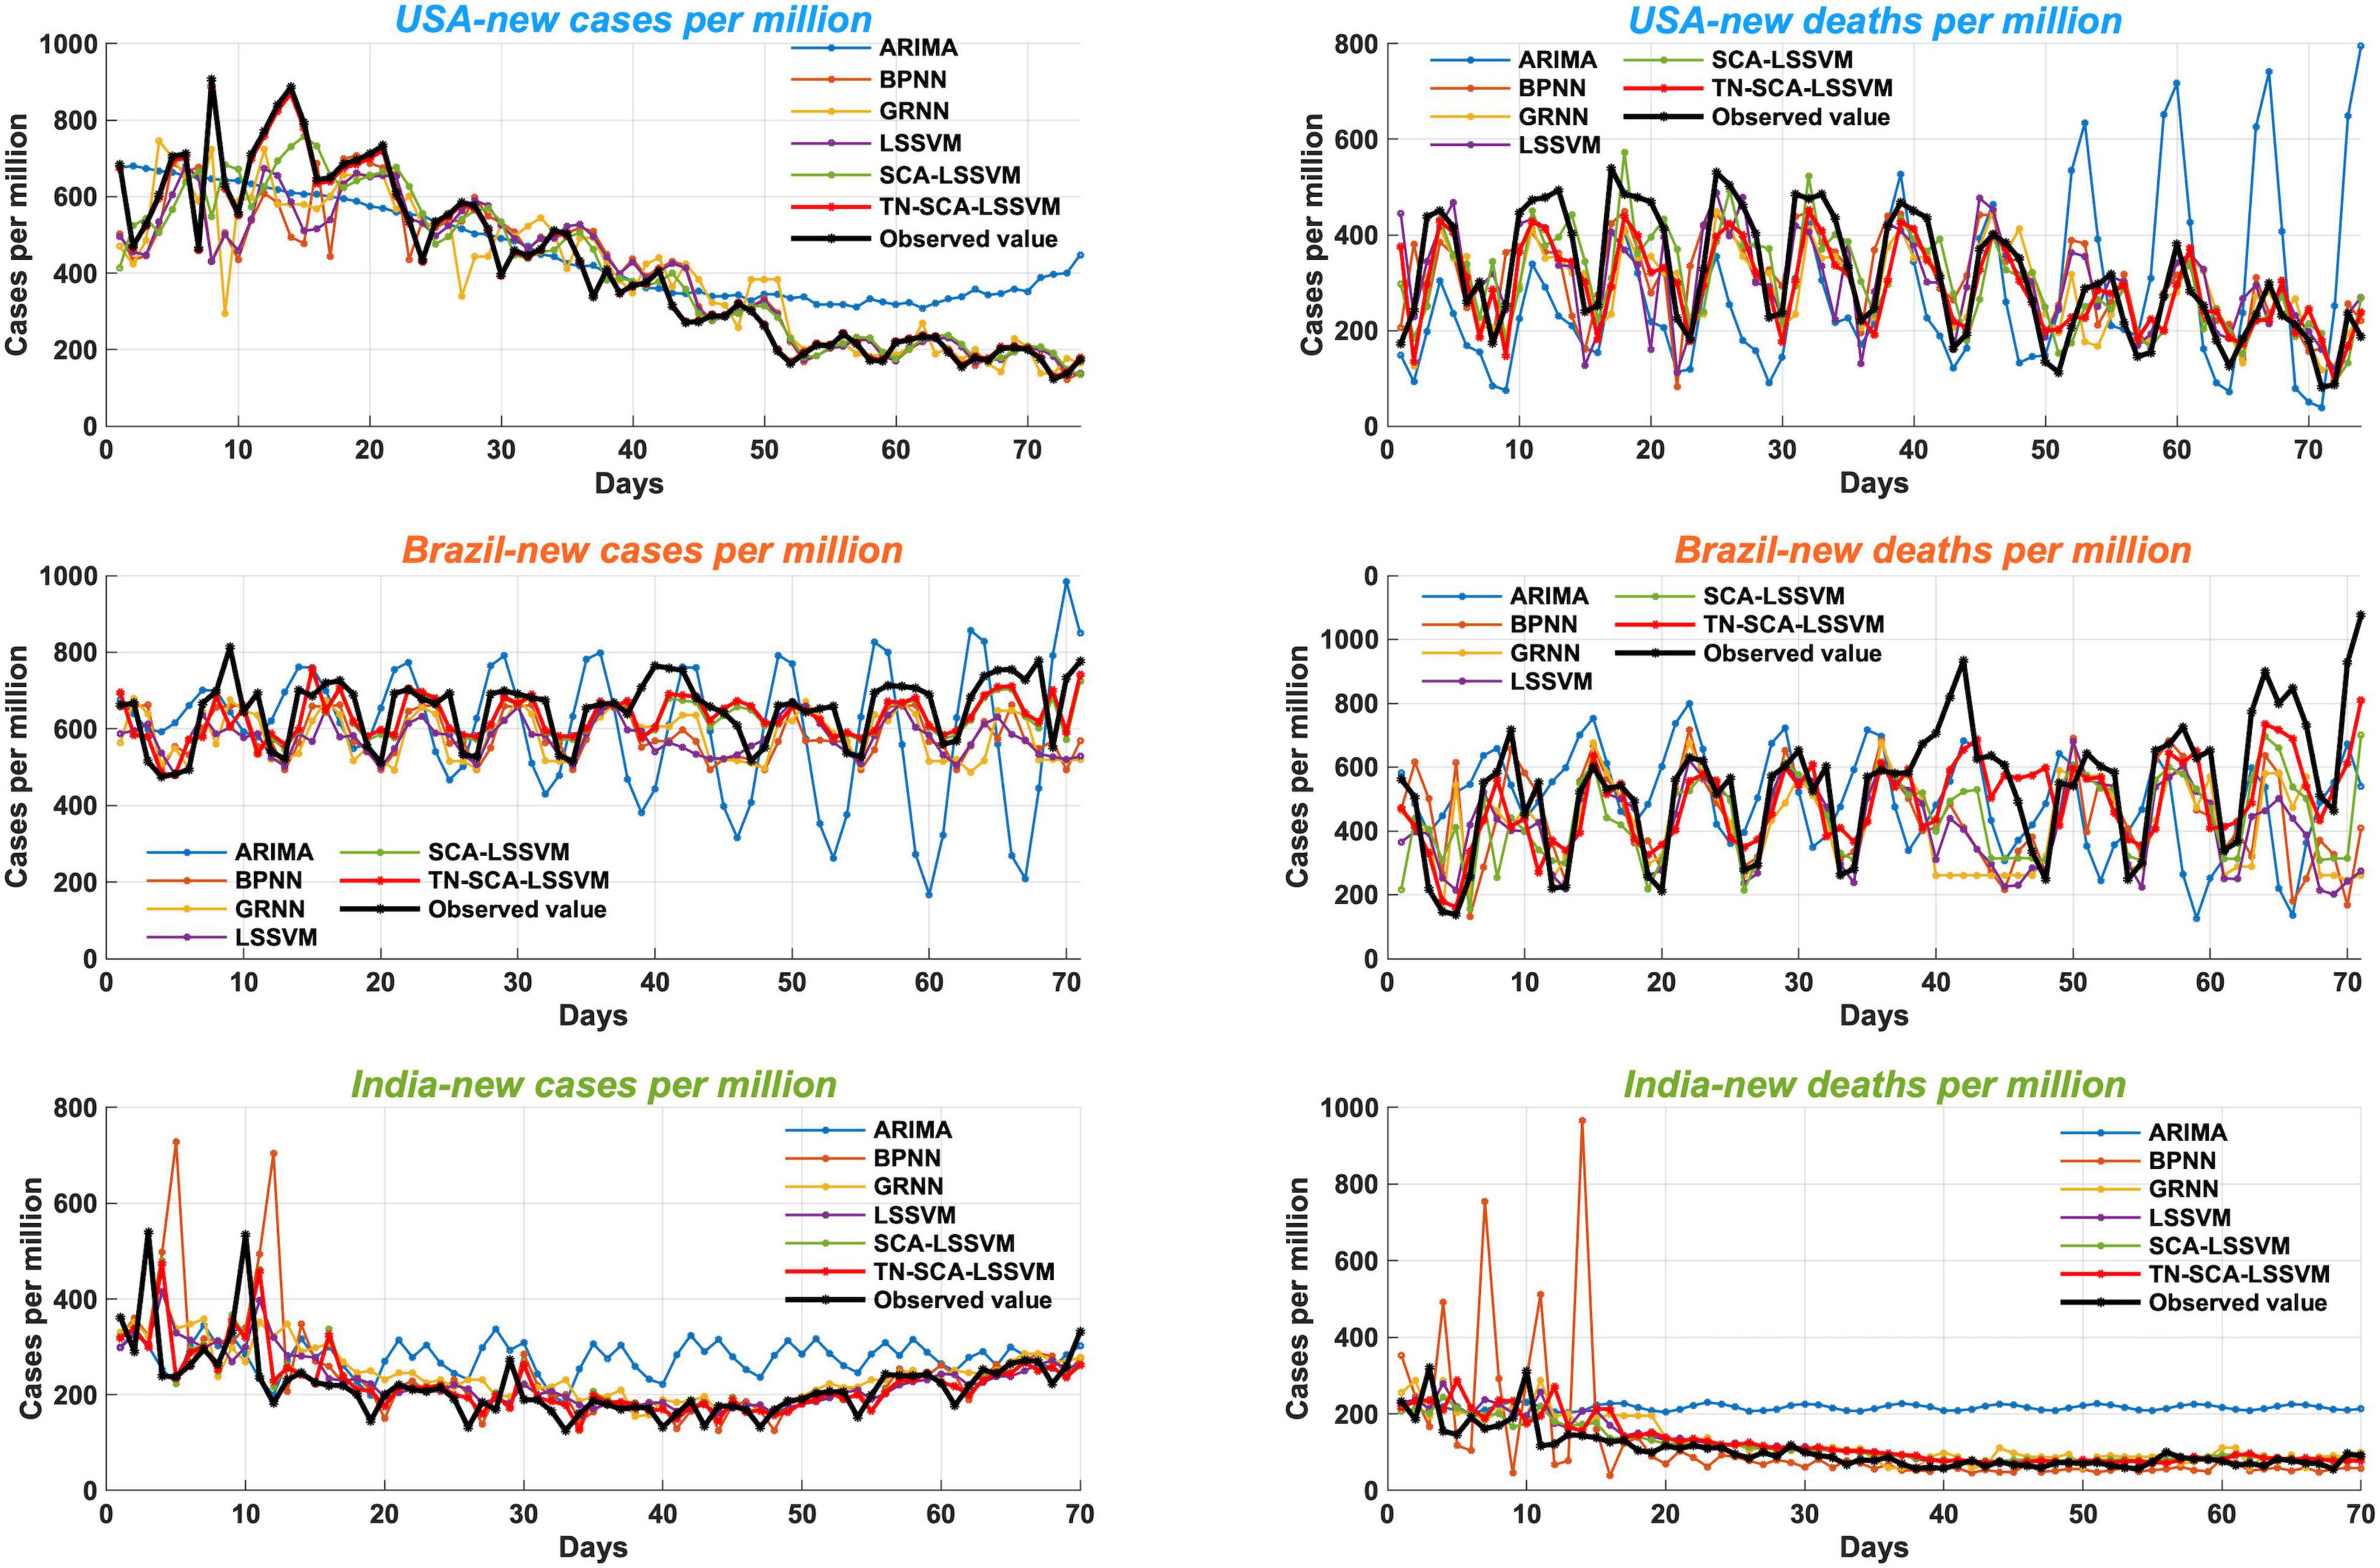
Figure 3. Forecasting results of the proposed model and benchmark models.
The proposed hybrid model with environmental features showed stronger predictive performance compared with other models. For example, in the United States, compared with the LSSVM and SCA-LSSVM, TN-SCA-LSSVM led to 7.6160 and 4.3233% reductions in MAE, 3.5175 and 3.7255% reductions in RMSE, and 7.9957 and 6.2626% reductions in MAPE, respectively. In Brazil, compared with LSSVM and SCA-LSSVM, TN -SCA-LSSVM led to 30.5007 and 0.7256% reductions in MAE, 29.8488 and 1.5190% reductions in RMSE, and 45.3074 and 3.1267% reductions in MAPE, respectively. In India, compared with LSSVM and SCA-LSSVM, TN-SCA-LSSVM led to 21.1537 and 6.0300% reductions in MAE, 5.5636 and −3.2965% reductions in RMSE, and 17.5524 and 4.7246% reductions in MAPE, respectively. According to the six evaluation criteria, it can be concluded that the proposed hybrid multivariable model was significantly better than other benchmark models for forecasting new cases.
From Table 6, we can draw the following conclusions:
It can be seen from Table 6 and Figure 3 that the proposed TN-SCA-LSSVM showed stronger predictive performance than ARIMA, BPNN, GRNN, LSSVM, and SCA-LSSVM. LSSVM had more accurate prediction accuracy than other single models and had the best performance among various error indicators of MAE, RMSE, MAPE, IA, DA, and R2. The proposed TN-SCA-LSSVM showed stronger predictive performance than other single or hybrid univariate models. According to the six evaluation criteria, it can be concluded that the proposed hybrid multivariable model was significantly better than other benchmark models for forecasting new death cases.
The proposed hybrid multivariable model with environmental features had strong prediction ability and effectively addressed the complexity and non-linearity of new cases and new deaths. The optimization method played an essential role in improving the prediction accuracy of the hybrid model. Results indicated that the SCA significantly improved the prediction performance of the LSSVM. In addition, the forecasting model with environmental variables further improved the prediction ability of the hybrid model.
In Experiment III, based on the interval forecasting theory discussed in Section “Interval Forecasting Module,” the interval prediction of new cases and new deaths in three countries was calculated by incorporating the optimal distribution function determined in Section “Experiment I: Distribution Functions of COVID-19 Cases” and the point prediction results with the highest accuracy in Section “Experiment II: Intelligent Point Prediction for COVID-19 Cases.” In addition, two metrics, PIAW and PICP listed in Table 1, were used to measure the validity of the interval prediction. It should be noted that the optimal interval prediction should satisfy the following conditions: The larger the IFCP value (0 ≤ IFCP ≤ 100%) and the smaller the IFAW value at a given significance level α are, the better the predictive performance of the interval prediction. Table 7 shows the United States, India, and Brazil interval prediction results under five different significance levels (0.20, 0.25, 0.30, 0.35, and 0.40). From Table 7, it can be observed that the values of IFCP and IFAW were different at five significance levels. For example, when α was 0.3, the IFCP and IFAW of COVID-19 new cases in the United States were 100.00% and 372.9357; when α was 0.35, the IFCP and IFAW of COVID-19 new cases in the United States were 100.00% and 270.2132, respectively.
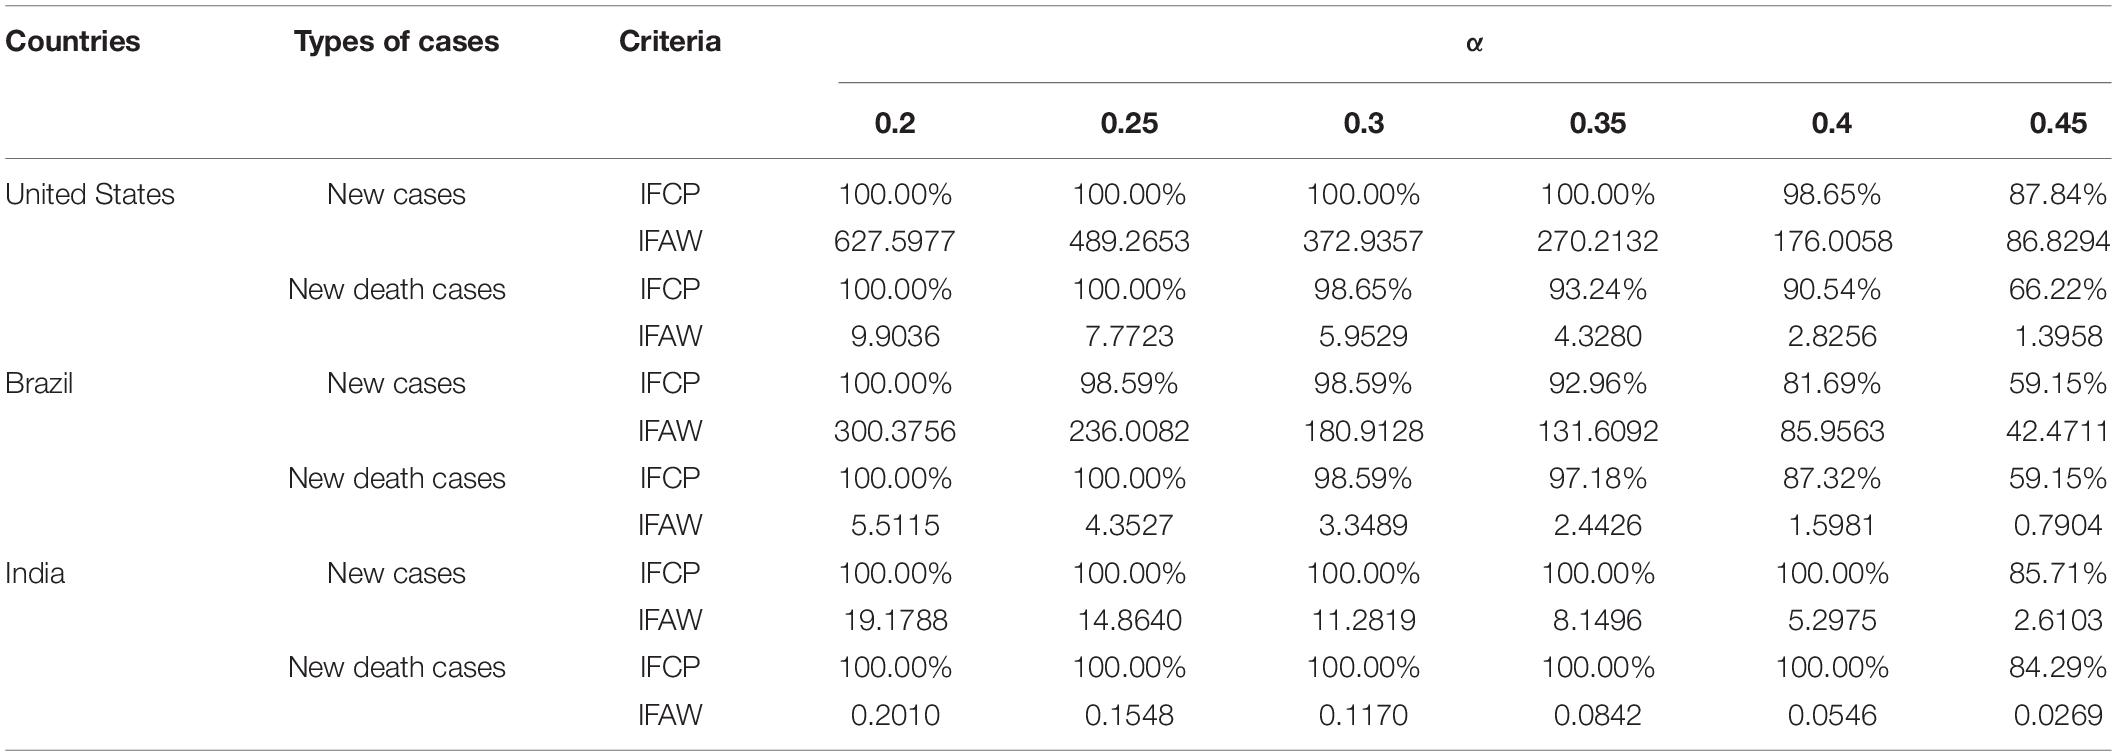
Table 7. The interval prediction results under five different significance levels of COVID-19 cases.
To present the interval prediction results more visually, the interval prediction results of COVID-19 cases at four significance levels of 0.25, 0.3, 0.35, and 0.4 were selected to make a visual effect, as shown in Figure 4. Figure 4 contains six subplots showing the interval prediction results of new cases and new deaths for each of the three countries. The dots represent the actual value, and the color depth of the shaded area indicates the range of interval forecasting at different significance levels. When a smaller significance level is selected, there are individual actual values that exceed the corresponding shaded areas. When a smaller significance level is chosen, there are individual actual values that exceed the corresponding shaded areas. When the significance level is large, although the shaded area can cover all the actual values well, it will lead to a large range of prediction intervals and lose practical significance.
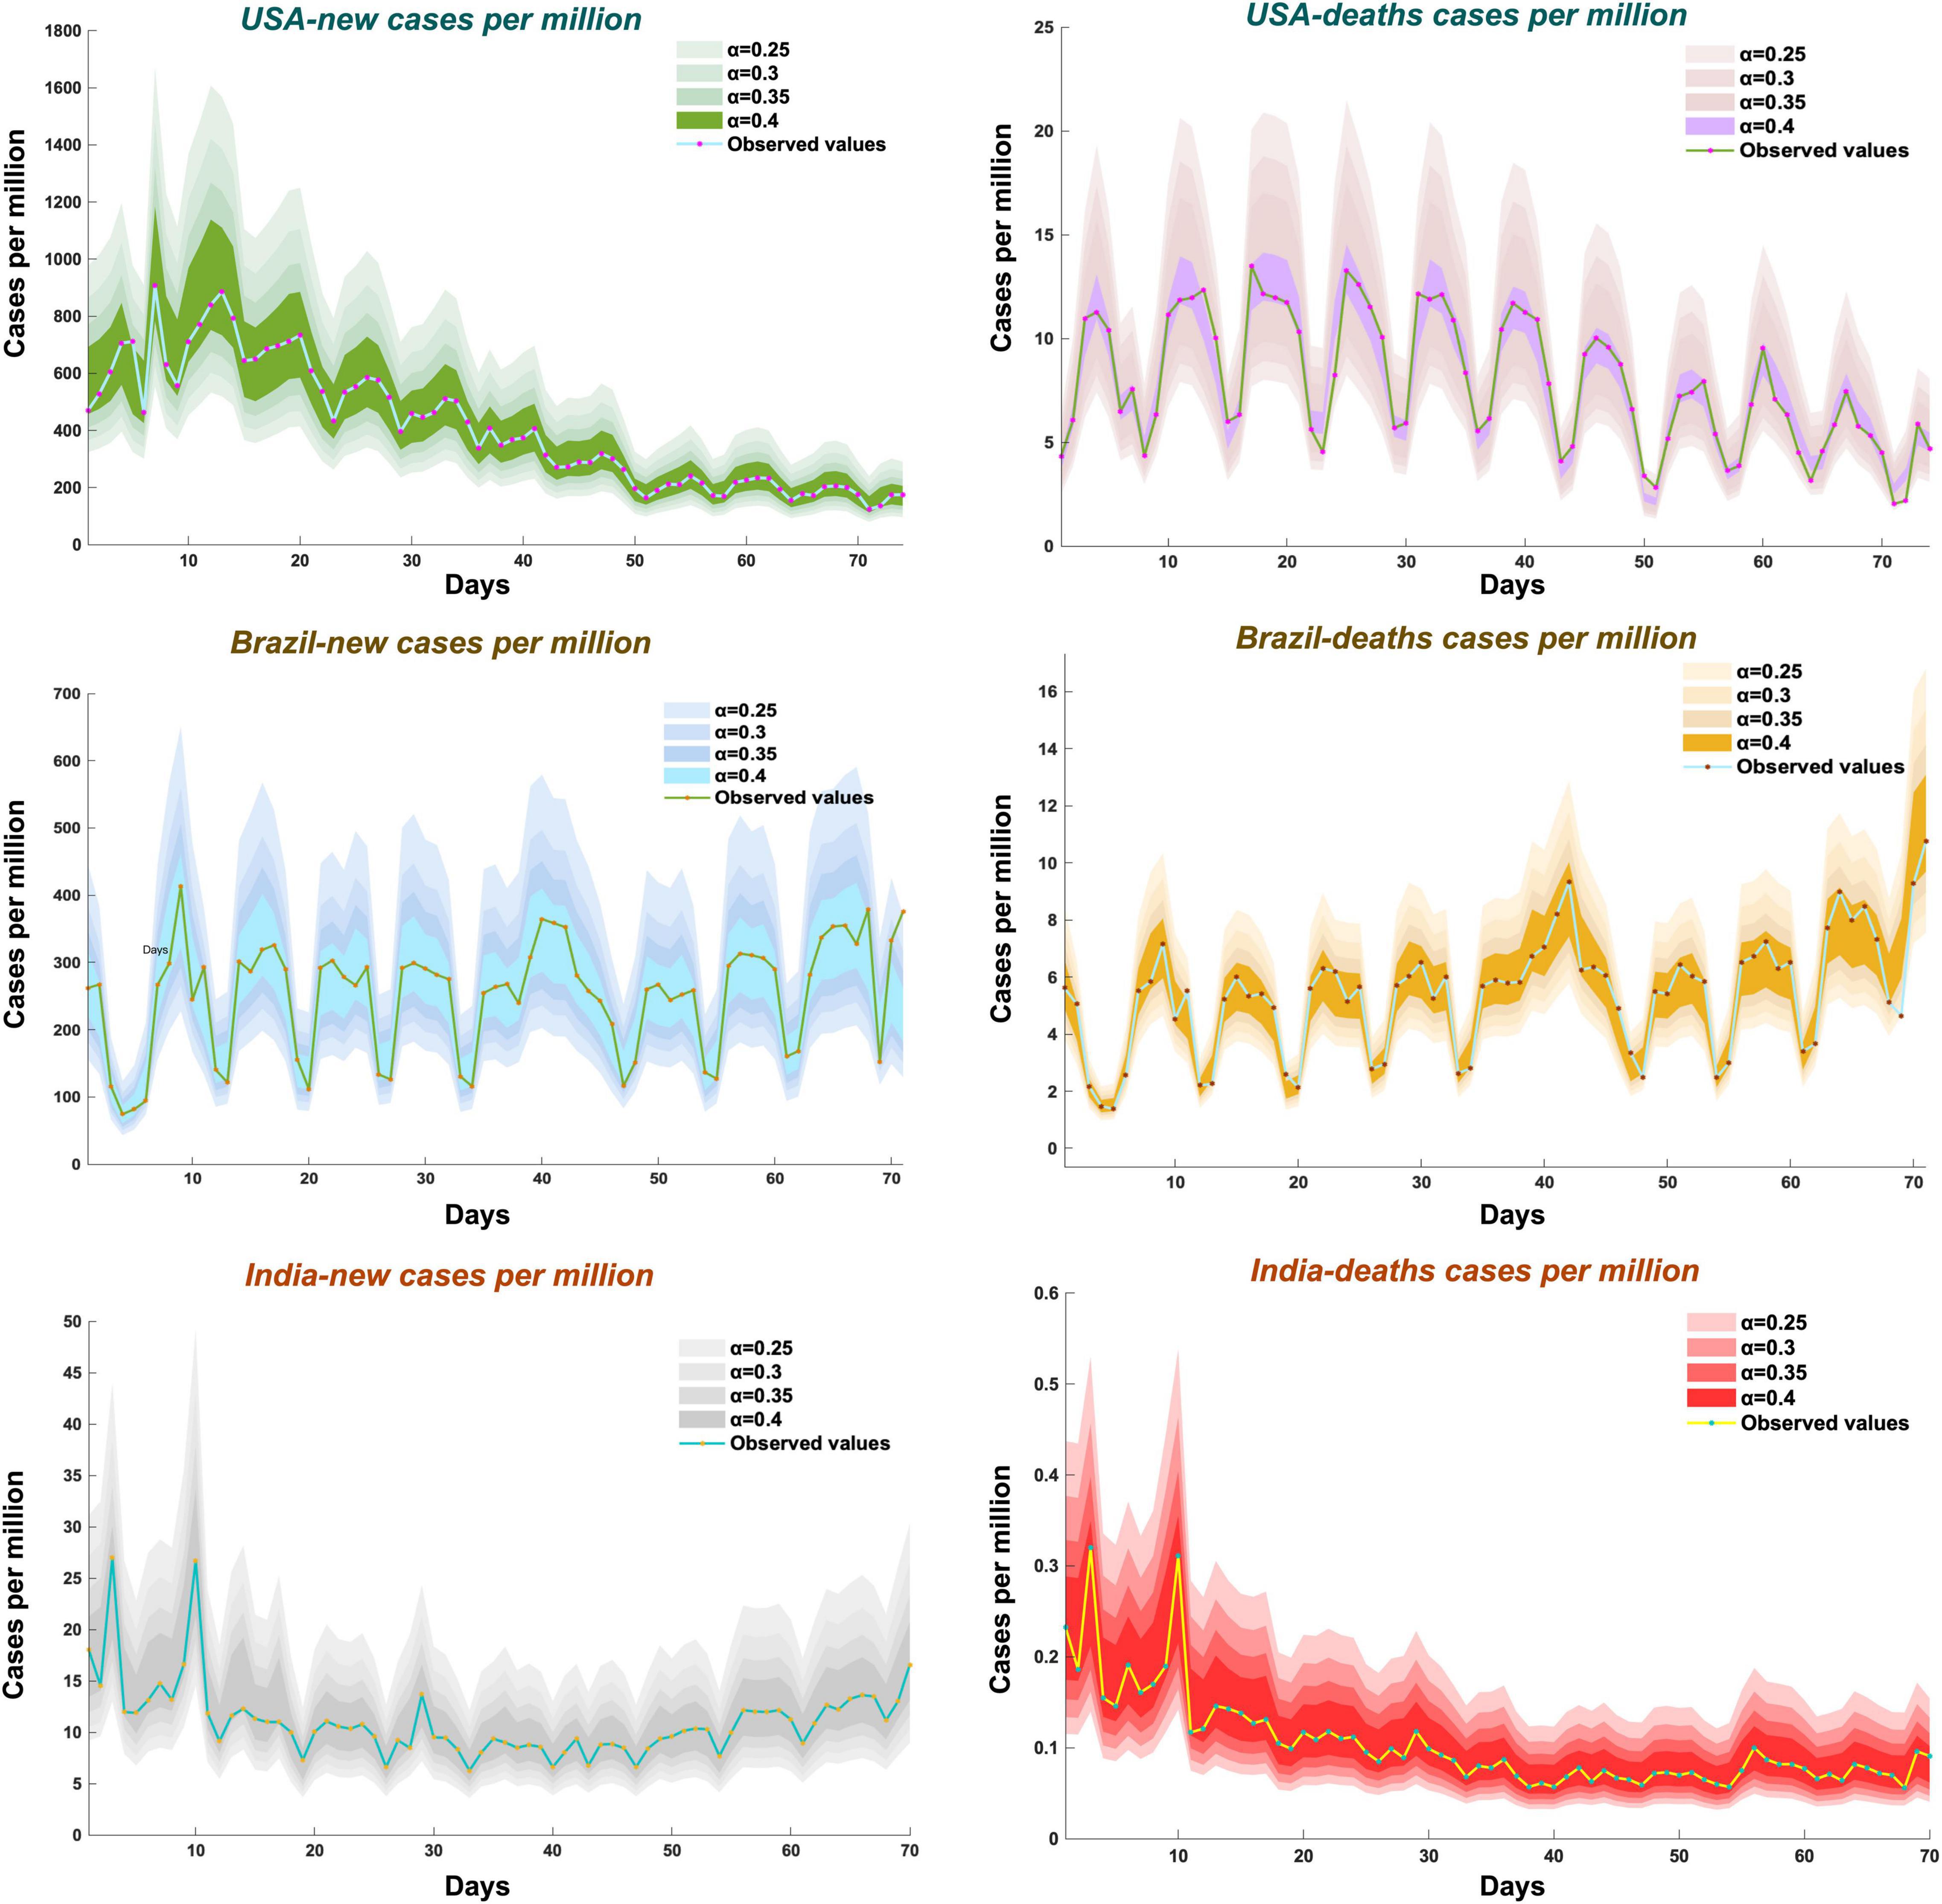
Figure 4. Interval prediction results of the proposed model with different significance levels.
The proposed point and interval forecasting approach with environmental variables obtained better prediction results than other comparable models. The specific reasons were determined to be as follows: First, the optimal DFs and their parameters that best fit the epidemic data of different countries were obtained by SCA. Second, the proposed hybrid multivariable model SCA-LSSCM had a strong prediction ability and effectively addressed the complexity and non-linearity of new cases and new deaths. Third, the addition of environmental variables further improved the prediction ability of the hybrid model. Finally, interval forecasting was calculated based on the optimal DFs and point prediction results to capture uncertainty information for decision-making.
Notably, because the interval prediction results were calculated based on the point prediction results, the interval prediction performance depends mainly on the point prediction results. In addition, a suitable significance level needs to be selected according to the actual situation in the practical application. In conclusion, the interval forecasting model proposed in this study could provide uncertain information about future epidemic development and could be combined with the accurate deterministic information provided by the point prediction hybrid model in Experiment 2. It could provide public health decision-makers with rich information for epidemic prevention and control decisions.
In practice, the proposed model could be driven by real-time data to dynamically and continuously optimize the model parameters by updating the data daily, making the model adaptable to complex epidemic scenarios that are non-linear, dynamic, and ambiguous. At the same time, this data-driven prediction would also help to establish a predictable safeguard mechanism, leaving a window of time for relevant decision-making departments to take measures and adjust strategies in advance to avoid the continuous spread of the epidemic.
This study presented a novel point and interval forecasting approach with environmental variables, which was composed of a distribution function analysis module, an intelligent point prediction module, and an interval forecasting module. In the distribution function analysis module, according to the results of the MAE, RMSE, and R2, SCA-Lognormal achieved optimal simulation capability for the new cases in the United States, while SCA-Gamma achieved optimal simulation performance in both the new deaths in the United States and the new cases in India. SCA-Weibull obtained optimal simulation ability for new cases and new deaths in Brazil and new deaths in India. In the intelligent point prediction module, according to the MAE, RMSE, MAPE, IA, DA, and R2, the hybrid multivariate model TN-SCA-LSSVM achieved more robust predictive performance than other univariate approaches, such as ARIMA, BPNN, GRNN, LSSVM, and SCA-LSSVM, which indicated that SCA significantly improved the prediction performance of LSSVM and that the addition of environmental features (temperature and NO2) further improved the prediction ability of the hybrid model. For instance, the average MAPE values of the proposed TN-SCA-LSSVM model were 62.1521, 33.9225, 27.5146, 18.3956, and 5.8034% lower than those of ARIMA, BPNN, GRNN, LSSVM, and SCA-LSSVM, respectively. In the interval forecasting module, for interval prediction of Covid-19 data in three countries, interval prediction results for new cases and new deaths were obtained based on the point prediction values and optimal DFs of the proposed hybrid TN-SCA-LSSVM model. The results showed that the performance of interval prediction was excellent because most of the observed values were located in the shaded area, with higher values of IFCP and smaller values of IFAW at different significance levels. Overall, the proposed system achieved better prediction results than other comparable models and enabled the informative and practical quantification of future COVID-19 pandemic trends, which offers more constructive suggestions for governmental administrators and the general public.
In this study, epidemiological data and two environmental variables were considered inputs for point and interval prediction models. However, predicting COVID-19 is a complex problem related to multiple factors, such as meteorological, environmental, socioeconomic or policy factors. Thus, the forecasting model can be improved by incorporating more influencing factors from different data sources, which may be an interesting research pursuit.
The original datasets used in the study are included in the article, further inquiries can be directed to the corresponding author.
ZQ: writing, conceptualization, and methodology. YS: writing-reviewing and editing. QX: formal analysis. YL: data curation and visualization. All authors contributed to the article and approved the submitted version.
This work was supported by the National Natural Science Foundation of China (Grant No. 72004086).
The authors declare that the research was conducted in the absence of any commercial or financial relationships that could be construed as a potential conflict of interest.
All claims expressed in this article are solely those of the authors and do not necessarily represent those of their affiliated organizations, or those of the publisher, the editors and the reviewers. Any product that may be evaluated in this article, or claim that may be made by its manufacturer, is not guaranteed or endorsed by the publisher.
ARIMA, auto regressive integrated moving average model; BPNN, back propagation neural network; GRNN, general regression neural network; ANFIS, Adaptive Neuro-Fuzzy Inference System; LSSVM, least square support vector machine; SCA, sine cosine algorithm; DFs, distribution functions; MLE, maximum likelihood estimation; TN-SCA-LSSVM, SCA-LSSVM with NO2 and temperature; ECDC, European Center for Disease Prevention and Control; WAQI, World Air Quality Index project.
Ala’raj, M., Majdalawieh, M., and Nizamuddin, N. (2021). Modeling and forecasting of COVID-19 using a hybrid dynamic model based on SEIRD with ARIMA corrections. Infect. Dis. Model. 6, 98–111. doi: 10.1016/J.IDM.2020.11.007
Barmparis, G. D., and Tsironis, G. P. (2020). Estimating the infection horizon of COVID-19 in eight countries with a data-driven approach. Chaos Solitons Fract. 135:109842. doi: 10.1016/j.chaos.2020.109842
Bauwens, M., Compernolle, S., Stavrakou, T., Müller, J. F., van Gent, J., Eskes, H., et al. (2020). Impact of Coronavirus Outbreak on NO2 Pollution Assessed Using TROPOMI and OMI Observations. Geophys. Res. Lett. [Epub Online ahead of print] doi: 10.1029/2020GL087978
Borghi, P. H., Zakordonets, O., and Teixeira, J. P. (2021). A COVID-19 time series forecasting model based on MLP ANN. Procedia Comput. Sci. 181, 940–947. doi: 10.1016/j.procs.2021.01.250
Castillo, O., and Melin, P. (2020). Forecasting of COVID-19 time series for countries in the world based on a hybrid approach combining the fractal dimension and fuzzy logic. Chaos Solitons Fract. 140:110242. doi: 10.1016/j.chaos.2020.110242
Ceylan, Z. (2020). Estimation of COVID-19 prevalence in Italy, Spain, and France. Sci. Total Environ. 729:138817. doi: 10.1016/j.scitotenv.2020.138817
Covid-19 Worldwide Air Quality data. COVID-19 Worldwide Air Quality data. Available Online at: https://aqicn.org/data-platform/covid19/ (accessed Feb. 13, 2022).
Ghosal, S., Sengupta, S., Majumder, M., and Sinha, B. (2020). Prediction of the number of deaths in India due to SARS-CoV-2 at 5–6 weeks. Diabetes Metab. Syndr. 14, 311–315. doi: 10.1016/j.dsx.2020.03.017
Hao, Y., Niu, X., and Wang, J. (2021). Impacts of haze pollution on China’s tourism industry: a system of economic loss analysis. J. Environ. Manag. 295:113051. doi: 10.1016/J.JENVMAN.2021.113051
He, S., Peng, Y., and Sun, K. (2020). SEIR modeling of the COVID-19 and its dynamics. Nonlinear Dyn. 101, 1667–1680. doi: 10.1007/s11071-020-05743-y
Keerthi, S. S., and Lin, C. J. (2003). Asymptotic behaviors of support vector machines with gaussian kernel. Neural Comput. 15, 1667–1689. doi: 10.1162/089976603321891855
Konstantinoudis, G., Padellini, T., Bennett, J., Davies, B., Ezzati, M., and Blangiardo, M. (2021). Long-term exposure to air-pollution and COVID-19 mortality in England: a hierarchical spatial analysis. Environ. Int. 146:106316. doi: 10.1016/J.ENVINT.2020.106316
Li, M. Y., Graef, J. R., Wang, L., and Karsai, J. (1999). Global dynamics of a SEIR model with varying total population size. Math. Biosci. 160, 191–213. doi: 10.1016/S0025-5564(99)00030-9
Lian, X., Huang, J., Zhang, L., Liu, C., Liu, X., and Wang, L. (2021). Environmental Indicator for COVID-19 Non-Pharmaceutical Interventions. Geophys. Res. Lett. 48:e2020GL090344. doi: 10.1029/2020GL090344
Ly, K. T. (2020). A COVID-19 forecasting system using adaptive neuro-fuzzy inference. Finance Res. Lett. 41:101844. doi: 10.1016/j.frl.2020.101844
Malki, Z., Atlam, E. S., Hassanien, A. E., Dagnew, G., Elhosseini, M. A., and Gad, I. (2020). Association between weather data and COVID-19 pandemic predicting mortality rate: machine learning approaches. Chaos Solitons Fract. 138:110137. doi: 10.1016/J.CHAOS.2020.110137
McAdam, P., and McNelis, P. (2005). Forecasting inflation with thick models and neural networks. Econ. Model. 22, 848–867. doi: 10.1016/J.ECONMOD.2005.06.002
Mirjalili, S. (2016). SCA: a Sine Cosine Algorithm for solving optimization problems. Knowl.-Based Syst. 96, 120–133. doi: 10.1016/j.knosys.2015.12.022
Moftakhar, L., and Seif, M. (2020). The exponentially increasing rate of patients infected with COVID-19 in Iran. Arch. Iran. Med. 23, 235–238. doi: 10.34172/aim.2020.03
Ndaïrou, F., Area, I., Nieto, J. J., and Torres, D. F. M. (2020). Mathematical modeling of COVID-19 transmission dynamics with a case study of Wuhan. Chaos Solitons Fract. 135:109846. doi: 10.1016/j.chaos.2020.109846
Pandey, G., Chaudhary, P., Gupta, R., and Pal, S. (2020). SEIR and Regression Model based COVID-19 outbreak predictions in India. medRxiv [Preprint]. doi: 10.1101/2020.04.01.20049825
Parbat, D., and Chakraborty, M. (2020). A python based support vector regression model for prediction of COVID19 cases in India. Chaos Solitons Fract. 138:109942. doi: 10.1016/j.chaos.2020.109942
Shi, P., Dong, Y., Yan, H., Zhao, C., Li, X., Liu, W., et al. (2020). Impact of temperature on the dynamics of the COVID-19 outbreak in China. Sci. Total Environ. 728:138890. doi: 10.1016/J.SCITOTENV.2020.138890
Song, Y., Qin, S., Qu, J., and Liu, F. (2015). The forecasting research of early warning systems for atmospheric pollutants: a case in Yangtze River Delta region. Atmos. Environ. 118, 58–69. doi: 10.1016/j.atmosenv.2015.06.032
Stock, J. H., and Watson, M. W. (2004). Combination forecasts of output growth in a seven-country data set. J. Forecast. 23, 405–430. doi: 10.1002/for.928
Suykens, J. A. K., and Vandewalle, J. (1999). Least squares support vector machine classifiers. Neural Process. Lett. 9, 293–300. doi: 10.1023/A:1018628609742
Swapnarekha, H., Behera, H. S., Nayak, J., and Naik, B. (2020). Role of intelligent computing in COVID-19 prognosis: a state-of-the-art review. Chaos Solitons Fract. 138:109947. doi: 10.1016/j.chaos.2020.109947
Tian, C., and Hao, Y. (2020). Point and interval forecasting for carbon price based on an improved analysis-forecast system. Appl. Math. Model. 79, 126–144. doi: 10.1016/j.apm.2019.10.022
Travaglio, M., Yu, Y., Popovic, R., Selley, L., Leal, N. S., and Martins, L. M. (2021). Links between air pollution and COVID-19 in England. Environ. Pollut. 268:115859. doi: 10.1016/J.ENVPOL.2020.115859
Wang, M., Jiang, A., Gong, L., Luo, L., Guo, W., Li, C., et al. (2020). Temperature Significantly Change COVID-19 Transmission in 429 cities. medRxiv [Preprint]. doi: 10.1101/2020.02.22.20025791
Wu, T., Perrings, C., Kinzig, A., Collins, J. P., Minteer, B. A., and Daszak, P. (2017). Economic growth, urbanization, globalization, and the risks of emerging infectious diseases in China: a review. Ambio 46, 18–29. doi: 10.1007/s13280-016-0809-2
Wu, Y., Jing, W., Liu, J., Ma, Q., Yuan, J., Wang, Y., et al. (2020). Effects of temperature and humidity on the daily new cases and new deaths of COVID-19 in 166 countries. Sci. Total Environ. 729:139051. doi: 10.1016/J.SCITOTENV.2020.139051
Xu, Y., Du, P., and Wang, J. (2017). Research and application of a hybrid model based on dynamic fuzzy synthetic evaluation for establishing air quality forecasting and early warning system: a case study in China. Environ. Pollut. 223, 435–448. doi: 10.1016/j.envpol.2017.01.043
Keywords: COVID-19, point forecasting, interval forecasting, artificial intelligence, environmental variables
Citation: Qu Z, Sha Y, Xu Q and Li Y (2022) Forecasting New COVID-19 Cases and Deaths Based on an Intelligent Point and Interval System Coupled With Environmental Variables. Front. Ecol. Evol. 10:875000. doi: 10.3389/fevo.2022.875000
Received: 13 February 2022; Accepted: 25 March 2022;
Published: 02 May 2022.
Edited by:
Yan Hao, Shandong Normal University, ChinaReviewed by:
Yunxuan Dong, University of Macau, ChinaCopyright © 2022 Qu, Sha, Xu and Li. This is an open-access article distributed under the terms of the Creative Commons Attribution License (CC BY). The use, distribution or reproduction in other forums is permitted, provided the original author(s) and the copyright owner(s) are credited and that the original publication in this journal is cited, in accordance with accepted academic practice. No use, distribution or reproduction is permitted which does not comply with these terms.
*Correspondence: Yongzhong Sha, c2hheXpoQGx6dS5lZHUuY24=
Disclaimer: All claims expressed in this article are solely those of the authors and do not necessarily represent those of their affiliated organizations, or those of the publisher, the editors and the reviewers. Any product that may be evaluated in this article or claim that may be made by its manufacturer is not guaranteed or endorsed by the publisher.
Research integrity at Frontiers
Learn more about the work of our research integrity team to safeguard the quality of each article we publish.