 Jarrett D. Phillips
- 1School of Computer Science, University of Guelph, Guelph, ON, Canada
- 2Biodiversity Institute of Ontario, University of Guelph, Guelph, ON, Canada
- 3Department of Integrative Biology, University of Guelph, Guelph, ON, Canada
DNA barcoding has been largely successful in satisfactorily exposing levels of standing genetic diversity for a wide range of taxonomic groups through the employment of only one or a few universal gene markers. However, sufficient coverage of geographically-broad intra-specific haplotype variation within genomic databases like the Barcode of Life Data Systems (BOLD) and GenBank remains relatively sparse. As reference sequence libraries continue to grow exponentially in size, there is now the need to identify novel ways of meaningfully analyzing vast amounts of available DNA barcode data. This is an important issue to address promptly for the routine tasks of specimen identification and species discovery, which have seen broad adoption in areas as diverse as regulatory forensics and resource conservation. Here, it is demonstrated that the interpretation of DNA barcoding data is lacking in statistical rigor. To highlight this, focus is set specifically on one key concept that has become a household name in the field: the DNA barcode gap. Arguments outlined herein specifically center on DNA barcoding in animal taxa and stem from three angles: (1) the improper allocation of specimen sampling effort necessary to capture adequate levels of within-species genetic variation, (2) failing to properly visualize intra-specific and interspecific genetic distances, and (3) the inconsistent, inappropriate use, or absence of statistical inferential procedures in DNA barcoding gap analyses. Furthermore, simple statistical solutions are outlined which can greatly propel the use of DNA barcoding as a tool to irrefutably match unknowns to knowns on the basis of the barcoding gap with a high degree of confidence. Proposed methods examined herein are illustrated through application to DNA barcode sequence data from Canadian Pacific fish species as a case study.
1. The Many Faces of DNA Barcoding
1.1. DNA Barcoding: Historical Development
In its infancy, DNA barcoding (Hebert et al., 2003a) was envisaged as a means to resolve a longstanding problem facing biodiversity science: the taxonomic impediment. Significant lack of progress in taxon characterization due to an aging expert population, in conjunction with the limited availability of adequate research funding to support such endeavors, has greatly contributed to the lack of timely dissemination of taxonomic information and knowledge in recent decades (Cao et al., 2016). In a time marked by global species extinction and ongoing environmental crisis, DNA barcoding promised to accelerate the description of novel taxa, as well as revise the status of existing ones. This was possible through the assembly of genetic “signatures” within a centralized repository more rapidly than customary Linnean classification was even capable. The proposal seemed, at first, like wishful thinking within some academic circles. DNA barcoding employs short molecular sequence tags from standardized genomic regions, such as the c. 650 bp fragment from the 5' end of the mitochondrial cytochrome c oxidase subunit I (COI) gene in animals, to establish taxon-level matches to unknown specimen queries at any life stage across the animal kingdom (Hebert et al., 2003b). Several past studies have also discussed the appeal of isolating a barcode sequence from mitochondrial DNA (mtDNA), as opposed to its nuclear counterpart [e.g., Hubert et al. (2008); Hubert and Hanner (2015)]. Notably, due to the effects of random genetic drift, mutational substitutions are expected to reach fixation within populations and become diagnostic of species sooner because the effective population size of mitochondria is one-quarter less than that of nuclear genes. The specific choice of COI as the currently unattested DNA barcode for animals is justified in several respects: (1) that it is protein-coding, (2) that it possesses a reasonably high rate of nucleotide substitution, and (3) that it lacks introns and comprises few insertions/deletions (indels) and no stop codons. In addition to these desirable characteristics, its ease of amplification, sequencing and alignment across most taxa, due to its highly conserved nature, makes COI the preferred gene marker over other such loci that meet only some of the abovementioned requirements (Phillips et al., 2019). Despite this, the attractiveness of DNA barcoding's use as both a specimen identification and species discovery tool is fraught with much controversy. The molecular identification of specimens to any level of biological organization through DNA barcodes necessarily depends a priori on known taxon designations brought about through the current state of taxonomic practices (DeSalle, 2006). Furthermore, DNA barcoding's success rests crucially on extant species-level haplotype diversity as well as the distinction between intra-specific and interspecific genetic variation across taxa (Phillips et al., 2019). When such links can be established, observable geographic and historic patterns of genetic diversity are then readily explained.
While DNA barcoding has found myriad applications in diverse subdisciplines of evolutionary biology, ecology, and more broadly in biodiversity science, one surprising area, namely applied regulatory forensics, has reaped the benefits barcoding has to offer in unparalleled ways throughout the years. The identification of regulated species of socioeconomic importance through the accumulation of DNA barcodes has been instrumental in combatting instances of seafood market fraud as well as monitoring the introduction and spread of invasive pests, particularly in Canada and the USA [e.g., seafood: Shehata et al. (2018, 2019a); meat products: Naaum et al. (2018), Shehata et al. (2019b); invasive arthropods: Madden et al. (2019)]. Despite this, several obstacles still remain. The inherent dynamism characteristic of public genomic databases, such as the Barcode of Life Data Systems [BOLD; Ratnasingham and Hebert (2007)] (http://www.boldsystems.org) and GenBank (https://www.ncbi.nlm.nih.gov/genbank/), precludes their routine use for such a task. The fact that the addition of new specimen records to community databanks may produce contradictory findings over time is problematic (Phillips et al., 2020). Instead, regulatory sequence databases should be populated with static taxon records traced to voucher specimens whenever possible so that such issues can be mitigated. While the inclusion of fit-for-purpose DNA sequences in governmental repositories like the European and Mediterranean Plant Protection Organization (EPPO)'s Q-bank (https://qbank.eppo.int) for agricultural/quarantine pests and the United States Food and Drug Administration (USFDA)'s Reference Standard Sequence Library for Seafood Identification (RSSL) (https://www.fda.gov/food/dna-based-seafood-identification/reference-standard-sequence-library-seafood-identification-rssl) for seafood species represents a step in the right direction, small sample size issues continue to plague the arena (Phillips et al., 2020). Further, the deep sampling of an adequate number of specimens necessary to capture sufficient levels of standing haplotype variation within species is critical if high confidence in specimen assignments is desired (Phillips et al., 2015, 2019, 2020; Doorenweerd et al., 2020). This is even more important since much sequence data in BOLD and GenBank suffer from serious quality control issues (namely biological and/or methodological). To ensure accurate identification, access to fewer high-quality specimen records is always preferable to the availability of many problematic records (Collins and Cruickshank, 2014). DNA-based identification accomplished through DNA barcoding places heavy reliance on the accuracy and completeness of reference sequence libraries to enable the rapid assignment of unknown specimens to valid or putative species, depending on whether the ultimate goal is specimen identification or species discovery respectively. As use of distance-based methods strongly outweighs other taxon identification approaches [e.g., tree-based algorithms Barbera et al., 2019] or character-based approaches Rach et al., 2008; Wong et al., 2009) within most DNA barcoding studies, due in part to computational expense, outdatedness, or inaccessibility of most software, a means of directly testing the overall performance of DNA barcoding is needed. Such a path forward is provided by the DNA barcode gap.
1.2. DNA Barcoding and the Barcode Gap: A Perfect Harmony?
A well-established tenet in the field is that the majority of DNA barcode variation found across species exceeds genetic variability seen within species. This apparent “barcode gap” (Meyer and Paulay, 2005) was recognized early on as a critical factor to the success of DNA barcoding. The existence of a species' barcoding gap is often invoked as evidence that DNA barcoding “works” in practice (Stoeckle and Thaler, 2014). Under current sampling efforts and morphological identifications associated with DNA barcodes, a large number of species show greater than 2% genetic distance to their nearest heterospecific and typically exhibit less than 1% intra-specific distance (Hubert and Hanner, 2015).
Researchers have differing opinions on how the DNA barcode gap ought to be defined. Whereas Meyer and Paulay (2005) advocated the use of the mean genetic distance to the nearest neighbor, employment of the minimum interspecific distance is now commonplace. Reliance on the former metric tends to exaggerate the presence of a real species barcoding gap through inflating false positives (see section 4.3.1 below for further discussion), leading to misidentification of specimens (Meier et al., 2008). Thus, on the basis of this paradigm shift, it is wholly conceivable that published DNA barcoding studies have likely reported biased estimates of the barcoding gap at the species level and therefore warrant revisitation and cautious interpretation. Perhaps this is why the barcoding gap is depicted using both the mean and maximum intra-specific genetic distance within BOLD's Barcode Gap Analysis tool available in the user Workbench. Meyer and Paulay (2005) differentiate between two variants of species barcoding gaps, depending on whether specimen identification or species discovery is the end goal: “local” and “global,” respectively. A “local” DNA barcode gap can be applied whenever an individual specimen of a particular species is closer in distance to another member of the same species; whereas, a “global” barcoding gap is applicable whenever a threshold can be identified that separates all species (Collins and Cruickshank, 2013). While each of these hold great importance for the identification of unknown specimens, the absence of a sufficiently wide “global” barcode gap that readily distinguishes higher-level taxonomic diversity (e.g., phyla) does not immediately rule out the existence and usefulness of “local” gaps at lower levels of taxonomic organization (i.e., genus, species) (Kvist, 2017; Koroiva and Kvist, 2018).
Many studies, particularly early ones (see below for some taxon-specific examples), use a barcoding gap approach as a reliable species, genus, or higher-level (i.e., order, family) separation criterion with little discussion as to its overall utility (Čandek and Kuntner, 2015). However, both the existence and application of the DNA barcode gap are equally important: taken together, they reconcile both morphological identifications established through Linnean taxonomy with molecular identifications based on DNA sequence variation. Recognizing this, Collins and Cruickshank (2013) discussed the “inappropriate use of fixed distance thresholds” and “incorrectly interpreting the barcoding gap.” Despite strong support early-on in the DNA barcoding enterprise for the existence of the DNA barcode gap, subsequent studies have since gone on to suggest that the presence of a barcode gap at any taxonomic level is simply an artifact of insufficient specimen sampling across narrow geographic and morphologic space (Dasmahapatra et al., 2010; Bergsten et al., 2012; Čandek and Kuntner, 2015). In light of this observation, the interpretation of the barcode gap across taxa is not a straightforward task [e.g., marine gastropods molluscs: Meyer and Paulay (2005), butterflies: Wiemers and Fiedler (2007), spiders: Čandek and Kuntner (2015), annelids: Kvist (2017), leaf-footed bugs: Zhang et al. (2017), dragonflies/damselflies: Koroiva and Kvist (2018)]. This may be due to the fact that the very definition of the DNA barcode gap has undergone refinement over the years. As a result, no one “true” quantitative approach exists for measuring the DNA barcoding gap that can be unanimously agreed upon within the barcoding community. The use of arbitrary and fixed distance cutoffs to separate out all taxa, such as the well-known 2% heuristic (Hebert et al., 2003a,b) and the 10 × rule (Hebert et al., 2004) no longer holds (Collins and Cruickshank, 2014; Zhang et al., 2017). Rather, because barcoding data is in a state of continual flux, as more specimens are collected and as taxonomic revisions are made, taxon distance thresholds should instead be directly computed from specimen DNA sequences when possible (Collins and Cruickshank, 2013; Young et al., 2017).
Numerous computational and statistical methods have been proposed over the years to better quantify the magnitude of the barcode gap. For instance, the 10× rule, where a taxon separation cutoff of 10 times the mean intra-specific distance is adopted, goes some way into accomplishing this, but it cannot be readily applied to distinguish among all taxa due to differences in both taxon evolutionary and life histories. The absence of a DNA barcoding gap to reliably discriminate species can be attributed to three primary factors: (1) the recent/rapid splitting of species from the Most Recent Common Ancestor (MRCA), leading to the retention of ancestral polymorphisms as a result of incomplete lineage sorting, introgressive hybridization or species synonymy; (2) the likely presence of cryptic species diversity due to lack of fixed morphological differences among closely-related taxa; and, (3) human-mediated errors (e.g., overlumping/oversplitting of taxa) in the identification of specimens by experts (Hubert and Hanner, 2015; Koroiva and Kvist, 2018). Thus, the employment of taxon-specific distance thresholds, as opposed to generic cutoffs, seems more reasonable. As a consequence, the adoption of a number of query-based criteria designed to aid in the reliable separation of intra-specific and interspecific distances has propagated throughout the DNA barcoding community and literature over the years. These include for instance the Best Close Match criterion employed within the TaxonDNA software (Meier et al., 2006), and methods available in the spider (Brown et al., 2012), the adhoc (Sonet et al., 2013), and the BarcodingR (Zhang et al., 2016) R packages. In spite of the introduction of various methods to aid the solving of the species genetic separation problem, a significant knowledge gap persists: the apparent dearth of statistical thoroughness in the computation of genetic distances that accompanies the majority of published DNA barcoding studies.
2. A Need to Improve and Maintain Statistical Rigor in DNA Barcoding Studies
Here, evidence is presented pointing to the lack of statistical rigor in DNA barcoding as it relates to distance-based specimen identification and species delineation. Despite having been pointed out as a clear limitation multiple times in various capacities by authors of previous studies (Matz and Nielsen, 2005; Nielsen and Matz, 2006; Luo et al., 2015; Phillips et al., 2019), the issue of statistical rigor within the context of DNA barcoding has not yet garnered the scrutiny it desperately deserves. This may be due to the fact that there is no one set definition for statistical rigor in the literature, partly because, like science, statistics is rooted deeply in epistemology, and more generally in philosophy (Lindley, 2000). The problem faced here however is that the majority of researchers, particularly those in life science fields, lack an appropriate level of statistical knowledge necessary for the proper application of statistical methods (Fieberg et al., 2020). As a result, misuse, abuse and misinterpretation of quantitative results is rampant in academic settings. By no means are DNA barcoding studies immune to this. Such naïveté has led to the overuse of “basic” parametric statistical procedures such as t-tests and the drawing of incorrect conclusions from p-values (Wasserstein et al., 2019). These and other statistical “sins” are so widespread in academic publications that some statisticians have devoted much of their time, and even their entire careers, to writing about the most common errors made by non-statisicians and steps to take to avoid making them [e.g., Good and Hardin (2003)]. Thus, here, statistical rigor is informally and simply defined as the use of appropriate quantitative methods (e.g., genetic distance thresholds) to test and justify hypotheses in light of empirical evidence (i.e., DNA sequence data) and uncertainty. This definition is adopted herein. Notably, it is stressed that the ubiquitous barcoding gap should be better defined on a statistical level, contingent on its use for the task of identifying unknown specimens or in describing novel species. However, as most DNA “barcoders” are not also statisticians, the lack of a statistically-precise static definition for the DNA barcode gap is understandable, albeit one that is absolutely necessary. Although there is much that could be elaborated on here, in this investigation, focus is specifically placed within the context of the need for the sound interpretation of the DNA barcoding gap as a necessary and sufficient criterion to assess the overall performance of DNA barcoding in animal taxa.
In the following subsections, problems with barcode gap interpretation from the standpoints of (1) requiring higher intra-specific specimen sample sizes to adequately capture standing genetic variation, (2) needing better descriptive statistics, along with visualization methods, to concisely and accurately summarize taxon genetic sequence distance data, and (3) necessitating more appropriate statistical inference procedures to draw meaningful conclusions from limited DNA sequence data are outlined. Throughout the present work, Meier et al.'s (2008) version of the DNA barcoding gap is employed; however, one can easily replace “maximum” with “mean” everywhere in the context of interspecific distances with the understanding that discrepancies as to which species show a barcode gap may (and often do) result. As pointed out by Meier et al. (2008), employment of the mean interspecific distance is not correct since this metric approaches the true mean. In contrast, use of the smallest inter-specific distance adequately reflects the fact that specimen identification becomes more challenging as sampling depth is increased (Meier et al., 2008). Viable solutions are then proposed which better harmonize the seemingly disparate disciplines of DNA barcoding and statistics. Moreover, the methods proposed herein also extend to the notion of (statistical) reproducibility. Many scientific studies lack sufficient information (including detailed explanations, quantitative data and metadata) necessary to replicate original experiments. A prime example where a sufficient level of detail is crucial to convey to researchers is in the description of agent-based models (ABMs), which are used widely in ecology. Typically, ABMs incorporate numerous assumptions needed to establish baseline individual- and group-level behavior in “perfect-world” scenarios. To ensure that such rigor is not compromised, Grimm et al. (2006) introduced and outlined a standard protocol that sought to bridge challenges of ABM: Overview, Design concepts and Details (ODD). This work has since been expanded upon to more fully encapsulate the elements needed to adequately describe ABMs in a complete but succinct manner (Grimm et al., 2010). The approaches outlined and examined below go some way into better enabling reproducibility, much like the ODD Protocol, as they are not only planted firmly in solid statistical theory, but are also straightforward to implement and easy to understand by the statistical nonexpert. While it is recognized that much of the discussion outlined herein on the absence of statistical rigor in DNA barcoding in the context of the barcode gap is highly animal-centric, potential solutions to ameliorate this problem are easily extended to other taxon groups, in particular plants and fungi, and their proposed barcode loci. Focus on animals was decided on simply because use of DNA barcoding in this group is much more straightforward and less controversial in comparison to non-animal species.
3. Case Study: DNA Barcoding of Pacific Canada's Fishes
From this point onward, statistical approaches to better characterizing the DNA barcode gap will be framed in the context of the barcoding of Canadian Pacific fishes as a focal case study. Many fish species native to the Pacific [e.g., Sockeye salmon (Oncorhynchus nerka)] hold strong socioeconomic and conservation importance globally, particularly as central food commodities within the seafood supply chain. As such, in recent decades, much work has gone toward better understanding patterns of standing genetic diversity in this group to aid recovery of declining fish stocks.
DNA barcodes were downloaded from BOLD on December 1, 2020. Specifically, sequence data were taken from Steinke et al. (2009a) (BOLD Project: TZFPC Fishes of Pacific Canada Part I) and consist of 1219 specimens representing 198 species (as of the date of download). At the time of project release and publication of Steinke et al. (2009a), data comprised 1225 specimens records from 201 species. Within the current dataset two specimen records (Process IDs: TZFPA062-06 and TZFPB406-05) were flagged as problematic (i.e. misidentified) in BOLD and an additional sequence (Process ID: TZFP069-04) was outside the barcode region length necessary for BARCODE compliance (i.e., said sequence was shorter than 500 bp; Hanner, 2009). Only the latter record was excluded from further analysis, leaving a sequence count of 1218. The two misidentified specimens were identified at the time of record submission to the species level as Arctozenus risso (Spotted barracudina) and Lipolagus ochotensis (Eared blacksmelt), respectively. A single record was associated with only a genus name [TZFPA198-07 Icelinus (sculpins)], so it was removed from subsequent calculations/inferences. Further, a total of 46 singleton species were identified. These records were also excluded from downstream consideration since DNA barcode gap analysis requires the inclusion of at least two specimens per species to be meaningful. This clearly highlights the lack of adequate sufficient sampling necessary to capture standing levels of within-species genetic variation existing within many DNA barcode libraries. Included in the gap analysis were five records comprising interim species [Paraliparis sp. (snailfishes)]. Thus, only 1171 of the 1218 specimens (representing 152 species) were deemed useable. Sequence alignment necessary for determination of the DNA barcoding gap was carried out directly using the built-in amino acid-based Hidden Markov Model (HMM) aligner due to dataset size. The default Kimura-2-Parameter (K2P) DNA substitution model was maintained, along with the default Pairwise Deletion option for ambiguous base and gap handling. While usage of K2P to account for differences in transition and transversion rates among sequence sites is both widespread and criticized in DNA barcoding studies as well as the community-at-large (Collins et al., 2012; Srivathsan and Meier, 2012), other more parsimoniously rigorous nucleotide evolution models (such as the uncorrected p-distance) can (and should) be adopted without loss of information (and may even be better suited in the long run). Simply blindly adopting K2P because of its initial employment by Hebert et al. (2003a), who argued that its use is warranted when genetic distances are low, is not reason enough, especially given that many taxa display large distances within and among species.
Using the Barcode Gap Analysis tool available through the BOLD Workbench, results revealed a total of 29 species (19.1%) had nearest neighbor distances less than the 2% threshold. The species L. ochotensis showed a maximum intra-specific distance of 1.24% and a minimum interspecific distance of 13.43% (nearest species: Northern smoothtongue (Leuroglossus schmidti); nearest neighbor: TZFPA187-07), while distances for A. risso, a singleton, were 0 and 17.72% (nearest species: Northern pearleye (Benthalbella dentata); nearest neighbor: TZFPB335-05), respectively. Although observed magnitudes of genetic distances for both of these species suggest that DNA barcoding “works” and is an effective tool when it comes to specimen identification, it is nevertheless unsettling that all mentioned species' nearest neighbors fall into separate genera. While this finding suggests a lack of overall specimen sampling depth for these species and perhaps Pacific fishes in general (Steinke et al., 2009a), it must further be emphasized that many Pacific species occur in deep, cold-water environments; thus, deep barcode sequence divergences are not a rare phenomenon. One species, Paraliparis pectoralis, had a maximum within-species distance of 2.27% (minimum interspecfic distance: 9.17%, nearest species: Paraliparis paucidens, nearest neighbor: TZFPA048-06). Another species, the Deepwater bristlemouth (Cyclothone atraria), displayed a maximum intra-specific distance of 9.22% (nearest neighbor distance: 22.78%; nearest species: Stout blacksmelt (Pseudobathylagus milleri); nearest neighbor: TZFPB400-05). These two cases of high intra-specific distance is strong indication of potential cryptic species diversity. All other maximum within-species distances were below 2%. It should be noted here that specimens assigned as correctly-identified or misidentified to a given species, as well as those individuals displaying cryptic genetic variation or evidence of barcode sharing may in fact not bear these characteristics. Calculated maximum intra-species genetic distances for C. atraria and P. pectoralis were based on sample sizes of only nine and 12 individuals respectively. Even though specimen sample size information is available for all species assessed by Steinke et al. (2009a), it is still impossible to directly discern how reliable reported genetic distance measures are, and therefore the trustworthiness of estimated DNA barcode gaps.
4. Highlighting the Lack of Statistical Rigor in DNA Barcoding
Prior to delving any further into the primary elements that constitute the lack of statistical rigor in DNA barcoding, along with the discussion of simple solutions to help aid its mitigation, astute readers may have noted thus far the use of the term “distance” to describe both genetic variability within species, as well as among species. This is no mistake. To the untrained eye, these terms are synonymous from a lexical point of view, and can be (and often are) used interchangeably within general writing. However in scientific writing, this constitutes a major faux-pas. The term “divergence” is used in the phylogenetics literature to express differences in either number of mutations or amount of time separating taxa (e.g., species differing by 2% per million years) accomplished through molecular clock measurements. Recently, DeSalle and Goldstein (2019) reiterated the importance of carefully balancing word meaning and word choice in barcoding papers so that author(s)' overall intent is not blurred. Numerous highly-cited past DNA barcoding studies employing barcode gap analyses have unknowingly used the term “divergence” to denote gene variation seen across species. Even some authors of the current work are guilty of this. Such word usage bears similarity to the confusion between the terms “species identification” and “specimen identification,” as raised by Collins and Cruickshank (2013) as the third of seven deadly sins of DNA barcoding. There is an important mathematical/statistical distinction between distance and divergence which must be stressed: distances are symmetric, whereas divergences are not. Considering two different specimens (or species), calling them A and B, then the distance between A and B is equal to the distance between B and A. Such a pattern is easily observed from examining a pairwise distance matrix of intra-specific and interspecific genetic distances. Values are identical (zero) with respect to the main diagonal (moving top left to bottom right), as a specimen or species will display zero distance from itself to itself. This can also be seen through exchanging matrix rows for columns and vice versa. On the other hand, the notion of divergence (e.g., the Kullback-Leibler divergence) speaks to how different two probability distributions are from one another (Kullback and Leibler, 1951). Thus the term “distance” is employed everywhere throughout the current work when referring to intra-specific and interspecific differences. While this confusion does not directly contribute a lack of statistical rigor per se, to this end, all future DNA barcoding studies employing barcode gap analyses should use the term “distance” over “divergence” to avoid any potential ambiguity and confusion.
4.1. Balancing Allocation of Specimen Sampling Effort
Current specimen sampling efforts for DNA barcoding have been improperly delegated to further the growth of public reference sequence databases such as BOLD and GenBank. Both geographic and taxonomic barcoding projects and campaigns have been far too focused on exhaustively sampling as many species as possible (Phillips et al., 2015, 2019). This assertion is immediately evident from examining BOLD species lists, where an overwhelming majority of species are singletons or doubletons. For instance, while specimen records are abundant for taxa like fishes and insects, they are highly lacking for birds, most mammals and especially herpetofauna (reptiles and amphibians). From this observation, it is clear that the sampling of intra-specific rather than interspecific genetic variation has been severely limited. While both extremes of genetic variation are necessary to fully comprehend and assess the scope and magnitude of species limits, taxon rarity combined with narrow sampling are typical in DNA barcoding studies (Ahrens et al., 2016; Gaytan et al., 2020). Barcoding initiatives should therefore instead be focused on the dense sampling of an optimal number of specimens per species, which should be strongly calibrated by factors such as research budget, cost and funding (Cameron et al., 2006; Stein et al., 2014). Much of the need for comprehensive sampling of intra-specific genetic variation and the appropriate magnitude of required specimen sample sizes also stems from observed phylogeographic patterns in wide-ranging taxa and/or the continual hybridization between evolutionarily-related species in tandem with introgression of mitochondrial genomes. Thus, many factors are at play and need to be accounted for in the determination of adequate sample sizes, both for DNA barcoding and unbiased estimation of the DNA barcode gap.
In the early days of the DNA barcoding endeavor, it was decided by the Consortium for the Barcode of Life (CBOL) that at least 5-10 specimens per species be collected from wide geographic regions for assembly of reference sequence libraries; indeed, this heuristic has been globally adopted by barcoding campaigns such as the Fish Barcode of Life (FISHBOL) (Ward et al., 2009) in an attempt to limit project costs and maximize returns. However, while collection of only a few individuals of every species is a good starting point, recent studies have highlighted that such small sample sizes are likely far from adequate to capture the majority of standing haplotype variation found within species; instead, hundreds to thousands of individuals may be needed based on both empirical findings and simulation studies (Zhang et al., 2010; Phillips et al., 2015, 2019). Further, it is imperative that, in addition to target species, sister species also be adequately sampled. This is necessary for both the strong detection and the correct interpretation of the DNA barcode gap. In the case of monotypic genera or rare/endangered taxa, representatives from the closest allied genus should also be targeted since only a few exemplars/individuals can often be retrieved.
4.1.1. Estimating Intra-Specific Specimen Sample Sizes With the R Package HACSim
The lack of a comprehensive and robust sampling of within-taxon genetic variation is a very real problem for molecular species diagnosis because it impedes the ability of DNA barcode researchers to acquire a full understanding of standing levels of intra-taxon haplotype diversity that is required to quantify the barcode gap.
To this end, the R package HACSim (Phillips et al., 2020) can aid biodiversity researchers and regulatory scientists in assessing current levels of specimen sampling effort reflected in genomic sequence libraries like those housed in BOLD (i.e., through computing the observed fraction of haplotype diversity that has likely been sampled within species). The method can further assist researchers in obtaining optimal specimen sample sizes likely required to adequately capture the majority of haplotype diversity found within presumably panmictic species randomly sampled across their entire geographic/ecologic ranges. This is done through extrapolating haplotype accumulation curves and observing the point on the x-axis where curves begin to saturate toward an asymptote. It is well known that most species within diverse taxonomic groups (e.g., freshwater fishes) exhibit high degrees of population structure and geographic isolation. Thus, the likelihood of observing a true species' barcode gap is increased when specimen sampling effort is high across its geographic range. Furthermore, the employment of HACSim to better gauge required sampling depths within species means that less reliance will ultimately be placed on arbitrary distance thresholds such as the 1% cutoff employed within BOLD (Ratnasingham and Hebert, 2007, 2013) to assign Linnean names to user-submitted query sequences based on expertly-verified references. Since it has long been recognized that a given taxonomic level is not equivalent, in terms of genetic distance, across different evolutionary lineages (e.g., a family of insects is not equal to a family of fishes), it is reasonable to expect that species falling on separate branches of the Animal Tree of Life will warrant the use of different distance thresholds when it comes to specimen identification. In fact, it seems reasonable that the output of HACSim can be employed to calculate optimal distance thresholds for reliable species separation. This is because, with larger specimen sample sizes and increasing spatial scale, intra-specific genetic distances will tend to increase, while distances observed among species will shrink (Meyer and Paulay, 2005; Bergsten et al., 2012).
HACSim is specifically relevant to assessing genetic variation derived from Sanger-based amplicon reads obtained from any taxon under study and any molecular marker of interest. Preliminary simulation studies demonstrate that HACSim reliably suggests specimen sample sizes necessary to recover wide-ranging levels of within-species haplotype diversity (Phillips et al., in preparation). Thus, such a method should be of invaluable use to the DNA barcoding community-at-large. However, as we progress deeper into the realm of big data, the potential of HACSim to aid in the characterization of genetic diversity through the use of next-generation sequencing (NGS) and High-Throughput Sequencing (HTS) data for environmental DNA (eDNA) and metabarcoding applications [e.g., Deiner et al. (2017); Elbrecht et al. (2018)] becomes clear. This said, it is critical that the capabilities of HACSim be expanded upon, especially the ability to handle multiple specimen reads. Thus, all computational DNA barcoders should consider contributing to this endeavor.
4.2. Visualization of Intra-Specific and Interspecific Genetic Distances
A large majority of published DNA barcoding studies infer the detection (presence or absence) of a species' barcode gap through visualization of specimen pairwise sequence distances as either histograms or dotplots (Collins and Cruickshank, 2013). Collins and Cruickshank (2013) were correct to suggest the employment of dotplots as opposed to frequency histograms to better depict the estimated distribution of species' interspecific and intra-specific distances, but they failed to offer a more thorough quantitative treatment as to why this is the case.
4.2.1. Circumventing the Problem With Histograms and Dotplots for Barcode Gap Display
Histograms partition numerical data into discrete class intervals called bins [not to be confused with BINs (Barcode Index Numbers) (Ratnasingham and Hebert, 2013)] to more easily visualize how sample data is distributed. However, the use of histograms, while both ubiquitous as a statistical summarization method and widely-understood by many, can often muddy the true shape of probability distributions if both the bin width and number of bins in which to group data are not chosen wisely. Histograms with narrow bins tend to be more precise when density of the sample data is low; whereas, when density of observations is high, wider bin widths should be preferred because of the tendency to better expose true data signal relative to noise (Scott, 1979). Whenever bin widths are chosen to be equal in size, the height of resulting histogram bars is proportional to the number of samples contained in each bin. Conversely, for the case of unequal bin widths, the area of bars scales with the number of observations. Despite the added benefit of experimenting with bin widths to reveal hidden structure within data, most software now routinely employed to construct histograms, such as R's graphics (R Core Team, 2018) and ggplot2 packages, utilize equal bin widths in generating histograms by default. Similarly, too small a choice of the number of bins and the histogram will be very rugged (i.e., have high bias); too large the number of bins and the histogram will be oversmoothed (i.e., possess high variance) (Scott, 1979). If DNA barcode researchers choose to continue to use equal histogram bin widths to display the barcode gap, then consideration of the optimal number of bins to employ needs to be carefully investigated. Several measures of appropriate bin numbers to use have been proposed in the statistical literature such as the robust Freedman-Diaconis rule (Freedman and Diaconis, 1981), which makes use of the sample interquartile range (IQR), or Scott's Normal reference rule (Scott, 1979), which employs the estimated (sample) standard deviation calculated from Normal distributions. Unfortunately, most heuristics (including the ones mentioned here) place a strong dependence on sample size. For instance, Microsoft® Excel sets the number of histogram bins to be equal to the square root of the number of data observations, whereas graphics employs Sturges rule (Sturges, 1926), basing the number of bins to scale proportionally with the base-two logarithm of the number of samples, while ggplot2 defaults to using 30 bins regardless of dataset size. For Sturges rule, bin width is computed from dividing the sample range of the data by the optimal bin number. The validity of Sturges rule in particular has been called into question as it tends to oversmooth data in the case of large samples, while still performing reasonably well for sample sizes less than 200 (Hyndman, 1995). Thus, there have been calls for the usage of more reliable methods. The main problem with equal bin widths is that important trends in the data may be confined to only one or a few bins. A further point worth mentioning here is that many programs (R included) default to using histogram frequencies (counts per bin). However, this may not be ideal. Plotting based on densities instead has the advantage of ensuring the area under the histogram is equal to one. Therefore, allowing histogram bins to vary in width for either (or both) genetic distances within or among species may be worth exploring. The reason behind employing such an approach is that it can account for bins with low numbers of observations. While having an approximately equal number of data points per bin may be ideal, such an approach is not typically seen in practice. Further, if this route is taken, alternatives for appropriate bin numbers apart from the methods outlined previously need to be examined. Because studies potentially employ different software for histogram generation, results are no longer directly comparable; thus, care must be exercised when making generalizations.
A much better alternative to displaying the DNA barcoding gap is to rely on the continuous variant of the histogram, kernel density estimation (KDE) plots (Rosenblatt, 1956; Parzen, 1962), to more accurately inform on the actual population distribution of the barcoding gap through depiction of intra-specific and interspecific pairwise genetic distances as smooth curves. KDE works by weighting data observations relative to their distance to other similar-magnitude data points. Much like histograms however, KDE often requires careful parameter selection, in particular regarding the kernel type and the kernel bandwidth. The kernel type strongly defines the overall shape that the density curve takes on, whereas the kernel density bandwidth controls the amount of smoothness of the generated curve. Optimal choice of these parameters is crucial so as to not distort real patterns present within the data. Most modern software (such as R) employ defaults which tend to work well under a wide variety of situations, but also give the user fine control over parameter initialization. However, automatic settings can sometimes lead to undesirable results. R for instance employs a Gaussian kernel and chooses the kernel bandwidth to be equal to the standard deviation of the kernel itself; this should be sufficient as far as estimation of the DNA barcode gap is concerned. Often with kernel density estimation, data may extend beyond those observed from histograms. In particular, data that are constrained to only positive support values can end up having negative density values, which for genetic distances, is not biologically meaningful. In practice however, this is not an immediate concern since truncation methods exist to ensure that data located at the boundaries of KDE plots have positive support.
The dotplot approach to inferring the barcode gap (Figure 1) is simple: on a plot of maximum intra-specific genetic distances (displayed on the x-axis) vs. minimum interspecific distances (shown on the y-axis), represented by points for every barcoded species, a line corresponding to the function y = x is drawn. Points occurring above this line suggest that a barcode gap is present for a given species and that DNA barcoding “works”. In contrast, points falling below the 1:1 line for any species suggest that the DNA barcode gap is absent, and thus barcoding fails to tell specimens apart. Often, points plotted in this fashion overlap tightly, making species-by-species visual inspections difficult. Figure 1 clearly shows that many Canadian Pacific fish species exhibit maximum intra-specific distances very close to, or equal to, zero. This strongly indicates that adequate specimen sampling needed to characterize standing haplotype diversity at the species level is severely lacking.
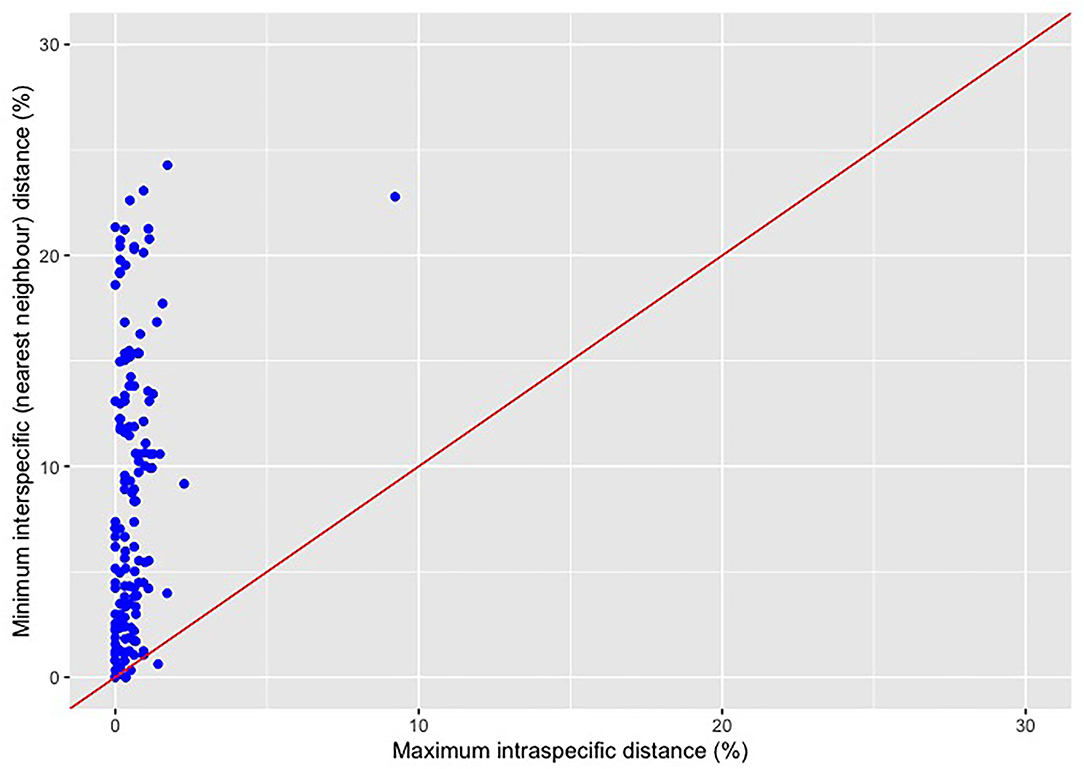
Figure 1. Traditional dotplot for visualizing the DNA barcode gap for a range of Canadian Pacific fishes assessed by Steinke et al. (2009a) and generated using the ggplot2 (Wickham, 2016) R package. Data come from the BOLD Workbench's Barcode Gap Analysis tool and comprise 1171 specimens from 152 species (c. 7.7 specimens per species on average). Points lying above the 45° line indicate that species show a barcode gap and are readily identified via molecular barcodes. On the other hand, points falling below the 1:1 line suggest that species lack a barcoding gap and thus are not easily diagnosed through their DNA barcodes. Most species assessed here [146 of 152 species (96.1%)] display a barcode gap since the minimum interspecific genetic distance exceeds the maximum intra-specific genetic distance. Despite this, evidence of species showing a barcode gap may in fact be an artifact of limited sampling of within-species haplotype variation. The species Cyclothone atraria at the point (9.22, 22.78) is clearly visible as an extreme outlier and signals possible cryptic species variation.
The use of traditional dotplots to display the barcode gap would be better represented as half-logarithm dotplots (Figure 2) which plot sorted log-transformed genetic distances for every species included in a taxon dataset against the number of species sampled (Steinke et al., 2009a,b). A horizontal line is then drawn at the 1% mark (or similar threshold), allowing for good separation of intra-specific distances from nearest neighbor distances. Plotting sorted genetic distances in this manner allows for relative differences to be easily seen among species (Steinke et al., 2009a). Further, through employing a log transformation of species' genetic distance data, interesting patterns are more easily spotted without worry for any loss of information. This is the case for two reasons. First, since y = loga(x) (where a ∈ (0, 1) ∩ (1, ∞) and x > 0) is monotone, the order of plotted points is preserved. Second, the log transform is variance-stabilizing because it has the effect of making positively-skewed data less skewed through removing any dependence existing between the mean and variance of a set of data observations. Without such a transformation in place, sample observations would likely display varying levels of heteroscedasticity (i.e., non-constant variance). Similar to the y-axis of Figure 1, numerous data points (representing over 60 fish species) lie directly on the x-axis, indicating a complete lack of sufficient specimen sampling (Figure 2). Despite its promise, it appears that the modified dotplot has not caught on within the DNA barcoding community outside a select few fish DNA barcoding studies (Steinke et al., 2009a,b).
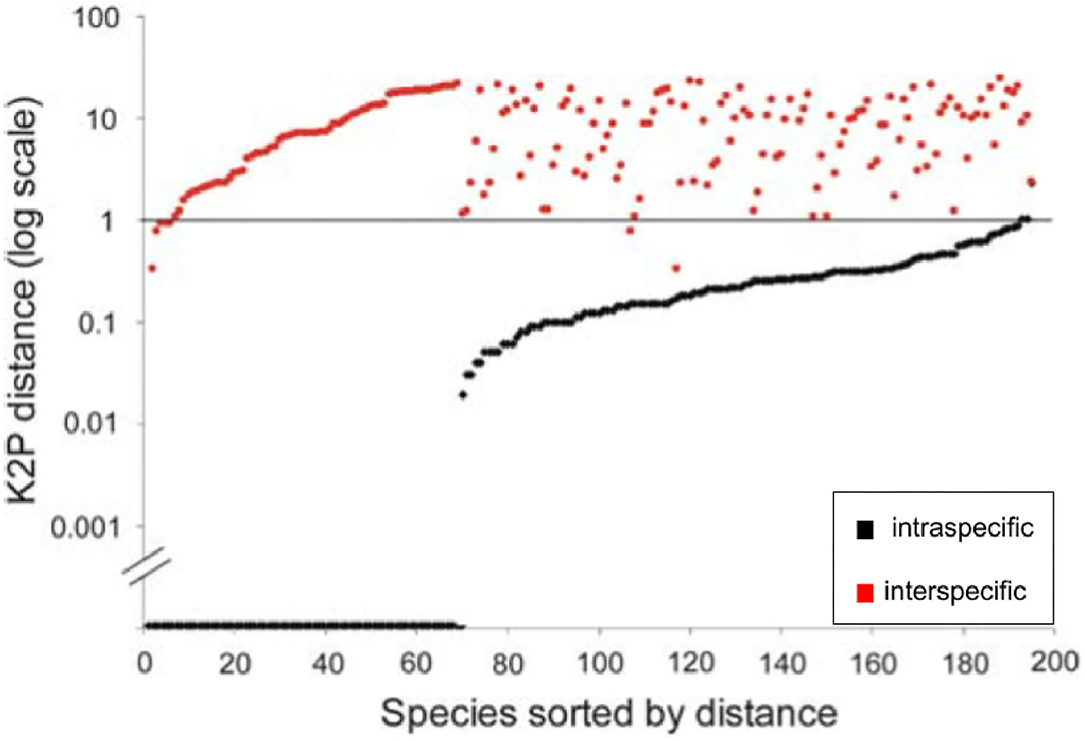
Figure 2. Half logarithm dotplot for the display of species' genetic distances modified from Steinke et al. (2009a) for fishes from Pacific Canada. Plotted data comprise those specimens originally analyzed by Steinke et al. (2009a) (i.e., 1225 specimens from 201 species). Most sampled species are resolved at the 1% log level of genetic distance.
A much more intuitive means of displaying intra-specific distances and interspecific distances is through using “quadrant plots” (Figure 3) because they can be employed to directly detect “outlier” and problematic species in need of closer examination. In this approach, as in the generation of traditional and half-logarithm dotplots, barcoded species are depicted as points on a plot of maximum intra-specific distances on the x-axis vs. minimum interspecific distances on the y-axis. Points fall into one of four categories in positive Cartesian space, depending on a predefined species distance cutoff (2% typically). Moving in a clockwise fashion from the top left corner, each category can be viewed as a case of either “barcoding success” or “barcoding failure.” Quadrant I corresponds to the case where species are easily discriminated using DNA barcoding and reflects concordance with currently accepted Linnean taxonomy (i.e., interspecific distances are greater than the prespecified level cutoff, while intra-specific distances are less than the chosen threshold—a “success.”) Species falling into Quadrant II likely represent cryptic complexes (i.e., both intra-specific distances and interspecific distances are greater than the prespecified level cutoff—a “failure.”) Species in this partition are indistinguishable through morphology alone and as a result are lumped under a single species name by taxonomists. Quadrant III encompasses evolutionarily young species that have recently diverged from the MRCA (i.e., not enough time has elapsed to allow nucleotide differences in the barcode region to accumulate—a “failure.”) This category can also include species that are known by various synonyms. Finally, Quadrant IV includes likely misidentified specimens or instances of hybridization between closely-related species—a “failure.”) Of all the case study species, C. atraria is the only species that would fall into Quadrant II. Based on computed genetic distances, both Arctozenus risso and Lipolagus ochotensis would be classified as belonging to Quadrant I; yet BOLD categorizes each of them as misidentified. This result is telling: it strongly suggests that Lipolagus ochotensis was represented in Steinke et al.'s (2009a) dataset by only a handful of collected specimens. Indeed, this is the case with only four sampled specimens. Thus, the plausibility of both Arctozenus risso and Lipolagus ochotensis as barcoding “successes” (and therefore presenting a real barcode gap) should be immediately called into question. Like the half-logarithm dotplot, the quadrant plot approach has seen very limited use in barcoding studies, despite its inherent simplicity. Such plots appear to have only been employed in two previous publications (Hebert et al., 2004; Hubert and Hanner, 2015).
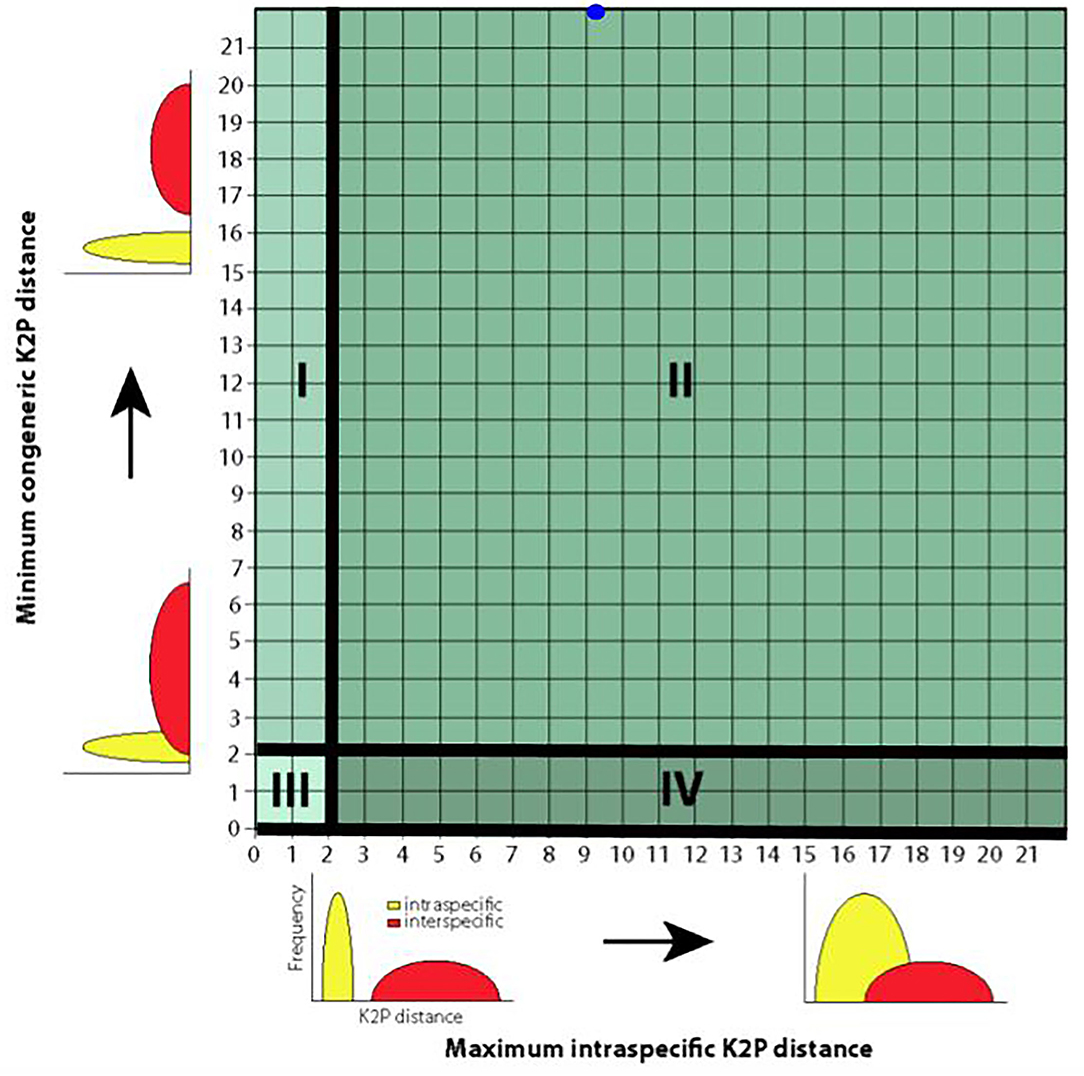
Figure 3. Quadrant plot for the depiction of species' genetic distances reproduced with modification from Hubert and Hanner (2015). Such plots are informative since problematic and/or “outlier” species can be easily detected and the success/performance of DNA barcoding assessed. Species are partitioned into four mutually exclusive groups (labeled I–IV) based on observed magnitudes of intra-specific and interspecific genetic distances. Here, a 2% distance threshold is assumed to separate most taxa. Solid black lines aid visual resolution of the quadrants. The blue dot at the approximate point (9.22, 22.78) within Quadrant II represents Cyclothone atraria, a likely cryptic species complex. Plot axes show the relationship to the density curves shown in Meyer and Paulay (2005). Theoretically, between-species genetic variation should greatly exceed barcode sequence variation observed within species (Quadrant I; minimum interspecific distance − maximum intra-specific distance > 2%). Practically, this will only be the case when specimens have been adequately sampled.
Whereas the abovementioned visual tools offer strong proof-of-concept of the DNA barcode gap, one element that they fail to reveal however is whether a barcoding gap likely exists. To properly address this question, more rigorous statistical methods are required.
4.3. Inconsistent, Inappropriate Use, or Absence of Inferential Statistical Procedures in DNA Barcoding
Attempts to place DNA barcoding on more statistically-solid ground have been undertaken several times before, particularly with regard to specimen classification [e.g., Matz and Nielsen (2005), Nielsen and Matz (2006), Abdo and Golding (2007), Austerlitz et al. (2009), Lou and Golding (2010), Zhang et al. (2012)] and (single-locus) species delineation [e.g., Pons et al. (2006), Monaghan et al. (2009), Puillandre et al. (2011), Reid and Carstens (2012), Fujisawa and Barraclough (2013), Zhang et al. (2013)]. Many of these proposed methods have seen widespread usage, while others seem to be rarely employed in certain instances due to their inherent mathematical complexity and/or black-box nature. Here, the intent is to highlight the increased need for more rigorous statistical procedures for better characterizing the DNA barcode gap by pointing to various efforts that have been made in merging statistical theory with specimen identification/classification throughout the years.
Perhaps the first instance of the use of statistical algorithmic approaches in DNA barcoding was for the purpose of specimen classification. Such methods relied mostly on ideas from classical inferential paradigms such as likelihood theory, whereas others took inspiration from more modern predictive machine learning models, particularly those incorporating subjectivist (Bayesian) thinking. One promising, yet grossly undervalued technique worth mentioning here is the probability of correct identification (PCI) (Spouge and Mariño-Ramirez, 2012; Martin et al., 2020). While the PCI has many variants, its primary function is to serve as a simple metric of DNA barcoding efficacy given a richly-populated and fine-tuned reference database. The PCI statistic has mostly seen use around appropriate marker selection for DNA barcoding, particularly in regard to challenging taxa such as fungi, plants and protists. At its heart, the PCI is nothing more than a binomial proportion whose sampling distribution is easily estimated using resampling procedures. From here, it is trivial to calculate quantities of interest such as standard errors and confidence intervals. In essence, the strong mathematical and statistical theory that underlies the PCI is what is missing and should be emulated in future DNA barcoding studies employing the barcode gap.
The use of statistical approaches for species delimitation has also generated much interest. Before delving into this topic further however, it must be stressed precisely how evolutionary biologists view the notions of species and speciation. While systematists agree on many fronts, one aspect on which there is large disagreement is in defining of species themselves. Species are simple testable hypotheses accepted or refuted solely on the basis of existing expert knowledge and newly acquired information (Pante et al., 2015). The argument for the use of DNA barcoding as a species delimitation tool necessarily rests on the adoption of a workable species concept that is congruent with one's belief system concerning what is known or expected to be true of focal taxa under study (Will et al., 2005; Miller, 2007; Pante et al., 2015). Unfortunately, deciding on a unified “barcoding species concept” that is both adequate and universally applicable across the entire Eukaryotic Tree of Life is no simple task since such a definition would have to satisfy properties, such as reproductive isolation and monophyly, inherent in the more than two dozen already-existing species concepts found throughout the literature (DeQueiroz, 2007). DNA barcoding itself will not succeed in uncovering deep biological and evolutionary relationships existing among taxa (Will et al., 2005). This is the case since multiple lines of evidence (e.g., morphology, ecology, evolutionary/life history, geography or behavior) must be factored into decision-making regarding the categorization of taxa into groups reminiscent of species using an integrative taxonomic framework (Dayrat, 2005). Thus, it has been strongly cautioned to tread down this road carefully, considering various strategies to approaching species demarcation tasks, as well as explanations for species existence, origin and formation over space and time (Carstens et al., 2013). The majority of proposed theoretical approaches in this regard have been strongly centered on population genetic and coalescent theory (Kingman, 1982). Despite this, methods like that of Birky et al. (2010)'s and Birky (2013)'s K/θ ratio hold much promise in providing a deeper theoretical basis for the DNA barcode gap and a direct means of testing for its existence; however, their overall performance depends highly on the specific model of speciation assumed to characterize dynamics of taxa under examination (Pons et al., 2006; Monaghan et al., 2009; Puillandre et al., 2011; Fujisawa and Barraclough, 2013; Zhang et al., 2013; Kapli et al., 2017). For example, rapid adaptive radiation events having occurred recently in the evolution of a taxon (such as Annelida) are known to complicate both local and global barcode gap detection since allopatrically-speciating populations would show comparable nucleotide makeup in the absence of gene flow (Kvist, 2017). Hubert and Hanner (2015) noted a deep connection between the coalescence of two distinct evolutionary lineages within a given gene tree and the observation of a barcode gap reliably separating intra-specific from interspecific sequence variation. Specifically, once lineages have effectively sorted, both specimen identification and species discovery tasks become easier.
In 2011, Puillandre et al. (2011) introduced the widely-popular Automatic Barcode Gap Discovery (ABGD), a nonparametric statistical method to discriminate species based on the existence of the barcode gap, using avaliable DNA sequence data, as opposed to generating taxon phylograms beforehand. Prior to this, heavy reliance fell upon the Generalized Mixed Yule Coalescent (GMYC) and its many variants (Pons et al., 2006; Monaghan et al., 2009; Reid and Carstens, 2012; Fujisawa and Barraclough, 2013). GMYC is an extremely parameter-sensitive, time- and memory-consuming model-based approach to species delimitation based on branching patterns observed within ultra-metric phylogenies. Resulting trees are generated using third-party software such as Bayesian Evolutionary Analysis Sampling Trees (BEAST; Drummond and Rambaut, 2007) or MrBayes (Huelsenbeck and Ronquist, 2001), and analyzed using the splits (SPecies LImits by Threshold Statistics) R package (Ezard et al., 2017). Since then, other methods to delimit species have been introduced to analyze barcode data (e.g., Poisson Tree Processes (PTP) and its relatives (Zhang et al., 2013; Kapli et al., 2017), Haplowebs (Dellicour and Flot, 2015), ASAP (Assemble Species by Automatic Partitioning) (Puillandre et al., 2021)) more efficiently. Earlier approaches such as haplotype parsimony networks (Templeton et al., 1992), constructed using software like TCS (Clement et al., 2000), have found their way into DNA barcoding, despite known interpretational issues such as the tendency to form disconnected subnetworks, or the inclination to group species together within the same node (Hart and Sunday, 2007; Phillips et al., 2019). In addition, the default 95% detection limit (i.e., the probability of parsimony) employed within TCS is largely arbitrary; users can set this value to range anywhere from 90–99% (Clement et al., 2000). Thus, the choice of distance cutoff can have a large effect on the outputted network topology. The above methods can differ greatly in the number of species delimited. Both Dellicour and Flot (2018) and Luo et al. (2018) note that GMYC tends to overestimate (overspilt) species, whereas underestimation of species (i.e., undersplitting) is evident for ABGD. The Barcode Index Number (BIN) approach (Ratnasingham and Hebert, 2013) seems to be a good compromise to its predecessors as it is fast to run, straightforward to implement and resulting output is easily interpreted (Kekkonen and Hebert, 2014). A BIN comprises a unique alphanumeric code corresponding to a tight cluster of closely-related haplotypes. The BIN framework employs hierarchical clustering (via the REfined Single Linkage (RESL) algorithm), along with Markov clustering, and often suggests species numbers between the extremes of ABGD and GMYC through partitioning DNA sequences into four mutually exclusive groups largely reflective of actual species: MATCH, MERGE, SPLIT, and MIXTURE, on the basis of genetic distances (Ratnasingham and Hebert, 2013). These presumptive groups or operational taxonomic units (OTUs) are biologically interpretable: MATCHES conform to established Linnean taxonomy; MERGES indicate that distinct species are indistinguishable through DNA barcoding and should be combined under a single species name; SPLITS reflect the presence of multiple species under a common Linnean name (i.e., cryptic species diversity); finally, MIXTURES reveal possible specimen misidentifications or instances of introgression/hybridization (Ratnasingham and Hebert, 2013; Serrao et al., 2014). A direct relationship exists between BIN categories and quadrant plot categories mentioned previously: MATCHES correspond to Quadrant I; SPLITS make up Quadrant II; MERGES fall into Quadrant III and MIXTURES lie in Quadrant IV. However, despite its promise, several major drawbacks to the use of the BIN system as a suitable species proxy exist. First, it is a black box whose underlying algorithm is not well-understood by researchers outside the DNA barcoding community, such as regulatory scientists. Secondly, BINs are inherently dynamic and therefore unstable over time. As more records are added to barcode libraries, new BINs are formed and existing once are coalesced. This behavior mirrors that of OTUs and their gradual replacement within the metabarcoding community by Amplicon Sequence Variants/Exact Sequence Variants (ASVs/ESVs). Part of these problems may stem from the fact that the RESL algorithm remains unpublished (though aspects of the BIN framework have been successfully patented), making dataset collation and comparison difficult. Currently, there is functionality within BOLD's Workbench to cluster DNA sequences into OTUs via RESL, but no easy and direct way to compare species delineation methods using both simulated and real taxon barcode data since sequences must already reside in BOLD in some form (i.e., as a public or private dataset).
4.3.1. Framing the DNA Barcode Gap as a Statistical Hypothesis
There is a need to define the barcode gap more formally as a composite (one-sided) statistical hypothesis test. An analogy here can be made to testing the hypothesis that a gene evolves neutrally in a species population. Such hypotheses can be assessed using a wide variety of tests such as Tajima's D (Tajima, 1983). In the present case, the null hypothesis of no barcode gap for a species would be tested against the alternative hypothesis that a barcode gap exists. Mathematically,
where d0 is a predefined cutoff for species separation (say, d0 = 2%). Here, the null hypothesis (H0) is assumed to be true, unless unsupported by the observed data. In this case, one fails to accept the null hypothesis in favor of the alternative. That is, it is assumed that present DNA sequence data do not support the existence of a barcode gap at the species level. Under this scheme, it is easy to distinguish between Type I errors (false positives) and Type II errors (false negatives). A false positive is analogous to taxonomic oversplitting (i.e., nearest neighbor distance < maximum intra-specific distance); whereas, excessive lumping of species (i.e., nearest neighbor distance > maximum intraspecific distance) strongly indicates that a false negative error has been made (Meyer and Paulay, 2005; Hubert and Hanner, 2015). A one-tailed test is chosen here, as opposed to the more widely employed two-sided test since between-species genetic variation usually exceeds that seen within species, with few exceptions. Such an approach leads to a more powerful test with greater flexibility than would be allowed using a two-sided test.
An immediate challenge exists in formulating an appropriate hypothesis test statistic for the barcode gap. Test statistics are usually of the form
where d is the observed difference between minimum interspecific distance and maximum interspecific distance and SE denotes estimator standard error. For already well-sampled species (i.e., those with a large number of collected specimens), the above test statistic would approximately follow the standard Normal distribution whenever H0 is true. Unfortunately, in the case of small specimen sample sizes, deriving an expression for the standard error of the estimated barcode gap would be difficult and the distribution of said test statistic would also not be obvious.
Framing DNA barcoding in a statistical way is clearly needed, since for densely-sampled clades, a barcode gap is almost surely to exist. Through employing deep taxon sampling schemes, DNA barcode researchers will be able to more easily detect a true species' barcode gap when one is actually present.
4.3.2. The Use of Nonparametric Bootstrapping to Estimate the DNA Barcode Gap
In addition to simple point estimates (and associated standard errors) of the barcoding gap for varying taxa which are widely reported [e.g., Wiemers and Fiedler (2007)] future studies should also report confidence interval (CI) estimates around the estimated population (or “true”) maximum intra-specific distance, minimum interspecific distance and the barcode gap using sample data of intra- and interspecific distances. Confidence intervals, unlike p-values, are more strongly favored within the statistical literature. A simple but naïve solution in this regard is to form CIs using the data at hand; however, this requires the strong assumption that genetic distances are drawn from a large normally-distributed population; in reality, the sampling distribution of pairwise distances is unknown since it is likely to be highly taxon-dependent. This should come as no surprise since genomic markers employed to assign taxon-level matches to unknown specimens using DNA barcoding show varying rates of molecular evolution both within and across taxonomic groups. These observed differences in taxon molecular evolutionary rates strongly affect fundamental processes at both the microevolutionary (e.g., random genetic drift, mutation, natural selection) and macroevolutionary (e.g., speciation) scales.
Thus, a better approach to reporting parameter estimates, which does not require the sampling distribution to be known a priori, and relaxes distributional assumptions through allowing for reasonably small sample sizes, is to employ nonparametric bootstrapping to continually resample from observed distances a large number of times (say, 10000 times) uniformly (i.e., with equal probability) with replacement (Efron, 1979). Sampling with replacement ensures that drawn observations are both independent and identically distributed; that is, sampling a given observation has no bearing on the occurrence of a future observation and all observations are generated from the same underlying statistical population. The idea here is that, for a large number of bootstrap replicates, the distribution of resampled distances (i.e., the bootstrap sampling distribution) mimics the actual distance distribution for the taxon under study quite closely. Such a scheme is analogous to bootstrapping in phylogenetic inference to assess how well nodes within neighbor-joining trees support the observed data (Felsenstein, 1985; Efron et al., 1996). Because a test statistic need not be known in advance, bootstrap results can be immediately used to form appropriate level (e.g., 95%) bootstrap confidence intervals for the population barcoding gap. Statistical interpretation of such constructed intervals is relatively straightforward: if the intervals contain the value d0, then the hypothesis that the maximum intra-specific distance does not differ significantly from the minimum interspecific distance at the hypothesized value d0 cannot be rejected at the stated significance level (e.g. α = 5 for 95% confidence). Put another way, if d0 falls within the obtained CI, then the hypothesis that no barcode gap is present cannot be rejected at the chosen level of statistical significance.
Nonparametric bootstrapping is known to perform poorly in certain situations. One such failure of the traditional bootstrap is in the estimation of extreme order statistics such as the population minimum or the population maximum. Standard bootstrapping, sometimes termed the n-out-of-n bootstrap, works by drawing resamples of the same size as the original sample. As the “revised” DNA barcode gap is defined in terms of the maximum intra-specific distance and minimum interspecific distance, the usual bootstrapping procedure detailed above is not applicable. It is worth mentioning that the n-out-of-n bootstrap would indeed work as expected under the “old” definition of the barcode gap, used prior to Meier et al. (2008), since that definition involved only statistical means. Fortunately, there is an immediate remedy available. The trick is to take resamples of a smaller size than the original dataset (Bickel et al., 1997). This technique is known as the m-out-of-n bootstrap, where m < n. In employing such a method, the variability of corresponding estimates will be higher (larger) than in the regular bootstrapping procedure whereas the bias will be low (Chernick, 2007, 2011). While this result may appear counterintuitive at first, assuming the variance of an estimator of interest is both constant and finite, said estimator's standard error will be smaller for a larger number of observations and larger for smaller sample sizes. Since m < n, another approach worth examining is random subsampling, which involves sampling without replacement (Politis et al., 1999). The optimal choice of m however is not obvious and can have a significant impact on obtained results. Therefore, algorithms for selecting appropriate values of m [such as that presented in Bickel and Sakov (2008)] must be investigated. In any case, m should be chosen such that it along with n both approach infinity, while at the same time ensuring that the quantity mn approaches zero (Chernick, 2007, 2011). For instance, letting m = √n or m = log(n) would satisfy this condition. In general, the value of m should be much smaller than that of n. This raises an interesting point in the context of DNA barcoding: bootstrapping is only reliable when clades have been sufficiently sampled; that is, the bootstrap is not a cure for the small sample size problem. Regardless, the above bootstrapping approach should be used to report point estimates and desired level CIs for “true” maximum intra-specific distances and interspecific distances, as well as population barcoding gaps in any and all future taxon-specific DNA barcoding studies (especially reference sequence library publications).
5. Critically Evaluating the Concept of the DNA Barcode Gap in Conservation and Regulatory Contexts
Over the years, several publications cited herein (and elsewhere) have successfully harnessed and exploited the awesome power of DNA barcoding in biodiversity and regulatory settings. On the flip side, numerous biodiversity-focused studies have clearly demonstrated the performance of DNA barcoding on the basis of the observed difference between intra-specific and interspecific genetic variation—the DNA barcoding gap. What appears to be missing however are more studies lying at the intersection of these two extremes, recent examples of which include Lee et al. (2019). The statistical approaches put forth and explained in detail here, in addition to existing bioinformatic tools that directly compute estimated barcode gaps (i.e., ABGD, ASAP) can greatly aid in providing strong support for the in-depth assessment of the DNA barcoding gap as a foundationally-rigorous concept, something that is nonexistent within most studies bearing a socioeconomic flavor.
Below, some specific use cases of DNA barcoding as they relate to characterizing both global and local barcode gaps in conservation and regulatory contexts are highlighted. Language is explicitly borrowed from Collins and Cruickshank (2014), who categorize taxon sequences into four independent groups: “known knowns,” “known unknowns,” “unknown knowns,” and “unknown unknowns.” “Known knowns” are well characterized and curated species in existing barcoding libraries, whereas “known unknowns” are formally described species, yet lack full library representation. Conversely, “unknown knowns” reflect possibly divergent/cryptic lineages among described species found in reference databases like BOLD. Lastly, “unknown unknowns” pertain to undescribed or cryptic species without records in existing libraries. The goal here is to dispel the perceived subtleties associated with employing DNA barcodes for such applications, especially in light of reference sequence libraries reflecting an incomplete sampling of natural variation. While scenarios mentioned here do not form an exhaustive list, they nevertheless cover a broad range of possibilities necessary for adequately conceptualizing the notion of a DNA barcoding gap.
Scenario I: A geographic region in the Pacific has a well-known fish species biodiversity. Several barcoding campaigns dedicated to monitoring fisheries bycatch over the years have resulted in a hypothetical library that is 98% complete. All species in the library comprise more than 20 sequences. In this case, the DNA barcode gap is probably almost entirely redundant. A given specimen query will likely be identical (or differ by only a few basepairs) to one already in the library. A nearest neighbor assignment with an arbitrary 1–2% threshold (or none at all) will correctly identify most queries to the species level, except in the case of barcode haplotype sharing. Here, only detection of the local barcode gap is of interest. Adjusting and recalculating the global DNA barcoding gap is unlikely to affect taxon classifications since observing rare species or new lineages is extremely unlikely with increased sampling intensity. Thus, the library mostly consists of “known knowns” and “unknown knowns.” The takeaway here is that as reference library coverage increases, estimating the barcode gap becomes less relevant. Incorporation of sample size estimation tools like that of Phillips et al. (2020) will add extra reassurance that specimen sampling is sufficient.
Scenario II: A poorly-sampled tropical region in Costa Rica has three times as many lepidopterean species as North America. Barcoding efforts have resulted in a library that is only 60% complete, where most species are represented by less than three sequences. Further, the taxonomy of many groups is uncertain. Due to low library coverage, there are many “known unknowns” and “unknown unknowns” which are likely to be encountered in real samples. Here, quantifying the barcode gap parameter space is critical to establishing a threshold by which queries can be assigned correctly as unknowns, thus limiting the rate of false positives (Hickerson et al., 2006; Dasmahapatra et al., 2010).
Scenario III: The Canadian Border Security Agency (CBSA) has intercepted a shipment of fish fins from a potentially endangered shark species being trafficked for illegal sales. To guarantee a conviction, a confirmed scientific name is needed. Unfortunately, specimens cannot be matched to any publicly-available sequence records in BOLD or GenBank. Thus, the presence of “known unknowns” in the seized samples greatly complicates matters. DNA barcode gap and sample size estimation would become key pieces of evidence capable of providing statistical uncertainty of species assignment in this case.
Scenario IV: A research team wishes to characterize alpha diversity between habitats or environments within an unexplored region in Madagascar for the purpose of completing a biodiversity survey. The goal is to infer broad endemicity and phylogeographic trends, as opposed to individual-level diversity; however, little in way of a DNA barcode reference library currently exists to aid this effort. There are many “known knowns,” “known unknowns,” “unknown unknowns,” and “unknown unknowns.” De novo species delimitation tools based on phylogenetic trees, such as GMYC and PTP, as well as those approaches utilizing genetic distances, including ABGD, ASAP and RESL, are necessary to addressing problems with specific methods and breakdown of statistical model assumptions. Here, local barcoding gaps are less important as no single method will be solely relied upon for any individual taxon. However, crude estimation of a global barcode gap is possible.
Scenario V: A taxonomist wishes to discover new species from samples of recently-collected specimens comprising many “known knowns,” “known unknowns,” “unknown knowns,” and “unknown unknowns.” As a first step, established single-locus delimitation algorithms are used to triage individuals into species-like units. Next, specific species hypotheses are tested through combining aspects of integrative taxonomy with more sophisticated Bayesian multi-locus delineation approaches based on the multi-species coalescent (e.g., *BEAST Heled and Drummond, 2010, BPP Yang and Rannala, 2012, Bayes factors Grummer et al., 2014). In this case, the global barcoding gap is of no real concern, except as a rough calibration/benchmark against known members at the genus level. Multigene species demarcation approaches will be superior in this respect because speciation events will be more readily ascertained.
Scenario VI: It is suggested that DNA barcoding could be applied to inventory diversity in a poorly-understood family of invertebrates. Since there are only “unknown unknowns,” the global DNA barcode gap could be employed to justify that genetic and morphological characters are congruent; thus, conducting further sequencing is worthwhile.
6. New Avenues for Estimating the DNA Barcode Gap
Finally, it is important to draw upon future promising avenues for continued work on accurately estimating the DNA barcoding gap. One potential application in this regard includes statistical mixture models which can account for genetic differences observed within and among species for the purpose of molecular specimen assignment. Mixture models offer great flexibility when it comes to accomplishing this task because correlations in haplotype diversity existing at the species level can be easily incorporated into such modeling frameworks. Much effort has gone into the development of easy to use computational tools to fit mixture models to a wide variety of data. A notable example in this regard that may prove valuable for barcode gap estimation is the R package mclust (Scrucca et al., 2016), software that has seen widespread use for the task of parametric model-based clustering in recent years.
Statistical methods for delineating species can inherently be viewed as “mixture models.” All proposed species delimitation approaches to date find the optimal partition of DNA sequences into mutually-distinct groups that are highly reflective of actual species. Thus, the problem of species separation boils down to that of a simple clustering/classification task. The majority of methods generate these clusters on the basis of estimated phylogenetic relationships (e.g., GMYC, PTP), along with an assumed parametric model of species generation (e.g., birth-death process, Yule process), whereas others simply use the DNA sequences themselves (i.e., ABGD, ASAP) to arrive at a plausible solution in a nonparametric fashion. In recent years, novel “hybrid” approaches to tease out species have been published. Notably, algorithmic methods such as (Fujisawa et al., 2016) and (Jones, 2017) stray away from objective single-locus likelihood inference to also include subjective multi-locus Bayesian inferential frameworks. Regardless, these and other related approaches may prove valuable in aiding better detection of the DNA barcoding gap.
Another approach that should be investigated and applied to address questions about the DNA barcode gap is the employment of nearest-neighbor and other machine learning methods used in clustering and classification tasks [e.g., van Velzen et al. (2012)]. However, the widespread success of machine learning methods is due greatly to the availability of large amounts of training data that feed and nurture artificial intelligence (AI) algorithms, a factor that poses problems for undescribed species, rare taxa and those with narrow geographic distributions (e.g., endemic species, monotypic taxa). With an arsenal of statistical tools like mixture models and nearest-neighbor methods in hand, practitioners will be better equipped to estimate important quantities central to DNA barcoding, including species separation thresholds.
Although not a statistical issue per se, the increased need for the sequencing of multiple genetic loci, particularly nuclear genes, to solidify confidence in specimen assignment and aid resolution of taxon boundaries, cannot be stressed enough (Eberle et al., 2020). Much like the adoption of the rbcL and matK chloroplast genes for DNA barcoding of land plants, a similar case can be made for a dual, or better yet, multiple, mitochondrial-nuclear gene system for barcoding of metazoan taxa. COI has been demonstrated to lack sufficient discriminatory power for identification in groups such as sharks and the aptly named “problem children” (Cnidaria and Porifera) (Bucklin et al., 2011) to name a few—all which show remarkably low rates of molecular evolution. In the case of animal DNA barcoding, several molecular regions (preferrably both mitochondrial and nuclear) should be sequenced across the same sampled specimen whenever possible; in reality however, this is rarely done. International Barcode of Life (iBOL) member nations (e.g., those in Canada and Europe) are moving toward multilocus DNA barcoding with open arms. The largest hub for DNA barcoding, the Centre for Biodiversity Genomics (CBG), still primarily employs single-marker barcoding for the construction of reference sequence libraries and for the progression of biodiversity science as a whole. One can even argue that Canadian DNA barcoding's staunch position on maintaining the status quo is warranted, due to the fear of becoming irrelevant. However, this has not greatly hindered the timely transition into the vast and exciting realm of “next-generation” DNA barcoding (Taylor and Harris, 2012). This is clearly evident from the fact that the majority of specimen sequence records found in BOLD are derived from just a single marker (COI). Within BOLD, substantially fewer specimen records orginate from other mitochondrial markers like cytochrome b (cytb) and the mitochondrial D-loop; even fewer come from nuclear gene regions such as ribosomal DNA (rDNA) and rhodopsin (rho). Thus, sequence reference databases should strive to incorporate genetic information from multiple genomic sources to better aid specimen identification to the species level, especially since the DNA barcode gap is nonexistent in most taxonomic groups outside animals (Kolter and Gemeinholzer, 2020). This is unfortunately easier said than done. Only quite recently have sequencing technologies such as Pacific Biosciences' SEQUEL platforms and genome skimming (Coissac et al., 2016) enabled the rapid and broad characterization of biodiversity at multiple taxonomic levels, due to the ability to accommodate both higher numbers of reads produced, as well as greater marker read length resolution (Marcus, 2018). The widespread adoption of a multi-marker approach for DNA barcoding has several limitations including the need for greater funding, as well as improved community standards. An ideal world is one where genomes for all taxa are available; however, currently only wealthy nations can afford to generate such massive amounts of data. This has led researchers within the community-at-large to forgo accomplishing goals “the right way” at the expense of upholding reproducibility. Global initiatives like Genome 10K (G10KCOS, 2009; Koepfli et al., 2015), which specifically seeks to sequence the entire genomes of over 10,000 vertebrate species, have provided biodiversity researchers with a glimpse into what will be possible once set data standards are adopted an strictly adhered to within the community-at-large (Koepfli et al., 2015). The proposal for DNA standards such as that for obtaining high-quality DNA barcodes from previously-collected specimens based on the reserved keyword “BARCODE” (Hanner, 2009) has been highly conducive in pushing DNA-based identification, albeit at a much smaller scale. Perhaps most importantly, Genome 10K points to a growing need for guidelines on the proper collection of specimens and the recovery of adequate amounts of specimen genetic information, the deep sequencing of specimen genomic DNA, as well as the timely deposition and curation of genome records to the International Nucleotide Sequence Database Collaboration (INSDC) through publicly-accessible online molecular sequence databases such as the National Center for Biotechnology Information (NCBI)'s GenBank for easy retrieval, visualization and downstream analysis.
7. Concluding Remarks
In this piece, it was demonstrated that DNA barcoding currently lacks the statistical rigor needed to properly interpret results of species barcode gap analyses through focusing on three key areas with respect to Metazoan taxa: (1) the need for larger specimen sample sizes reflective of standing genetic variation within species; (2) the misleading display of intra-specific and interspecific distances, and (3) the absence of formal statistical inference procedures in DNA barcoding. A past study of Pacific Canada's fish fauna by Steinke et al. (2009a) was employed to illustrate flaws in the presentation of the DNA barcode gap, as well as the need for larger specimen sample sizes to avoid biases in the reporting of within- and between-species genetic distances critical for reliably estimating the gap. First, the routine use of the novel R package HACSim will allow researchers to better assess the efficacy of current taxon sampling schemes and develop more robust collection protocols that will permit greater statistical power in detecting a true species' barcode gap. Next, a more careful consideration of the depiction of the DNA barcode gap as a frequency histogram is warranted, as are alternative representations, including density estimation curves and the half-logarithm dotplot, due to interpretation issues surrounding default graphical parameters employed by many popular statistical analysis programs such as R and Excel. In addition, better ways to reconcile DNA barcoding with statistical inference include proposing the framing of the barcode gap as a one-tailed statistical hypothesis test, and backing the use of the nonparametric bootstrap to compute standard errors and confidence intervals for maximum intra-specific distances, nearest-neighbor distances, as well as the barcode gap. Finally, new directions are offered for thinking critically about the robust estimation of the DNA barcode gap. While it is recognized that collecting specimens such as those of deepwater Pacific fishes is a costly and time-consuming endeavor that are unlikely to provide necessary genetic resolution deemed critical for large-scale biodiversity assessment, the introduction and proliferation of new quantitative methods to address knowledge gaps and uncertainties pertaining to the diversity of life on this planet will nonetheless make full use of the rapidly closing window of available sampling opportunity. Taken together, the methods outlined herein have the potential to open closed doors, giving biodiversity researchers and regulatory scientists an unprecedented view of patterns left in DNA sequences from key evolutionary mechanisms and processes responsible for shaping Earth's biodiversity over millions of years.
While focus was placed heavily on animal DNA barcoding and the importance of sound determination of the barcode gap, many of the principles that underlie taxon classification and demarcation algorithms mentioned or discussed in some detail herein are directly transferrable to targeted species detection using DNA/eDNA as well as metabarcoding. Species-level discrimination is challenging (or unreliable) without extensive reference libraries at hand. Thus, researchers are likely more concerned with pinpointing higher-level taxonomic matches. As a result, intra-specific variation and barcode gap thresholds are largely ignored. In these instances, length variation in retrieved barcode sequences is widespread; thus, separate bioinformatic solutions are required like that of Barbera et al. (2019). Despite this, efforts should be made to better integrate methods of DNA barcoding with (e)DNA metabarcoding, especially since many biodiversity researchers and regulatory scientists nowadays routinely employ elements of both disciplines in their work.
Before closing, it should be mentioned that the appropriate use of improved and accessible statistical methods and recommendations discussed herein can be conveniently framed in the context of Collins and Cruickshank (Collins and Cruickshank, 2014) (Table 1). Specifically, when dealing with “known knowns” and “unknown knowns,” all proposed methods are presumed to perform well when it comes to reliably estimating the magnitude of DNA barcode gaps, along with other important quantities computed of the basis of species' genetic distances, provided specimen sample sizes are reasonably large. On the other hand, the abovestated methods cannot reasonably be expected to work well in the case of “known unknowns” and “unknown unknowns” since DNA barcodes within reference sequence libraries will be largely undersampled despite uncertainties in taxononmic descriptions. Nevertheless, this limitation does not outright render usage of the proposed approaches here invalid since there is strong dependence on the taxa in question.
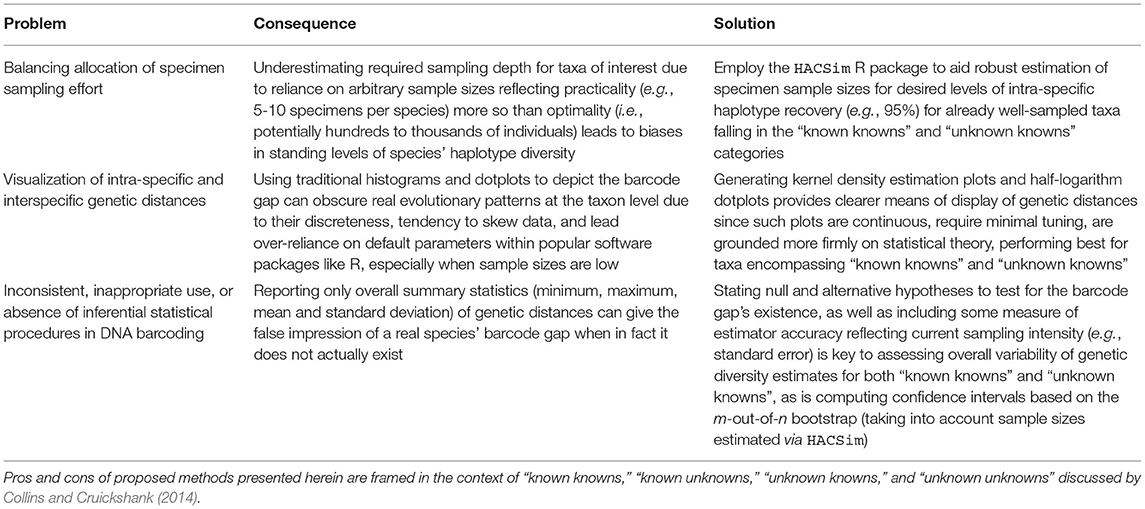
Table 1. Summary of problems, consequences and solutions contributing to the lack of statistical rigor in DNA barcoding as it pertains to accurately estimating the DNA barcode gap at the species level.
With these considerations in mind, both biodiversity and regulatory scientists alike will be well-equipped to constructively analyze vast amounts of DNA barcode data with greater confidence and as a result feel more secure in making critical assessments as to the performance of DNA barcoding on the basis of the barcode gap. The widespread adoption of the methods discussed herein will be of great importance in moving forward with the building of large-scale DNA barcode reference libraries.
Data Availability Statement
Publicly available datasets were analyzed in this study. This data can be found at: https://doi.org/10.5061/dryad.1ns1rn8t2.
Author Contributions
JP conducted all analyses and wrote the manuscript. DG acted as an advisor in statistics. RH acted as an advisor in DNA barcoding. All authors contributed to the revision of this manuscript and approved the final version.
Funding
This work was supported by the University of Guelph College of Physical and Engineering Sciences (CPES) Graduate Excellence Entrance Scholarship to JP. The funders had no role in study design, data collection and analysis, decision to publish or preparation of the manuscript.
Conflict of Interest
The authors declare that the research was conducted in the absence of any commercial or financial relationships that could be construed as a potential conflict of interest.
Publisher's Note
All claims expressed in this article are solely those of the authors and do not necessarily represent those of their affiliated organizations, or those of the publisher, the editors and the reviewers. Any product that may be evaluated in this article, or claim that may be made by its manufacturer, is not guaranteed or endorsed by the publisher.
Acknowledgments
We thank Robert (Rob) Young for providing valuable comments to earlier drafts of this manuscript and for helpful discussions throughout the writing process. In addition, Aníbal Castillo, Erika Myler, and Dirk Steinke each provided comments on later drafts. Rupert Collins, along with two anonymous reviewers, provided critical feedback on a past iteration of this manuscript, thus improving its clarity and readability significantly. Rupert Collins also graciously suggested the incorporation of some specific use cases of DNA barcoding in relation to better characterizing the DNA barcode gap for conservation and regulation. These have been added and elaborated on herein. Finally, two reviewers provided constructive analysis of the work, for which we are greatly appreciative. We acknowledge that the University of Guelph resides on the ancestral lands of the Attawandaron people and the treaty lands and territory of the Mississaugas of the Credit. We recognize the significance of the Dish with One Spoon Covenant to this land and offer our respect to our Anishinaabe, Haudenosaunee, and Métis neighbors as we strive to strengthen our relationships with them.
References
Abdo, Z., and Golding, G. (2007). A step toward barcoding life: a model-based, decision-theoretic method to assign genes to preexisting species groups. Systematic Biol. 56, 44–56. doi: 10.1080/10635150601167005
Ahrens, D., Fujisawa, T., Krammer, H.-J., Eberle, J., Fabrizi, S., and Vogler, A. (2016). Rarity and incomplete sampling in DNA-based species delimitation. Syst. Biol. 65, 478–494. doi: 10.1093/sysbio/syw002
Austerlitz, F., David, O., Schaeffer, B., Bleakley, K., Olteanu, M., Leblois, R., et al. (2009). DNA barcode analysis: a comparison of phylogenetic and statistical classification methods. BMC Bioinf. 10, S10. doi: 10.1186/1471-2105-10-S14-S10
Barbera, P., Kozlov, A., Czech, L., Morel, B., Darriba, D., Flouri, T., and Stamatakis, A. (2019). EPA-ng: Massively parallel evolutionary placement of genetic sequences. Syst. Biol. 68, 365–369. doi: 10.1093/sysbio/syy054
Bergsten, J., Bilton, D. T., Fujisawa, T., Elliott, M., Monaghan, M. T., Balke, M., et al. (2012). The effect of geographical scale of sampling on DNA barcoding. Syst. Biol. 61, sys037. doi: 10.1093/sysbio/sys037
Bickel, P., Götze, F., and van Zwet, W. (1997). Resampling fewer than n observations: Gains, losses, and remedies for losses. Stat. Sinica 7, 1–31.
Bickel, P., and Sakov, A. (2008). On the choice of m in the m-out-of-n bootstrap and confidence bounds for extrema. Stat. Sinica 18, 967–985. Available online at: http://www.jstor.org/stable/24308525
Birky, C. J. (2013). Species detection and identification in sexual organisms using population genetic theory and DNA sequences. PLoS ONE 8, e52544. doi: 10.1371/journal.pone.0052544
Birky, C. J., Adams, J., Gemmel, M., and Perry, J. (2010). Using population genetic theory and DNA sequences for species detection and identification in asexual organisms. PLoS ONE 5, e10609. doi: 10.1371/journal.pone.0010609
Brown, S. D., Collins, R. A., Boyer, S., Lefort, M.-C., Malumbres-Olarte, J., Vink, C. J., et al. (2012). Spider: an R package for the analysis of species identity and evolution, with particular reference to DNA barcoding. Mol. Ecol. Resour. 12, 562–565. doi: 10.1111/j.1755-0998.2011.03108.x
Bucklin, A., Steinke, D., and Blanco-Bercial, L. (2011). DNA barcoding of marine metazoa. Ann. Rev. Marine Sci. 3, 471–508. doi: 10.1111/1755-0998.12304
Cameron, S., Rubinoff, D., and Will, K. (2006). Who will actually use DNA barcoding and what will it cost? Syst. Biol. 55, 844–847. doi: 10.1080/10635150600960079
Čandek, K., and Kuntner, M. (2015). DNA barcoding gap: reliable species identification over morphological and geographical scales. Mol. Ecol. Resour. 15, 268–277. doi: 10.1111/1755-0998.12304
Cao, X., Liu, J., Zheng, G., Kuntner, M., and Agnarsson, I. (2016). Rapid dissemination of taxonomic discoveries based on dna barcoding and morphology. Sci. Rep. 6, 1–13. doi: 10.1038/srep37066
Carstens, B., Pelletier, T., Reid, N., and Satler, J. (2013). How to fail at species delimitation. Mol. Ecol. 22, 4369–4383. doi: 10.1111/mec.12413
Chernick, M. (2007). Bootstrap Methods: A Guide for Practitioners and Researchers. Newtown, PA: Wiley.
Clement, M., Posada, D., and Crandall, K. A. (2000). TCS: a computer program to estimate gene genealogies. Mol. Ecol. 9, 1657–1659. doi: 10.1046/j.1365-294x.2000.01020.x
Coissac, E., Hollingsworth, P., Lavergne, S., and Taberlet, P. (2016). From barcodes to genomes: extending the concep of dna barcoding. Mol. Ecol. 25, 1423–1428. doi: 10.1111/mec.13549
Collins, R., Boykin, L., Cruickshank, R., and Armstrong, K. (2012). Barcoding's next top model: an evaluation of nucleotide substitution models for specimen identification. Methods Ecol. Evol. 3, 457–465. doi: 10.1111/j.2041-210X.2011.00176.x
Collins, R., and Cruickshank, R. (2013). The seven deadly sins of DNA barcoding. Mol. Ecol. Resour. 13, 969–975. doi: 10.1111/1755-0998.12046
Collins, R., and Cruickshank, R. (2014). Known knowns, known unknowns, unknown unknowns and unknown knowns in DNA barcoding: a comment on Dowton et al. Syst. Biol. 63, 1005–1009. doi: 10.1093/sysbio/syu060
Dasmahapatra, K. K., Elias, M., Hill, R. I., Hoffman, J. I., and Mallet, J. (2010). Mitochondrial DNA barcoding detects some species that are real, and some that are not. Mol. Ecol. Resour. 10, 264–273. doi: 10.1111/j.1755-0998.2009.02763.x
Dayrat, B. (2005). Towards integrative taxonomy. Biol. J. Linnean Soc. 85, 407–415. doi: 10.1111/j.1095-8312.2005.00503.x
Deiner, K., Renshaw, M., Li, Y., Olds, B., Lodge, D., and Pfrender, M. (2017). Long-range PCR allows sequencing of mitochondrial genomes from environmental DNA. Methods Ecol. Evol. 8, 1888–1898. doi: 10.1111/2041-210X.12836
Dellicour, S., and Flot, J.-F. (2015). Delimiting species-poor data sets using single molecular markers: A study of barcode gaps, haplowebs and GMYC. Syst. Biol. 64, 900–908. doi: 10.1093/sysbio/syu130
Dellicour, S., and Flot, J.-F. (2018). The hitchhiker's guide to single-locus species delimitation. Mol. Ecol. Resour. 18, 1234–1246. doi: 10.1111/1755-0998.12908
DeQueiroz, K. (2007). Species concepts and species delimitation. Syst. Biol. 56, 879–886. doi: 10.1080/10635150701701083
DeSalle, R. (2006). Species discovery versus species identification in DNA barcoding efforts: Response to Rubinoff. Conserv. Biol. 20, 1545–1547. doi: 10.1111/j.1523-1739.2006.00543.x
DeSalle, R., and Goldstein, P. (2019). Review and interpretation of trends in DNA barcoding. Front. Ecol. Evol. 7, 1–11. doi: 10.3389/fevo.2019.00302
Doorenweerd, C., San Jose, M., Barr, N., Leblanc, L., and Rubinoff, D. (2020). Highly variable COI haplotype diversity between three species of invasive pest fruit fly reflects remarkably incongruent demographic histories. Sci. Rep. 10, 1–10. doi: 10.1038/s41598-020-63973-x
Drummond, A., and Rambaut, A. (2007). BEAST: Bayesian evolutionary analysis by sampling trees. BMC Evol. Biol. 7, 1–8. doi: 10.1186/1471-2148-7-214
Eberle, J., Ahrens, D., Mayer, C., Niehuis, O., and Mishof, B. (2020). A plea for standardized nuclear markers in metazoan DNA taxonomy. Trends Ecol. Evol. 35, 336–345. doi: 10.1016/j.tree.2019.12.003
Efron, B., Halloran, E., and Holmes, S. (1996). Bootstrap confidence levels for phylogenetic trees. PNAS 93, 13429–13434.
Elbrecht, V., Vamos, E. E., Steinke, D., and Leese, F. (2018). Estimating intraspecific genetic diversity from community DNA metabarcoding data. PeerJ 6, e4644. doi: 10.7717/peerj.4644
Ezard, T., Fujisawa, T., and Barraclough, T. (2017). splits: SPecies' LImits by Threshold Statistics. R package version 1.0-19/r52.
Felsenstein, J. (1985). Confidence limits on phylogenies: an approach using the bootstrap. Evolution 39, 783–791. doi: 10.1111/j.1558-5646.1985.tb00420.x
Fieberg, J., Vitense, K., and Johnson, D. (2020). Resampling-based methods for biologists. PeerJ 8, e9089. doi: 10.7717/peerj.9089
Freedman, D., and Diaconis, P. (1981). On the histogram as a density estimator: L2 theory. Z. Wahrscheinlichkeitstheorie verw. Gebiete 57, 453–476.
Fujisawa, T., Aswad, A., and Barraclough, T. (2016). A rapid and scalable method for multilocus species delimitation using Bayesian model comparison and rooted triplets. Syst. Biol. 65, 759–771. doi: 10.1093/sysbio/syw028
Fujisawa, T., and Barraclough, T. (2013). Delimiting species using single-locus data and the Generalized Mixed Yule Coalescent approach: a revised method and evaluation on simulated data sets. Syst. Biol. 62, 707–724. doi: 10.1093/sysbio/syt033
G10KCOS (2009). Genome 10K: a proposal to obtain whole-genome sequence for 10,000 vertebrate species. J. Heredity 100, 659–674. doi: 10.1093/jhered/esp086
Gaytan, A., Bergsten, J., Canelo, T., Perez-Izquierdo, C., Santoro, M., and Bonal, R. (2020). DNA barcoding and geographical scale effect: the problems of undersampling genetic diversity hotspots. Ecol. Evol. 10, 10754–10772. doi: 10.1002/ece3.6733
Good, P., and Hardin, J. (2003). Common Errors in Statistics (And How to Avoid Them). Hoboken, NJ: John Wiley & Sons, Inc.
Grimm, V., Berger, U., Bastiansen, F., Eliassen, S., Ginot, V., Giske, J., et al. (2006). A standard protocol for describing individual-based and agent-based models. Ecol. Model. 198, 115–126. doi: 10.1016/j.ecolmodel.2006.04.023
Grimm, V., Berger, U., DeAngelis, D., Polhill, J., Giske, J., and Railsback, S. (2010). The ODD protocol: a review and first update. Ecol. Model. 221, 2760–2768. doi: 10.1016/j.ecolmodel.2010.08.019
Grummer, J., Jr, B. R., and Reeder, T. (2014). Species delimitation uaing Bayes factors: simulations and applications to the Sceloporus scalaris species group (squamata: phrynosomatidae. Syst. Biol. 63, 119–133. doi: 10.1093/sysbio/syt069
Hanner, R. (2009). Data standards for BARCODE records in INSDC (BRIs). Database Working Group, Consortium for the Barcode of Life.
Hart, M. W., and Sunday, J. (2007). Things fall apart: biological species form unconnected parsimony networks. Biol. Lett. 3, 509–512. doi: 10.1098/rsbl.2007.0307
Hebert, P. D., Cywinska, A., Ball, S. L., and deWaard, J. (2003a). Biological identifications through DNA barcodes. Proc. R. Soc. London B Biol. Sci. 270, 313–321. doi: 10.1098/rspb.2002.2218
Hebert, P. D., Ratnasingham, S., and de Waard, J. R. (2003b). Barcoding animal life: cytochrome c oxidase subunit 1 divergences among closely related species. Proc. R. Soc. London B Biol. Sci. 270, S96–S99. doi: 10.1098/rsbl.2003.0025
Hebert, P. D., Stoeckle, M. Y., Zemlak, T. S., and Francis, C. M. (2004). Identification of birds through DNA barcodes. PLoS Biol. 2, e312. doi: 10.1371/journal.pbio.0020312
Heled, J., and Drummond, A. (2010). Bayesian inference of species trees from multilocus data. Mol. Biol. Evol. 27, 570–580. doi: 10.1093/molbev/msp274
Hickerson, M. J., Meyer, C. P., and Moritz, C. (2006). DNA barcoding will often fail to discover new animal species over broad parameter space. Syst. Biol. 55, 729–739. doi: 10.1515/dna-2015-0006
Hubert, N., and Hanner, R. (2015). DNA Barcoding, species delineation and taxonomy: a historical perspective. DNA Barcodes 3, 44–58. doi: 10.1515/dna-2015-0006
Hubert, N., Hanner, R., Holm, E., Mandrak, N. E., Taylor, E., Burridge, M., et al. (2008). Identifying Canadian freshwater fishes through DNA barcodes. PLoS ONE 3, e2490. doi: 10.1371/journal.pone.0002490
Huelsenbeck, J., and Ronquist, F. (2001). MRBAYES: Bayesian inference of phylogenetic trees. Bioinformatics 17, 754–755. doi: 10.1093/bioinformatics/17.8.754
Jones, G. (2017). Algorithmic improvements to species delimitation and phylogeny estimation under the multispecies coalescent. J. Math. Biol. 74, 447–467. doi: 10.1007/s00285-016-1034-0
Kapli, P., Lutteropp, S., Zhang, J., Kobert, K., Pavlidis, P., Stamatakis, A., et al. (2017). Multi-rate Poisson tree processes for single-locus species delimitation under maximum likelihood and Markov chain Monte Carlo. Bioinformatics 33, 1630–1638. doi: 10.1093/bioinformatics/btx025
Kekkonen, M., and Hebert, P. (2014). DNA barcode-based delineation of putative species: efficient start for taxonomic workflows. Mol. Ecol. Resour. 14, 706–714. doi: 10.1111/1755-0998.12233
Kingman, J. F. C. (1982). The coalescent. Stochast. Process. Appl. 13, 235–248. doi: 10.1016/0304-4149(82)90011-4
Koepfli, K.-P., Paten, B., the Genome 10K Community of Scientists, and O'Brien, S. (2015). The Genome 10K Project: a way forward. Annu. Rev. Anim. Biosci. 3, 57–111. doi: 10.1146/annurev-animal-090414-014900
Kolter, A., and Gemeinholzer, B. (2020). Plant DNA barcoding necessitates marker-specific efforts to establish more comprehensive reference databases. Genome 64, 265–298. doi: 10.1139/gen-2019-0198
Koroiva, R., and Kvist, S. (2018). Estimating the DNA barcoding gap in a global dataset of cox1 sequences for Odonata: Close, but no cigar. Mitochondrial DNA 29, 765–771. doi: 10.1080/24701394.2017.1357709
Kullback, S., and Leibler, R. (1951). On information and sufficiency. Ann. Math. Stat. 22, 49–86. doi: 10.1214/aoms/1177729694
Kvist, S. (2017). Does a global barcoding gap exist in Annelida? Mitochondrial DNA Part A 27, 2241–2252. doi: 10.3109/19401736.2014.984166
Lee, T., Anderson, S., Tran-Nguyen, L., Sallam, N., Le Ru, B., Conlong, D., et al. (2019). Towards a global DNA barcode reference library for quarantine identifications of lepidopteran stemborers, with an emphasis on sugarcane pests. Sci. Rep. 9, 7039. doi: 10.1038/s41598-019-42995-0
Lindley, D. (2000). The philiosophy of statistics. Statistician 49, 293–337. doi: 10.1111/1467-9884.00238
Lou, M., and Golding, G. (2010). Assigning sequences to species in the absence of large interspecific differences. Mol. Phylogenet. Evol. 58, 187–194. doi: 10.1016/j.ympev.2010.01.002
Luo, A., Lan, H., Ling, C., Zhang, A.-B., Shi, L., Ho, S. Y., et al. (2015). A simulation study of sample size for DNA barcoding. Ecol. Evol. 5, 5869–5879. doi: 10.1002/ece3.1846
Luo, A., Ling, C., Ho, S., and Zhu, C.-D. (2018). Comparison of methods for molecular species delimitation across a range of speciation scenarios. Syst. Biol. 67, 830–846. doi: 10.1093/sysbio/syy011
Madden, M., Young, R., Brown, J., Miller, S., Frewin, A., and Hanner, R. (2019). Using DNA barcoding to improve invasive pest identification at U.S. ports-of-entry. PLoS ONE 14, e0222291. doi: 10.1371/journal.pone.0222291
Marcus, J. (2018). Our love-hate relationship with DNA barcodes, the Y2K problem, and the search for next generation barcodes. AIMS Gen. 5, 1–23. doi: 10.3934/genet.2018.1.1
Martin, M., Daniëls, P., D, E., and Spouge, J. (2020). Figures of merit and statistics for detecting faulty species identification with DNA barcodes: a case study in Ramaria and related fungal genera. PLoS ONE 15, e0237507. doi: 10.1371/journal.pone.0237507
Matz, M. V., and Nielsen, R. (2005). A likelihood ratio test for species membership based on DNA sequence data. Philosoph. Trans. R. Soc. London B Biol. Sci. 360, 1969–1974. doi: 10.1098/rstb.2005.1728
Meier, R., Shiyang, K., Vaidya, G., and Ng, P. (2006). DNA barcoding and taxonomy in Diptera: a tale of high intraspecific variability and low identification success. Syst. Biol. 55, 715–728. doi: 10.1080/10635150600969864
Meier, R., Zhang, G., and Ali, F. (2008). The use of mean instead of smallest interspecific distances exaggerates the size of the “barcoding gap” and leads to misidentification. Syst. Biol. 57, 809–813. doi: 10.1080/10635150802406343
Meyer, C. P., and Paulay, G. (2005). DNA barcoding: error rates based on comprehensive sampling. PLoS Biol. 3, e422. doi: 10.1371/journal.pbio.0030422
Miller, S. (2007). DNA barcoding and the renaissance of taxonomy. PNAS 104, 4775–4776. doi: 10.1073/pnas.0700466104
Monaghan, M., Wild, R., Elliot, M., Fujisawa, T., Balke, M., Inward, D., et al. (2009). Accelerated species inventory on madagascar using coalescent-based models of species delineation. Syst. Biol. 58, 298–311. doi: 10.1093/sysbio/syp027
Naaum, A., Shehata, H., Chen, S., Li, J., Tabujara, N., Awmack, D., et al. (2018). Complementary molecular methods detect undeclared species in sausage products at retail markets in Canada. Food Control 84, 339–344. doi: 10.1016/j.foodcont.2017.07.040
Nielsen, R., and Matz, M. (2006). Statistical approaches for DNA barcoding. Syst. Biol. 55, 162–169. doi: 10.1080/10635150500431239
Pante, E., Puillandre, N., Viricel, A., Arnaud-Haond, S., Aurelle, D., Castelin, M., et al. (2015). Species are hypotheses: avoid connectivity assessments based on pillars of sand. Mol. Ecol. 24, 525–544. doi: 10.1111/mec.13048
Parzen, E. (1962). On estimation of a probability density function and mode. Ann. Math. Stat. 33, 1065–1076.
Phillips, J. D., Gillis, D. J., and Hanner, R. H. (2019). Incomplete estimates of genetic diversity within species: implications for DNA barcoding. Ecol. Evol. 9, 2996–3010. doi: 10.1002/ece3.4757
Phillips, J. D., Gillis, D. J., and Hanner, R. H. (2020). HACSim: an R package to estimate intraspecific sample sizes for genetic diversity assessment using haplotype accumulation curves. PeerJ Comput. Sci. 6, e243. doi: 10.7717/peerj-cs.243
Phillips, J. D., Gwiazdowski, R. A., Ashlock, D., and Hanner, R. (2015). An exploration of sufficient sampling effort to describe intraspecific DNA barcode haplotype diversity: examples from the ray–finned fishes (chordata: actinopterygii). DNA Barcodes 3, 66–73. doi: 10.1515/dna-2015-0008
Pons, J., Barraclough, T., Gomez-Zurita, J., Cardoso, A., Duran, D., Hazell, S., et al. (2006). Sequence-based species delimitation for the DNA taxonomy of undescribed insects. Syst. Biol. 55, 595–609. doi: 10.1080/10635150600852011
Puillandre, N., Brouillet, S., and Achaz, G. (2021). ASAP: assemble species by automatic partitioning. Mol. Ecol. Resour. 21, 609–620. doi: 10.1111/1755-0998.13281
Puillandre, N., Lambert, A., Brouillet, S., and Achaz, G. (2011). ABGD, automatic barcode gap discovery for primary species delimitation. Mol. Ecol. 21, 1864–1877. doi: 10.1111/j.1365-294X.2011.05239.x
R Core Team (2018). R: A Language and Environment for Statistical Computing Vienna: R Foundation for Statistical Computing.
Rach, J., DeSalle, R., Sarkar, I., Schierwater, B., and Hadrys, H. (2008). Character-based DNA barcoding allows discrimination of genera, species and populations in Odonata. Proc. R. Soc. B 275, 237–247. doi: 10.1098/rspb.2007.1290
Ratnasingham, S., and Hebert, P. D. (2007). BOLD: the barcode of life data system (http://www.barcodinglife.org). Mol. Ecol. Notes 7, 355–364. doi: 10.1371/journal.pone.0066213
Ratnasingham, S., and Hebert, P. D. (2013). A DNA-based registry for all animal species: the Barcode Index Number (BIN) system. PLoS ONE 8, e66213. doi: 10.1371/journal.pone.0066213
Reid, N., and Carstens, B. (2012). Phylogenetic estimation error can decrease the accuracy of species delimitation: a Bayesian implementation of the general mixed yule-coalescent model. BMC Evol. Biol. 12, 196. doi: 10.1186/1471-2148-12-196
Rosenblatt, M. (1956). Remarks on some nonparametric estimates of a density function. Ann. Math. Stat. 27, 832–837.
Scrucca, L., Fop, M., Murphy, T., and Raftery, A. (2016). Mclust 5: clustering, classification and density estimation using Gaussian finite mixture models. R J. 8, 205–233. doi: 10.32614/RJ-2016-021
Serrao, N., Steinke, D., and Hanner, R. (2014). Calibrating snakehead diversity with DNA barcodes: expanding taxonomic coverage to enable identification of potential and established invasive species. PLoS ONE 9, e99546. doi: 10.1371/journal.pone.0099546
Shehata, H., Bourque, D., Steinke, D., Chen, S., and Hanner, R. (2019a). Survey of mislabelling across finfish supply chain reveals mislabelling both outside and within Canada. Food Res. Int. 121, 723–729. doi: 10.1016/j.foodres.2018.12.047
Shehata, H., Naaum, A., Chen, S., Murphy, T., Li, J., Shannon, K., et al. (2019b). Re-visiting the occurrence of undeclared species in sausage products sold in Canada. Food Res. Int. 122, 593–598. doi: 10.1016/j.foodres.2019.01.030
Shehata, H., Naaum, A., Garduño, R., and Hanner, R. (2018). DNA barcoding as a regulatory tool for seafood authentication in Canada. Food Control 92, 147–153. doi: 10.1016/j.foodcont.2018.04.045
Sonet, G., Jordaens, K., Nagy, Z. T., Breman, F. C., De Meyer, M., Backeljau, T., et al. (2013). Adhoc: an R package to calculate ad hoc distance thresholds for DNA barcoding identification. Zookeys 365, 329–336. doi: 10.3897/zookeys.365.6034
Spouge, J., and Mariño-Ramirez, L. (2012). “The practical evaluation of DNA barcode efficacy,” in DNA Barcodes: Methods and Protocols, 1 Edn, eds W. Kress, and D. Erickson (New York, NY: Springer).
Srivathsan, A., and Meier, R. (2012). On the inappropriate use of Kimura-2-parameter (K2P) divergences in the DNA-barcoding literature. Cladistics 28, 190–194. doi: 10.1111/j.1096-0031.2011.00370.x
Stein, E. D., Martinez, M. C., Stiles, S., Miller, P. E., and Zakharov, E. V. (2014). Is DNA barcoding actually cheaper and faster than traditional morphological methods: Results from a survey of freshwater bioassessment efforts in the United States? PLoS ONE 9, e95525. doi: 10.1371/journal.pone.0095525
Steinke, D., Zemlak, T. S., Boutillier, J. A., and Hebert, P. D. (2009a). DNA barcoding of Pacific Canada's fishes. Mar. Biol. 156, 2641–2647. doi: 10.1007/s00227-009-1284-0
Steinke, D., Zemlak, T. S., and Hebert, P. D. (2009b). Barcoding Nemo: DNA-based identifications for the ornamental fish trade. PLoS ONE 4, e6300. doi: 10.1371/journal.pone.0006300
Stoeckle, M. Y., and Thaler, D. S. (2014). DNA barcoding works in practice but not in (neutral) theory. PLoS ONE 9, e100755. doi: 10.1371/journal.pone.0100755
Sturges, H. (1926). The choice of a class interval. J. Am. Stat. Assoc. 21, 65–66. doi: 10.1080/01621459.1926.10502161
Tajima, F. (1983). Evolutionary relationship of DNA sequences in finite populations. Genetics 105, 437–460. doi: 10.1093/genetics/105.2.437
Taylor, H., and Harris, W. (2012). An emergent science on the brink of irrelevance: a review of the past 8 years of DNA barcoding. Mol. Ecol. Resour. 12, 377–388. doi: 10.1111/j.1755-0998.2012.03119.x
Templeton, A. R., Crandall, K. A., and Sing, C. F. (1992). A cladistic analysis of phenotypic associations with haplotypes inferred from restriction endonuclease mapping and DNA sequence data. III. Cladogram estimation. Genetics 132, 619–633. doi: 10.1093/genetics/132.2.619
van Velzen, R., Weitschek, E., Felici, G., and Bakker, F. (2012). DNA barcoding of recently diverged species: relative performance of matching methods. PLoS ONE 7, e30490. doi: 10.1371/journal.pone.0030490
Ward, R. D., Hanner, R., and Hebert, P. D. (2009). The campaign to DNA barcode all fishes, FISH-BOL. J. Fish Biol. 74, 329–356. doi: 10.1080/00031305.2019.1583913
Wasserstein, R., Schirm, A., and Lazr, N. (2019). Moving to a world beyond “p < 0.05. Am. Stat. 73, 1–19. doi: 10.1007/978-3-319-24277-4
Wiemers, M., and Fiedler, K. (2007). Does the DNA barcoding gap exist?—a case study in blue butterflies (Lepidoptera: Lycaenidae). Front. Zool. 4, 8. doi: 10.1186/1742-9994-4-8
Will, K., Mishler, B., and Wheeler, Q. (2005). The perils of DNA barcoding and the need for integrative taxonomy. Syst. Biol. 54, 844–851. doi: 10.1080/10635150500354878
Wong, E. H.-K., Shivji, M. S., and Hanner, R. H. (2009). Identifying sharks with DNA barcodes: assessing the utility of a nucleotide diagnostic approach. Mol. Ecol. Resour. 9, 243–256. doi: 10.1139/gen-2015-0209
Yang, Z., and Rannala, B. (2012). Bayesian species delimitation using multilocus sequence data. Proc. Natl. Acad. Sci. 107, 9264–9269. doi: 10.1073/pnas.0913022107
Young, R., Abott, C., Therriault, T., and Adamowicz, S. (2017). Barcode-based species delimitation in the marine realm: a test using Hexanauplia (Multicrustacea: Thecostraca and Copepoda). Genome 60, 169–182. doi: 10.1139/gen-2015-0209
Zhang, A., Hao, M., Yang, C., and Shi, Z. (2016). BarcodingR: an integrated R package for species identification using DNA barcodes. Methods Ecol. Evol. 8, 1–8. doi: 10.1111/2041-210X.12682
Zhang, A.-B., He, L.-J., Crozier, R. H., Muster, C., and Zhu, C.-D. (2010). Estimating sample sizes for DNA barcoding. Mol. Phylogen. Evol. 54, 1035–1039. doi: 10.1016/j.ympev.2009.09.014
Zhang, A.-B., Muster, C., Zhu, C.-D., Crozier, R., Wan, P., Feng, J., and Ward, R. (2012). A fuzzy-set-theory-based approach to analyse species membership in DNA barcoding. Mol. Ecol. 21, 1848–1863. doi: 10.1111/j.1365-294X.2011.05235.x
Zhang, H.-G., Lv, M.-H., Yi, W.-B., Zhu, W.-B., and Bu, W.-J. (2017). Species diversity can be overestimated by a fixed empirical threshold: insights from DNA barcoding of the genus Cletus (Hemiptera: Coreidae) and the meta-analysis of COI data from previous phylogeographical studies. Mol. Ecol. Resour. 17, 314–323. doi: 10.1111/1755-0998.12571
Keywords: DNA barcode gap, genetic variation, maximum intra-specific distance, minimum interspecific distance, sampling effort, specimen identification, species, statistics
Citation: Phillips JD, Gillis DJ and Hanner RH (2022) Lack of Statistical Rigor in DNA Barcoding Likely Invalidates the Presence of a True Species' Barcode Gap. Front. Ecol. Evol. 10:859099. doi: 10.3389/fevo.2022.859099
Received: 20 January 2022; Accepted: 01 March 2022;
Published: 14 April 2022.
Edited by:
Hui Zhang, Institute of Oceanology (CAS), ChinaReviewed by:
Andrea Galimberti, University of Milano-Bicocca, ItalyPairot Pramual, Mahasarakham University, Thailand
Copyright © 2022 Phillips, Gillis and Hanner. This is an open-access article distributed under the terms of the Creative Commons Attribution License (CC BY). The use, distribution or reproduction in other forums is permitted, provided the original author(s) and the copyright owner(s) are credited and that the original publication in this journal is cited, in accordance with accepted academic practice. No use, distribution or reproduction is permitted which does not comply with these terms.
*Correspondence: Jarrett D. Phillips, jphill01@uoguelph.ca