- Shandong Key Laboratory of Eco-Environmental Science for the Yellow River Delta, Binzhou University, Binzhou, China
Wetlands reserve a large amount of organic carbon (C), playing a key role in contributing global C stocks. It is still uncertain to evaluate wetland C stocks due to wetland disturbance or degradation. In this study, we performed the degraded and recovering wetlands to estimate aboveground C stocks and soil organic C (SOC) stocks at the depth of 1 m in the Yellow River Delta. Our results showed that the recovering wetland sequestered 1.67 Mg C ha–1 aboveground, approximately three times higher than those (0.56 Mg C ha–1) of degraded wetland, and recovering wetland stored more SOC of 51.86 Mg C ha–1 in the top 1 m soils, approximately two times higher than those (26.94 Mg C ha–1) of degraded wetland. These findings indicate that the transformation between degraded and recovering wetlands is associated with the conversion of wetland C sources and sinks. The shifts in aboveground C stocks and SOC stocks were mainly attributed to changed biotic (i.e., aboveground biomass and photosynthetic C) and abiotic (i.e., soil water, salinity, SOC and N contents, and SOC compounds) factors. The improved soil water, salinity, and nutrient enhance C reservoir, sequestering more C in aboveground vegetation and storing more SOC via photosynthetic C input of plant litter and root exudates in recovering wetland than in degraded wetland with poor soil conditions. The relationships among wetland C stocks, plant, and soil properties indicate plant-soil interaction driving wetland ecosystem C stocks in degraded and recovering wetlands. Our research suggests that wetland restoration highlights a positive response to “carbon neutrality” by efficiently sequestering C above- and belowground.
Introduction
Wetlands serve as the carbon (C) sink and reservoir, playing an important role in global ecosystem C stocks (Duarte et al., 2013), although they occupy only 5–8% of the earth’s area, accounting for 20–30% of global C storage (Xiao et al., 2019). However, a large number of wetlands have been degraded in the past decades due to reclamation, construction projects, or climate warming (Xu W. et al., 2019). Wetland degradation associated with the loss of plant biomass and soil C implies that wetlands are transformed from C sink to C source, exacerbating global climate warming (Baustian et al., 2021). To alleviate climate warming and enhance wetland ecosystem functions, the governments and scientists pay more attention to the protection and restoration of wetlands (Crooks et al., 2018). Studies have reported that wetland restoration can greatly recover above- and belowground ecosystem structures and function, such as increasing plant diversity and biomass, storing more C in soils, and structuring stable linkage among plant, microorganism, and soil (Ma et al., 2017; Orth et al., 2020). Based on the goal of C neutrality, it is necessary to evaluate wetland C stocks and clarify the regulation mechanism of soil organic C (SOC) storage during the degradation and restoration of wetlands.
Wetland C budgets are attributed to the balance between plant C input and soil C loss (Spivak et al., 2019). The disturbed wetlands would influence plant C assimilation and soil organic matter (SOM) decomposition. Wetland degradation, such as wetland converting to saline-alkali land, exacerbates soil salinity and nutrient stress, which result in the decline in plant productivity and soil microbial C degradation (Herbert et al., 2015; Servais et al., 2019). The unbalance between the input and output of organic matter affects wetland C turnover and storage. Despite plant-derived C contribution to wetland C stocks through litter and root exudates, C quality (defined as labile and recalcitrant C compounds) also plays a crucial role in mediating wetland C retention (Xia et al., 2021). Labile C compounds (e.g., carbohydrates) are easily degraded by microorganisms with a fast turnover rate (Shao et al., 2021). Recalcitrant C compounds contain macromolecular substances such as aromatic C compounds and lignin, which are resistant to be degraded and persist in soils for decades or even centuries, contributing to ecosystem C storage (Suseela et al., 2013). However, the empirical evidence is still lacking to assess above- and belowground C reservoirs in disturbed wetlands through integrating C quantity and quality.
Phragmites australis (P. australis) is the dominant species with strong photosynthetic capacity, widely spreading over wetland ecosystems (Guan et al., 2017). The change in wetland dominated by P. australis can exhibit substantial effects on wetland ecosystem C stocks. Using complementary approaches of C estimation, natural 13C isotope, and mid-infrared spectroscopy (mid-IR), we evaluated above- and belowground C stocks and illustrated the plant-soil interaction of degraded and recovering wetlands in the Yellow River Delta. The goal of this study was to (1) assess the responses of wetland C stocks (i.e., plant C and SOC stocks) to degraded and recovering wetlands, (2) detect the dynamics of SOC compounds in degraded and recovering wetlands, and (3) explore how plant and soil parameters regulated above- and belowground C immobilization in our studied wetlands.
Materials and Methods
Site Description and Sampling
Soil and plant samples were taken in July 2020 from the degraded and recovering estuarine wetlands, located in the Yellow River Delta National Nature Reserve (118°33′–119°20′E, 37°35′–38°12′N, established in 1992), Eastern China. The mean annual precipitation is 530–630 mm, mainly occurring in summer (∼70%); mean annual temperature is 11.7–12.6°C. The studied soils are classified as an alluvial soil formed by alluvial sediment of the Yellow River, with average pH of 8.57 (Table 1). Roads built for oil exploitation and transportation interrupted Yellow River water into wetland, exacerbating soil salinization and decreased aboveground biomass, and ultimately resulting in wetland degradation (Figure 1). In recent years, the governments have performed the rehabilitation engineering to recover wetland by diverting Yellow River water into degraded wetland, leading to wetland restoration with the increase in aboveground biomass (Figure 1). Both degraded and recovering wetlands are dominated by P. australis (Figure 1).

Table 1. Effects of wetland degradation and restoration on soil physicochemical properties, including soil water content, electrical conductivity, pH, bulk density, and total nitrogen content.
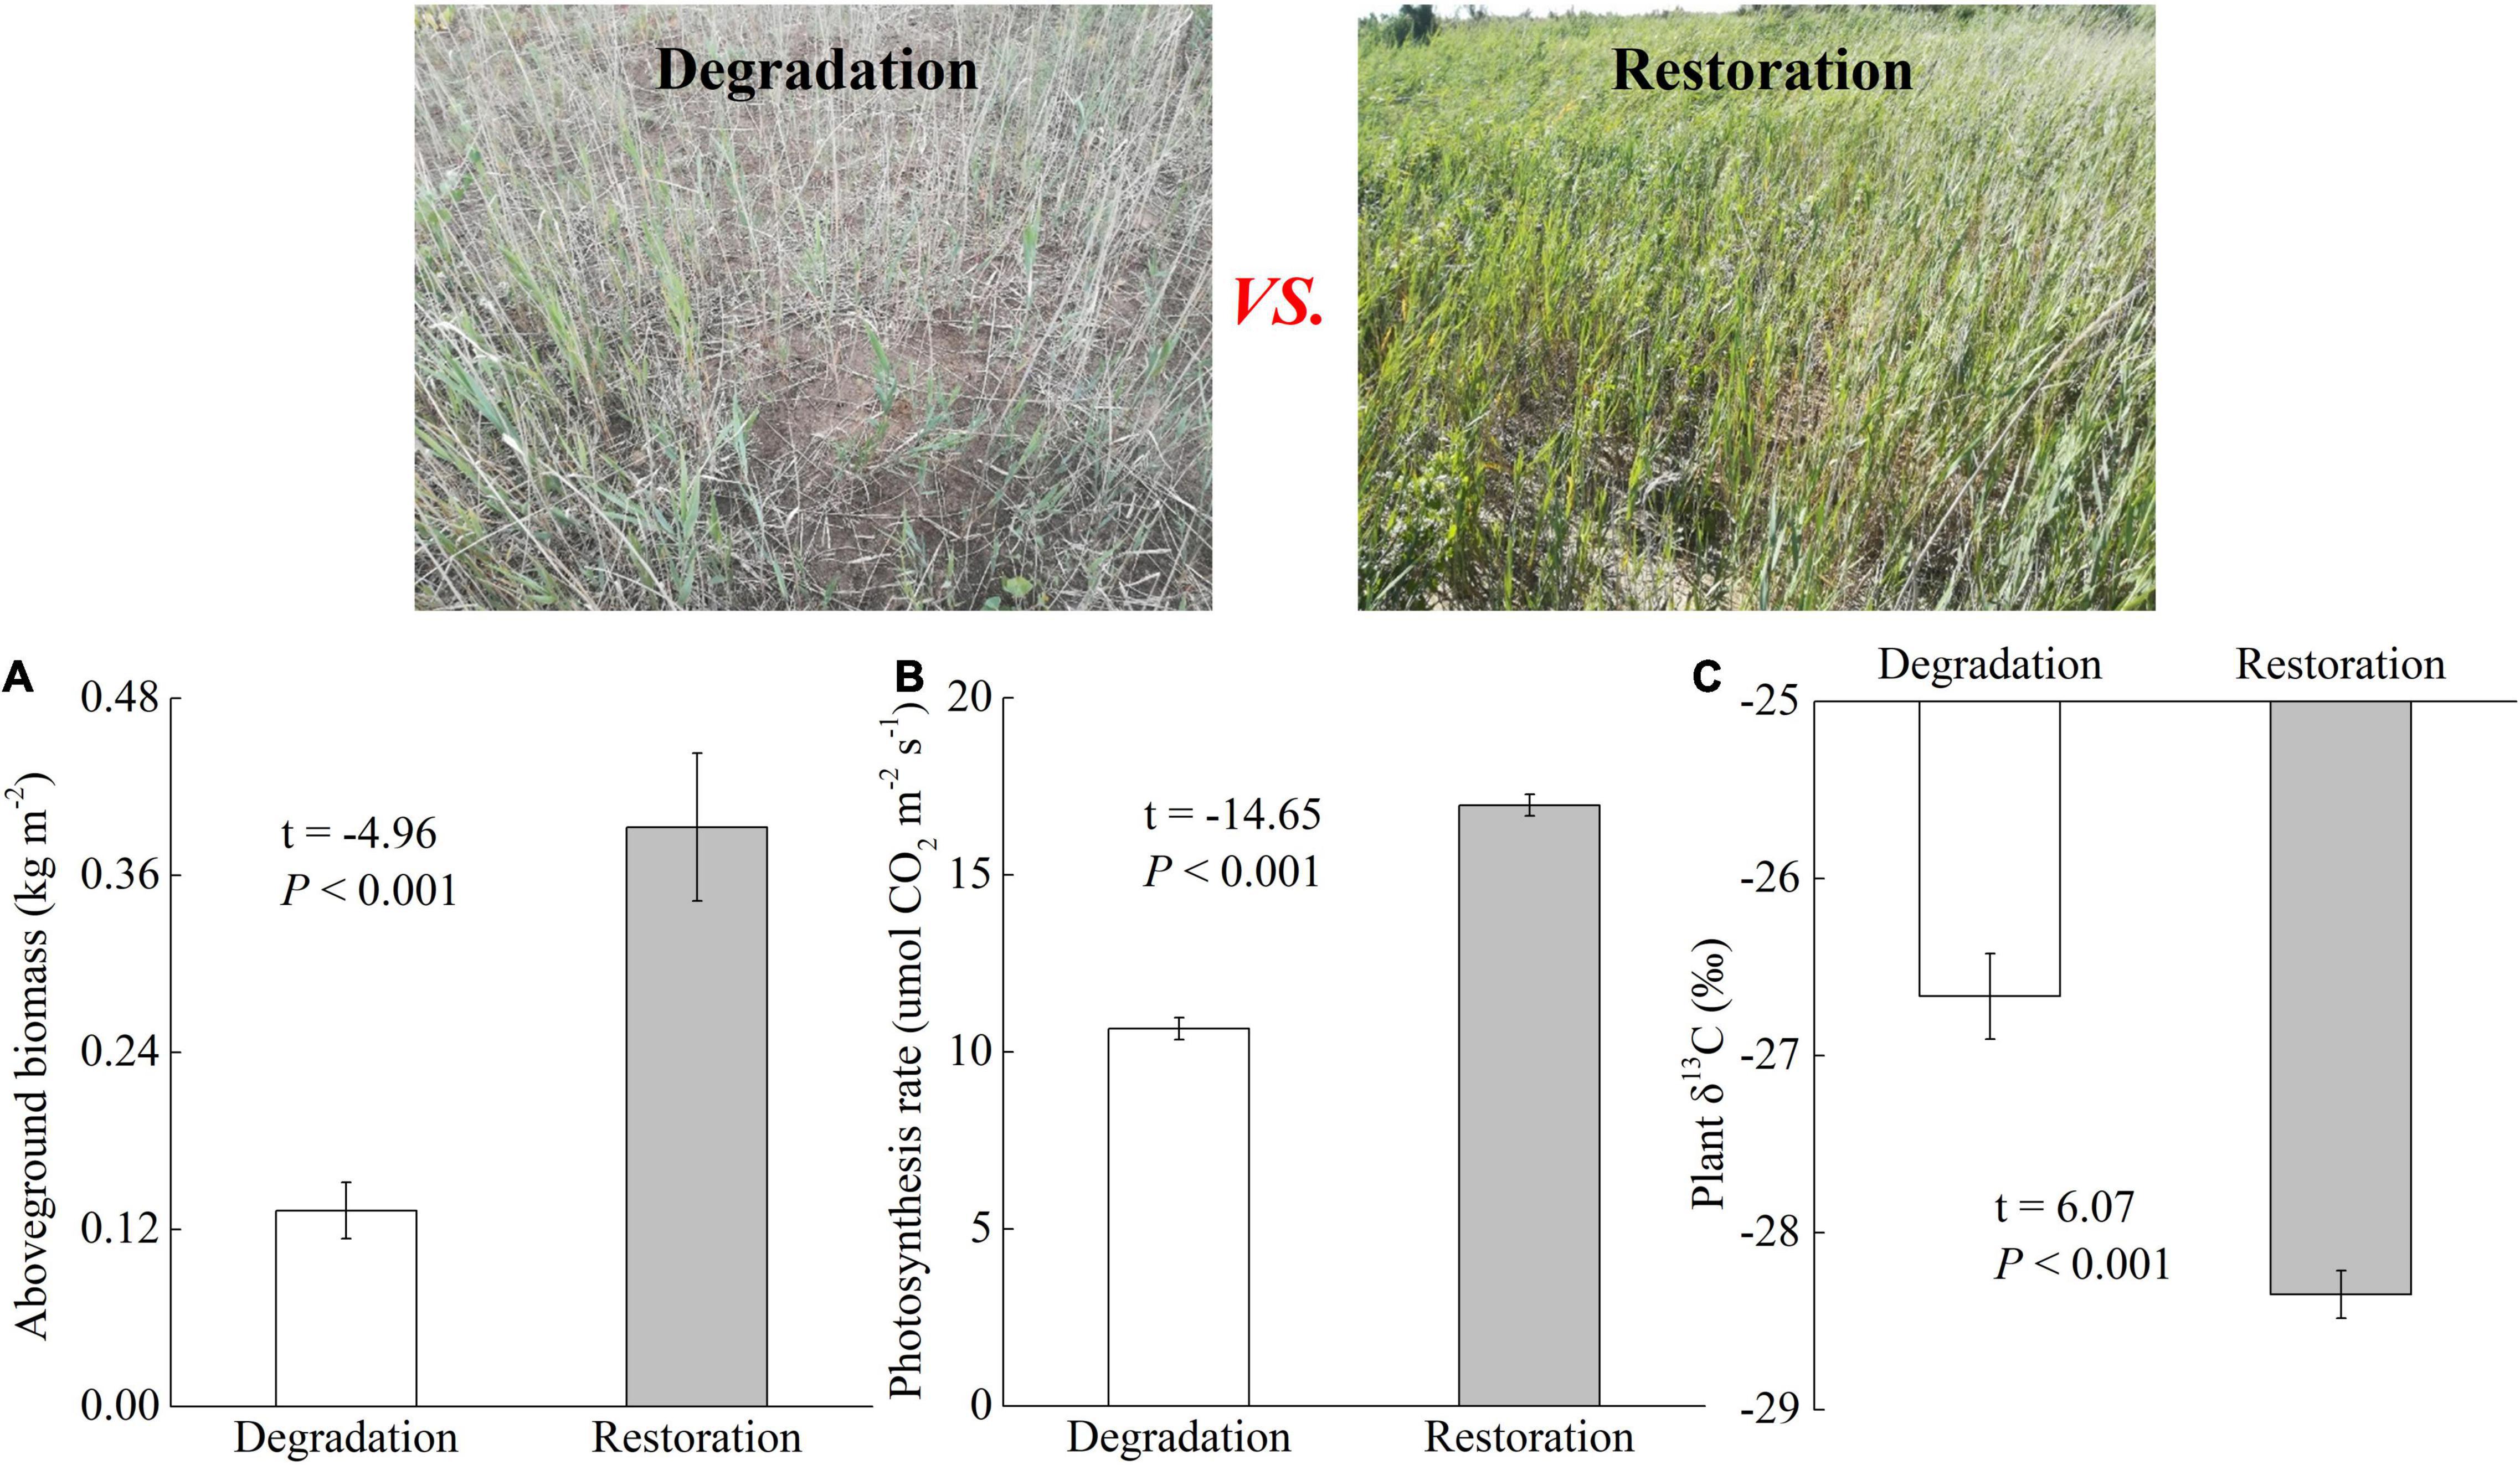
Figure 1. Effects of wetland degradation and restoration on aboveground biomass (A), leaf photosynthesis rate (B), and natural plant δ13C (C).
Sampling plots were conducted with a randomized within-wetland nested design. Six 30 m × 30 m plots were randomly selected in each degraded and recovering wetland. To weaken the spatial heterogeneity, we collected aboveground vegetation and soil cores (i.e., 0–10 cm, 10–20 cm, 20–40 cm, 40–60 cm, and 60–100 cm) from five random subplots. Plant and soil samples from subplots were then integrated to the plot level by mixing samples into one representative plant and soil sample, respectively. Sixty soil samples were collected with two wetland types × six plots × five depths. Plant samples were used to measure plant C content, natural 13C isotope, and aboveground biomass, subsequently to calculate aboveground C stock. Soil samples were sieved (<2 mm) to remove residues and roots. Each soil sample was divided into two subsamples to analyze (1) water content (fresh soil subsamples), and (2) electrical conductivity (EC), pH, SOC and TN contents, natural 13C isotope, and SOC compounds (air-dried soil subsamples).
Measurement and Calculation of Aboveground Plant Parameters
Leaf photosynthetic rate of P. australis was measured with a Li-6400XT photosynthesis system (Li-COR Inc., Lincoln, NE, United States). The harvested P. australis (1 m × 1 m subplot) were oven-dried to measure aboveground biomass. Plant subsamples grounding by ball milling (MM400, Retsch, Germany) and sieving (0.15 mm) were used to analyze plant C content and natural 13C isotope (i.e., δ13C) on an elemental analysis with isotope-ratio mass spectrometry (EA-IRMA) (Elementar, Langenselbold, Germany). We estimated aboveground C stocks using the following formula: Aboveground C stocks (Mg C ha–1) = plant C content (g kg–1) × aboveground biomass (kg m–2)/100.
Soil Physicochemical Analysis and SOC Stock Estimation
Fresh soil samples were oven-dried (105°C for 48 h) to measure soil water content (SWC). We prepared soil slurries (1:5 w/v) to analyze EC and pH using an electrode meter (Jenco 6173, Jenco, United States). After sieving to 0.15 mm, soil samples were provided to calculate SOC by the potassium dichromate oxidation method, to determine soil nitrogen (N) with the elemental analyzer (Elementar vario EL III, Germany), and to analyze soil δ13C after removing carbonate on an EA-IRMA (Elementar, Langenselbold, Germany). Soil bulk density (BD) was measured using an oven-dried soil sample collected with a bulk sampler. Finally, we calculated SOC stocks using the following formula: SOC stocks (Mg C ha–1) = SOC content (%) × BD (g cm–3) × soil depth (cm).
Soil samples (sieved to 0.15 mm) were thoroughly mixed with potassium bromide (soil:KBr = 1:40 w/w), which were used to analyze SOC compounds on a Thermo Nicolet 6,700 infrared spectrometer (Thermo Electron Scientific Instruments Corp., Madison, WI, United States). Reflectance spectra (4,000–400 cm–1) were measured with 64 scans at a resolution of 4 cm–1. Relative spectral peak areas at 1,630 and 1,050 cm–1 represent aromatic C compounds and carbohydrates, respectively (Shao et al., 2019).
Statistical Analysis
To test whether plant and soil parameters differed between degraded and recovering wetlands, we performed paired sample t-tests with the evaluation of normality assumption and homogenous variance using the SAS V.8.1 software (SAS Institute Inc., Cary, NC, United States). Generalized linear models (GLM) were used to determine relationships among plant parameters, soil properties, and wetland C stocks including above- and belowground C stocks.
Results
Responses of Soil Physicochemical Properties to Degraded and Recovering Wetlands
Soil physicochemical properties, including SWC, EC pH, BD, and soil N content, significantly responded to degraded and recovering wetlands in different soil depths (Table 1). Wetland restoration greatly increased SWC and soil N content of 0–100 cm compared with degraded wetland (all p < 0.05). Surface soil EC (0–10 cm and 10–20 cm) in recovering wetland was lower than degraded wetland (both p < 0.05), whereas no change in soils of 20–100 cm (p > 0.05). For soil pH, wetland restoration only led to the increase in soil pH of 0–10 cm (p < 0.05). In addition, recovering wetland showed lower soil BD than degraded wetland at the five soil depths (all p < 0.05, except marginal significance at 60–100 cm).
Responses of Plant Properties and Aboveground C Stocks to Degraded and Recovering Wetlands
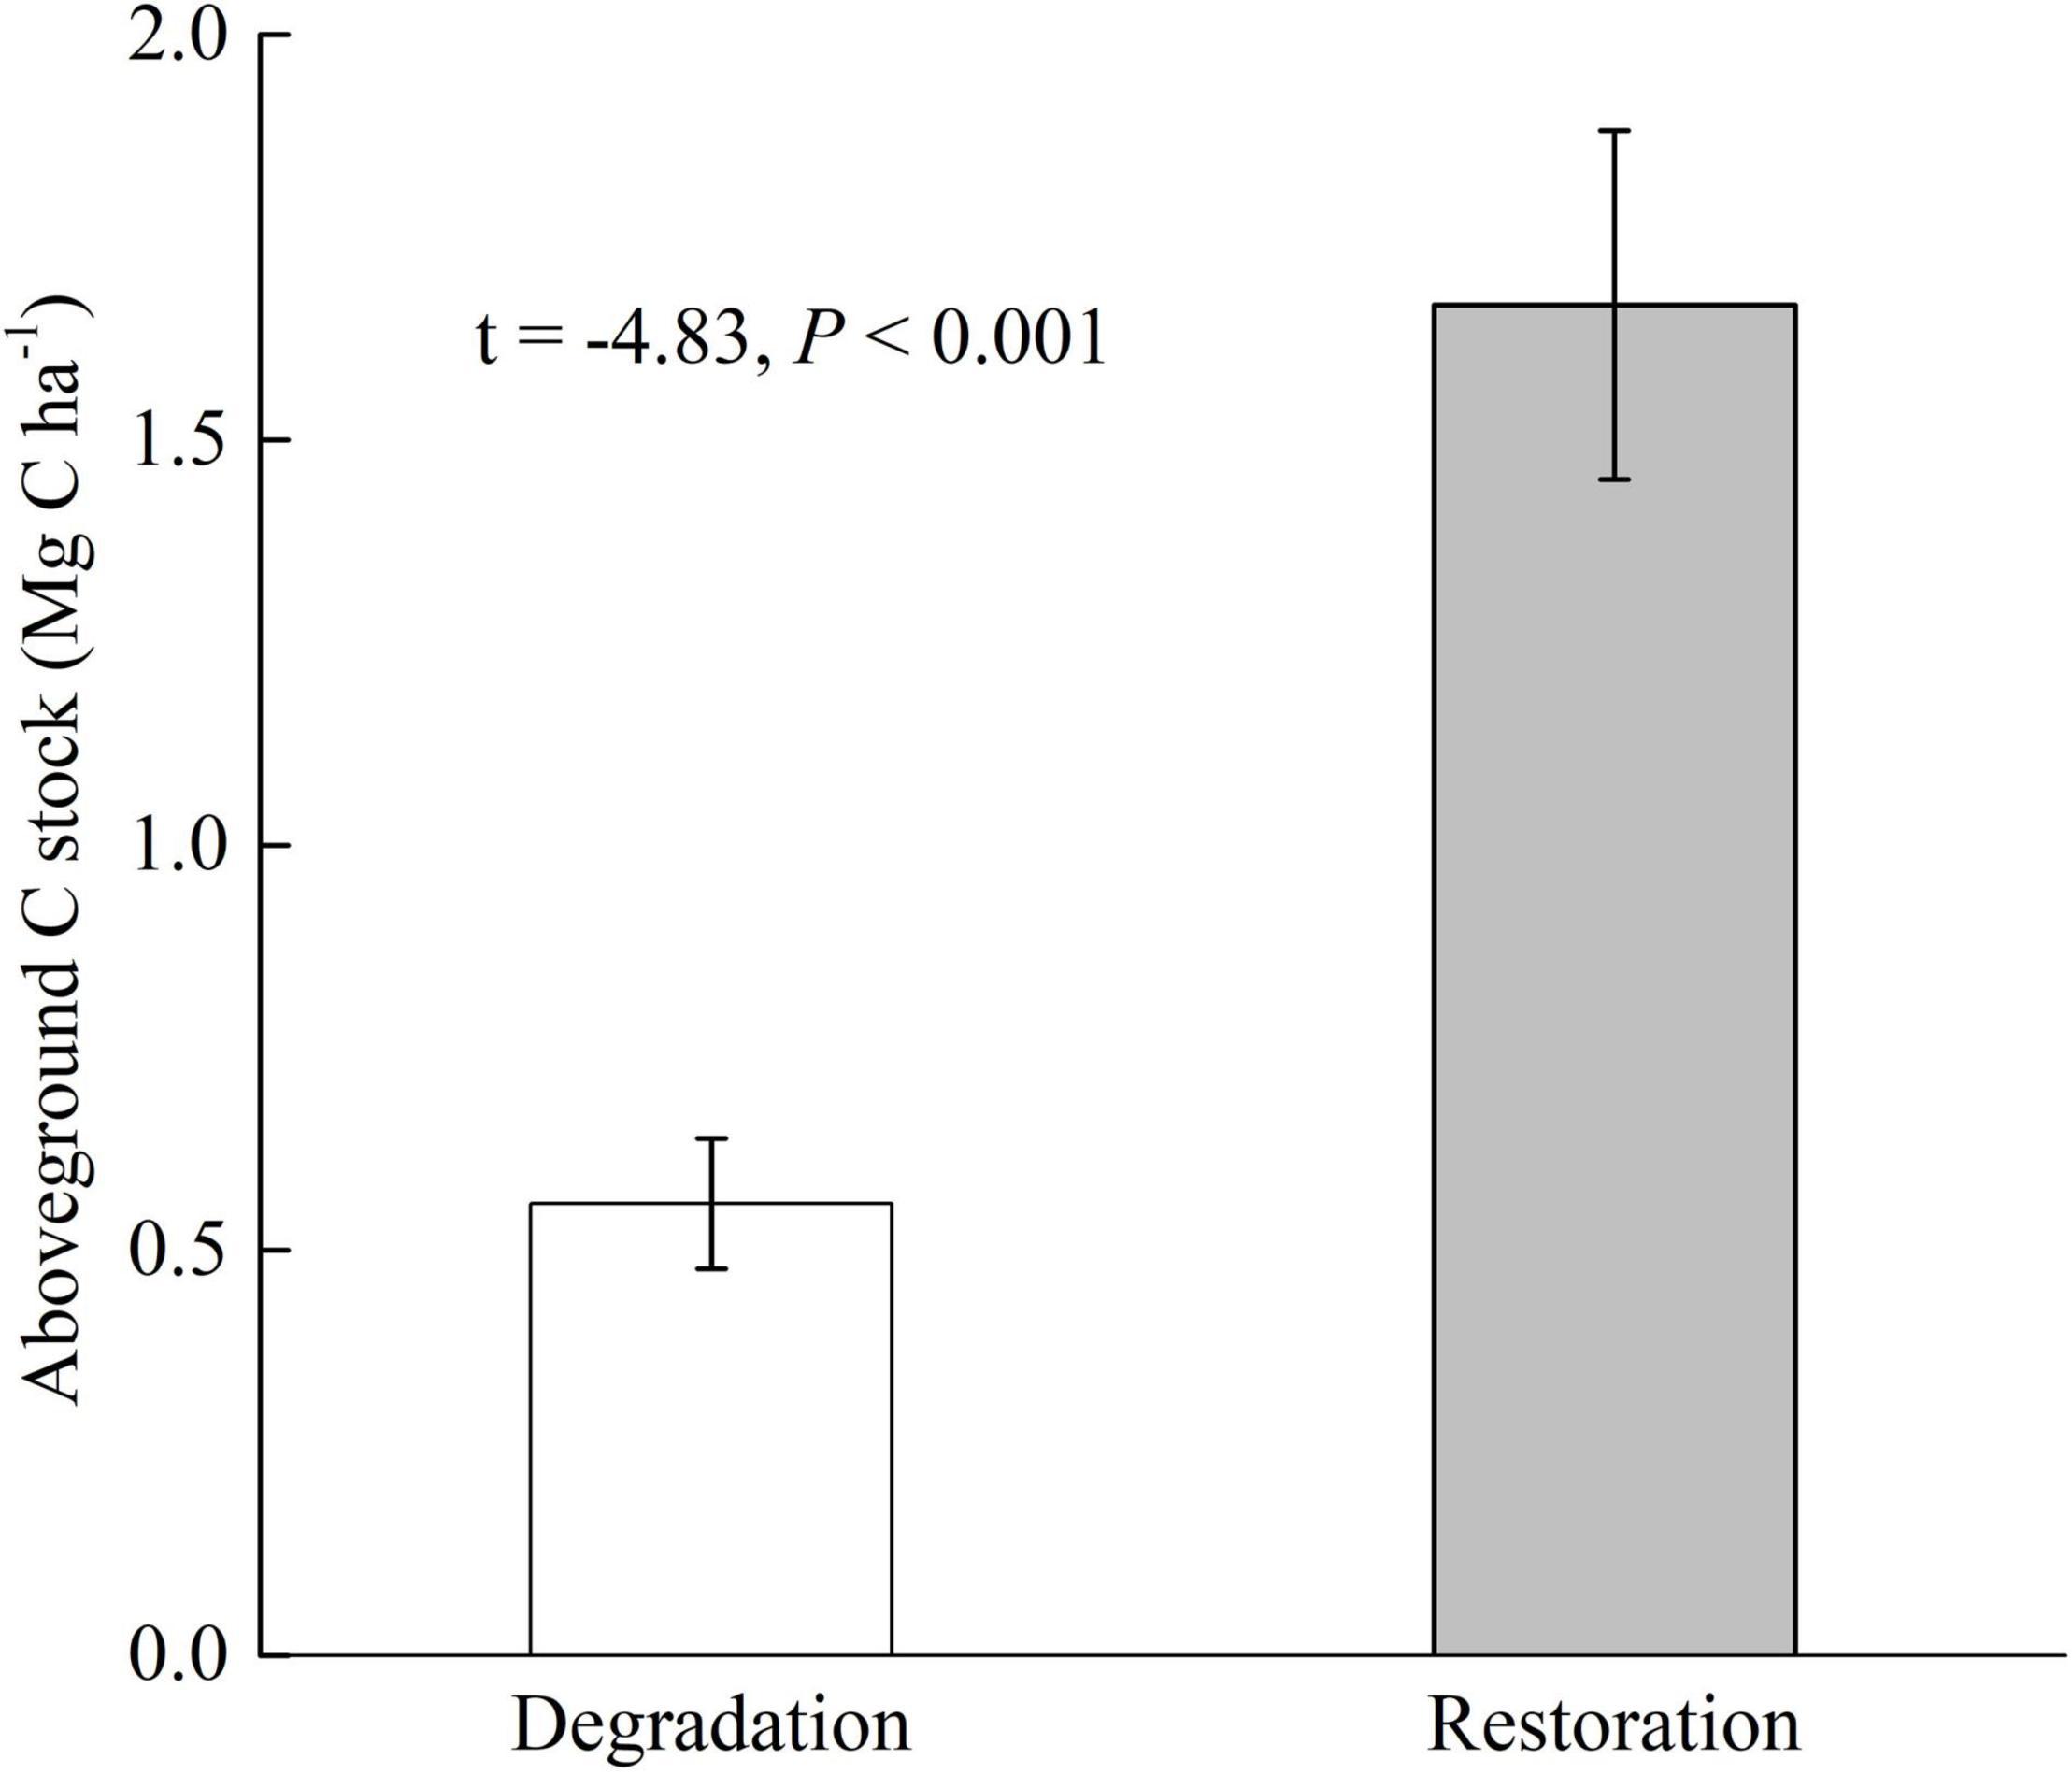
Our study demonstrated that wetland degradation and restoration significantly influenced aboveground biomass, leaf photosynthesis rate, and plant δ13C (Figure 1). Compared with degraded wetland, recovering wetland substantially increased aboveground biomass and leaf photosynthesis rate by 199.0% (p < 0.001) and 195.7% (p < 0.001), respectively. The plant δ13C was higher in degraded wetland (−26.67‰) than in recovering wetland (−28.35‰). In addition, our study estimated aboveground C stocks that were significantly changed from 0.56 Mg C ha–1 to 1.67 Mg C ha–1 as a conversion of degraded wetland to recovering wetland (p < 0.001; Figure 2).
Responses of Soil C Parameters to Degraded and Recovering Wetlands
The SOC content and soil δ13C were greatly changed in degraded and recovering wetlands at the depth of 0-40 cm; no change was found at the depth of 40-100 cm (Figure 3). In comparison with wetland degradation, wetland restoration significantly increased the SOC content by 304.6, 517.6, and 98.62% at depth of 0-10 cm, 10–20 cm, and 20–40 cm, respectively (all p < 0.05). Soil δ13C in recovering wetland was significantly lower than that in degraded wetland at depths of 0–10 cm (−38.39‰ vs. −35.65‰), 10–20 cm (−38.92‰ vs. −35.64‰), and 20–40 cm (−39.04‰ vs. −38.21‰) (all p < 0.05).
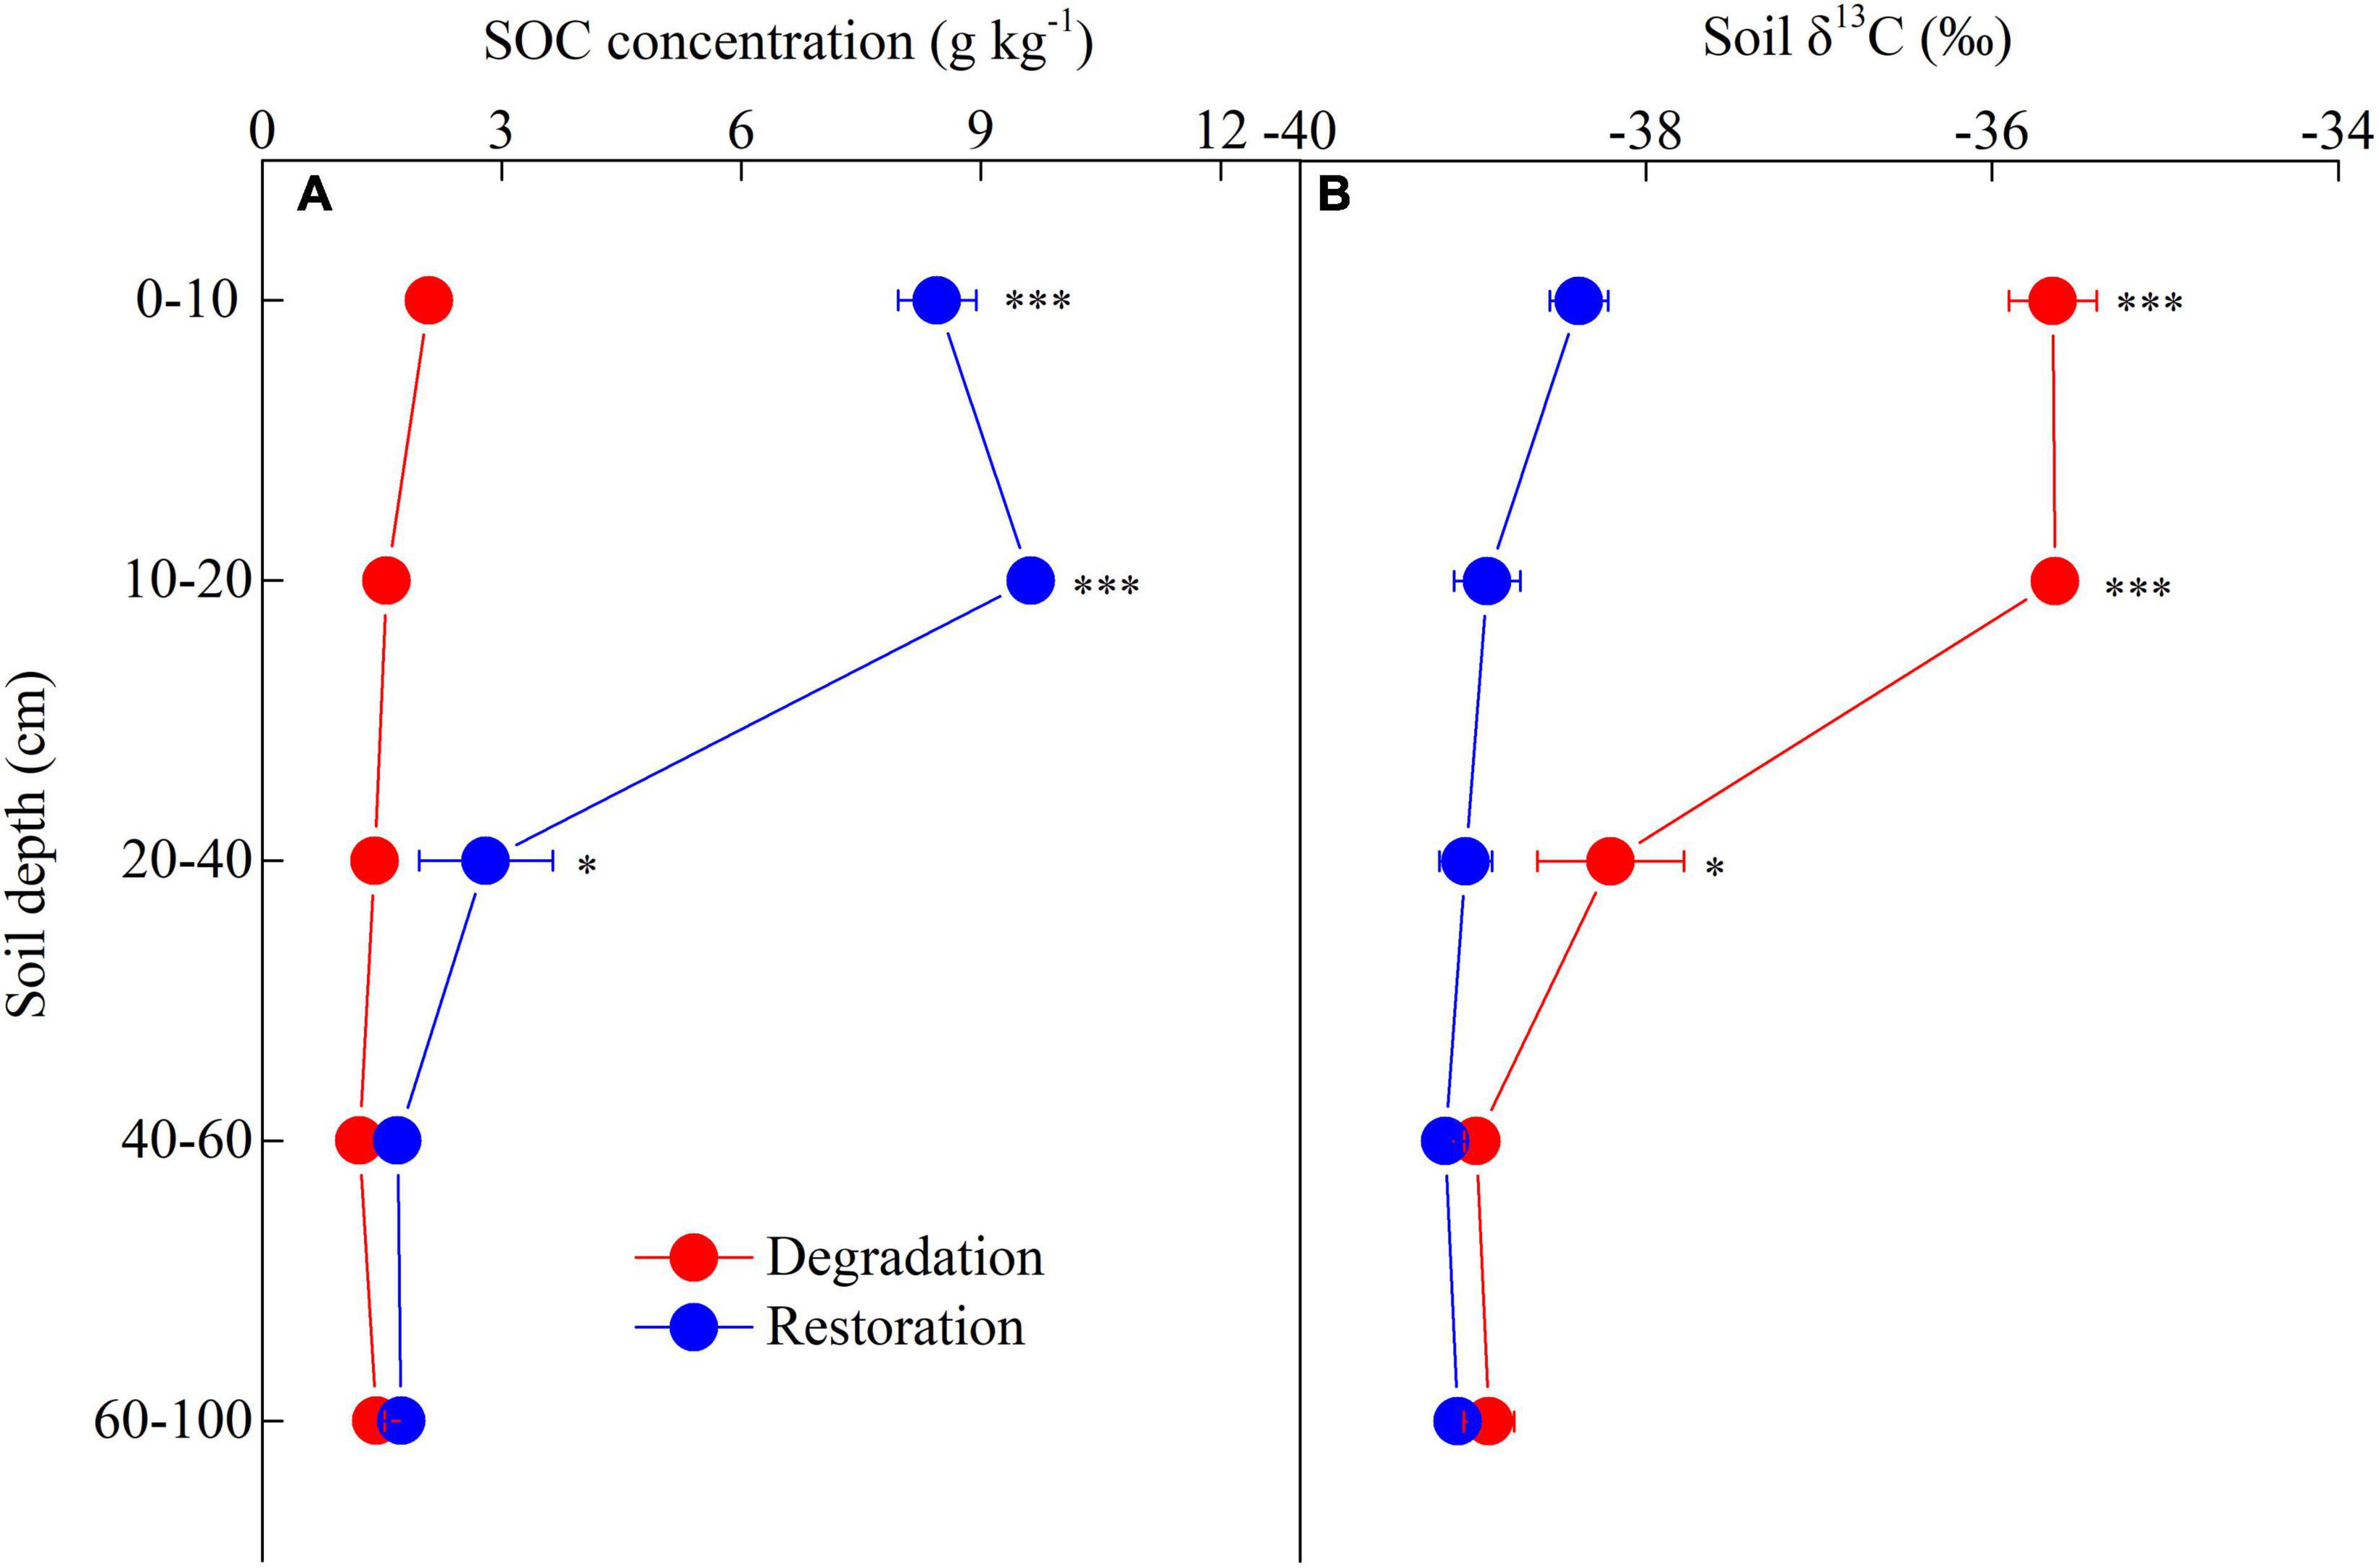
Figure 3. Effects of wetland degradation and restoration on soil organic C (SOC) concentration (A) and natural soil δ13C (B) at a soil depth of 0–100 cm. The symbols of *** and * represent statistical signifiance with p < 0.001 and p < 0.05, respectively.
Wetland restoration led to a significant increment in SOC stocks, which increased by 6.09 Mg C ha–1 (0–10 cm, p < 0.001), 11.64 Mg C ha–1 (10–20 cm, p < 0.001), and 4.39 Mg C ha–1 (20–40 cm, p < 0.001) as degraded wetland converting to recovering wetland, whereas slight increment in SOC stocks at the depth of 40–60 cm (Figure 4). We evaluated SOC stocks of 0–100 cm and found that SOC stocks were greatly lower in degraded wetland (26.94 Mg C ha–1) than recovering wetland (51.86 Mg C ha–1) (Figure 4A).
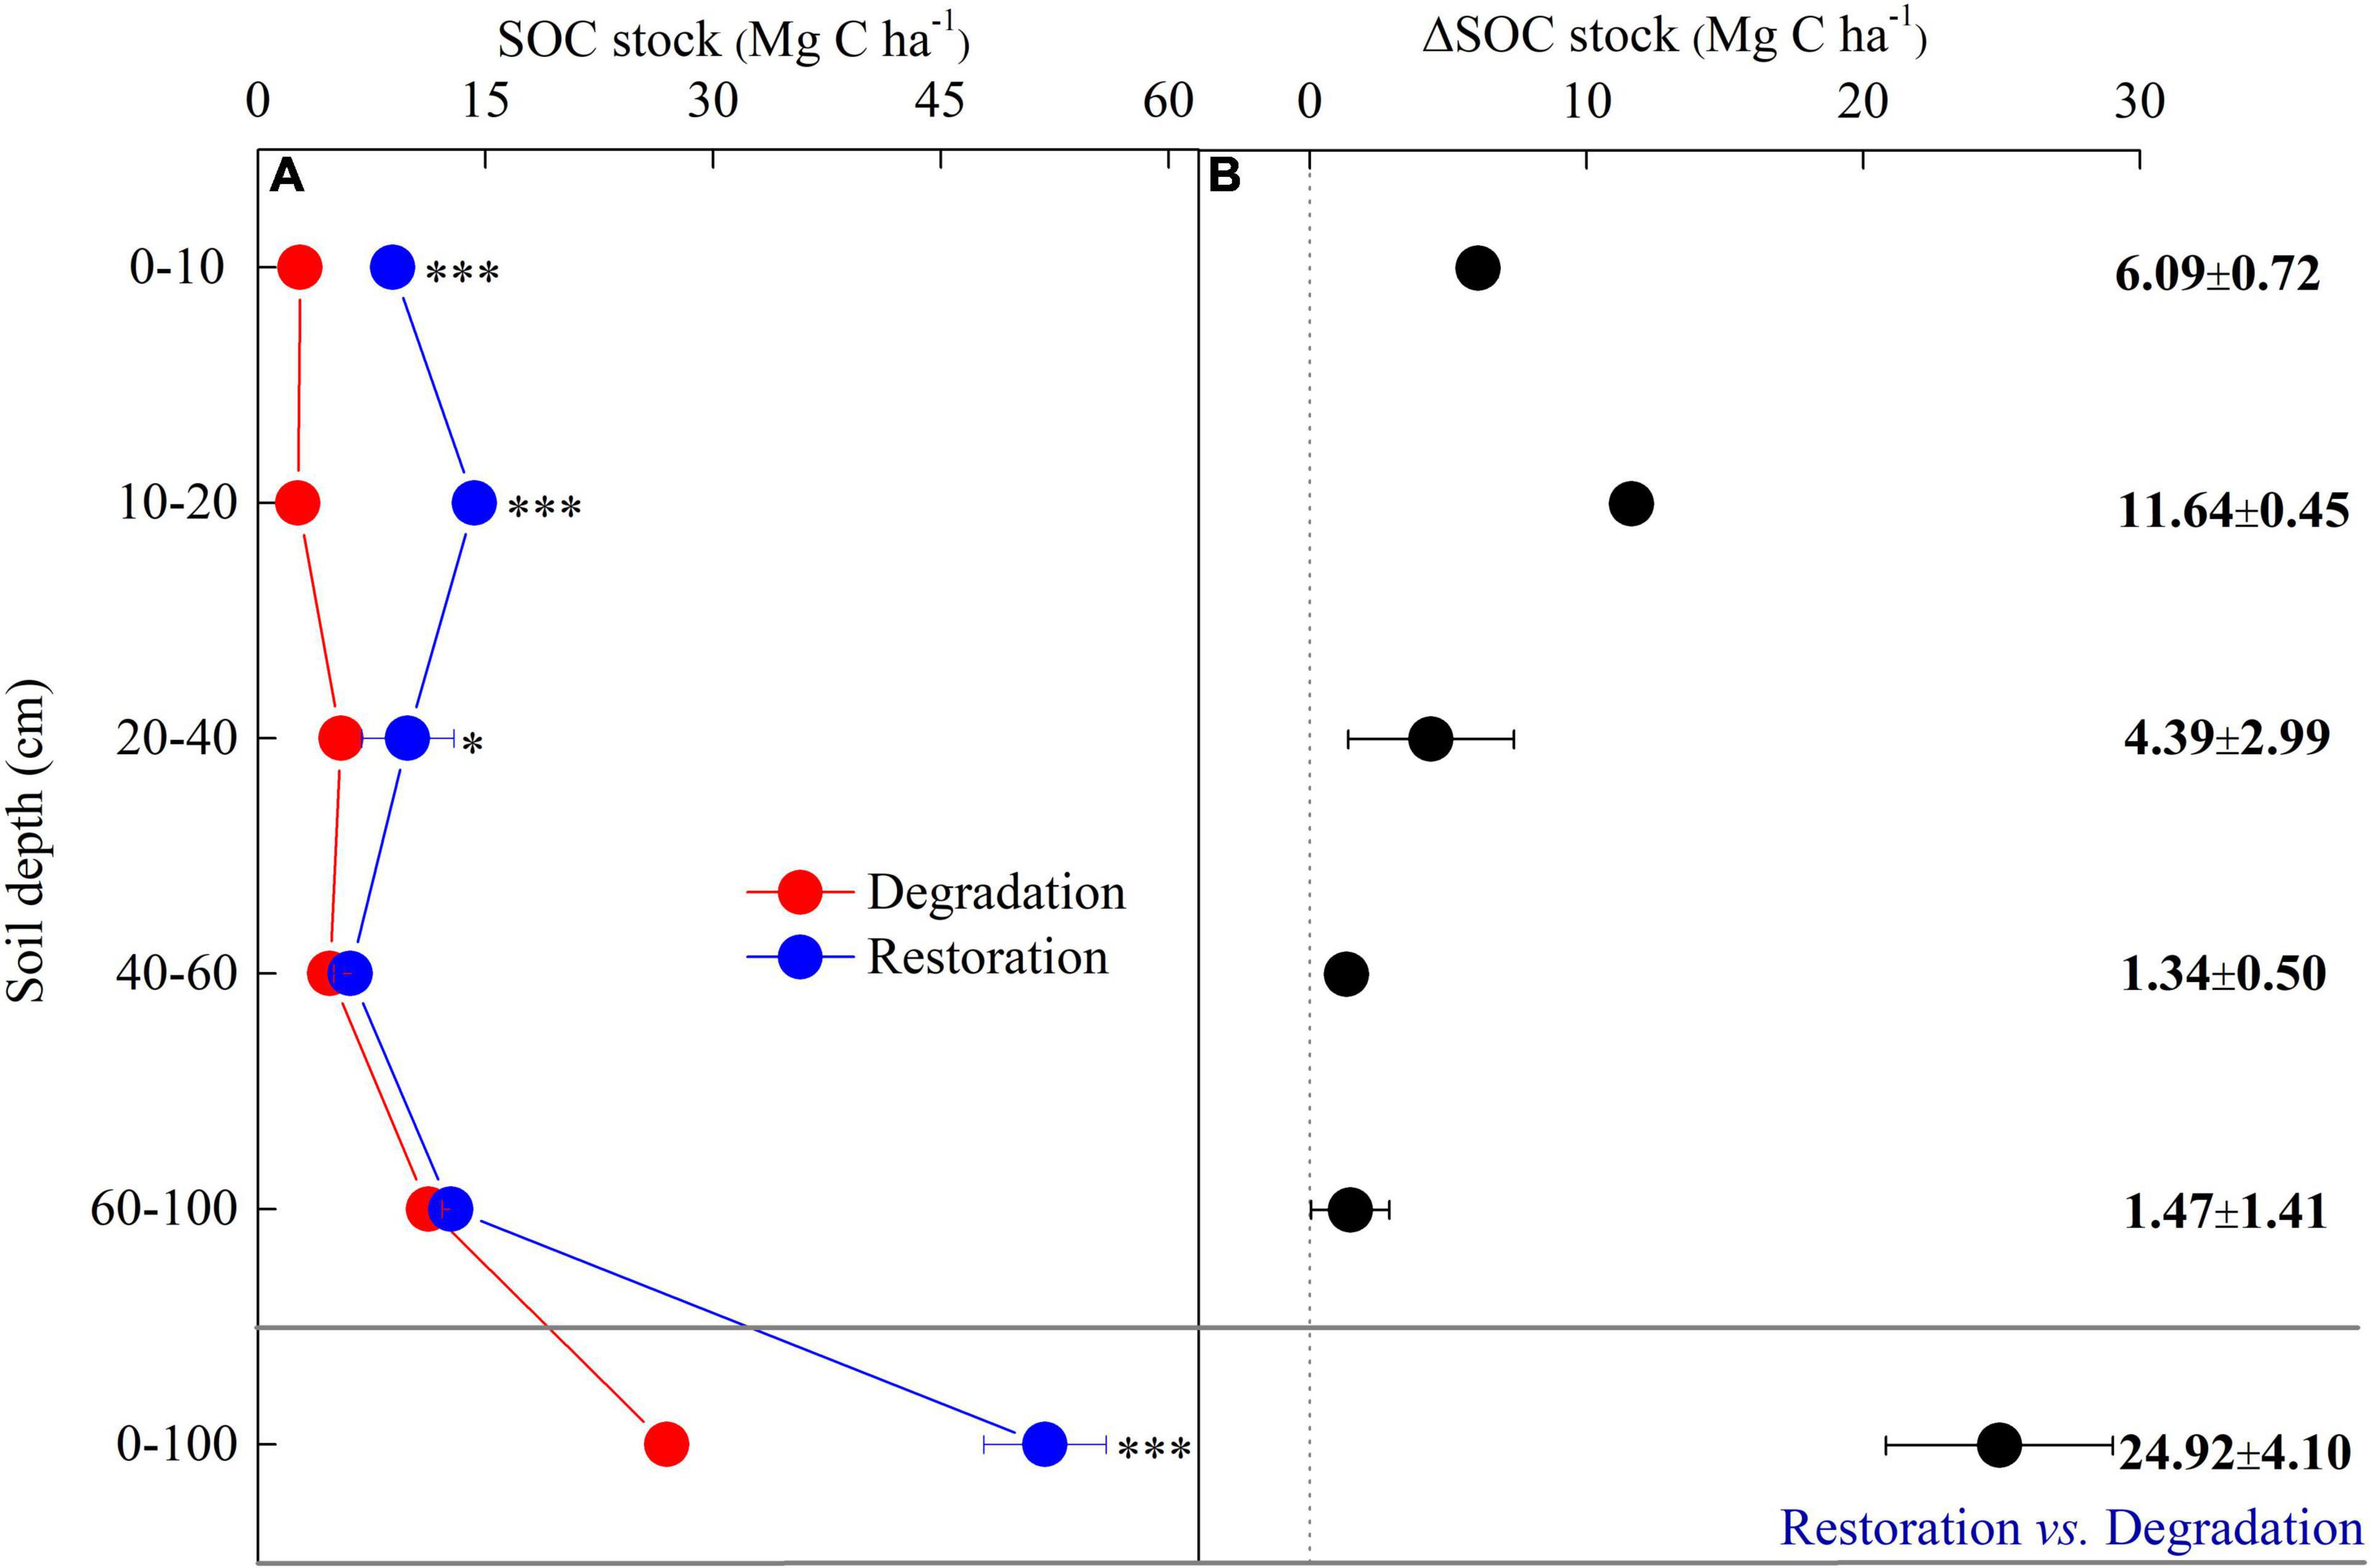
Figure 4. Variations of soil organic C (SOC) stocks (A) and Δ SOC stocks (B) of 0–100 cm in degraded and recovering wetlands. The symbols of *** and * represent statistical signifiance with p < 0.001 and p < 0.05, respectively.
The SOC compounds were estimated using the mid-IR technology (Figure 5). We found that wetland restoration resulted in significant reduction of soil aromatic C compounds (relative abundance, 1,630 cm–1) at the depth of 0-40 cm (all p < 0.01), while significant increase in aromatic C compounds at the depth of 40-100 cm (both p < 0.05, Figure 5A). The relative abundance of carbohydrates (1,050 cm–1) was higher in recovering wetland than degraded wetland at the soil depth of 0–20 cm and did not change at a soil depth of 40-100 cm (Figure 5B). In addition, the ratio of aromatic C compounds to carbohydrates showed similar changes with aromatic C compounds in degraded and recovering wetlands at soil depth of 0–100 cm (Figure 5C).
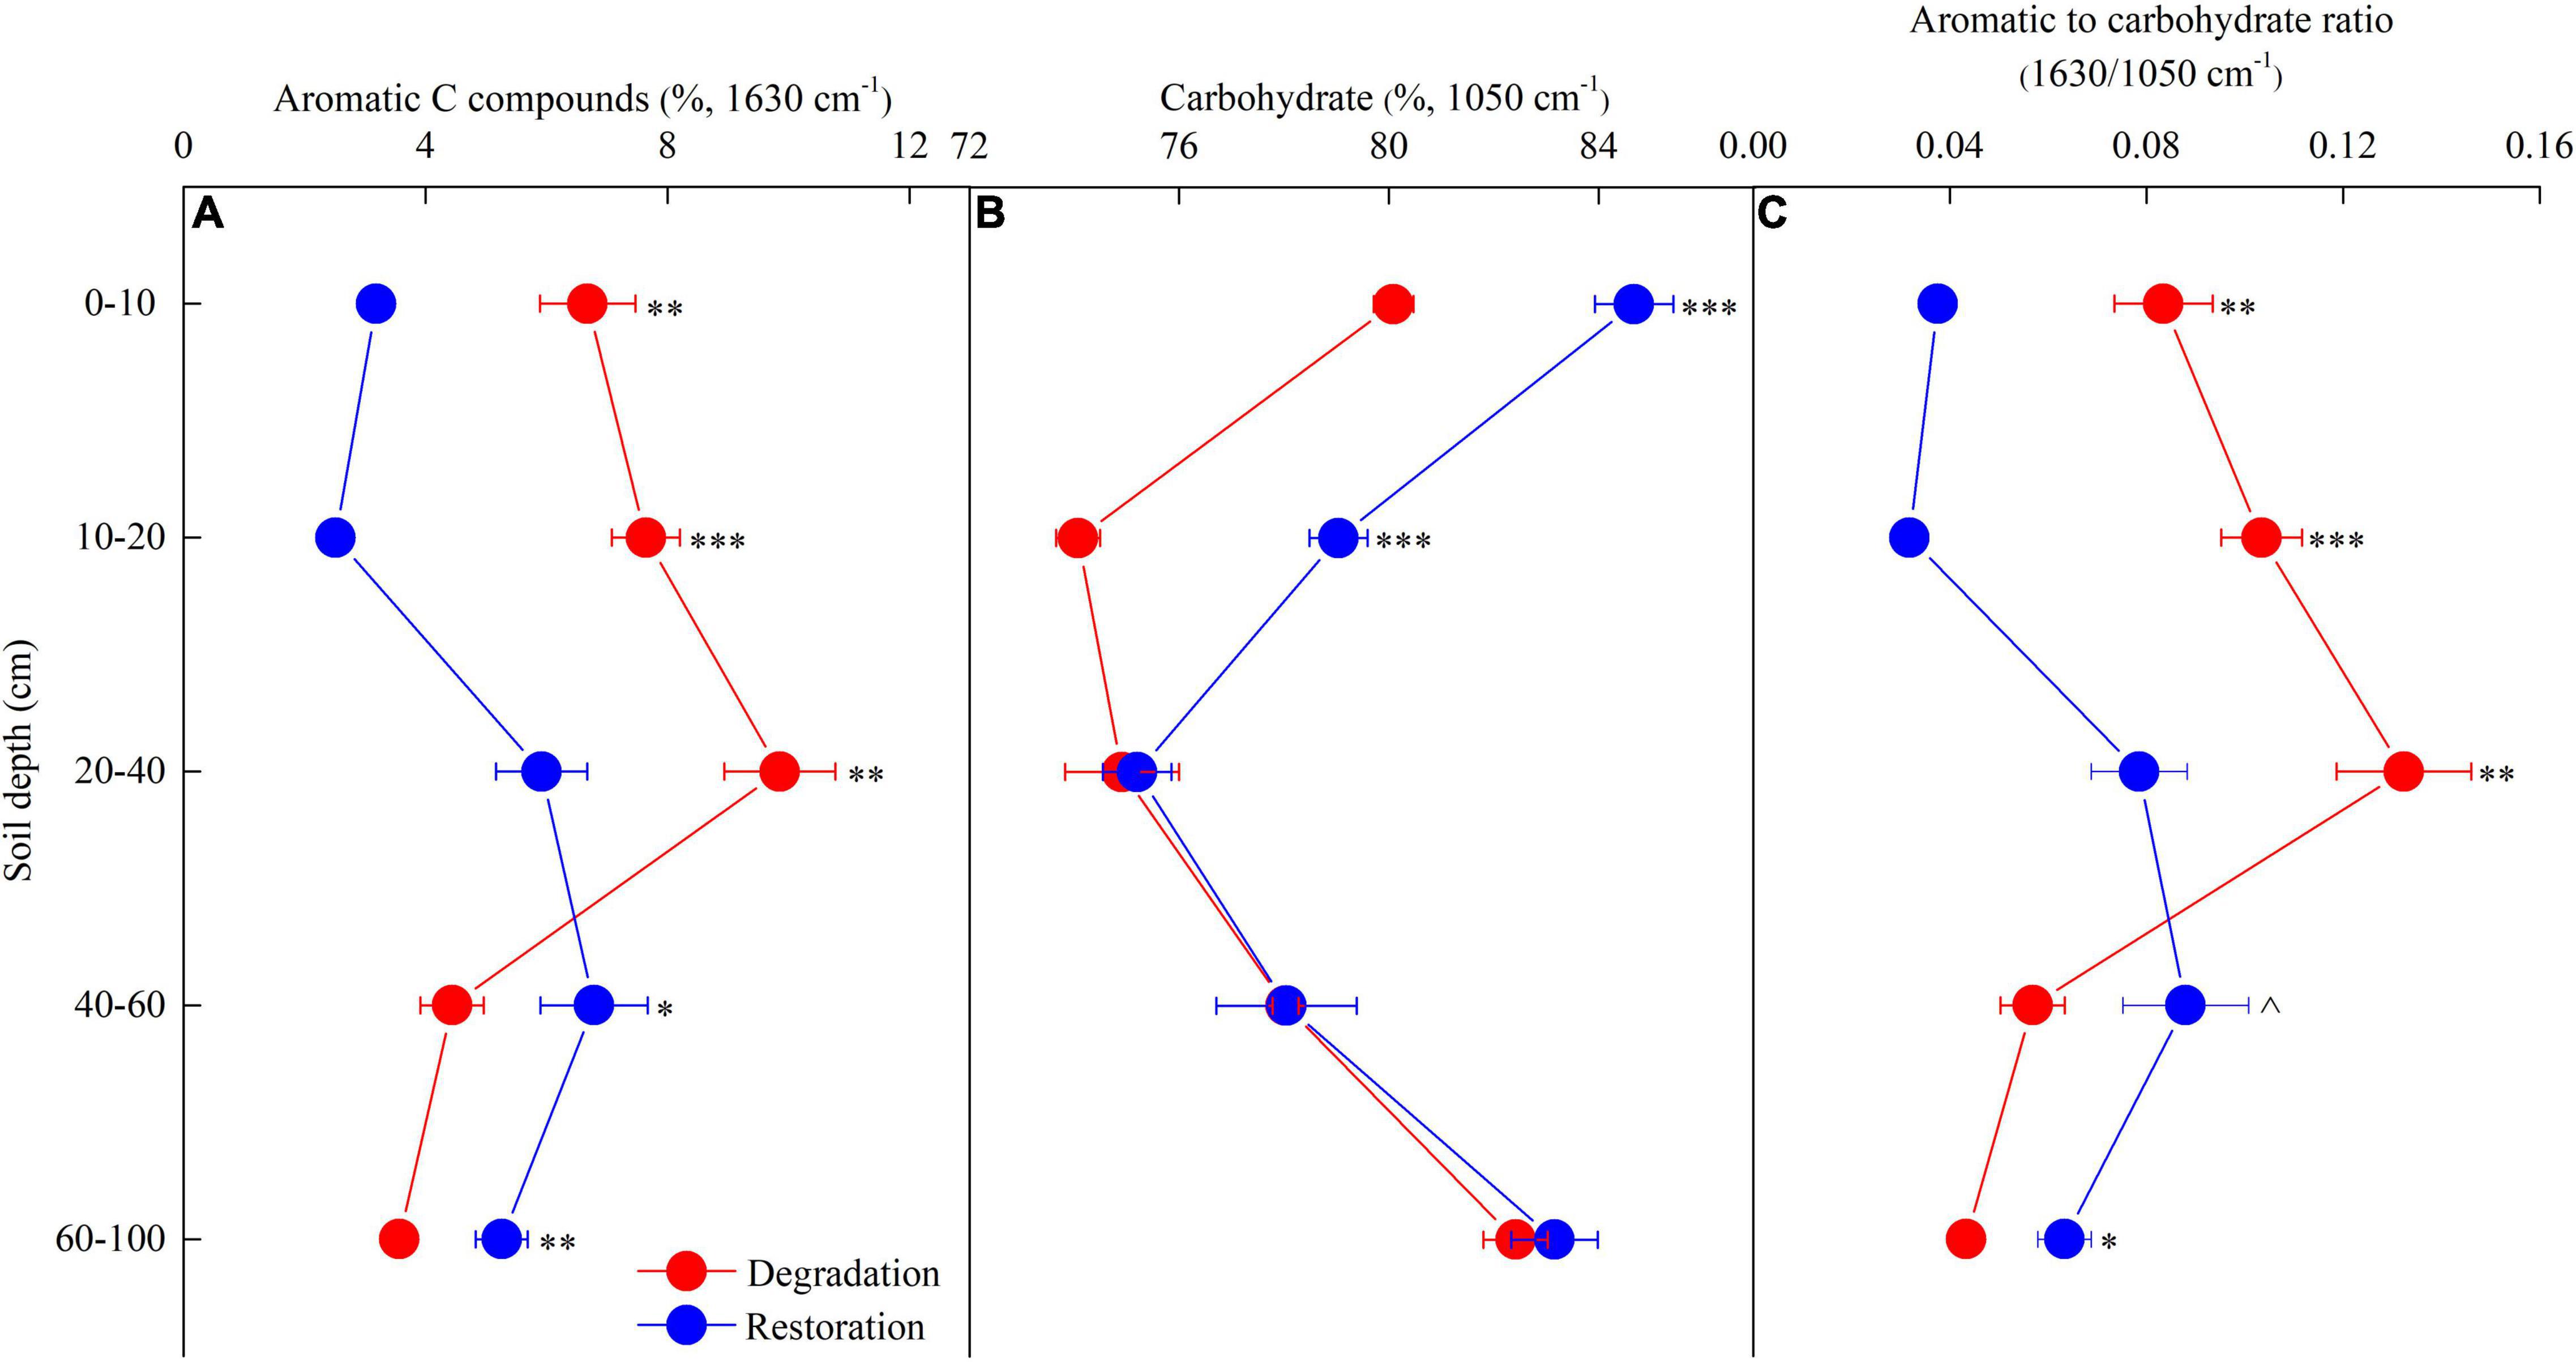
Figure 5. Effects of wetland degradation and restoration on soil organic C (SOC) compounds (i.e., aromatic C compounds, A; and carbohydrates, B) and the ratio of aromatic C compounds to carbohydrates (C) at a soil depth of 0–100 cm. The symbols of ***, **, *, and ∧ represent statistical signifiance with p < 0.001, p < 0.01, p < 0.05, and p < 0.1, respectively.
Correlations of Above- and Belowground C Stocks With Plant and Soil Parameters in Degraded and Recovering Wetlands
Generalized linear models showed that aboveground C stocks were tightly and positively related with SWC (R2 = 0.54, p < 0.01), soil N content (R2 = 0.69, p < 0.001), leaf photosynthesis rate (R2 = 0.69, p < 0.001), and aboveground biomass (R2 = 0.99, p < 0.01), whereas negatively associated with soil EC (R2 = 0.60, p < 0.01) and not related with plant C content (R2 = 0.19, p = 0.09) in degraded and recovering wetlands (Figure 6).
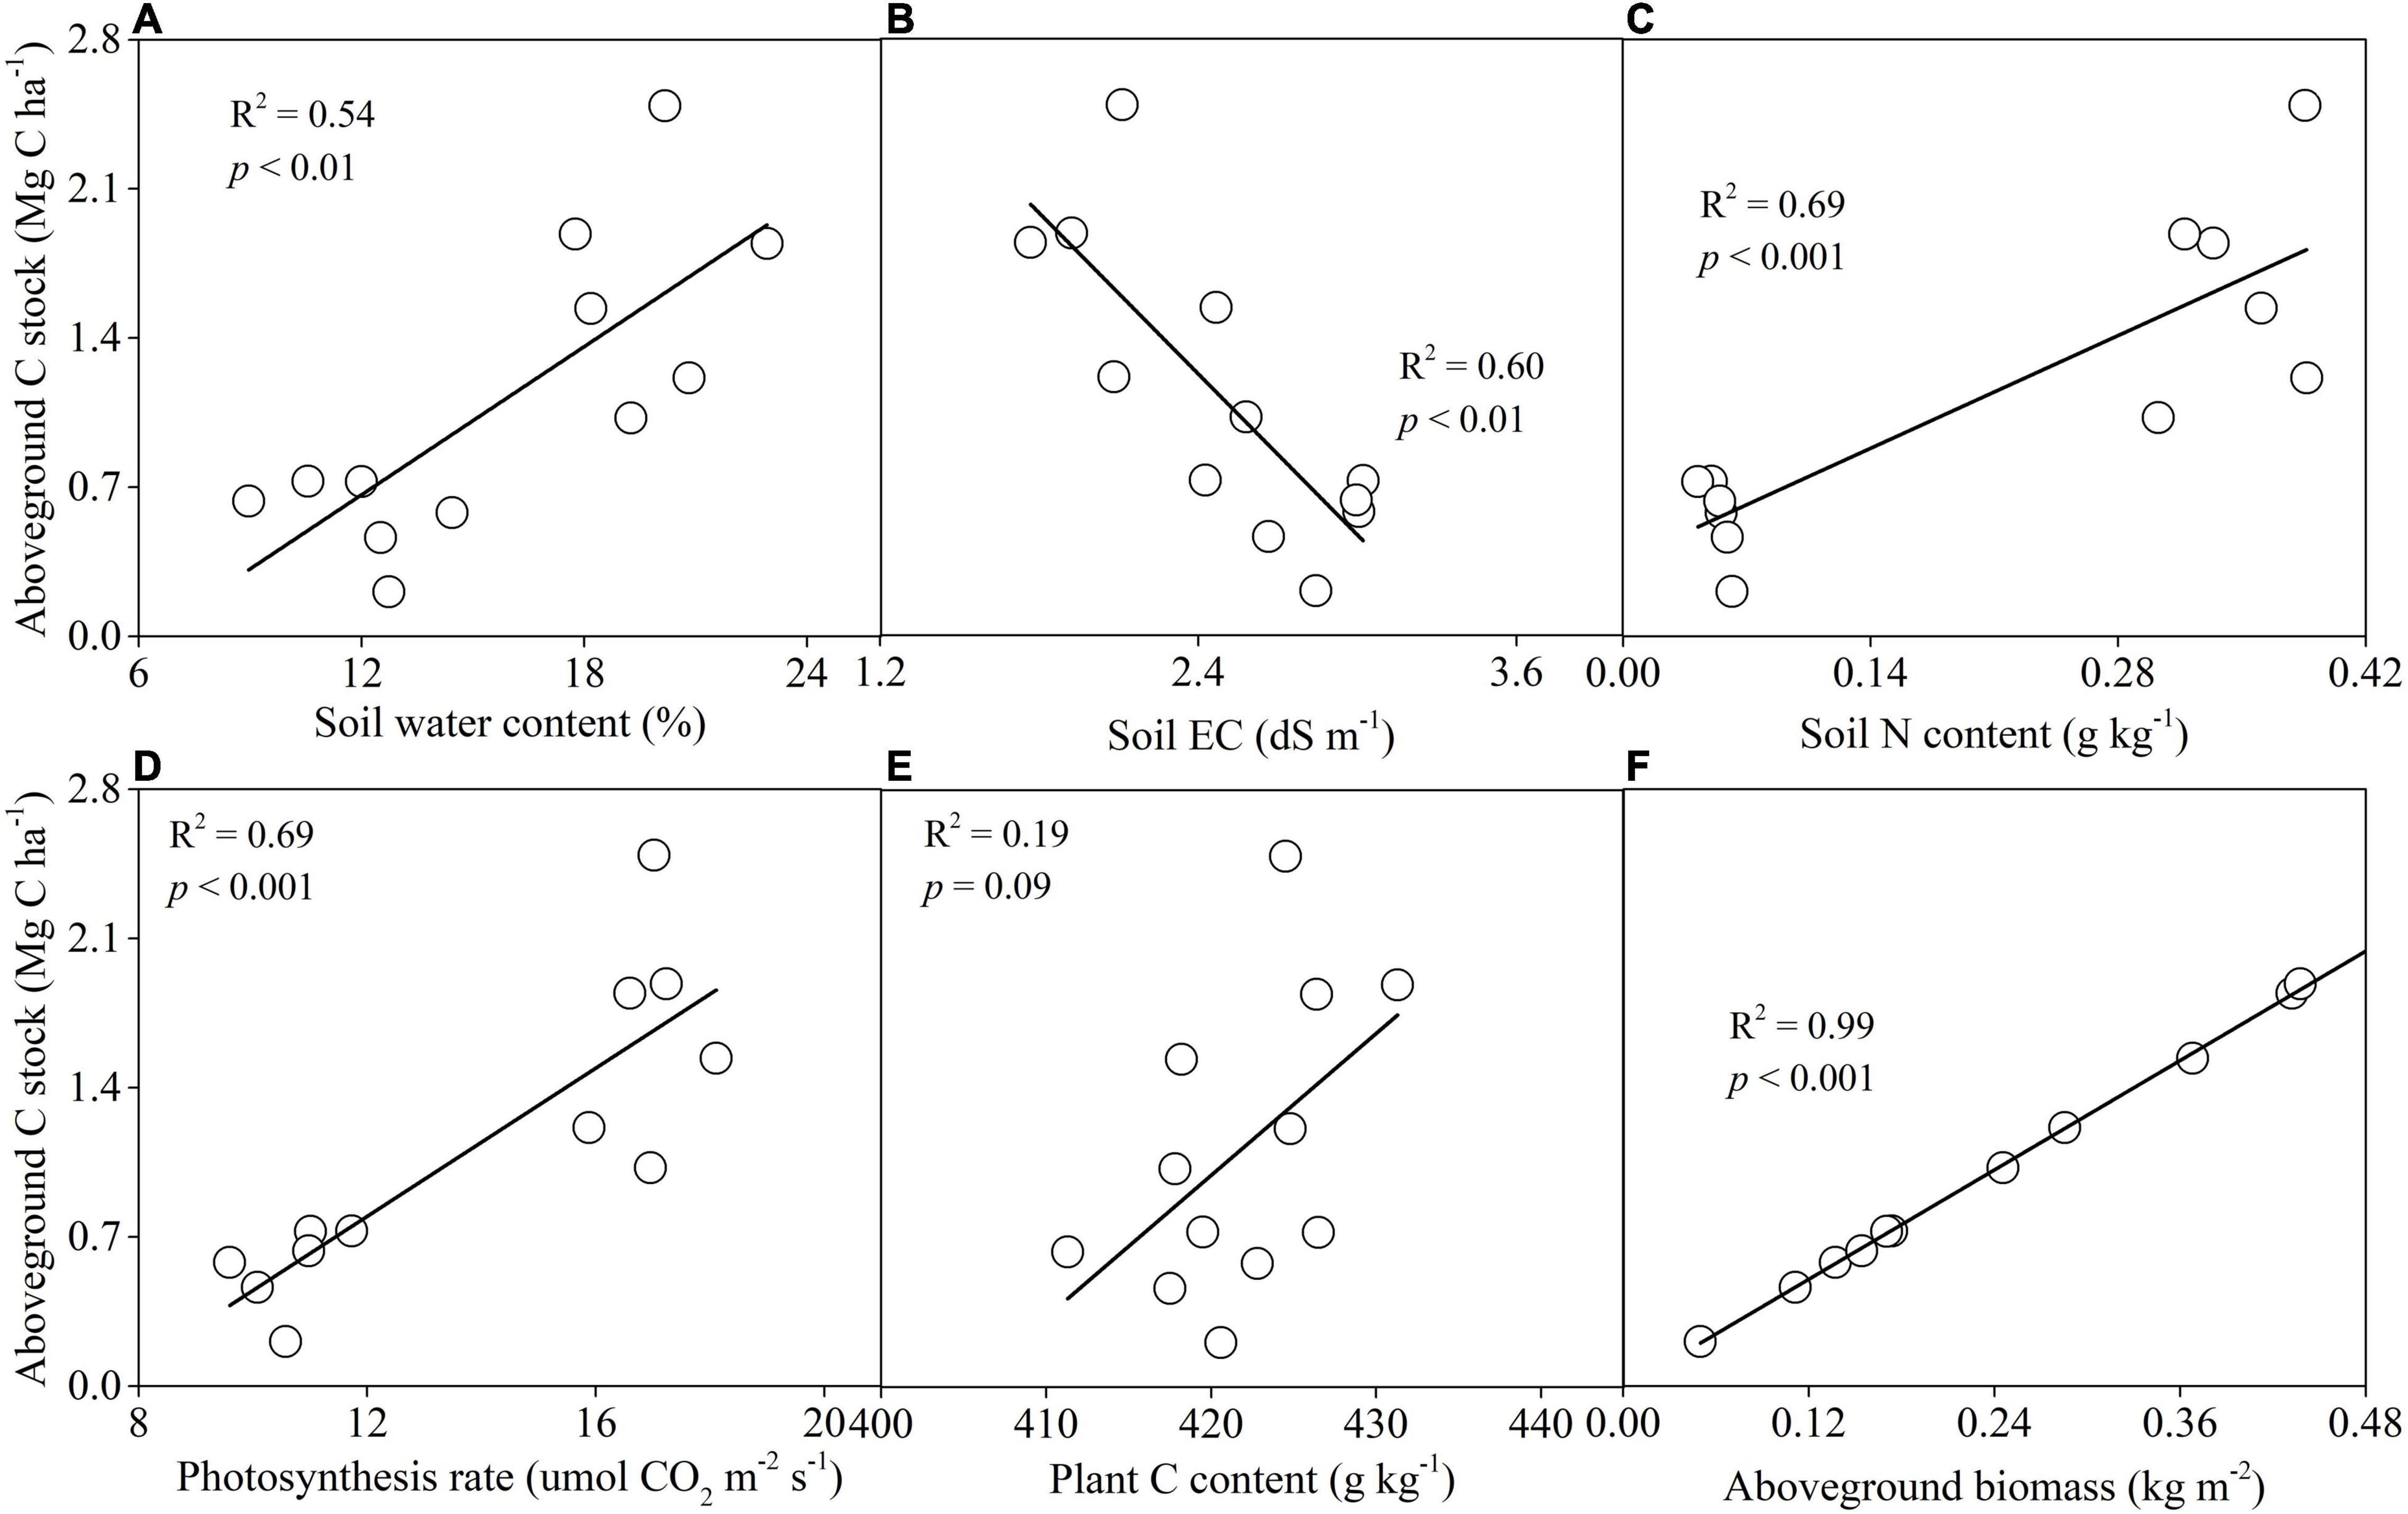
Figure 6. The relationships of aboveground C stocks with soil properties (weighted average of 0–100 cm) and plant properties in degraded and recovering wetlands. Soil properties include soil water content (A), soil EC (B), soil N content (C), photosynthesis rate (D), plant C content (E), and aboveground biomass (F).
In addition, SOC stocks of 0-100 cm showed positive relationships with SWC (R2 = 0.66, p < 0.001), leaf photosynthesis rate (R2 = 0.72, p < 0.001), aboveground biomass (R2 = 0.79, p < 0.001), SOC content (R2 = 0.93, p < 0.001), and carbohydrate (R2 = 0.57, p = 0.003), while negative relationships with soil EC (R2 = 0.48, p < 0.01), soil BD (R2 = 0.61, p = 0.002), soil δ13C (R2 = 0.72, p < 0.001), aromatic C compounds (R2 = 0.54, p = 0.004), and ratio of aromatic C compounds to carbohydrates (R2 = 0.54, p = 0.004) (Figure 7).
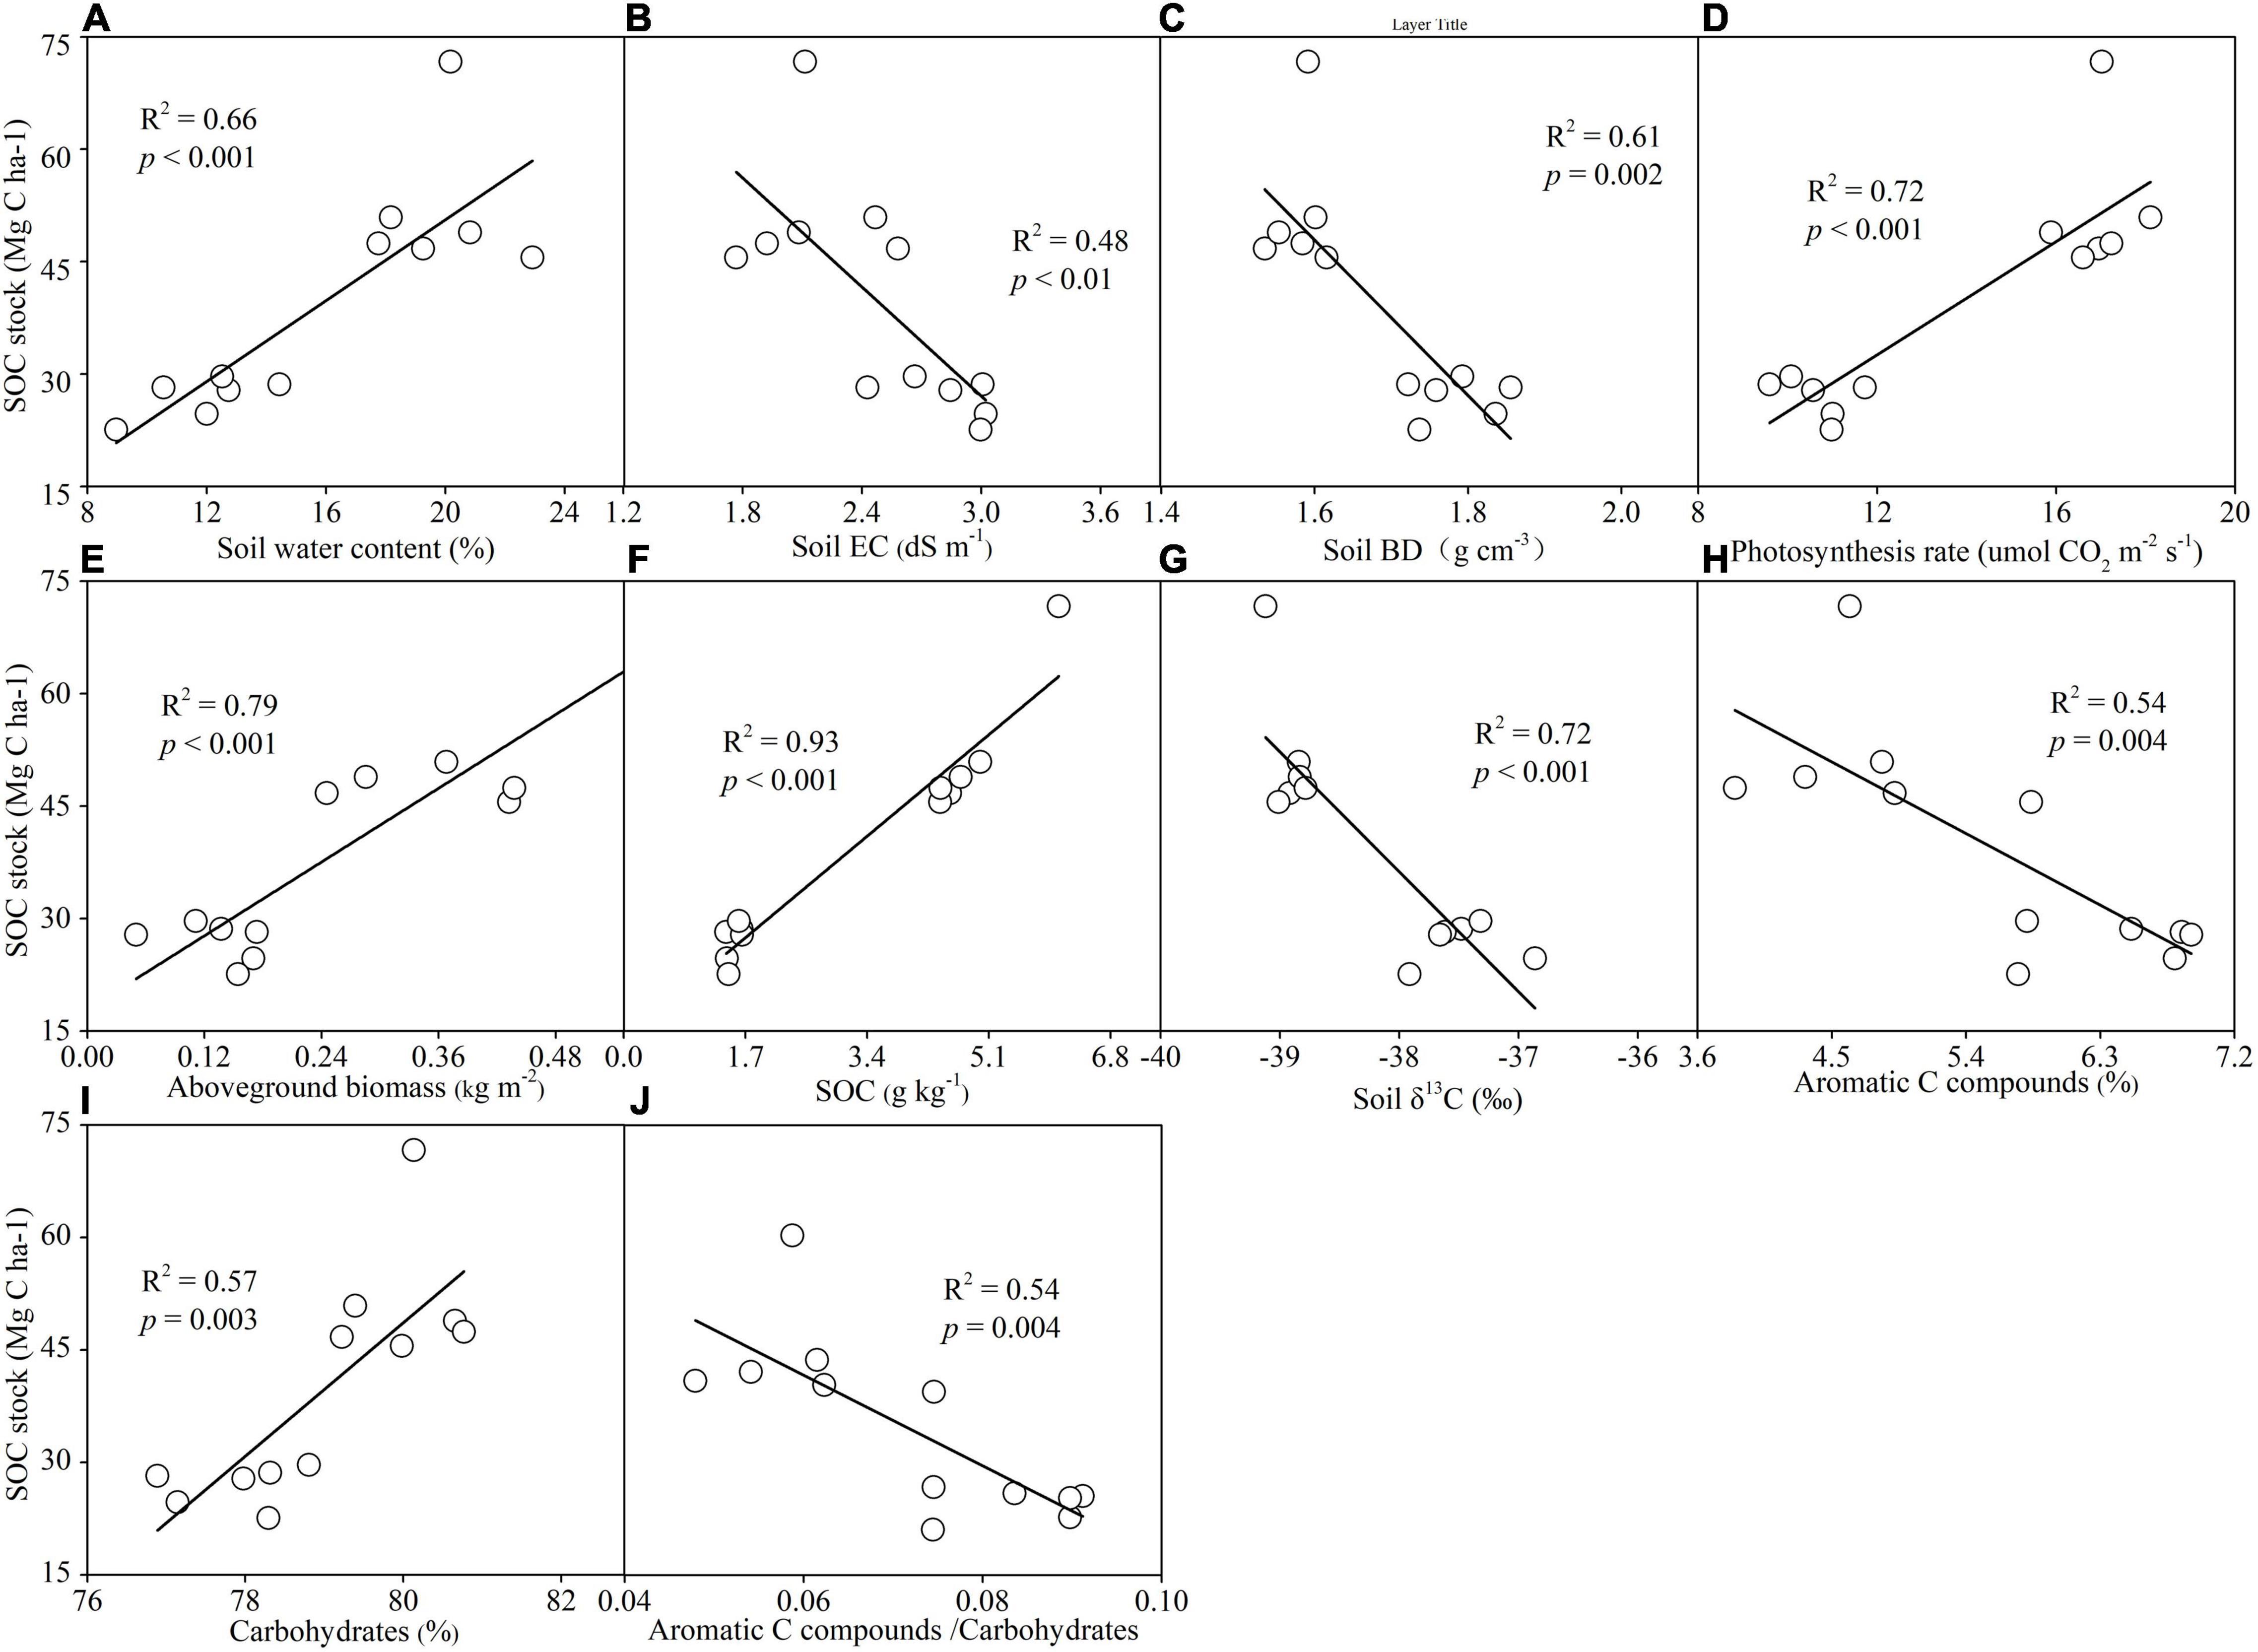
Figure 7. The relationships of soil organic C (SOC) stocks with soil properties (weighted average of 0–100 cm) and plant properties in degraded and recovering wetlands. Soil properties include soil water content (A), soil EC (B), soil BD (C), photosynthesis rate (D), aboveground biomass (E), SOC (F), soil δ13C (G), aromatic C compounds (H), carbohydrates (I), and aromatic C compounds/carbohydrates (J).
Discussion
Impacts of Wetland Degradation and Restoration on Aboveground C Stocks
Our study found that aboveground C stocks in recovering wetland (1.67 Mg C ha–1) was approximately three times of aboveground C stocks in degraded wetland (0.56 Mg C ha–1). This finding indicates that wetland restoration can recover and enhance plant C sequestration (Renzi et al., 2019; Sapkota and White, 2020).
The aboveground C stocks are originated from plant C content and aboveground biomass (Dayathilake et al., 2020). In this study, aboveground C stocks were tightly related with aboveground biomass and slightly associated with the plant C content, suggesting aboveground biomass was the predominant factor driving aboveground C stocks in degraded and recovering wetlands (Sharma et al., 2020). The prior studies have reported that the shift in aboveground biomass is ascribed to varied biotic and abiotic factors, such as soil water level, salinity, nutrient, and plant photosynthesis (Hayes et al., 2017; Zhai et al., 2022).
In degraded wetland, the increased soil environmental stress, such as low water availability and high salinity, restrains plant growth, development, and physiological characteristics (Cui et al., 2018). Water deficit and salinity stress influence plant productivity via the following two reasons: one is to control seedling germination and the other is to regulate CO2 assimilation of vegetation leaf (Ma et al., 2020). Under drought and salinity stress, the first response of vegetation is a decline in seedling germination and, subsequently, the reduction in plant growth, which negatively affects aboveground biomass. In addition, drought and salinity stress can impact leaf physiological characteristics to keep vegetation adaption in the severe environmental conditions (Munns et al., 2020). For example, the low stomatal conductance in degraded wetland (Supplementary Figure 1b) suppresses CO2 into leaf intercellular spaces, thus reducing plant CO2 assimilation and the photosynthesis rate (also represented by natural plant δ13C), subsequently resulting in low plant productivity and C sequestration.
Soil nutrients are also the key and limited factors driving plant productivity (Hayes et al., 2017). Wetland degradation leads to a large amount of soil nutrient loss due to increased surface SOM decomposition, wind erosion, or water erosion, exacerbating wetland nutrient limitation (Song et al., 2014; Wu et al., 2021). In our degraded wetland, soil N content was so scarce, which cannot satisfy plant N requirement. Low N availability held low plant productivity and showed negative feedback to wetland C sequestration.
In contrast to degraded wetland, recovering wetland sequestered more C in aboveground vegetation, which was ascribed to the improving soil conditions and plant physiological characteristics. The increasing soil water and nutrient level stimulate the vegetation growth, metabolism, and development associated with strong photosynthetic C assimilation, causing higher aboveground biomass in recovering wetland, exhibiting a positive feedback to wetland C stocks (Zhao et al., 2016; Dronova et al., 2021).
Impacts of Wetland Degradation and Restoration on SOC Stocks
Wetland soils contain a large amount of organic C, which generally serves as C sinks due to the slow decomposition rate of SOM (Stagg et al., 2018). However, wetland disturbances, such as human activities, result in wetland degradation, inducing soil C loss by increased surface SOM decomposition or erosion (Kirwan and Megonigal, 2013; Baustian et al., 2021). In our study, roads built for oil exploitation led to wetland degradation of P. australis. The degraded wetland stored SOC stocks of 26.94 Mg C ha–1 in top soil 100 cm, approximately less than two times of recovering wetland SOC stocks (51.86 Mg C ha–1). Compared with recovering wetland, degraded wetland substantially diminished SOC stocks, especially at a soil depth of 0-40 cm. The dynamics of SOC stocks in degraded and recovering wetlands suggest that wetland degradation induces substantial loss of SOC, and recovering the degraded wetland and protecting the existing wetlands are the effective approaches to restore and enhance C reservoir in wetland soils.
The variations of SOC stocks in degraded and recovering wetlands are likely due to the restoration of water and vegetation (Zhao et al., 2018). After wetland restoration, freshwater input increases the flooding period of wetland that led to more SOC retention in anaerobic soils because of the constrained SOM decomposition by microorganisms (Keller et al., 2015). Previous studies have reported that vegetation restoration can promote SOC accumulation (Chu et al., 2019). Wetland SOC storage originated from enhanced plant production is mainly through two pathways, namely, (1) more inputs of aboveground plant litter or (2) increased input of photosynthetic C via root excretion (Billah et al., 2022). These are supported by our finding that SOC stocks were tightly associated with the aboveground biomass and leaf photosynthesis rate. Recovering wetland had high available water and nitrogen supply to plant, stimulating plant growth, and subsequently contributing SOC pool through dead aboveground plant residues (Li et al., 2022). In addition, decreased soil salinity stress can relieve the salinity effect on leaf physiology, such as the increase in stomatal conductance, which induces more plant CO2 fixation (Cui et al., 2018). Combined with high available water and nitrogen supply, vegetation in recovering wetland showed a higher photosynthesis rate, releasing more C into soils via root exudates, and thus enhancing SOC stocks. Compared with degraded wetland, recovering wetland substantially increased SOC stocks, especially at a soil depth of 0–40 cm (mainly root active layers), indicating that aboveground vegetation plays an important role in regulating SOC accumulation and restoration.
We observed that the changes in SOC quality (represented by specifically spectral peak of mid-IR) can influence SOC stocks in degraded and recovering wetlands (Yang et al., 2022). SOC stocks were positively associated with carbohydrates and negatively with aromatic C compounds and ratio of aromatic C compounds to carbohydrates. These correlations suggest that a greater proportion of carbohydrates in soils increases SOC storage. The aromatic C compounds are relatively stable and recalcitrant SOM compounds, which mainly are originated from plant residues (Suseela et al., 2013). Carbohydrates, as labile SOM compounds, are derived from root exudates (Shao et al., 2021). Although the aboveground plant residues input increases the aromatic C compound, the ratio of aromatic C compounds to carbohydrates is lower in recovering wetland than in degraded wetland. The increased photosynthesis rate of recovering wetlands continuously input C of low molecular weight (e.g., glucose, fructose, and sucrose), performing great contribution to SOC storage. In addition, low natural 13C isotope can represent high photosynthetic C retention in soils (Xia et al., 2021), which further corroborates the impact of carbohydrates on SOC stocks in recovering wetland, especially in topsoil of 40 cm. The shifts in the SOC quality (e.g., carbohydrates, aromatic C compounds) and their tight relationships suggest that the SOC quality is also the major driver of belowground C retention and storage.
Soil BD is a comprehensive proxy to indicate soil structure, reflect soil compaction, porosity, and fertility, and play a crucial role in affecting SOC stocks (Zhao et al., 2018). The negative relationship between SOC stocks and BD was observed under wetland degradation and restoration. Although wetland degradation increased soil BD, SOC concentration of 40 cm is substantially lower compared with that in recovering wetland. Wetland degradation results in a large amount of SOC loss due to low plant productivity and surface soil erosion (Baustian et al., 2021). The lower SOC concentration amplifies its negative effect on SOC stocks, leading to the negative feedback of BD to SOC stocks in degraded wetland.
Effects of Plant-Soil Interactions on Wetland C Stocks
Our study illustrated that biotic (i.e., aboveground biomass and photosynthetic C) and abiotic (i.e., soil water, salinity, SOC, and N contents) factors predominately determine wetland C stocks, including aboveground C stocks and SOC stocks. Soil and plant parameters do not separately influence SOC stocks, whereas plant-soil interaction mediates wetland C stocks in degraded and recovering wetlands. The conversion between disturbed wetland and protected wetland results in the shifts of plant community that is a key linkage of above- and belowground ecosystems (Xu S. et al., 2019). On the one hand, dead plant residues and root exudates supply C and nutrients to soils, persisting in soils in the form of SOM through mineral associations or aggregate occlusion (Maietta et al., 2019), and then contributing SOC stocks. On the other hand, the new C input, especially photosynthetic C, primes the SOM decomposition to release nutrients to the plant (Chen et al., 2019). The nutrient recycling promotes the plant growth and photosynthetic C fixation, enhancing aboveground C stocks. Therefore, we revealed that plant-soil interactions and their feedbacks to fluctuant wetland ecosystems play an important role in regulating SOC cycling and storage.
Conclusion
Our study demonstrates that wetland restoration is expected to be an efficient approach to offset C loss resulting from wetland degradation. Wetland restoration contained higher aboveground C stocks and SOC stocks, which of the summary was approximately two times of degraded wetland C stocks. We observed that the restoration of water, nutrient, and vegetation were the key factors to enhance the sequestration and storage of organic C above- and belowground in recovering wetland, tightly associated with high photosynthetic C fixation in plant (represented by aboveground biomass) and photosynthetic C input to soils (represented by soil natural δ13C and carbohydrates). We suggested that plant–soil interactions and their feedbacks to environmental change need to be considered to evaluate SOC stocks in wetlands.
Data Availability Statement
The raw data supporting the conclusions of this article will be made available by the authors, without undue reservation.
Author Contributions
PS analyzed the data and wrote the manuscript. HH helped perform statistical analyses. HY, TL, DZ, JM, and DD helped collect soil samples. JS supervised the writing of this manuscript. All authors contributed to the article and approved the submitted version.
Funding
This work was supported by the Natural Science Foundation of Shandong Province (ZR2020QD004 and ZR2020QC040) and the National Natural Science Foundation of China (32101387, 41971119, and 42171059).
Conflict of Interest
The authors declare that the research was conducted in the absence of any commercial or financial relationships that could be construed as a potential conflict of interest.
Publisher’s Note
All claims expressed in this article are solely those of the authors and do not necessarily represent those of their affiliated organizations, or those of the publisher, the editors and the reviewers. Any product that may be evaluated in this article, or claim that may be made by its manufacturer, is not guaranteed or endorsed by the publisher.
Supplementary Material
The Supplementary Material for this article can be found online at: https://www.frontiersin.org/articles/10.3389/fevo.2022.856479/full#supplementary-material
References
Baustian, M. M., Stagg, C. L., Perry, C. L., Moss, L. C., and Carruthers, T. J. (2021). Long-term carbon sinks in marsh soils of coastal Louisiana are at risk to wetland loss. J. Geophys. Res. Biogeosci. 126:e2020JG005832. doi: 10.1029/2020JG005832
Billah, M. M., Bhuiyan, M. K. A., Islam, M. A., Das, J., and Hoque, A. (2022). Salt marsh restoration: an overview of techniques and success indicators. Environ. Sci. Pollut. Res. 29, 15347–15363. doi: 10.1007/s11356-021-18305-5
Chen, L., Liu, L., Qin, S., Yang, G., Fang, K., Zhu, B., et al. (2019). Regulation of priming effect by soil organic matter stability over a broad geographic scale. Nat. Commun. 10:5112. doi: 10.1038/s41467-019-13119-z
Chu, X., Han, G., Xing, Q., Xia, J., Sun, B., Li, X., et al. (2019). Changes in plant biomass induced by soil moisture variability drive interannual variation in the net ecosystem CO2 exchange over a reclaimed coastal wetland. Agric. For. Meteorol. 264, 138–148. doi: 10.1016/j.agrformet.2018.09.013
Crooks, S., Sutton-Grier, A. E., Troxler, T. G., Herold, N., Bernal, B., Schile-Beers, L., et al. (2018). Coastal wetland management as a contribution to the US National Greenhouse Gas Inventory. Nat. Clim. Change 8, 1109–1112. doi: 10.1038/s41558-018-0345-0
Cui, L., Li, G., Ouyang, N., Mu, F., Yan, F., Zhang, Y., et al. (2018). Analyzing coastal wetland degradation and its key restoration technologies in the coastal area of Jiangsu, China. Wetlands 38, 525–537. doi: 10.1007/s13157-018-0997-6
Dayathilake, D. D. T. L., Lokupitiya, E., and Wijeratne, V. P. I. S. (2020). Estimation of aboveground and belowground carbon stocks in urban freshwater wetlands of Sri Lanka. Carbon Balance Manage. 15:17. doi: 10.1186/s13021-020-00152-5
Dronova, I., Taddeo, S., Hemes, K. S., Knox, S. H., Valach, A., Oikawa, P. Y., et al. (2021). Remotely sensed phenological heterogeneity of restored wetlands: linking vegetation structure and function. Agric. For. Meteorol. 296:108215. doi: 10.1016/j.agrformet.2020.108215
Duarte, C. M., Losada, I. J., Hendriks, I. E., Mazarrasa, I., and Marbà, N. (2013). The role of coastal plant communities for climate change mitigation and adaptation. Nat. Clim. Change 3, 961–968. doi: 10.1038/nclimate1970
Guan, B., Yu, J., Hou, A., Han, G., Wang, G., Qu, F., et al. (2017). The ecological adaptability of Phragmites australis to interactive effects of water level and salt stress in the Yellow River Delta. Aquat. Ecol. 51, 107–116. doi: 10.1007/s10452-016-9602-3
Hayes, M. A., Jesse, A., Tabet, B., Reef, R., Keuskamp, J. A., and Lovelock, C. E. (2017). The contrasting effects of nutrient enrichment on growth, biomass allocation and decomposition of plant tissue in coastal wetlands. Plant Soil 416, 193–204. doi: 10.1007/s11104-017-3206-0
Herbert, E. R., Boon, P., Burgin, A. J., Neubauer, S. C., Franklin, R. B., Ardón, M., et al. (2015). A global perspective on wetland salinization: ecological consequences of a growing threat to freshwater wetlands. Ecosphere 6, 1–43. doi: 10.1890/ES14-00534.1
Keller, J. K., Anthony, T., Clark, D., Gabriel, K., Gamalath, D., Kabala, R., et al. (2015). Soil organic carbon and nitrogen storage in two southern California salt marshes: the role of pre-restoration vegetation. Bull. South. Calif. Acad. Sci. 114, 22–32.
Kirwan, M. L., and Megonigal, J. P. (2013). Tidal wetland stability in the face of human impacts and sea-level rise. Nature 504, 53–60. doi: 10.1038/nature12856
Li, J., Han, G., Wang, G., Liu, X., Zhang, Q., Chen, Y., et al. (2022). Imbalanced nitrogen–phosphorus input alters soil organic carbon storage and mineralisation in a salt marsh. Catena 208:105720. doi: 10.1016/j.catena.2021.105720
Ma, Y., Dias, M. C., and Freitas, H. (2020). Drought and salinity stress responses and microbe-induced tolerance in plants. Front. Plant Sci. 11:591911. doi: 10.3389/fpls.2020.591911
Ma, Z., Zhang, M., Xiao, R., Cui, Y., and Yu, F. (2017). Changes in soil microbial biomass and community composition in coastal wetlands affected by restoration projects in a Chinese delta. Geoderma 289, 124–134. doi: 10.1016/j.geoderma.2016.11.037
Maietta, C. E., Bernstein, Z. A., Gaimaro, J. R., Buyer, J. S., Rabenhorst, M. C., Monsaint-Queeney, V. L., et al. (2019). Aggregation but not organo-metal complexes contributed to C storage in tidal freshwater wetland soils. Soil Sci. Soc. Am. J. 183, 252–265. doi: 10.2136/sssaj2018.05.0199
Munns, R., Day, D. A., Fricke, W., Watt, M., Arsova, B., Barkla, B. J., et al. (2020). Energy costs of salt tolerance in crop plants. New Phytol. 225, 1072–1090. doi: 10.1111/nph.15864
Orth, R. J., Lefcheck, J. S., McGlathery, K. S., Aoki, L., Luckenbach, M. W., Moore, K. A., et al. (2020). Restoration of seagrass habitat leads to rapid recovery of coastal ecosystem services. Sci. Adv. 6:eabc6434. doi: 10.1126/sciadv.abc6434
Renzi, J. J., He, Q., and Silliman, B. R. (2019). Harnessing positive species interactions to enhance coastal wetland restoration. Front. Ecol. Evol. 7:131. doi: 10.3389/fevo.2019.00131
Sapkota, Y., and White, J. R. (2020). Carbon offset market methodologies applicable for coastal wetland restoration and conservation in the United States: a review. Sci. Total Environ. 701:134497. doi: 10.1016/j.scitotenv.2019.134497
Servais, S., Kominoski, J. S., Charles, S. P., Gaiser, E. E., Mazzei, V., Troxler, T. G., et al. (2019). Saltwater intrusion and soil carbon loss: testing effects of salinity and phosphorus loading on microbial functions in experimental freshwater wetlands. Geoderma 337, 1291–1300. doi: 10.1016/j.geoderma.2018.11.013
Shao, P., Liang, C., Rubert-Nason, K., Li, X., Xie, H., and Bao, X. (2019). Secondary successional forests undergo tightly-coupled changes in soil microbial community structure and soil organic matter. Soil Biol. Biochem. 128, 56–65. doi: 10.1016/j.soilbio.2018.10.004
Shao, P., Lynch, L., Xie, H., Bao, X., and Liang, C. (2021). Tradeoffs among microbial life history strategies influence the fate of microbial residues in subtropical forest soils. Soil Biol. Biochem. 153:108112.
Sharma, S., MacKenzie, R. A., Tieng, T., Soben, K., Tulyasuwan, N., Resanond, A., et al. (2020). The impacts of degradation, deforestation and restoration on mangrove ecosystem carbon stocks across Cambodia. Sci. Total Environ. 706:135416. doi: 10.1016/j.scitotenv.2019.135416
Song, K., Wang, Z., Du, J., Liu, L., Zeng, L., and Ren, C. (2014). Wetland degradation: its driving forces and environmental impacts in the Sanjiang Plain, China. Environ. Manage. 54, 255–271. doi: 10.1007/s00267-014-0278-y
Spivak, A. C., Sanderman, J., Bowen, J. L., Canuel, E. A., and Hopkinson, C. S. (2019). Global-change controls on soil-carbon accumulation and loss in coastal vegetated ecosystems. Nat. Geosci. 12, 685–692. doi: 10.1038/s41561-019-0435-2
Stagg, C. L., Baustian, M. M., Perry, C. L., Carruthers, T. J., and Hall, C. T. (2018). Direct and indirect controls on organic matter decomposition in four coastal wetland communities along a landscape salinity gradient. J. Ecol. 106, 655–670. doi: 10.1111/1365-2745.12901
Suseela, V., Tharayil, N., Xing, B., and Dukes, J. S. (2013). Labile compounds in plant litter reduce the sensitivity of decomposition to warming and altered precipitation. New Phytol. 200, 122–133. doi: 10.1111/nph.12376
Wu, Y., Xu, N., Wang, H., Li, J., Zhong, H., Dong, H., et al. (2021). Variations in the diversity of the soil microbial community and structure under various categories of degraded wetland in Sanjiang Plain, northeastern China. Land Degrad. Dev. 32, 2143–2156. doi: 10.1002/ldr.3872
Xia, S., Song, Z., Li, Q., Guo, L., Yu, C., Singh, B. P., et al. (2021). Distribution, sources, and decomposition of soil organic matter along a salinity gradient in estuarine wetlands characterized by C: N ratio, δ13C−δ15N, and lignin biomarker. Glob. Change Biol. 27, 417–434. doi: 10.1111/gcb.15403
Xiao, D., Deng, L., Kim, D. G., Huang, C., and Tian, K. (2019). Carbon budgets of wetland ecosystems in China. Glob. Change Biol. 25, 2061–2076. doi: 10.1111/gcb.14621
Xu, S., Liu, X., Li, X., and Tian, C. (2019). Soil organic carbon changes following wetland restoration: a global meta-analysis. Geoderma 353, 89–96.
Xu, W., Fan, X., Ma, J., Pimm, S. L., Kong, L., Zeng, Y., et al. (2019). Hidden loss of wetlands in China. Curr. Biol. 29, 3065–3071. doi: 10.1016/j.cub.2019.07.053
Yang, R., Wang, L., Chen, L., and Zhang, Z. (2022). Assessment of soil quality using VIS–NIR spectra in invaded coastal wetlands. Environ. Earth Sci. 81:19.
Zhai, Z., Luo, M., Yang, Y., Liu, Y., Chen, X., Zhang, C., et al. (2022). Trade-off between microbial carbon use efficiency and microbial phosphorus limitation under salinization in a tidal wetland. Catena 209:105809. doi: 10.1016/j.catena.2021.105809
Zhao, Q., Bai, J., Huang, L., Gu, B., Lu, Q., and Gao, Z. (2016). A review of methodologies and success indicators for coastal wetland restoration. Ecol. Indic. 60, 442–452.
Keywords: wetland C stocks, aboveground biomass, soil organic carbon, wetland degradation, wetland restoration
Citation: Shao P, Han H, Yang H, Li T, Zhang D, Ma J, Duan D and Sun J (2022) Responses of Above- and Belowground Carbon Stocks to Degraded and Recovering Wetlands in the Yellow River Delta. Front. Ecol. Evol. 10:856479. doi: 10.3389/fevo.2022.856479
Received: 17 January 2022; Accepted: 28 January 2022;
Published: 24 February 2022.
Edited by:
Guangxuan Han, Yantai Institute of Coastal Zone Research (CAS), ChinaCopyright © 2022 Shao, Han, Yang, Li, Zhang, Ma, Duan and Sun. This is an open-access article distributed under the terms of the Creative Commons Attribution License (CC BY). The use, distribution or reproduction in other forums is permitted, provided the original author(s) and the copyright owner(s) are credited and that the original publication in this journal is cited, in accordance with accepted academic practice. No use, distribution or reproduction is permitted which does not comply with these terms.
*Correspondence: Jingkuan Sun, c3VuamluZ2t1YW5AYnp1LmVkdS5jbg==
 Pengshuai Shao
 Hongyan Han
 Hongjun Yang
 Tian Li