 Haofan Wang
 Zhihong Liu1
 Kai Wu
 Yang Zhang
95% of researchers rate our articles as excellent or good
Learn more about the work of our research integrity team to safeguard the quality of each article we publish.
Find out more
ORIGINAL RESEARCH article
Front. Ecol. Evol. , 31 May 2022
Sec. Interdisciplinary Climate Studies
Volume 10 - 2022 | https://doi.org/10.3389/fevo.2022.845801
This article is part of the Research Topic Air Pollution and Climate Change: Interactions and Co-mitigation View all 18 articles
Rapid urbanization has the potential to fundamentally perturb energy budget and alter urban air quality. While it is clear that urban meteorological parameters are sensitive to urbanization-induced changes in landscapes, a gap exists in our knowledge about how changes in land use and land cover affect the dynamics of urban air quality. Herein, we simulated a severe O3 episode (10–16 July 2017) and a highly polluted PM2.5 episode (25–30 December 2017) and assessed the changes of meteorological phenomenon and evolution of air pollutants induced by urbanization. We found that the urban expansion area (i.e., land use transition from natural to urban surfaces between 2000 and 2017, UEA) has a significant increase in nocturnal 2-m temperature (T2) with maximum values reaching 3 and 4°C in summer and winter, respectively. In contrast, UEA experienced cooling in the daytime with stronger reductions of T2 in winter than in summer. The T2 variability is primarily attributed to the intense thermal inertia and high heat capacity of the urban canopy and the shadowing effect caused by urbanization. Owing to increased surface roughness and decreased surface albedo as well as shadowing effects, the ventilation index (VI) of UEA increased up to 1,200 m2/s in winter while decreased up to 950 m2/s in summer. Changes in meteorological phenomenon alter physical and chemical processes associated with variations in PM2.5 and O3 concentrations. Urbanization leads to enhanced vertical advection process and weakened aerosol production, subsequently causing PM2.5 levels to decrease by 33.2 μg/m3 during the day and 4.6 μg/m3 at night, respectively. Meanwhile, O3 levels increased by 61.4 μg/m3 at 20:00 due to the reduction of horizontal advection induced by urbanization, while O3 concentrations changed insignificantly at other times. This work provides valuable insights into the effects of urbanization on urban meteorology and air quality over typical megacities, which support informed decision-making for urban heat and air pollution mitigation.
Urbanization is an ubiquitous trend worldwide driven by rapid industrialization and socioeconomic development. More than 60% of the world population resided in urban areas in 2018 and it is projected to increase by 80% by 2030 (Grimm et al., 2008; Seto et al., 2012). Since 2000s, environmental issues including heatwaves, flooding, and poor air quality accompanied by urbanization have become public concerns which puts the environmental quality of cities under pressure (Fang et al., 2022). In particular, air pollution featured by high levels of ozone and particulate matter is recognized as a major environmental issue in highly urbanized megacities and city clusters in Asia. Urbanization leads to dramatic land use and land cover (LULC) alteration, which generally results in lower albedo, higher roughness, and higher thermal inertia (Fan et al., 2017). These changes could significantly impact surface energy budget and further influence regional meteorology (Vahmani and Hogue, 2014). Moreover, the street canyon and the gaps between buildings change the radiative forcing (Vahmani and Ban-Weiss, 2016). Changes in radiative forcing can lead to changes in near-surface temperatures, affecting the dispersion of pollutants and having a profound impact on air quality (Vahmani et al., 2016).
Prior studies that examine urbanization effects on local and regional-scale city environment were generally based on coupled urban canopy models (UCM) to mesoscale weather forecast models and air quality models (Lin et al., 2016; Lian et al., 2018). Over Los Angeles, Li et al. (2019) used WRF-Chem model to explore the effects of urbanization on meteorology and air quality and reported that nighttime 2-m temperature (T2) rise by up to 1.7°C and PM2.5 concentrations fall by up to 2.5 μg/m3 at night. In South Korea, Kim et al. (2021) found that urbanization in metropolitan Ulsan caused PM10 concentrations drop by up to 3 μg/m3 and 5 μg/m3 in the daytime and nighttime, respectively. Wang K. et al. (2021) found that LULC change in the Beijing-Tianjin-Hebei region had significant effects on meteorological conditions and air quality at urban stations, and UCM can improve the performance of meteorological simulation. With a focus on the Yangtze River Delta (YRD) in eastern China, Liao et al. (2014) investigated the performance of different urban canopy models in YRD by WRF-Chem model and pointed out that urbanization process significantly influences wind speeds (reduced by 0.7–2.6 m/s) across YRD. For Sichuan Basin situated in western China, Wang H. et al. (2021) found that increased roughness had a significant effect on reducing near-surface wind speeds, leading to the accumulation of PM2.5 in urban areas of Chengdu. In prior work, only a few studies have focused on identifying the land cover changes over Chengdu based on satellite image and examined the variations of meteorological parameters over time, while modeling assessment on meteorology and air quality changes attributed to urbanization has been rarely conducted, which limits the understanding of environmental consequences induced by urbanization over time (Yang et al., 2020a).
Chengdu is the capital city of Sichuan province with 16.7 million residents and suffers from severe O3 pollution in summer and experiences episodes of PM2.5 pollution in winter (Yang et al., 2020b; Wu et al., 2021). Substantial anthropogenic emissions of oxides of nitrogen (NOx), primary PM2.5, and volatile organic compounds (VOCs) are emitted from on-road vehicles and industrial infrastructures, significantly contributing to the formation of O3 and PM2.5 in urban areas (Wu et al., 2022). Based on inventory analysis, the Sichuan Academy of Environmental Sciences (SCAES) estimated that emissions of NOx, primary PM2.5, and volatile organic compounds (VOCs) over Chengdu in 2017 were 140 × 106, 70 × 106, and 160 × 106 kg, respectively (Xu et al., 2020). Therefore, it is of utmost importance to quantify the magnitude changes of meteorological phenomenon and air quality attributed to rapid urbanization in Chengdu, the typical basin city located on western China.
In this study, we explicitly address the impacts of urbanization on meteorology and air quality by integrating urban canopy model within the WRF-CMAQ modeling system over Chengdu city. The model framework includes historical and current urban land cover datasets obtained from Moderate Resolution Imaging Spectroradiometer (MODIS) in combination with advanced urban parameterizations. Comparisons of meteorological parameters and air pollutants levels are made between model simulations configured with different land use and land cover data from MODIS. The findings of this work are useful in improving understanding on how urbanization modulate various aspects of meteorology and subsequently influence urban environment.
The WRFv4.1.1 model (Salamanca et al., 2011; Skamarock et al., 2019) and the CMAQv5.3.1 model (Appel et al., 2021), are both compiled and operated on a server with Linux environment. WRFv4.1.1 model was used to simulate meteorological conditions with meteorological initial and boundary conditions taken from NCEP 1° × 1° Final (FNL) reanalysis dataset. As shown in Figure 1, three nested domains were adopted with horizontal resolutions of 27, 9, and 3 km, respectively. The outermost domain covers southwest China and the innermost domain focuses on Chengdu. The physical parameterizations configured to be used in WRF are listed in Table 1. CMAQv5.3.1 was driven by meteorological fields provided by WRF to model trace gases and aerosols. The initial and boundary conditions for CMAQ were derived from the default profiles which represent a clean atmosphere. BVOC emissions were calculated by The Model of Emissions of Gases and Aerosols from Nature version 2.1 (MEGANv2.1) (Guenther et al., 2012; Wu et al., 2020). CMAQ was configured with the Carbon Bond chemical mechanism (CB06) and AERO6. The model simulation was performed over a 15 days period from 1 July 2017 to 16 July 2017 (summer period), which covers the evolution of a typical summertime O3 episode in Chengdu and a 15 days period from 15 January 2017 to 30 January 2017 (winter period), which covers the evolution of a typical wintertime PM2.5 episode in Chengdu. To reduce bias from meteorological drift, the first 10 days in both simulations were treated as spin-up and were not analyzed in this study.
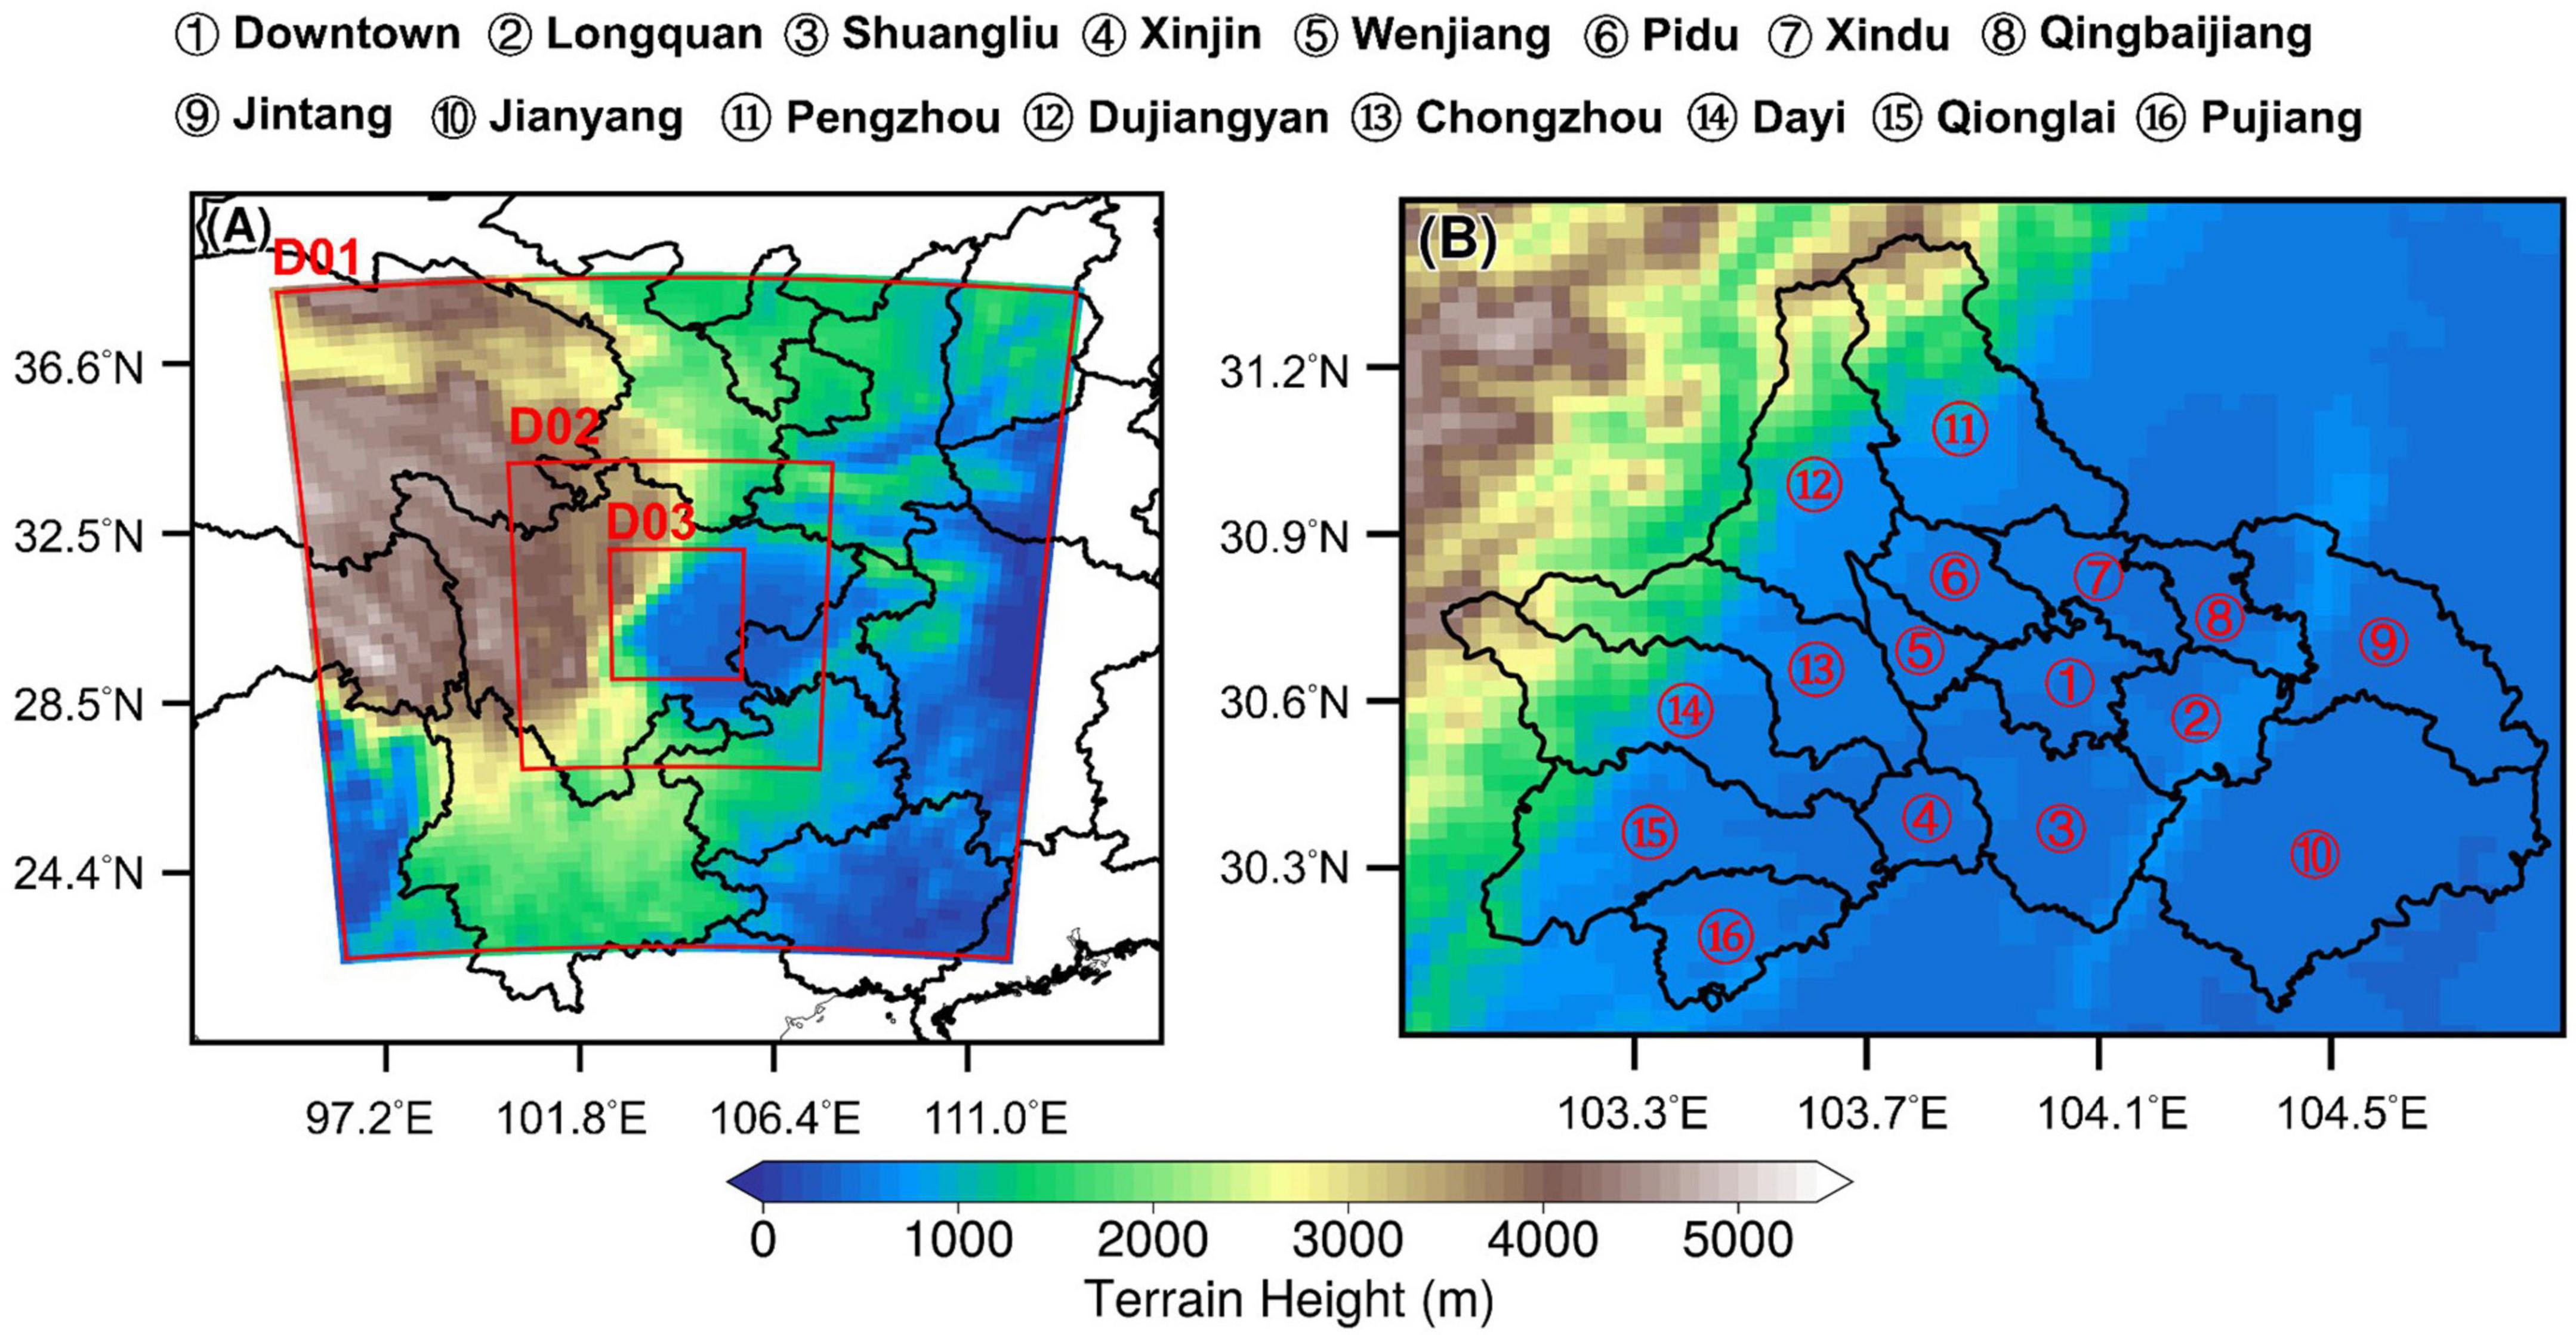
Figure 1. Terrain map of the triple nested model domain (A) and subdistricts in Chengdu (B).
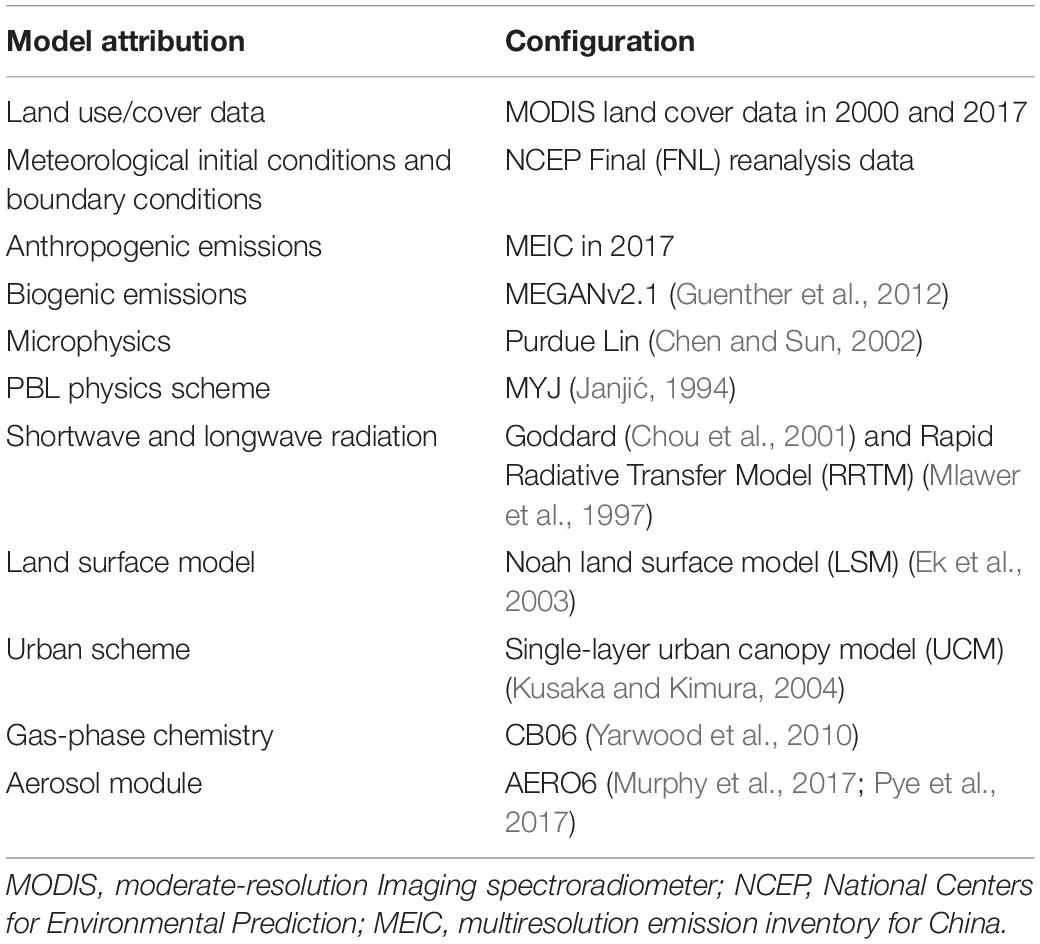
Table 1. Summary of configurations in WRF-CMAQ modeling system.
To probe the magnitude change modulated by advection, deposition, and chemical production/loss changes, process analysis module (PA) in the CMAQ model is activated in simulations (Yang et al., 2021). The physical and chemical processes in PA includes vertical advection (ZADV), horizontal advection (HADV), horizontal diffusion (HDIF), vertical diffusion (VDIF), primary emissions (EMIS), dry deposition (DDEP), cloud processes (CLDS), gas-phase chemistry (CHEM), and aerosol processes (AERO).
To investigate the impact of land use and land cover changes induced by urbanization on regional meteorology and air quality over Chengdu, we conducted WRF-UCM-CMAQ simulations with two scenarios: 2000 LULC and 2017 LULC. The LULC data was obtained from the MODIS MCD12Q1 product. As seen in Figure 2, the urban areas of metropolitan Chengdu significantly expanded and there are considerable transitions from suburban areas to urban areas from 2000 to 2017, reflecting the rapid urbanization processes that occurred in Chengdu. The obvious changes between these two scenarios could result in changes in land surface properties and influence BVOC emissions from vegetation.
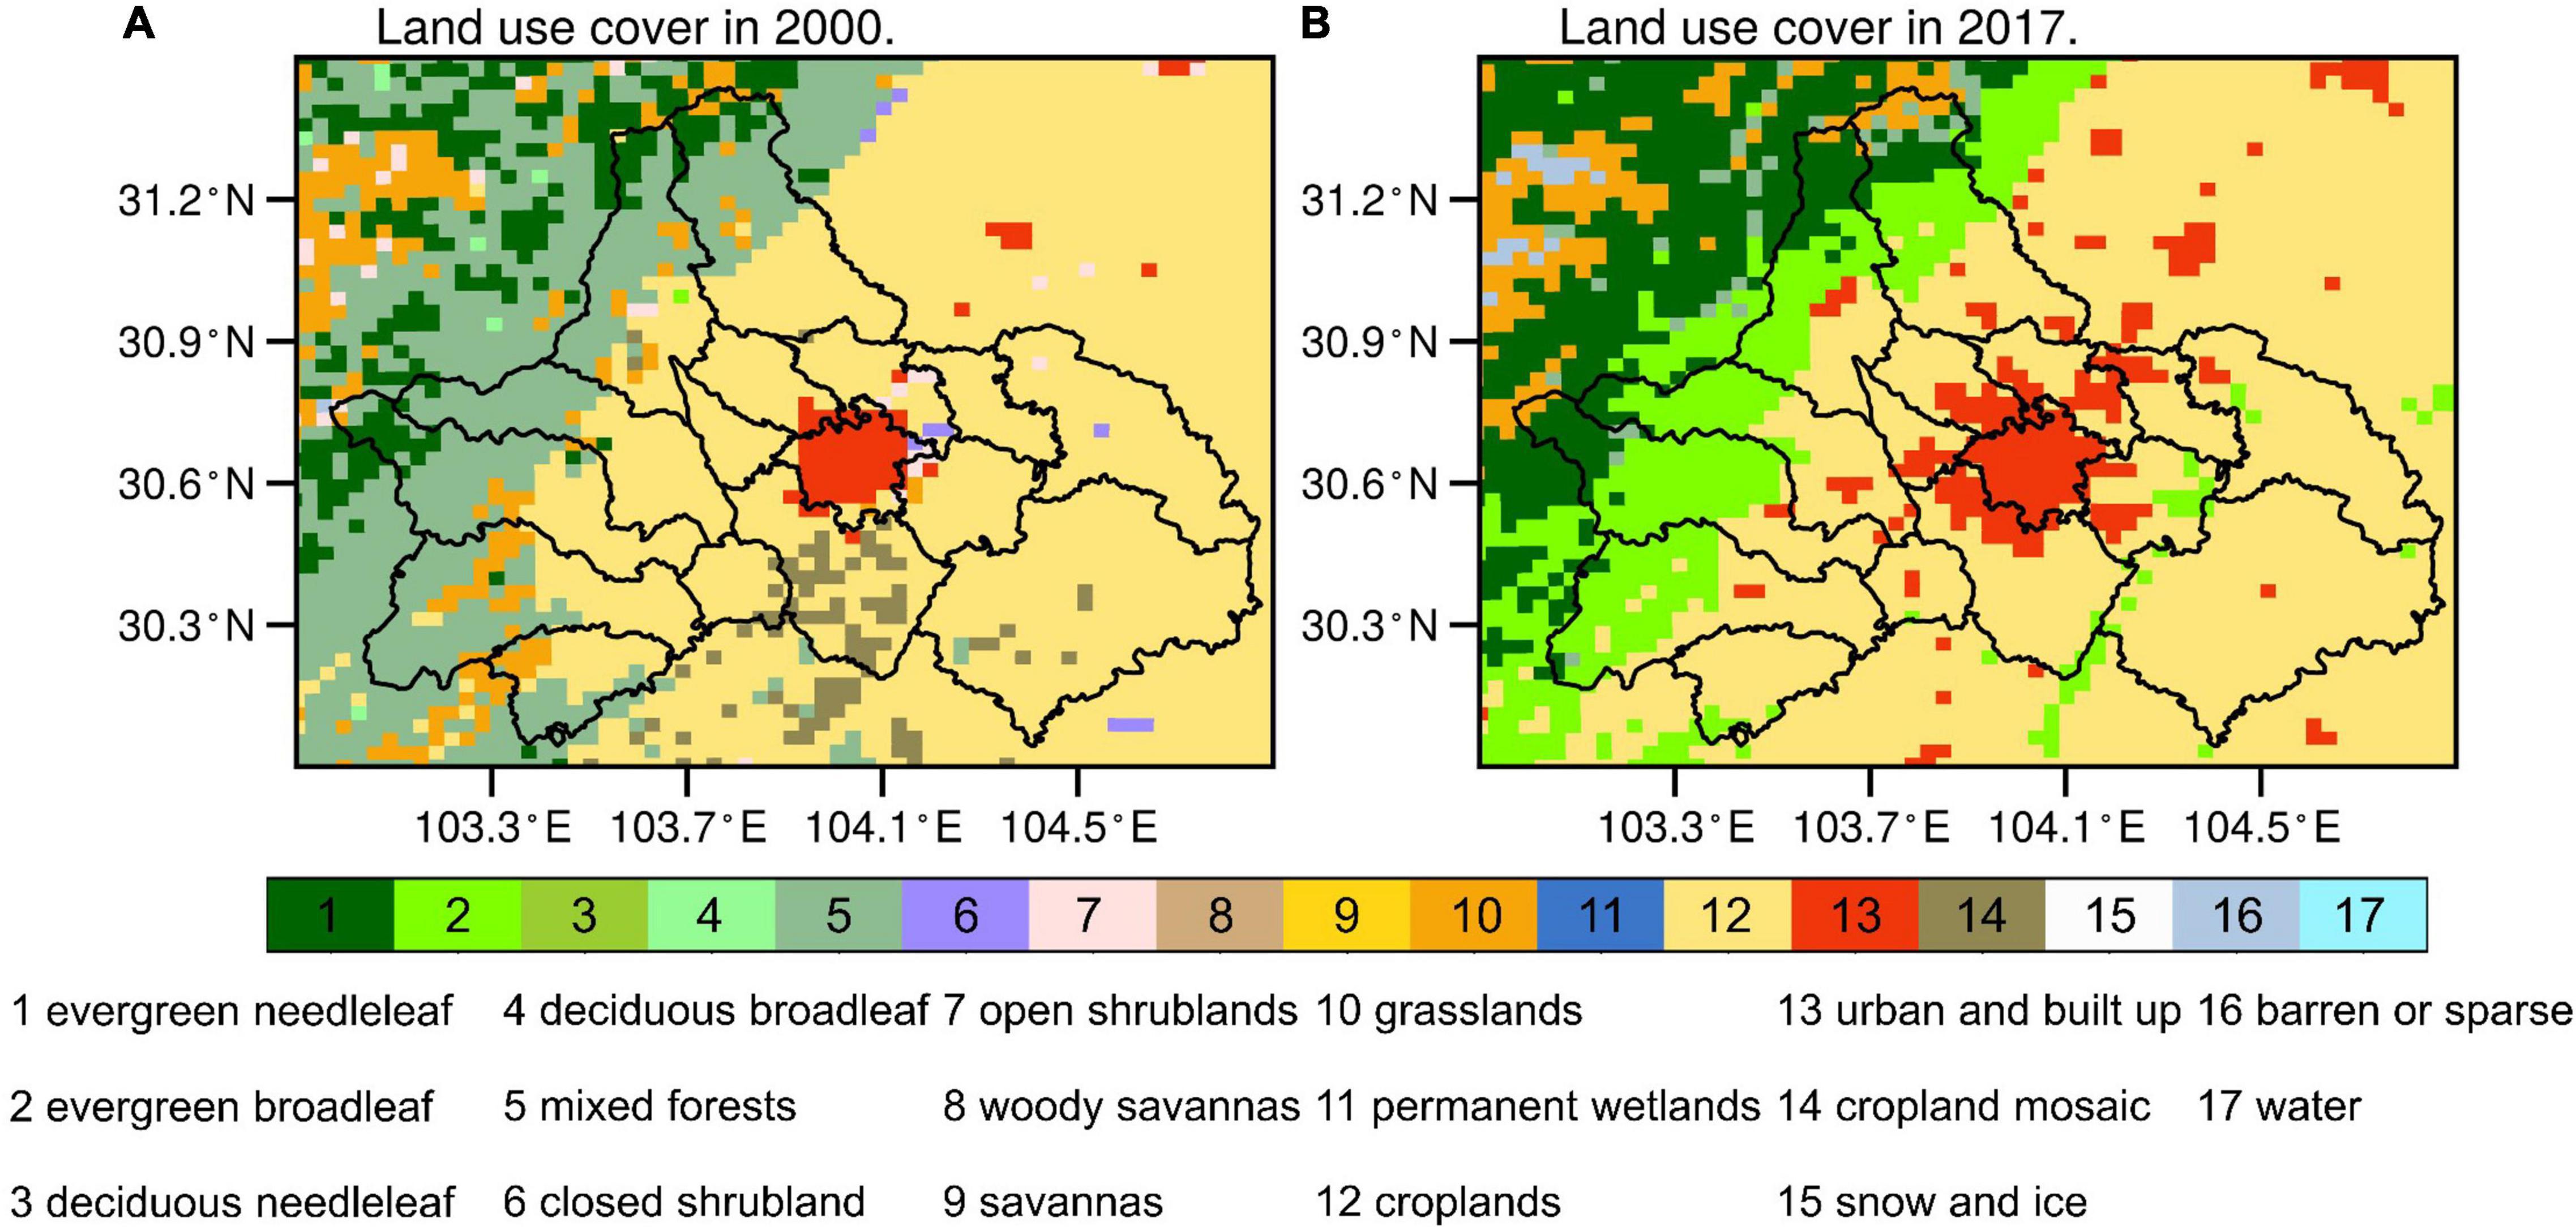
Figure 2. Moderate Resolution Imaging Spectroradiometer (MODIS) land use category across Chengdu in 2000 (A) and 2017 (B).
We use hourly ground-level meteorological observations [including 2-m temperature (T2), 10-m wind speed (WS10) and 10-m wind direction(WD10)] from 4 national basic meteorological stations [Chongzhou (CZ), Shuangliu (SL), Xindu (XD), and Wenjiang (WJ)] provided by the Sichuan Provincial Meteorological Service. Hourly ambient levels of air pollutants (PM2.5 and O3) from three monitoring stations are collected from the China National Environmental Monitoring Centre (CNEMC). The locations of these stations are shown in Figure 3. These data undergo rigorous quality control and are further used to assess the model performance of WRF-CMAQ.
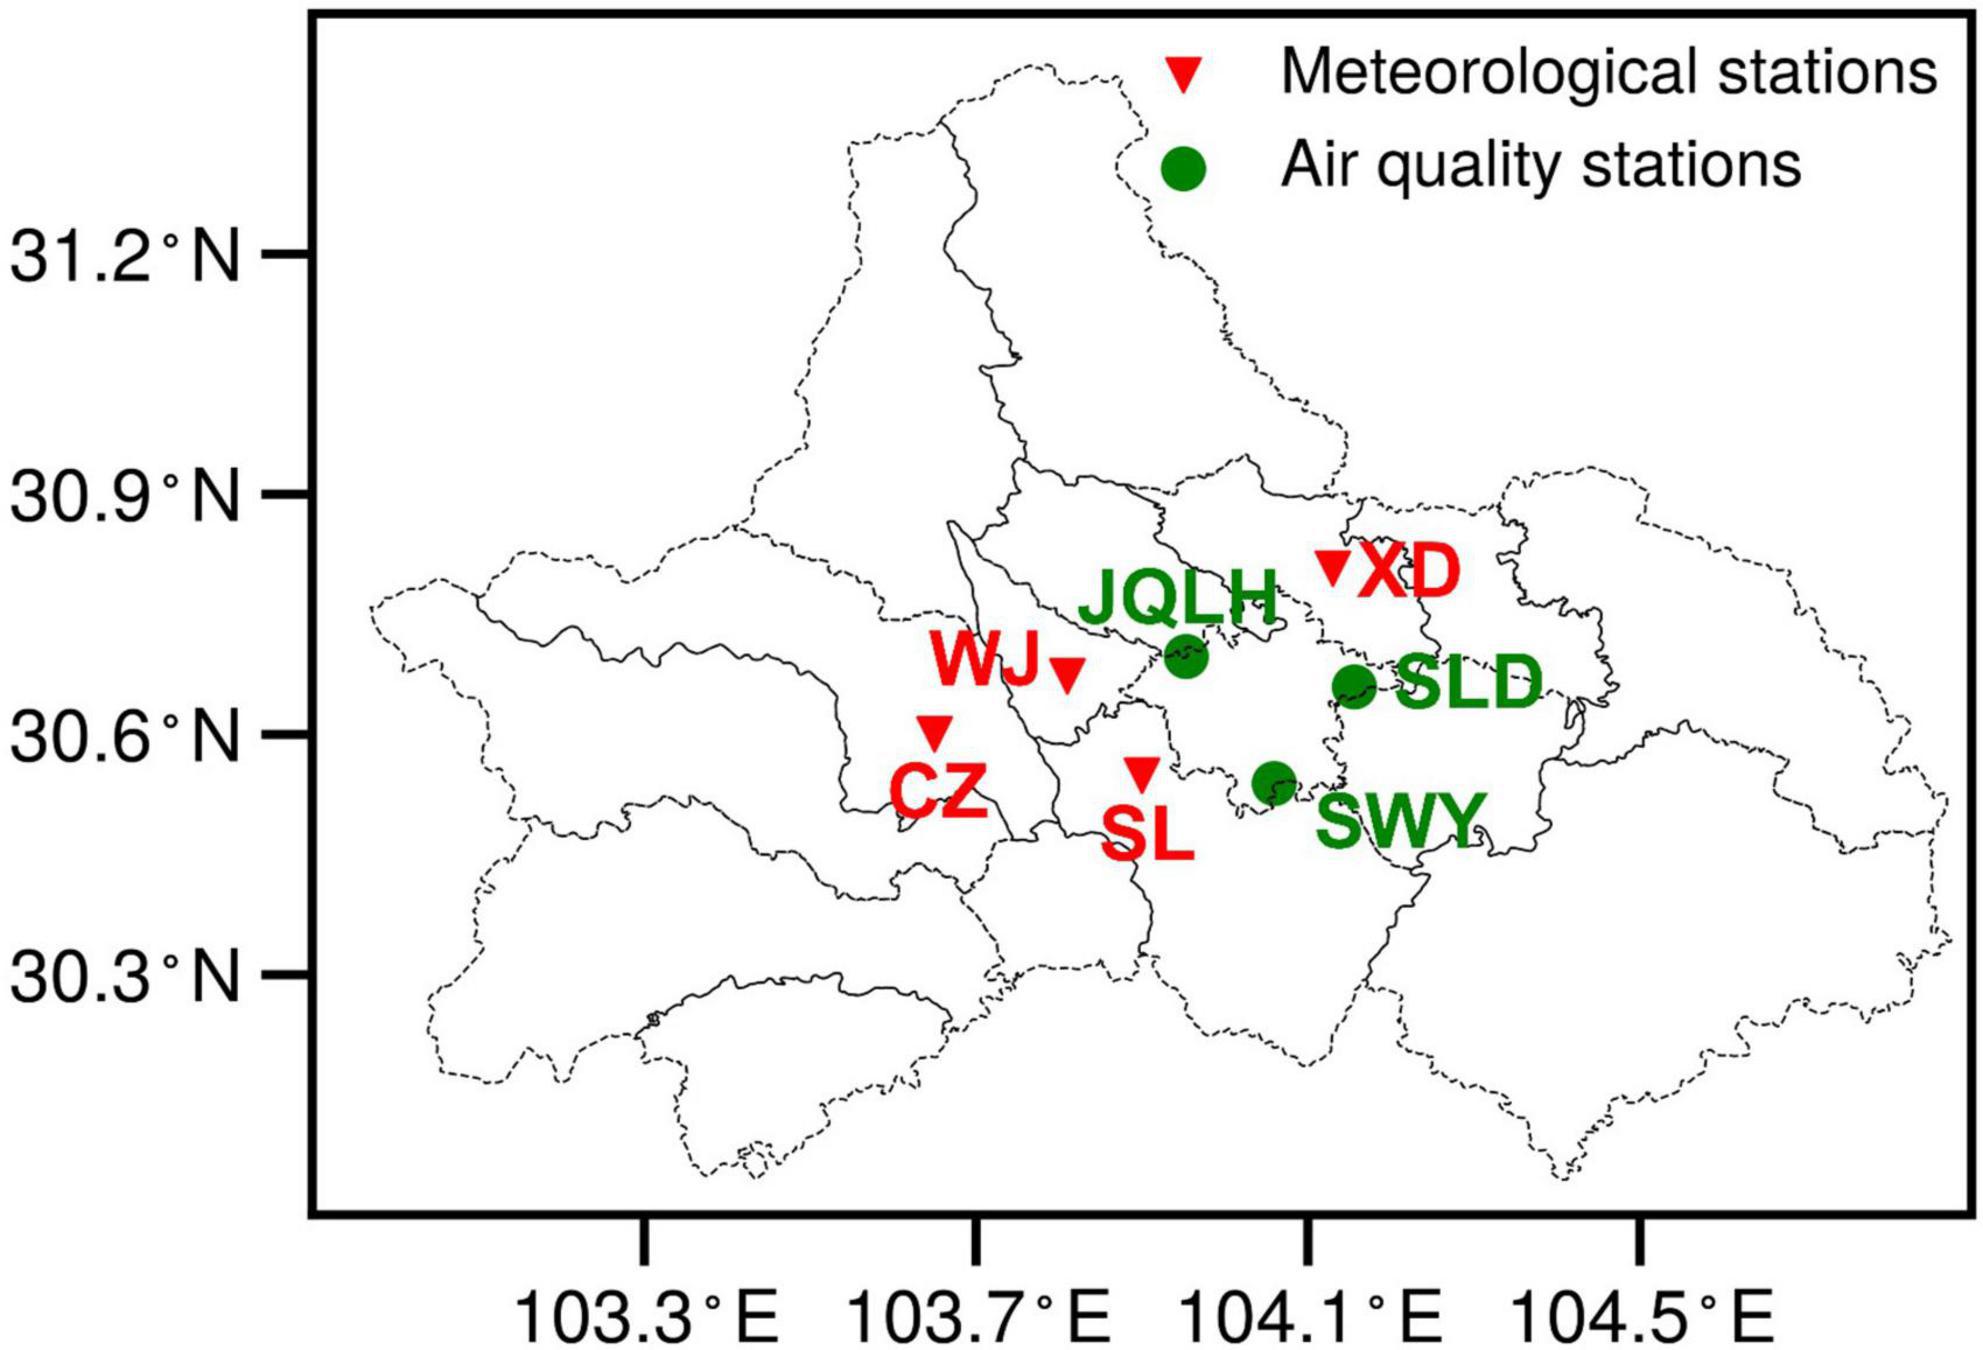
Figure 3. Locations of air quality monitoring stations and meteorological sites in Chengdu.
To assess the modeling performance, hourly output data from the WRF-CMAQ model was interpolated to the observation site (Figure 3). The model performance was quantified using statistical metrics including Pearson correlation coefficient (R), mean bias (MB), root mean square error (RMSE), normalized mean bias (NMB), the mean fractional error (MFE), and the mean fractional bias (MFB). The criteria values reported in Emery et al. (2017) and Boylan and Russell (2006) are adopted for comparing the statistical metrics. In previous studies, we assessed the model performance on meteorology and found that it can accurately reflect the diurnal pattern and fluctuation. It should be noted that the model performance evaluation on the wintertime meteorology has been described in detail previously (Wang H. et al., 2021), and thus will not be discussed here.
Where Mi and Oi are the simulated and observed data, respectively. and are the average of the simulated and observed data, respectively. n is the number of samples.
Evaluation of the WRF-CMAQ model performance is undertaken through comparison against ground-level observations, as shown in Supplementary Figure 1 and Supplementary Table 1. It can be clearly seen that the WRF model reasonably reproduces the diurnal pattern and variability of T2, with R values, ranged 0.73–0.83 and MB less than 1.22°C. For WS10, while WRF tends to overestimate nighttime wind speed, the simulated wind fields are broadly consistent with observations.
Figure 4 depicts the comparison of simulated and observed O3 and PM2.5 concentrations at hourly intervals. The model accurately replicated the O3 diurnal cycle, with R values ranging from 0.70 to 0.78 (Supplementary Table 2). The statistical measures of the model performance were reported in Supplementary Table 2. The simulated O3 concentrations at JQLH, SLD, and SWY with MB are −7.04, −12.14, and 18.33 μg/m3, respectively. Furthermore, the statistical metrics for O3 are within the acceptable standards (NMB < ± 15%) when compared to established benchmarks (Emery et al., 2017) using hourly O3 values. In terms of PM2.5 concentrations, the model captures PM2.5 variations with R values ranging from 0.53-0.60 (Supplementary Table 3) and the MFB (MFE) of −14.9% (40.1%), −5.7% (34.2%), and 0.6% (33.2%), respectively, which attain the criteria standards (−30% ≤ MFB ≤ 30% and MFE ≤ 50%) reported by Boylan and Russell (2006) for model performance.
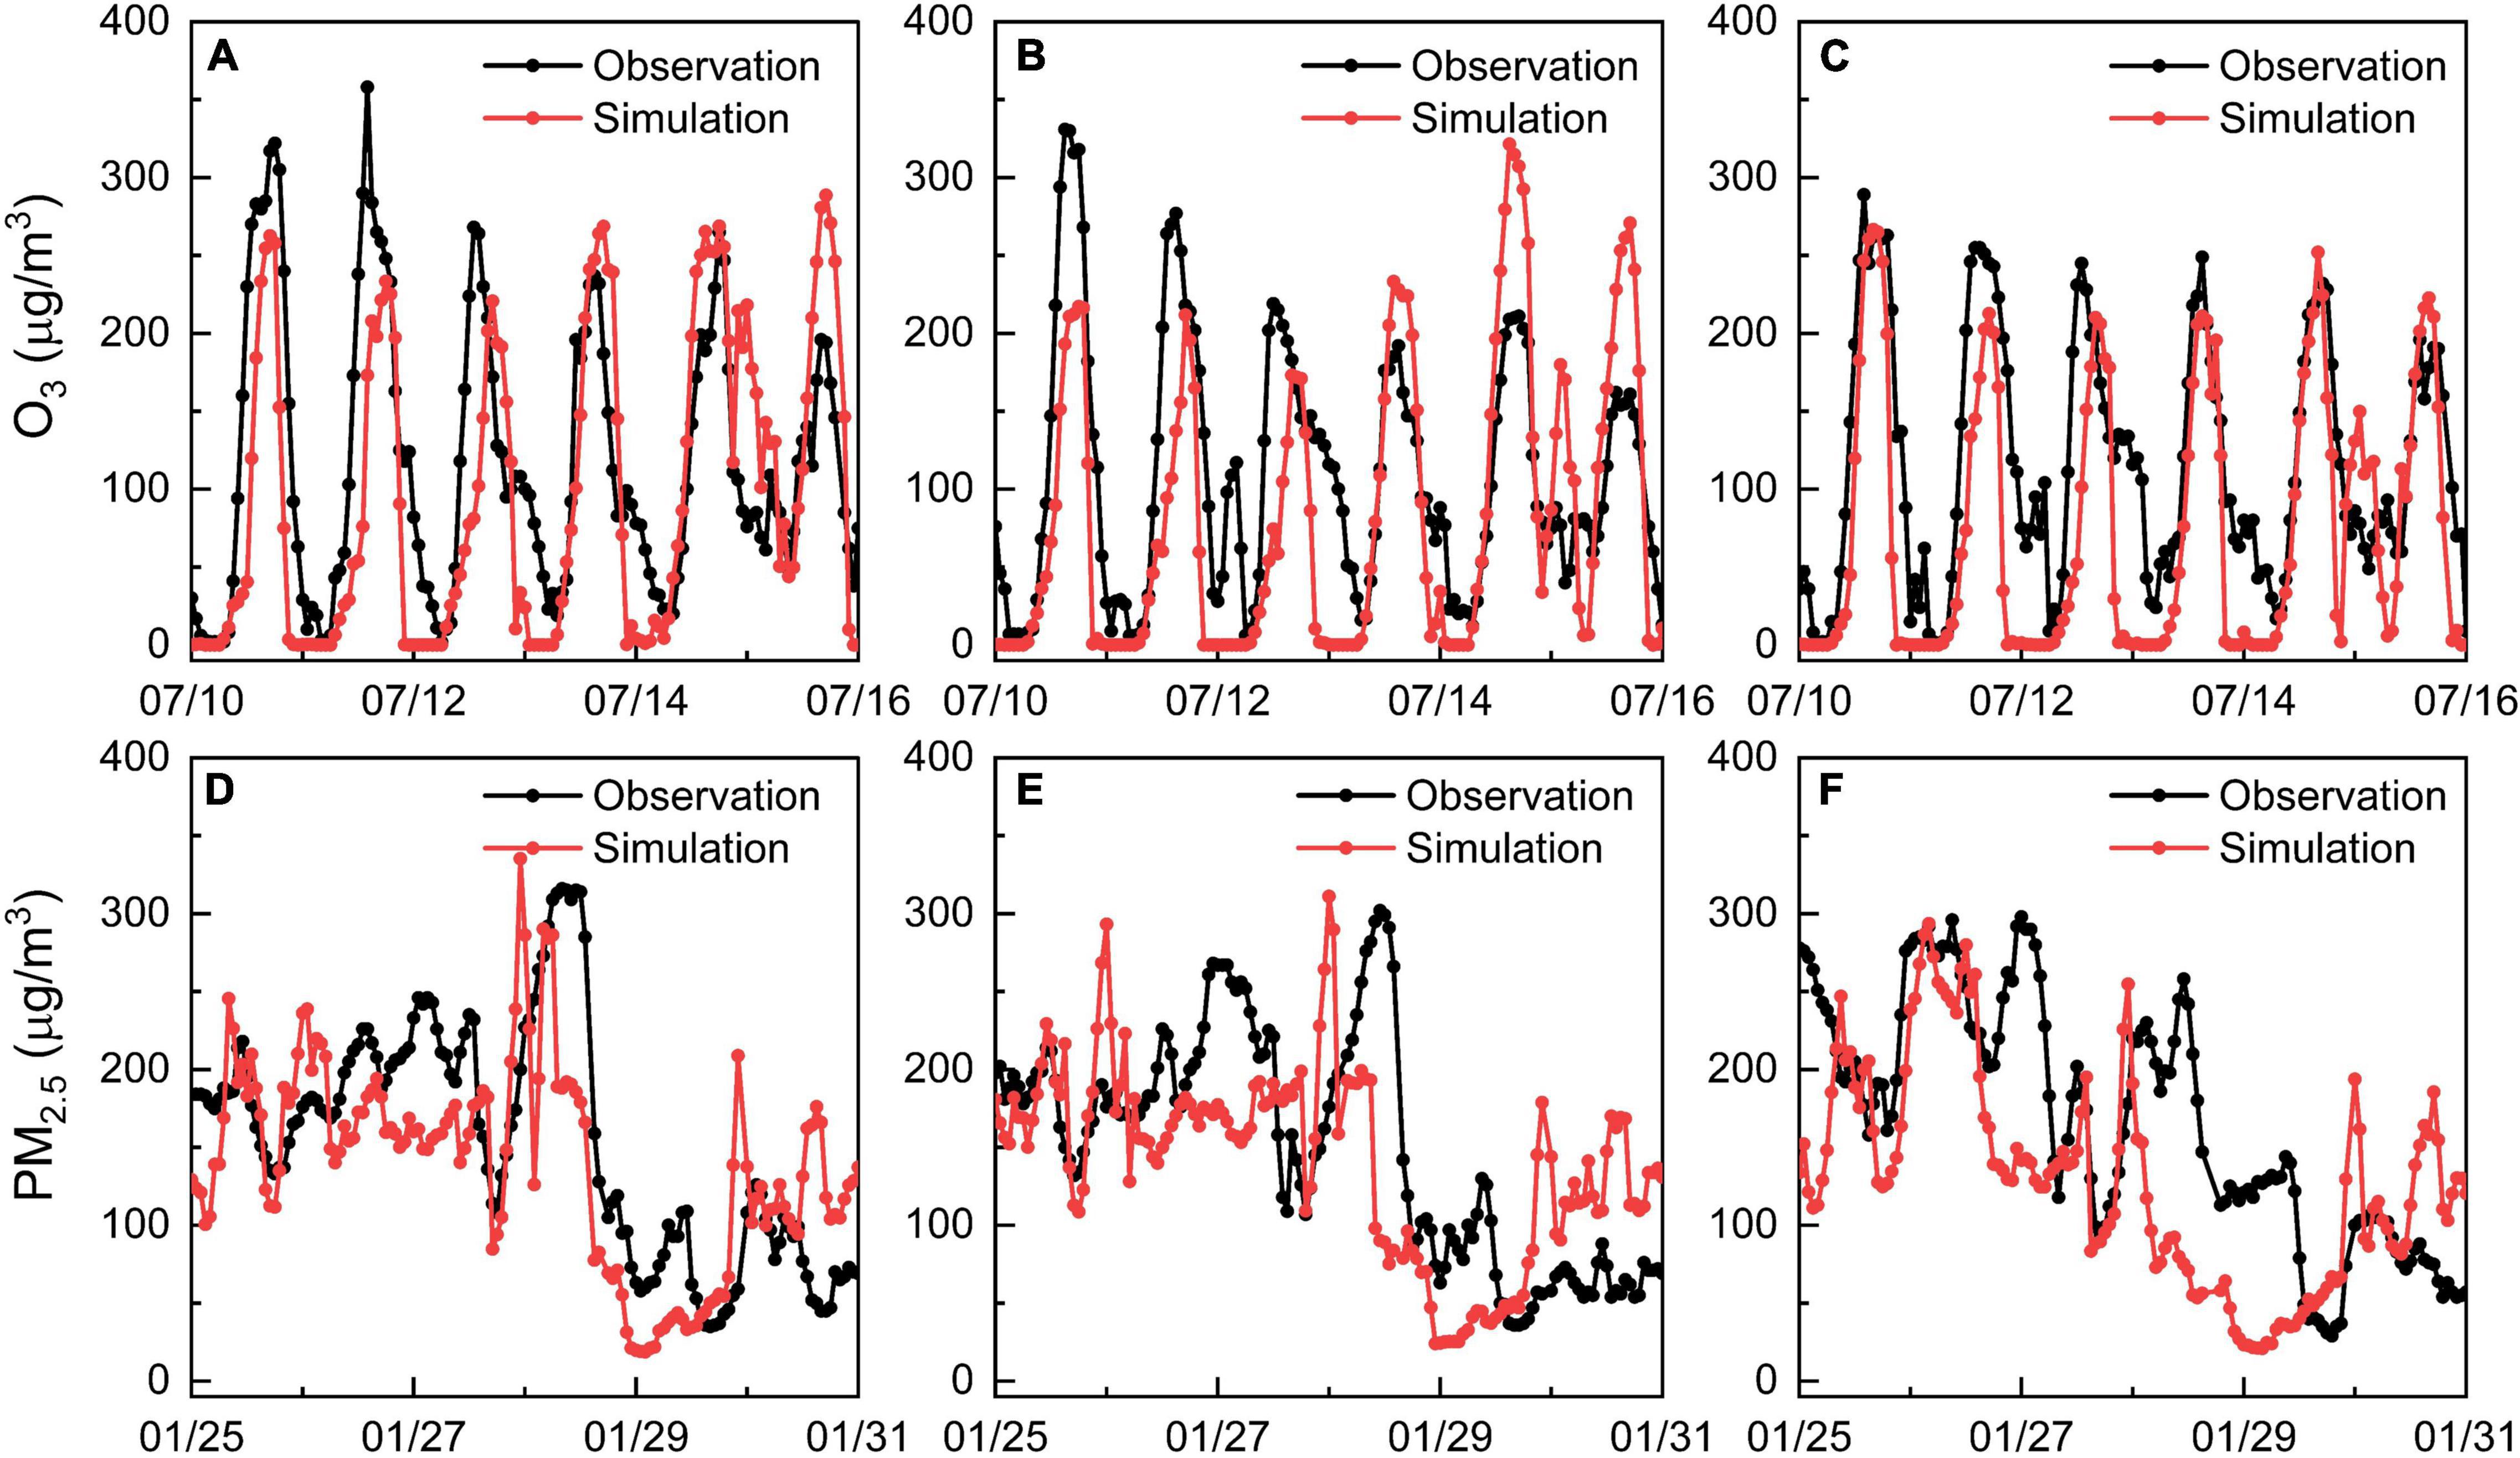
Figure 4. Time series of simulated and observed hourly concentrations of O3 at the (A) JQLH, (B) SLD, and (C) SWY stations over 10-16 July, 2017 and time series of simulated and observed hourly concentrations of PM2.5 at the (D) JQLH, (E) SLD, and (F) SWY stations over 25–31 December, 2017.
Figure 5 presents spatial changes of T2 induced by LULC alteration via urbanization across Chengdu in winter and summer. Evidently, the most prominent effects are seen in metropolitan Chengdu where dominated by the anthropogenic land surface. Suburban and rural areas exhibit slight warming over time with T2 changes less than 1°C, indicating the impacts of urbanization at regional-scale. In addition, it is found that nocturnal T2 across UEA (i.e., land use transition from natural to urban surfaces between 2000 and 2017) increases significantly with maximum values reaching 3 and 4°C in summer and winter, respectively. In contrast, UEA experiences cooling in the daytime with a remarkably reduced T2 in winter than in summer. This pattern is mainly caused by intense thermal inertia and high heat capacity of the urban canopy, which is primarily attributed to manmade materials (e.g., pavements and buildings).
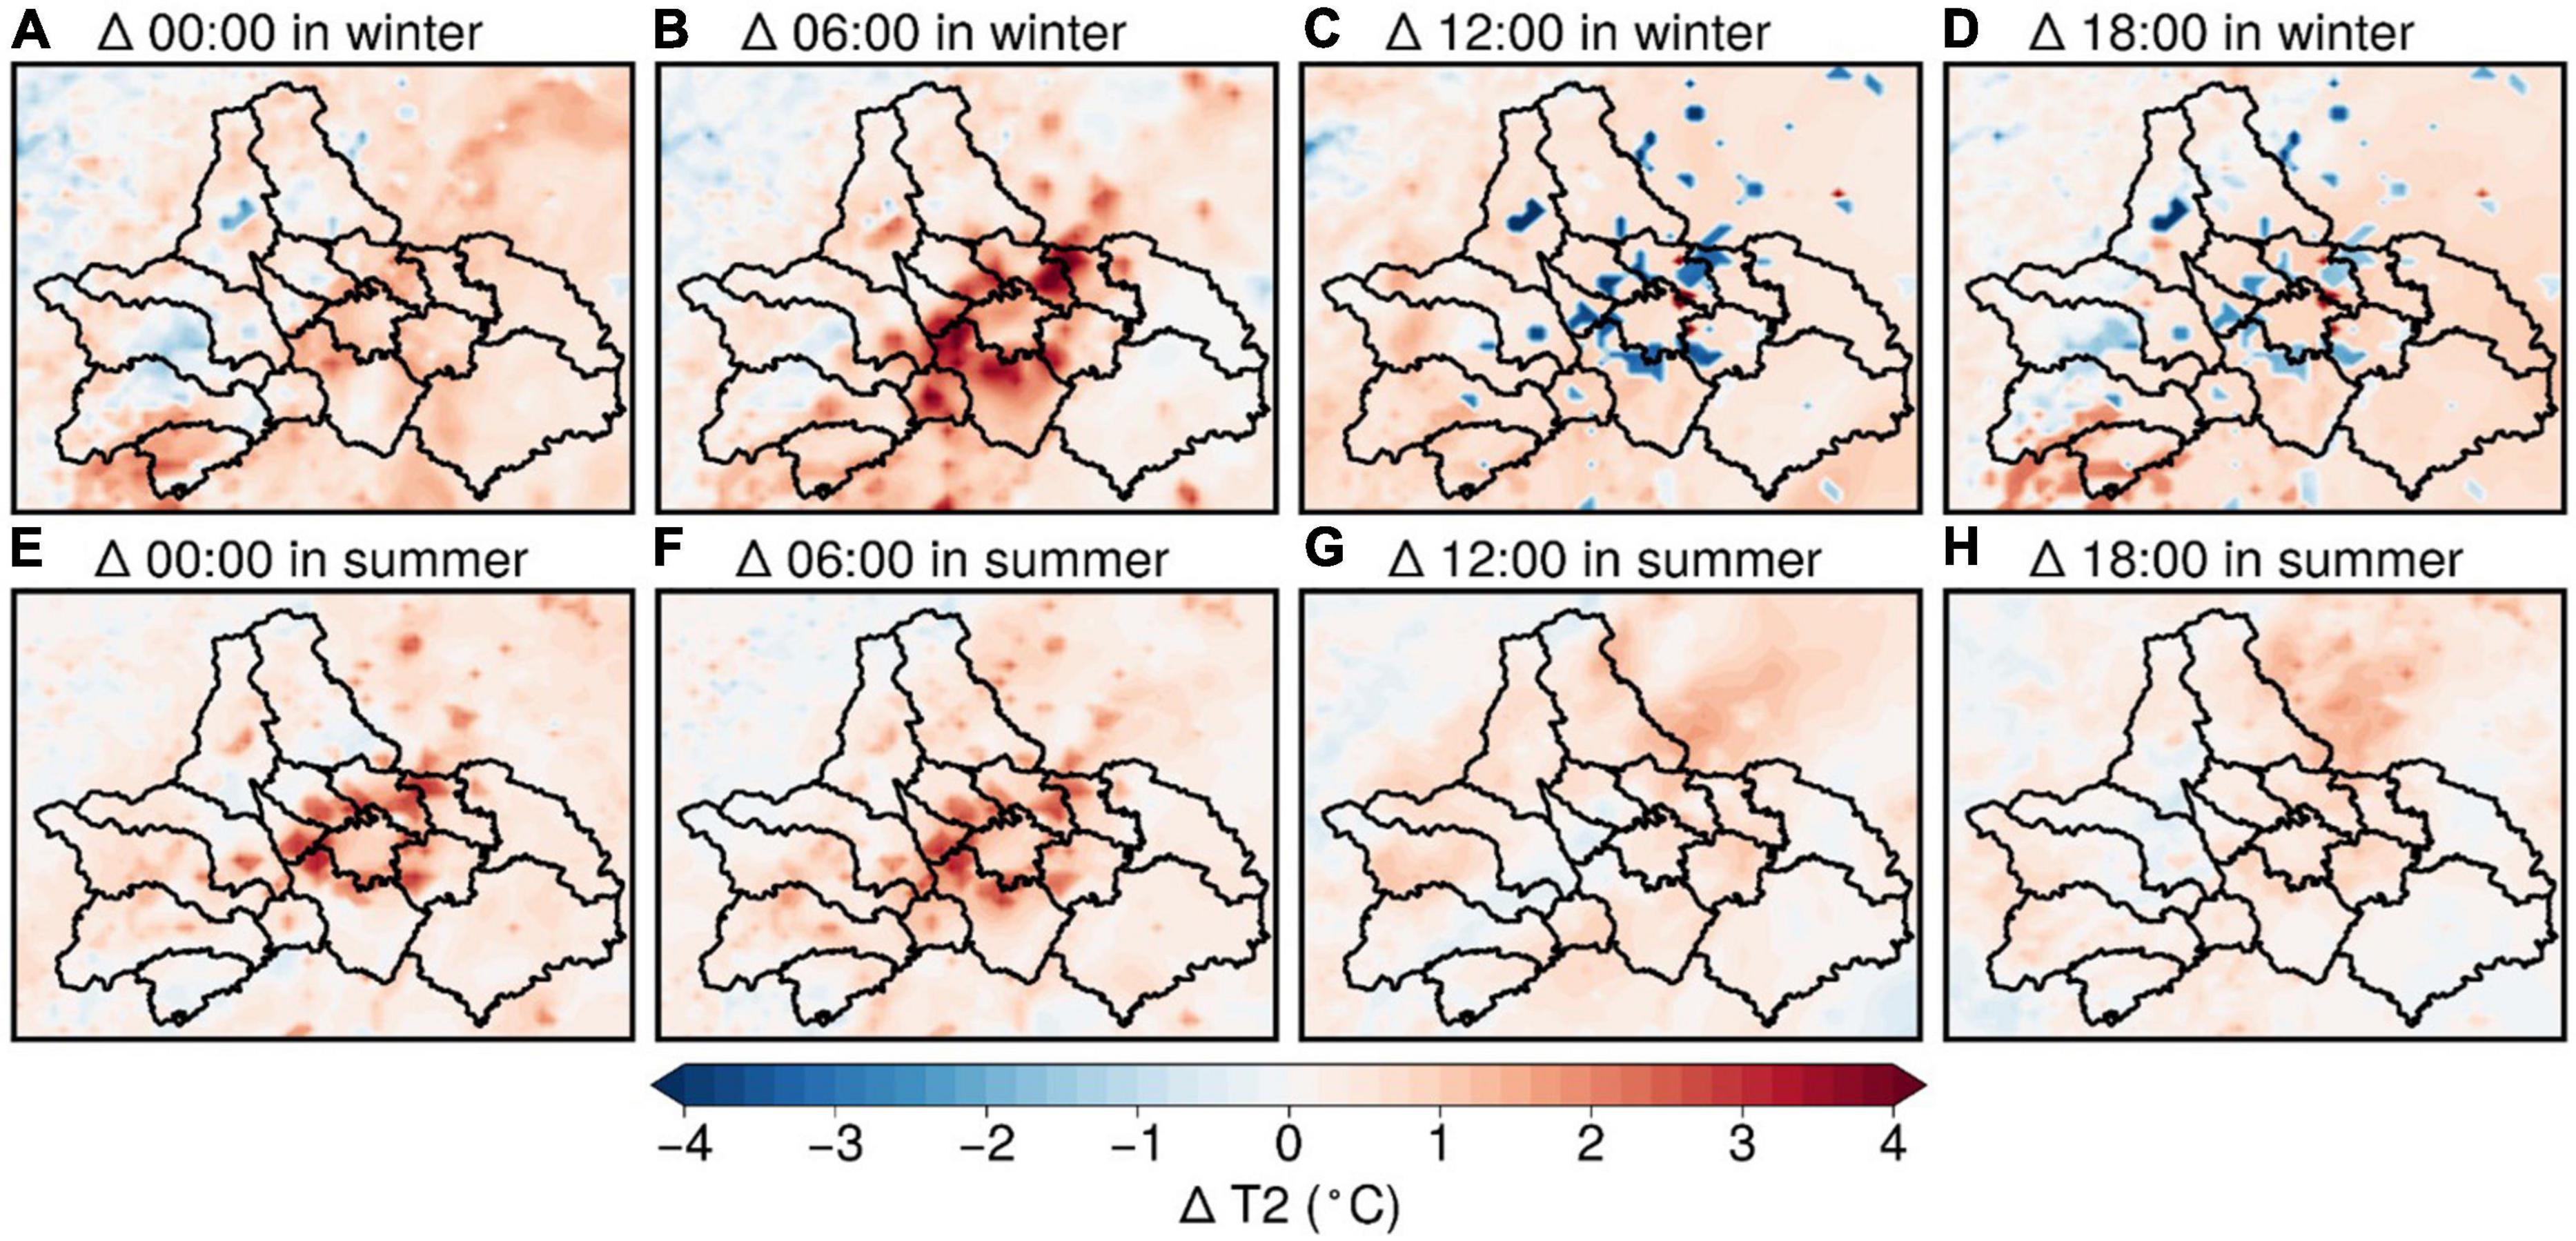
Figure 5. Spatial map of T2 variations induced by land use change between 2000 and 2017 at 00:00, 06:00, 12:00, and 18:00 LST in winter (A–D) and summer (E–H).
Urbanization turns natural land surface into anthropogenic land surface, thus leading to an increase in heat capacity and a reduction in surface albedo. Furthermore, the intense thermal inertia of the urban canopy hinders the cooling process during nighttime. Therefore, the cooling process of the urban surface is slower than that of the natural surface. Meanwhile, the increasing PBLH (Supplementary Figure 2) can also lead to warming because of lower air cooling rates at night (Li et al., 2019).
In the daytime, T2 in UEA decreases by about 2–3°C in winter due to the higher thermal inertia of the urban canopy while the change in summer is insignificant. This is mainly attributed to the perturbation of energy balance in urban areas induced by buildings within the city, namely, the shadow effects (SE). SE is explained by the low solar zenith angle in the winter period leading to less amount of solar radiation reaching the ground and subsequently resulting in less radiation shaded by the buildings, while the high solar zenith angle in the summer period causes much solar radiation to reach the ground and a large portion of it blocked by buildings. In summer, T2 increases due to the absorption of solar radiation, and the higher thermal inertia of the urban canopy hinders the process of temperature increase during the day. The temperature difference between the urban surface and the natural surface is insignificant because of the minor SE due to the high solar zenith angle in the summer period. In winter, while the urban canopy has thermal inertia, SE is more pronounced and shade most of the radiation, offsetting the warming and causing the temperature to decrease by 2–3°C over the UEA.
Changes in ventilation conditions due to urbanization are discussed in this section. The changes in PBLH affect the vertical diffusion capacity of air pollutants, while the changes in WS10 affect the horizontal transport of ground-level air pollutants. Here, we use the ventilation index (VI) calculated as the product of PBLH and WS10 for illustrating the variations of diffusion capacity over Chengdu (Li et al., 2019). The equation for VI can be written as follow.
where PBLH is the planetary boundary layer height (m) and WS10 is the 10-m wind speed (m/s).
Figure 6 presents spatial changes of VI induced urbanization across Chengdu in winter and summer. In winter, it is found that VI across UEA increases significantly with maximum values reaching 1,400 m2/s and 1,300 m2/s during the daytime and nighttime, respectively. In contrast, UEA has a significant diurnal variation of VI in summer, with a significant decrease in VI during the nighttime (maximum of 1,400 m2/s) and a significant increase during the daytime (maximum of 1,500 m2/s).
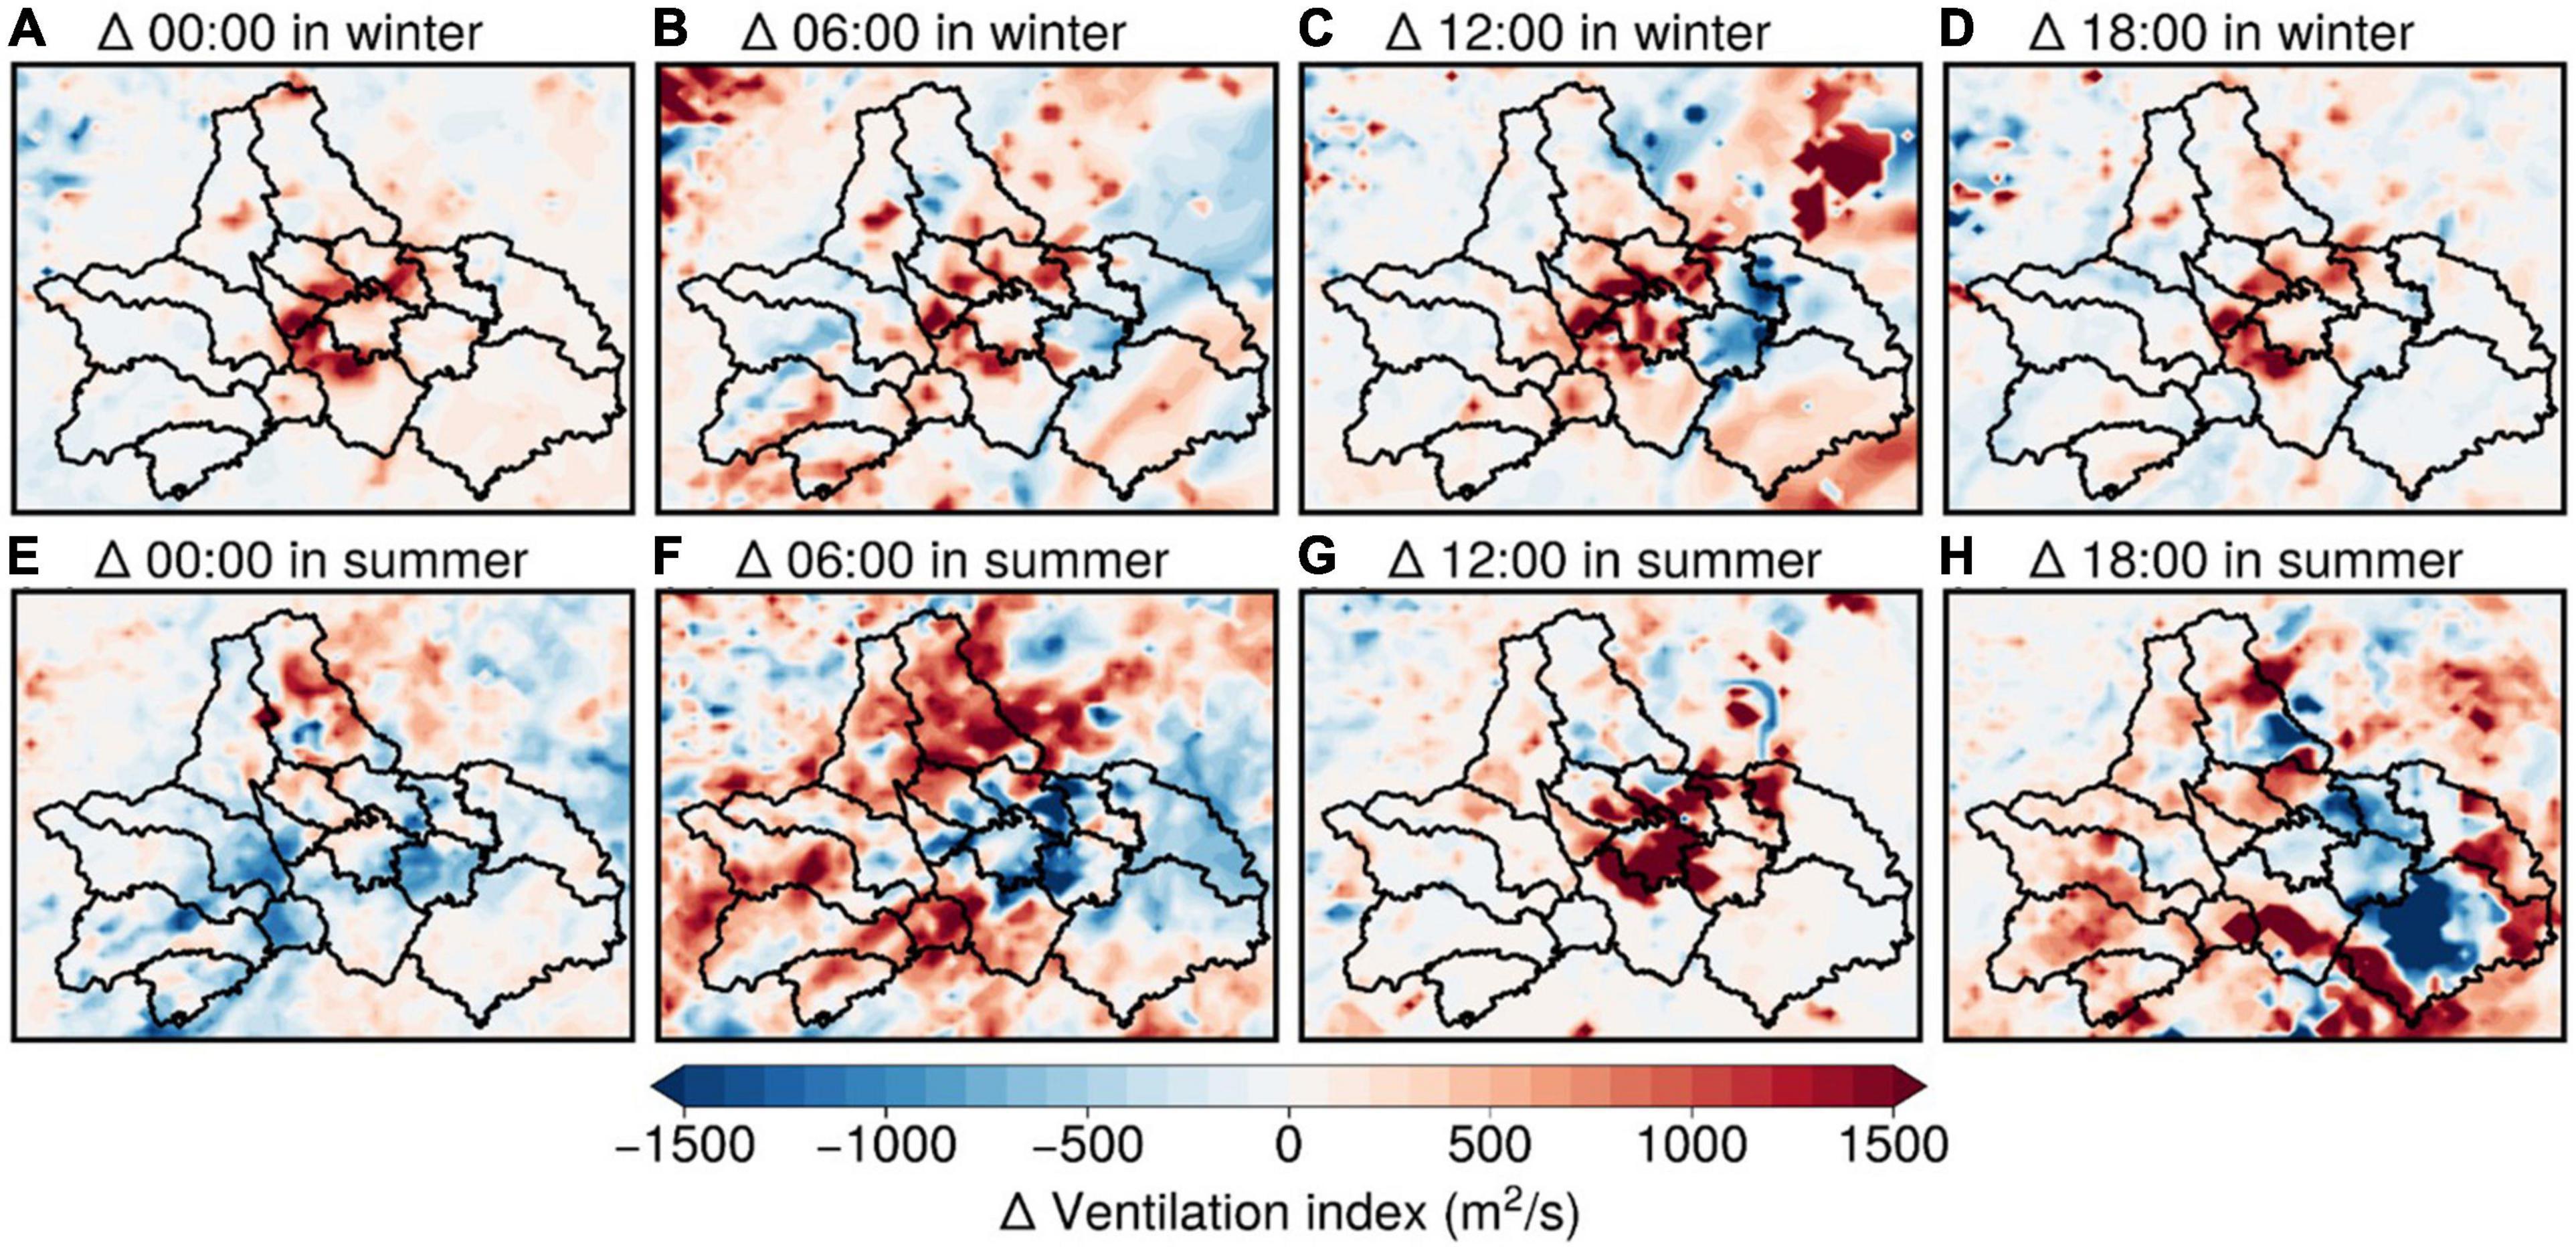
Figure 6. Spatial map of VI variations induced by land use change between 2000 and 2017 at 00:00, 06:00, 12:00, and 18:00 in winter (A–D) and summer (E–H) periods.
In winter, during the 00:00-06:00 period (Supplementary Figure 4), UEA exhibited stronger WS10 (Supplementary Figure 3) and higher PBLH (Supplementary Figure 2) in 2017, which can be attributed to the mechanism that SE causes long-wave radiation in the street valley to be repeatedly reflected and absorbed at night. The urban surface temperature increased due to the accumulation of long-wave radiation and anthropogenic heat rejection, which increases the aerodynamic energy of atmospheric turbulence and increase the WS10 and PBLH. Increasing PBLH is also related to increased surface roughness since shear production dominates turbulent kinetic energy (TKE) at night (Li et al., 2019). During 12:00–18:00 (Supplementary Figure 4), WS10 increased by 0.24 m/s and PBLH slightly increased by 47.3 m. The decrease of PBLH is mainly associated with air temperature changes because buoyancy production dominates TKE during the day. Reduced buoyancy production of TKE occurs when air temperature decreases (Figures 5C,D), resulting in a shallower PBLH. Ultimately, the increased WS10 resulted in a 1,400 m2/s increase at 12:00 and a 1,300 m2/s increase at 18:00 in VI.
In summer, during the 00:00–06:00 period (Supplementary Figure 5), UEA shows weaker WS10 (Supplementary Figure 3) and higher PBLH (Supplementary Figure 2) in 2017. The decrease in WS10 is mostly caused by the dragging force, which increases as the friction effect enhances. Additionally, SE causes the urban surface to heat up due to multiple reflections and absorptions of long-wave radiation in the street valley, delaying the heat dissipation process, and subsequently leading to an increase in PBLH. Consequently, the reduction of WS10 caused the VI to decrease by 500 m2/s at 00:00 and 1,200 m2/s at 06:00 (Supplementary Figure 5), which is beneficial to confine pollutants near the surface. At 12:00 (Supplementary Figure 5), the increased air temperature enhances the atmospheric turbulence and drives the daytime PBL growth, resulting in an increase of 1,300 m2/s in VI. In summary, WS10 acts as the dominant factor in altering VI in summer, while variability in PBLH governs the changes of VI in daytime and WS10 contributes to variations of VI at night in winter.
Figure 7 shows spatial distribution of PM2.5 concentrations in 2000 and 2017 LULC at 00:00, 06:00, 12:00, and 18:00. There are PM2.5 hotspots over UEA and southern Chengdu at 00:00, with peak levels spike to 313.4 and 283.3 μg/m3 in 2017 and 2000, respectively. In the morning (06:00), PM2.5 levels over downtown Chengdu drop to 126.3 μg/m3 and elevated PM2.5 concentrations are found over rural areas. It is worth noting that urbanization leads to considerable decrease of PM2.5 concentrations (>40 μg/m3) across UEA at night. However, the change of PM2.5 is insignificant in the daytime over the study domain, implying varied effects induced by urbanization for different time periods.

Figure 7. Spatial map of simulated PM2.5 levels and PM2.5 variations induced by land use change between 2000 and 2017 at 00:00, 06:00, 12:00, and 18:00.
To further examine the dominant contributor that leads to variations of PM2.5, the chemical components of PM2.5 are classified into the following three categories: secondary inorganic aerosols (SIA), including nitrate (NO3–), sulfate (SO42–), and ammonium (NH4+); carbonaceous aerosols, including elemental carbon (EC) and primary organic carbon (POC); and secondary organic aerosol (SOA), including SOA formed from anthropogenic VOC precursors (ASOA) and biogenic VOC precursors (BSOA). Figure 8 depicts the diurnal changes of PM2.5 components and total PM2.5 concentrations over UEA. The primary carbonaceous aerosols have similar temporal changes with WS10. During the daytime, the slight changes of WS10 do not substantially affect primary carbonaceous aerosols concentrations. In addition, the shift of land cover dominated by vegetation to anthropogenic land surface leads to reductions of BVOC emissions and subsequently results in reduced BSOA concentrations (by 3.4 μg/m3). Some semi-volatile compounds species in ASOA increase by 2.85 μg/m3 due to the changes in gas-particle phase partitioning from the temperature reduction. The concentrations of nocturnal nitrate and sulfate aerosols decreased by 2.8 μg/m3 and 1.3 μg/m3, respectively. It is worth mentioning that reductions of nitrate and sulfate account for approximately 40% of the decline in PM2.5 concentrations. As sulfate is non-volatile, weakened atmospheric oxidation rates induced by reduced temperature and enhanced ventilation are dominant contributors to declined sulfate. Unlike large reductions in nitrate and sulfate, CMAQ predicts the changes of NH4+ to a lesser extent due to relatively low level of ammonia emissions in Chengdu.
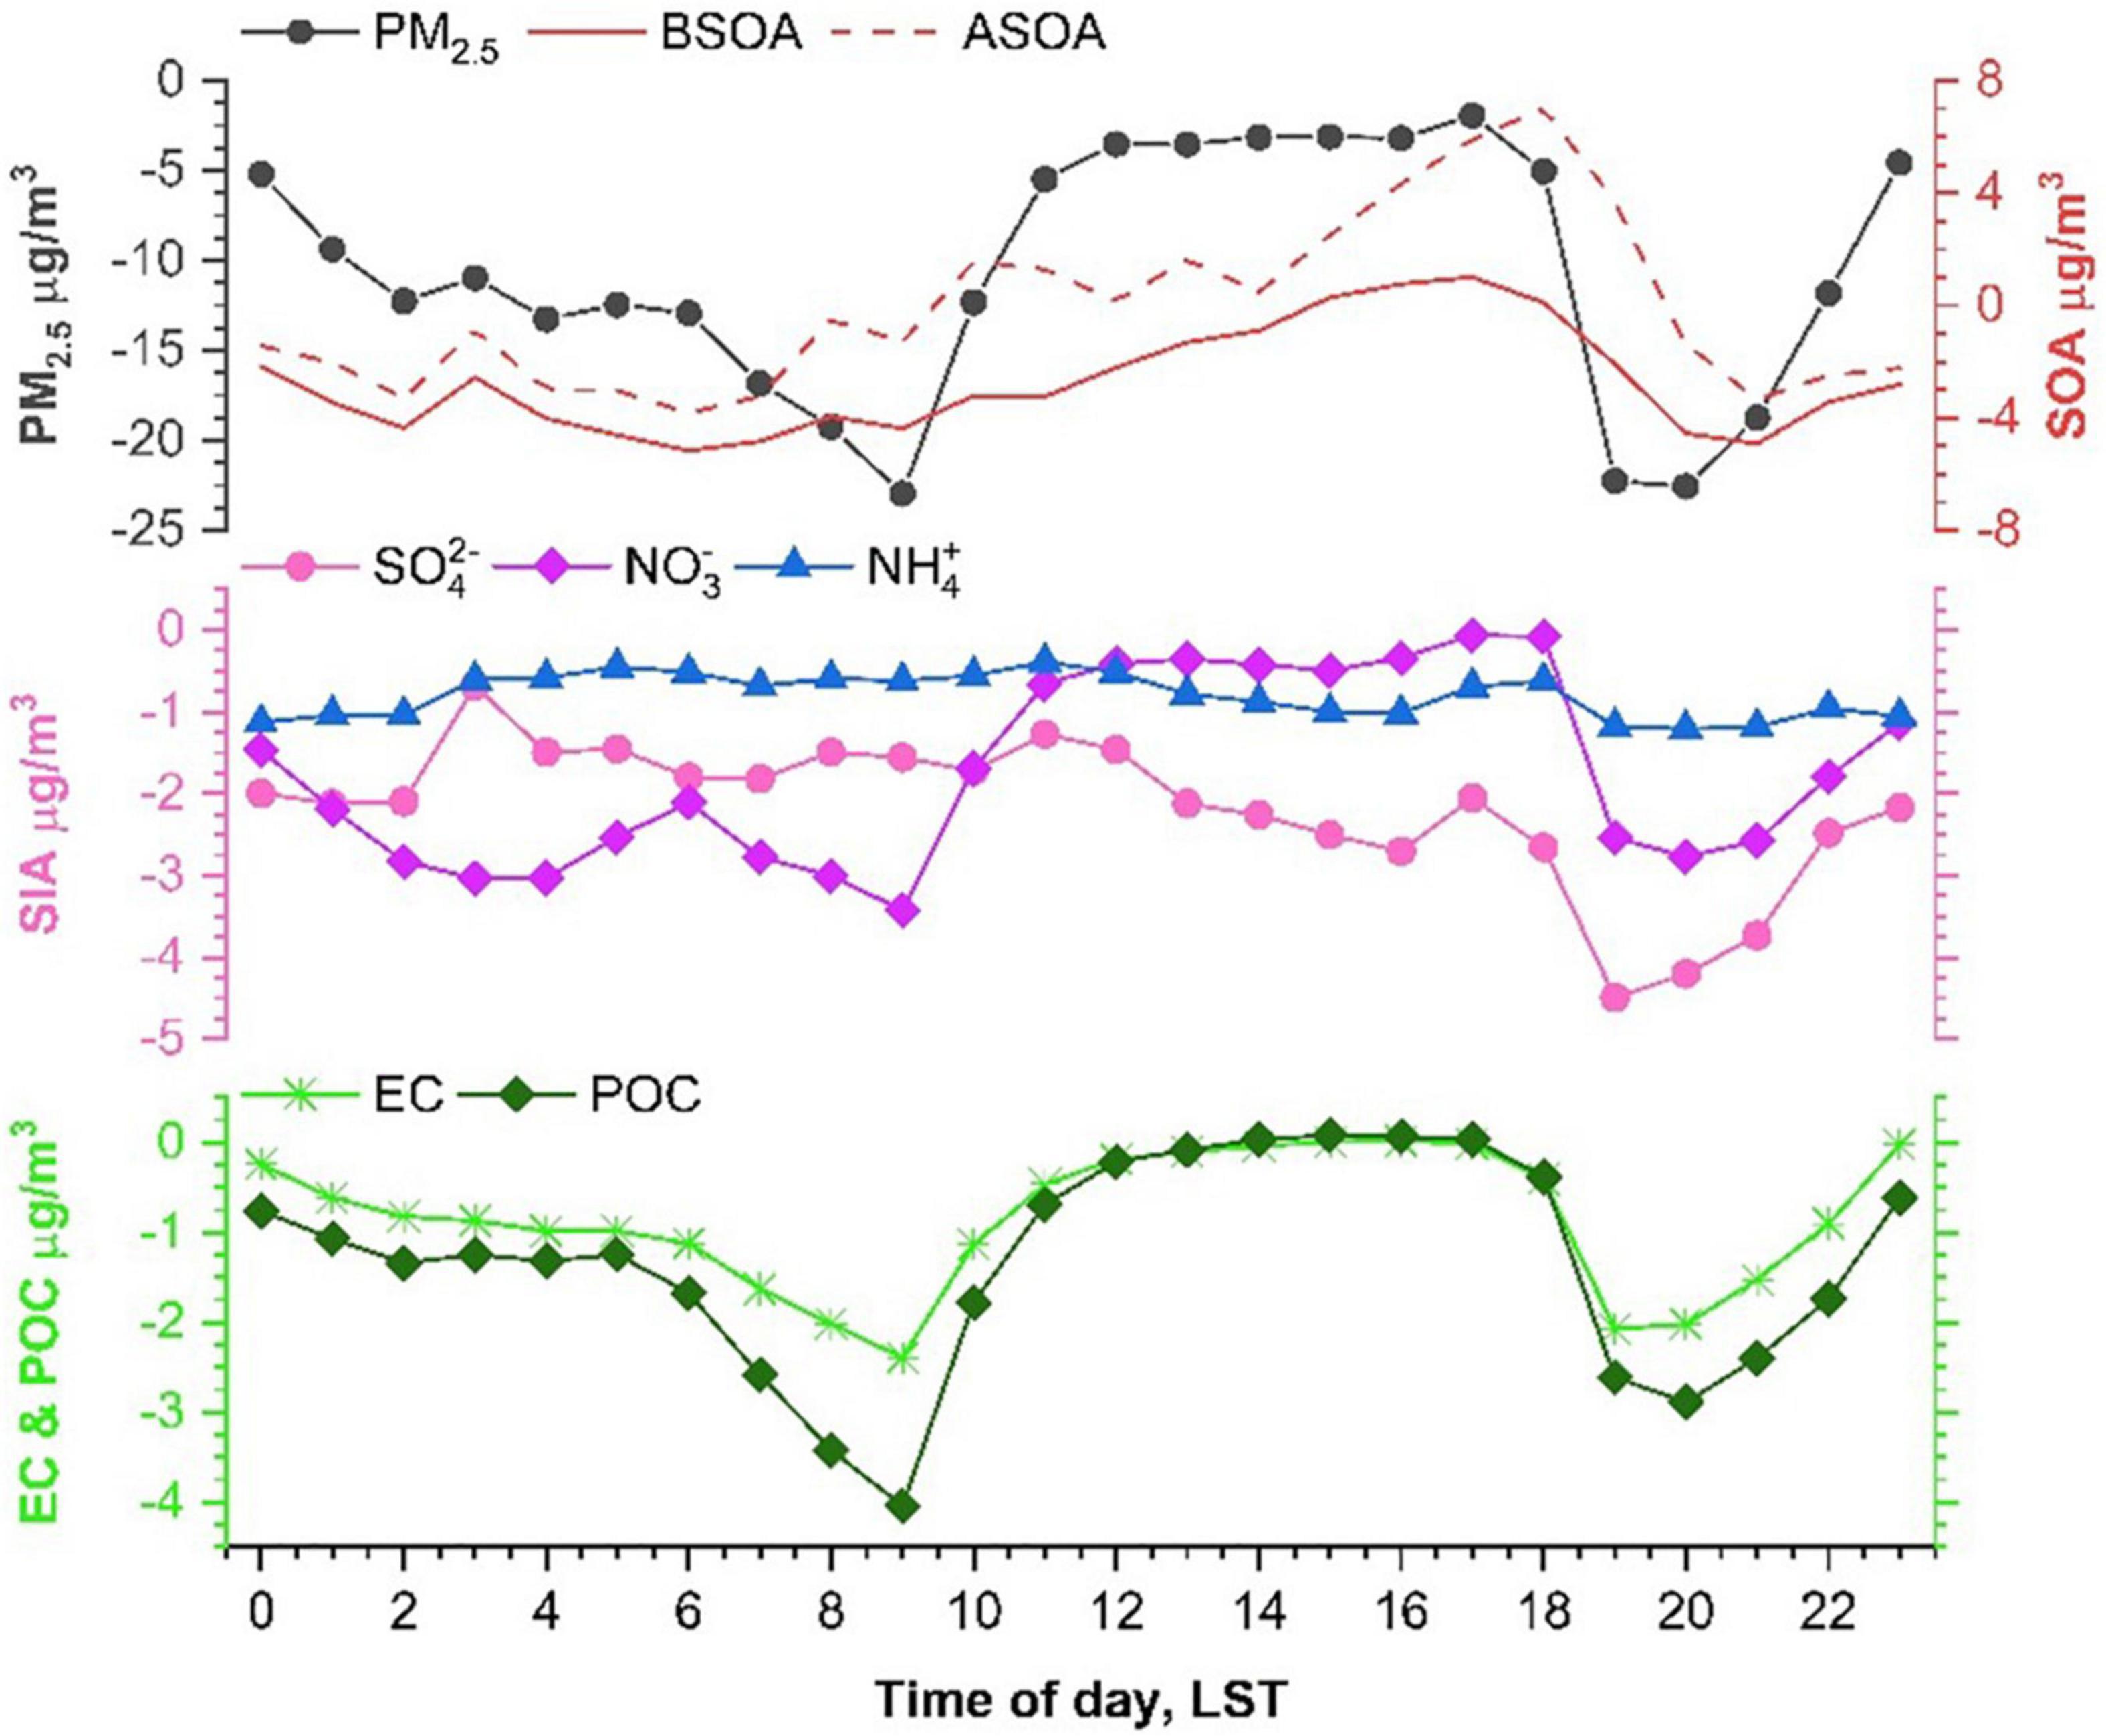
Figure 8. Diurnal pattern of PM2.5 and chemical components over UEA of Chengdu between 2000 and 2017. The average data was calculated from the value of UEA.
The impact of urbanization on PM2.5 concentrations in winter results exhibited the PM2.5 concentrations over UEA significantly increased at night while slightly decreased during the daytime. In 2017, AERO process had a daytime impact of −28.3 μg/m3, compared to −19.4 μg/m3 in 2000 (Figure 9). AERO process enhanced since the temperature decreases during the day, reducing air oxidation rate and hence the SOA level decreased. CHEM and DDEP processes were insignificantly affected by urbanization, while HADV and ZADV processes had remarkable impacts from urbanization due to the increase of VI. HADV process in 2017 resulted in PM2.5 concentrations increased by 26.3 μg/m3 at night and increased by 5.2 μg/m3 during the day, whereas HADV process in 2000 resulted in PM2.5 concentrations increased by 13.8 μg/m3 at night and decrease by 2.2 μg/m3 during the day. According to ZADV process, PM2.5 concentrations over UEA decreased by 33.4 μg/m3 and 29.3 μg/m3 during the nighttime in 2017 and 2000, respectively. This discrepancy could be attributed to the increased T2 from more anthropogenic heat and the higher heat storage capacity, which enhanced vertical convection. Because of the lower WS10 during the nighttime in 2017, HDIF process led to a 0.15 μg/m3 increase in PM2.5 concentrations, whereas HDIF caused PM2.5 concentrations to decrease by 0.15 μg/m3 during the night in 2000 due to the higher WS10. In addition, owing to the increase in T2, the UEA acquired a higher temperature gradient, making VDIF process stronger in 2017 than it was in 2000.
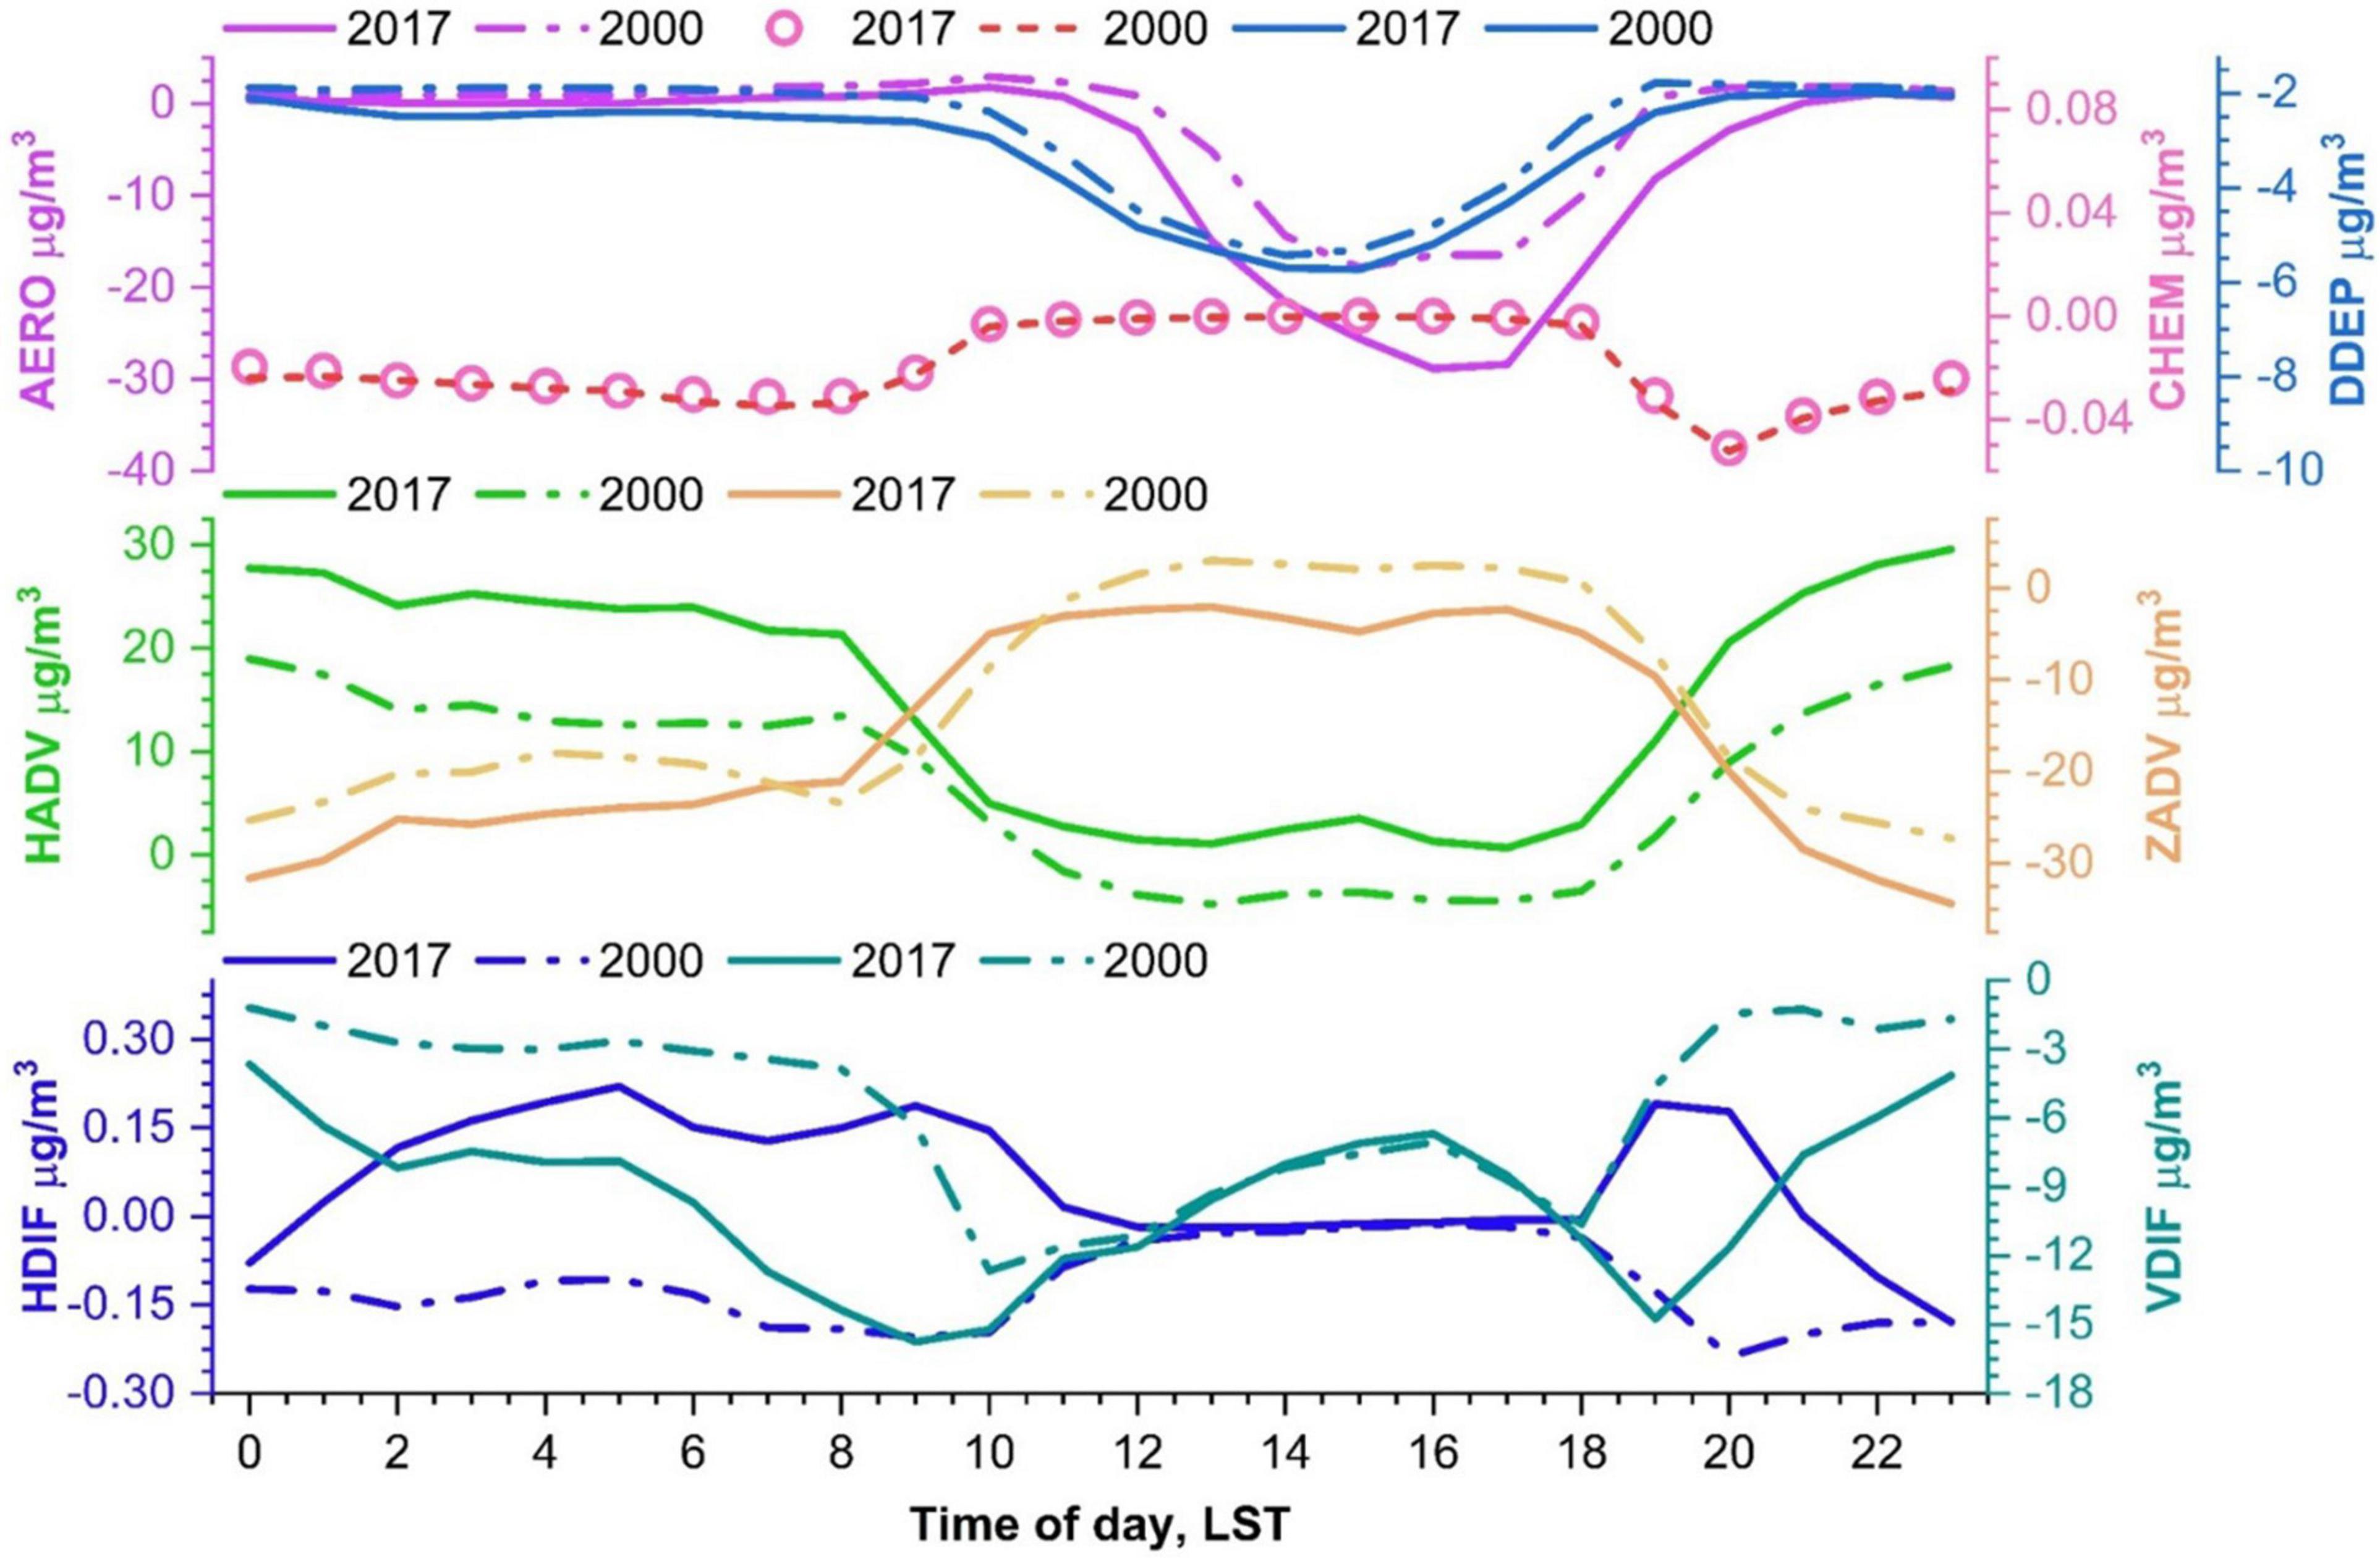
Figure 9. Diurnal pattern of physical and chemical processes for PM2.5 in 2000 and 2017. The average data was calculated from the value of UEA.
Figure 10 shows the spatial distribution of simulated O3 at 00:00, 06:00, 12:00, and 18:00 during the summer episode. It is worth noting that the Mountain Range area situated in the northwestern Chengdu exhibited elevated O3 levels between 00:00 and 06:00 with peak O3 concentrations spiking above 200 μg/m3, which is mainly attributed to weak NOx titration at night due to the relatively low anthropogenic NOx emissions over this region. In contrast, O3 levels in metropolitan Chengdu showed a typical diurnal pattern which is characterized by peak concentrations occurring in the afternoon and decreasing to a low level (less than 30 μg/m3) at night due to sufficient NOx titration.
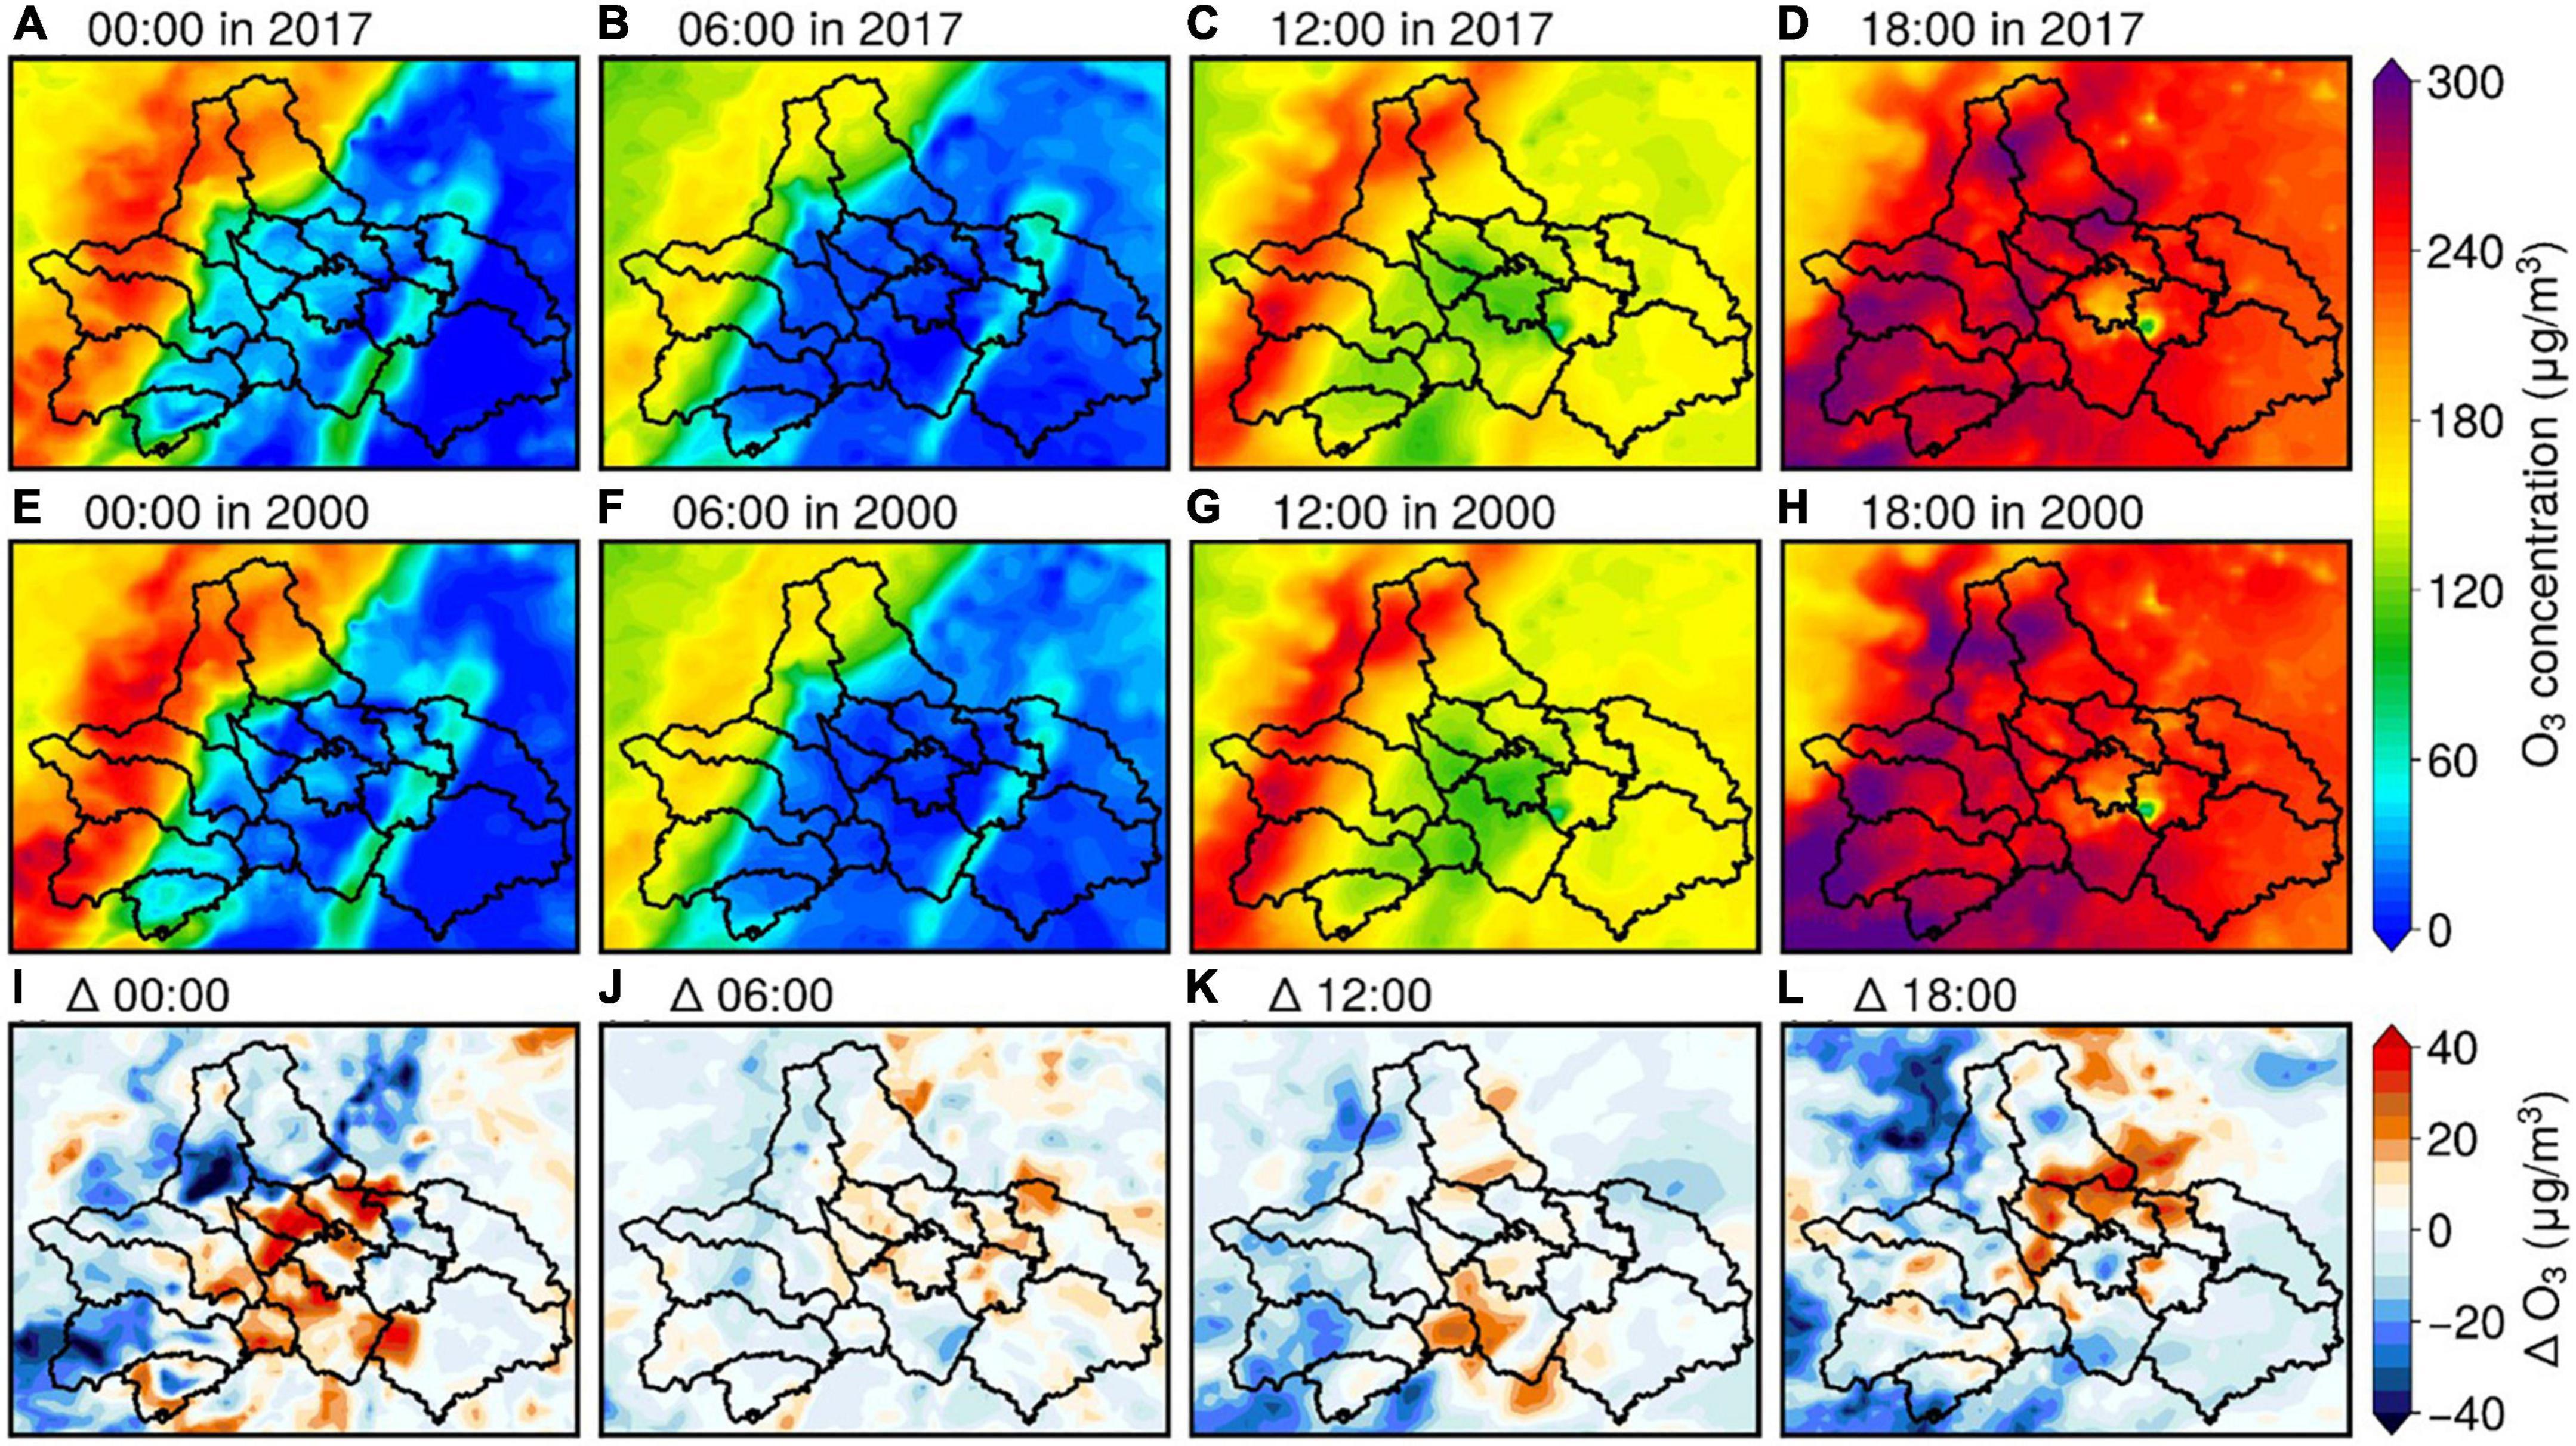
Figure 10. Spatial map of simulated O3 levels and O3 variations induced by land use change between 2000 and 2017 at 00:00, 06:00, 12:00, and 18:00.
In comparison to the difference in O3 concentrations between 2000 and 2017, O3 levels in UEA increase significantly at midnight (00:00) with an enhancement magnitude reaching 40 μg/m3, which is consistent with the variation of nocturnal temperature in Supplementary Figure 5B. This pattern implies that the impacts of the thermal inertia of urban buildings govern this phenomenon, as the cooling rates over anthropogenic land surface are lower than natural LULC. Furthermore, there is a notable increase in O3 concentrations at 18:00 throughout the UEA with a similar spatial pattern and magnitude as 00:00. Figure 11 demonstrates that O3 and NO2 concentrations increased significantly at 20:00 with values of 61.4 and 62.3 μg/m3, respectively, while the concentrations of O3 and NO2 did not change significantly during the daytime, which is due to that VI had remarkable increase around 20:00 while VI changed marginally during the daytime. Thus, regions with lower NO2 levels (i.e., UEA) would accumulate more O3 concentrations due to the weaker titration during the nighttime.
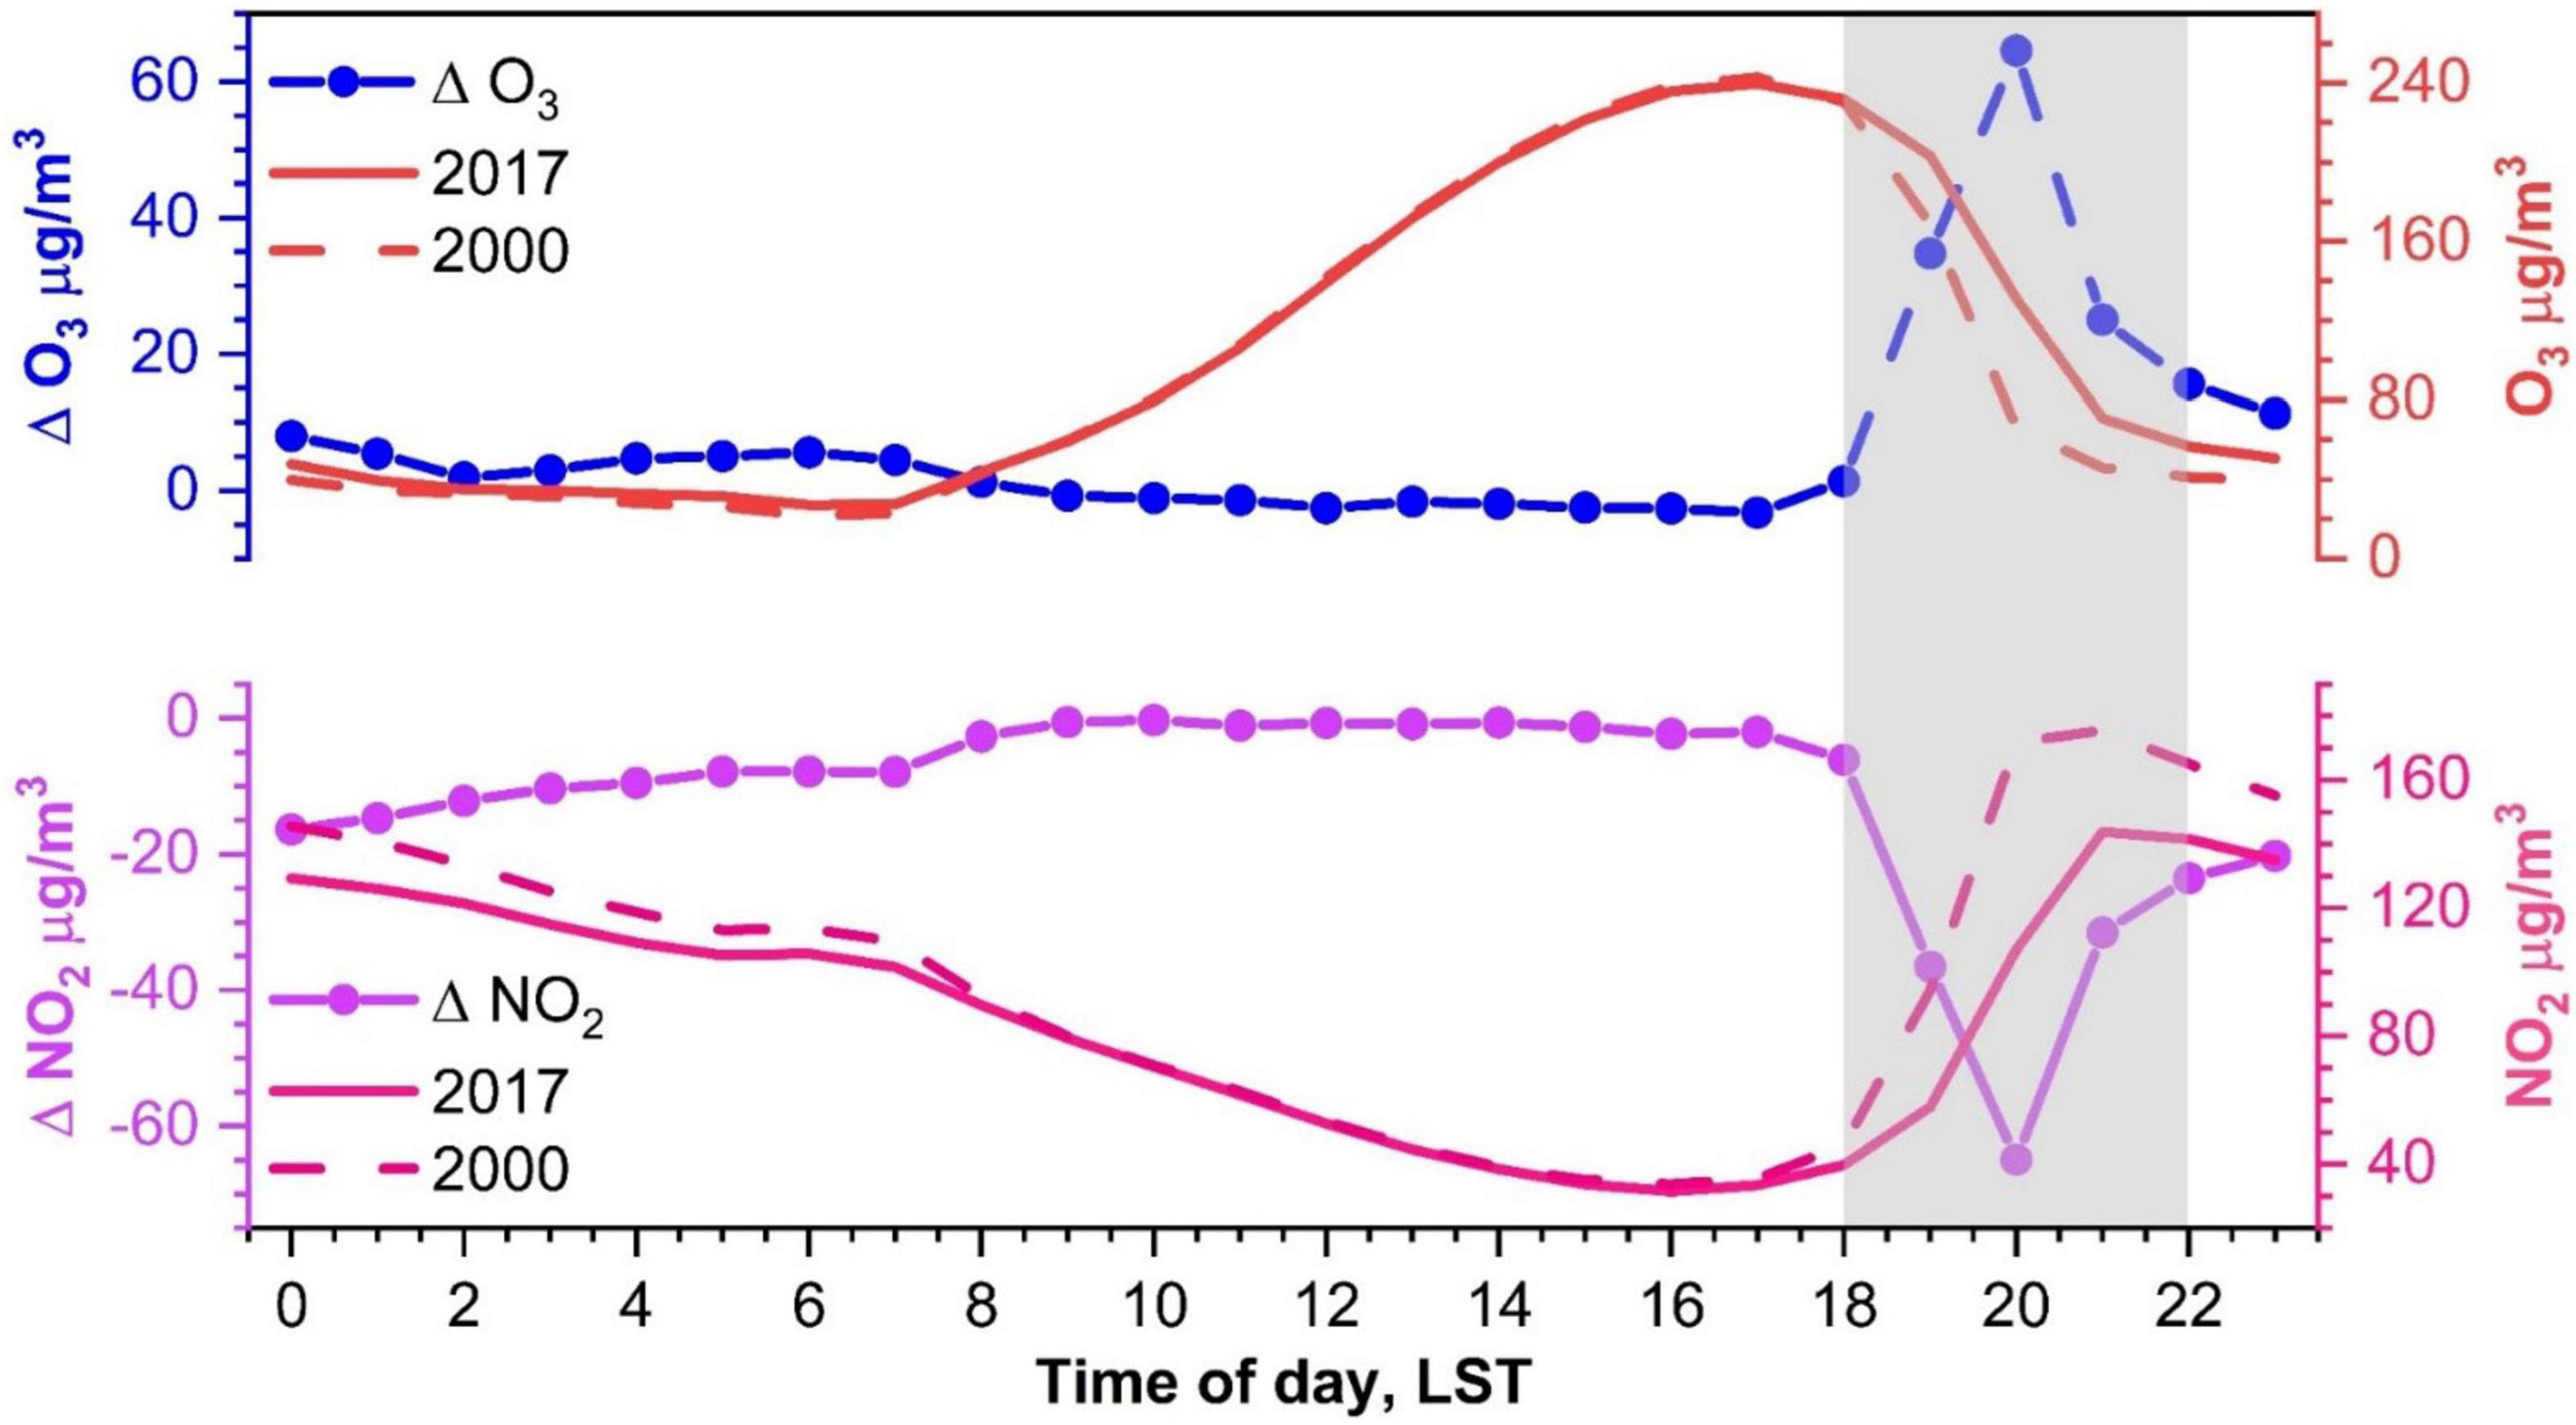
Figure 11. Diurnal pattern of O3 and NO2 over UEA of Chengdu between 2000 and 2017. The average data was calculated by the value over UEA.
Changes in O3 concentrations are mainly caused by HADV and VDIF processes, as seen in Figure 12. Accumulated contribution from VDIF increase to 323.4 μg/m3 becasuse PBLH and vertical wind speed both increase induced by urbanization. In terms of HADV process, the increase of WS10 facilitates the dispersion and transport outflow of O3, which cause O3 concentrations to decrease by 133.7 μg/m3 in 2017 while to increase 43.3 μg/m3 in 2000. Higher plant fraction in 2000 leads to stronger DDEP process during the daytime because vegetation could consume O3 through plant stomata. However, during the nighttime, the intensity of DDEP process in 2000 is weaker than that in 2017 which is due to that O3 concentrations in 2000 is much lower than that in 2017 at this time.
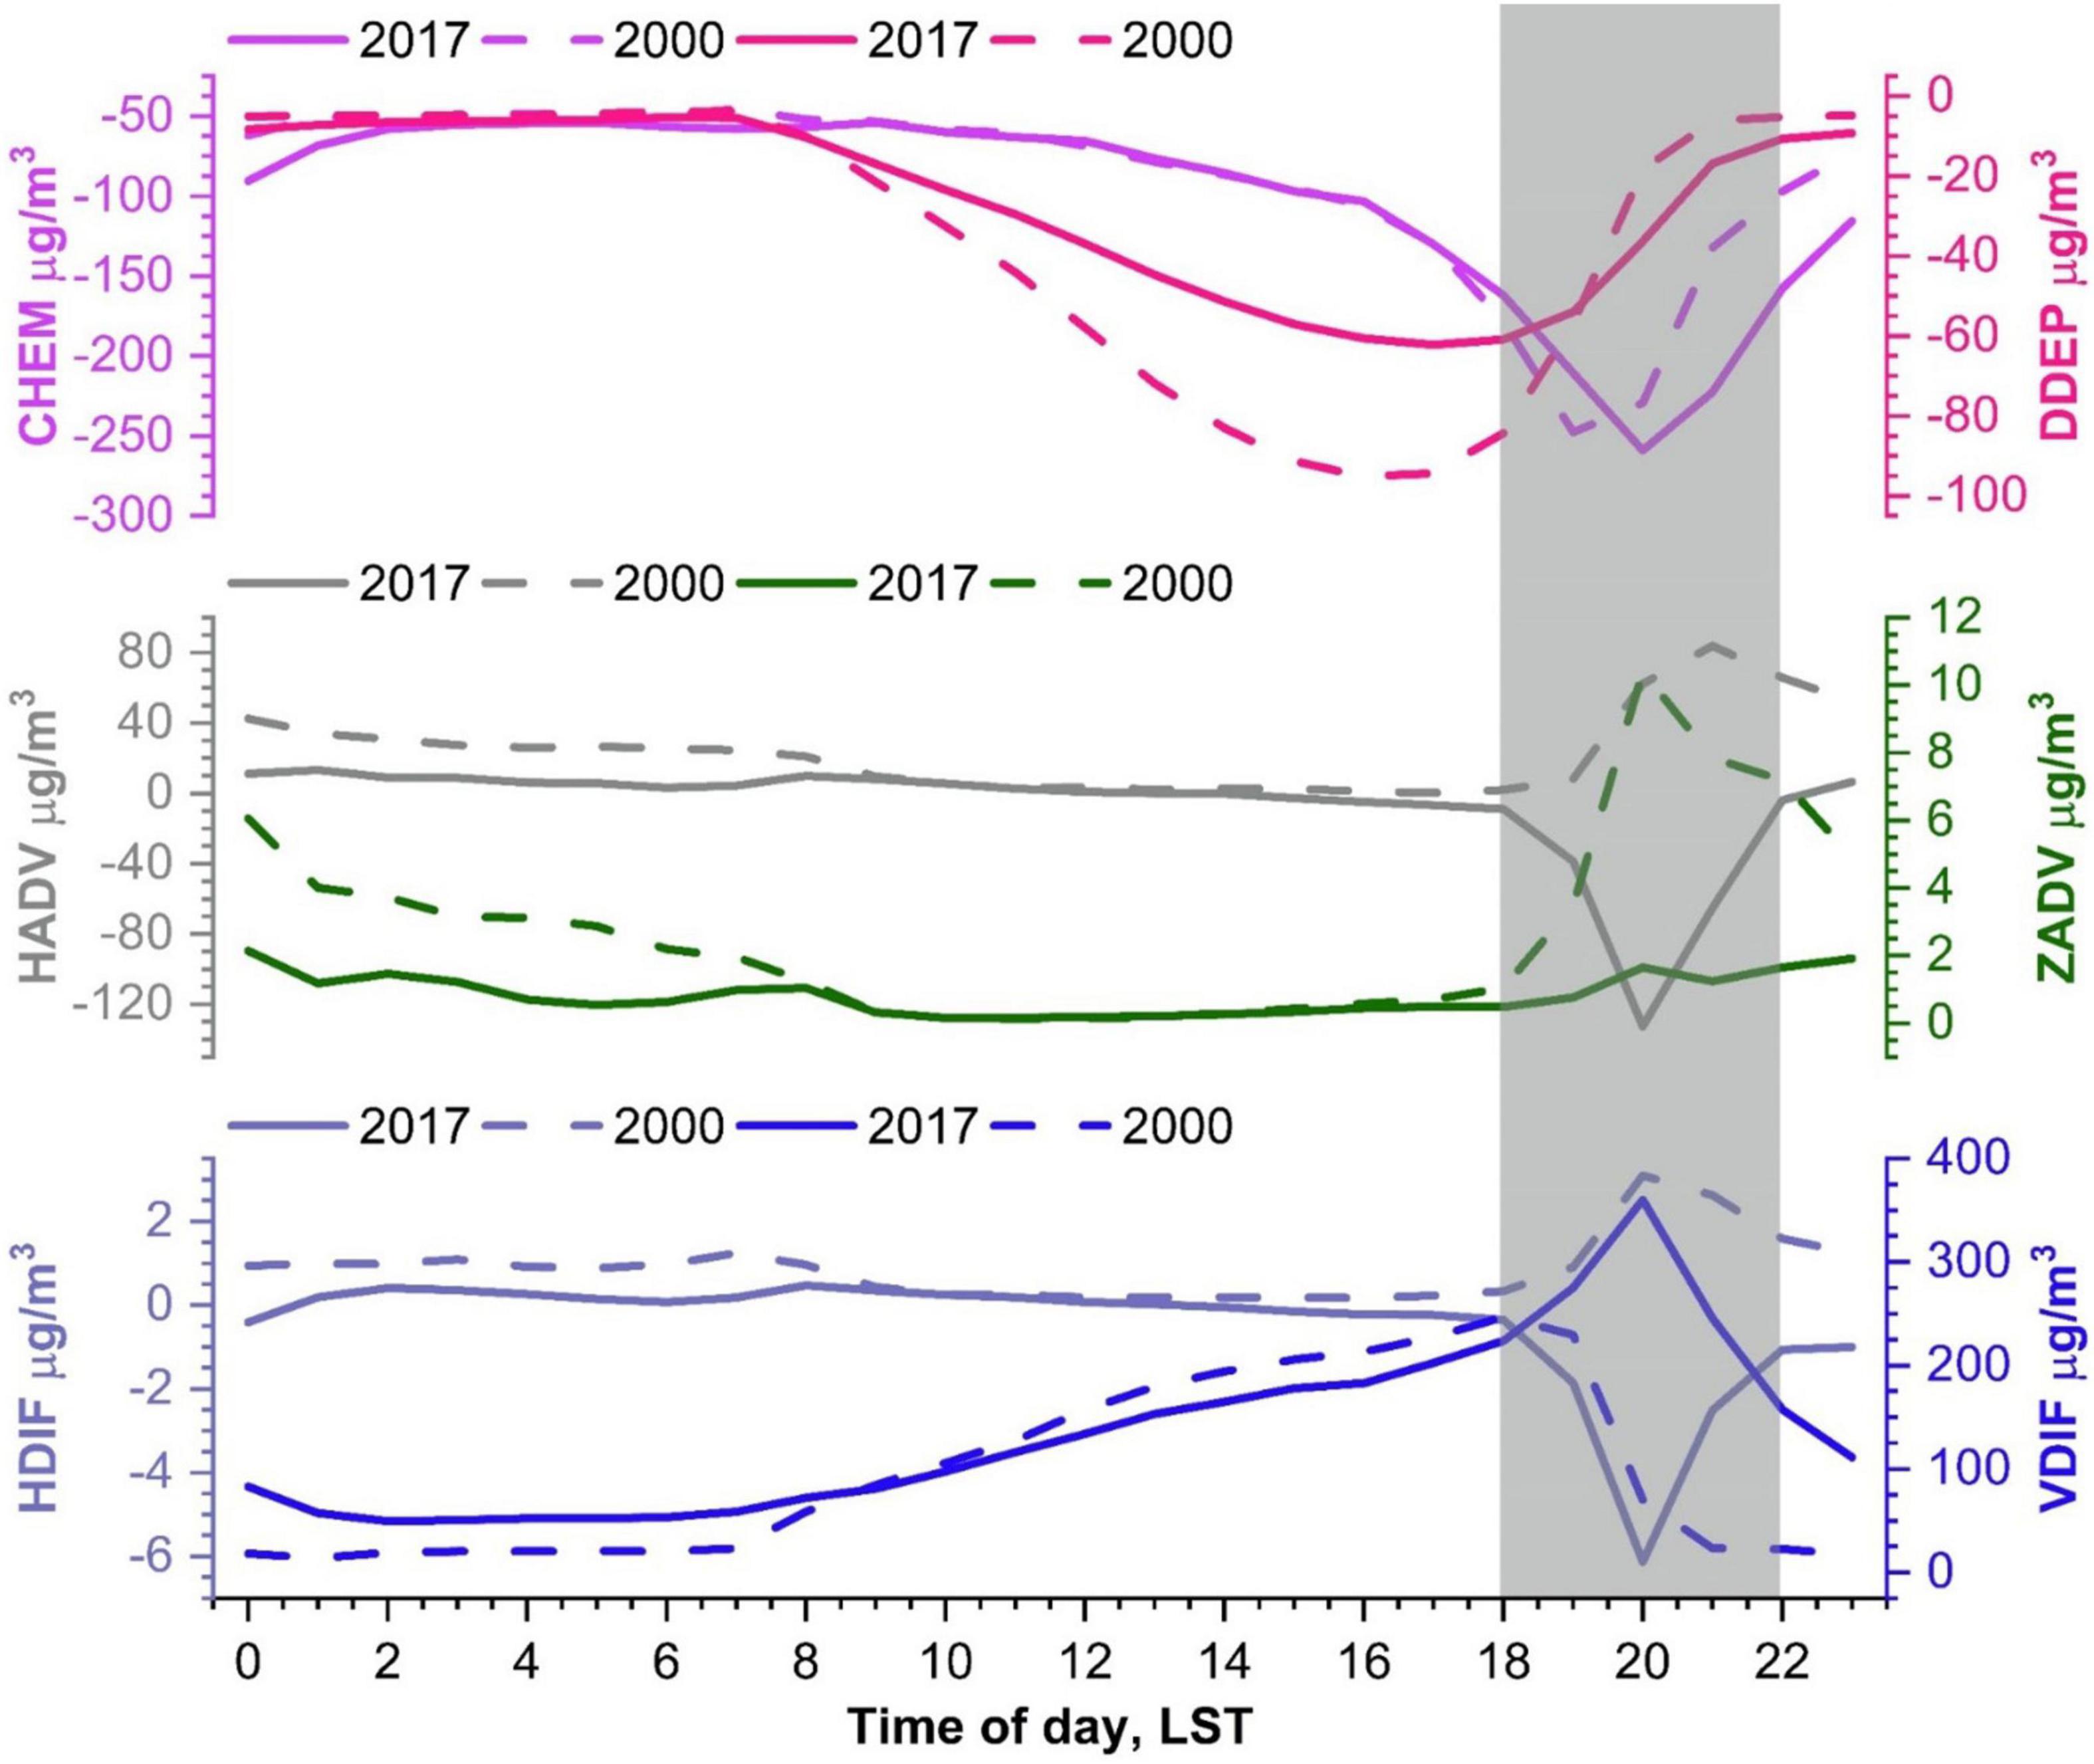
Figure 12. Diurnal pattern of physical and chemical processes for O3 in 2000 and 2017. The average data was calculated from the value of UEA.
In this study, we use parallel WRF-UCM-CMAQ modeling with LULC data in 2000 and 2017 to investigate the effects of urbanization on regional meteorology and air quality in Chengdu, a typical megacity in the southwestern China. Changes in key meteorological parameters and air pollutants levels are compared in a summertime high O3 event and a winter PM2.5 episode.
Our results find that land surface alteration induced by urbanization exhibits profound effects on meteorological parameters across UEA. In winter, urbanization leads to reduced T2 (by −1.1°C) and increased VI (by 819 m2/s) during the daytime, while increasing T2 (by 0.46°C) and VI (by 328 m2/s) at night in summer, urbanization increased T2 throughout the day (0.55°C during the day and 2.0°C at night) while VI increased by 1,161 m2/s during 18:00-20:00 and decreased by 355 m2/s during the other times. The magnitude difference in nocturnal T2 between winter and summer is mainly because the intense solar radiation in summer lead urban surface to store more heat, which can raise T2 at night. The differences in VI can be attributed to changes in PBLH and WS10 caused by increased surface roughness and reduced surface albedo, as well as energy changes in atmospheric turbulence caused by SE.
Changes in regional meteorology have an impact on gaseous pollutants concentrations and particulate pollution. PM2.5 concentrations are dictated by the various competing processes, including (a) the gas-particle phase partitioning, (b) the atmospheric oxidation rate, and (c) ventilation. In addition, urbanization caused the LULC from vegetation dominated shift to the anthropogenic land surface, which results in reduced BSOA concentrations (by 3.4 μg/m3). These processes lead to PM2.5 decrease by 33.2 and 4.6 μg/m3 during the daytime and nighttime, respectively. For O3, it is found that urbanization leads to insignificant changes in daytime O3 levels while nocturnal O3 concentrations in 2017 substantially increase as compared with 2000, which is attributed to VDIF process at night bringing in more concentrations.
Here, we demonstrate the crucial effects of urbanization on urban meteorological parameters and its subsequent influence on air quality by taking the megacity of Chengdu as an example. The findings of this work contribute insight into developing climate adaptation and air pollution mitigation strategies for megacities and heavily urbanized areas.
Publicly available datasets were analyzed in this study. This data can be found here: http://meicmodel.org/, https://earthdata.nasa.gov/, and https://rda.ucar.edu/datasets/ds083.2/index.html.
HW: conceptualization, methodology, formal analysis, investigation, writing—original draft, visualization, and project administration. ZL: conceptualization and project administration. KW: conceptualization and writing—review and editing. JQ: review and editing. YZ: conceptualization, writing—review and editing, and project administration. BY and MH: resources and data curation. All authors contributed to the article and approved the submitted version.
This study was funded by the National Natural Science Foundation of China (No. 41901294), the Scientific Research Foundation of CUIT (No. KYTZ201909), the Science and Technology Department of Sichuan Province Foundation (No. 21YYJC3604), the Key Research and Development Projects of Sichuan Science and Technology (No. 2022YFS0482), Sichuan Science and Technology Program (No. 2020YFG0144), and FengYun Application Pioneering Project (No. FY-APP-2021.0208).
The authors declare that the research was conducted in the absence of any commercial or financial relationships that could be construed as a potential conflict of interest.
All claims expressed in this article are solely those of the authors and do not necessarily represent those of their affiliated organizations, or those of the publisher, the editors and the reviewers. Any product that may be evaluated in this article, or claim that may be made by its manufacturer, is not guaranteed or endorsed by the publisher.
We thank the MEIC team from Tsinghua University for providing the Multiscale Emission Inventory of China (MEIC).
The Supplementary Material for this article can be found online at: https://www.frontiersin.org/articles/10.3389/fevo.2022.845801/full#supplementary-material
Appel, K. W., Bash, J. O., Fahey, K. M., Foley, K. M., Gilliam, R. C., Hogrefe, C., et al. (2021). The Community Multiscale Air Quality (CMAQ) model versions 5.3 and 5.3.1: system updates and evaluation. Geosci. Model Dev. 14, 2867–2897. doi: 10.5194/gmd-14-2867-2021
Boylan, J. W., and Russell, A. G. (2006). PM and light extinction model performance metrics, goals, and criteria for three-dimensional air quality models. Atmosph. Env. 40, 4946–4959. doi: 10.1016/j.atmosenv.2005.09.087
Chen, S.-H., and Sun, W.-Y. (2002). A One-dimensional Time Dependent Cloud Model. J. Meteorol. Soc. Jap. 80, 99–118. doi: 10.2151/jmsj.80.99
Chou, M.-D., Suarez, M. J., Liang, X.-Z., Yan, M. M.-H., and Cote, C. (2001). A Thermal Infrared Radiation Parameterization for Atmospheric Studies. NASA Technique Report NASA/TM-2001-104606. Greenbelt, MD: National Aeronautics and Space Administration, Goddard Space Flight Center.
Ek, M. B., Mitchell, K. E., Lin, Y., Rogers, E., Grunmann, P., Koren, V., et al. (2003). Implementation of Noah land surface model advances in the National Centers for Environmental Prediction operational mesoscale Eta model. J. Geophys. Res. 108:2002JD003296. doi: 10.1029/2002JD003296
Emery, C., Liu, Z., Russell, A. G., Odman, M. T., Yarwood, G., and Kumar, N. (2017). Recommendations on statistics and benchmarks to assess photochemical model performance. J. Air Waste Manag. Assoc. 67, 582–598. doi: 10.1080/10962247.2016.1265027
Fan, C., Myint, S., Kaplan, S., Middel, A., Zheng, B., Rahman, A., et al. (2017). Understanding the Impact of Urbanization on Surface Urban Heat Islands—A Longitudinal Analysis of the Oasis Effect in Subtropical Desert Cities. Remote Sens. 9:672. doi: 10.3390/rs9070672
Fang, C., Qiu, J., Li, J., and Wang, J. (2022). Analysis of the meteorological impact on PM2.5 pollution in Changchun based on KZ filter and WRF-CMAQ. Atmospheric Env. 271:118924. doi: 10.1016/j.atmosenv.2021.118924
Grimm, N. B., Faeth, S. H., Golubiewski, N. E., Redman, C. L., Wu, J., Bai, X., et al. (2008). Global Change and the Ecology of Cities. Science 319, 756–760. doi: 10.1126/science.1150195
Guenther, A. B., Jiang, X., Heald, C. L., Sakulyanontvittaya, T., Duhl, T., Emmons, L. K., et al. (2012). The Model of Emissions of Gases and Aerosols from Nature version 2.1 (MEGAN2.1): an extended and updated framework for modeling biogenic emissions. Geosci. Model Dev. 5, 1471–1492. doi: 10.5194/gmd-5-1471-2012
Janjić, Z. I. (1994). The Step-Mountain Eta Coordinate Model: Further Developments of the Convection, Viscous Sublayer, and Turbulence Closure Schemes. Mon. Wea. Rev. 122, 927–945. doi: 10.1175/1520-04931994122<0927:TSMECM<2.0.CO;2
Kim, G., Lee, J., Lee, M.-I., and Kim, D. (2021). Impacts of urbanization on atmospheric circulation and aerosol transport in a coastal environment simulated by the WRF-Chem coupled with urban canopy model. Atmosph. Env. 249:118253. doi: 10.1016/j.atmosenv.2021.118253
Kusaka, H., and Kimura, F. (2004). Coupling a Single-Layer Urban Canopy Model with a Simple Atmospheric Model: impact on Urban Heat Island Simulation for an Idealized Case. J. Meteorol. Soc. J. 82, 67–80. doi: 10.2151/jmsj.82.67
Li, Y., Zhang, J., Sailor, D. J., and Ban-Weiss, G. A. (2019). Effects of urbanization on regional meteorology and air quality in Southern California. Atmos. Chem. Phys. 19, 4439–4457. doi: 10.5194/acp-19-4439-2019
Lian, J., Wu, L., Bréon, F.-M., Broquet, G., Vautard, R., Zaccheo, T. S., et al. (2018). Evaluation of the WRF-UCM mesoscale model and ECMWF global operational forecasts over the Paris region in the prospect of tracer atmospheric transport modeling. Elementa: Sci. Anthrop. 6:64. doi: 10.1525/elementa.319
Liao, J., Wang, T., Wang, X., Xie, M., Jiang, Z., Huang, X., et al. (2014). Impacts of different urban canopy schemes in WRF/Chem on regional climate and air quality in Yangtze River Delta, China. Atmosph. Res. 145–146, 226–243. doi: 10.1016/j.atmosres.2014.04.005
Lin, C.-Y., Su, C.-J., Kusaka, H., Akimoto, Y., Sheng, Y.-F., Huang, J.-C., et al. (2016). Impact of an improved WRF urban canopy model on diurnal air temperature simulation over northern Taiwan. Atmos. Chem. Phys. 16, 1809–1822. doi: 10.5194/acp-16-1809-2016
Mlawer, E. J., Taubman, S. J., Brown, P. D., Iacono, M. J., and Clough, S. A. (1997). Radiative transfer for inhomogeneous atmospheres: RRTM, a validated correlated-k model for the longwave. J. Geophys. Res. 102, 16663–16682. doi: 10.1029/97JD00237
Murphy, B. N., Woody, M. C., Jimenez, J. L., Carlton, A. M. G., Hayes, P. L., Liu, S., et al. (2017). Semivolatile POA and parameterized total combustion SOA in CMAQv5.2: impacts on source strength and partitioning. Atmos. Chem. Phys. 17, 11107–11133. doi: 10.5194/acp-17-11107-2017
Pye, H. O. T., Murphy, B. N., Xu, L., Ng, N. L., Carlton, A. G., Guo, H., et al. (2017). On the implications of aerosol liquid water and phase separation for organic aerosol mass. Atmos. Chem. Phys. 17, 343–369. doi: 10.5194/acp-17-343-2017
Salamanca, F., Martilli, A., Tewari, M., and Chen, F. (2011). A Study of the Urban Boundary Layer Using Different Urban Parameterizations and High-Resolution Urban Canopy Parameters with WRF. J. Appl. Meteorol. Climat. 50, 1107–1128. doi: 10.1175/2010JAMC2538.1
Seto, K. C., Guneralp, B., and Hutyra, L. R. (2012). Global forecasts of urban expansion to 2030 and direct impacts on biodiversity and carbon pools. Proc. Natl. Acad. Sci. 109, 16083–16088. doi: 10.1073/pnas.1211658109
Skamarock, W. C., Klemp, J. B., Dudhia, J., Gill, D. O., Liu, Z., Berner, J., et al. (2019). A Description of the Advanced Research WRF Model Version 4. UCAR/NCAR. doi: 10.5065/1DFH-6P97
Vahmani, P., and Ban-Weiss, G. A. (2016). Impact of remotely sensed albedo and vegetation fraction on simulation of urban climate in WRF-urban canopy model: A case study of the urban heat island in Los Angeles: Satellite-supported urban climate model. J. Geophys. Res. Atmos. 121, 1511–1531. doi: 10.1002/2015JD023718
Vahmani, P., and Hogue, T. S. (2014). Incorporating an Urban Irrigation Module into the Noah Land Surface Model Coupled with an Urban Canopy Model. J. Hydromet. 15, 1440–1456. doi: 10.1175/JHM-D-13-0121.1
Vahmani, P., Sun, F., Hall, A., and Ban-Weiss, G. (2016). Investigating the climate impacts of urbanization and the potential for cool roofs to counter future climate change in Southern California. Environ. Res. Lett. 11, 124027. doi: 10.1088/1748-9326/11/12/124027
Wang, H., Liu, Z., Zhang, Y., Yu, Z., and Chen, C. (2021). Impact of different urban canopy models on air quality simulation in Chengdu, southwestern China. Atmosph. Env. 267:118775. doi: 10.1016/j.atmosenv.2021.118775
Wang, K., Tong, Y., Gao, J., Gao, C., Wu, K., Yue, T., et al. (2021). Impacts of LULC, FDDA, Topo-wind and UCM schemes on WRF-CMAQ over the Beijing-Tianjin-Hebei region, China. Atmosph. Pollut. Res. 12, 292–304. doi: 10.1016/j.apr.2020.11.011
Wu, K., Wang, Y., Qiao, Y., Liu, Y., Wang, S., Yang, X., et al. (2022). Drivers of 2013–2020 ozone trends in the Sichuan Basin China: Impacts of meteorology and precursor emission changes. Env. Pollut. 300:118914. doi: 10.1016/j.envpol.2022.118914
Wu, K., Yang, X., Chen, D., Gu, S., Lu, Y., Jiang, Q., et al. (2020). Estimation of biogenic VOC emissions and their corresponding impact on ozone and secondary organic aerosol formation in China. Atmosph. Res. 231:104656. doi: 10.1016/j.atmosres.2019.104656
Wu, K., Zhu, S., Liu, Y., Wang, H., Yang, X., Liu, L., et al. (2021). Modeling Ammonia and Its Uptake by Secondary Organic Aerosol Over China. Geophys. Res. Atmos. 126:34109. doi: 10.1029/2020JD034109
Xu, C.-X., Chen, J.-H., Li, Y., He, M., Feng, X.-Q., and Han, L. (2020). Emission Inventory and Characteristics of Anthropogenic Air Pollution Sources Based on Second Pollution Source Census Data in Sichuan Province. Huan Jing Ke Xue 41, 4482–4494. doi: 10.13227/j.hjkx.202002162
Yang, X., Wu, K., Wang, H., Liu, Y., Gu, S., Lu, Y., et al. (2020a). Summertime ozone pollution in Sichuan Basin, China: Meteorological conditions, sources and process analysis. [J]. Atmos. Environ. 226:117392.
Yang, X., Lu, Y., Zhu, X., He, J., Jiang, Q., Wu, K., et al. (2020b). Formation and Evolution Mechanisms of Severe Haze Pollution in the Sichuan Basin, Southwest China. Aerosol. Air. Qual. Res. 20, 2557–2567. doi: 10.4209/aaqr.2020.04.0173
Yang, X., Wu, K., Lu, Y., Wang, S., Qiao, Y., Zhang, X., et al. (2021). Origin of regional springtime ozone episodes in the Sichuan Basin, China: Role of synoptic forcing and regional transport. Environ. Poll. 278:116845. doi: 10.1016/j.envpol.2021.116845
Keywords: urbanization, air quality, land use, land cover, complex terrain
Citation: Wang H, Liu Z, Wu K, Qiu J, Zhang Y, Ye B and He M (2022) Impact of Urbanization on Meteorology and Air Quality in Chengdu, a Basin City of Southwestern China. Front. Ecol. Evol. 10:845801. doi: 10.3389/fevo.2022.845801
Received: 30 December 2021; Accepted: 05 May 2022;
Published: 31 May 2022.
Edited by:
Yuzhong Zhang, Westlake University, ChinaReviewed by:
Shan Yin, Shanghai Jiao Tong University, ChinaCopyright © 2022 Wang, Liu, Wu, Qiu, Zhang, Ye and He. This is an open-access article distributed under the terms of the Creative Commons Attribution License (CC BY). The use, distribution or reproduction in other forums is permitted, provided the original author(s) and the copyright owner(s) are credited and that the original publication in this journal is cited, in accordance with accepted academic practice. No use, distribution or reproduction is permitted which does not comply with these terms.
*Correspondence: Yang Zhang, emhhbmd5YW5nQGN1aXQuZWR1LmNu
Disclaimer: All claims expressed in this article are solely those of the authors and do not necessarily represent those of their affiliated organizations, or those of the publisher, the editors and the reviewers. Any product that may be evaluated in this article or claim that may be made by its manufacturer is not guaranteed or endorsed by the publisher.
Research integrity at Frontiers
Learn more about the work of our research integrity team to safeguard the quality of each article we publish.