- 1School of Science, University of Waikato, Tauranga, New Zealand
- 2Red Sea Research Center, King Abdullah University of Science and Technology, Thuwal, Saudi Arabia
- 3School of Applied Sciences, Edinburgh Napier University, Edinburgh, United Kingdom
- 4Department of Environment and Sustainability, The Red Sea Development Company, Riyadh, Saudi Arabia
Mangrove forests play an important role in facilitating biogeochemical pathways and cycling acting as blue carbon sinks. These services are primarily regulated by the activity of the soil microbiome. However, there is still limited research into spatial and temporal variation patterns of bacterial community assemblages in mangrove soils. This study investigated important ecological scales of microprocesses that govern microbial communities in an arid mangrove ecosystem. Shifts in microbial community composition were influenced by fluctuations in environmental factors within the mangrove forests of the Red Sea influenced by seasonal changes in sea level. Notably, in summer microbial communities in shrub sites differed significantly from the fringe and the winter samples, with lower alpha diversity yet a higher dominance of specialized species capable of surviving in extreme conditions. The onset of dispersal limitation and heterogenous selection and the reduction of drift are likely the main forces shaping community assemblages. Specifically, in summer lower mean tidal levels eliminate tidal inundation creating a harsh high salinity and high temperature environment with no tidal connection thereby influencing the onset of dispersal limitation. An increased understanding of the spatial and temporal variation of bacterial communities is critical when assessing delivery of ecosystem services and their role in soil biogeochemical processes.
Introduction
Mangrove forests are among the world’s most productive habitats providing essential ecosystem services including coastal protection, fisheries, nutrient cycling and nursery habitat. Mangroves also play important roles in facilitating biogeochemical pathways and acting as blue carbon sinks with the majority of carbon bound in the soil (Donato et al., 2011; Alongi, 2020; Jennerjahn, 2020). This important ecosystem service is driven primarily by the activity of the associated soil microbial communities (Alongi, 1994; Holguin et al., 2001; Thomson et al., 2022). Despite their role in the delivery of this ecosystem service microbial communities in mangrove soils have received little attention in comparison to other marine and terrestrial environments (Thompson et al., 2017; Bahram et al., 2018). Notably, there is still limited research into spatial and temporal variation patterns of bacterial community assemblages in mangrove soils (Ma et al., 2020; Zhang et al., 2021). A few studies have assessed the role of biotic and abiotic factors to better understand the ecological drivers that influence spatial patterns of microbial communities in mangrove soils (Alongi, 2005; Reef et al., 2010; Thomson et al., 2022). The temporal dynamics of microbial assemblages and how they are influenced by environmental variability in marine systems has been noted to be poorly explored, representing a significant research gap (Trevathan-Tackett et al., 2019).
Preliminary research indicates that short-term microbial temporal variability can be surprisingly consistent, with predictable patterns over the period of days to weeks for macroalgae (Lachnit et al., 2011), corals (Kimes et al., 2013), and sponges (Simister et al., 2013). However, at longer seasonal time periods evidence for the scales at which coastal microbiomes shift along with the drivers behind these shifts is often conflicting (Trevathan-Tackett et al., 2019). For example, studies indicating stability in the microbiome over time and location (Lema et al., 2014; Fahimipour et al., 2017) contradict studies that suggest that microbial communities are highly variable and influenced by habitat forming species and environmental conditions (Cúcio et al., 2016; van de Water et al., 2018). Whilst some of these inconsistencies relate to the scale of various studies, it has been concluded that these conflicting patterns prevent us from generalizing about the stability or variability of microbial communities (Trevathan-Tackett et al., 2019). Even less information is available for mangrove habitats which are subjected to significant short term tidal and seasonal variations in salinity, temperature, oxygen content, and hydrodynamic fluctuations (Alongi, 2009). These environmental variations require mangrove microbial species to be capable of adapting to such highly dynamic conditions (Kathiresan and Bingham, 2001).
Mangrove stands within the central Red Sea are characterized by high seasonal and spatial variability of environmental conditions within forest stands (Almahasheer et al., 2016a,b; Shaltout et al., 2020). They consist of a single tree species Avicennia marina which are further characterized by two distinct zones: a seaward fringe zone formed by taller trees and a landward shrub zone formed by dwarf individuals (Price et al., 1987; Kumar et al., 2010; Carvalho et al., 2019). These two distinct zones are influenced by cyclical fluctuations of sea-levels that change over the seasons and leave the shrub zone unflooded between the months of May and November with consequent water scarcity and high salinity (Manasrah et al., 2009; Churchill et al., 2018; Antony et al., 2022). These conditions are one of the primary drivers behind the forest architecture with smaller dwarf trees in the landward zone (Anton et al., 2020). Conversely, the fringe zone is always influenced by tidal flows that alleviate salinity stress and avoid heat desiccation, resulting in taller trees with more dense pneumatophores. These seasonal fluctuations influence the ecology of Red Sea arid mangrove forests as well as the ecological processes in these two distinct zones (Adame et al., 2020; Anton et al., 2020).
Based on a recent horizon scanning exercise two key research questions have emerged (Trevathan-Tackett et al., 2019). Firstly, how does the resolution at which we study microbiomes influence how we interpret differences in their composition and function at spatial and temporal scales? Secondly, how is resilience and stability influenced in the context of variability? This research therefore aims to address this research gap investigating how mangrove microbiomes are influenced temporally given their unique conditions. In this study we collect associated environmental data in a highly dynamic system to elucidate potential drivers associated with seasonal shifts in microbial communities in two different zones of an arid mangrove ecosystem.
Materials and Methods
The samples were collected from an Avicennia marina stand at the Ibn Sina research station (22.33°N; 39.09°E) near the city of Thuwal, Saudi Arabia (Figure 1). For clarification, we define two main seasons on the basis of temperature and precipitation data: Summer, which is dry and hot and lasts from May through to October, and Winter, which is colder and experiences precipitation events and spans between November and April. The average high temperature in summer reaches 35–37°C with no precipitation. In the winter, average high temperatures are around 27–31°C with a precipitation of up to 200 mm between November and April (data from: Jeddah Regional Climate Center). Sea level also varies with season. In summer the sea level drops and part of the mangrove remains exposed with no tidal influence (i.e., our shrubs site) while in winter the sea level rises again and the mangrove is entirely flooded (Manasrah et al., 2009; Pugh et al., 2019). To capture the contrasting conditions that were present across the two main seasons, samples were collected at two sampling time points: Sampling for the dry and hot season, in which the sea level of the Red Sea was low, was conducted in early October 2018, and sampling for the colder and wetter season, where the sea level inundated the entire shrub forest, was done in December 2018.
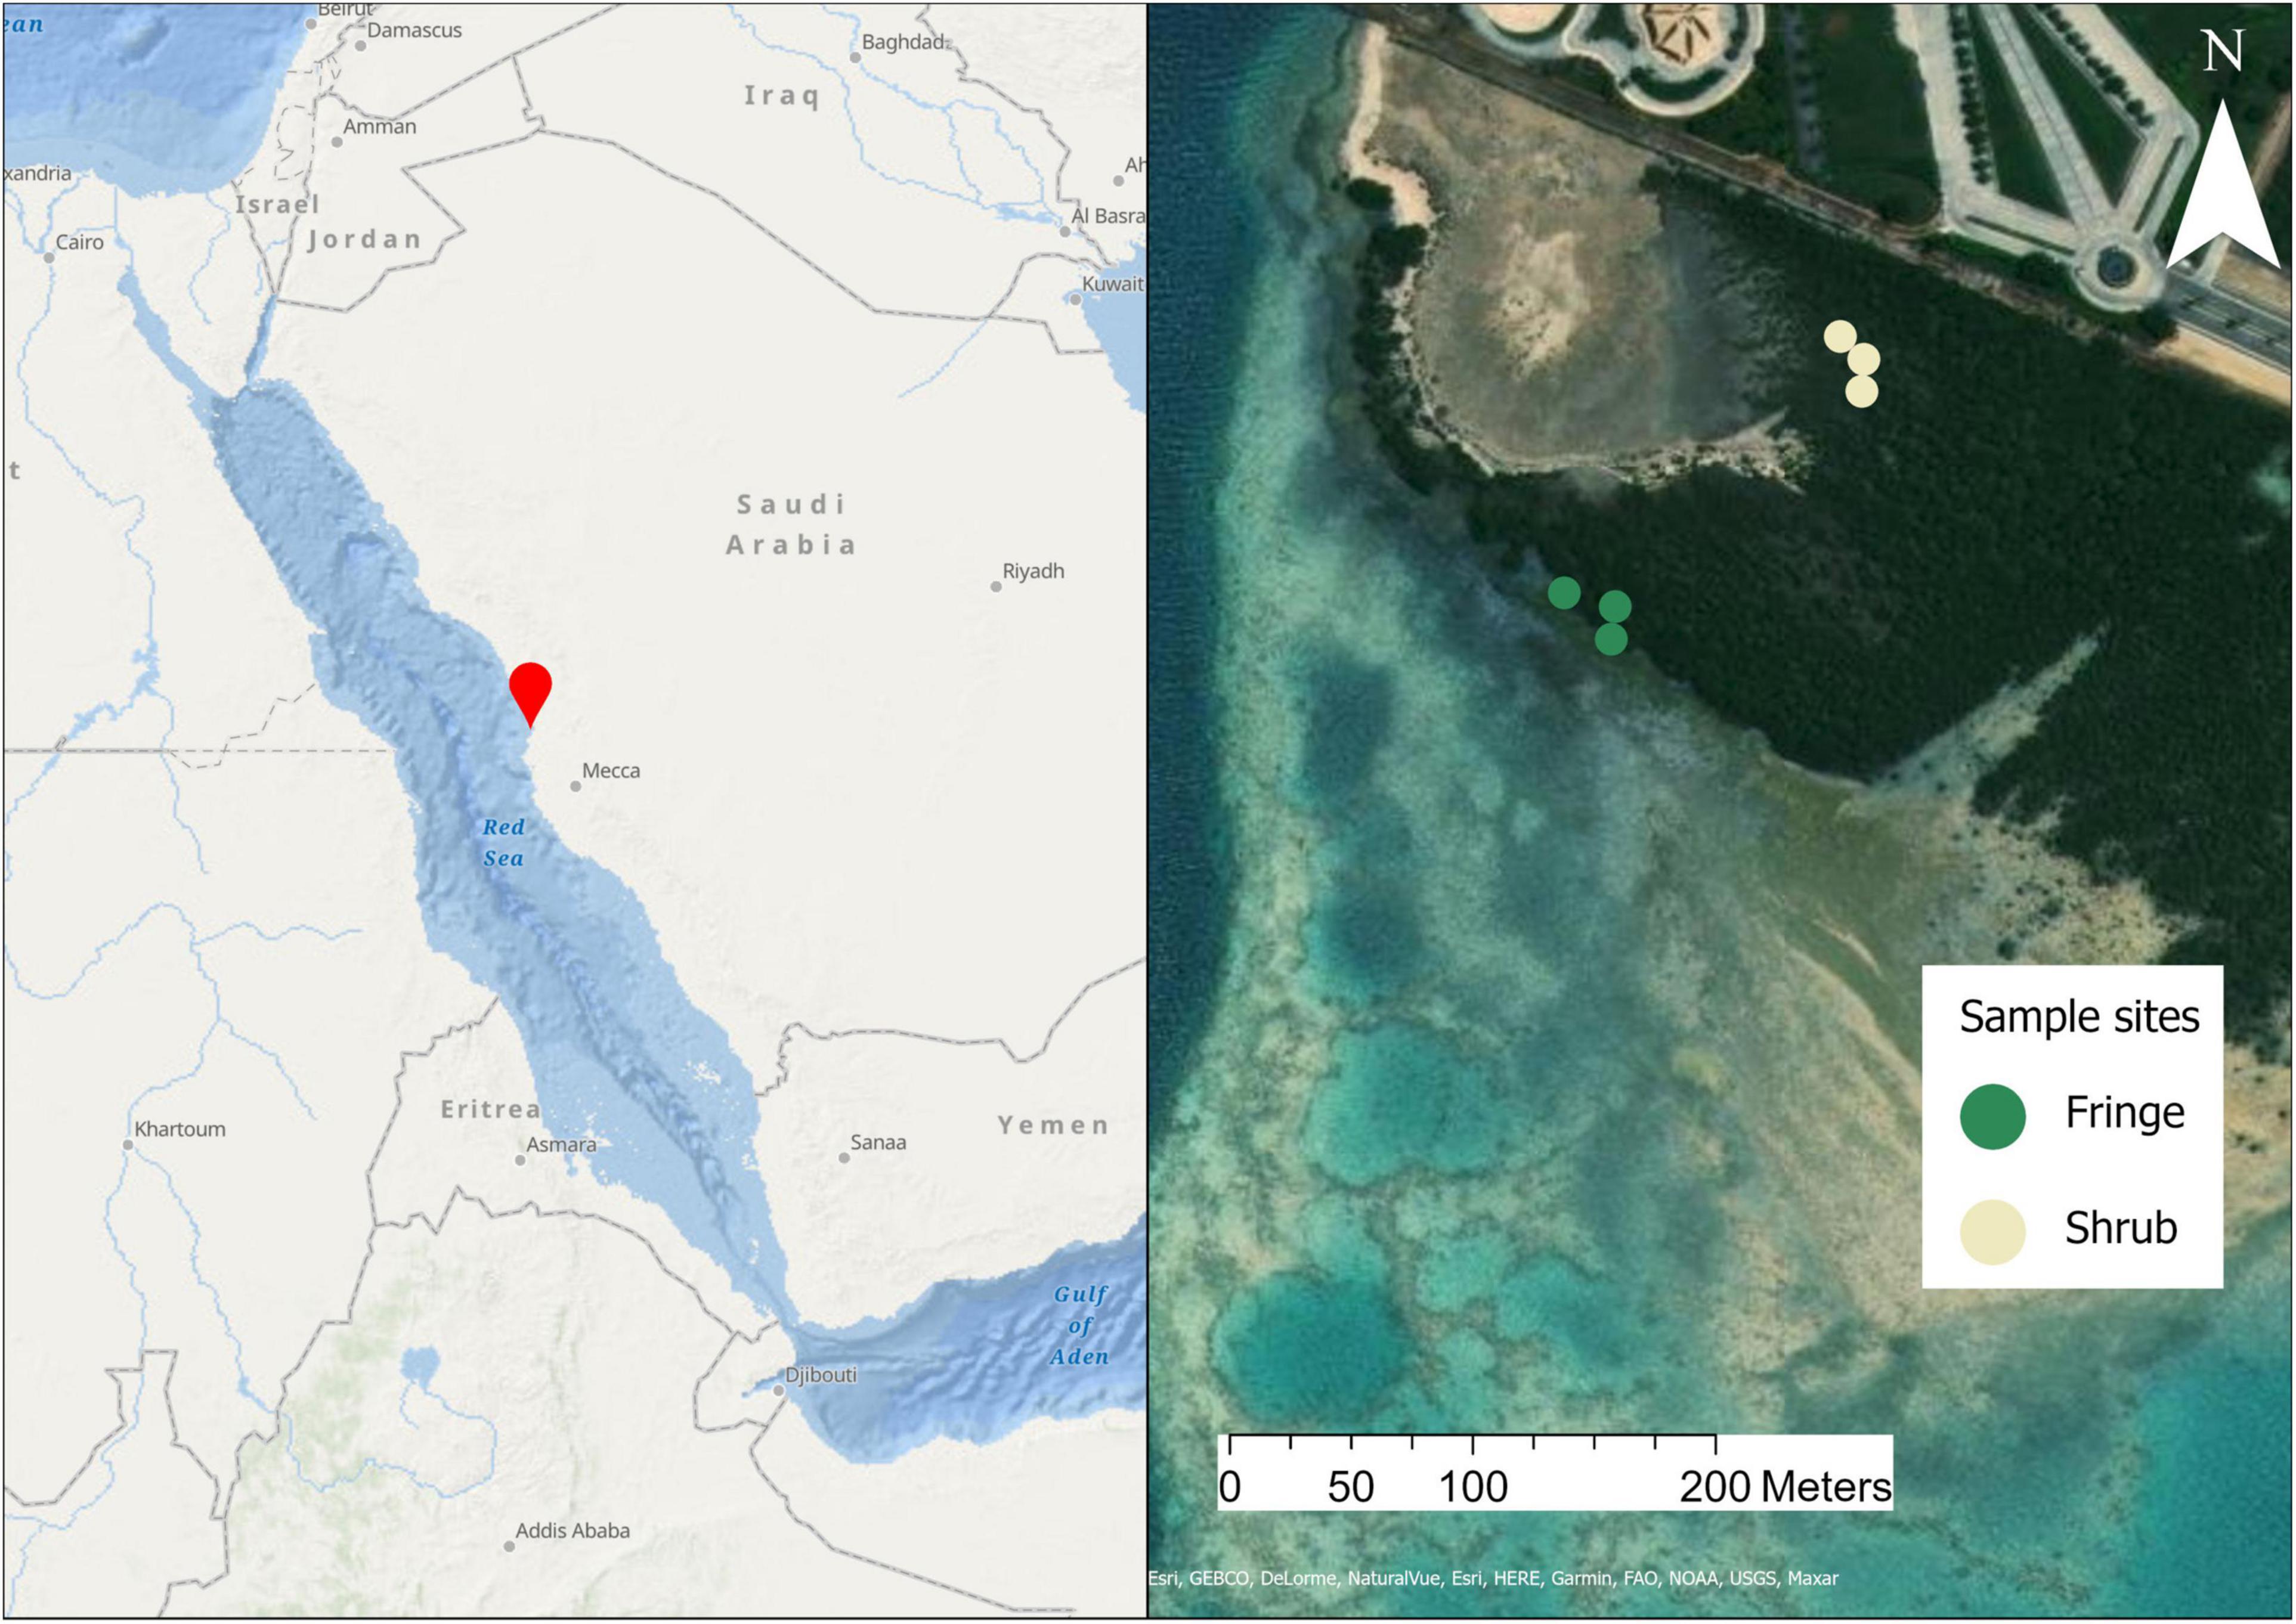
Figure 1. Map of the study area. The left side shows the site location in the central Red Sea. On the right is a satellite image of the sampling site showing the contrasting zones. From each indicated location (colored dots) three replicate samples were collected. The established sites were sampled once during each season sampling campaign. Sources: Esri, GEBCO, NOAA, National Geographic, DeLorme, HERE, Geonames.org, and other contributors.
Soil samples were collected from the tall fringing zone of the forest and from the interior of the stand, the shrub zone. Nine replicate cores were taken per zone and subsequently divided into surface (0–2 cm) and subsurface (5–7 cm) layers. The following sampling procedures correspond to the methods described in Thomson et al. (2022). Soil cores were collected using a 60 mL polyethylene syringe with cut-off tip (3 cm diameter), that extended to 10 cm depth. Samples were kept in the dark on ice and were taken to the laboratory for storage at −80°C, 2–3 h after the sampling was completed. Soil samples were pooled into triplicates for soil, salinity, and nutrient analyses (total n = 24), whereas individual samples were analyzed for microbial DNA (total n = 72).
Soil Analysis
Grain Size
Soil grain size was determined by wet sieving and subsequent calculation of the dry weight percentage fractions. Grain size fractions were gravel (>2,000 μm), very coarse sand (<2,000 and > 1,000 μm), coarse sand (<1,000 and > 500 μm), medium sand (< 500 and > 250 μm), fine sand (< 250 and > 125 μm), very fine sand (< 125 and > 63 μm), and silt (< 63 μm) (after Wentworth, 1922). Soil grain sizes were grouped into major fractions silt and clay (<63 μm), sand (63–500 μm), and coarse sand to granule gravel (500–2,000 μm) for redundancy analysis but were represented as mean volume-based diameter in the summary table for ease of visual representation (Allen, 1990).
Salinity
Salinity was measured using a handheld salinity refractometer calibrated with ultra-pure water (milliQ) prior to the measurements. Approximately 5 g of soil was dried and ground, thereafter 25 mL of ultra-pure water (milliQ) were added. Samples were then placed on a rotary shaker at 250 rpm for 30 min and subsequently centrifuged at 10 G for 8 min. One drop of supernatant was measured on the refractometer. The values were recorded in percent salinity per 1 g of soil and are shown in practical salinity units (psu) (Radojevic and Bashkin, 2007).
Nutrients
Total organic carbon and total nitrogen were determined using an elemental analyzer (Flash 2000 CHNS/O Elemental analyzer, Thermo Fisher Scientific, Waltham, MA, United States). Soil samples were dried and 10 g weighed into silver (Ag) and tin capsules, respectively. Samples for organic carbon analysis were acidified with 3 M HCl for removal of inorganic carbon prior to analysis (Zimmermann and Keefe, 1997). Soil samples for total phosphorus were dried at 30°C and subsequently digested using a combination of nitric and hydrochloric acids at 180°C. Analysis of total phosphorus was done by inductively coupled plasma optical emission spectrometry (ICP-OES 5110, Agilent Technologies, Santa Clara, CA, United States) (EPA, 1996).
DNA Extraction and Target Gene Amplification
The DNA extraction and target gene amplification techniques used here, are described in Thomson et al. (2022). DNA for bacterial community analysis was extracted from approximately 0.8 g of soil, using the DNeasy® PowerSoil® Kit (Qiagen, Hilden, Germany). Using the specific primers 341F and 805R 113 with overhang illumina adapters (Illumina Inc., San Diego, CA, United States), the V3–V4 hypervariable regions of the 16S rRNA gene were amplified by polymerase chain reaction (PCR), at a final reaction volume of 25 μL per sample (Klindworth et al., 2013). The amplified samples were cleaned to remove primer-dimers and non-targeted DNA molecules using the SequalPrep® Normalization Plate (96) Kit (Invitrogen, Carlsbad, CA, United States). Library preparation was carried out using the Nextera® XT Index kit (Illumina Inc., San Diego, CA, United States) in combination with the Qiagen Multiplex PCR Master Mix (Qiagen, Hilden, Germany) that uses the HotStarTaq DNA Polymerase. The cycler was set to 95°C as initial temperature for 15 min, followed by 8 cycles of 95°C for 30 s, 55°C for 90 s, and 72°C for 30 s, and a final extension with 95°C for 5 min (as specified by the manufacturer), before a second clean-up and normalization step was performed [SequalPrep® Normalization Plate (96) Kit, Invitrogen, Carlsbad, CA, United States]. The libraries were then concentrated by vacuum centrifugation to approximately 12–15 nM, their concentration was measured by qPCR, and the amplicon length was validated with a Bioanalyzer at the KAUST Bioscience Core Lab. The samples were then sequenced on the Illumina MiSeq® platform—v3 chemistry—(Illumina Inc., San Diego, CA, United States) with paired-end sequencing over 301 cycles.
Bioinformatics
The PCR primer sequences were removed from the dereplicated reads using the cutadapt software v. 2.1 (Martin, 2013) with a max error rate of 7%. Untrimmed sequences were removed. The DADA2 software package v. 1.10 (Callahan et al., 2016) was used to differentiate exact amplicon sequence variants (ASVs) and remove chimeras. Filtering parameters used were: maxN = 0, maxEE = c(3, 6), trunclen = c(260, 190), trunQ = 2. DADA2’s core algorithm models the errors in Illumina-sequenced reads and assigns ASVs with an accuracy of two base pairs (bp) difference, based on the quality score distribution (Callahan et al., 2016). The resulting ASVs were used for taxonomic classification using the SILVA database v. 132 (Quast et al., 2012). Eukaryotic and archaeal amplification artifacts that were also targeted by the relatively unspecific range of the V3–V4 primers used, were removed from the data set for downstream analysis. Rare ASVs (prevalence threshold of < 0.5% relative to the total abundance of ASVs) were removed. Samples that contained < 10,000 reads were removed and the remaining samples were rarefied to the minimum depth of 11,063 sequences per sample (R package phyloseq v. 1.26.1, seed = 33) (McMurdie and Holmes, 2013). In total, four samples were discarded due to repeated non-amplification of the target gene, and further four samples due to insufficient sequencing depth (0, 0, 8,695, and 9,334 sequences). Sequences were aligned (R package DECIPHER v 2.12.0) (Wright, 2016) for phylogenetic tree construction (R package phangorn v 2.5.5) (Schliep, 2011), from which the alpha diversity metric of phylogenetic diversity (Faith’s PD) was calculated (R package picante v 1.8.2) (Kembel et al., 2010). The final abundance table contained 3,383 ASVs across 64 samples, after filtration of erroneous sequences (archaeal, chloroplast, or mitochondrial) and removal of rare ASVs (5% prevalence threshold). The asymptotic rarefaction curves of each sample show that the majority of the taxonomic diversity was covered sufficiently by the sequencing depth and suggested a rarefaction threshold of 10,000 sequences per sample (Supplementary Figure 1). Agglomeration of samples to the phylum and genus level resulted in 41 unique phyla and 231 genera.
Statistical Analysis
All statistical analyses were performed in R (Core Team, 2021). An extensive list of all packages used can be found in Supplementary Material. The number of observed ASVs and the Shannon diversity index were calculated as descriptive metrics of alpha diversity, using phyloseq. The fixed and independent experimental factors used in this study were season (summer/winter), zone (fringe/shrub), and depth (surface/subsurface). Differences between experimental factors were tested using analysis of variance (ANOVA), after validating that the assumptions of normality of residuals and homoscedasticity were met. Shannon diversity values were normalized by the ranked quantile normalization transformation [package “bestNormalize” v 1.8.2, function “orderNorm()”] (Peterson and Cavanaugh, 2020; Peterson, 2021), after which the normality assumptions were satisfied. Nearest taxon index (NTI) and net relatedness index (NRI) was calculated using the “phytools” package v 0.7-90 (Revell, 2012). Differences in community composition between sites and seasons were assessed by calculating the Bray-Curtis dissimilarity between samples and visualizing them on a non-metric multidimensional scaling (NMDS) plot. Differences were tested using the manyglm() function in mvabund v 4.1.12 (Wang et al., 2012), which fits individual generalized linear models assuming a negative binomial distribution. Indicator species were calculated using “indicspecies” v 1.7.9 (de Cáceres et al., 2011) and differential abundance by the ANCOM-BC package v 1.4.0 (Lin and Peddada, 2020). The measured environmental variables were z-score standardized (R base, scale() function) and checked for collinearity using the Spearman-rank method. Variables with a correlation coefficient of > 0.7 or < −0.7 were considered collinear and excluded from the analysis (Dormann et al., 2013). The differences of environmental factors between sites were tested using permutational analysis of variance (PERMANOVA, vegan package) after validating homogeneity of dispersion between the factors. An ANOVA [anova.cca()] was performed on the Bray-Curtis based redundancy analysis [dbRDA, package = vegan, function dbRDA()] to test for the significance of environmental variables on the community composition matrix. We applied iCAMP, a framework to quantitatively infer community assembly mechanisms by phylogenetic bin-based null model analysis (Ning et al., 2020), to disentangle ecological processes governing mangrove soil microbiome assembly. The Functional Annotation of Prokaryotic taxa (FAPROTAX) database v. 1.2.1 (Louca et al., 2016) was used to perform functional annotation of the ASVs according to literature references of known microbial metabolism. The functions were assigned to the ASV table containing taxonomic annotations (from SILVA database), using the python script “collapse_table.py” in python v. 3.7.4 (Van Rossum and Drake, 2019).
Results
Bacterial Community Composition of Arid Mangrove Soils
The species richness, as described by the number of observed ASVs, varied significantly between seasons and zones [season × zone; F(1, 59) = 5.89, p = 0.018; Figure 2A and Supplementary Table 1]. The greatest difference was between the zones in summer (TukeyHSD, p.adj = 0.001; 41.8% higher in fringe), and a significant mean difference of the shrub sites between the seasons (TukeyHSD, p.adj = 0.04, 28.9% higher in winter). The diversity of each sample was expressed by the Shannon H’ Diversity index. The diversity index showed significant differences between seasons, zones, and depths [season × zone × depth; F(1, 56) = 6.33, p = 0.015; Figure 2B and Supplementary Table 2]. Notably, the diversity of the fringe site in the summer season was significantly higher compared to the shrub (TukeyHSD, p.adj < 0.001, 17.1% increase), but similar compared to both zones in winter.
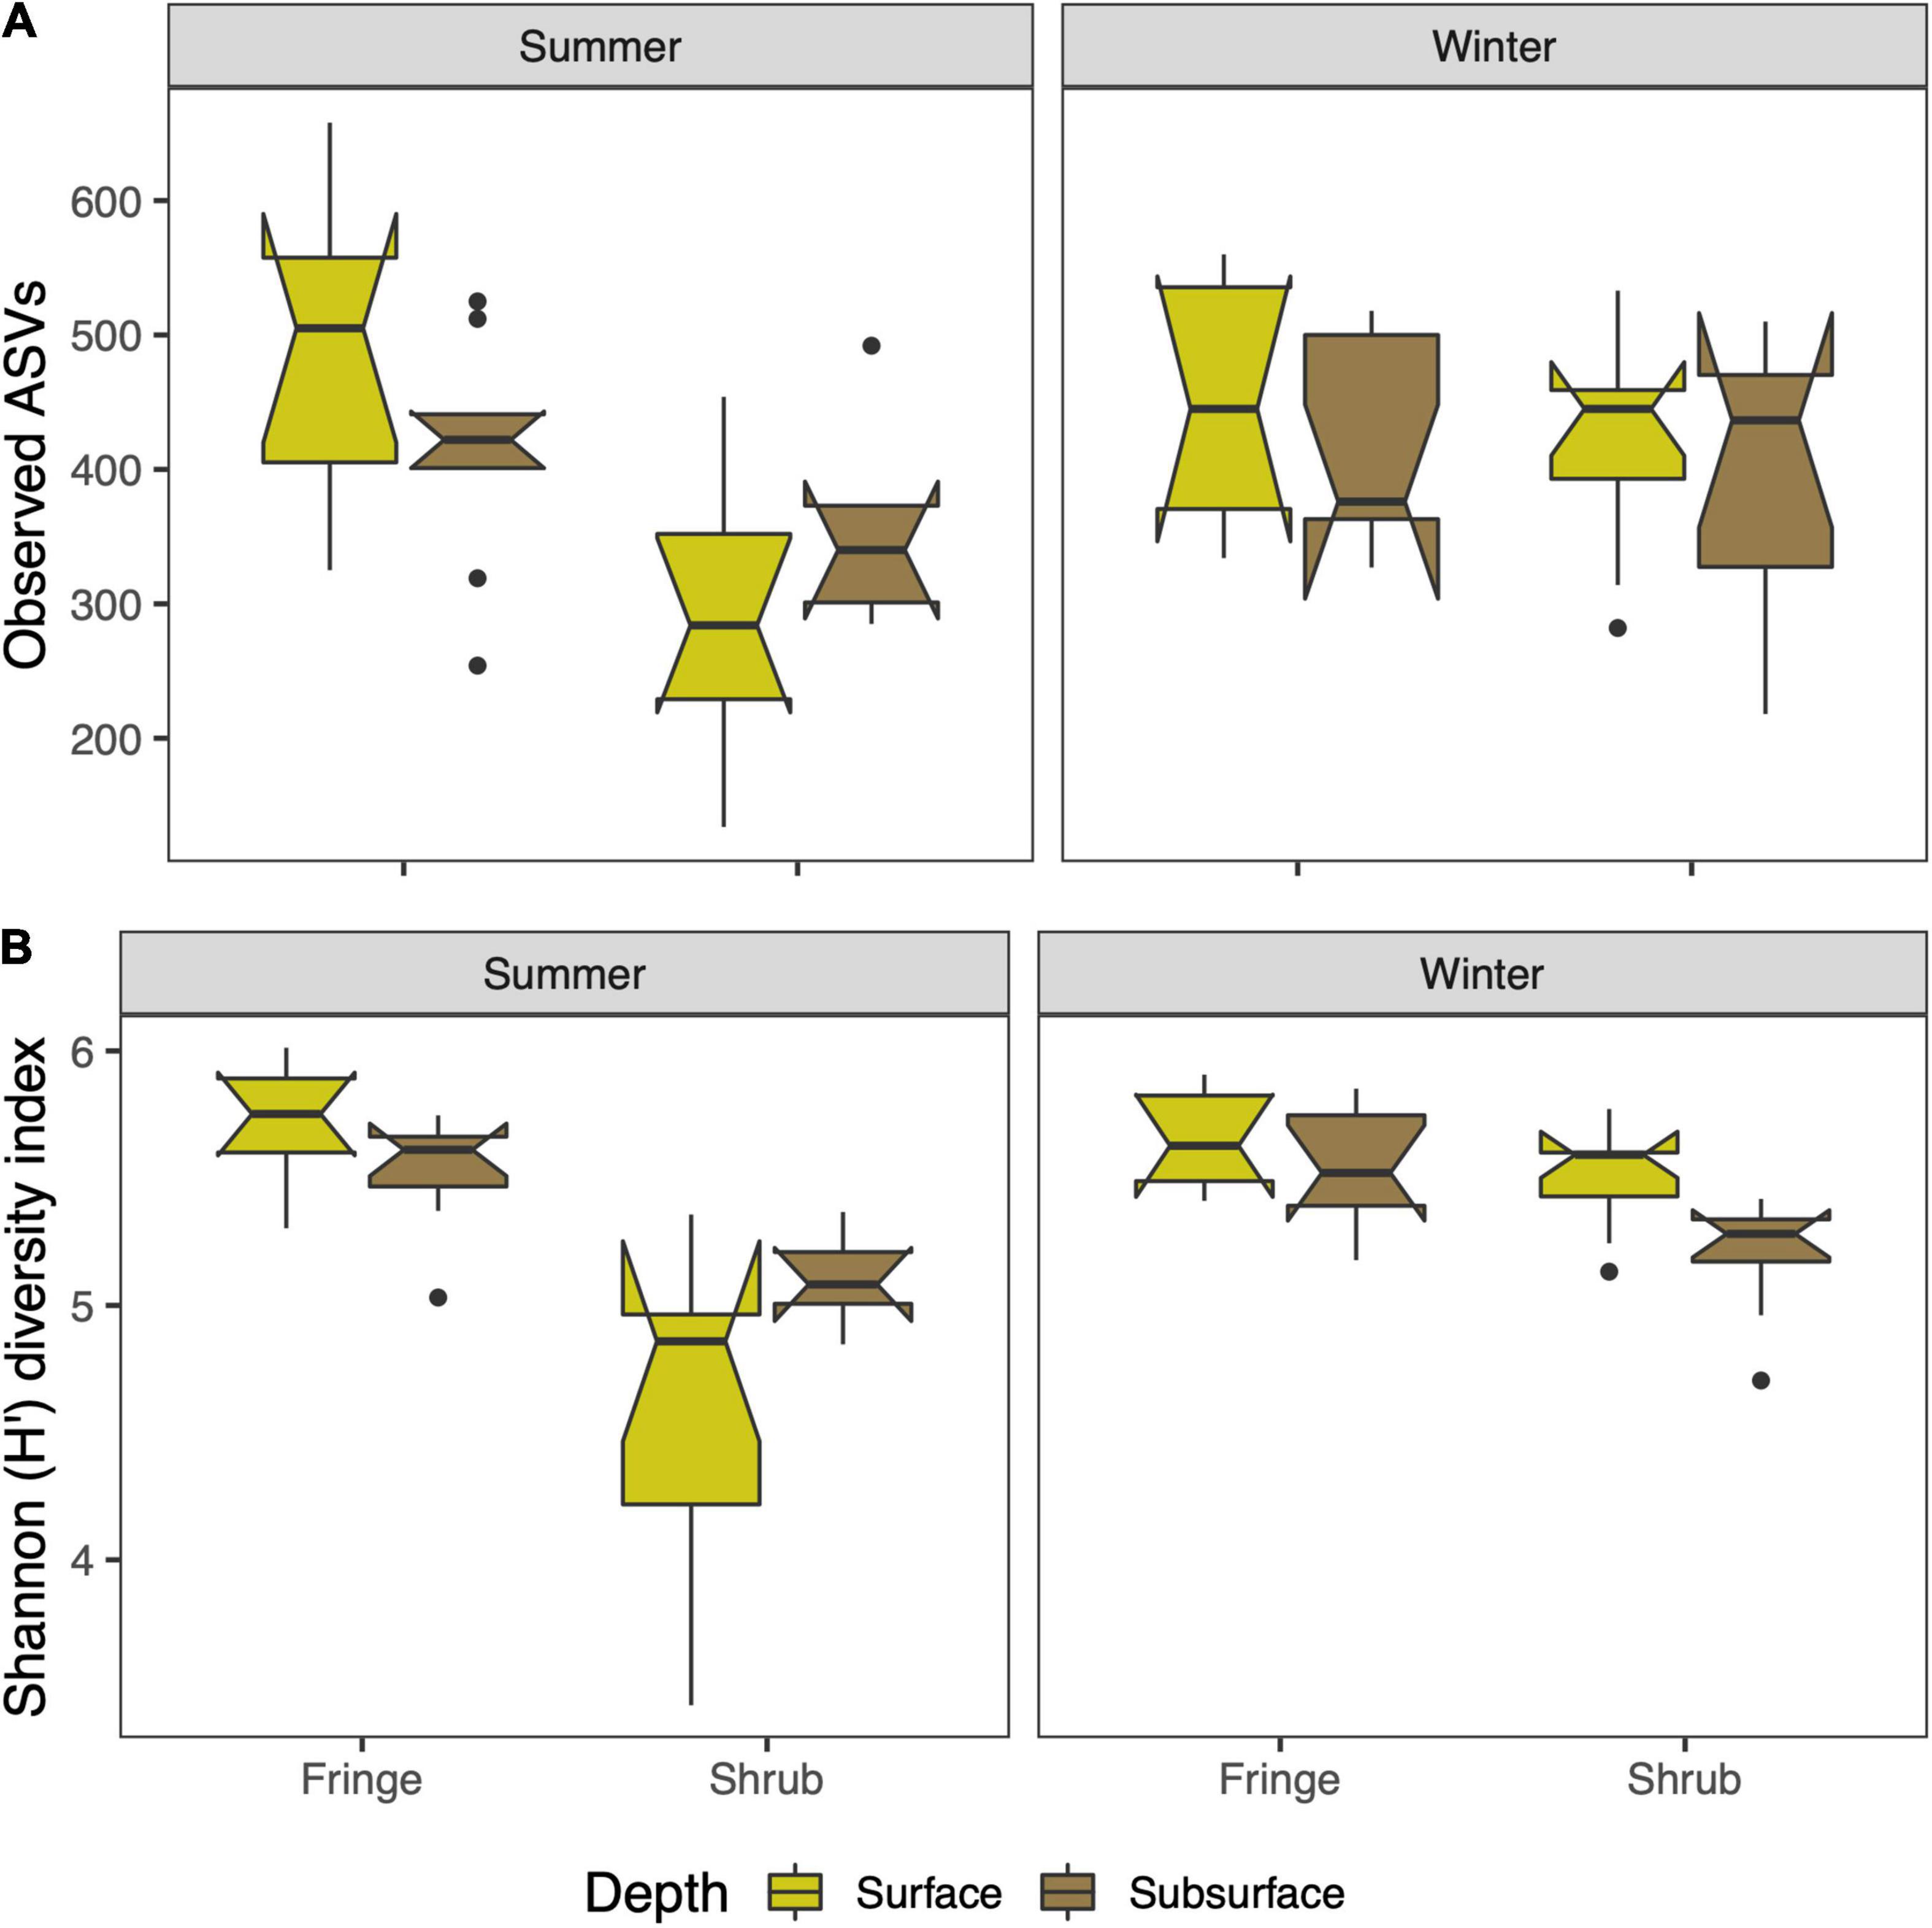
Figure 2. Alpha diversity metrics of the bacterial community of arid mangrove forest soils in the Red Sea. The panels are split by season and display the zones and depths (color). (A) Species richness presented as the number of observed ASVs, and (B) species diversity calculated using the Shannon diversity index. The boxplots indicate the median with the interquartile range (IQR) between the 25th and the 75th percentile and the whiskers extend 1.5*IQR. Boxes were plotted with the notch (± 1.58*IQR/sqrt[n]) to display likely statistical significance if notches do not overlap.
Faith’s PD indicates a higher phylogenetic diversity in the shrub compared to the fringe of both seasons for surface and subsurface soils [zone × depth; F(1, 57) = 6.32, p = 0.015; Figure 3A and Supplementary Table 3], which was driven by the differences between the zones in the subsurface (TukeyHSD; p.adj < 0.01). This difference was more pronounced in the winter season (TukeyHSD; p.adj < 0.001, 27.9% increase in the shrub) as compared to the summer (TukeyHSD; p.adj < 0.001, 15.6% increase in the shrub). The relationship between Faith’s PD and observed ASVs showed consistently steeper inclines in the shrub compared to the fringe (Figure 3B). NTI and NRI were used to characterize the phylogenetic structure of the bacterial communities. Overall, the values were above zero, indicating phylogenetic clustering relative to the null-model. This was more pronounced closer to the tips of the trees, as the tip-sensitive index (NTI) was higher than the tree-wide index (NRI) (mean = 4.9 and 2.1, respectively). The NTI varied significantly between “zone” and “depth” [zone × depth; F(1, 57) = 14.88, p-value < 0.001; Figure 4A and Supplementary Table 4]. This difference was solely driven by the variation in the shrub, where the surface showed significantly higher values than the subsurface (TukeyHSD; p.adj < 0.001), while the difference between depths was not significant in the fringe (TukeyHSD; p.adj = 0.91). The NRI also varied between factors “zone” and “depth” [zone × depth; F(1, 57) = 10.51, p = 0.002; Figure 4B and Supplementary Table 5]. As with the previous index, the variation between depths was only significant in the shrub (TukeyHSD; p.adj = 0.003) and not in the fringe (TukeyHSD; p.adj = 0.8). The direction of change between the depths in the shrub differs between the indices. While the mean value NTI decreases from the surface to the subsurface (by 105.8%), the mean value NRI increases from the surface to the subsurface (73.8%). The phylogenetic structure was consistently less clustered/slightly over-dispersed in the shrub compared to the fringe for NTI [zone; F(1, 57) = 384.09, p < 0.001] and NRI [zone; F(1, 57) = 324.40, p < 0.001]. The relative abundances of phyla differed across experimental factors (Figure 5). Proteobacteria (56.6% relative abundance across all samples) was the most prevalent phylum and more abundant in the fringe compared to the shrub samples. The abundance of the second most prevalent phylum, Bacteroidetes (15.3%), was higher in the surface than the subsurface. Other dominant phyla were Chloroflexi (9.2%), Halanaerobiaeota (3.3%), and Calditrichaeota (2.5%) (Supplementary Table 6). The top three most abundant phyla made up over 80% of the community, and the top 12 most abundant phyla made up over 95%. The most striking difference was a high contribution of Halanaerobiaeota and Acetothermia in the surface of the shrub site in the summer season. Both phyla are present in the shub sites in winter but at relatively low abundances. Deltaproteobacteria (35.4%) were the most abundant class, followed by Gammaproteobacteria (19.5%), and Bacteroidia (11.6%) (Supplementary Table 7).
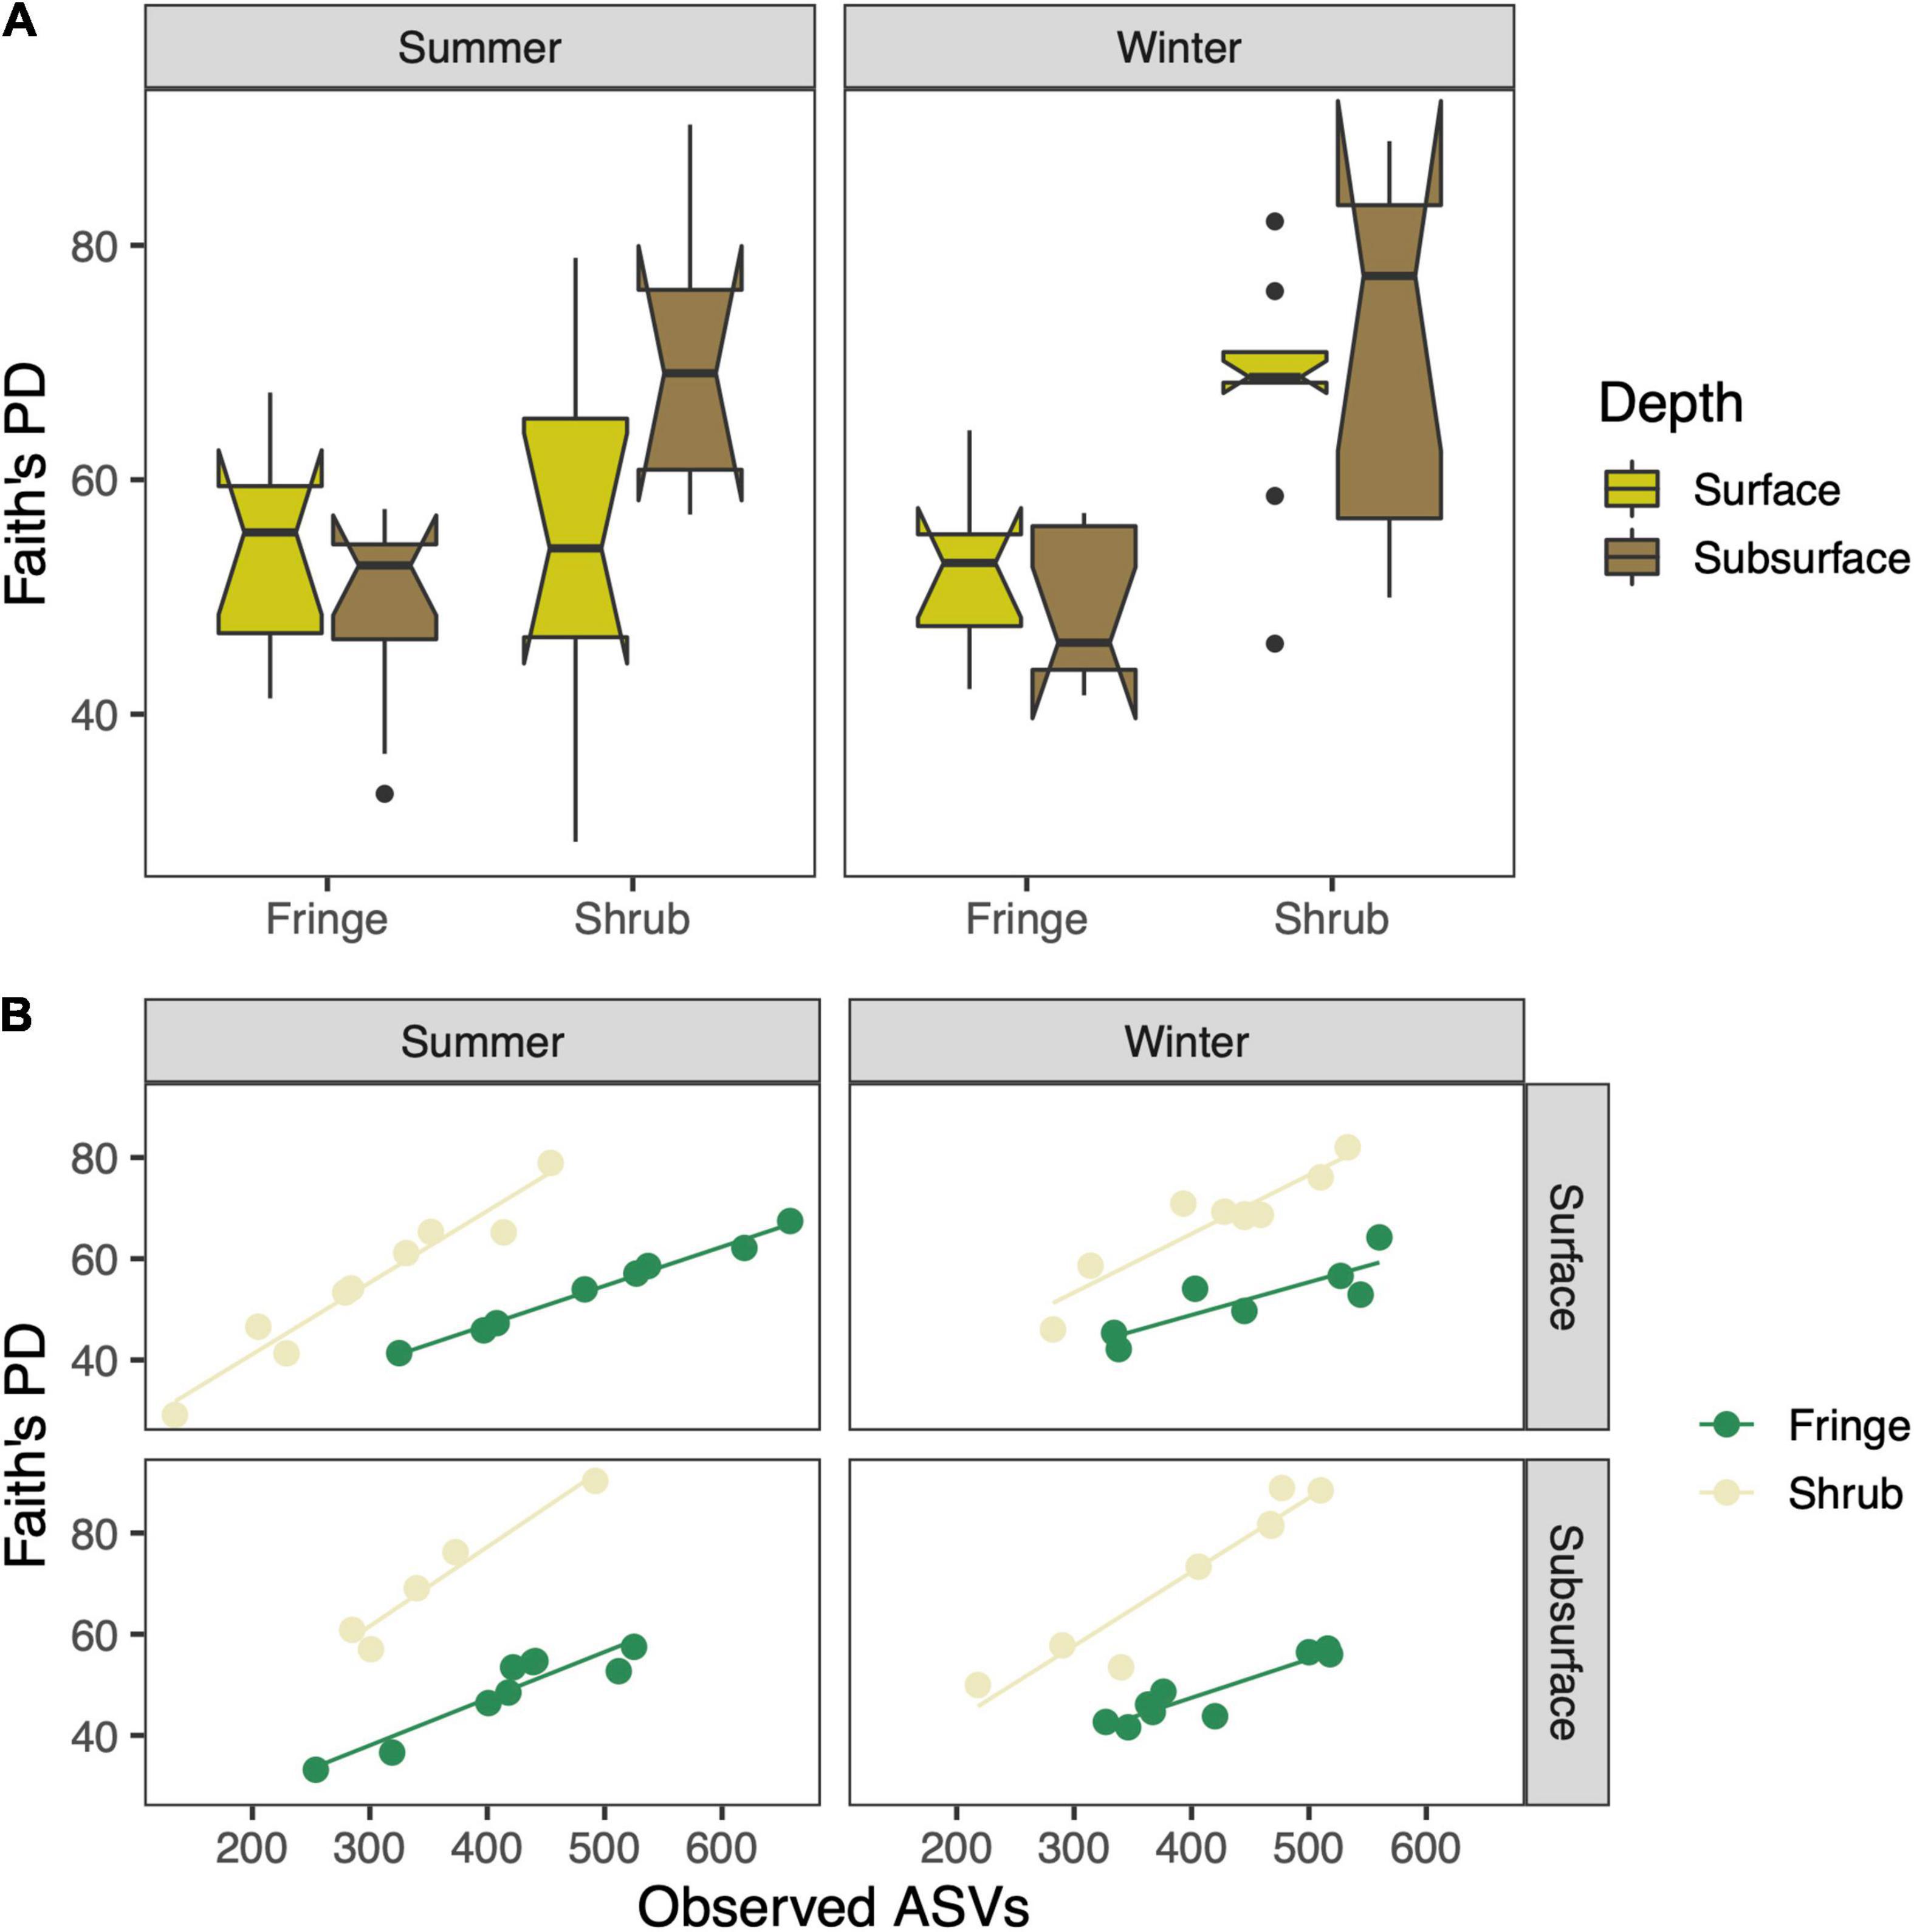
Figure 3. (A) Faith’s phylogenetic diversity index which expresses the sum of all branch lengths of the phylogenetic tree. (B) Correlations between species richness and phylogenetic diversity. The boxplots indicate the median with the interquartile range (IQR) between the 25th and the 75th percentile and the whiskers extend 1.5*IQR. Boxes were plotted with the notch (± 1.58*IQR/sqrt[n]) to display likely statistical significance if notches do not overlap.
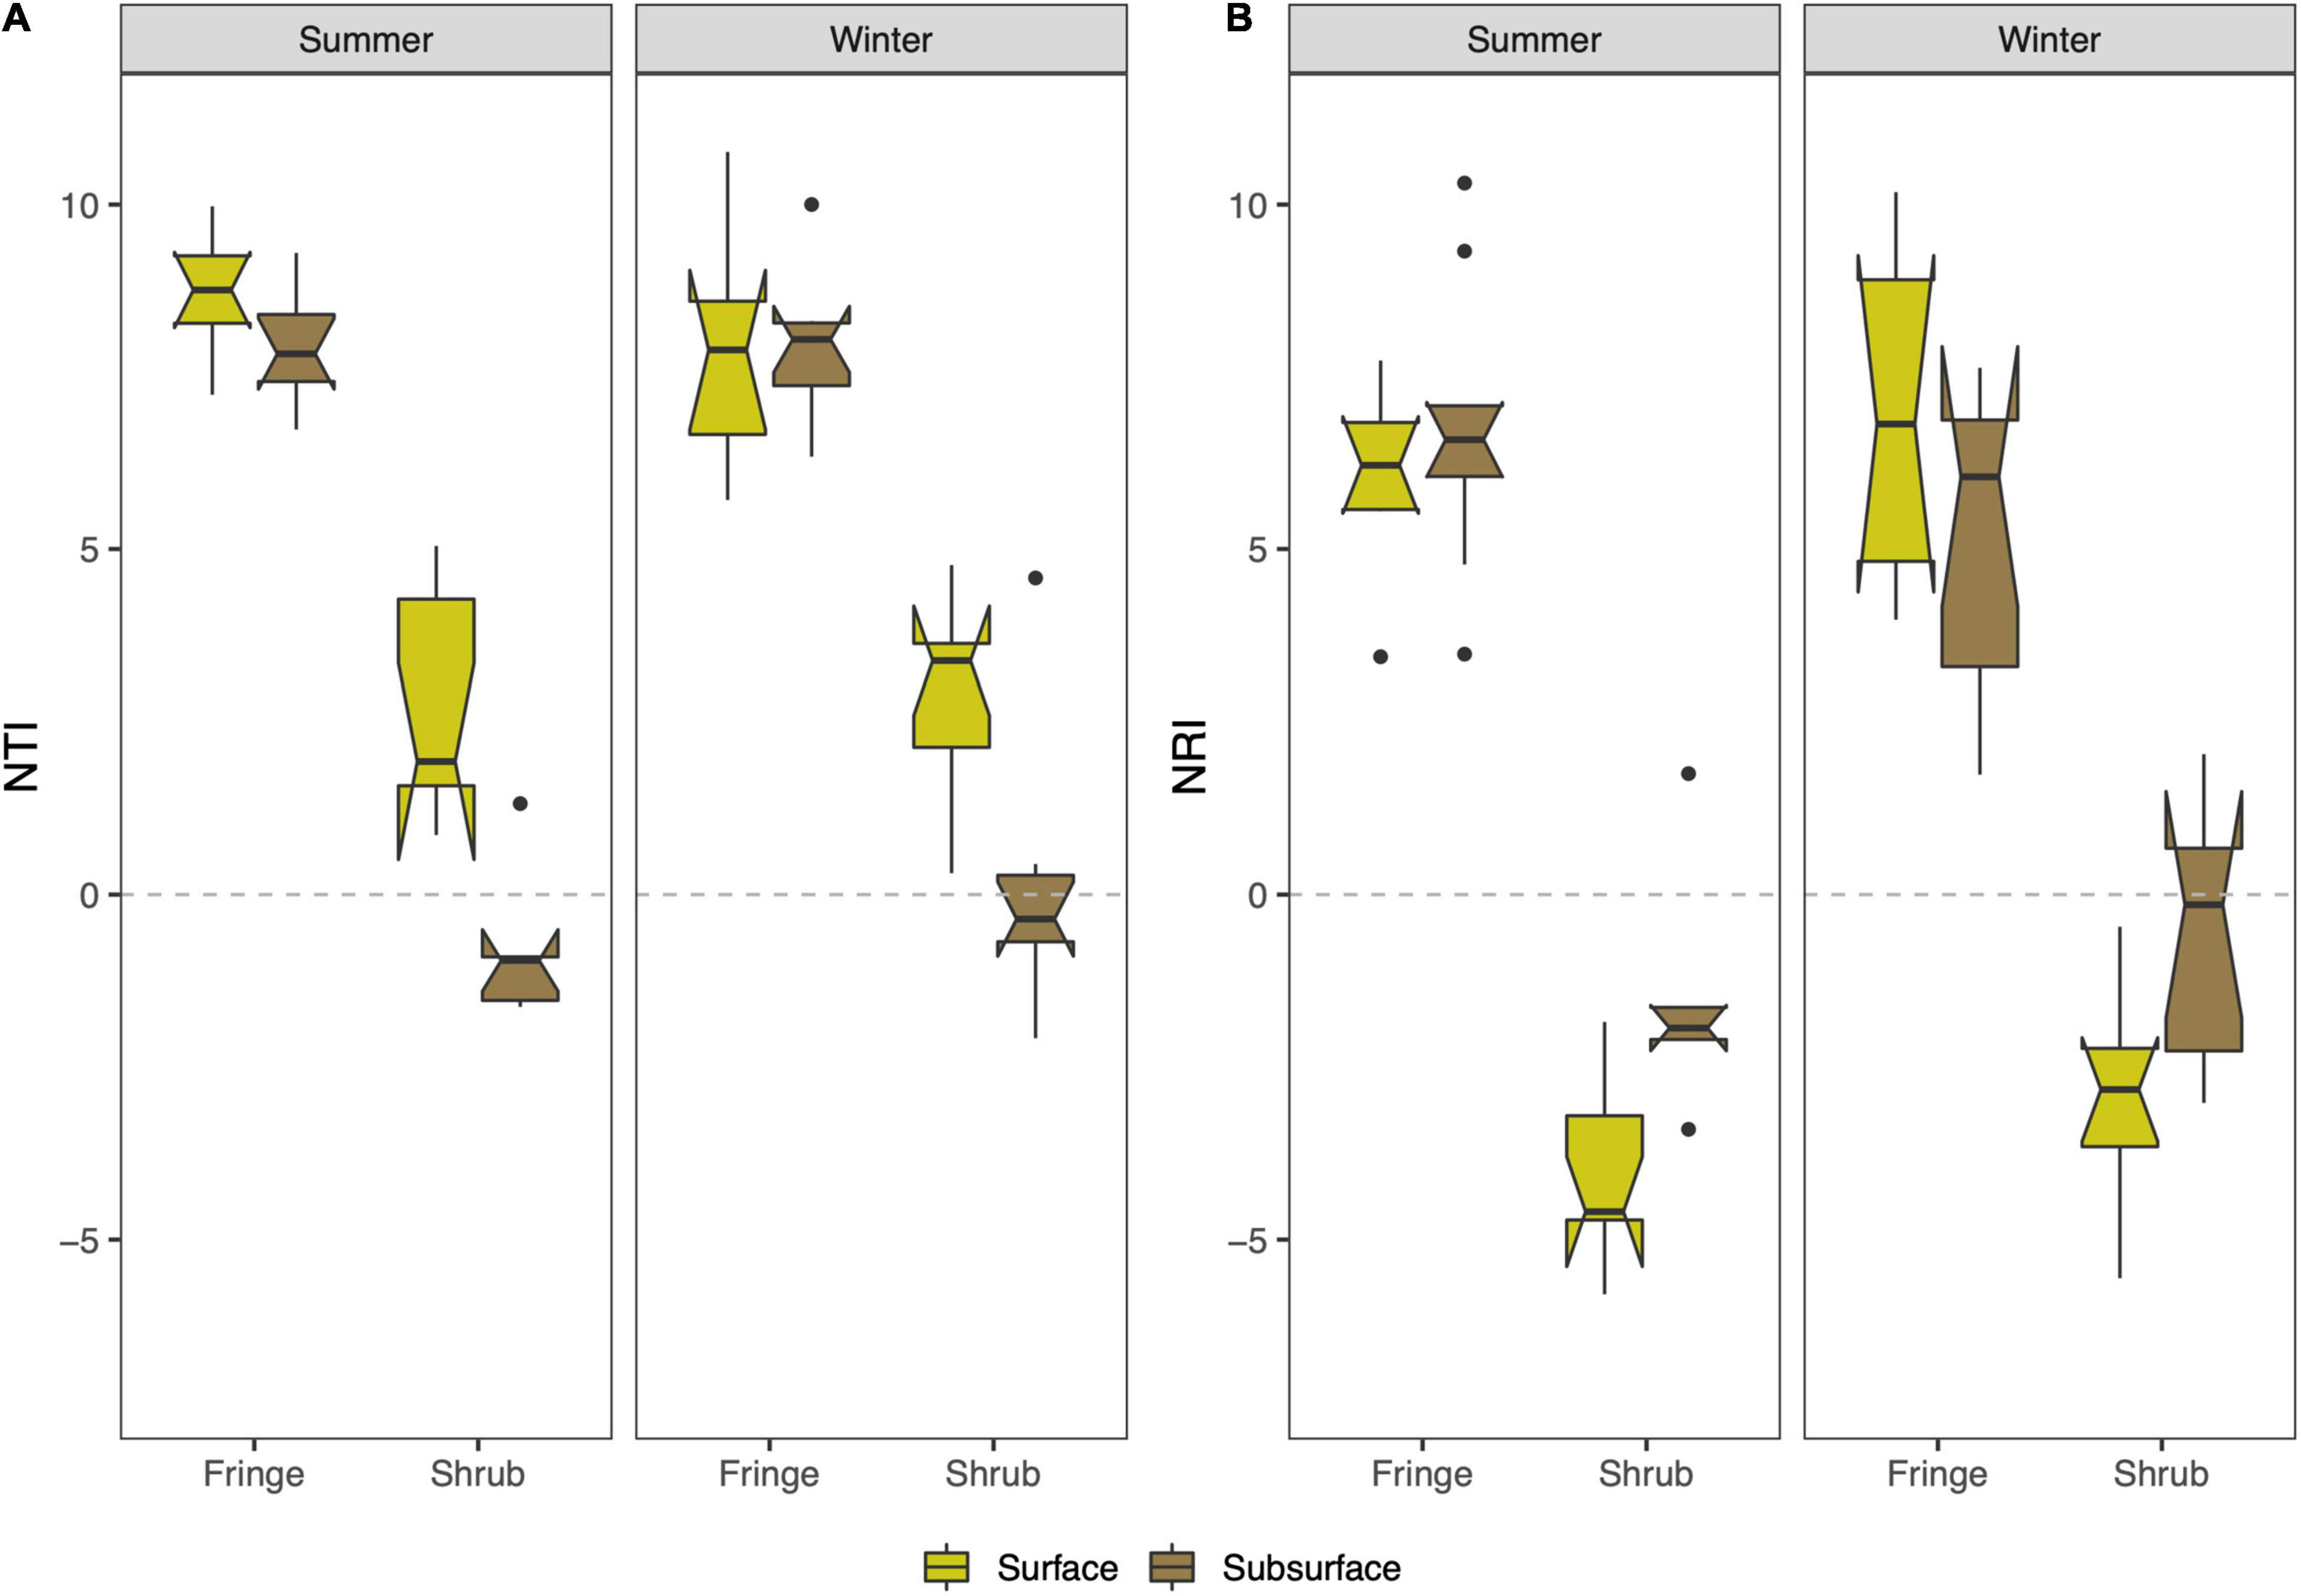
Figure 4. Patterns of phylogenetic diversity structure across seasons and location factors. (A) Nearest taxon index (NTI) is calculated from the mean distance to the nearest neighbor on the phylogenetic tree. (B) Net relatedness index (NRI) computes the mean pairwise distances between each taxon on the phylogenetic tree. Both indexes are fitted against null models to give a standardized measure of effect size of phylogenetic clustering or overdispersion. The boxplots indicate the median with the interquartile range (IQR) between the 25th and the 75th percentile and the whiskers extend 1.5*IQR. Boxes were plotted with the notch (± 1.58*IQR/sqrt[n]) to display likely statistical significance if notches do not overlap.
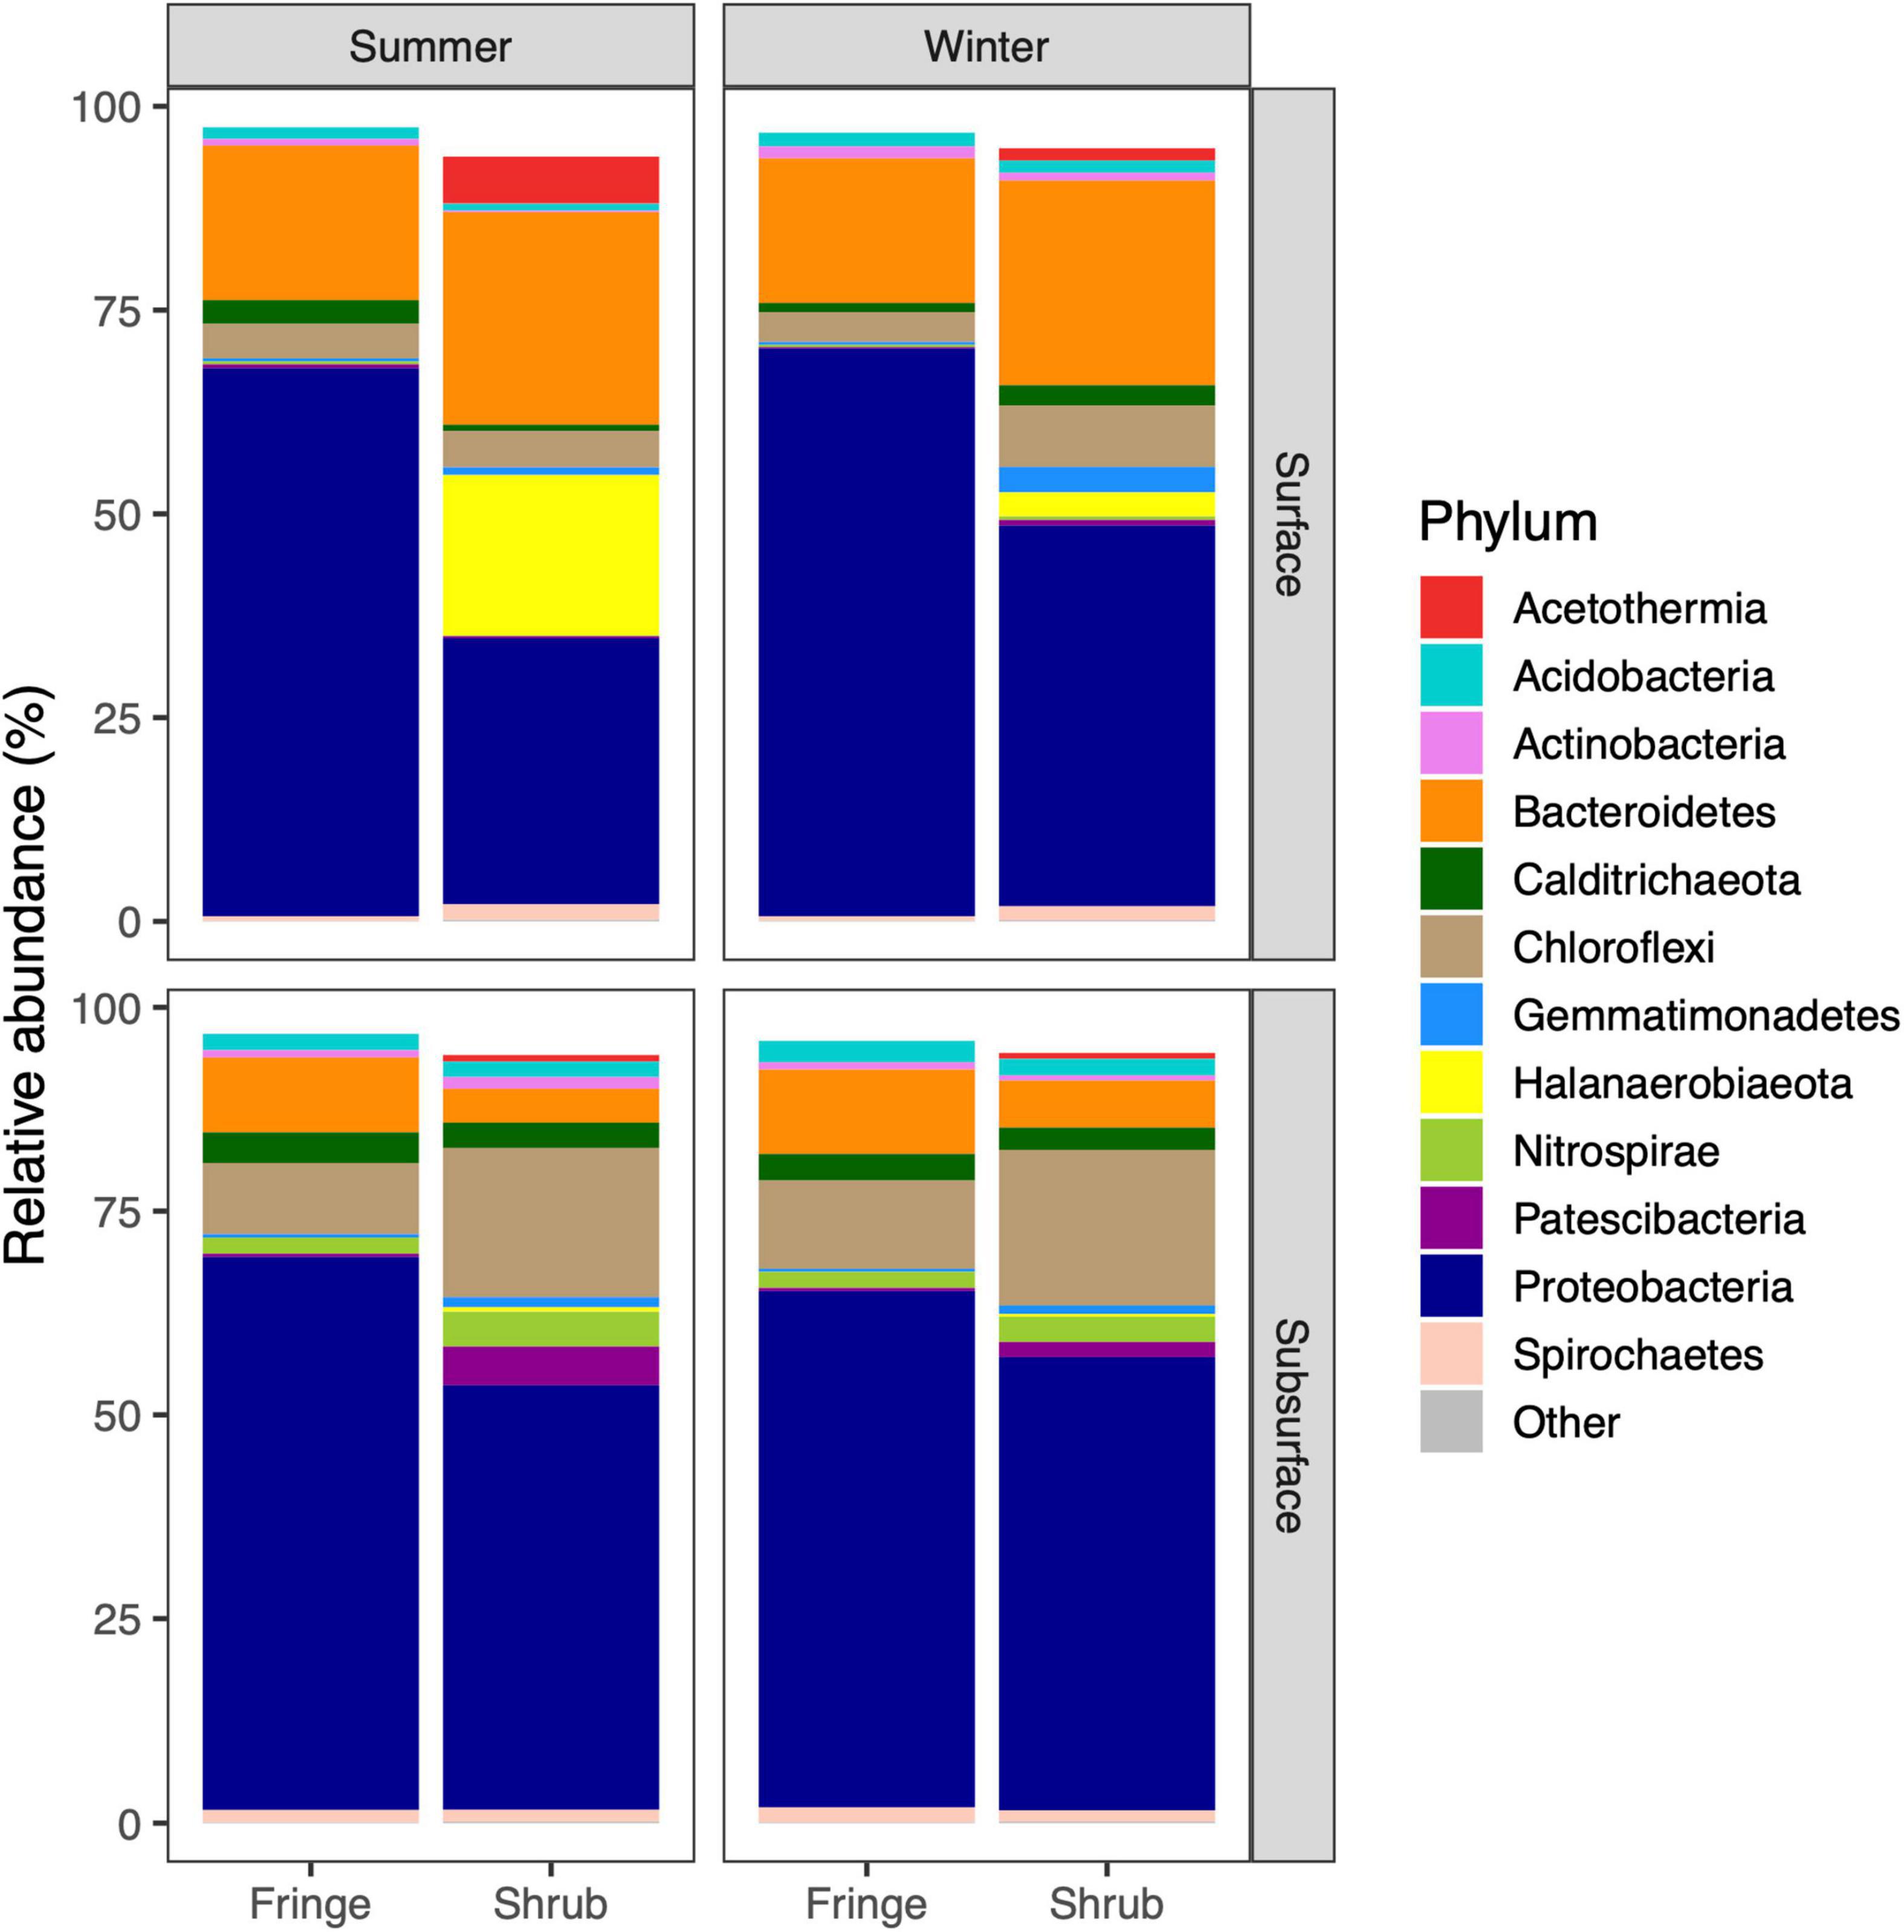
Figure 5. Phylum based composition of bacterial community based on 16S rRNA amplicon sequencing. The 12 most prevalent phyla across seasons, zones, and depths are shown while less abundant phyla were grouped as “Other.” Mean relative abundances taken from all replicates are presented here.
Multivariate analysis of the bacterial communities showed significant interaction of season, zone, and depth (season × zone × depth; LRT = 39, P = 0.009). This difference was mainly driven by the significant term “zone” (LRT = 44,371, P = 0.001), which cumulative effect size alone was nearly twice that of all other factors and interaction terms combined (Supplementary Table 8), followed by the factor “depth” (LRT = 19,478, P < 0.001). Univariate analysis of the individual taxa confirmed the differences of community composition between zones as 630 of the 773 significantly differing ASVs (81.5%) varied between the zones. In comparison, 131 of 773 (16.9%) significantly differing ASVs varied between depths, and only 12 of 773 (1.5%) ASVs significantly varied between interaction factors.
The separation between sites is clear when looking at the NMDS plot (Figure 6A), in which the samples separate by zone along the first axis. A secondary separation occurs along the second axis, which splits the samples by depth. This effect is much more pronounced in the shrub samples. A weak separation of the surface samples in the shrub by season is also noticeable. The low stress value of 0.08 indicates a fairly good fit of the data in two-dimensional ordination space. The dispersion of each group, measured as the distance of each sample to the centroid of the respective group, is shown below. While the samples are homogeneously dispersed by season [Figure 6B; betadisper; F(1, 62) = 0.01, p = 0.91] and also by depth [Figure 6C; betadisper; F(1, 62) = 0.82, p = 0.37], the dispersion in the fringe is significantly higher in the shrub than it is in the fringe [Figure 6D; betadisper; F(1, 62) = 37.94, p = 5.96e-08].
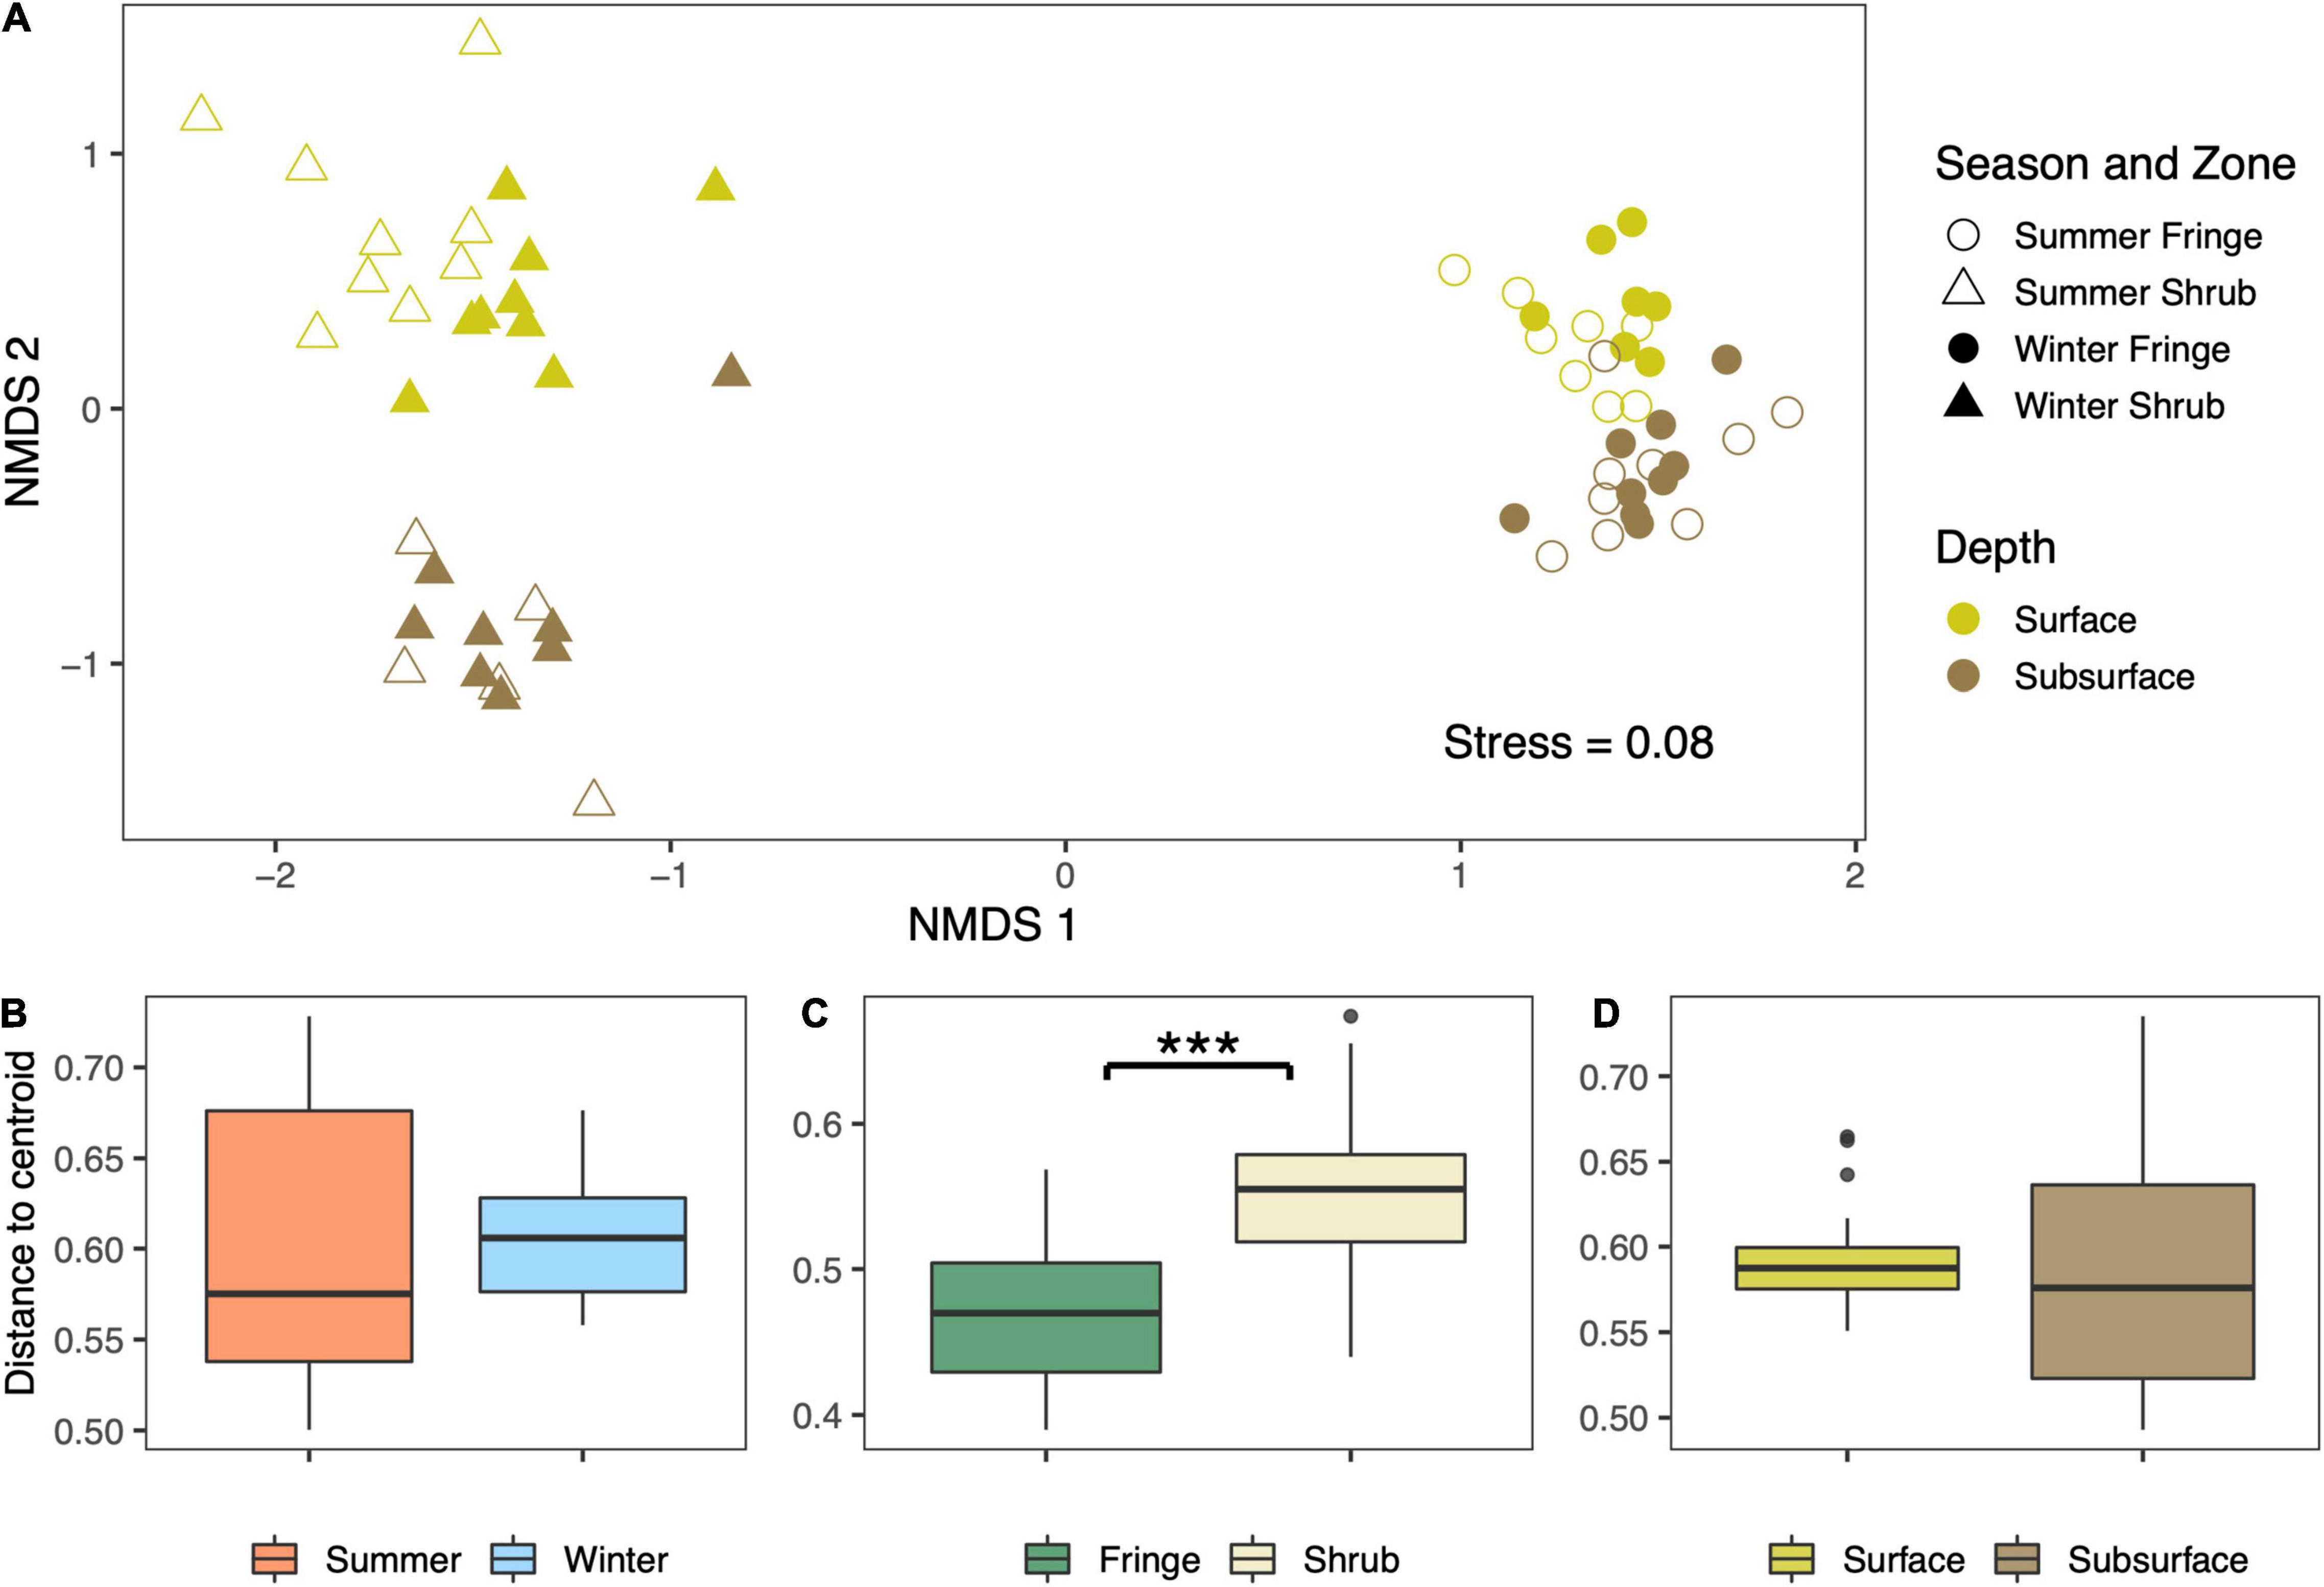
Figure 6. (A) Non-metric multidimensional scaling (NMDS) plot based on Bray-Curtis distance shows high levels of separation between the samples by factors along the first and the second NMDS axis. The level of dispersion within the individual factors (B) season, (C) zone, and (D) depth was calculated as the mean distance of each sample point to the centroid of the respective factor. The three asterisks indicate a significant level of heterogeneous dispersal between the fringe and the shrub samples. The center line in the box displays the median and the margins of the box specify the 25th and 75th percentile. Whiskers extend to the smallest (lower whisker) or the largest (upper whisker) value within the range of 1.5× interquartile range.
Season and Site-Specific Bacterial Taxa
Indicator species analysis revealed a total number of 2,417 ASVs that were significantly associated with the individual, or combinations of sites. Of those, 950 ASVs (39%) were significantly associated with an individual factor combination (Table 1) and 1,043 ASVs (43%) were associated with a combination of two factors. The site with the most ASVs associated was the “Winter Shrub Subsurface” (264 ASVs), followed by “Summer Shrub Subsurface” (174 ASVs). The surface had generally less indicator ASVs than the subsurface, and the fringe less than the shrub.
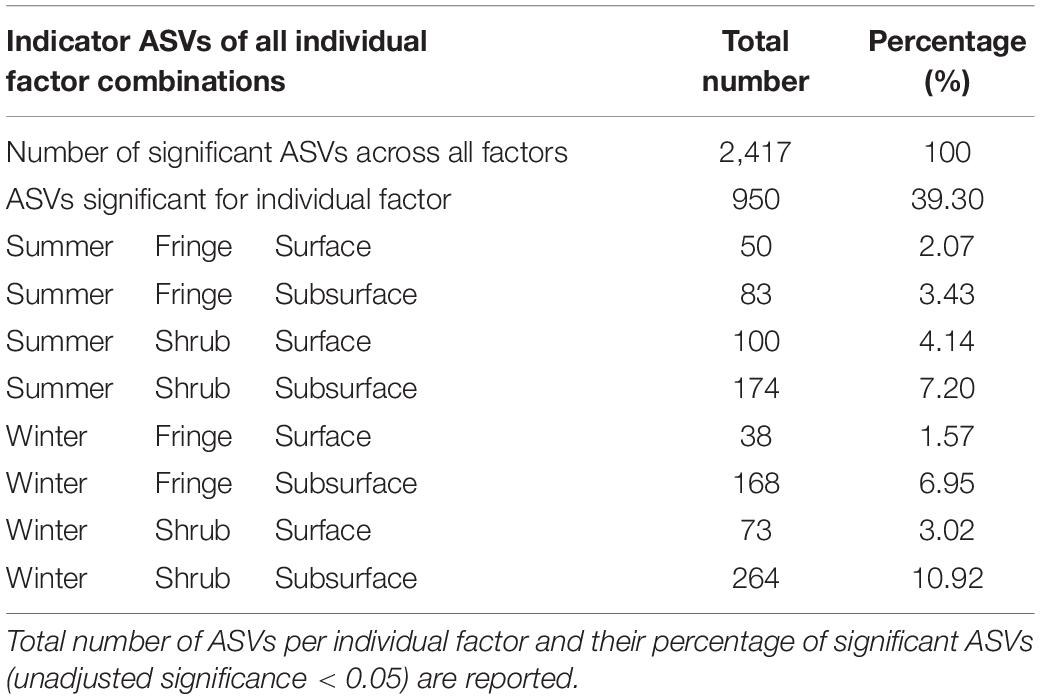
Table 1. Bacterial indicator species (ASVs) of individual site combinations in arid mangrove forest soils in Saudi Arabia.
The results of the pairwise differential abundance analysis (ANCOM-BC) were used to disentangle the abundances of taxa at Phylum level (Figure 7). The data is split by season and depth, but only significant differences between fringe and shrub are shown here. Halanaerobiaeota show a strong increase in the shrub, which is higher in the surface samples, especially in summer (note the varying x-axis between the seasons). Similarly, Acetothermia increase in the shrub relative to the fringe and they are higher in the surface. Firmicutes only increased in the shrub surface in summer, while Fibrobacteres increased in the fringe in summer. Interestingly, Epsilonbacteraeota increased in the fringe relatively to the shrub in the subsurface in summer but increased in the surface in winter. Cyanobacteria were higher in the surface of the shrub in summer but not in winter.
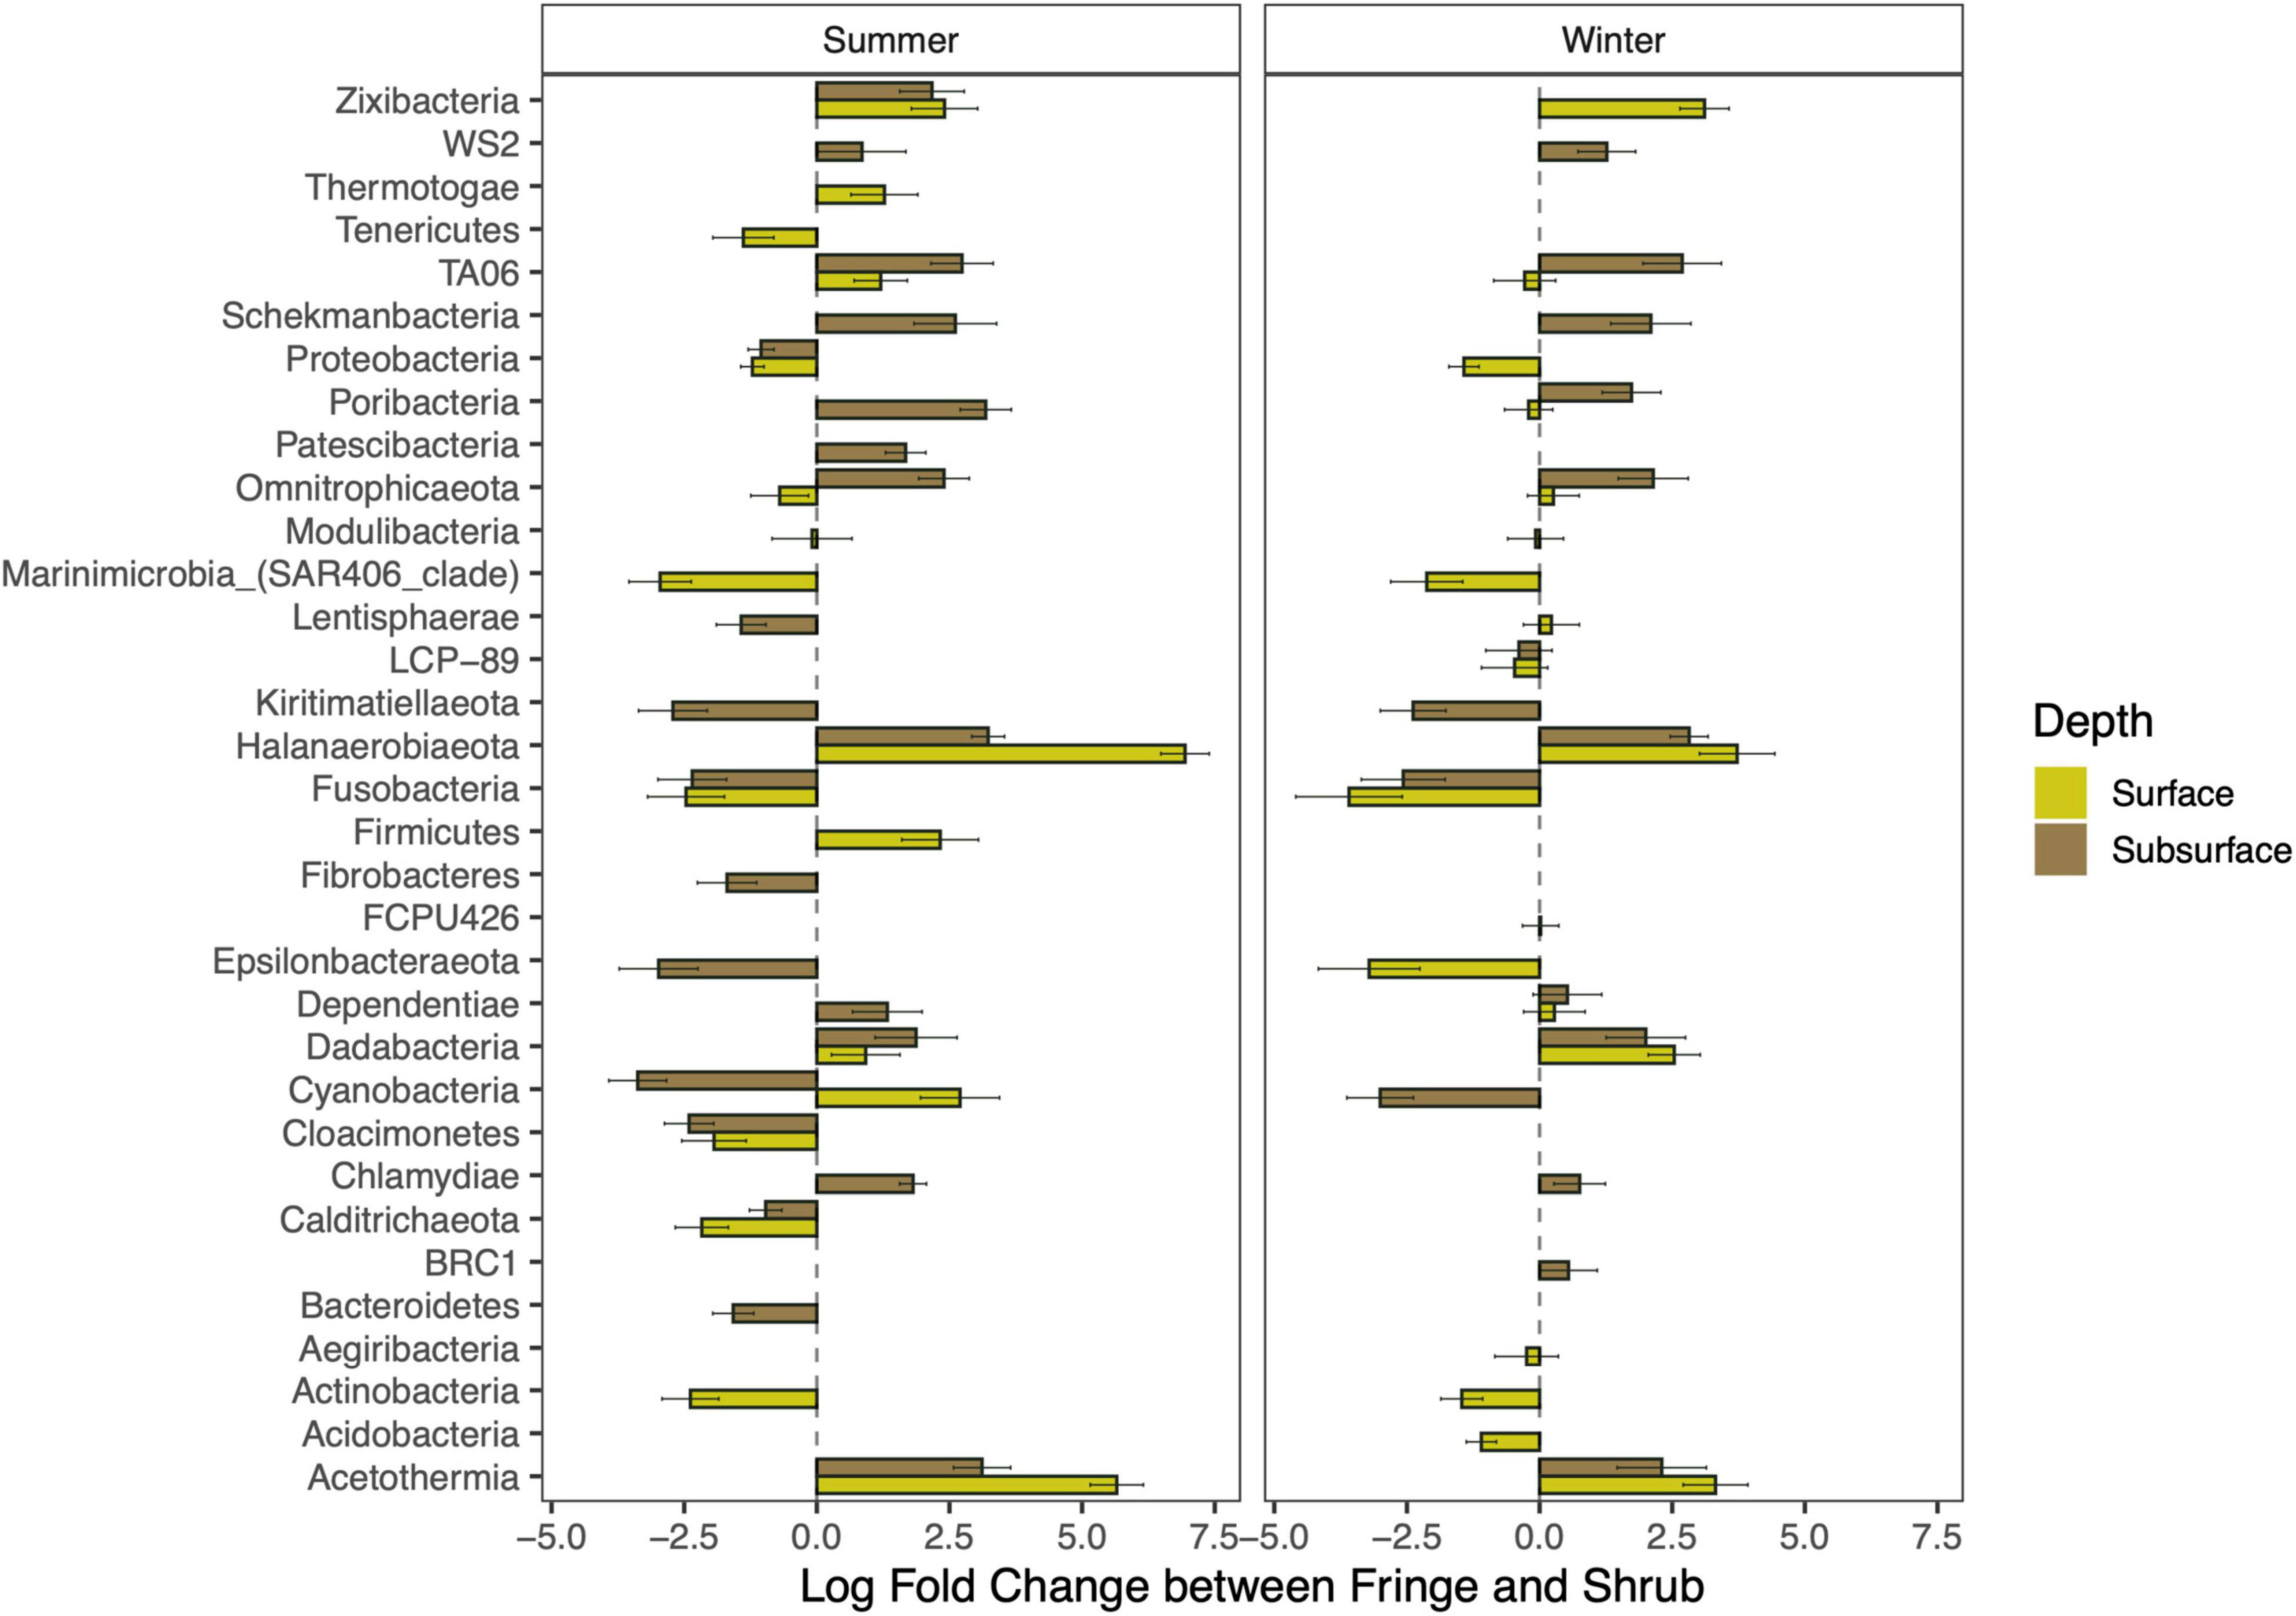
Figure 7. Comparison of differentially abundant phyla between the fringe and the shrub. Negative values mean a decrease, and positive values show an increase of the indicated phylum in the shrub relative to the fringe. Only significant phyla are shown (p-adjusted < 0.05). The height of the bar indicates the level of change between the zones and the error bars show the standard deviation of the test statistic.
Factors Driving the Differentiation of Bacterial Communities in Mangrove Soils
Measured environmental variables were tested for their differences between sites (Table 2). A PERMANOVA of the standardized values confirmed a significant difference between zone and depth [zone × depth; F(1, 56) = 9.40, p < 0.001; Supplementary Table 10] with the single factor “zone” contributing the majority of the explained variation (30.9%).

Table 2. Summary table of the measured soil parameters from both seasons and different locations in the mangrove forest.
The correlation between the microbial community composition and the measured environmental parameters was used to identify environmental drivers of community composition. The statistical significance of the model was confirmed [anova.cca(); F(1, 59) = 8.56, p < 0.001; Supplementary Table 11]. The compositional variability of the microbial community was significantly explained by grain size (the sandy, and the clay and silt fractions), salinity, total organic carbon, and total phosphorus [permutational ANOVA for Bray-Curtis distance-based redundancy analysis (dbRDA); Figure 8 and Supplementary Table 12). The proportion of inertia constrained by the four factors was 36.7%.
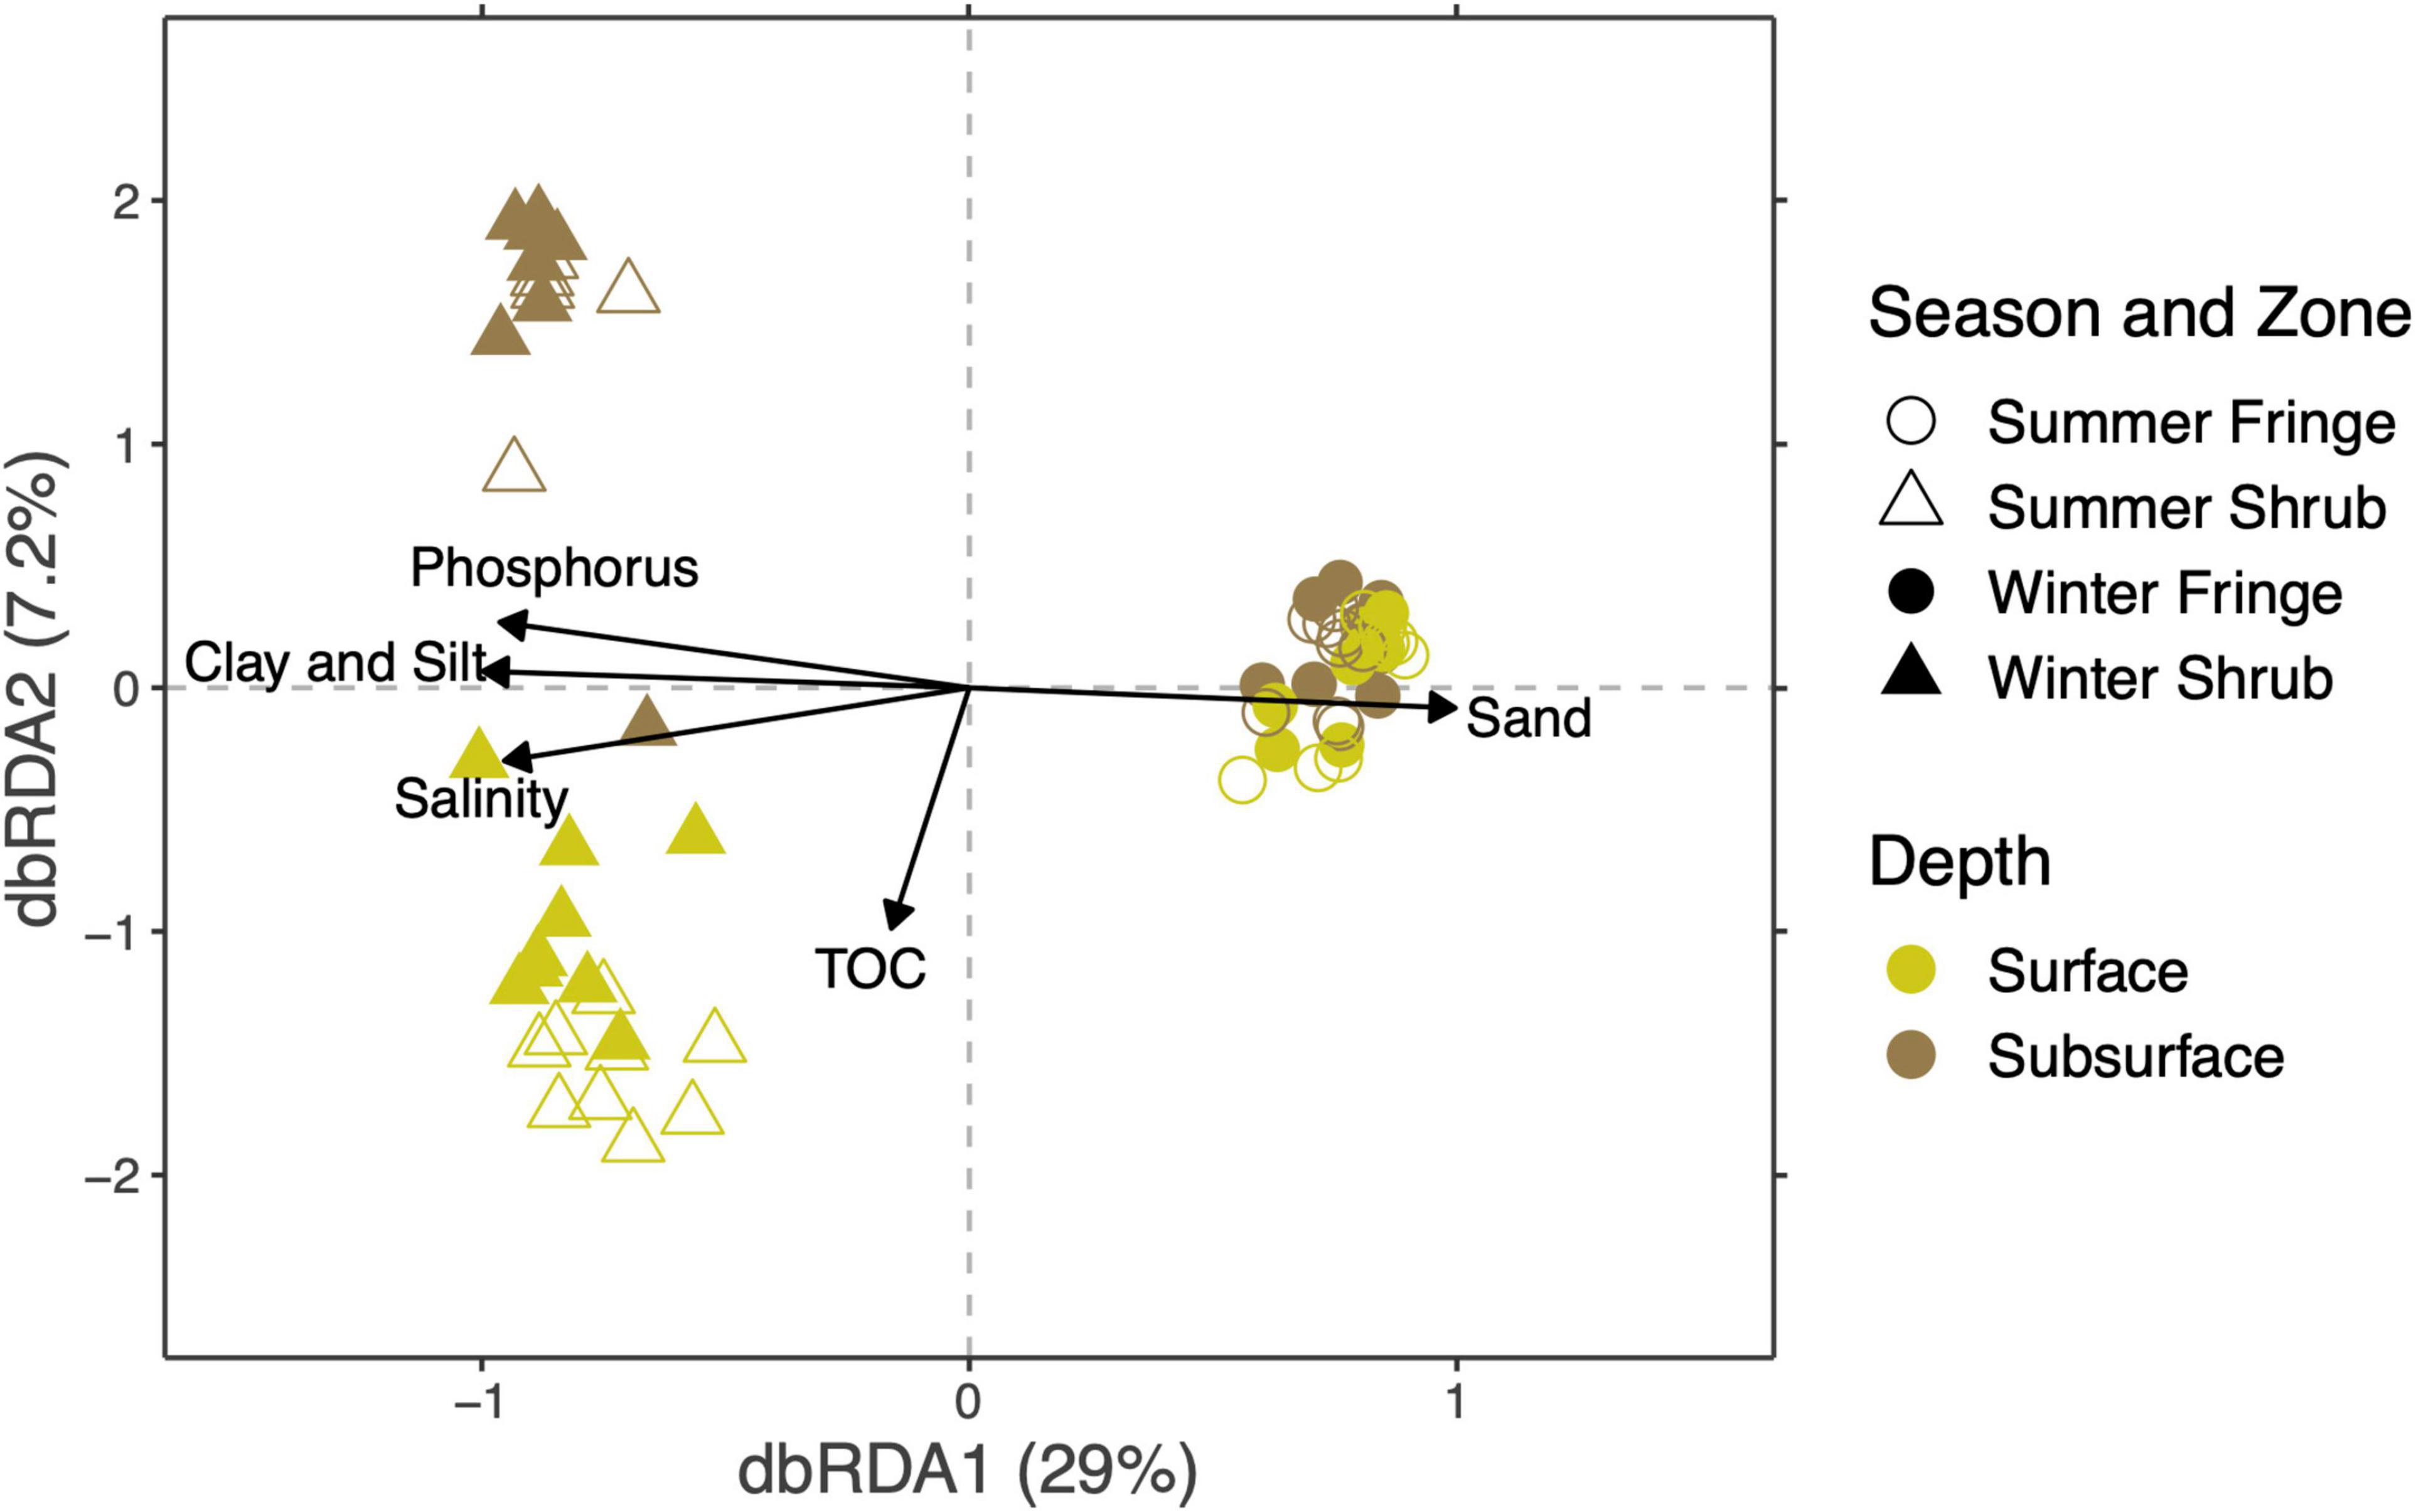
Figure 8. Mangrove soil bacterial community sensitivity to environmental factors is presented by distance-based redundancy analysis (dbRDA, vegan package). The percentages given on the axes denote the variation explained by each dimension. Environmental factors grain size, salinity, total organic carbon, and phosphorus significantly explained 36% of the compositional variation in the community.
Based on iCAMP analysis, stochasticity was the main process characterizing the assembly in mangrove soil, accounting for over 72% (Figures 9A,B). Drift and dispersal limitation were the second most important processes that drive the mangrove soil assembly. These processes are the most important to characterize the sampling area (i.e., shrubs and fringe) across the two seasons. In the summer the subsurface and surface soil of shrubs shows increasing dispersal limitation (Cohens’d = −6.8, p < 0.001) while the drift decreases (Cohens’d = 7.06, p < 0.001). Although with a lower magnitude, Heterogeneous selection was found higher in shrubs than in fringe all over the year (Cohens’d = 2.11, p < 0.05).
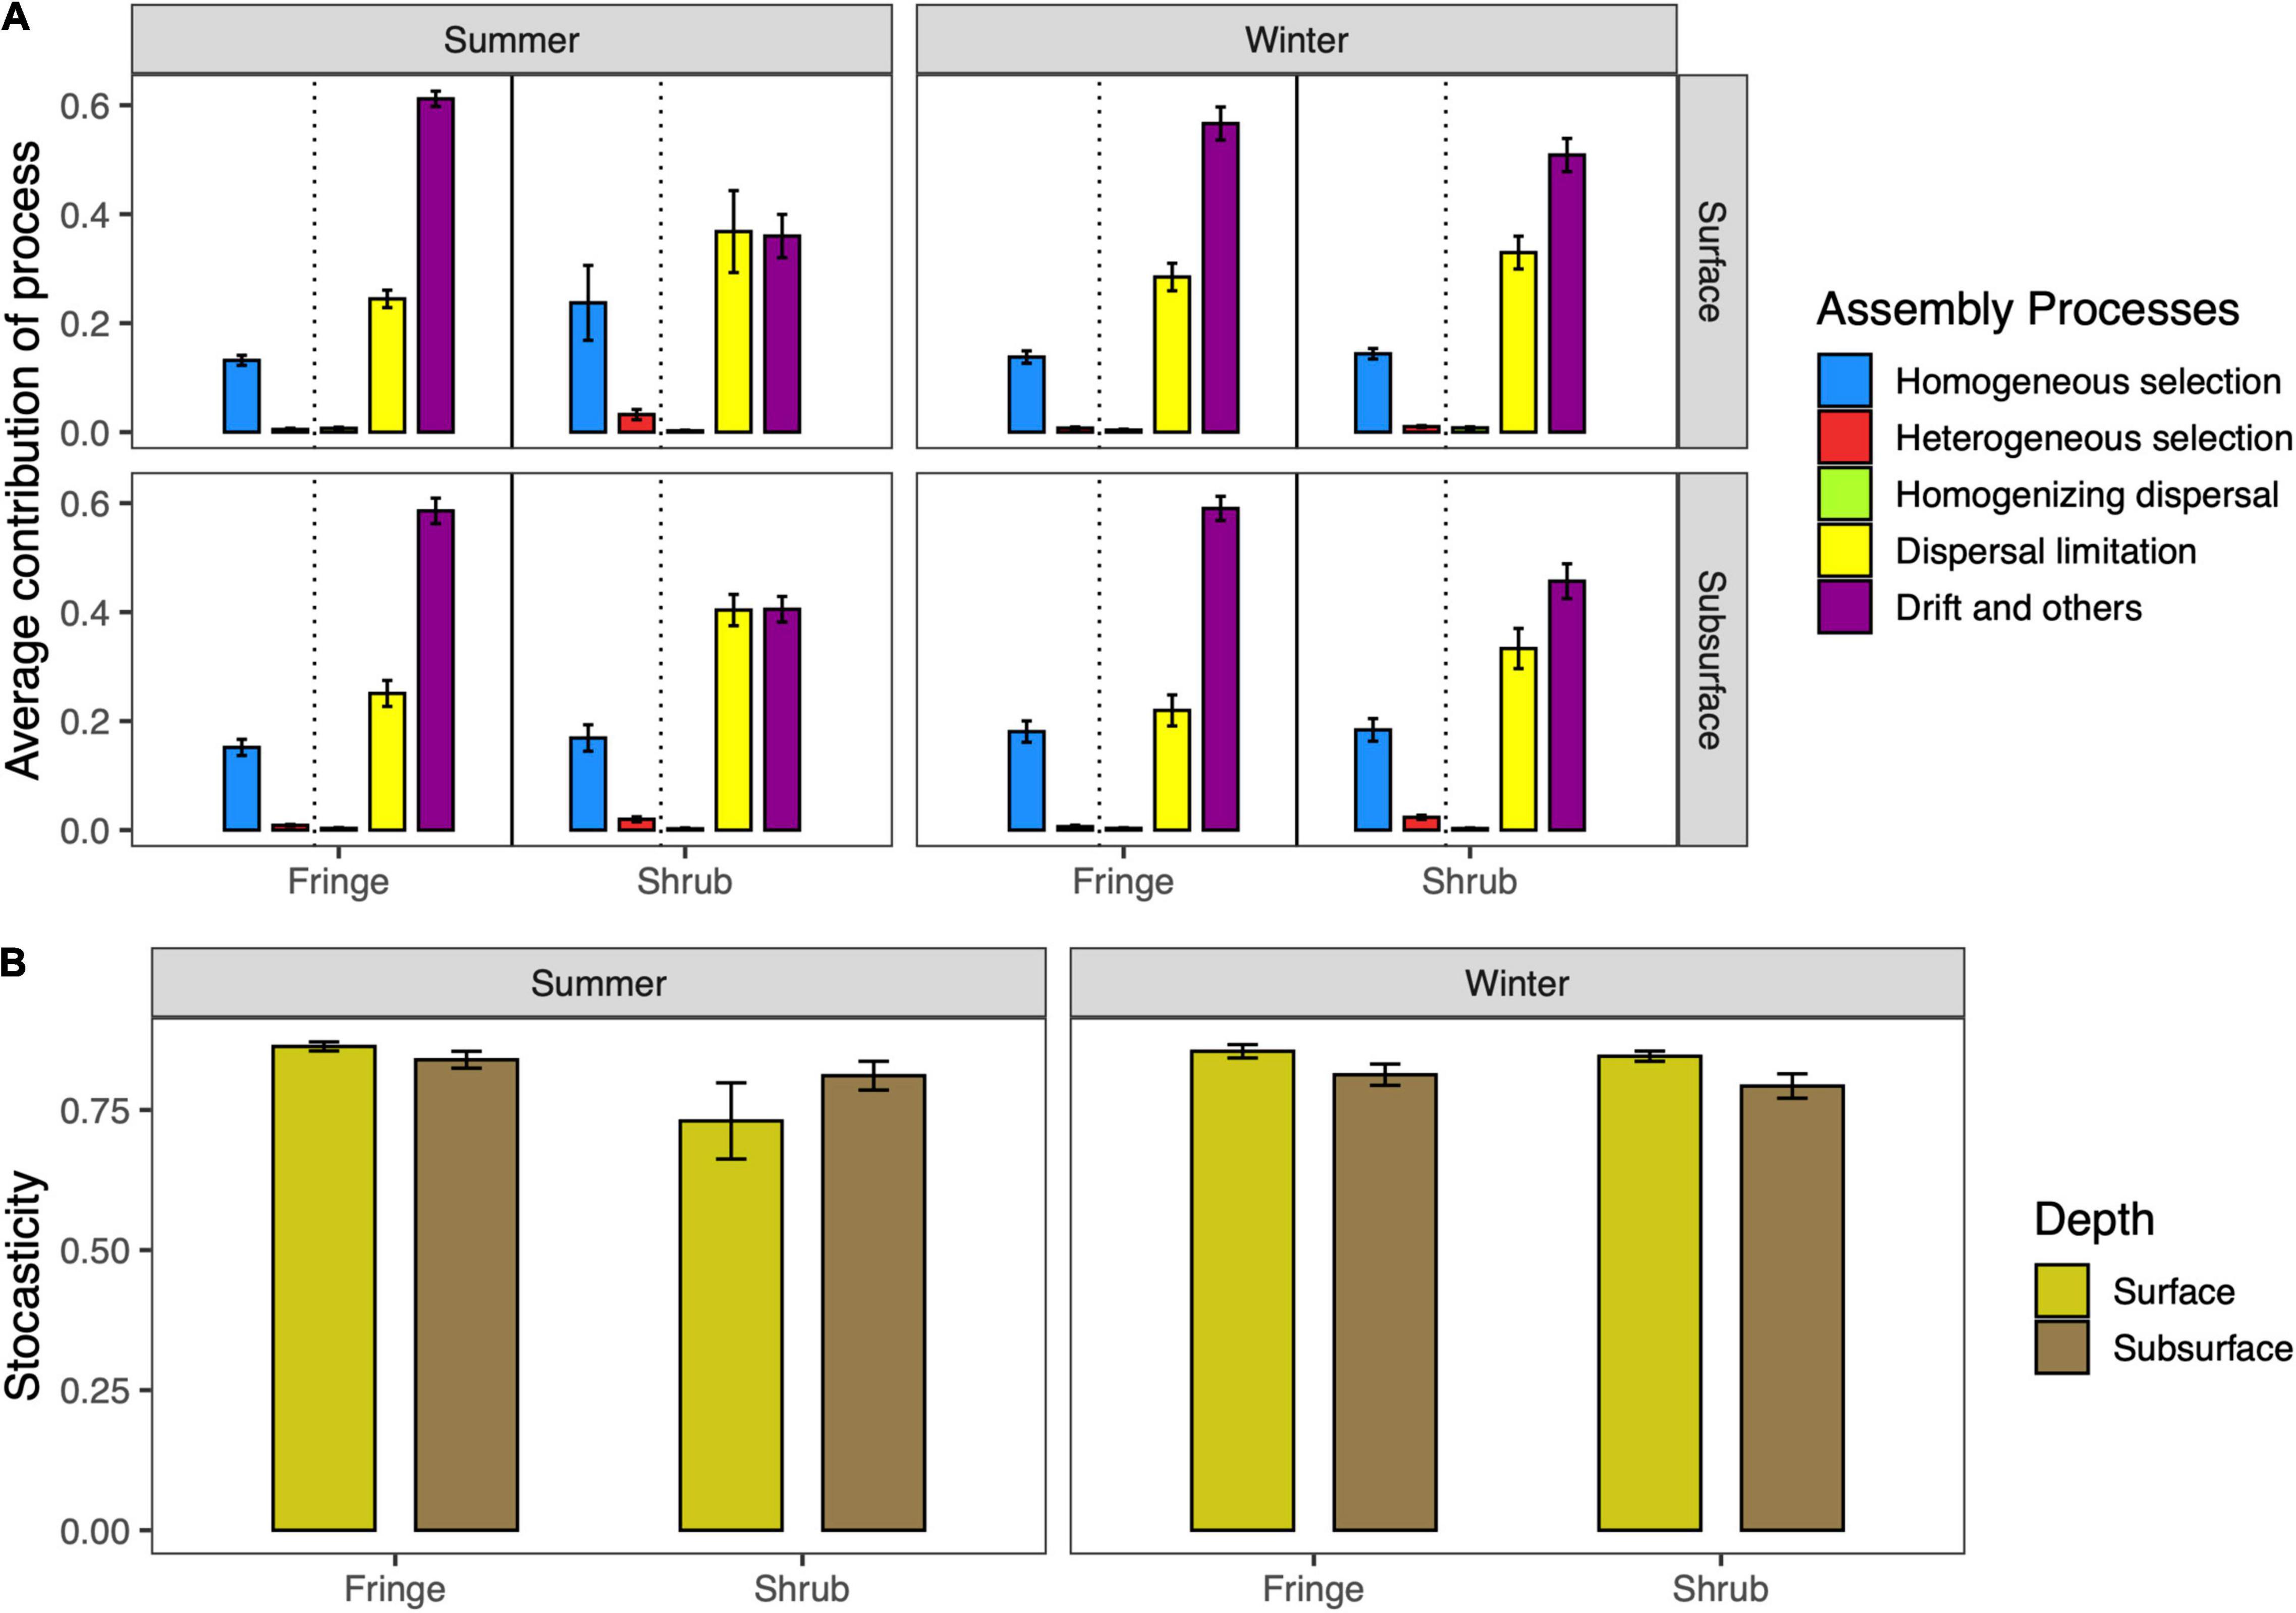
Figure 9. (A) Average contribution of bacterial community assembly processes across seasons and location factors. The processes are calculated from distance based phylogenetic structure analysis in the icamp package in R. The dotted line separates the deterministic processes (left side of line) from the stochastic processes (right of line). (B) The sum of the stochastic processes across experimental factors. The bars are represented as the mean of the relative values ± SD.
Functional Predictions
Across all factors, and particularly in the fringe, “respiration of sulfur compounds” and “sulfate respiration” was the most prominent function (Figure 10). “Chemoheterotrophy” and “fermentation” were abundant in all samples. Interestingly, their abundance was higher in the surface of the shrub but in the subsurface of the fringe. Functional traits related to photosynthesis, such as “cyanobacteria” (grouped as a function by FAPROTAX), “phototrophy,” and “photoautotrophy” were more abundant at the surface layers, most notably in the summer season. Overall, the assigned functions were dominated by various parts of the sulfur cycle.
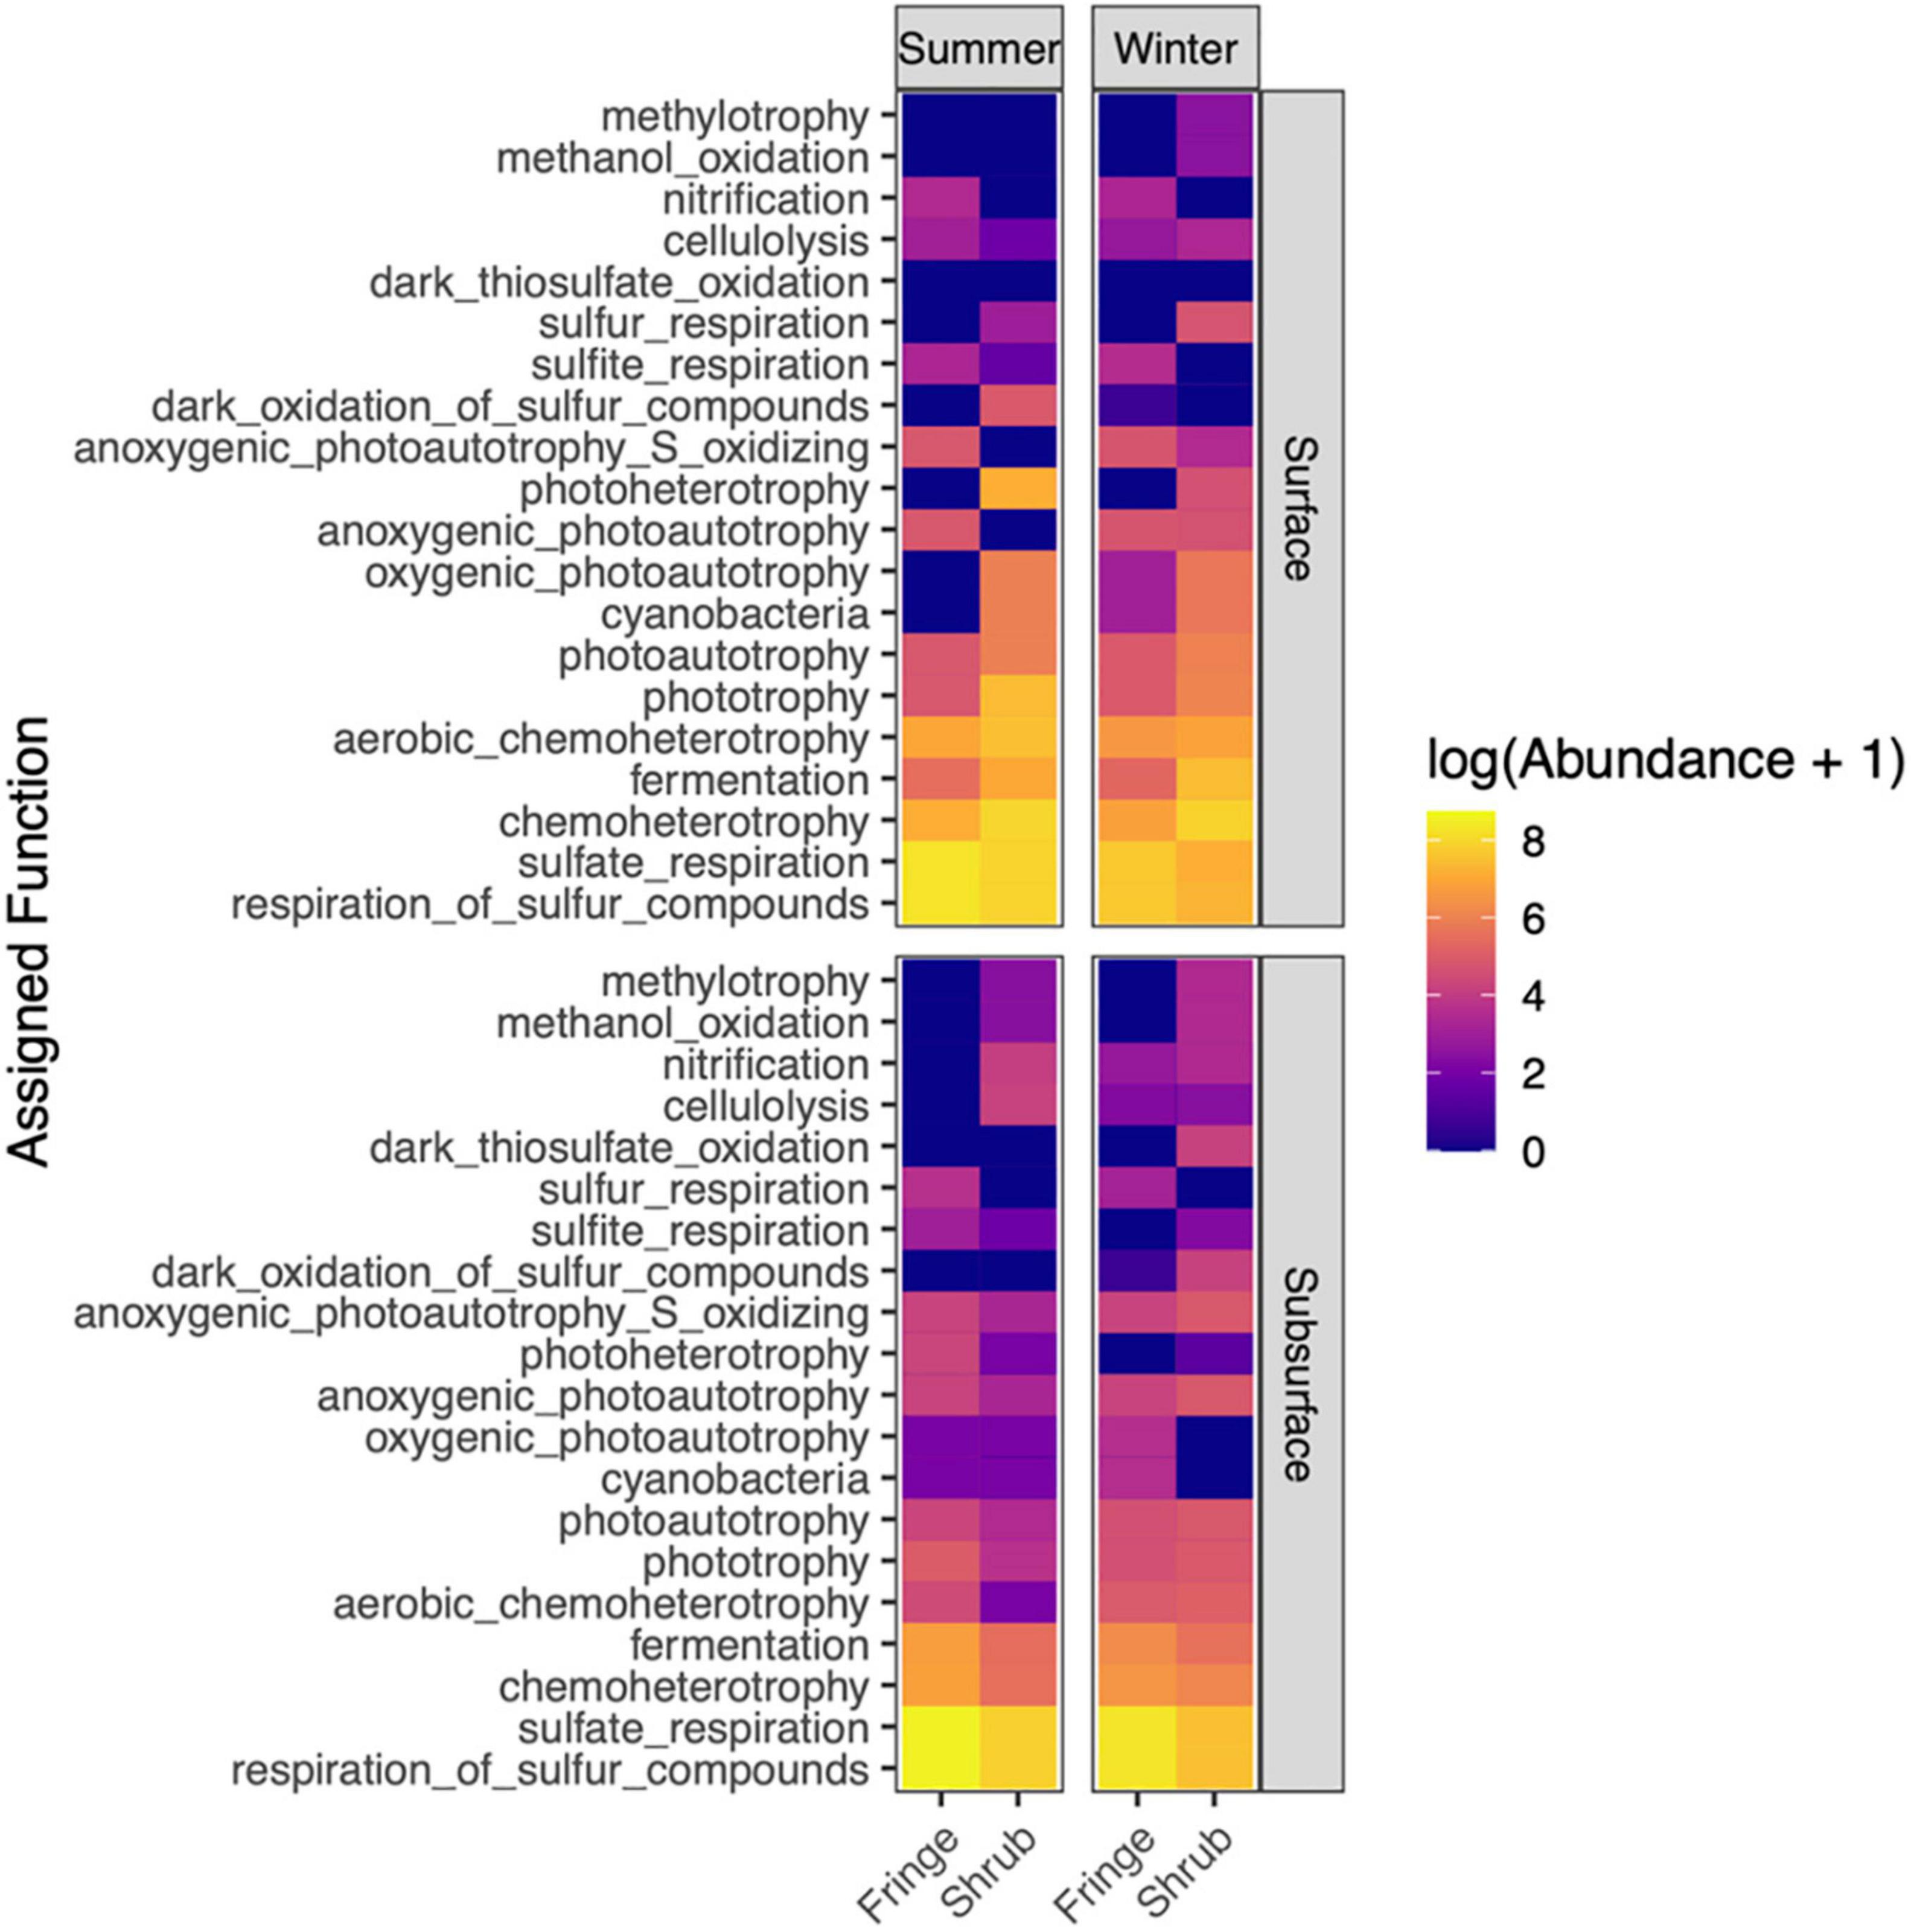
Figure 10. Heat map showing the distributions of bacterial functions that were assigned by FAPROTAX across season, zone and depth. Values were log-transformed with lighter values indicating higher abundances. For readability, only the top 20 most prevalent functions are plotted.
The function mvabund was used to test for significant differences between assigned functions across location factors, since the data showed a strong mean-variance relationship and were strongly heterogeneously dispersed for the factor “zone.” The analysis confirmed a significant difference between the functional compositions of the factors (season × zone × depth; LRT = 65.5, P = 0.006; Supplementary Table 13). The results from the univariate comparisons of each function returned 58 functions (out of 280) that differed significantly between the factors (Supplementary Figure 6). The most functions differed between the individual factors “zone” and “depth” (24 and 16, respectively), but their interaction factor showed higher test statistic values, indicating a strong influence of the combined factors (Supplementary Figure 6). “Photoautotrophy” and “cyanobacteria” (grouped as a function by FAPROTAX) contributed strongly to the separation between zones and depths, as did “fermentation.” “Dark sulfide oxidation” was significantly different between zones, and “aerobic chemoheterotrophy,” “photoautotrophy,” and “predatory or exoparasitic” functions separated the samples by depth. The only function that differed between the seasons (with a low test statistic) was “fermentation.”
Discussion
Shifts in microbial community composition were influenced by fluctuations of environmental factors within the mangrove forests of the central Red Sea, that in turn were influenced by seasonal changes in sea level and associated environmental conditions. Notably, bacterial communities in the shrub sites differed significantly in summer with lower alpha diversity yet a higher dominance of specialized taxa capable of surviving in extreme conditions. The lack of tidal inundation in the summer in the inner mangrove habitats creates high temperature and water scarcity conditions. In combination with associated high salinities from evaporative processes these inner mangrove stands represent a harsh environment which may facilitate the selection of extremophiles. A higher dominance of specialized bacterial taxa was observed and included the presence of salt tolerant halophiles, thermophiles and fermenters which were documented in higher abundances in surface soils in summer. The role of these seasonal temporal fluctuations in driving community composition and functional shifts are considered in turn.
Spatial and Temporal Patterns of Diversity in Relation to Environmental Factors
The decreased alpha diversity in the shrub samples in summer differs from other studies which have documented higher diversity indices in summer likely due to cooler winter temperatures inhibiting microbial activity (Ma et al., 2020). In the Red Sea tidal amplitudes are small because of the constricted connection to the Gulf of Aden and the Indian Ocean (Pugh et al., 2019). In combination with El Niño southern oscillation (ENSO) conditions, which result in significant decreases in mean tidal levels seasonally (Dasari et al., 2018), the inner mangrove habitats dry out completely in summer. Coupled with high air temperatures in this region, the associated soil temperatures and salinity in inner mangrove forests can be very high, leading to extreme conditions for life to prevail. Whilst the overall diversity decreased in the summer the occurrence of highly specialized microbes including Halanaerobiaeota and Acetothermia were documented in this harsh environment (Figures 4, 6). Halanaerobiaeota are halophiles capable of thriving in high salt concentrations that have been shown to degrade organic matter via fermentation (Roush et al., 2014). Similarly, Acetothermia are thermophiles capable of withstanding extreme temperatures and have been documented in hydrothermal vents and geothermal pools (Hao et al., 2018). Given the high temperatures and salinity that occur in the inner sites the dominance of these microbes is not surprising. The increased abundance of Firmicutes in shrub samples in summer is consistent with a study that found Firmicutes to be resilient to warm and dry conditions in grassland soils, possibly due to their endospore-forming abilities (Ning et al., 2020). Cyanobacteria in turn can form thick microbial mats in the high intertidal which may counteract evaporation and create microhabitats of alleviated stressors (Stal, 2001; Alvarenga et al., 2015).
Investigations of the phylogenetic diversity and the phylogenetic tree structure revealed higher phylogenetic diversity in shrub mangrove soils. High phylogenetic diversity in the shrub in summer may be explained by, either, a high level of speciation, creating many splits of the tree’s tips, or an increase in “longer” branches that differ from the rest of the tree. In conjunction with the phylogenetic structure (NTI and NRI), the shrub sites are tree-wide over dispersed (NRI) which indicates more deeply branching lineages (Kembel et al., 2010). This also aligns with the decrease in species richness and diversity observed in shrub sites. By contrast, phylogenetic overdispersion in temperate bacterial communities may result from greater competitive pressure or nutrient availability as predicted by niche theory (Bryant et al., 2012). Compared to temperate biomes, tropical and boreal habitats contain more closely related taxa at the tip of phylogenetic trees, but from more distantly related clades, indicating a deeper evolutionary niche specialization in bacteria (Webb et al., 2002). Together with global biomass patterns these results suggest that soil bacterial communities in the tropics and at high latitudes are subjected to stronger environmental filtering and include a relatively greater proportion of edaphic-niche specialists, possibly rendering these communities more vulnerable to global change (Bahram et al., 2018). These findings also suggest a substantial compositional shift in the communities in the shrub forest, most likely associated with the strongly selective environment (Thomson et al., 2022).
The factor zone was consistently the most important in explaining variation throughout the analyses. This is exemplified by the multivariate analysis of the bacterial communities, where 81.5% of all significantly varying ASVs varied between zones. This intra-forest variation is mainly driven by the intertidal zonation which leads to contrasting conditions between the fringe and the shrub (Feller et al., 2010; Naidoo, 2010). Physico-chemical parameters measured in this study reflect this gradient and play significant roles in explaining variation within the dataset. Higher grain sizes in the fringe are due to increased wave and tidal action in this area, while higher levels of salinity reflect higher levels of desiccation and less water exchange in the shrub zone (Naidoo, 2010; Adame et al., 2020). Yet another difference between the zones of the mangrove forest was the beta dispersion of the respective samples. The high dispersion in the shrub indicates a high level of uniqueness of each community, as compared to the homogeneous communities of the fringe forest. This reflects the differing conditions in both zones with increased water movement homogenizing communities in the fringe and more selective conditions prevailing in the shrub zone (Chen et al., 2021).
Other environmental conditions associated with shifts in the bacterial communities in the shrub sites included higher nutrients (notably phosphorus) and organic carbon content. Within the inner mangrove forests, due in part to the limited tidal flows as well as the dense forest architecture, plant and organic material including mangrove leaves accumulate (Chaikaew and Chavanich, 2017). This accumulation, reflected in the elevated carbon content and nutrients recorded at the inner sites, can further enhance fermentation processes as well as increase photoheterotrophic microbes which use the organic carbon (fatty acids and sugars). Overall, strong shifts in the microbial communities with increases in the dominance of fermenters and extremophiles occurred spatially with notable seasonal shifts in the shrub forest, driven by summer conditions.
Assembly Mechanisms and Resulting Functional Shifts
Understanding the assembly mechanisms of microbial communities is important in order to understand and predict changes in response to a shifting environment (Nemergut et al., 2013). Our results suggest a strong dominance of neutral processes, with an emphasis on drift and secondarily dispersal limitation, in all sample locations (Figure 9A). This finding is consistent with literature from marine ecosystems that report stochasticity as the predominant assembly process in subtropical bays (Mo et al., 2018), coastal waters and intertidal sediments (Chen et al., 2017), and for primary succession on marine suspended microplastics (Zhang et al., 2022). Interestingly, these mechanisms are fairly consistent across all sites of the forest but show a distinct difference when using a combined spatial and temporal approach The shrub samples in the summer period show a decreased level of drift as dominant assembly process while dispersal limitation becomes more important. At the same time, homogeneous and heterogeneous selection becomes a more important process in the assembly of these communities (Figure 9A). This induces a shift in the relative contribution of stochastic vs. deterministic processes in the shrub samples in summer, where stochastic processes become less relevant (Figure 9B). These findings complement the hypotheses stated before, that dispersal limitation is a dominant factor discriminating between the fringe and the shrub environment in mangrove forest of the Red Sea. A previous study on warming effects on grassland soil communities found that warming, drought, and decreased plant biomass increased homogeneous selection at the cost of drift (Ning et al., 2020).
Microbial communities in mangrove soils have been found to be influenced by the pervasive structure of the root system and similarly mangrove growth has been shown to be influenced by the resident microbial communities (Gomes et al., 2010). Changes in plant exudates in response to high salinity and temperature conditions can in turn exert selective pressure on the associated bacterial communities living in the soil. These feedbacks between the environmental conditions, mangrove plants and the associated microbial communities living in the soils provide supporting evidence and mechanisms for relevant community assembly processes. Notably, the higher phylogenetic diversity in the shrubs indicates an overall higher heterogeneous selection pressure indicative of richer ecological niches within the inner shrub forests which changed seasonally. This increased phylogenetic diversity in the shrub is mirrored by the functional profile of the bacterial community. While the fringe samples showed the highest abundances of single functions (connected to the sulfur cycle), the shrub samples offered a higher diversity of different functions (Figure 10). The fluctuating environmental conditions that influence ecological and functional diversity have important implications for overall ecosystem functioning and service delivery.
Conclusion
This study revealed important ecological scales of microprocesses that governed microbial communities in arid Red Sea mangroves. Notably, the research highlights the strong impact of seasonality on inner mangrove sites and temporally dependent ecological patchiness in the processes governing the assembly of mangrove bacterial communities. The onset of dispersal limitation and homogeneous and heterogenous selection, and the reduction of drift are likely the main forces shaping the varying community assemblages due to the oceanographic characteristics of the Red Sea. Specifically, in summer lower mean tidal levels eliminate tidal inundation creating a harsh environment with no tidal connection thereby increasing dispersal limitation and selective processes. This spatially separated shift of community composition in the inner mangrove forest may have an effect on ecosystem functions such as productivity, plant health, and organic matter degradation. An increased understanding of the combined spatial and temporal variation of bacterial communities is critical when assessing delivery of ecosystem services and their role in soil biogeochemical processes in dynamic and fluctuating habitats.
Data Availability Statement
The raw sequence data was deposited in the SRA of the NCBI (https://www.ncbi.nlm.nih.gov/sra) under accession number PRJNA786350.
Author Contributions
TT, MF, and JE contributed to the conceptualization and design of the study, and wrote the manuscript. TT, MB-S, NP, EA, and JE conducted field work and laboratory analyses. TT and MF analyzed the data. BJ and SC supported the project financially and supervised it. All authors read and approved the final version of it.
Funding
This work was funded by the KAUST baseline funding to BJ. This research received no specific grant from any funding agency in the public, commercial, or non-profit sectors.
Conflict of Interest
The authors declare that the research was conducted in the absence of any commercial or financial relationships that could be construed as a potential conflict of interest.
Publisher’s Note
All claims expressed in this article are solely those of the authors and do not necessarily represent those of their affiliated organizations, or those of the publisher, the editors and the reviewers. Any product that may be evaluated in this article, or claim that may be made by its manufacturer, is not guaranteed or endorsed by the publisher.
Acknowledgments
We thank Akuhata Bailey-Winiata for the creation of the map shown in Figure 1. We would like to thank the editor and the reviewers whose comments have resulted in a much-improved manuscript.
Supplementary Material
The Supplementary Material for this article can be found online at: https://www.frontiersin.org/articles/10.3389/fevo.2022.845611/full#supplementary-material
References
Adame, M. F., Reef, R., Santini, N. S., Najera, E., Turschwell, M. P., Hayes, M. A., et al. (2020). Mangroves in arid regions: ecology, threats, and opportunities. Estuar. Coast. Shelf Sci. 2020, 106796. doi: 10.1016/j.ecss.2020.106796
Allen, T. (1990). 4 Particle size, shape and distribution 4.1 PARTICLE SIZE. Particle Size Measur. 1990, 1–806.
Almahasheer, H., Aljowair, A., Duarte, C. M., and Irigoien, X. (2016a). Decadal stability of Red Sea mangroves. Estuar. Coast. Shelf Sci. 169, 164–172. doi: 10.1016/J.ECSS.2015.11.027
Almahasheer, H., Duarte, C. M., and Irigoien, X. (2016b). Nutrient Limitation in Central Red Sea Mangroves. Front. Mar. Sci. 3:271. doi: 10.3389/fmars.2016.00271
Alongi, D. M. (1994). The role of bacteria in nutrient recycling in tropical mangrove and other coastal benthic ecosystems. Hydrobiologia 285, 19–32. doi: 10.1007/BF00005650
Alongi, D. M. (2020). Global Significance of Mangrove Blue Carbon in Climate Change Mitigation. Sci 2, 67. doi: 10.3390/sci2030067
Alvarenga, D. O., Rigonato, J., Branco, L. H. Z., and Fiore, M. F. (2015). Cyanobacteria in mangrove ecosystems. Biodivers. Conserv. 24, 799–817. doi: 10.1007/S10531-015-0871-2
Anton, A., Almahasheer, H., Delgado, A., Garcias-Bonet, N., Carrillo-de-Albornoz, P., Marbà, N., et al. (2020). Stunted Mangrove Trees in the Oligotrophic Central Red Sea Relate to Nitrogen Limitation. Front. Mar. Sci. 7:597. doi: 10.3389/FMARS.2020.00597/BIBTEX
Antony, C., Langodan, S., Dasari, H. P., Abualnaja, Y., and Hoteit, I. (2022). Sea-level extremes of meteorological origin in the Red Sea. Weather Clim. Extrem. 35:100409. doi: 10.1016/j.wace.2022.100409
Bahram, M., Hildebrand, F., Forslund, S. K., Anderson, J. L., Soudzilovskaia, N. A., Bodegom, P. M., et al. (2018). Structure and function of the global topsoil microbiome. Nature 560, 233–237. doi: 10.1038/s41586-018-0386-6
Bryant, J. A., Stewart, F. J., Eppley, J. M., and Delong, E. F. (2012). Microbial community phylogenetic and trait diversity declines with depth in a marine oxygen minimum zone. Ecology 93, 1659–1673. doi: 10.1890/11-1204.1
Callahan, B. J., McMurdie, P. J., Rosen, M. J., Han, A. W., Johnson, A. J. A., and Holmes, S. P. (2016). DADA2: High-resolution sample inference from Illumina amplicon data. Nat. Methods 13, 581–583. doi: 10.1038/nmeth.3869
Carvalho, S., Kürten, B., Krokos, G., Hoteit, I., and Ellis, J. I. (2019). The Red Sea. World Seas Environ. Eval. 2019, 49–74. doi: 10.1016/B978-0-08-100853-9.00004-X
Chaikaew, P., and Chavanich, S. (2017). Spatial variability and relationship of mangrove soil organic matter to organic carbon. Appl. Environ. Soil Sci. 2017:4010381. doi: 10.1155/2017/4010381
Chen, W., Pan, Y., Yu, L., Yang, J., and Zhang, W. (2017). Patterns and processes in marine microeukaryotic community biogeography from Xiamen coastal waters and intertidal sediments, southeast China. Front. Microbiol. 8:1912. doi: 10.3389/FMICB.2017.01912/BIBTEX
Chen, Y. J., Leung, P. M., Cook, P. L. M., Wong, W. W., Hutchinson, T., Eate, V., et al. (2021). Hydrodynamic disturbance controls microbial community assembly and biogeochemical processes in coastal sediments. ISME J. 2021, 1–14. doi: 10.1038/s41396-021-01111-9
Churchill, J. H., Abualnaja, Y., Limeburner, R., and Nellayaputhenpeedika, M. (2018). The dynamics of weather-band sea level variations in the Red Sea. Reg. Stud. Mar. Sci. 24, 336–342. doi: 10.1016/J.RSMA.2018.09.006
Core Team, T. (2021). R: A language and environment for statistical computing. Vienna: R Foundation for Statistical Computing.
Cúcio, C., Engelen, A. H., Costa, R., and Muyzer, G. (2016). Rhizosphere microbiomes of European + seagrasses are selected by the plant, but are not species specific. Front. Microbiol. 7:440. doi: 10.3389/FMICB.2016.00440/BIBTEX
Dasari, H. P., Langodan, S., Viswanadhapalli, Y., Vadlamudi, B. R., Papadopoulos, V. P., and Hoteit, I. (2018). ENSO influence on the interannual variability of the Red Sea convergence zone and associated rainfall. Int. J. Climatol. 38, 761–775. doi: 10.1002/JOC.5208
de Cáceres, M., Sol, D., Lapiedra, O., and Legendre, P. (2011). A framework for estimating niche metrics using the resemblance between qualitative resources. Oikos 120, 1341–1350. doi: 10.1111/J.1600-0706.2011.19679.X
Donato, D. C., Kauffman, J. B., Murdiyarso, D., Kurnianto, S., Stidham, M., and Kanninen, M. (2011). Mangroves among the most carbon-rich forests in the tropics. Nat. Geosci. 4, 293–297. doi: 10.1038/ngeo1123
Dormann, C. F., Elith, J., Bacher, S., Buchmann, C., Carl, G., Carré, G., et al. (2013). Collinearity: a review of methods to deal with it and a simulation study evaluating their performance. Ecography 36, 27–46. doi: 10.1111/J.1600-0587.2012.07348.X
EPA (1996). EPA Method 3052 - Microwave assisted acid digestion of siliceous and organic based matrices. Washington, D.C: EPA, 1–13.
Fahimipour, A. K., Kardish, M. R., Lang, J. M., Green, J. L., Eisen, J. A., and Stachowicz, J. J. (2017). Globalscale structure of the eelgrass microbiome. Appl. Environ. Microbiol. 83:16. doi: 10.1128/AEM.03391-16
Feller, I. C., Lovelock, C. E., Berger, U., Mckee, K. L., Joye, S. B., and Ball, M. C. (2010). Biocomplexity in Mangrove Ecosystems. Annu. Rev. Mar. Sci 2, 395–417. doi: 10.1146/annurev.marine.010908.163809
Gomes, N. C. M., Cleary, D. F. R., Pinto, F. N., Egas, C., Almeida, A., Cunha, A., et al. (2010). Taking Root: Enduring Effect of Rhizosphere Bacterial Colonization in Mangroves. PLoS One 5:e14065. doi: 10.1371/journal.pone.0014065
Hao, L., McIlroy, S. J., Kirkegaard, R. H., Karst, S. M., Fernando, W. E. Y., Aslan, H., et al. (2018). Novel prosthecate bacteria from the candidate phylum Acetothermia. ISME J. 129, 2225–2237. doi: 10.1038/s41396-018-0187-9
Holguin, G., Vazquez, P., and Bashan, Y. (2001). The role of sediment microorganisms in the productivity, conservation, and rehabilitation of mangrove ecosystems: an overview. Biol. Fertil. Soils 33, 265–278. doi: 10.1007/s003740000319
Jennerjahn, T. C. (2020). Relevance and magnitude of “Blue Carbon” storage in mangrove sediments: carbon accumulation rates vs. stocks, sources vs. sinks. Estuar. Coast. Shelf Sci. 2020:107027. doi: 10.1016/j.ecss.2020.107027
Kathiresan, K., and Bingham, B. L. (2001). Biology of mangroves and mangrove Ecosystems. Advances in Marine Biology 40, 81–251. doi: 10.1016/S0065-2881(01)40003-4
Kembel, S. W., Cowan, P. D., Helmus, M. R., Cornwell, W. K., Morlon, H., Ackerly, D. D., et al. (2010). Picante: R tools for integrating phylogenies and ecology. Bioinformatics 26, 1463–1464.
Kimes, N. E., Johnson, W. R., Torralba, M., Nelson, K. E., Weil, E., and Morris, P. J. (2013). The Montastraea faveolata microbiome: ecological and temporal influences on a Caribbean reef-building coral in decline. Environ. Microbiol. 15, 2082–2094. doi: 10.1111/1462-2920.12130
Klindworth, A., Pruesse, E., Schweer, T., Peplies, J., Quast, C., Horn, M., et al. (2013). Evaluation of general 16S ribosomal RNA gene PCR primers for classical and next-generation sequencing-based diversity studies. Nucleic Acids Res. 41, e1–e1. doi: 10.1093/nar/gks808
Kumar, A., Khan, M. A., and Muqtadir, A. (2010). Distribution of Mangroves along the Red Sea Coast of the Arabian Peninsula: Part-I : the Northern Coast of Western Saudi Arabia. J. Earth Sci. India 3, 28–42.
Lachnit, T., Meske, D., Wahl, M., Harder, T., and Schmitz, R. (2011). Epibacterial community patterns on marine macroalgae are host-specific but temporally variable. Environ. Microbiol. 13, 655–665. doi: 10.1111/J.1462-2920.2010.02371.X
Lema, K. A., Bourne, D. G., and Willis, B. L. (2014). Onset and establishment of diazotrophs and other bacterial associates in the early life history stages of the coral Acropora millepora. Mol. Ecol. 23, 4682–4695. doi: 10.1111/mec.12899
Lin, H., and Peddada, S. D. (2020). Analysis of compositions of microbiomes with bias correction. Nat. Commun. 111, 1–11. doi: 10.1038/s41467-020-17041-7
Louca, S., Wegener Parfrey, L., and Doebeli, M. (2016). Decoupling function and taxonomy in the global ocean microbiome. Science 353, 1272–1277. doi: 10.1126/SCIENCE.AAF4507
Ma, J., Zhou, T., Xu, C., Shen, D., Xu, S., and Lin, C. (2020). Spatial and Temporal Variation in Microbial Diversity and Community Structure in a Contaminated Mangrove Wetland. Appl. Sci. 10:5850. doi: 10.3390/APP10175850
Manasrah, R., Hasanean, H. M., and Al-Rousan, S. (2009). Spatial and seasonal variations of sea level in the Red Sea, 1958-2001. Ocean Sci. J. 44, 145–159. doi: 10.1007/s12601-009-0013-4
Martin, M. (2013). Cutadapt removes adapter sequences from high-throughput sequencing reads. EMBnet J. 17, 10–12. doi: 10.14806/ej.17.1.200
McMurdie, P. J., and Holmes, S. (2013). phyloseq: an R Package for Reproducible Interactive Analysis and Graphics of Microbiome Census Data. PLoS One 8:e61217. doi: 10.1371/journal.pone.0061217
Mo, Y., Zhang, W., Yang, J., Lin, Y., Yu, Z., and Lin, S. (2018). Biogeographic patterns of abundant and rare bacterioplankton in three subtropical bays resulting from selective and neutral processes. ISME J. 129, 2198–2210. doi: 10.1038/s41396-018-0153-6
Naidoo, G. (2010). Ecophysiological differences between fringe and dwarf Avicennia marina mangroves. Trees 24, 667–673. doi: 10.1007/s00468-010-0436-7
Nemergut, D. R., Schmidt, S. K., Fukami, T., O’Neill, S. P., Bilinski, T. M., Stanish, L. F., et al. (2013). Patterns and Processes of Microbial Community Assembly. Microbiol. Mol. Biol. Rev. 77, 342–356. doi: 10.1128/mmbr.00051-12
Ning, D., Yuan, M., Wu, L., Zhang, Y., Guo, X., Zhou, X., et al. (2020). A quantitative framework reveals ecological drivers of grassland microbial community assembly in response to warming. Nat. Commun. 111, 1–12. doi: 10.1038/s41467-020-18560-z
Peterson, R. A. (2021). Finding Optimal Normalizing Transformations via bestNormalize. R J. 13, 310–329. doi: 10.32614/RJ-2021-041
Peterson, R. A., and Cavanaugh, J. E. (2020). Ordered quantile normalization: a semiparametric transformation built for the cross-validation era. J. Appl. Stat. 47, 2312–2327. doi: 10.1080/02664763.2019.1630372
Price, A. R. G., Medley, P. A. H., McDowall, R. J., Dawson-Shepherd, A. R., Hogarth, P. J., and Ormond, R. F. G. (1987). Aspects of mangal ecology along the Red Sea coast of Saudi Arabia. J. Nat. Hist. 21, 449–464. doi: 10.1080/00222938700771121
Pugh, D. T., Abualnaja, Y., and Jarosz, E. (2019). “The Tides of the Red Sea,” in Oceanographic and Biological Aspects of the Red Sea eds N. Rasul and I. Stewart (Cham: Springer) 2019, 11–40. doi: 10.1007/978-3-319-99417-8_2
Quast, C., Pruesse, E., Yilmaz, P., Gerken, J., Schweer, T., Yarza, P., et al. (2012). The SILVA ribosomal RNA gene database project: improved data processing and web-based tools. Nucleic Acids Res. 41, D590–D596. doi: 10.1093/nar/gks1219
Radojevic, M., and Bashkin, V. N. eds (2007). “Soil, Sediment, Sludge, and Dust,” in Practical Environmental Analysis, (Cambridge, MA: RSC publishing).
Reef, R., Feller, I. C., and Lovelock, C. E. (2010). Nutrition of mangroves. Tree Physiol. 30, 1148–1160. doi: 10.1093/treephys/tpq048
Revell, L. J. (2012). phytools: an R package for phylogenetic comparative biology (and other things). Methods Ecol. Evol. 3, 217–223. doi: 10.1111/J.2041-210X.2011.00169.X
Roush, D. W., Elias, D. A., and Mormile, M. R. (2014). Metabolic Capabilities of the Members of the Order Halanaerobiales and Their Potential Biotechnological Applications. Curr. bBotechnology 3, 3–9. doi: 10.2174/221155010301140303102741
Shaltout, K. H., Ahmed, M. T., Alrumman, S. A., Ahmed, D. A., and Eid, E. M. (2020). Evaluation of the carbon sequestration capacity of arid mangroves along nutrient availability and salinity gradients along the Red Sea coastline of Saudi Arabia. Oceanologia 62, 56–69. doi: 10.1016/J.OCEANO.2019.08.002
Simister, R., Taylor, M. W., Rogers, K. M., Schupp, P. J., and Deines, P. (2013). Temporal molecular and isotopic analysis of active bacterial communities in two New Zealand sponges. FEMS Microbiol. Ecol. 85, 195–205. doi: 10.1111/1574-6941.12109
Stal, L. J. (2001). Coastal microbial mats: the physiology of a small-scale ecosystem. South African J. Bot. 67, 399–410. doi: 10.1016/S0254-6299(15)31156-X
Thompson, L. R., Sanders, J. G., McDonald, D., Amir, A., Ladau, J., Locey, K. J., et al. (2017). A communal catalogue reveals Earth’s multiscale microbial diversity. Nature 551, 457–463. doi: 10.1038/nature24621
Thomson, T., Fusi, M., Bennett-Smith, M. F., Prinz, N., Aylagas, E., Carvalho, S., et al. (2022). Contrasting Effects of Local Environmental and Biogeographic Factors on the Composition and Structure of Bacterial Communities in Arid Monospecific Mangrove Soils. Microbiol. Spectr. 10, 903. doi: 10.1128/SPECTRUM.00903-21/SUPPL_FILE/SPECTRUM00903-21_SUPP_1_SEQ7.PDF
Trevathan-Tackett, S. M., Sherman, C. D. H., Huggett, M. J., Campbell, A. H., Laverock, B., Hurtado-McCormick, V., et al. (2019). A horizon scan of priorities for coastal marine microbiome research. Nat. Ecol. Evol. 3, 1509–1520. doi: 10.1038/s41559-019-0999-7
van de Water, J. A. J. M., Voolstra, C. R., Rottier, C., Cocito, S., Peirano, A., Allemand, D., et al. (2018). Seasonal Stability in the Microbiomes of Temperate Gorgonians and the Red Coral Corallium rubrum Across the Mediterranean Sea. Microb. Ecol. 75, 274–288. doi: 10.1007/S00248-017-1006-Y
Van Rossum, G., and Drake, F. L. (2019). The Python Language Reference — Python 3.7.4 documentation. Available online at: https://docs.python.org/release/3.7.4/reference/index.html [Accessed July 12, 2020].
Wang, Y., Naumann, U., Wright, S. T., and Warton, D. I. (2012). mvabund - an R package for model-based analysis of multivariate abundance data. Methods Ecol. Evol. 2012, 471–474. doi: 10.1111/j.2041-210X.2012.00190.x
Webb, C. O., Ackerly, D. D., McPeek, M. A., and Donoghue, M. J. (2002). Phylogenies and Community Ecology. Annu. Rev. Ecol. Syst. 33, 475–505. doi: 10.1146/ANNUREV.ECOLSYS.33.010802.150448
Wentworth, C. K. (1922). A Scale of Grade and Class Terms for Clastic Sediments. J. Geol. 30, 377–392. doi: 10.1086/622910
Wright, E. S. (2016). Using DECIPHER v2.0 to analyze big biological sequence data in R. R J. 8, 352–359. doi: 10.32614/rj-2016-025
Zhang, S. J., Zeng, Y. H., Zhu, J. M., Cai, Z. H., and Zhou, J. (2022). The structure and assembly mechanisms of plastisphere microbial community in natural marine environment. J. Hazard. Mater. 421, 126780. doi: 10.1016/J.JHAZMAT.2021.126780
Zhang, Z., Pan, J., Pan, Y., and Li, M. (2021). Biogeography, Assembly Patterns, Driving Factors, and Interactions of Archaeal Community in Mangrove Sediments. mSystems 6, e1381–e1320. doi: 10.1128/mSystems.01381-20
Keywords: microbiome, temporal variability, bacterial communities, mangrove forests, soil processes
Citation: Thomson T, Ellis JI, Fusi M, Prinz N, Bennett-Smith MF, Aylagas E, Carvalho S and Jones BH (2022) The Right Place at the Right Time: Seasonal Variation of Bacterial Communities in Arid Avicennia marina Soils in the Red Sea Is Specific to Its Position in the Intertidal. Front. Ecol. Evol. 10:845611. doi: 10.3389/fevo.2022.845611
Received: 30 December 2021; Accepted: 25 February 2022;
Published: 07 April 2022.
Edited by:
Christos Athanassiou, University of Thessaly, GreeceReviewed by:
Shuo Jiao, Northwest A&F University, ChinaMohammed O. Aljahdali, King Abdulaziz University, Saudi Arabia
Copyright © 2022 Thomson, Ellis, Fusi, Prinz, Bennett-Smith, Aylagas, Carvalho and Jones. This is an open-access article distributed under the terms of the Creative Commons Attribution License (CC BY). The use, distribution or reproduction in other forums is permitted, provided the original author(s) and the copyright owner(s) are credited and that the original publication in this journal is cited, in accordance with accepted academic practice. No use, distribution or reproduction is permitted which does not comply with these terms.
*Correspondence: Timothy Thomson, dGltaS50aG9tc29uQGdtYWlsLmNvbQ==
 Timothy Thomson
 Joanne I. Ellis
 Marco Fusi
 Natalie Prinz
 Morgan F. Bennett-Smith2
 Eva Aylagas
 Susana Carvalho
 Burton H. Jones