- 1Key Laboratory of Mariculture, Ministry of Education, College of Fisheries, Ocean University of China, Qingdao, China
- 2Laboratory for Marine Fisheries Science and Food Production Processes, Pilot National Laboratory for Marine Science and Technology, Qingdao, China
- 3Department of Biological Sciences, University of Bergen, Bergen, Norway
- 4Institute of Marine Research, Bergen, Norway
- 5International Institute for Applied Systems Analysis, Laxenburg, Austria
Japanese Spanish mackerel (Scomberomorus niphonius) is an important fish species in the China Seas with wide distribution, extensive migration, and high economic value. This species has been yielding high fisheries production despite experiencing continuously high fishing pressure and the conversion from gillnet to trawl harvesting. Meanwhile, changes in life-history traits have been observed, including earlier maturation and smaller size at age. Here, we build an individual-based eco-genetic model parameterized for Japanese Spanish mackerel to investigate the population’s response to different fishing scenarios (fishing by trawl or by gillnet). The model allows evolution of life-history processes including maturation, reproduction and growth. It also incorporates environmental variability, phenotypic plasticity, and density-dependent feedbacks. Our results show that different gear types can result in different responses of life-history traits and altered population dynamics. The population harvested by gillnet shows weaker response to fishing than that by trawl. When fishing ceases, gillnet-harvested population can recover to the pre-harvest level more easily than that harvested by trawl. The different responses of population growth rate and evolution to different fishing gears demonstrated in this study shed light on the sustainable management and utilization of Japanese Spanish mackerel in the over-exploited China Seas.
Introduction
Fishing is recognized as a potential evolutionary force, described as a “large-scale size-selective experiment on life-history evolution” (Rijnsdorp, 1993; Stokes and Law, 2000). Usually, commercial fisheries harvest large-sized individuals, because fisheries management regulations are enacted to protect small individuals and larger-sized individuals tend to have higher economic values (Holland and Sutinen, 1999; Salas et al., 2004; Andersen et al., 2012). Consequently, smaller-sized individuals survive better from selective harvest, and earlier-matured individuals are more likely to reproduce. When these affected traits possess genetic variability, the resultant harvest selection will alter the population’s gene frequencies. Conclusive evidence for adaptive evolution has been obtained through controlled experiments [reviewed by Conover and Baumann (2009); Díaz Pauli and Heino (2014)]. Controlled experiments show that the removal of larger individuals from a population leads to changes in phenotypic traits, typically leading to reduced body size and smaller size at maturation (Edley and Law, 1988; Conover and Munch, 2002; van Wijk et al., 2013). In the wild, evidence for FIE is less conclusive because it can be difficult to disentangle fisheries-induced evolution (FIE) from phenotypically plastic or demographic changes (Ricker, 1981; Rijnsdorp, 1993; Heino and Dieckmann, 2008; Heino et al., 2015). FIE experiments in the laboratory also revealed dramatic shifts in allele frequencies, loss of genetic diversity, and increases in linkage disequilibrium at specific locations in the genome (van Wijk et al., 2013; Uusi-Heikkilä et al., 2017; Therkildsen et al., 2019). However, the magnitude and frequency of FIE may be quite small in the wild (Andersen and Brander, 2009). A recent study analyzed genome-wide data obtained from two exploited Atlantic cod populations and found little evidence of rapid evolution (Pinsky et al., 2021).
In order to understand the mechanisms of FIE and guide empirical work, eco-genetic models have emerged as indispensable tools. Eco-genetic models permit the incorporation of salient genetic detail such as a population’s genetic variances and covariances and the corresponding heritabilities, as well as the probabilistic inheritance and phenotypic expression of quantitative traits (Dunlop et al., 2009a). Eco-genetic models integrate principles of life-history and quantitative genetics theories to account for life-history and genetic variability and have been used to explore the eco-evolutionary consequences of harvesting on fish populations (e.g., Baskett et al., 2005; Marty et al., 2015; Mollet et al., 2016). Such eco-genetic models focus on the evolution of life-history traits, their correlation structure, bioeconomic consequences, and the effects of different exploitation strategies. These models have generated insights into the influence of FIE on populations (Dunlop et al., 2009b,2015; Enberg et al., 2009; Marty et al., 2015), differences in selection pressures caused by different gear types (Jørgensen et al., 2009), and the bioeconomic consequences of FIE (Eikeset et al., 2013; Zimmermann and Jørgensen, 2015). These insights provide guidance to managers to help mitigate adverse effects of FIE and achieve the sustainable management of fisheries resources (Dunlop et al., 2009a; Jørgensen et al., 2009; Heino et al., 2013; Laugen et al., 2014; Mollet et al., 2016).
Theoretical modeling affirms that decreasing fishing mortality can weaken the evolutionary response to harvest (Law and Grey, 1989; Ernande et al., 2004; Marty et al., 2015; Kuparinen et al., 2016). But reducing fishing effort in a fishery is generally known to be difficult (Hilborn and Walters, 1992), considering its short-term social and economic effects, which makes managing fishing gear and their size-selectivity an attractive alternative avenue (Law, 2000; Jørgensen et al., 2009; Zimmermann and Jørgensen, 2017). The selectivity of fishing gears is determined by gear type (Watson et al., 2006) and properties of individual gear, such as mesh size (Hamley, 1975). Trawls, seines and stow nets with sigmoid size-selectivity curves target big individuals. Gillnets with bell-shaped selectivity curve exclude fish below or above a target size range. The difference of selection landscape between sigmoid and bell-shaped selectivity curves causes different responses of life-history traits to fishing (Jørgensen et al., 2009; Mollet et al., 2016; Zimmermann and Jørgensen, 2017).
Japanese Spanish mackerel is an epipelagic, neritic species, widely distributed throughout the subtropical and temperate waters of the western North Pacific and playing an important role in the commercial fisheries of China. Since the 1950s, Japanese Spanish mackerel has been extensively exploited; however, its catch has shown an increasing trend, maintaining above 4 × 10⁵ t in recent years (Ministry of Agriculture and Rural Affairs, 1998–2020). Japanese Spanish mackerel was mainly exploited by gillnets from the 1950s to 1970s. Since then, the catch proportion harvested by gillnets has declined, and trawl has become the main harvesting gear (Qiu et al., 2009). The sustained high catch of Japanese Spanish mackerel under continuous fishing pressure by trawl fisheries is contrary to the common pattern that commercial fish populations tend to decline after an extended period of fishing pressure (Law, 2000; Hutchings, 2005). At the same time, the population characteristics of Japanese Spanish mackerel have changed, including age structure dominated by 1- and 2-year-old individuals, earlier maturation, and prolonged spawning season (Qiu and Ye, 1996; Mu et al., 2018). So it will be worth studying the influence of different gear types on the evolution of life-history traits, the effects of life-history evolution on population characteristics, and the possibility of reversing evolution by managing fishing gear and its size-selectivity.
Here, we constructed an individual-based eco-genetic model (Dunlop et al., 2009b) parameterized for Japanese Spanish mackerel in the China Seas and investigated two contrasting scenarios—evolutionary and non-evolutionary—in order to assess the consequences of genetic trait evolution under exploitation with different gears. Specifically, by comparing the evolutionary and non-evolutionary scenarios during the exploitation phase as well as the subsequent moratorium period, we can address the role of FIE in population dynamics under different fishing gear types. The main objectives of this study are to (a) explore the role of evolution during population exploitation and moratorium phases, (b) identify the influence of different gear types and levels of fishing mortality on the adaptive evolution, and the response of genetic traits to trawl- and gillnet-harvesting, and (c) provide guidance to mitigate the adverse effects of FIE.
Model Description
We constructed an individual-based eco-genetic model to study the influence of selective harvest on evolution of life-history traits for Japanese Spanish mackerel. The model combines the quantitative genetics of evolving life-history traits with individual-level ecological processes of growth, survival and reproduction, as well as with population-level ecological processes such as density dependence and environmental variability.
In our model, each individual is characterized by five traits, which affect its life history through growth rate, maturation schedule, and reproductive investment. The expression of these genetic traits can be influenced by environmental variation. Eventually, the phenotypic traits are determined by the value of genetic traits and environmental variation together. The individuals grow, mature, reproduce, and die from natural or fishing mortality. When many such interacting individuals share a common ecological environment, population dynamics emerge. The factors affecting population dynamics are present as density dependence and environmental stochastic fluctuations, which act on recruitment and growth conditions. In this competitive and stochastic environment, some genetic traits improve an individual’s chances to survive and produce offspring more than others and are therefore more likely to be transmitted to future generations.
Genetic Traits and Their Expression
Each individual i in year t possesses five inherited quantitative genetic traits: juvenile growth rate g(i, t), growth investment at maturation onset α(i, t), rate of decay in post-maturation growth investment χ(i, t), intercept γ(i, t), and slope s(i, t) of probabilistic maturation reaction norm (PMRN; Heino et al., 2002; Dieckmann and Heino, 2007). The genetic trait g(i, t) affects its resource acquisition, while α(i, t) and χ(i, t) determine the trade-off between somatic growth and reproductive investment. The genetic traits γ(i, t) and s(i, t) specify an individual’s maturation schedule through the PMRN intercept γ and slope s.
Given that the actual distribution of genetic variation among our five inherited quantitative genetic traits is unknown for Japanese Spanish mackerel, we assumed the same coefficient of genetic variation (CVG = 12%) for all evolving traits. CVG is given by,
Where is the genetic variance of the initial population, and is the mean value of genetic trait.
All initial individuals are assigned with trait values from a normal distribution with a mean equal to the population-level genetic value and a coefficient of genetic variation of 12%. Offspring inherit the genetic traits of their parents from a normal distribution with mean equal to the mid-parental value and variance ; the latter is assumed to held constant through time at half the genetic variance of the initial population, i.e., (Dunlop et al., 2009b). The phenotypic variance of genetic traits was determined by assuming that individual-level phenotypic can be described by a Gaussian distribution with a mean equal to the individual’s genetic trait value and a constant environmental variance , with the latter calculated by assuming a conservative heritability h2 of 0.2 in the initial population; thus . The relationship among , , and h2 is given by,
Besides expression noise, population-level density dependence also can affect the juvenile growth rate g(i, t),
Where B(t) is the population biomass in year t and ρ is the strength of density dependence in growth.
Life-History Processes
In addition to the five genetic traits [g(i, t), α(i, t), χ(i, t), γ(i, t), s(i, t)], an individual i in year t is also characterized by its phenotypic life-history traits including age a(i, t), length l(i, t), age at maturation am(i), and fecundity Q(i, t). All these life-history traits determine the life-history processes including somatic and gonadic growth, maturation, reproduction and mortality.
Energy Allocation to Somatic and Gonadic Growth
Energy allocation between growth and reproduction is described following the biphasic seasonal growth model (Quince et al., 2008). Before maturation, an individual allocates all net energy, which is assumed to scale with its somatic weight w(i, t) as wβ(i, t), where β denotes the allometric exponent, to somatic growth. For adults, net energy is allocated between somatic and gonadic growth after a fraction p(i, t)of the productive season and p(i, t) is given by,
Where α(i) gives the proportion of the growing season in the first adult year that is devoted to somatic growth, and χ(i) measures the annual decrease of this proportion in the adult stage. Both parameters range from 0 to 1 (Quince et al., 2008). This is consistent with von Bertalanffy adult growth.
We assume an allometric exponent β of 2/3 (Kozlowski and Wiegert, 1986; Kozłowski and Wiegert, 1987; Lester et al., 2004) and relationship between somatic weight and body length of w = Ωl3. An individual length-at-age trajectory is given by,
Before maturation, the gonad weight equals 0. After maturation, it is a function of body length at the end of each productive season,
Where γ is the ratio of the wet-weight energy density of somatic tissue to gonad tissue.
Maturation
We model the maturation process using the PMRNs (Heino et al., 2002; Dieckmann and Heino, 2007). The probability that an immature individual matures in a given year probabilistically depends on its age and size. We assume a linear PMRN with a constant width. The PMRN is thus determined by its intercept γ and slope s. The maturation probability is then given by the logistic equation:
Where l(i, t) is the length of individual i in year t, and lp50(i, t)defines the reaction-norm midpoints, i.e., the body length at which the probability of maturing reaches 50%, calculated as lp50 (i, t) = y(i) + s(i) a(i, t). The parameter δ is determined by the PMRN envelope width w,
With and plow specify the lower and upper probability bounds, respectively, chosen for defining the PMRN width (in our model, we chose quartiles pup = 0.25and plow = 0.75).
We use a stochastic process of Bernoulli trials to model an individual maturation process. If a number randomly drawn from a uniform distribution between 0 and 1 is smaller than m(i, t), maturation takes place.
Reproduction
An individual’s fecundity is defined by dividing its gonad weight by an egg weight, Q(i, t) = G(i, t) / wegg. The total number of newborns in each year, N0, is density-dependent and determined by a Beverton–Holt recruitment function (Beverton and Holt, 1957) that depends on the total fecundity of the population.
Here, e−εR(t) describes population-level inter-annual environmental variability in recruitment modeled as a lognormal process, where εR(t) is normally distributed, which represents the influence of environmental fluctuations (e.g., temperature or larval food supply) on recruitment. The parameter η1 specifies the survival of recruits when total fecundity is low, while η2 measures the strength of density dependence; the asymptotic number of recruits at high total fecundity is given by η1/η2 (Quinn and Deriso, 1999).
The female parent of newborns is selected in proportion to female gonad size through a stochastic process of Bernoulli trials. Firstly, we determine the female which has the largest gonad weight. And then, a number is drawn randomly from a uniform distribution between 0 and this maximal gonad weigh. If this number is less than the gonad weight of the drawn individual, this individual will be selected as female parent. The other parent will be selected randomly from amongst the mature males. Eventually, all newborns will be assigned two parents through the random draws. Therefore, an individual having higher fecundity will, on average, produce more offspring (Marty et al., 2015).
For each female in the population, the model records the number of offspring that survive to reach maturity. Then we calculate the average number of offspring that reach maturity for each cohort R0, which represents the average lifetime reproductive output of females in a cohort. For each cohort we calculate the population growth rate per unit time as , where G is the generation time, estimated by the mean age at maturation for the cohort (Kuparinen and Hutchings, 2012; Dunlop et al., 2015).
Natural and Fishing Mortality
Natural mortality consists of three components: (i) size-independent mortality d0 originating from diseases, senescence, parasites or any stochastic source of mortality; (ii) size-dependent predation mortality ds that decreases with the increase in body size according to,
Where cs denotes the (hypothetical) maximum instantaneous predation mortality rate at size zero and ls is the size at which the predation mortality is decreased by the factor 1/e; and (iii) a growth-dependent mortality,
With cg denoting the minimum instantaneous growth-dependent mortality rate and g0 the growth rate at which the growth-dependent mortality is increased by factor e. Growth-dependent mortality accounts for the trade-off between growth and survival. Faster growth is achieved at the cost of less energy being available for maintenance (Ernande et al., 2004) and/or a higher exposure to predation (Abrams, 1991; Werner and Anholt, 1993; Walters and Korman, 1999) through more active foraging.
In addition to the natural mortality components, individuals may also experience fishing mortality at an instantaneous rate H. Fishing is size-selective with gillnet-like or trawl-like fishing selectivity curves (Figure 1). Gillnet-like selectivity curve kG is defined as:
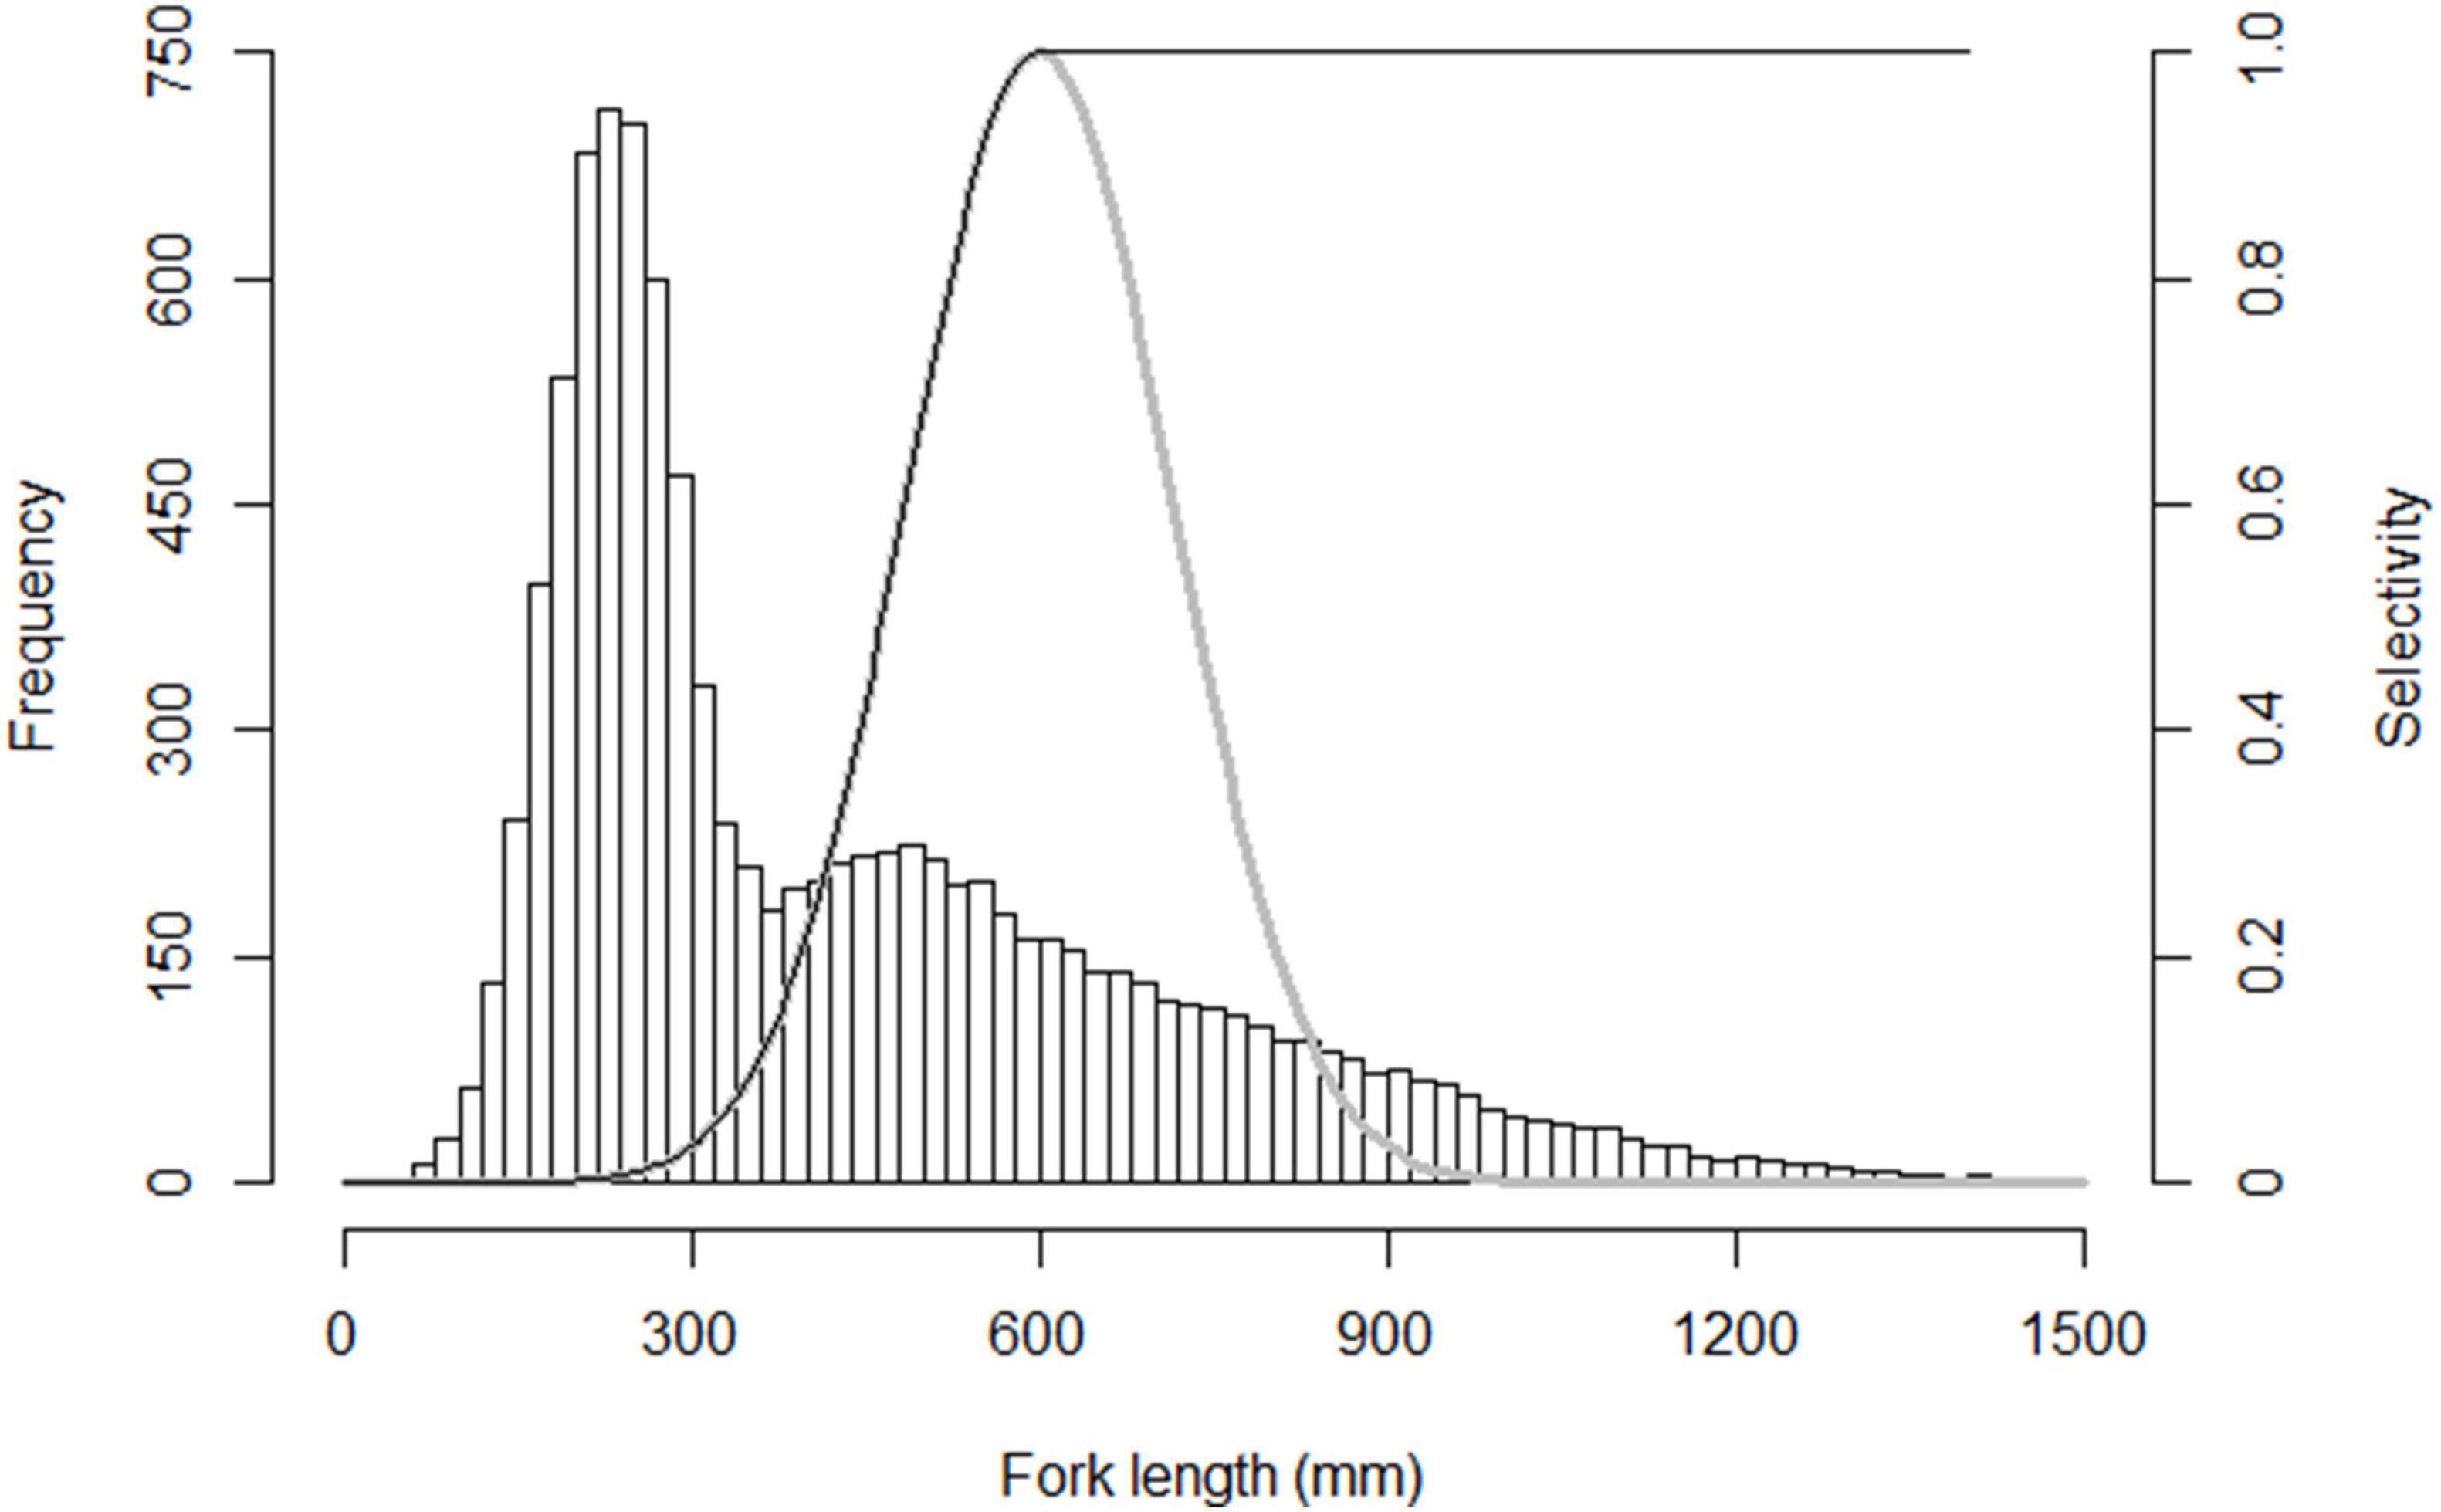
Figure 1. Fork length distribution of Japanese Spanish mackerel populations and size-selectivity curves used to impose selection on Japanese Spanish mackerel life histories. At maximum selectivity, fish of that size are harvested at the rate specified by the parameter H. The bell-shaped size-selectivity curve is for gillnet. The peak of the Gaussian function is at 600 mm. In each case the standard deviation is 1.5% of the mean. Sigmoid trawl selectivity was modeled based on the same probability distribution as for gillnet, maximum selectivity for all fish with lengths larger than that at the peak selectivity.
Where Lmax specifies the size at which the selectivity curve peaks and fish become fully vulnerable to fishing. To increase comparability, we introduce a modified trawl-like selectivity curve kT by replacing the descending leg of the curve by a constant equal to the maximum selectivity:
The instantaneous fishing mortality rate is determined by this selectivity 0 < k ≤ 1 and the maximum instantaneous harvest rate H,
The total instantaneous mortality rate is then given by,
The resultant individual-specific annual probability of dying is D(i, t) = 1 − exp(−Z(i, t)⋅1year), which again is realized through Bernoulli trials.
Model Parameterization and Model Runs
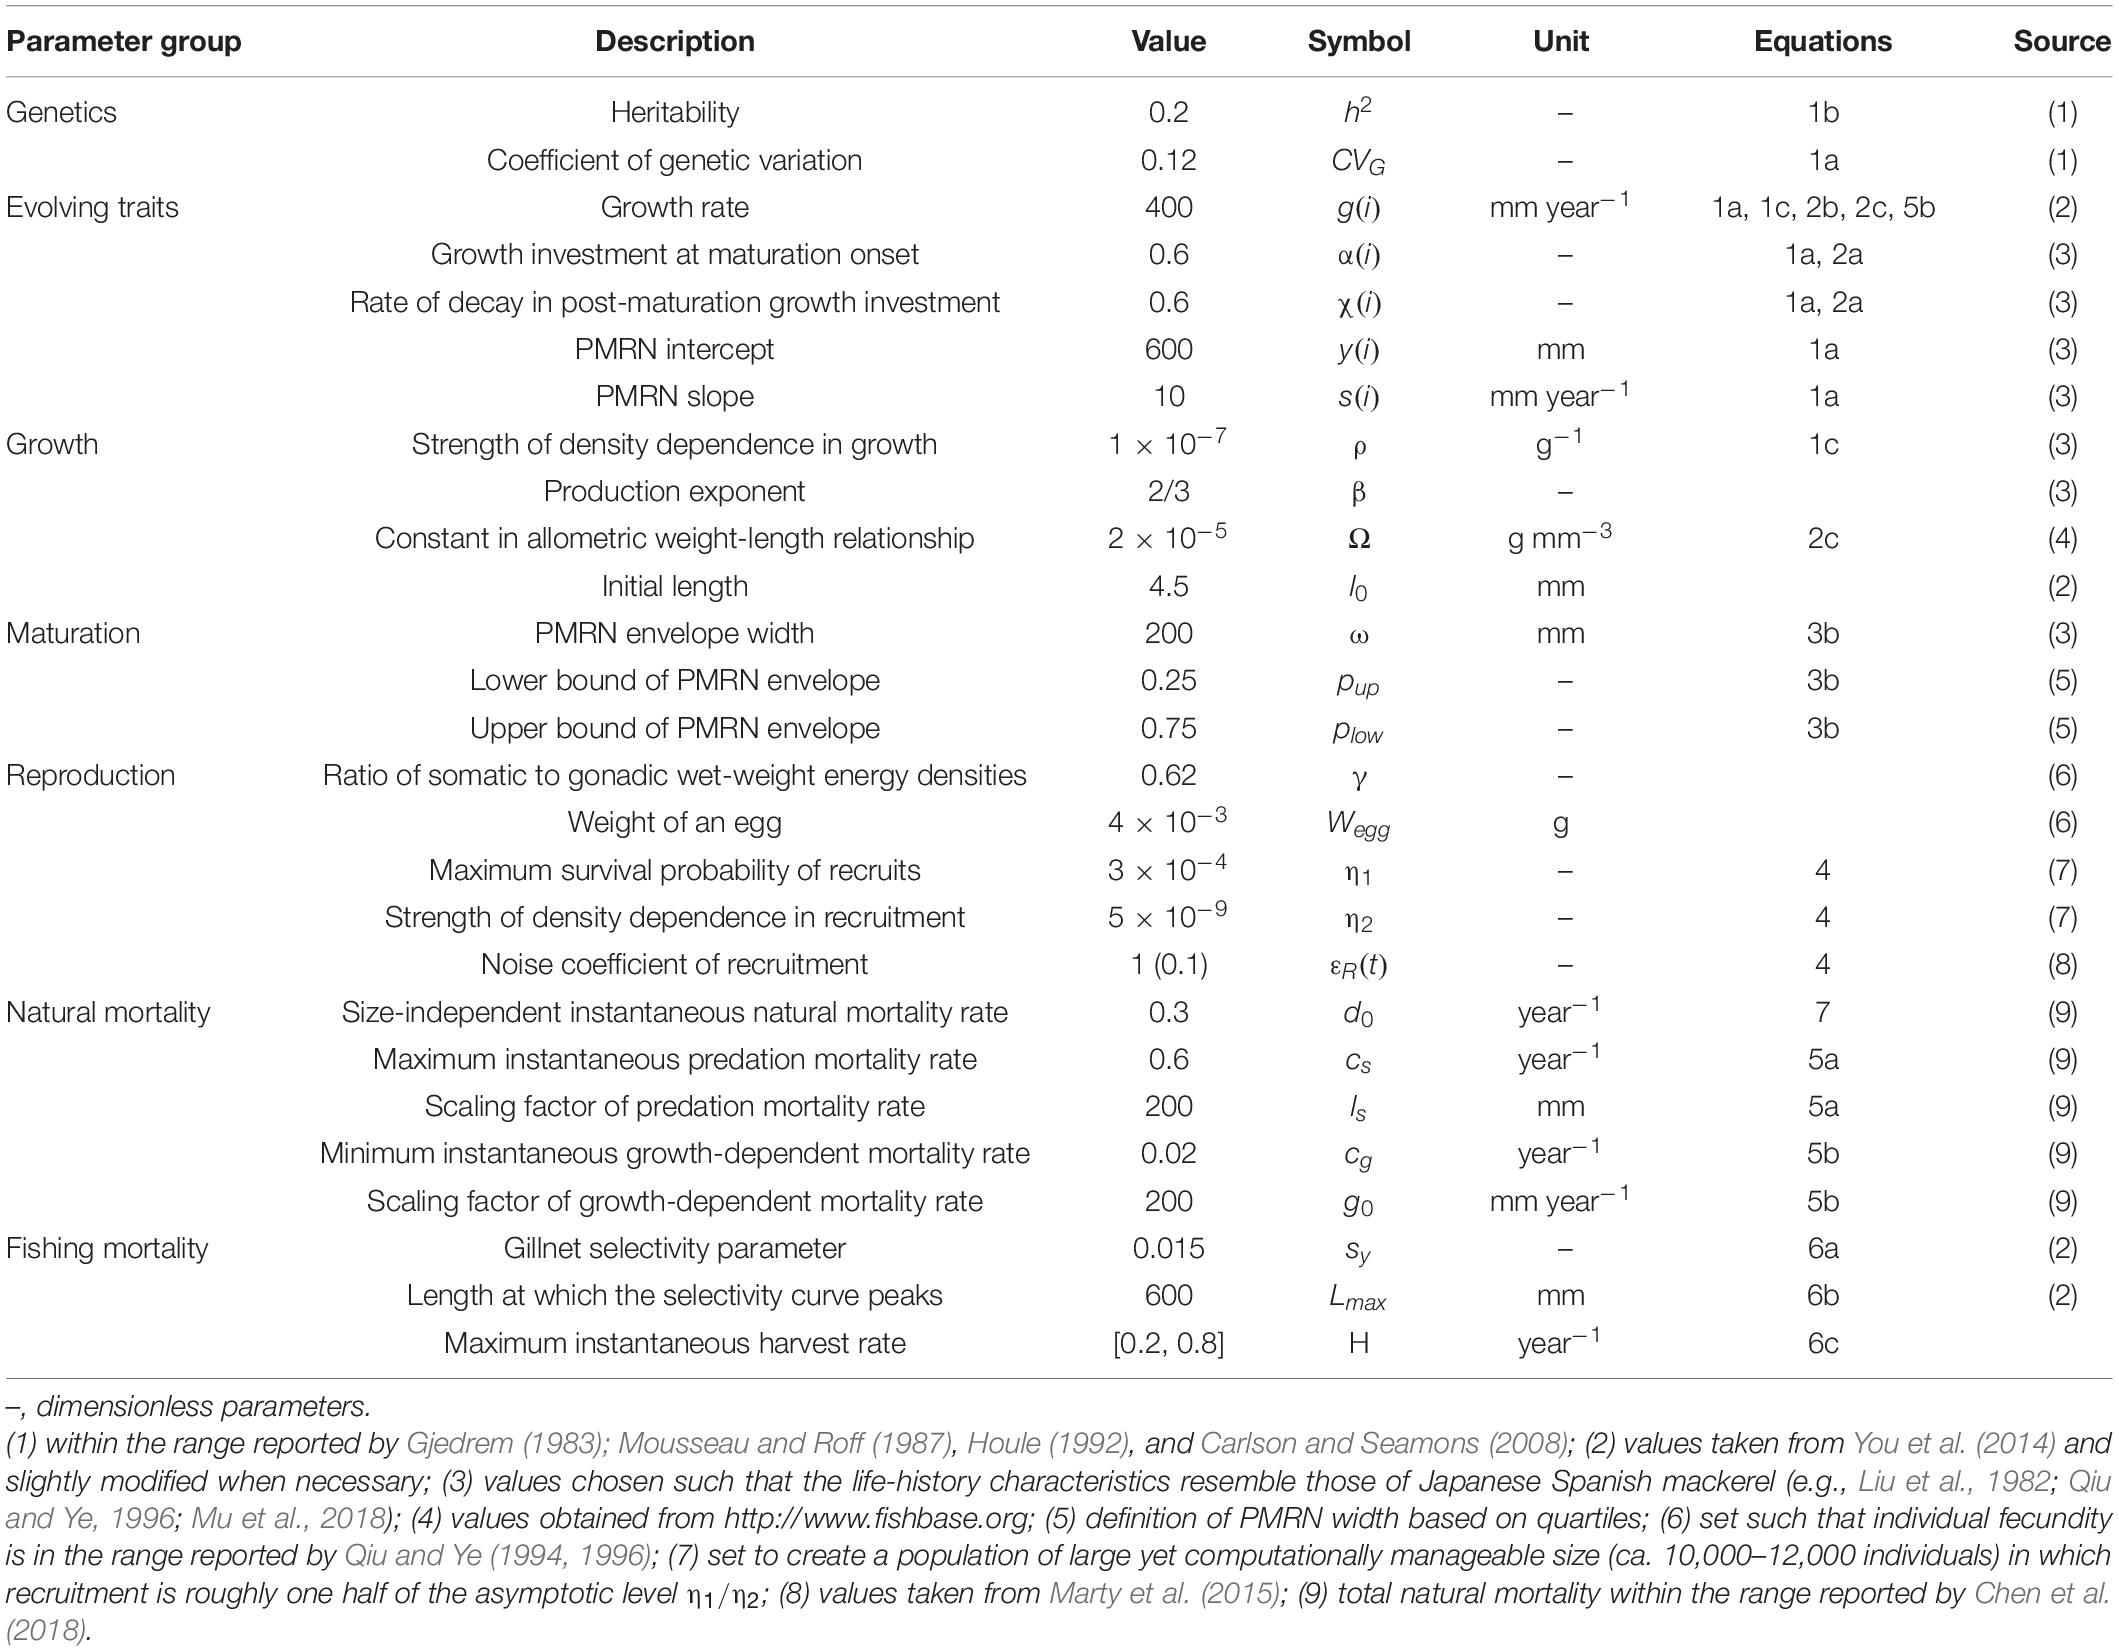
We model a Japanese Spanish mackerel population with parameters taken from the historical survey data. Whereas some parameters are unknown or cannot be estimated from available data, we assume these values to ensure that the emergent model properties qualitatively and quantitatively resemble the natural patterns (Grimm et al., 2005). To do so, we first run our model to reach an equilibrium with likely parameter values and compare the output with data available. Parameters were adjusted until the modeled patterns (e.g., growth curves, age and size distributions, and fecundity) resemble the real patterns observed for Japanese Spanish mackerel, and all parameters are shown in Table 1.
After running for 5,000 years without harvesting, the population approaches a demographic and evolutionary equilibrium, that is, all genetic traits and the correlations among them have converged close to an evolutionarily stable strategy. We display all results from this time onward. Model is then run without fishing for 100 extra years. Harvesting then starts and lasts another 100 years, followed by a 100 years’ moratorium. All results presented are averages of 30 replicate models runs, carried out with different random seeds.
Evolutionary and Non-evolutionary Model
Given the unknown evolvability of the evolving traits in Japanese Spanish mackerel population, following Houle (1992) and Dunlop et al. (2009b), we set the CVG at either 0% (i.e., purely ecological dynamics with no evolution) or 12% (i.e., with a high evolvability), respectively, to construct the non-evolutionary and evolutionary scenarios. The comparison between the non-evolutionary and evolutionary scenarios can help understand the influence of gear types on life-history evolution qualitatively, and the role of evolution in population exploitation and recovery phase.
Results
Dynamics of Population Biomass and Population Traits in Evolutionary and Non-evolutionary Scenarios
The response of population biomass to fishing is determined by harvest patterns and evolutionary assumptions (Figure 2). With the trawl-harvesting, increasing fishing intensity magnifies the evolutionary response of population biomass, which can be seen by comparing time series of total biomass for the evolving population with its hypothetical non-evolving counterpart (Figures 2A,C,E). When fishing begins, biomass of evolving population declines dramatically at the early phase of harvest, and then rebounds; this rebound is more obvious at high fishing pressure (Figure 2E). When fishing ceases, biomass of evolving population increases rapidly at the early phase of moratorium, but then the pace of recovery slows down and the biomass does not recover to the pre-harvest level during a 100-year moratorium. In contrast, biomass of non-evolving population does not rebound during the fishing period, but it quickly recovers to the pre-harvest level during the moratorium.
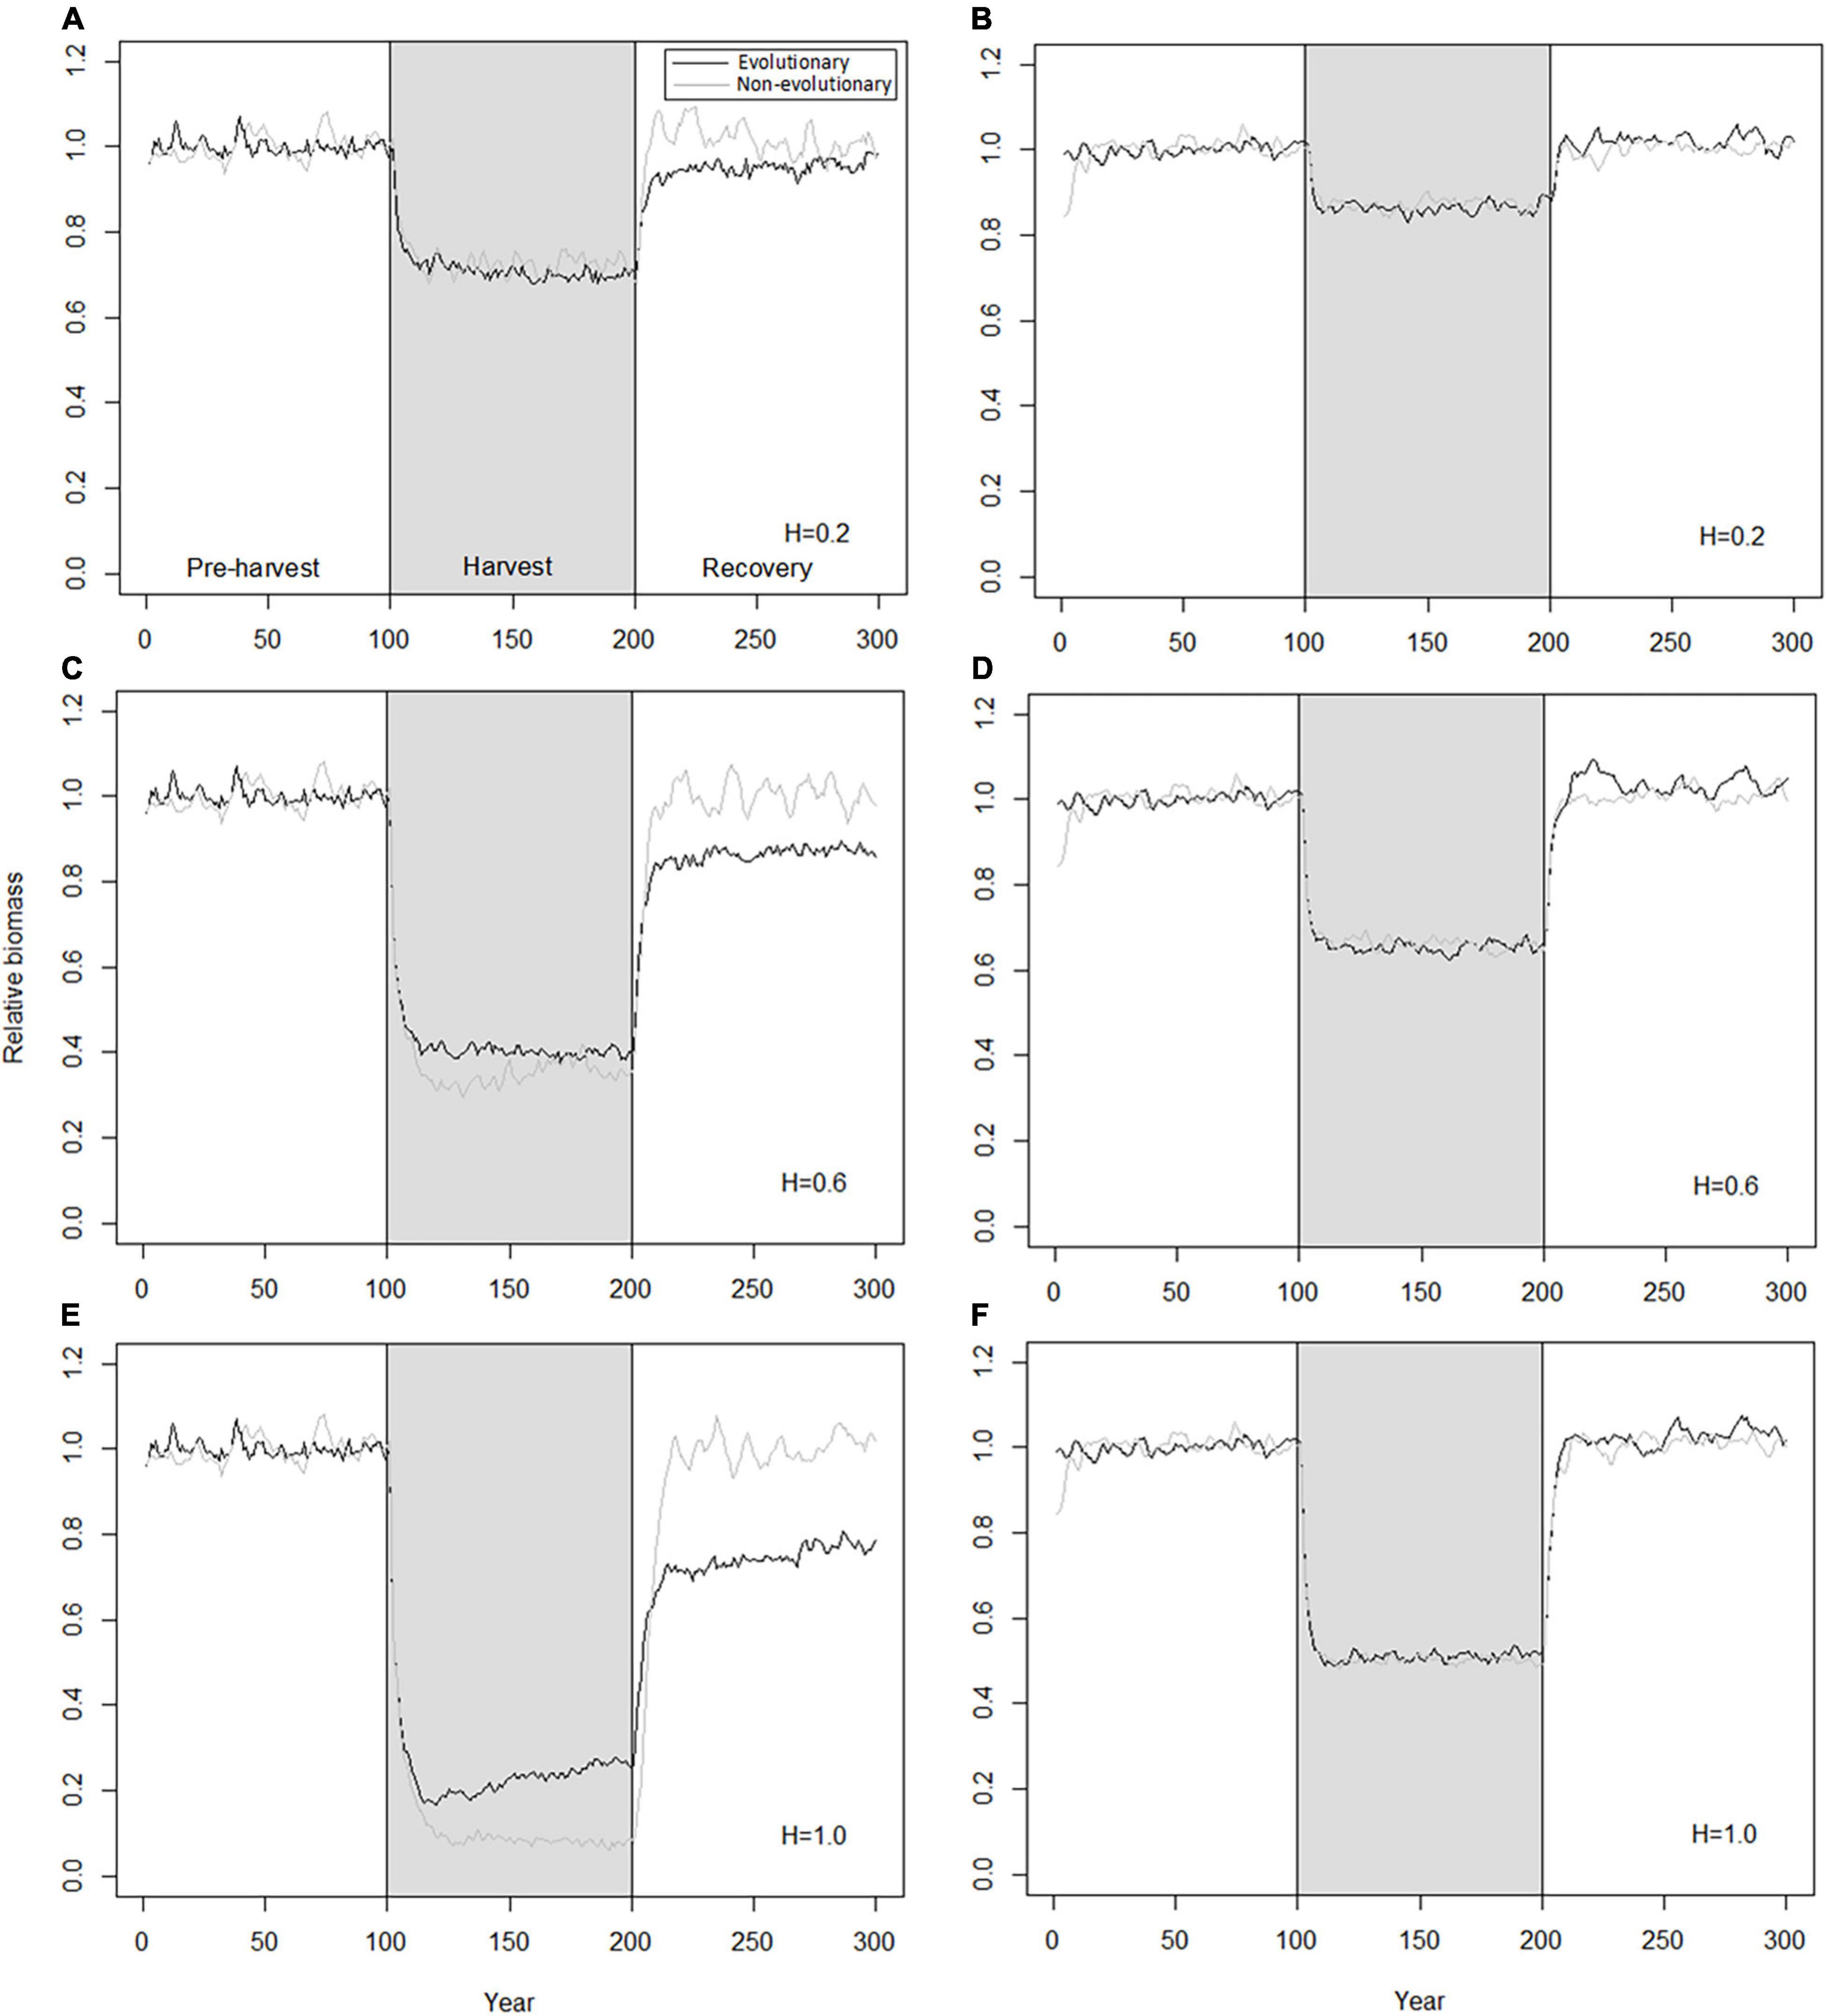
Figure 2. Decrease and subsequent recovery of population biomass (of individuals aged 1 year and older) in dependence on instantaneous harvest rate (increasing from top to bottom). Black curves, evolutionary model; gray curves, non-evolutionary model; gray shading, harvest period. (A,C,E) Panels with sigmoid size-selectivity curves as is typical for trawl, and (B,D,F) panels with bell-shaped size-selectivity curves for examples with gillnet.
Compared to trawl fishing, populations exposed to gillnet fishing show weaker but qualitatively similar biomass responses to fishing and its termination (Figures 2B,D,F). The responses are weaker also when evolution is allowed. Importantly, however, the biomasses of the evolving populations do not systematically differ from their hypothetical non-evolving counterparts (Figures 2B,D,F). In other words, there is no rebound during the fishing period, nor lack of recovery during the moratorium.
Parallel with changes in population biomass, also population- and individual-level phenotypic traits are changing. In absence of evolution, these changes reflect only demographic changes and equilibrate quickly to a new level after changes in fishing pressure (Figure 3), similarly as already seen for population biomass (Figure 2). Traits in evolving trawl-harvested populations show rapid initial responses similar to those seen for non-evolving populations, but also somewhat slower, sustained trait changes (Figure 3). These sustained changes occur during both harvest and recovery periods but are reversed and slower during the harvest period. Because of the slow change during the moratorium, population traits are not restored to their pre-harvest levels during the time horizon considered here (100 years). Notably, while the differences in traits between evolving and non-evolving populations are at their greatest in the end of the harvest period, even after 100 years of recovery, evolving populations that adapted to harvesting are characterized by earlier maturation at smaller sizes, but also by higher productivity, higher fecundity, and higher proportion of mature individuals, compared to the pre-harvest levels or those seen in the recovered non-evolving population.
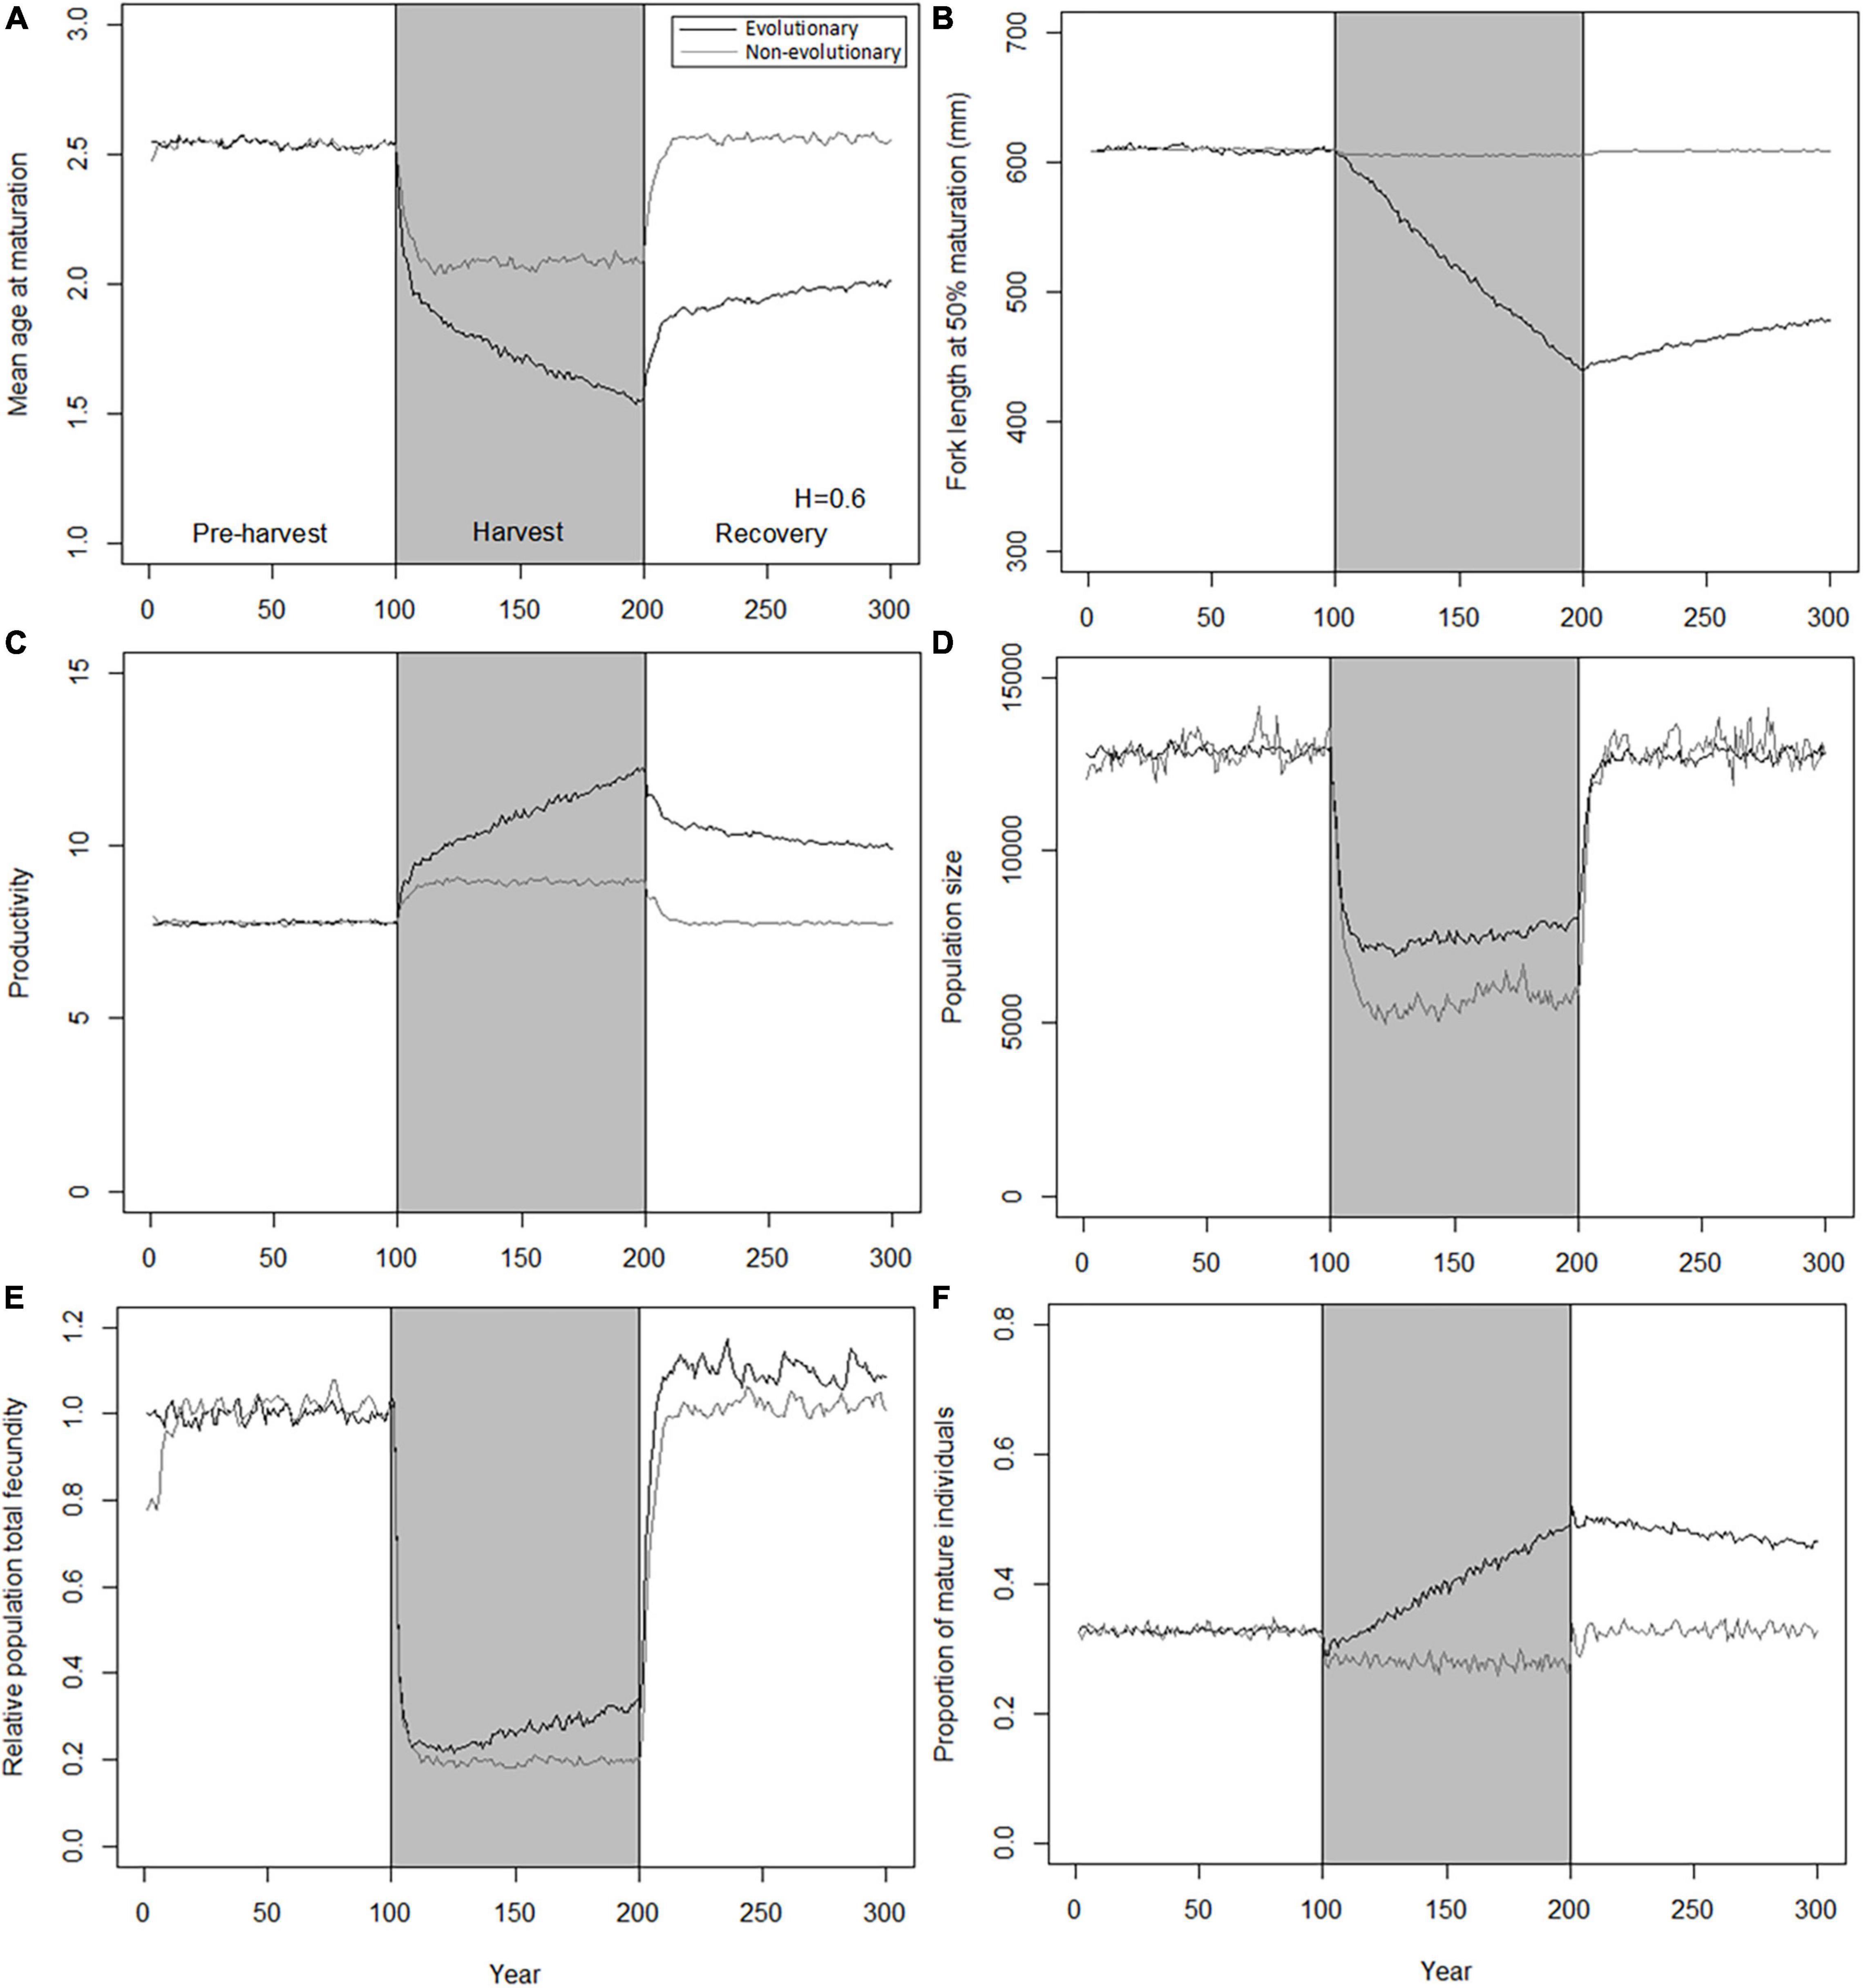
Figure 3. Decrease and subsequent recovery of population traits under 0.6 of instantaneous harvest rate by trawl. Black curves, evolutionary model; gray curves, non-evolutionary model; gray shading, harvest period. (A) Mean age at maturation; (B) fork length at 50% maturation; (C) productivity; (D) population size; (E) relative population total fecundity; (F) proportion of mature individuals.
Differences in Responses to Harvest Between Trawl-Harvested and Gillnet-Harvested Populations Under the Same Maximum Fishing Mortality
When the trawl-harvested and gillnet-harvested populations are exposed to fishing with the same maximum instantaneous harvest rate (here 0.6 yr–1), all genetic traits show stronger responses to trawl-harvesting than to gillnet-harvesting (Figure 4), with the exception of growth rate (Figure 4E). The difference is the starkest for the PMRN intercept, which declines by about 30% under trawl-harvest, but increases by about 5% under gillnet-harvest (Figure 4A). In contrast, the PMRN slope, growth investment at maturation onset, and the ratio of decay in post-maturation growth investment show less drastic declining trends during the early phase of fishing (Figures 4B–D). Contrary to other genetic traits, growth rate increases during the fishing phase, and furthermore, does not show markedly divergent responses between the trawl-harvest and gillnet-harvest (Figure 4E).
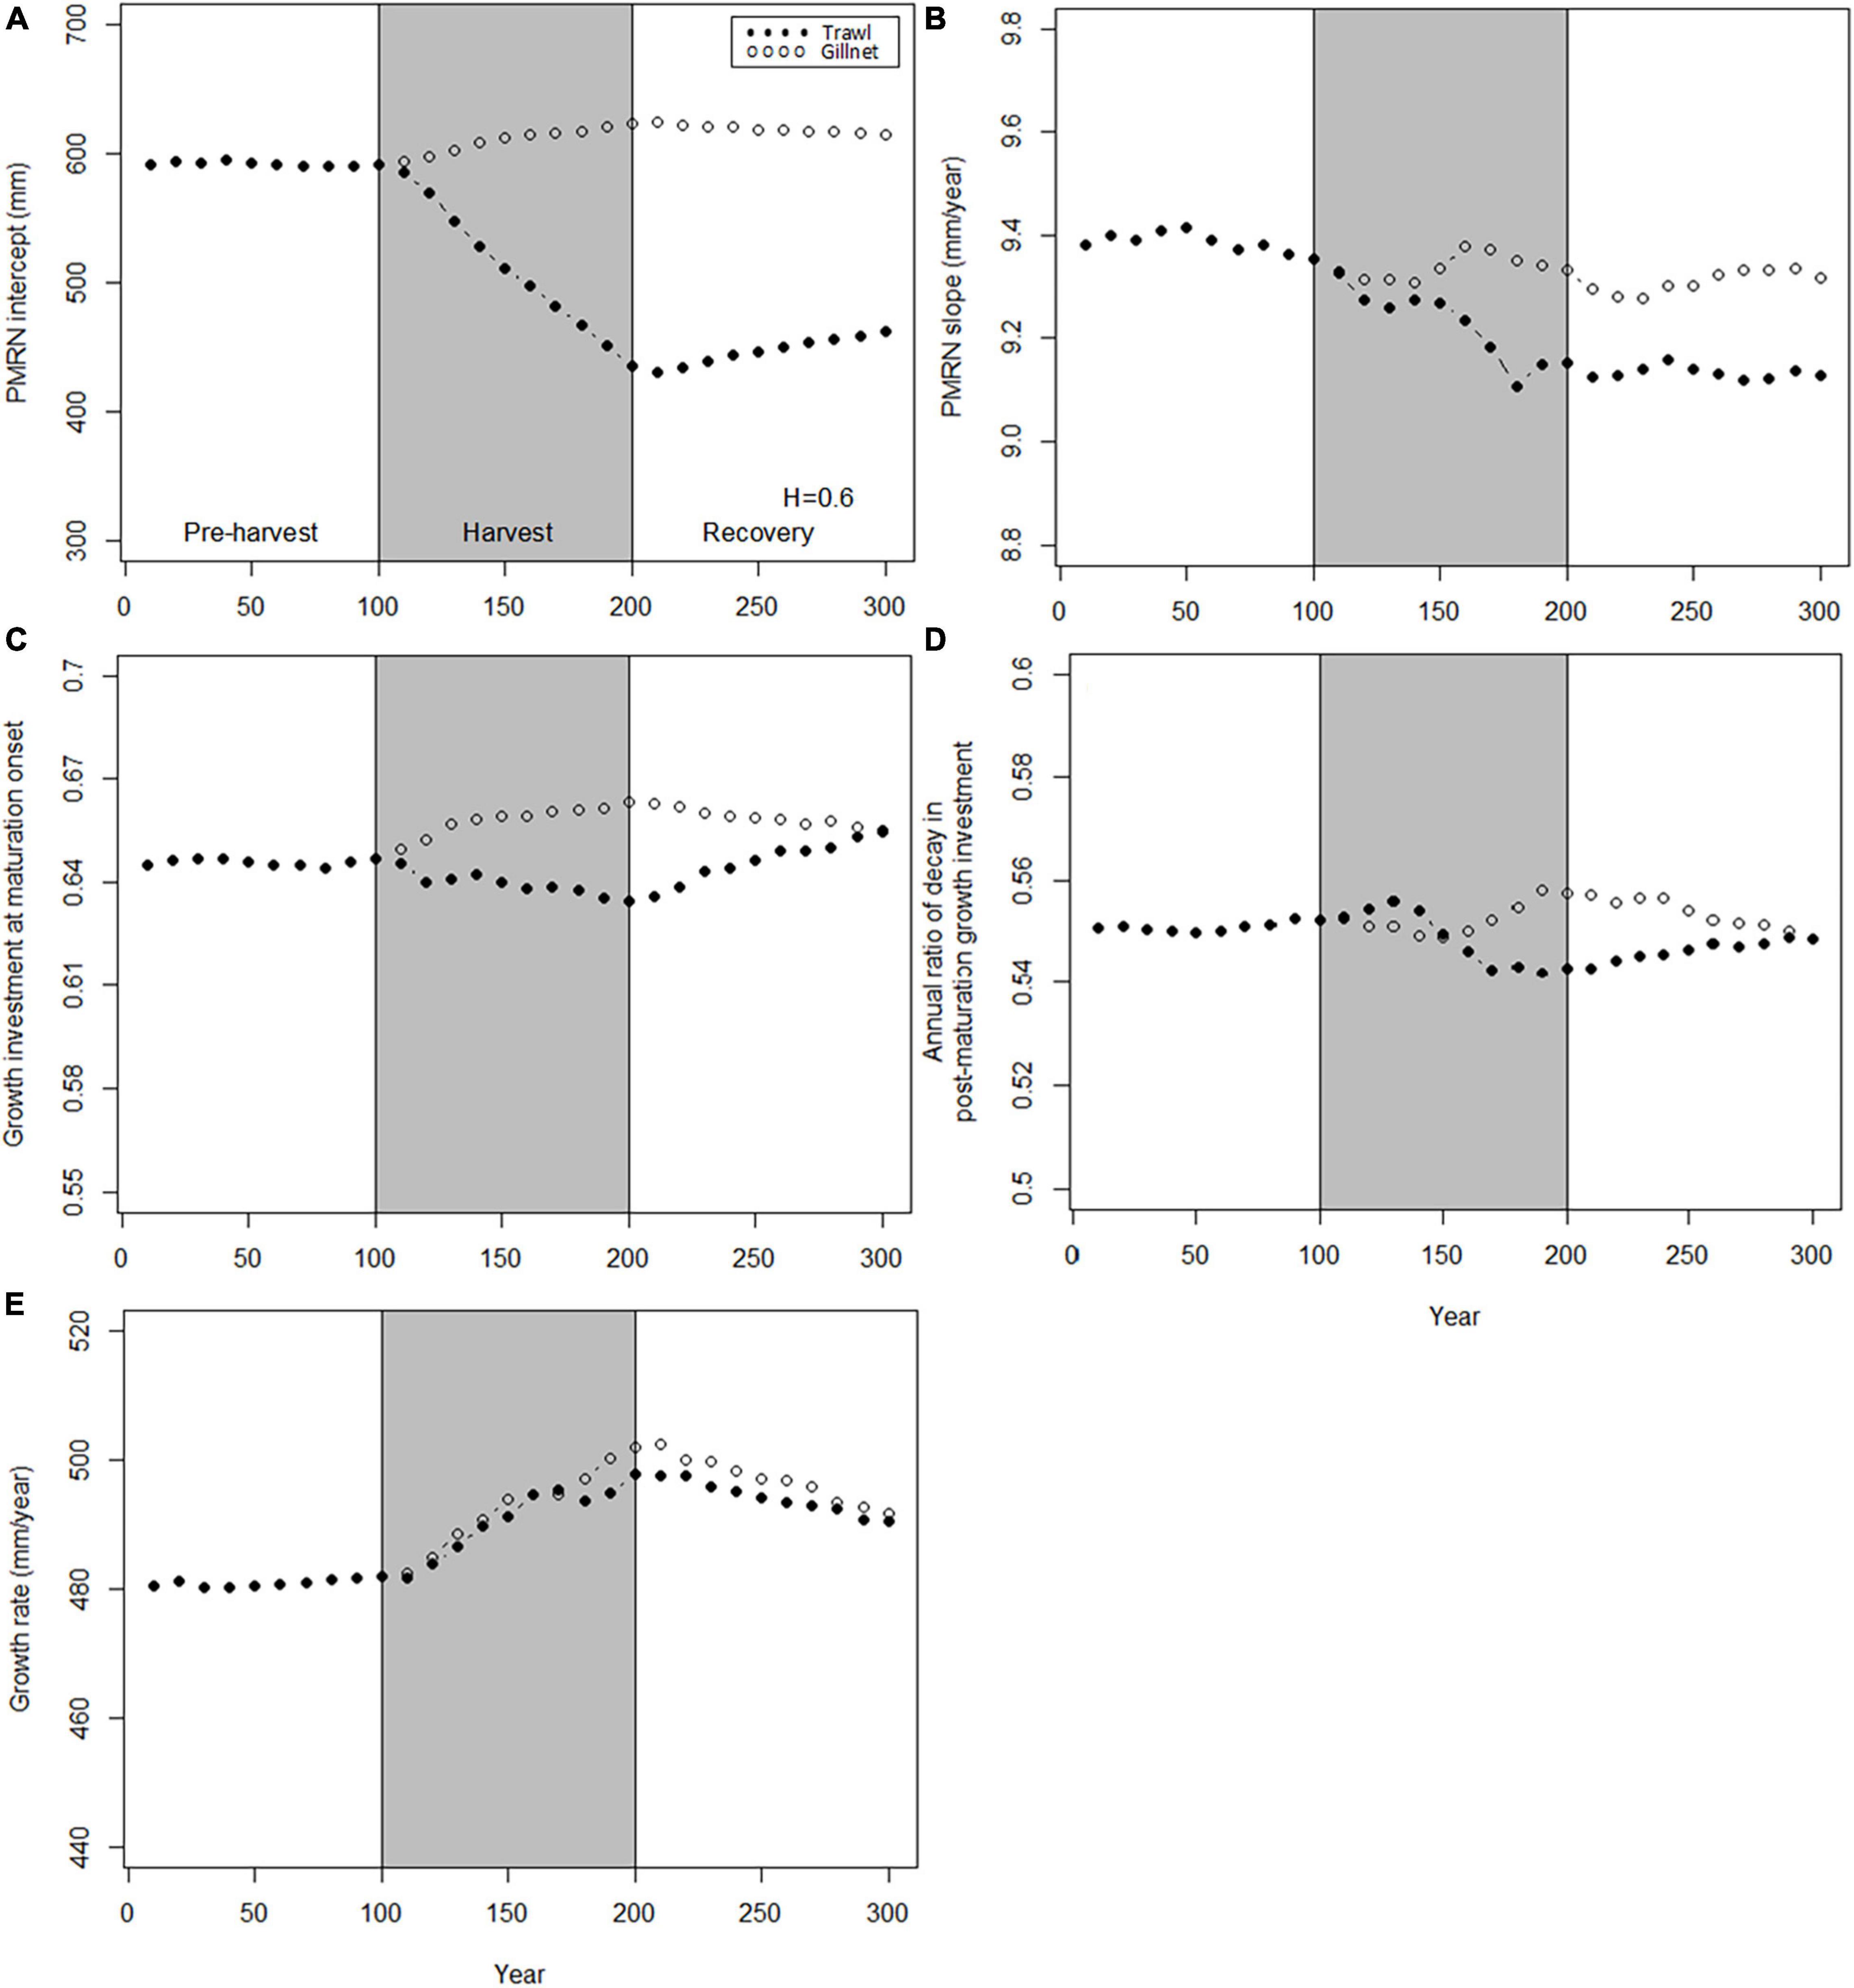
Figure 4. Dynamics of the mean genotypic values of evolving traits before, during and after harvest. Harvest (gray shading) starts at t = 100 years and stop at t = 200 years. Dynamics are shown for two harvest patterns: H = 0.6 year– 1 for trawl (solid points) and H = 0.6 year– 1 for gillnet (hollow points). (A) PMRN intercept y; (B) PMRN slope s; (C) Growth investment α at maturation onset; (D) Annual ratio χ of decay in post-maturation growth investment; (E) Juvenile growth rate g.
Compared to the genetic traits, population traits show more consistently large harvest-induced divergence between trawl-harvested and gillnet-harvested populations (Figure 5). During the moratorium, because genetic changes in individual-level genetic traits are relatively modest in gillnet-harvested populations (Figure 4), traits in these population are able to quickly recover near to their pre-harvest levels. In contrast, trawl-harvested populations show consistently large responses during the harvest period and only partial recovery during the moratorium (Figure 5). Notable exceptions to this pattern are population size and population fecundity: in trawl-harvested populations the former recovers to its preharvest level (Figure 5D), while the latter overshoots to a level that exceeds its pre-harvest level by about 10% (Figure 5E). For these same cases, the gillnet-harvested populations fail to reach a full recovery.
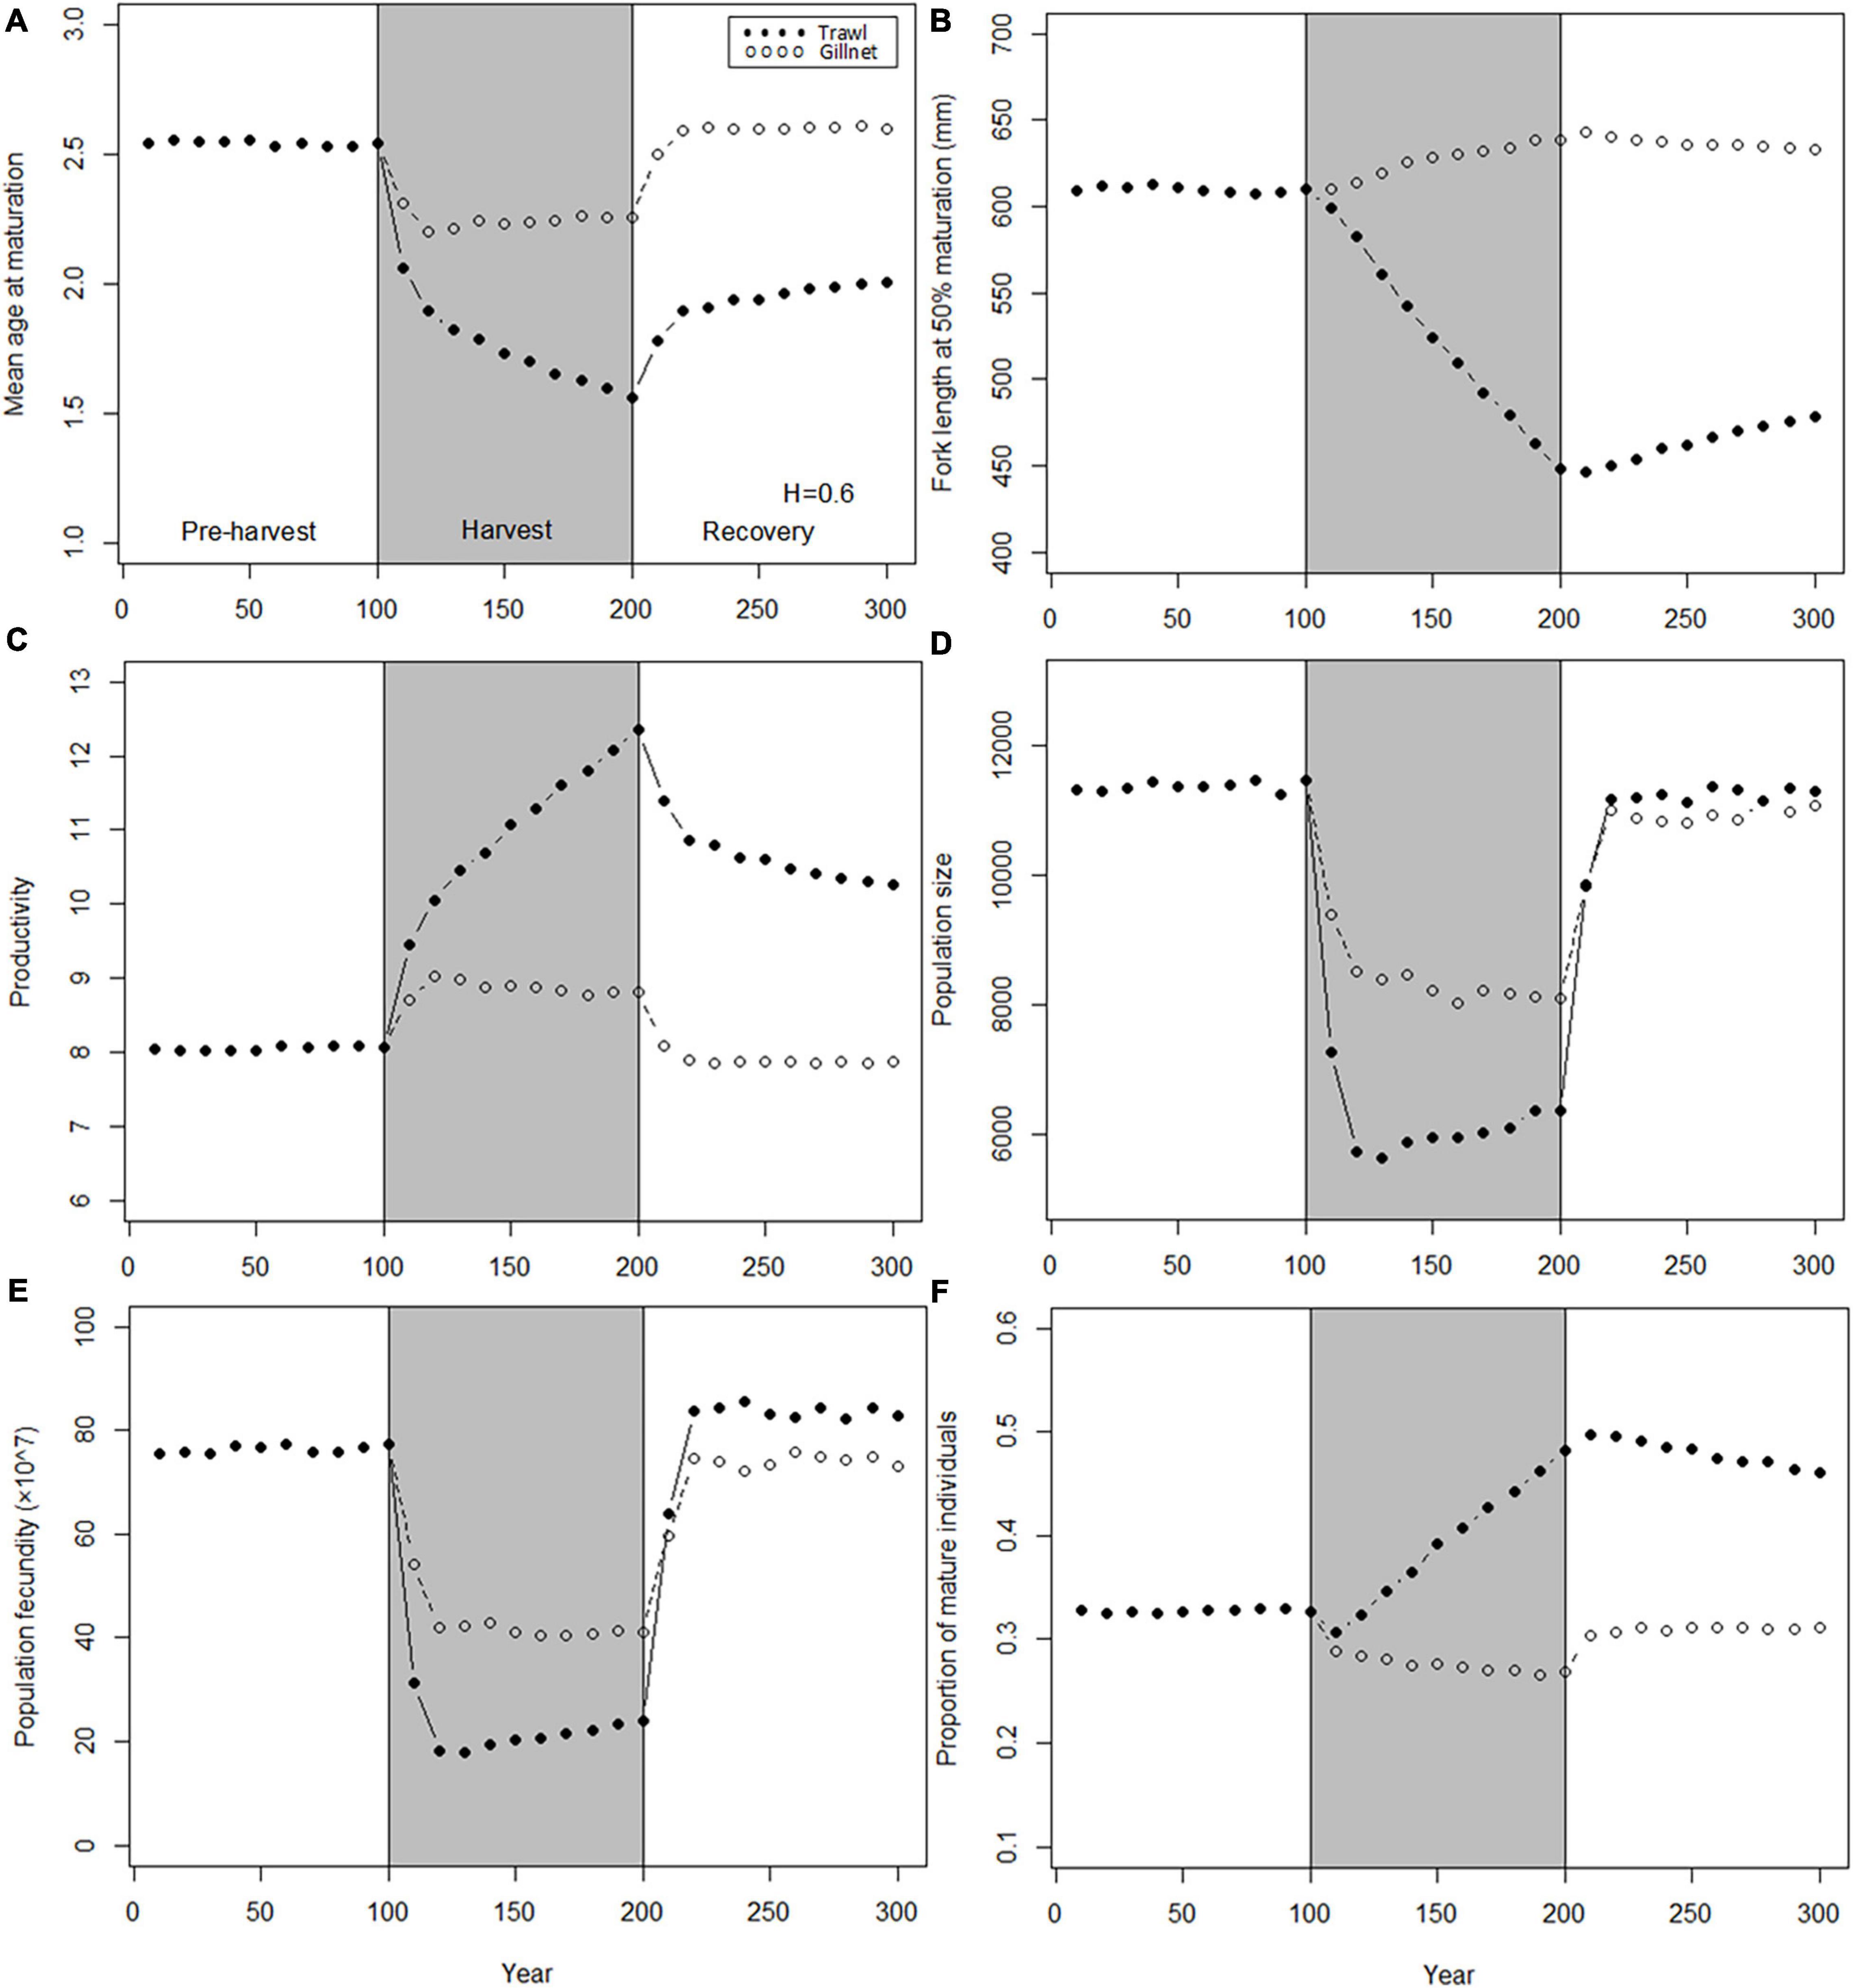
Figure 5. Dynamics of the mean values of population traits before, during and after harvest. Harvest (gray shading) starts at t = 100 years and stop at t = 200 years. Dynamics are shown for two harvest patterns: H = 0.6 year– 1 for trawl (solid points) and H = 0.6 year– 1 for gillnet (hollow points). (A) Mean age at maturation; (B) Fork length at 50% maturation; (C) Population growth rate; (D) Population size; (E) Population fecundity; (F) Proportion of mature individuals.
The large differences in the evolutionary responses between the trawl-harvested and gillnet-harvested populations are probably largely driven by the much lower overall harvest-induced mortality in the gillnet-harvested populations than in the trawl-harvested populations: the former experience near-maximal levels of mortality only over a narrow range of sizes, whereas the latter have a prolonged exposure. To make a fairer comparison between these two fishing gear types, we conduct below comparisons where total catch instead of maximum fishing mortality is standardized.
Differences in Responses to Harvest Between Trawl-Harvested and Gillnet-Harvested Populations Under the Same Biomass Removal
When the same amount of biomass is removed from the population, the evolutionary responses to different fishing gears again diverge (Figure 6), but the difference are less than under the same maximal fishing mortality (Figure 4). While the responses under gillnet harvesting are similar as before (catch standardization was done using gillnet catch as the baseline), responses under trawling are greatly reduced. The response is larger for trawling compared to gillnet fishery only for the PMRN intercept (Figure 6A) and is similar (genetic PMRN intercept, genetic annual ratio of decay in post-maturation growth investment; Figures 6B,D) or less (growth investment at maturation, genetic growth rate; Figures 6C,E). Recovery is modest, except for growth investment at maturation after trawl fishing and for genetic growth rate after gillnet fishing.
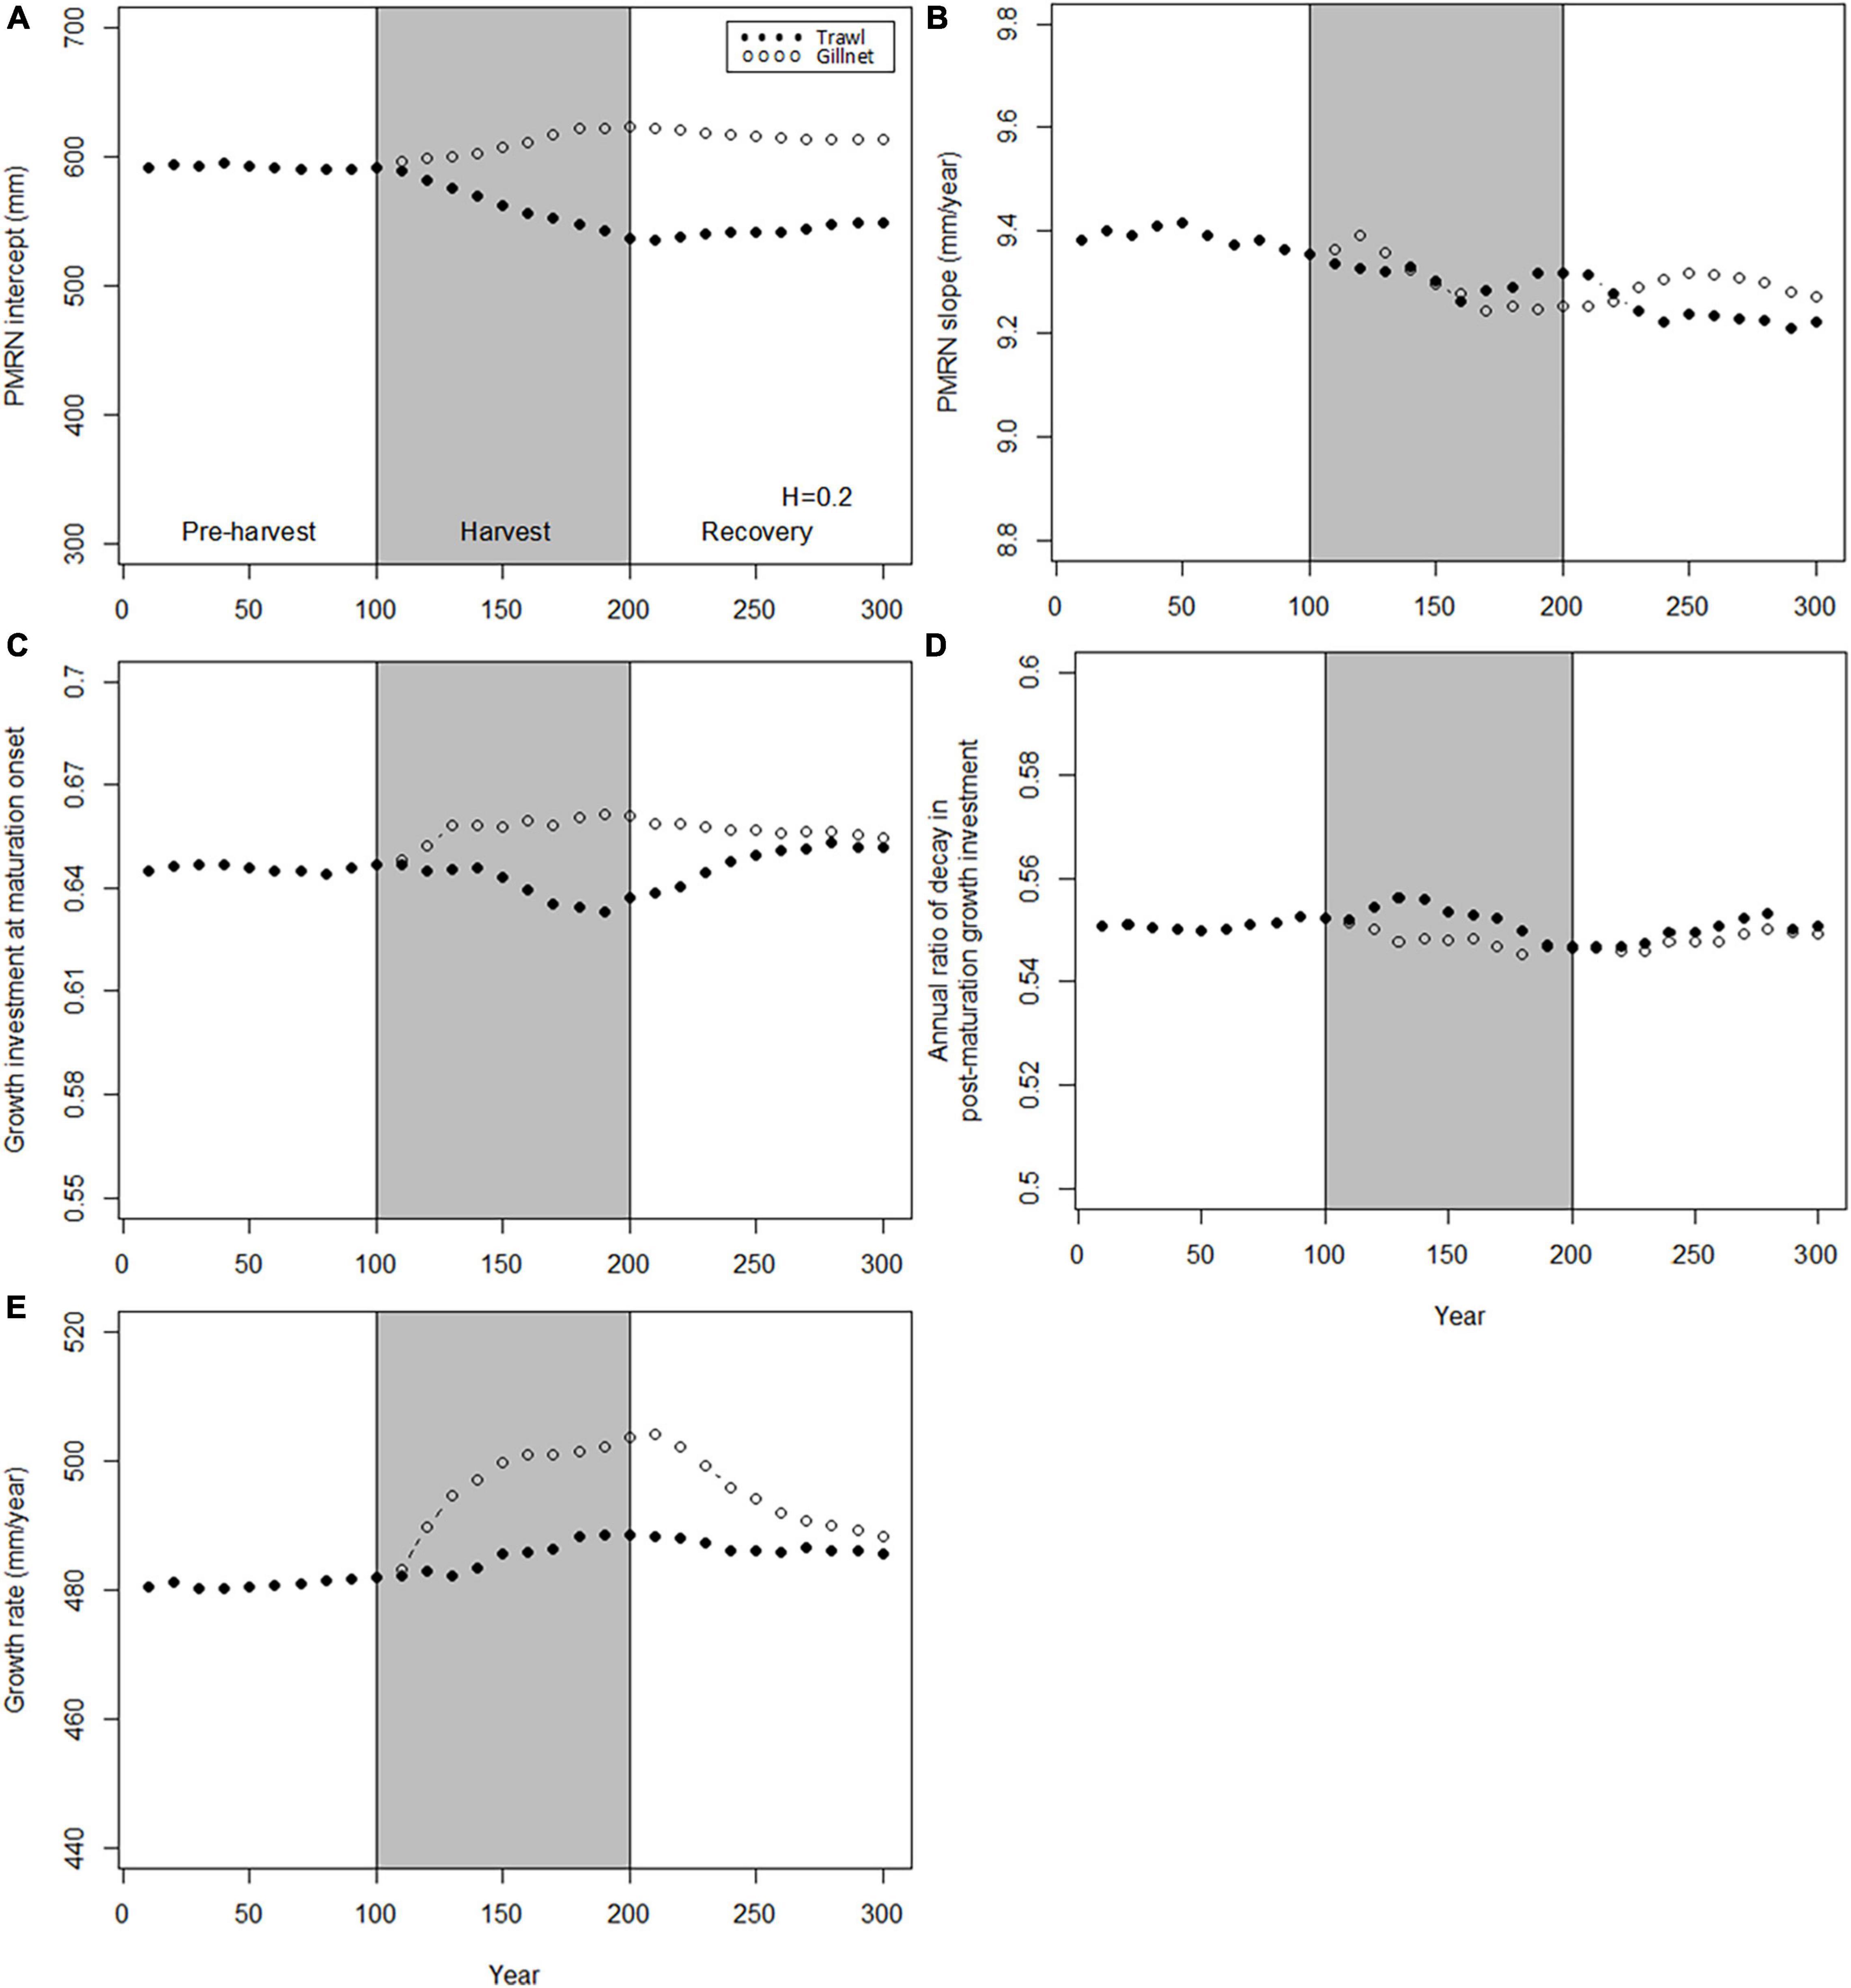
Figure 6. Dynamics of the mean genotypic values of evolving traits before, during and after harvest. Harvest (gray shading) starts at t = 100 years and stop at t = 200 years. Dynamics are shown for two harvest patterns: H = 0.2 year– 1 for trawl (solid points) and H = 0.8 year– 1 for gillnet (hollow points). (A) PMRN intercept y; (B) PMRN slope s; (C) Growth investment α at maturation onset; (D) Annual ratio χ of decay in post-maturation growth investment; (E) Juvenile growth rate g.
The population traits also respond differently to trawl- and gillnet-harvesting (Figure 7). As for the genetic traits, catch-standardization results in a weaker response than maximum fishing mortality standardization under trawl but not under gillnet fishing. Nevertheless, the effect of trawl fishing is larger than that of gillnet fishing for three population traits, mean age at maturation, length at 50% maturity, and productivity (Figures 7A–C). For the other three traits, the response after fishing is larger, but the differences diminish following the 100-year recovery.
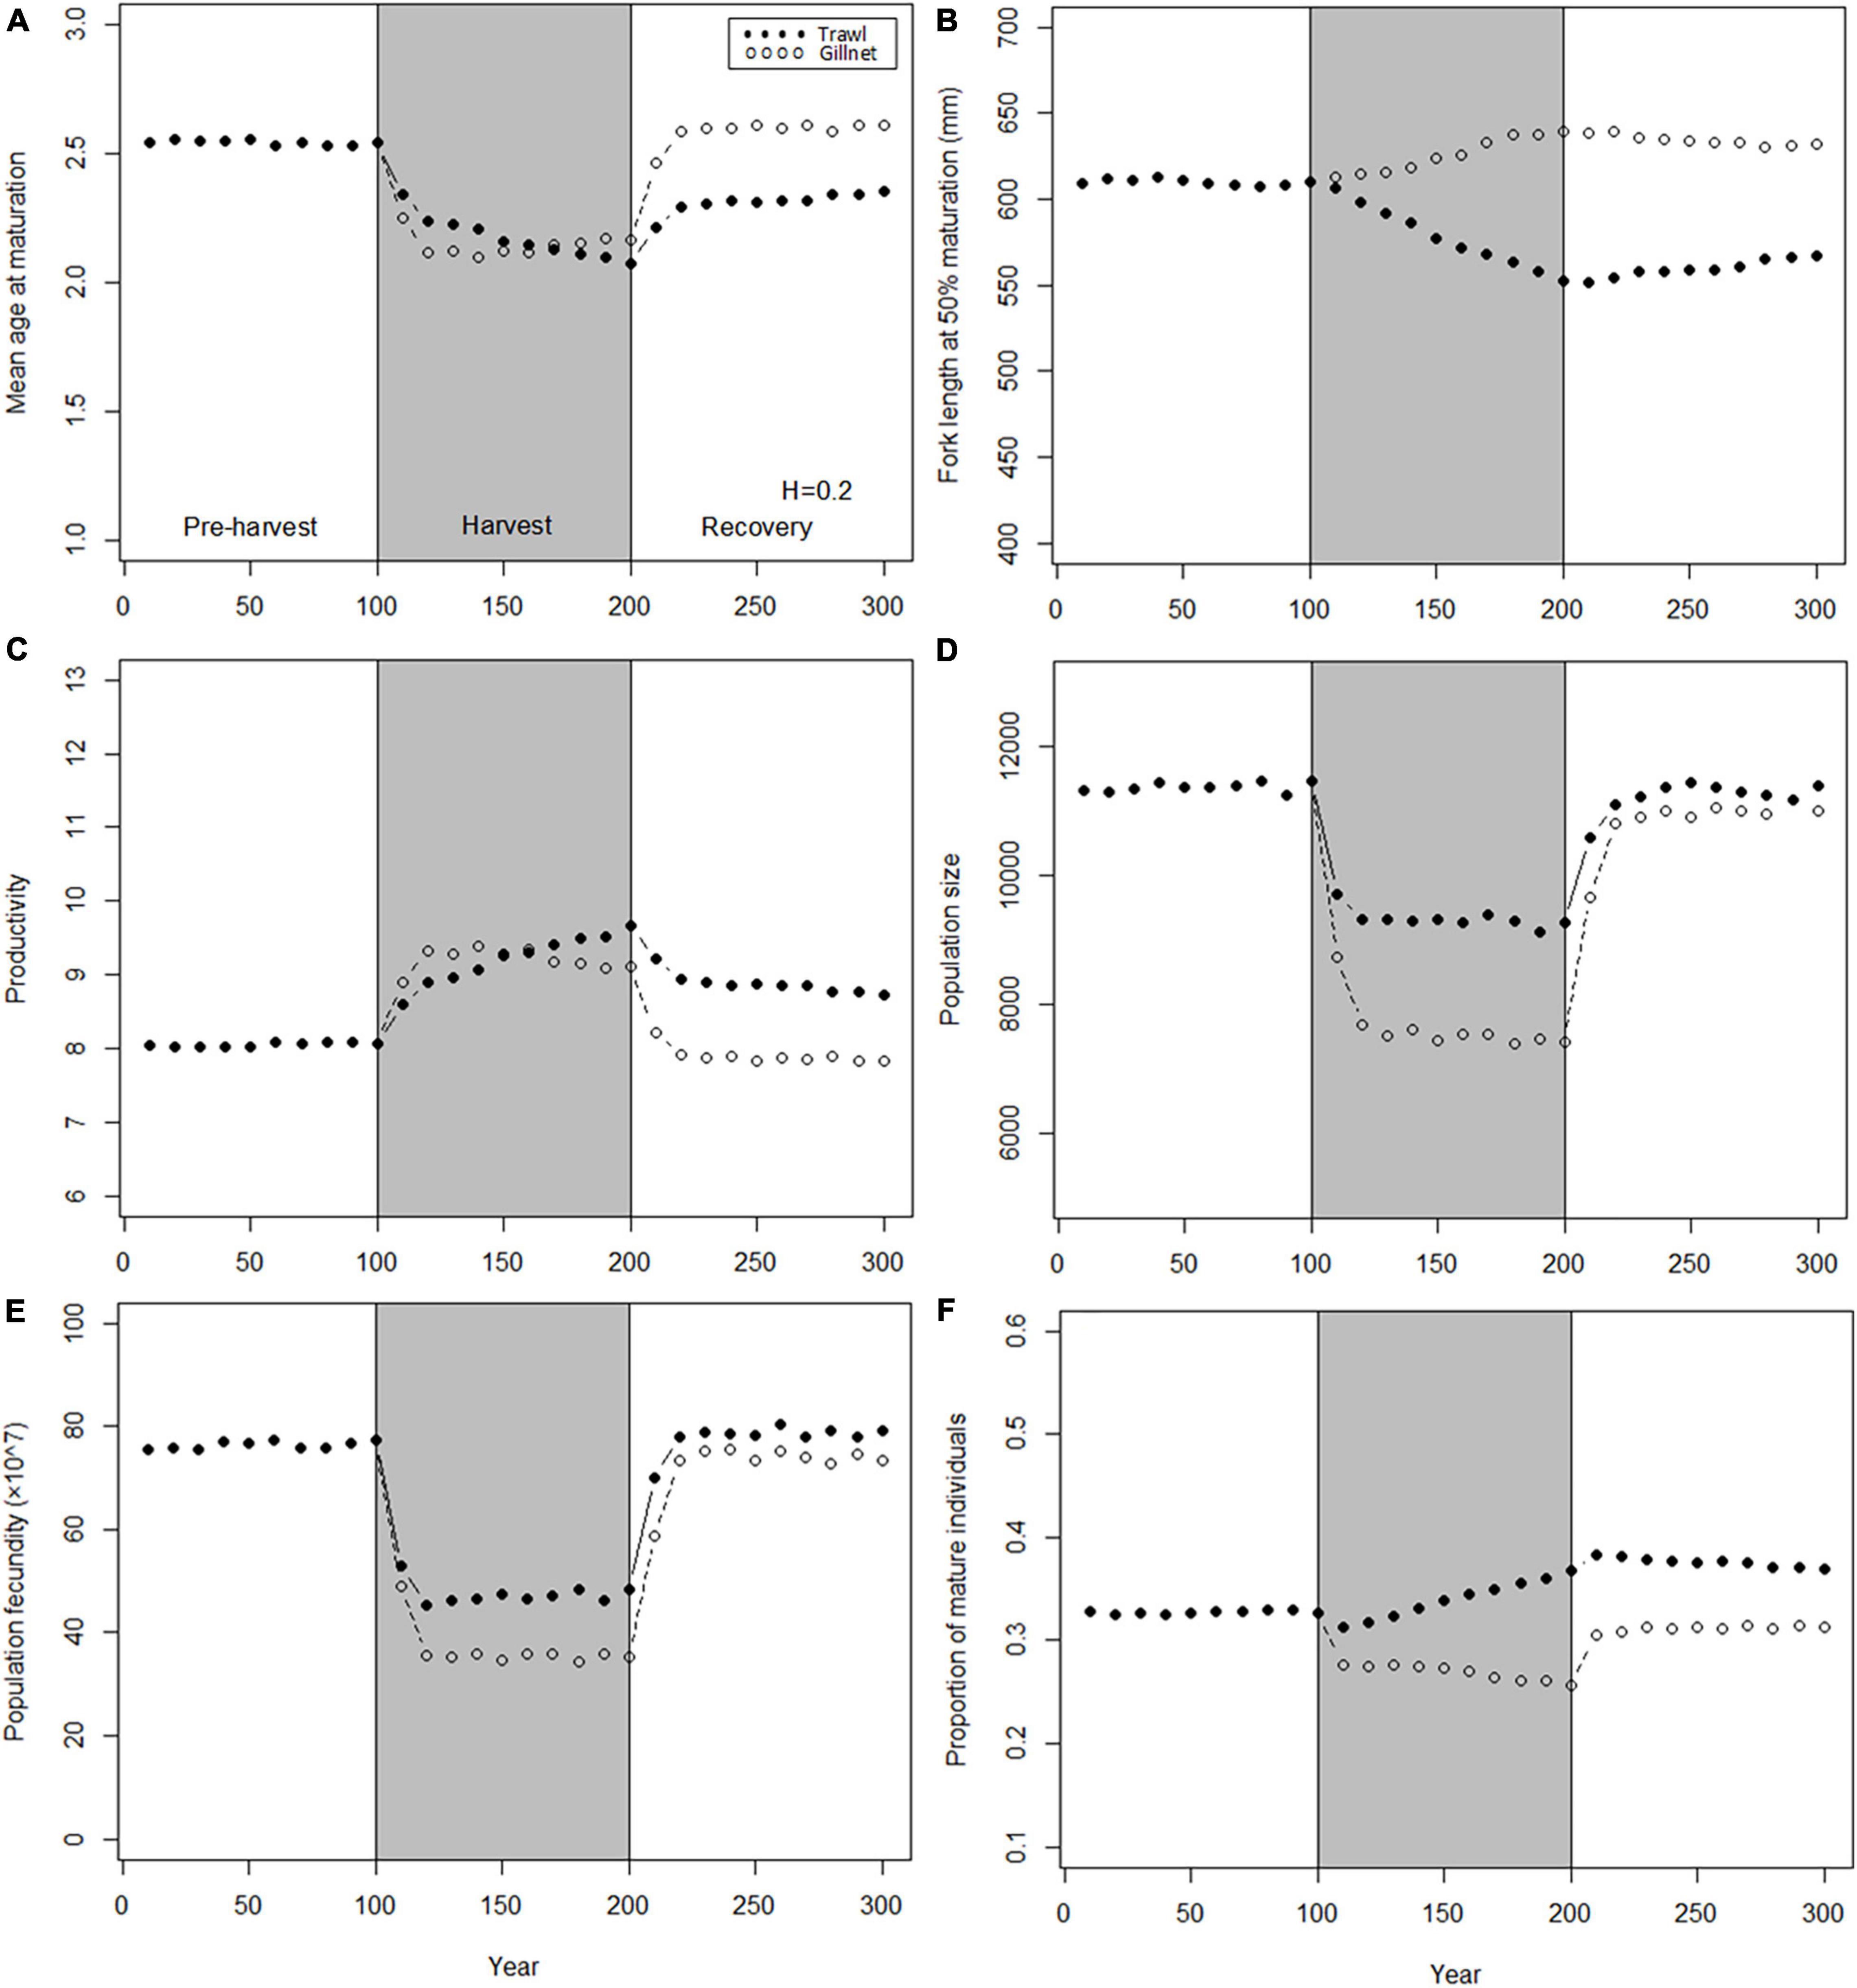
Figure 7. Dynamics of the mean values of population traits before, during and after harvest. Harvest (gray shading) starts at t = 100 years and stop at t = 200 years. Dynamics are shown for two harvest patterns: H = 0.2 year– 1 for trawl (solid points) and H = 0.8 year– 1 for gillnet (hollow points). (A) Mean age at maturation; (B) Fork length at 50% maturation; (C) Population growth rate; (D) Population size; (E) Population fecundity; (F) Proportion of mature individuals.
Importance of the Level of Instantaneous Harvest Rate
When fishing intensity increases, the responses of genetic traits under both trawl- and gillnet-harvesting generally, but not always, increase (Figure 8). However, the large differences between fishing gears and between traits are evident. Among all combinations of gears and traits, the PMRN intercept shows the highest degree of response to trawl-harvesting, declining by almost 40% after 100-year harvest under the instantaneous harvest rate of 1.0 yr–1. In contrast, under the same harvest rate with gillnet-harvesting, the PMRN intercept increases by about 5%. Similar pattern, but of lesser magnitude, is observed for the growth investment at maturation onset and annual ratio of decay in post-maturation growth investment; note, however, that the response for the latter is markedly non-linear. The response in the growth coefficients is qualitatively similar under both trawl- and gillnet-harvesting, although the effect is saturating for the trawl harvesting. The responses of the PMRN slope under trawl- and gillnet-harvesting show no obvious trends as the fishing intensity increases.
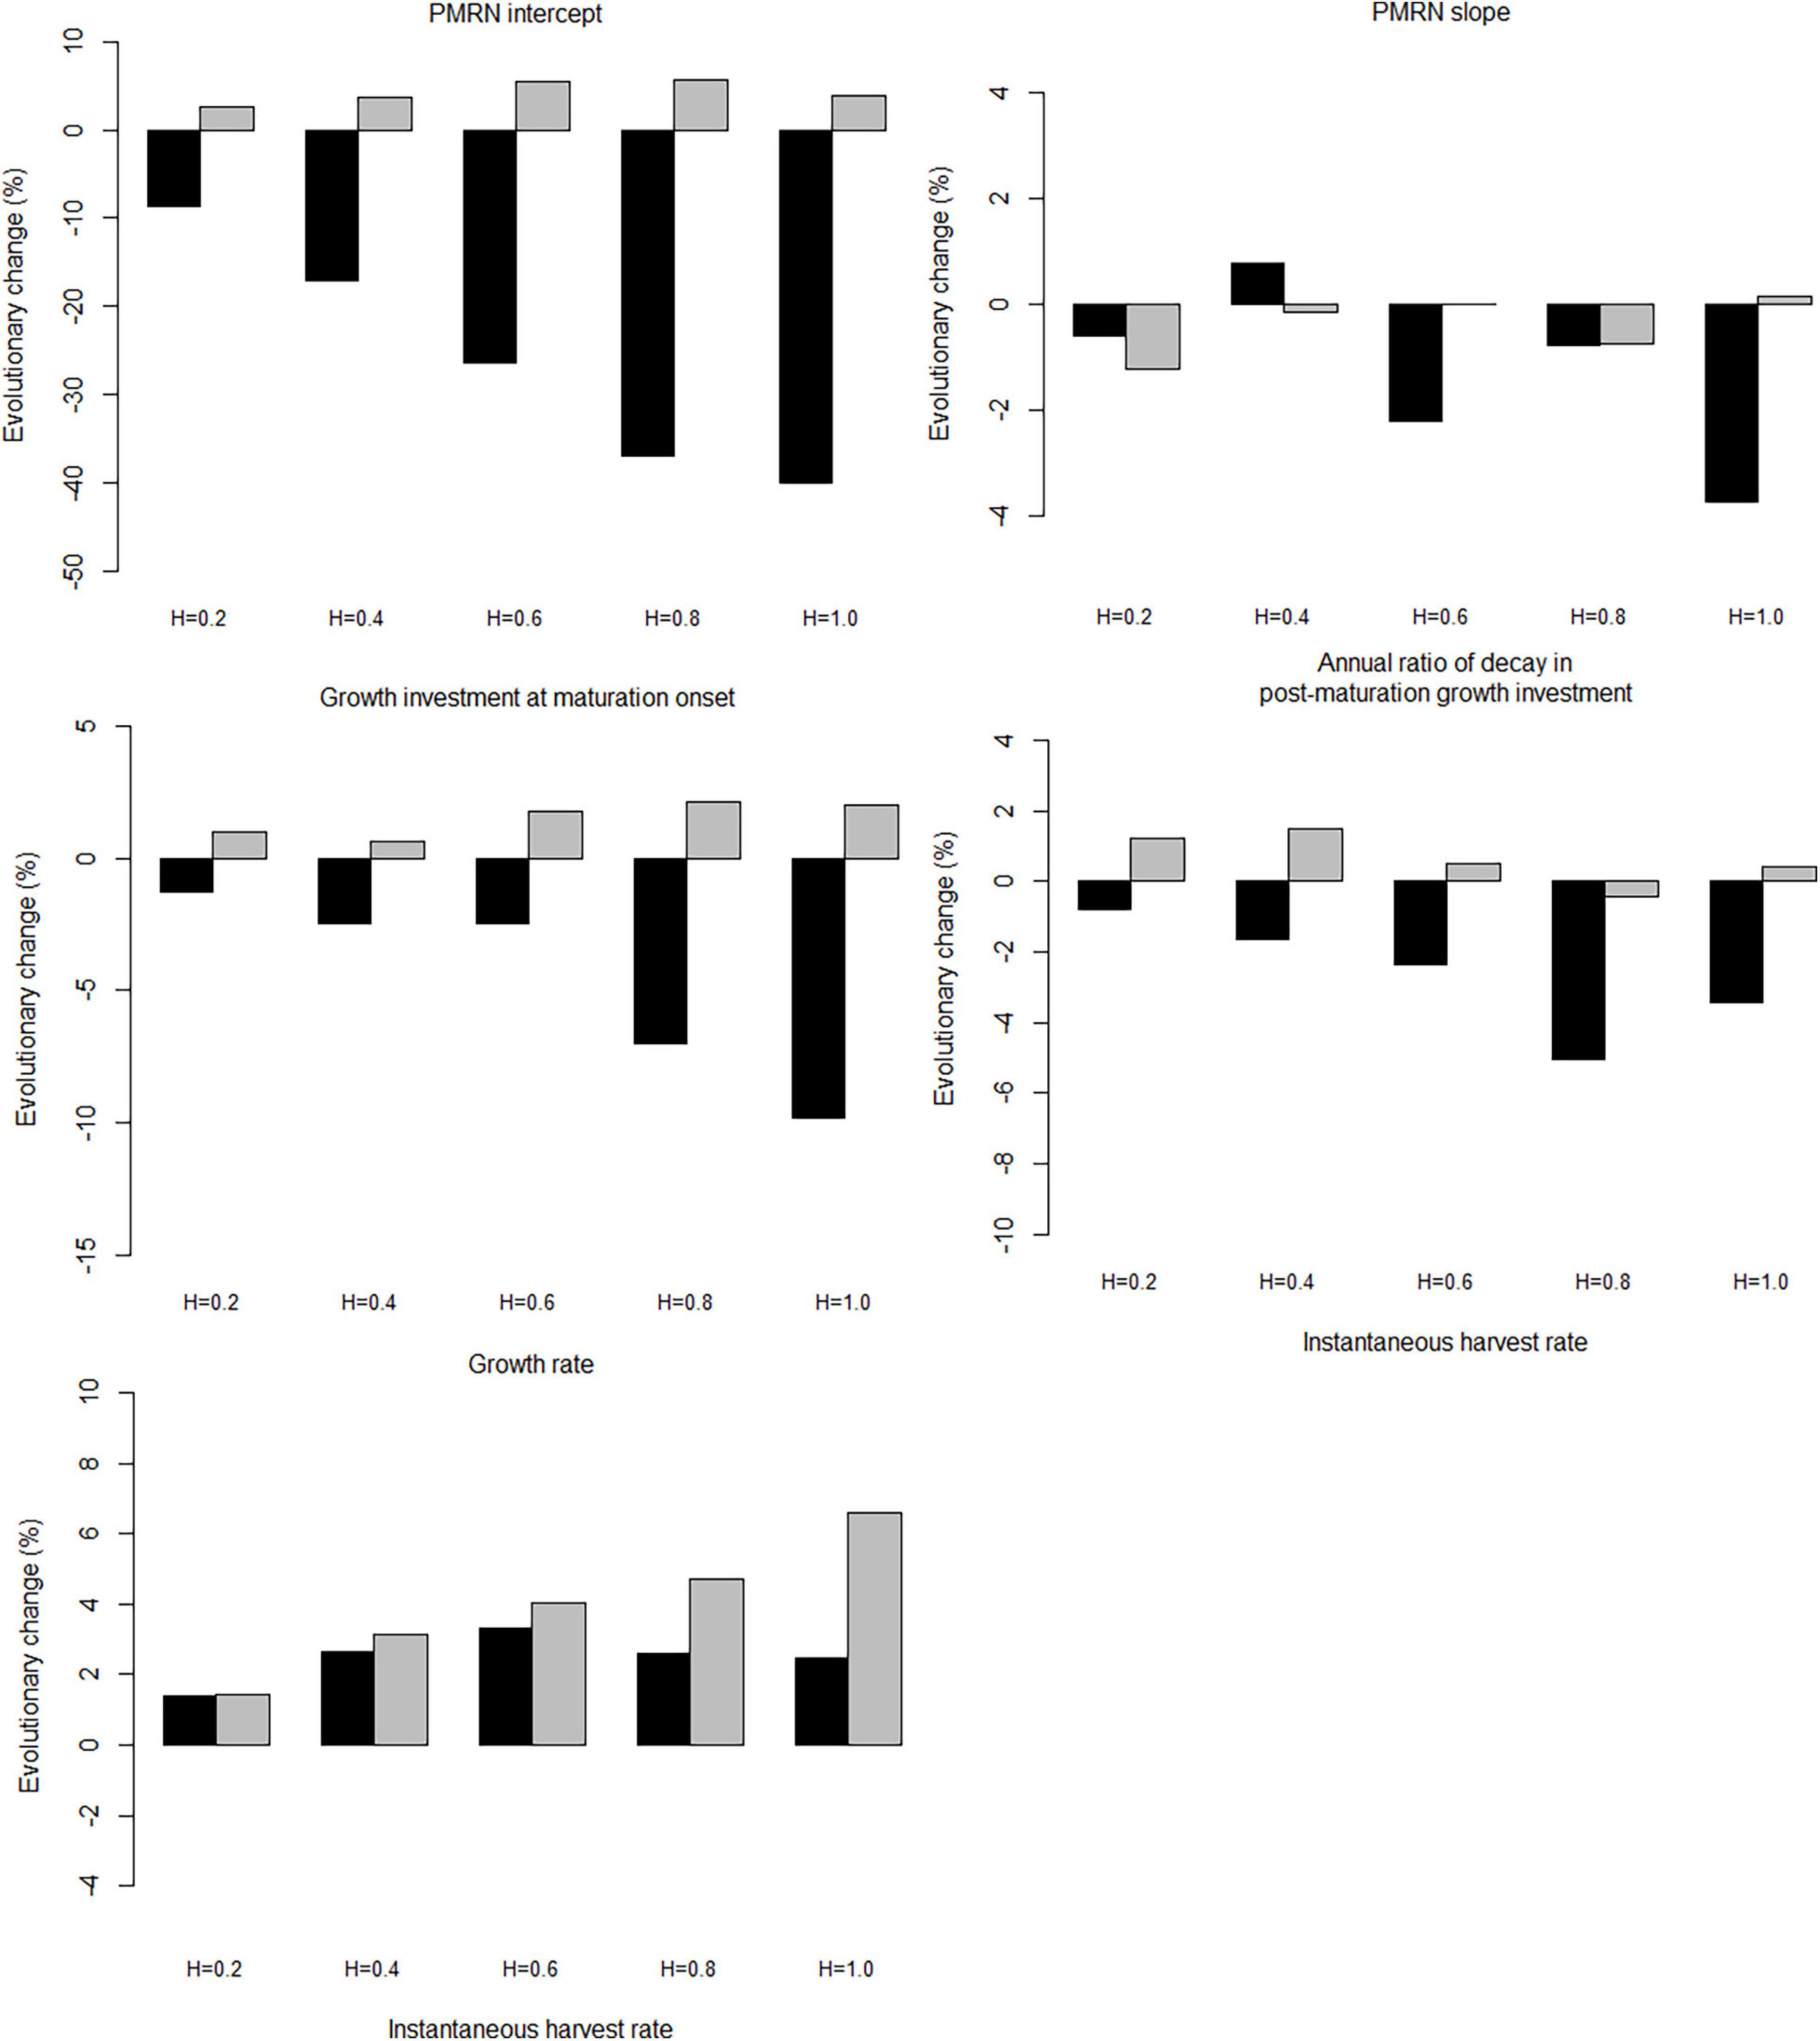
Figure 8. Effect of the maximum instantaneous harvest rate on the mean genotypic value of evolving traits. Panels show the percentage change after 100 years of harvesting, relative to the 100 years before harvesting started. The black bars, trawl-harvested scenarios; the gray bars, gillnet-harvested scenarios.
Compared with genetic traits, the population traits show much stronger responses to increasing harvest intensity (Figure 9). The absolute magnitude of the responses is always larger under trawl-harvesting than under gillnet-harvesting. Moreover, the responses are qualitatively similar between trawl- and gillnet harvesting for all but one population trait, fork length at 50% maturation, which shows responses of opposing signs. With the remarkable exception of productivity for both gears and fork length at 50% maturation for gillnet harvesting, the responses are generally negative.
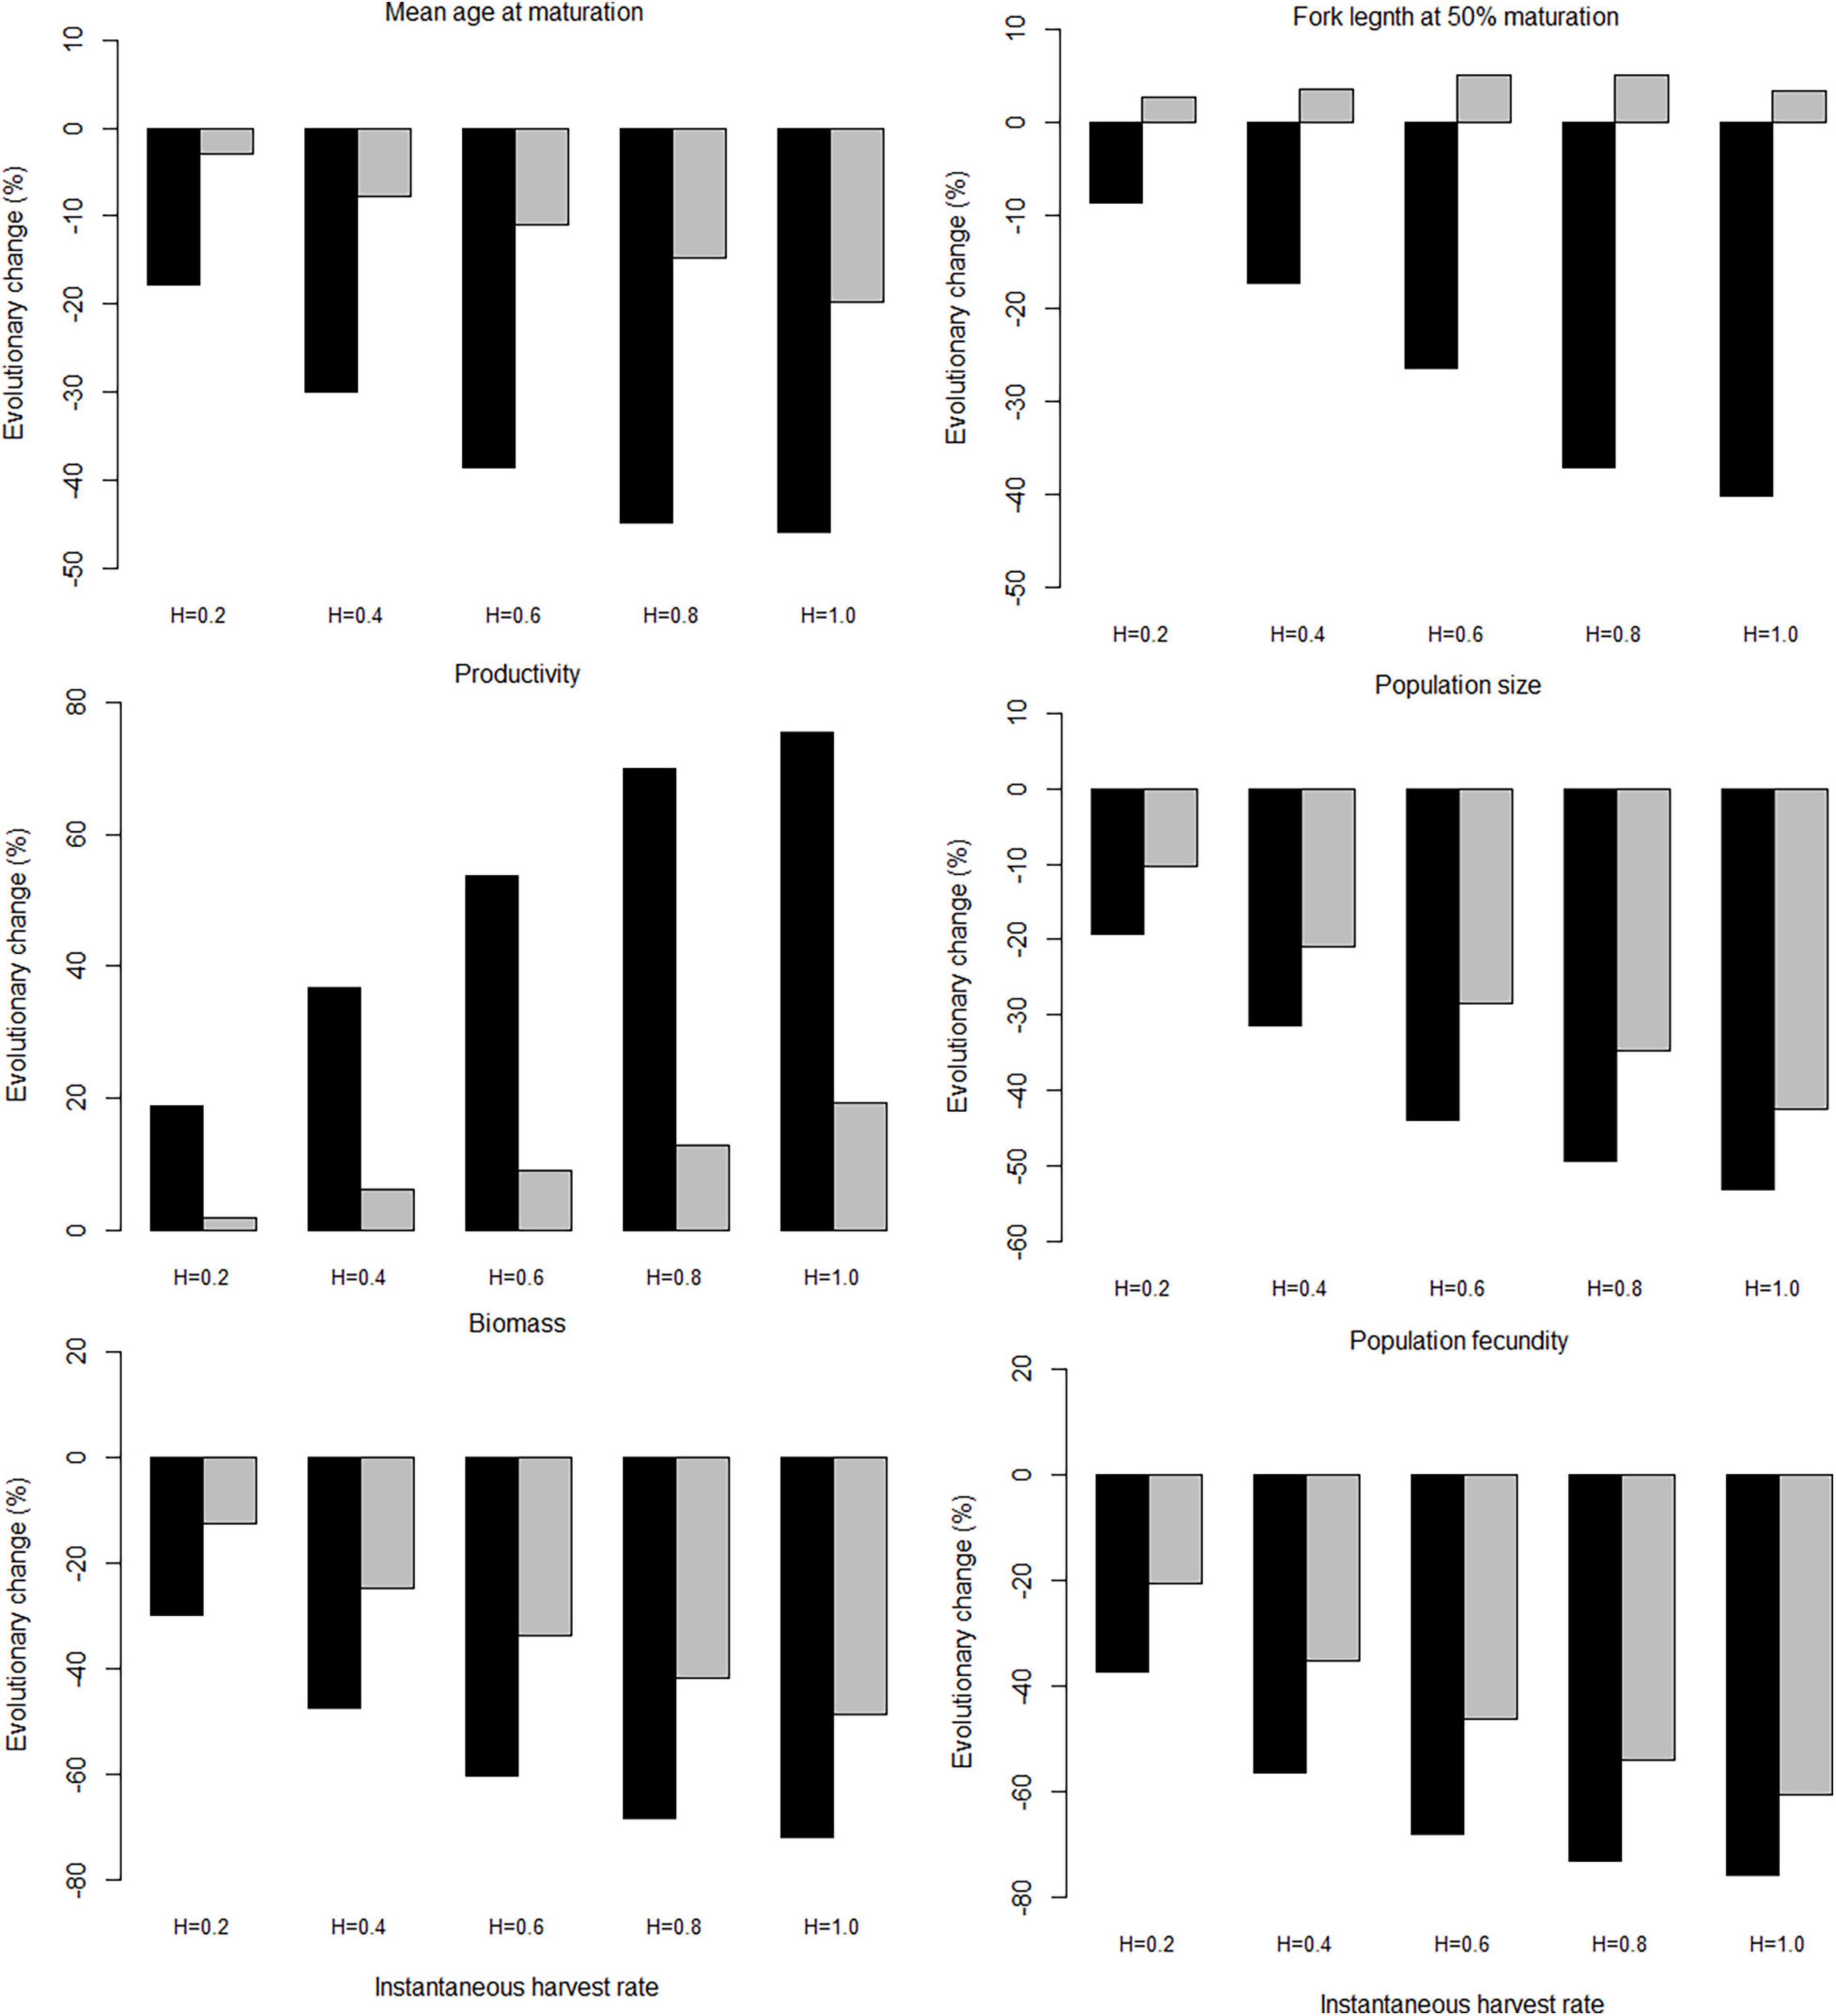
Figure 9. Effect of the maximum instantaneous harvest rate on the mean value of population traits. Panels show the percentage change after 100 years of harvesting, relative to the 100 years before harvesting started. The black bars, trawl-harvested scenarios; the gray bars, gillnet-harvested scenarios.
Discussion
Dynamics of Fisheries-Induced Population Declines and Population Recovery Under Selective Harvest
Prior to exploitation, the population will approach a demographic and evolutionary equilibrium with stable population traits. When harvest begins, mature and large individuals are removed from the population, resulting in rapid demographic changes and subsequent changes in genetic traits that take place at slower, generational time scale. Changes in population-level characteristics reflect changes at both time scales.
When fishing is ceased, individuals that would have previously been harvested survive and influence population dynamics. This is observed as a sharp increase in biomass at the beginning of moratorium, but also as rapid changes in population traits. These effects result from the restoration of an age and size structure in which previously fished size groups are dying off at a slower rate. This demographic restoration is mainly observed in terms of very rapid initial recoveries of most of the population characteristics shown in Figures 3, 5, 7. The recovery of genetic traits occurs at a much slower and more constant rate (Figures 4, 6). As the total biomass increases, also density-dependent effects begin to alter the phenotypic composition of the population by affecting individual rates of growth and reproduction until the population dynamic reaches a new demographic equilibrium.
Studies have shown that FIE is not always negative for exploited population (Christie et al., 2018; Ahti et al., 2020). Especially for the populations under high fishing mortality, adaptation may allow population biomass to increase while fishing still continues at the same, high intensity (Figure 2E). A more extreme scenario is that of an evolutionary rescue, where a population that does not adapt (or is not adapting fast enough) would be driven to extinction, but under FIE, the population survives high fishing intensity owing to the survival of favorable genotypes (Jusufovski and Kuparinen, 2020; Kuparinen and Uusi-Heikkilä, 2020). Non-evolutionary populations collapse under high-intensity fishing pressure, while evolutionary populations can still maintain a certain biomass level under high-intensity fishing pressure (Kaitala and Getz, 1995; Heino, 1998; Dunlop et al., 2015). In this study, when the instantaneous harvest rate H = 1.0, the biomass of non-evolutionary population is significantly lower than that of evolutionary population, and the difference between the biomass will gradually increase with the increasing fishing pressure (Figures 2, 3). At the beginning of moratorium, the biomass and population characteristics of the evolutionary population gradually decrease in the recovery phase, and cannot return to pre-harvest levels within 100 years, especially with trawl fishing. This is attributable to the earlier maturation and smaller size at age, despite fecundity and population size return back to pre-harvest levels. This difference between evolutionary and non-evolutionary population change process could be used as a reference to judge whether the population evolves under the fishing effects.
Selection can be manipulated to help populations, and is a demographic process that can alter birth and death rates, and so it can have an immediate influence on population dynamics (Boukal et al., 2008; Hendry et al., 2011). The exploited population is directly affected by harvest selection, rather than indirectly affected through human-induced environment. Current studies have concluded that both phenotypic plasticity and genetic changes lead to the phenotypic changes observed in the population (Dieckmann and Heino, 2007; Crispo et al., 2010). When exploitation is reduced, the population may initially recover fast (Kaitala and Getz, 1995; Heino, 1998; Enberg et al., 2009). This beneficial aspect of FIE is not guaranteed though, and under 70% harvest rate adaptive evolution can lead to yellow perch (Perca flavescens) extinction (Dunlop et al., 2015).
Differences in Evolution Under Size-Selective Trawl- and Gillnet-Harvesting
Fishing mortality levels and gear types influence the size structure of fish stocks and the evolution of life-history traits over time. Evolutionary change occurs even if fishing mortality is low, but the magnitude of response markedly differs between trawl and gillnet selectivity (Figures 8, 9), which implies that a suitable management strategy based on gear selectivity could reduce the effect of FIE. The different response of genetic traits to fishing depends on which size group is preserved to reproduce next generation (Roff, 1992; Heino and Kaitala, 1999; Lester et al., 2004).
The exploited population will show different evolutionary trends to different fishing gears over decades of fishing. Under the gillnet-harvesting, individuals that manage to pass the size range vulnerable to fishing have high survival and can grow big and fecund, eventually producing high numbers of offspring that carry their parents’ genetic traits. But with trawl-harvesting removing large and fecund individuals, the offspring are mainly reproduced by small-sized mature individuals.
Under trawl-harvesting, fishing induces decreased PMRN, larger genetic growth capacity, less growth investment at maturation, and slower rate of decay in post-maturation growth investment (Figure 4). The changes in these genetic traits cause the population to mature earlier, grow faster, and invest more energy into reproduction, which is consistent with the observations in Japanese Spanish mackerel fishery since the 1980s. But when the population is harvested by gillnet, PMRN intercept, growth investment at maturation, and genetic growth capacity show slightly increasing trend (Figures 4A,C,D), which makes the population to mature later and to grow faster by investing more energy into somatic growth. Even when the same amount of biomass is removed from the population, the population responds differently to trawl- and gillnet-harvesting (Figures 6, 7). The remaining individuals influence the recovery process of genetic traits and population traits. Compared with trawl-harvested population, the population traits under gillnet-harvesting recover faster to pre-harvest levels (Figure 7).
Furthermore, genomic analysis can complement conclusions from evolutionary modeling. The whole-genome sequence analysis of Atlantic cod (Gadus morhua) suggest that phenotypic change in these populations is not constrained by irreversible loss of genomic variation, which have implications for both the model and experimental research of fisheries-induced evolution (Pinsky et al., 2021). Broadly speaking, our results agree with earlier results by Jørgensen et al. (2009) and Mollet et al. (2016) that while no exploitation is evolutionarily neutral, dome-shaped exploitation patterns can offer both high long-term yields and low evolutionary impact. The model by Mollet et al. (2016), albeit for a demersal fish species (North Sea plaice), is broadly similar to ours, involving similar evolving traits (apart from having a more rigid scheme for reproductive investment) and modeling approach (individual-based eco-genetic modeling). The model by Jørgensen et al. (2009) is also for a demersal fish (Northeast Arctic cod), but one with relatively rare distinction between spawner and feeder fisheries (only mature fish are caught in the former, while both immature and mature are caught in the latter). The modeling framework is also different, involving fully flexible evolution of energy allocation between growth and reproduction but no evolution of genetic growth capacity. Note that the evolution of growth is an important part of the evolutionary response to fishing in both our model and in that by Mollet et al. (2016). The model is an optimization model that can predict long-term outcomes but no transient behaviors. Nevertheless, the model runs that are most comparable to ours, ones without spawner fishery, suggest that dome-shaped selectivity has better chances of conserving the population’s original life history than sigmoid selectivity.
Management Implications for Japanese Spanish Mackerel in Response to Evolution
An important commercial fish species in the China Seas, the annual catch of Japanese Spanish mackerel is more than 0.1 million tons (Sun, 2009). The current dominant management measures include minimum landing size limit, minimum mesh size of fishing gear, total allowable catch, “Double-control” system (the control of both the total number of marine engine-powered fishing vessels and their total engine power), and summer moratorium in China. The summer moratorium aims to protect the main spawning period of marine fish in the China Seas and stops fishing for about 4 months each year. Controlling the mesh size of fishing gear can help protect small-sized individuals such that they survive to grow and reproduce the next generation.
The life-history traits of Japanese Spanish mackerel have changed since the 1980s, including changes in age at maturation, size at age, and spawning season. As our model has shown, adaptive evolution is expected to occur under a long-term harvest, resulting in the loss of genotypic diversity and low rate of recovery for genetic traits. Therefore, there is a need to incorporate management measures that would minimize unwanted evolutionary impacts of fisheries. Our study focusses on the individual eco-genetic model of Japanese Spanish mackerel, and does not consider the processes of species interaction, and predation. In order to explore the FIE of multiple species, primary productivity and species interaction should be considered in future modeling studies. In addition, we set different instantaneous mortality to harvest, this determines the changes of harvest, which is consistent with biomass. The sensitivity analysis is performed using different mesh sizes, and the derivation of the selectivity curves of Japanese Spanish mackerel depend on the actual studies on Japanese Spanish mackerel (You et al., 2014; Supplementary Tables 4, 5). The impact of fishing selectivity under varying mesh sizes on FIE would be considered in the further work.
The rate of evolution in an exploited population depends on the size groups that are removed by fishing, which are ultimately determined by the size selectivity of gears and the intensity of harvest (Therkildsen et al., 2019; Crespel et al., 2021). In order to control the negative effects of FIE, low fishing mortalities have been suggested as a general remedy (Heino, 1998; Law, 2000; Laugen et al., 2014). Our results agree with this prediction (Figures 8, 9). Meanwhile, our results also suggest that changing converting exploitation pattern from sigmoid to bell-shaped selectivity, by allowing large and fecund individuals to survive and reproduce, could be an alternative avenue to reduce the evolutionary responses to fishing. Japanese Spanish mackerel have experienced heavy exploitation and showed an obvious evolutionary shift. Therefore, limiting the exploitation intensity and controlling fishing gear could weaken or even reverse the evolutionary trend. In particular, harvesting the population with gillnets could reduce the evolutionary response to fishing and promote a more sustainable utilization of fisheries resources. When gillnet harvesting is used to extract similar yields as trawling, it appears less evolutionarily benign than comparisons using similar maximum exploitation rates. Moreover, evolutionary and plastic responses to harvest are affected by more complex processes than those considered in any single-species model, such as the one considered here. Fishing affects the dynamics of target populations, changes interspecific processes, such as predation-prey interactions, and alters natural mortality rates (Law, 2000; Heino and Godø, 2002; Pope et al., 2021). So, an ecosystem approach is required to explore this kind of complex dynamics (Blanchard et al., 2005; Jørgensen and Fiksen, 2006).
Data Availability Statement
The original contributions presented in the study are included in the article/Supplementary Material, further inquiries can be directed to the corresponding author/s.
Author Contributions
PS designed and conducted the model structure. YS and RS conducted the model building and data analysis. PS, YT, and MH wrote and edited the manuscript, while all other authors have reviewed and revised it. All authors have given final approval of the manuscript.
Funding
This work was supported by the National Natural Science Foundation of China (grant numbers: 41930534, 32073027, and 41861134037) and The Research Council of Norway (grant number: 288037).
Conflict of Interest
The authors declare that the research was conducted in the absence of any commercial or financial relationships that could be construed as a potential conflict of interest.
Publisher’s Note
All claims expressed in this article are solely those of the authors and do not necessarily represent those of their affiliated organizations, or those of the publisher, the editors and the reviewers. Any product that may be evaluated in this article, or claim that may be made by its manufacturer, is not guaranteed or endorsed by the publisher.
Supplementary Material
The Supplementary Material for this article can be found online at: https://www.frontiersin.org/articles/10.3389/fevo.2022.844693/full#supplementary-material
References
Abrams, P. A. (1991). Life history and the relationship between food availability and foraging effort. Ecology 72, 1242–1252. doi: 10.2307/1941098
Ahti, P. A., Kuparinen, A., and Uusi-Heikkilä, S. (2020). Size does matter — the eco-evolutionary effects of changing body size in fish. Environ. Rev. 28, 311–324. doi: 10.1139/er-2019-0076
Andersen, B. S., Ulrich, C., Eigaard, O. R., and Christensen, A. S. (2012). Short-term choice behaviour in a mixed fishery: investigating métier selection in the Danish gillnet fishery. ICES J. Mar. Sci. 69, 131–143. doi: 10.1093/icesjms/fsr181
Andersen, K. H., and Brander, K. (2009). Expected rate of fisheries-induced evolution is slow. Proc. Natl. Acad. Sci. U.S.A. 106, 11657–11660. doi: 10.1073/pnas.0901690106
Baskett, M. L., Levin, S. A., Gaines, S. D., and Dushoff, J. (2005). Marine reserve design and the evolution of size at maturation in harvested fish. Ecol. Appl. 15, 882–902. doi: 10.1890/04-0723
Beverton, R. J. H., and Holt, S. J. (1957). On the Dynamics of Exploited Fish Populations. London: Ministry of Agriculture, Fisheries and Food.
Blanchard, J. L., Nicholas, K. D., Simon, J., James, R. E., John, K. P., Alex, T., et al. (2005). Do climate and fishing influence size-based indicators of Celtic Sea fish community structure? ICES J. Mar. Sci. 62, 405–411. doi: 10.1016/j.icesjms.2005.01.006
Boukal, D. S., Dunlop, E. S., Heino, M., and Dieckmann, U. (2008). Fisheries-Induced Evolution of Body Size and Other Life History Traits: the Impact of Gear Selectivity. ICES CM 2008/F:07. ICES.
Carlson, S. M., and Seamons, T. R. (2008). A review of quantitative genetic components of fitness in salmonids: implications for adaptation to future change. Evol. Appl. 1, 222–238. doi: 10.1111/j.1752-4571.2008.00025.x
Chen, N., Zhang, C. L., Sun, M., Xu, Y., Ren, Y. P., and Chen, Y. (2018). The impact of natural mortality variations on the performance of management procedures for Spanish mackerel (Scomberomorus niphonius) in the Yellow Sea, China. Acta Oceanol. Sin. 37, 21–30. doi: 10.1007/s13131-018-1234-0
Christie, M. R., McNickle, G. G., French, R. A., and Blouin, M. S. (2018). Life history variation is maintained by fitness trade-offs and negative frequency-dependent selection. Proc. Natl. Acad. Sci. U.S.A. 115, 4441–4446. doi: 10.1073/pnas.1801779115
Conover, D. O., and Baumann, H. (2009). The role of experiments in understanding fishery-induced evolution. Evol. Appl. 2, 276–290. doi: 10.1111/j.1752-4571.2009.00079.x
Conover, D. O., and Munch, S. B. (2002). Sustaining fisheries yields over evolutionary time scales. Science 297, 94–96. doi: 10.1126/science.1074085
Crespel, A., Schneider, K., Miller, T., Rácz, A., Jacobs, A., Lindström, J., et al. (2021). Genomic basis of fishing-associated selection varies with population density. Proc. Natl. Acad. Sci. U.S.A. 118:e2020833118. doi: 10.1073/pnas.2020833118
Crispo, E., DiBattista, J. D., Correa, C., Thibert-Plante, X., McKellar, A. E., Schwartz, A. K., et al. (2010). The evolution of phenotypic plasticity in response to anthropogenic disturbance. Evol. Ecol. Res. 12, 47–66. doi: 10.1007/s10682-009-9304-6
Díaz Pauli, B., and Heino, M. (2014). What can selection experiments teach us about fisheries-induced evolution? Biol. J. Linn. Soc. 111, 485–503. doi: 10.1111/bij.12241
Dieckmann, U., and Heino, M. (2007). Probabilistic maturation reaction norms: their history, strengths, and limitations. Mar. Ecol. Prog. Ser. 335, 253–269. doi: 10.3354/meps335253
Dunlop, E. S., Baskett, M. L., Heino, M., and Dieckmann, U. (2009a). Propensity of marine reserves to reduce the evolutionary effects of fishing in a migratory species. Evol. Appl. 2, 371–393. doi: 10.1111/j.1752-4571.2009.00089.x
Dunlop, E. S., Heino, M., and Dieckmann, U. (2009b). Eco-genetic modeling of contemporary life-history evolution. Ecol. Appl. 19, 1815–1834. doi: 10.1890/08-1404.1
Dunlop, E. S., Eikeset, A. M., and Stenseth, C. S. (2015). From genes to populations: how fisheries-induced evolution alters stock productivity. Ecol. Appl. 25, 1860–1868. doi: 10.1890/14-1862.1
Edley, T., and Law, R. (1988). Evolution of life histories and yields in experimental populations of Daphnia magna. Biol. J. Linn. Soc. 34, 309–326. doi: 10.1111/j.1095-8312.1988.tb01966.x
Eikeset, A. M., Richter, A. P., Dunlop, E. S., Dieckmann, U., and Stenseth, N. C. (2013). Economic repercussions of fisheries-induced evolution. Proc. Natl. Acad. Sci. U.S.A. 110, 12259–12264. doi: 10.1073/pnas.1212593110
Enberg, K., Jørgensen, C., Dunlop, E. S., Heino, M., and Dieckmann, U. (2009). Implications of fisheries-induced evolution for stock rebuilding and recovery. Ecol. Appl. 2, 394–414. doi: 10.1111/j.1752-4571.2009.00077.x
Ernande, B., Dieckmann, U., and Heino, M. (2004). Adaptive changes in harvested populations: plasticity and evolution of age and size at maturation. Proc. R. Soc. B Biol. Sci. 271, 415–423. doi: 10.1098/rspb.2003.2519
Gjedrem, T. (1983). Genetic variation in quantitative traits and selective breeding in fish and shellfish. Aquaculture 33, 51–72. doi: 10.1016/0044-8486(83)90386-1
Grimm, V., Revilla, E., Berger, U., Jeltsch, F., Mooij, W. M., Railsback, S. F., et al. (2005). Pattern-oriented modeling of agent-based complex systems: lessons from ecology. Science 310, 987–991. doi: 10.1126/science.1116681
Hamley, J. M. (1975). Review of gillnet selectivity. J. Fish. Res. Board Canada 32, 1943–1969. doi: 10.1139/f75-233
Heino, M. (1998). Management of evolving fish stocks. Can. J. Fish. Aquat. Sci. 55, 1971–1982. doi: 10.1139/f98-089
Heino, M., Baulier, L., Boukal, D. S., Ernande, B., Johnston, F. D., Mollet, F. M., et al. (2013). Can fisheries-induced evolution shift reference points for fisheries management? ICES J. Mar. Sci. 70, 707–721. doi: 10.1093/icesjms/fst077
Heino, M., Díaz Pauli, B., and Dieckmann, U. (2015). Fisheries-induced evolution. Annu. Rev. Ecol. Evol. Syst. 46, 461–480.
Heino, M., and Dieckmann, U. (2008). Detecting fisheries-induced life-history evolution: an overview of the reaction norm approach. Bull. Mar. Sci. 83, 69–93. doi: 10.1590/S1679-87592008000300009
Heino, M., Dieckmann, U., and Godø, O. R. (2002). Measuring probabilistic reaction norms for age and size at maturation. Evolution 56, 669–678. doi: 10.1111/j.0014-3820.2002.tb01378.x
Heino, M., and Godø, O. R. (2002). Fisheries-induced selection pressures in the context of sustainable fisheries. Bull. Mar. Sci. 70, 639–656.
Heino, M., and Kaitala, V. (1999). Evolution of resource allocation between growth and reproduction in animals with indeterminate growth. J. Evol. Biol. 12, 423–429. doi: 10.1046/j.1420-9101.1999.00044.x
Hendry, A. P., Kinnison, M. T., Heino, M., Day, T., Smith, T. B., Fitt, G., et al. (2011). Evolutionary principles and their practical application. Evol. Appl. 4, 159–183. doi: 10.1111/j.1752-4571.2010.00165.x
Hilborn, R., and Walters, C. J. (1992). “Statistical catch-at-age methods,” in Quantitative Fisheries Stock Assessment (Boston, MA: Springer), 369–390. doi: 10.1007/978-1-4615-3598-0_11
Holland, D. S., and Sutinen, J. G. (1999). An empirical model of fleet dynamics in New England trawl fisheries. Can. J. Fish. Aquat. Sci. 56, 253–264. doi: 10.1139/cjfas-56-2-253
Houle, D. (1992). Comparing evolvability and variability of quantitative traits. Genetics 130, 195–204. doi: 10.1007/BF00132277
Hutchings, J. A. (2005). Life history consequences of overexploitation to population recovery in Northwest Atlantic cod (Gadus morhua). Can. J. Fish. Aquat. Sci. 62, 824–832. doi: 10.1139/f05-081
Jørgensen, C., Ernande, B., and Fiksen, O. (2009). Size-selective fishing gear and life history evolution in the Northeast Arctic cod. Evol. Appl. 2, 356–370. doi: 10.1111/j.1752-4571.2009.00075.x
Jørgensen, C., and Fiksen, Ø. (2006). State-dependent energy allocation in cod (Gadus morhua). Can. J. Fish. Aquat. Sci. 63, 186–199. doi: 10.1139/f05-209
Jusufovski, D., and Kuparinen, A. (2020). Exploring individual and population eco-evolutionary feedbacks under the coupled effects of fishing and predation. Fish. Res. 231:105713. doi: 10.1016/j.fishres.2020.105713
Kaitala, V., and Getz, W. M. (1995). Population dynamics and harvesting of semelparous species with phenotypic and genotypic variability in reproductive age. J. Math. Biol. 33, 521–556. doi: 10.1007/BF00163041
Kozlowski, J., and Wiegert, R. G. (1986). Optimal allocation of energy to growth and reproduction. Theor. Popul. Biol. 29, 16–37. doi: 10.1016/0040-5809(86)90003-1
Kozłowski, J., and Wiegert, R. G. (1987). Optimal age and size at maturity in annuals and perennials with determinate growth. Evol. Ecol. 1, 231–244. doi: 10.1007/BF02067553
Kuparinen, A., and Hutchings, J. A. (2012). Consequences of fisheries-induced evolution for population productivity and recovery potential. Proc. R. Soc. B Biol. Sci. 279, 2571–2579. doi: 10.1098/rspb.2012.0120
Kuparinen, A., Hutchings, J. A., and Waples, R. S. (2016). Harvest-induced evolution and effective population size. Evol. Appl. 9, 658–672. doi: 10.1111/eva.12373
Kuparinen, A., and Uusi-Heikkilä, S. (2020). Atlantic cod recovery from the Allee effect zone: contrasting ecological and evolutionary rescue. Fish Fish. 21, 916–926. doi: 10.1111/faf.12470
Laugen, A. T., Engelhard, G. H., Whitlock, R., Arlinghaus, R., Dankel, D. J., Dunlop, E. S., et al. (2014). Evolutionary impact assessment: accounting for evolutionary consequences of fishing in an ecosystem approach to fisheries management. Fish Fish. 15, 65–96. doi: 10.1111/faf.12007
Law, R. (2000). Fishing, selection, and phenotypic evolution. ICES J. Mar. Sci. 57, 659–668. doi: 10.1006/jmsc.2000.0731
Law, R., and Grey, R. D. (1989). Evolution of yields from populations with age-specific cropping. Evol. Ecol. 3, 343–359. doi: 10.1007/BF02285264
Lester, N. P., Shuter, B. J., and Abrams, P. A. (2004). Interpreting the von Bertalanffy model of somatic growth in fishes: the cost of reproduction. Proc. R. Soc. Lond. B Biol. Sci. 271, 1625–1631. doi: 10.1098/rspb.2004.2778
Liu, C. X., Zhang, X., and Yang, K. W. (1982). Studies on the growth of Spanish mackerel, Scomberomorus niphonius in the Huanghai Sea and Bohai Sea. Oceanol. Limnol. Sin. 13, 170–178.
Marty, L., Dieckmann, U., and Ernande, B. (2015). Fisheries-induced neutral and adaptive evolution in exploited fish populations and consequences for their adaptive potential. Evol. Appl. 8, 47–63. doi: 10.1111/eva.12220
Ministry of Agriculture and Rural Affairs (1998–2020). Chinese Fishery Statistical Yearbook. Beijing: Ministry of Agriculture and Rural Affairs.
Mollet, F. M., Dieckmann, U., and Rijnsdorp, A. D. (2016). Reconstructing the effects of fishing on life-history evolution in North Sea plaice Pleuronectes platessa. Mar. Ecol. Prog. Ser. 542, 195–208. doi: 10.3354/meps11441
Mousseau, T. A., and Roff, D. A. (1987). Natural selection and the heritability of fitness components. Heredity 59, 181–198. doi: 10.1038/hdy.1987.113
Mu, X. X., Zhang, C., Zhang, C. L., Xu, B. D., Xue, Y., Tian, Y. J., et al. (2018). The fisheries biology of the spawning stock of Scomberomorus niphonius in the Bohai and Yellow Seas. J. Fish. Sci. China 25, 1308–1316. doi: 10.3724/SP.J.1118.2018.17346
Pinsky, M. L., Eikeset, A. M., Helmerson, C., Bradbury, I. R., Bentzen, P., Morris, C., et al. (2021). Genomic stability through time despite decades of exploitation in cod on both sides of the Atlantic. Proc. Natl. Acad. Sci. U.S.A. 118:e2025453118. doi: 10.1073/pnas.2025453118
Pope, J. G., Gislason, H., Rice, J. C., and Daan, N. (2021). Scrabbling around for understanding of natural mortality. Fish. Res. 240:105952. doi: 10.1016/j.fishres.2021.105952
Qiu, S. Y., Lv, Z. B., and Jiao, J. J. (2009). Study on the suitable season of exploitation and utilization of fishery resources in the Yellow Sea and Bohai Sea. Shandong Fish. 26, 18–20.
Qiu, S. Y., and Ye, M. Z. (1994). Study on the individual fecundity of mackerel in the Yellow Sea and Bohai Sea. J. Shanghai Ocean Univ. 3, 21–26.
Qiu, S. Y., and Ye, M. Z. (1996). Studies on the reproductive biology of Scomberomorus niphonius in the Yellow Sea and Bohai Sea. Oceanol. Limnol. Sin. 25, 463–470.
Quince, C., Albrams, P. A., Shuter, B. J., and Lester, P. L. (2008). Biphasic growth in fish I: theoretical foundations. J. Theor. Biol. 254, 197–206. doi: 10.1016/j.jtbi.2008.05.029
Quinn, T. Q., and Deriso, R. B. (1999). Quantitative Fish Dynamics. New York, NY: Oxford University Press.
Ricker, W. E. (1981). Changes in the average size and average age of Pacific salmon. Can. J. Fish. Aquat. Sci. 38, 1636–1656. doi: 10.1139/f81-213
Rijnsdorp, A. D. (1993). Fisheries as a large-scale experiment on life-history evolution: disentangling phenotypic and genetic effects in changes in maturation and reproduction of North Sea plaice, Pleuronectes platessa L. Oecologia 96, 391–401. doi: 10.1007/BF00317510
Roff, D. A. (1992). The Evolution of Life Histories: Theory and Analysis. New York, NY: Chapman & Hall.
Salas, S., Sumaila, U. R., and Pitcher, T. (2004). Short-term decisions of small-scale fishers selecting alternative target species: a choice model. Can. J. Fish. Aquat. Sci. 61, 374–383. doi: 10.1139/f04-007
Stokes, K., and Law, R. (2000). Fishing as an evolutionary force. Mar. Ecol. Prog. Ser. 208, 307–309.
Sun, B. (2009). The Current Situation and Conservation of Scomberomorus niphonius in Yellow Sea and Bohai Bay. Doctoral Dissertation. Beijing: Chinese Academy of Agricultural Sciences.
Therkildsen, N. O., Wilder, A. P., Conover, D. O., Munch, S. B., Baumann, H., and Palumbi, S. R. (2019). Contrasting genomic shifts underlie parallel phenotypic evolution in response to fishing. Science 365, 487–490. doi: 10.1126/science.aaw7271
Uusi-Heikkilä, S., Sävilammi, T., Leder, E. H., Arlinghaus, R., and Primmer, C. R. (2017). Rapid, broad-scale gene expression evolution in experimentally harvested fish populations. Mol. Ecol. 26, 3954–3967. doi: 10.1111/mec.14179
van Wijk, S. J., Taylor, M. I., Creer, S., Dreyer, C., Rodrigues, F. M., Ramnarine, I. W., et al. (2013). Experimental harvesting of fish populations drives genetically based shifts in body size and maturation. Front. Ecol. Environ. 11, 181–187. doi: 10.1890/120229
Walters, C., and Korman, J. (1999). Linking recruitment to trophic factors: revisiting the Beverton-Holt recruitment model from a life history and multispecies perspective. Rev. Fish Biol. Fish. 9, 187–202. doi: 10.1023/A:1008991021305
Watson, R., Revenga, C., and Kura, Y. (2006). Fishing gear associated with global marine catches: I. Database development. Fish. Res. 79, 97–102. doi: 10.1016/j.fishres.2006.01.010
Werner, E. E., and Anholt, B. R. (1993). Ecological consequences of the trade-off between growth and mortality rates mediated by foraging activity. Am. Nat. 142, 242–272. doi: 10.1086/285537
You, Z. B., Li, X. S., Zhao, X. Y., Wang, X. L., Sun, S., Sun, Z. Z., et al. (2014). The selectivity research of big mesh gillnet for Scomberomorus niphonius. J. Fish. China 38, 289–296. doi: 10.3724/SP.J.1231.2014.48950
Zimmermann, F., and Jørgensen, C. (2015). Bioeconomic consequences of fishing-induced evolution: a model predicts limited impacted on net present value. Can. J. Fish. Aquat. Sci. 72, 612–624. doi: 10.1139/cjfas-2014-0006
Keywords: fisheries-induced evolution, eco-genetic model, gear selectivity, life history traits, fisheries management
Citation: Sun P, Shang Y, Sun R, Tian Y and Heino M (2022) The Effects of Selective Harvest on Japanese Spanish Mackerel (Scomberomorus niphonius) Phenotypic Evolution. Front. Ecol. Evol. 10:844693. doi: 10.3389/fevo.2022.844693
Received: 28 December 2021; Accepted: 07 February 2022;
Published: 28 February 2022.
Edited by:
Claus Wedekind, University of Lausanne, SwitzerlandReviewed by:
Thomas Mehner, Leibniz Institute of Freshwater Ecology and Inland Fisheries (IGB), GermanyAnssi Vainikka, University of Eastern Finland, Finland
Copyright © 2022 Sun, Shang, Sun, Tian and Heino. This is an open-access article distributed under the terms of the Creative Commons Attribution License (CC BY). The use, distribution or reproduction in other forums is permitted, provided the original author(s) and the copyright owner(s) are credited and that the original publication in this journal is cited, in accordance with accepted academic practice. No use, distribution or reproduction is permitted which does not comply with these terms.
*Correspondence: Peng Sun, c3VucGVuZ0BvdWMuZWR1LmNu
†ORCID: Peng Sun, orcid.org/0000-0002-0839-1785; Runlong Sun, orcid.org/0000-0003-1186-0367; Yongjun Tian, orcid.org/0000-0003-2798-0638; Mikko Heino, orcid.org/0000-0003-2928-3940
 Peng Sun
 Yangke Shang
 Runlong Sun
 Yongjun Tian
 Mikko Heino