 Minhuan Li1
 Jiancheng Chen
95% of researchers rate our articles as excellent or good
Learn more about the work of our research integrity team to safeguard the quality of each article we publish.
Find out more
ORIGINAL RESEARCH article
Front. Ecol. Evol. , 11 February 2022
Sec. Conservation and Restoration Ecology
Volume 10 - 2022 | https://doi.org/10.3389/fevo.2022.841943
This article is part of the Research Topic Solutions to High-Quality Development: Theories and Practices in Ecological Aspects View all 21 articles
Grassland is the largest terrestrial ecosystem in China, and its ecological environment is currently facing several challenges. The service assessment of scientific and effective grassland ecosystem and in-depth analysis of its change mechanism is of great significance to clarify its protection demand and spatial optimization layout. This study used a set of quantitative surrogate biophysical indicators to evaluate the capability of grassland ecosystem services (i.e., carbon fixation, soil protection, water purification and provision, and biodiversity conservation) in the Hulunbuir grassland from 2000 to 2015 and use econometric models to explore their dynamic change mechanism. The results showed that from 2009 to 2012, the grassland ecosystem service value significantly declined, and from 2013 to 2015, its value significantly improved, but the overall level was still lower than that of 2000. The factor that has the highest degree of impact on grassland ecosystem services is the soil potassium content, and there is a significant positive correlation. This is mainly due to the important role of potassium in the photosynthesis of grassland plants; the least influential factors are social economic factors such as population and gross domestic product (GDP). It shows that the sparsely populated grassland ecosystem is not sensitive to these factors. In addition, climate, topography, and grassland management policies all have a significant impact on grassland ecosystem services. Against the backdrop of intensified pressure on ecological grassland protection and surging market demand for livestock products based on grassland resource input, the sustainable development of grassland areas needs to improve the supply capacity of grassland while ensuring its ecological security, so as to realize a win-win situation for its ecological and production functions.
With population growth and economic and social development, the human use and transformation of Earth surface ecosystems have reached unprecedented levels, with net primary productivity taking up more than 20% of the net primary productivity of the global ecosystem; however, this expression is highly heterogeneous, with some areas reaching even more than 60% (Zhang et al., 2017). Human interference and utilization have exerted profound impacts on the natural ecosystem, leading to ecological environment degradation, which is mainly manifested in, for example, reductions in biodiversity and productivity, desertification, soil and nutrient loss, and water pollution (Liebig et al., 2010; Castellani et al., 2017; Wang et al., 2019; Zhao et al., 2019). Continuous ecosystem supply is an important guarantee for the sustainable development of human society, mainly in the form of ecosystem services (ESs). Ecosystems and ESs, in the process of material and energy flow forming and maintaining human survival in the ecosystem, depending on the natural environment and utility for input to the social economic system through useful material and energy (e.g., products) and as a necessary environment for human survival conditions (e.g., improving the environment and water and biodiversity conservation) (Daily, 1997; Reid et al., 2005; Zagonari, 2016). The quantitative assessment of ESs is not only an important basis for supporting decisions for the rational utilization of regional resources, ecological protection, and sustainable social and economic development but also an important index for investigating the supply capacity of ecosystems and identifying the status quo of their ecological functions and production functions (Burkhard et al., 2013; Woodruff and Bendor, 2016). As the largest terrestrial ecosystem in China, grassland accounts for over 40% of the total land area species, which is an important part of the national green ecological barrier and ecological security. An ecological function is always the first function of grassland; the protection of the ecological grassland security is also a key task of the implementation of the 18th National Congress of the Communist Party of China to vigorously promote the construction of ecological civilization, and as an important part of the life community of “mountains, rivers, forests, fields, lakes, and grasses”; the grassland ecosystem plays an increasingly important role in maintaining the national ecological security. For example, in terms of water conservation, grassland occupies nearly 40% of water conservation function areas in China (Wang et al., 2017). The water conservation capacity of grassland is 40–100 times that of cultivated land and 0.5–3 times that of forest land. The water conservation capacity of grassland is 58.5% higher than that of forest land for runoff retention and 88.5% higher than that of forest land for sediment reduction. In terms of carbon fixation, grassland, as an important carbon-storing terrestrial vegetation ecosystem, is a huge carbon reservoir in China. Most of the carbon storage of grassland ecology is concentrated in the underground roots and soil of the grassland, and the carbon storage of grassland accounts for 17% of the national land carbon storage (Fang et al., 2010; Deng et al., 2017). Giving full play to the carbon storage function of grassland is of great significance for China’s independent emission-reduction program and maintaining the carbon balance of the natural system. In addition, grassland plays an important role in windbreak and sand fixation, soil and water conservation, biodiversity, and carbon fixation. In this context, the scientific and effective assessment of ES was carried out for the grassland ecosystem, and its change mechanism was analyzed in depth. It is of great significance to clarify the needs of grassland protection, optimize the spatial layout, and realize the harmonious development between humans and nature.
Currently, the ES assessment mainly comprises three types of methods, namely, the benefit transfer, model, and quantitative index methods. Among these, the benefit transfer method was derived from Costanza et al. (1997), and it is mainly based on research of various types of land area and per unit area ES values or the product of the physical-quality parameters of the various types of ESs (Plummer, 2009). Benefit transfer, although less demanding in terms of data amounts and simpler, has higher corresponding uncertainty results and a lack of a solid scientific foundation and was thus put into question (Eigenbrod et al., 2010; Koschke et al., 2012). The model method is based on ESs provided by the ecological and social economic foundation of the development of the comprehensive evaluation method; among them, the InVEST and ARIES models are the most widely used (Daily et al., 2009). Although the model method to evaluate ESs value is, in theory, the most complete, data demand is higher, and it is often difficult for it to fully obtain the desired results in practice. The quantitative index is based on laws of the ecology principle for different ESs, and the corresponding algorithm is briefly formulated to define its value. This method focuses on the space unit and the practicability and accuracy of ESs. In practice, both the feasibility and accuracy of the operation results are high, this method thus having more extensive applications (Carreño et al., 2012). On this basis, this study used a set of quantitative surrogate biophysical indicators to evaluate the capability of grassland ESs in the Hulunbuir grassland in 2001–2015, considering that the grassland ecosystem has more natural attributes, and the framework of the grassland ecological service established in this study mainly includes carbon fixation, soil protection, water purification and provision, and biodiversity conservation. This method takes into account the operability and accuracy of the evaluation of ESs, and at the same time, combines the econometric model to explore its change mechanism and provides decision support for the management of the ecological environment of the grassland area.
The rest of this article is organized as follows: First, the research area is introduced in section “Study Area.” Then, in section “Data and Methodology,” we focused on the methodology and data sources. In section “Results,” we further reported and analyzed the estimated results and the factors affecting ESs. Finally, in section “Conclusion and Discussion,” we provided the discussion and conclusions of this article.
The Hulunbuir grassland is located northwest of Hulunbuir, Inner Mongolia Autonomous Region, and it is one of the four major grasslands of the world. It has a coverage of 100,000 km2 and is mainly divided into six types, namely, mountain meadow, mountain meadow grassland, hill meadow grassland, plain hill arid grassland, sandy vegetation grassland, and lowland meadow grassland. There are over 3,000 rivers, over 500 lakes, over 1,600 plant species, over 500 animal species, over 30 million mu of arable land, and over 18 million livestock (e.g., horse and pieces). However, in recent years, 66% of all pastures have degraded, which were manifested as three lows and one imbalance (i.e., low productivity, low coverage, low proportion of high-quality forage, and ecological and production dysfunction); industrial development is in urgent need for transformation and upgrading. Research on the grassland is correspondingly typical and representative. Therefore, based on assessing the grassland ES function and exploring its change mechanism, the Hulunbuir grassland was chosen as the study area in this study, which mainly includes five counties of Hulunbuir, namely, Xin Barag Right, Xin Barag Left, Prairie Chenbarhu, Hailar, and Ewenki Autonomous; the research in this region provide decision support for eco-environmental management in grassland regions (Figure 1).
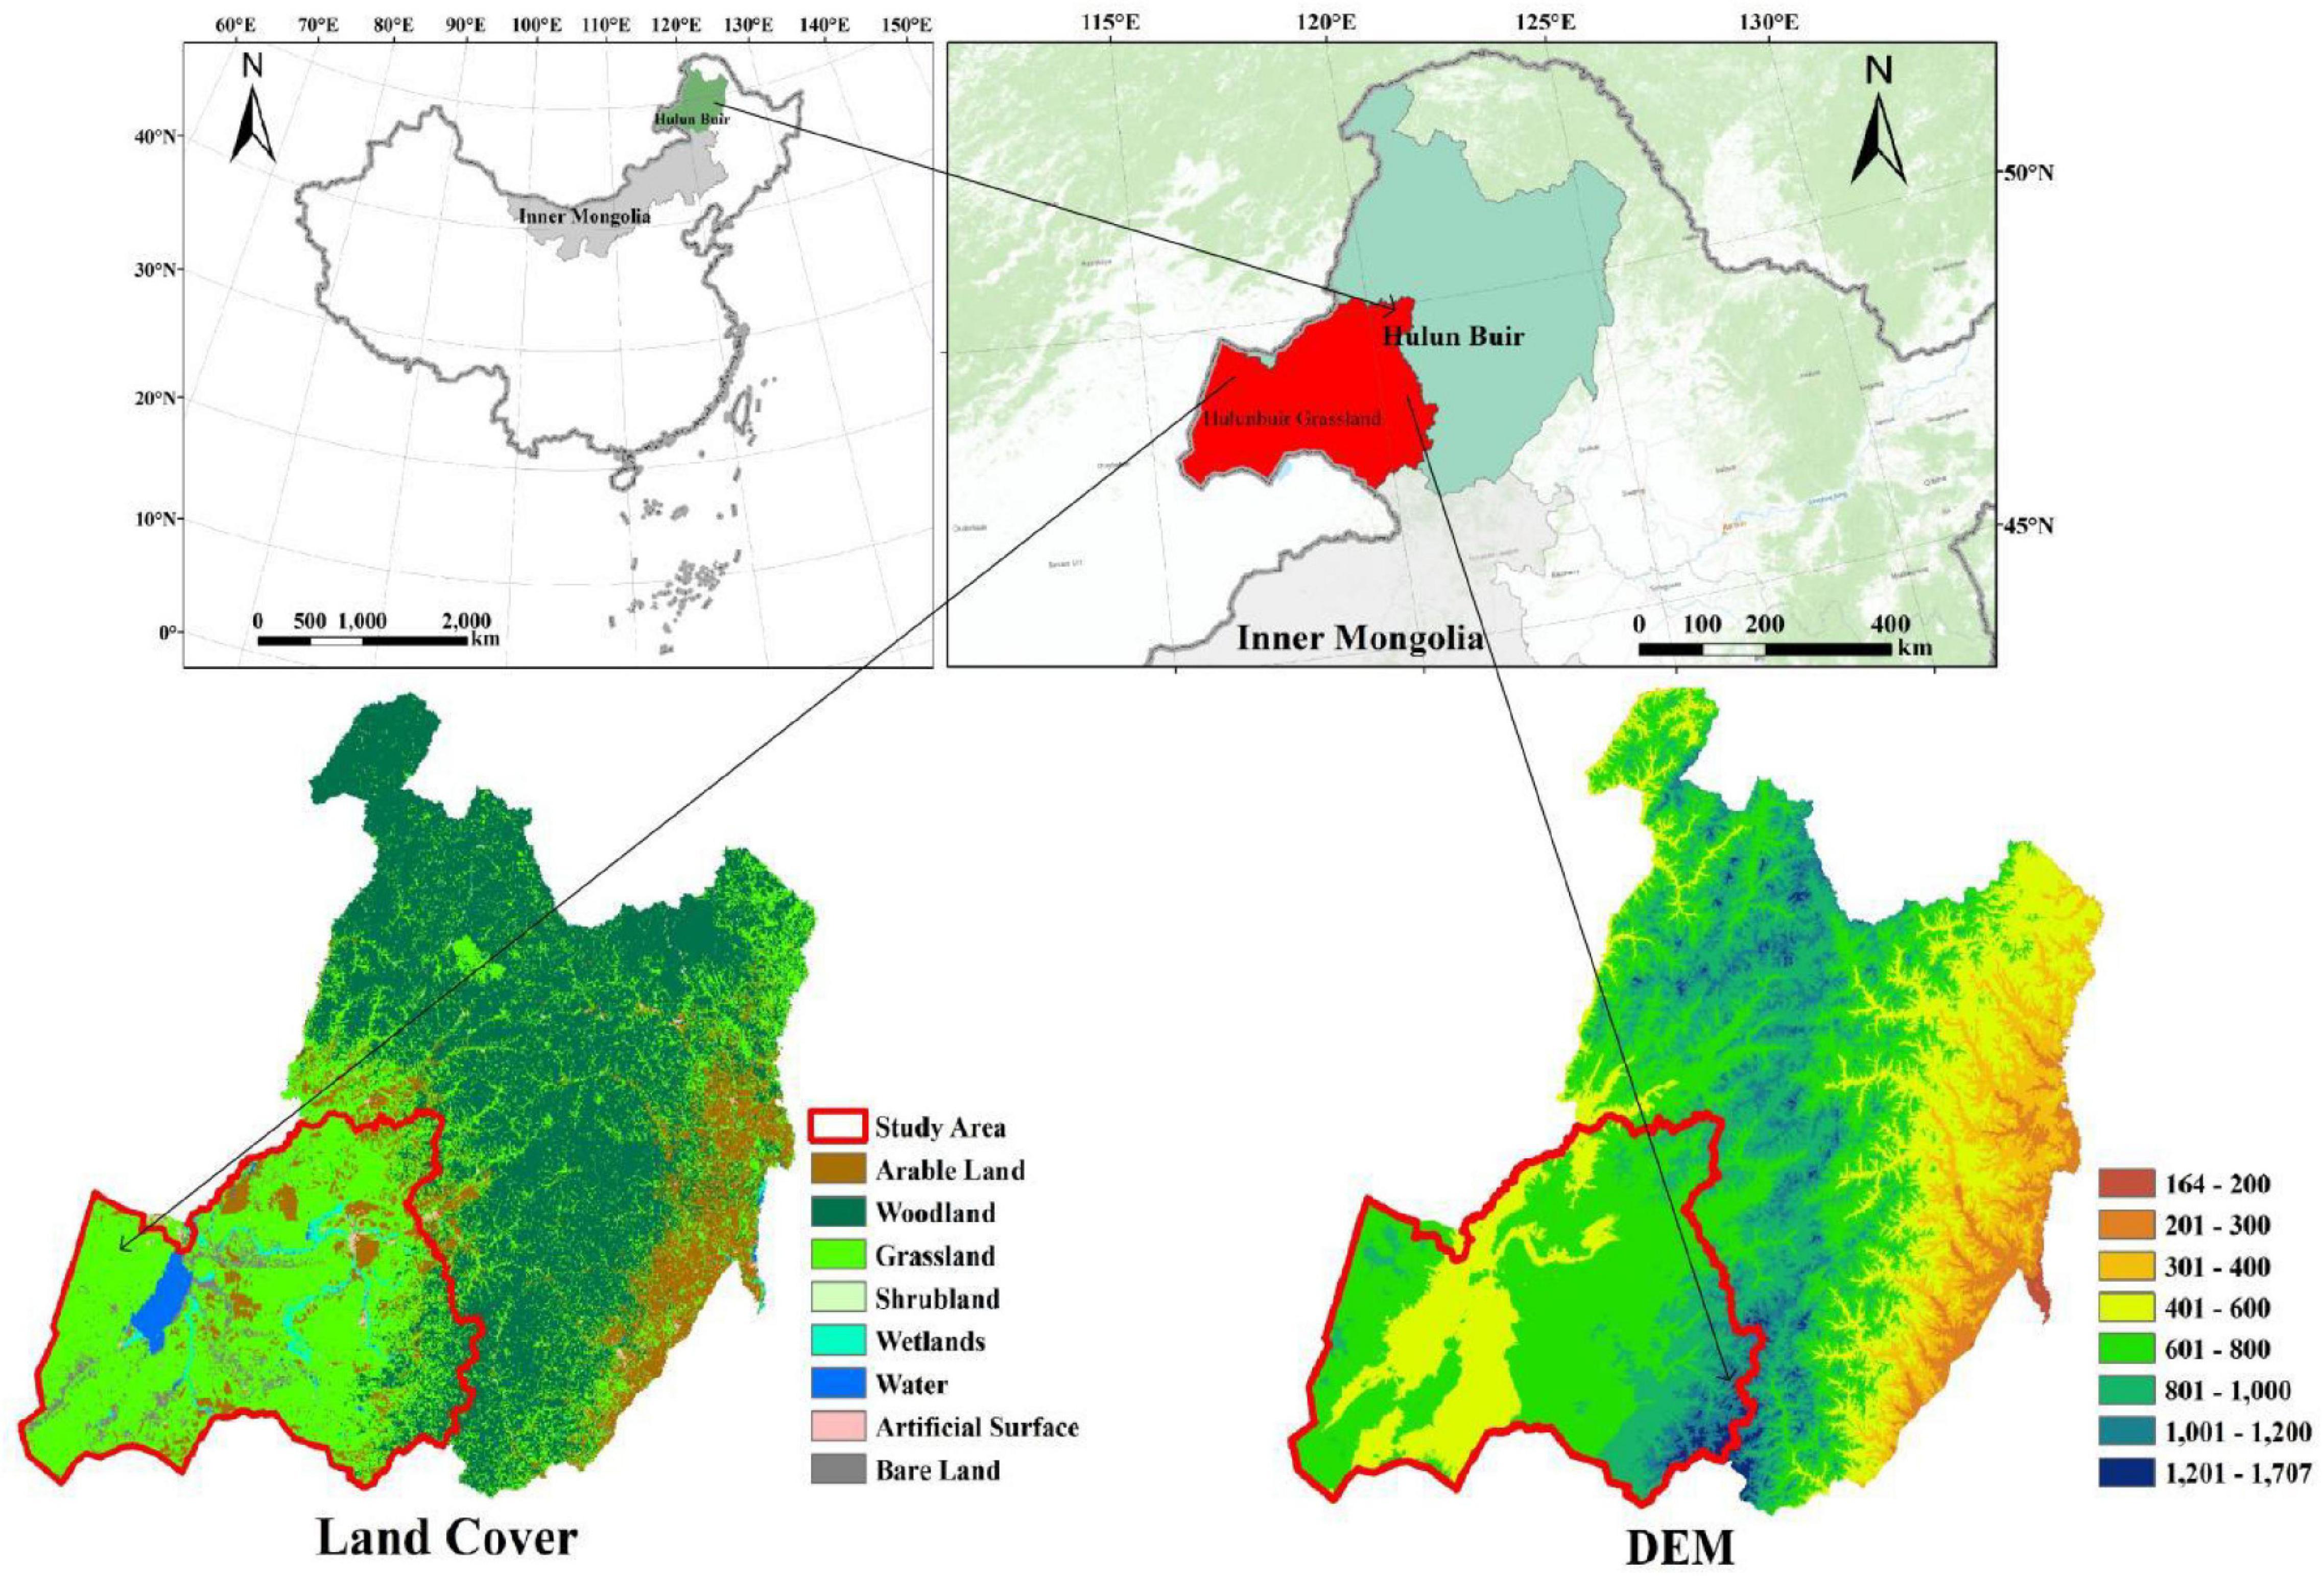
Figure 1. Location of the study area.
The data used in this research mainly come from the Resource Environment and Science Data Center1. In this study, we selected MOD17A2 data from MODIS product data, which have provided 1 km spatial resolution around the global land surface since 2000 and can be downloaded for free from http://www.ntsg.umt.edu/. MOD17A2 data are based on the net primary production (NPP) estimation model built by means of the Biome Biochemical Model (BIOME-BGC) model and a light-utilization model (Zhao and Running, 2010). According to research needs, this study extracted the data of MOD17A2 products of two tiles (i.e., h25v05 and h26v05) from 2000 to 2015 covering the Hulunbuir grassland with a spatial resolution of 1 km. On the basis of the MODIS Reprojection Tool (MRT) and the Cygwin platform, MODIS data were extracted and assembled. NPP source data in the Hierarchical Data Format (HDF) were converted into the GeoTIFF format, and the final image based on Python was converted and cropped. In addition, the data of the land-use raster component come from the Chinese Academy of Sciences (2000, 2005, 2010, 2015). Taking into account the time availability of parameter data in the evaluation of influencing factors in this study, the time range of this study is set to 2000–2015.
In this study, grassland ES capacity was investigated, and its change mechanism is deeply explored mainly on the basis of the quantitative index method (Figure 2), based on the ecological principles and laws of different ESs, a quantitative index system is established, and economic analysis methods of multiple regression models are introduced to determine the important factors that affect ESs. These studies are based on the assumption that the capacity of an ES is directly related to the amount of biology covering Earth. The NPP of the grassland was taken as the index of the amount of biology and production, and the evaluation system of ESs was constructed. Through the measuring method, NPP was transformed into the equivalent of the ESs on a raster scale of 1 km × 1 km and was spatialized by using ArcGIS software. The selection of the index refers to previous studies (Barral and Oscar, 2012; Carreño et al., 2012; Zhang et al., 2017).
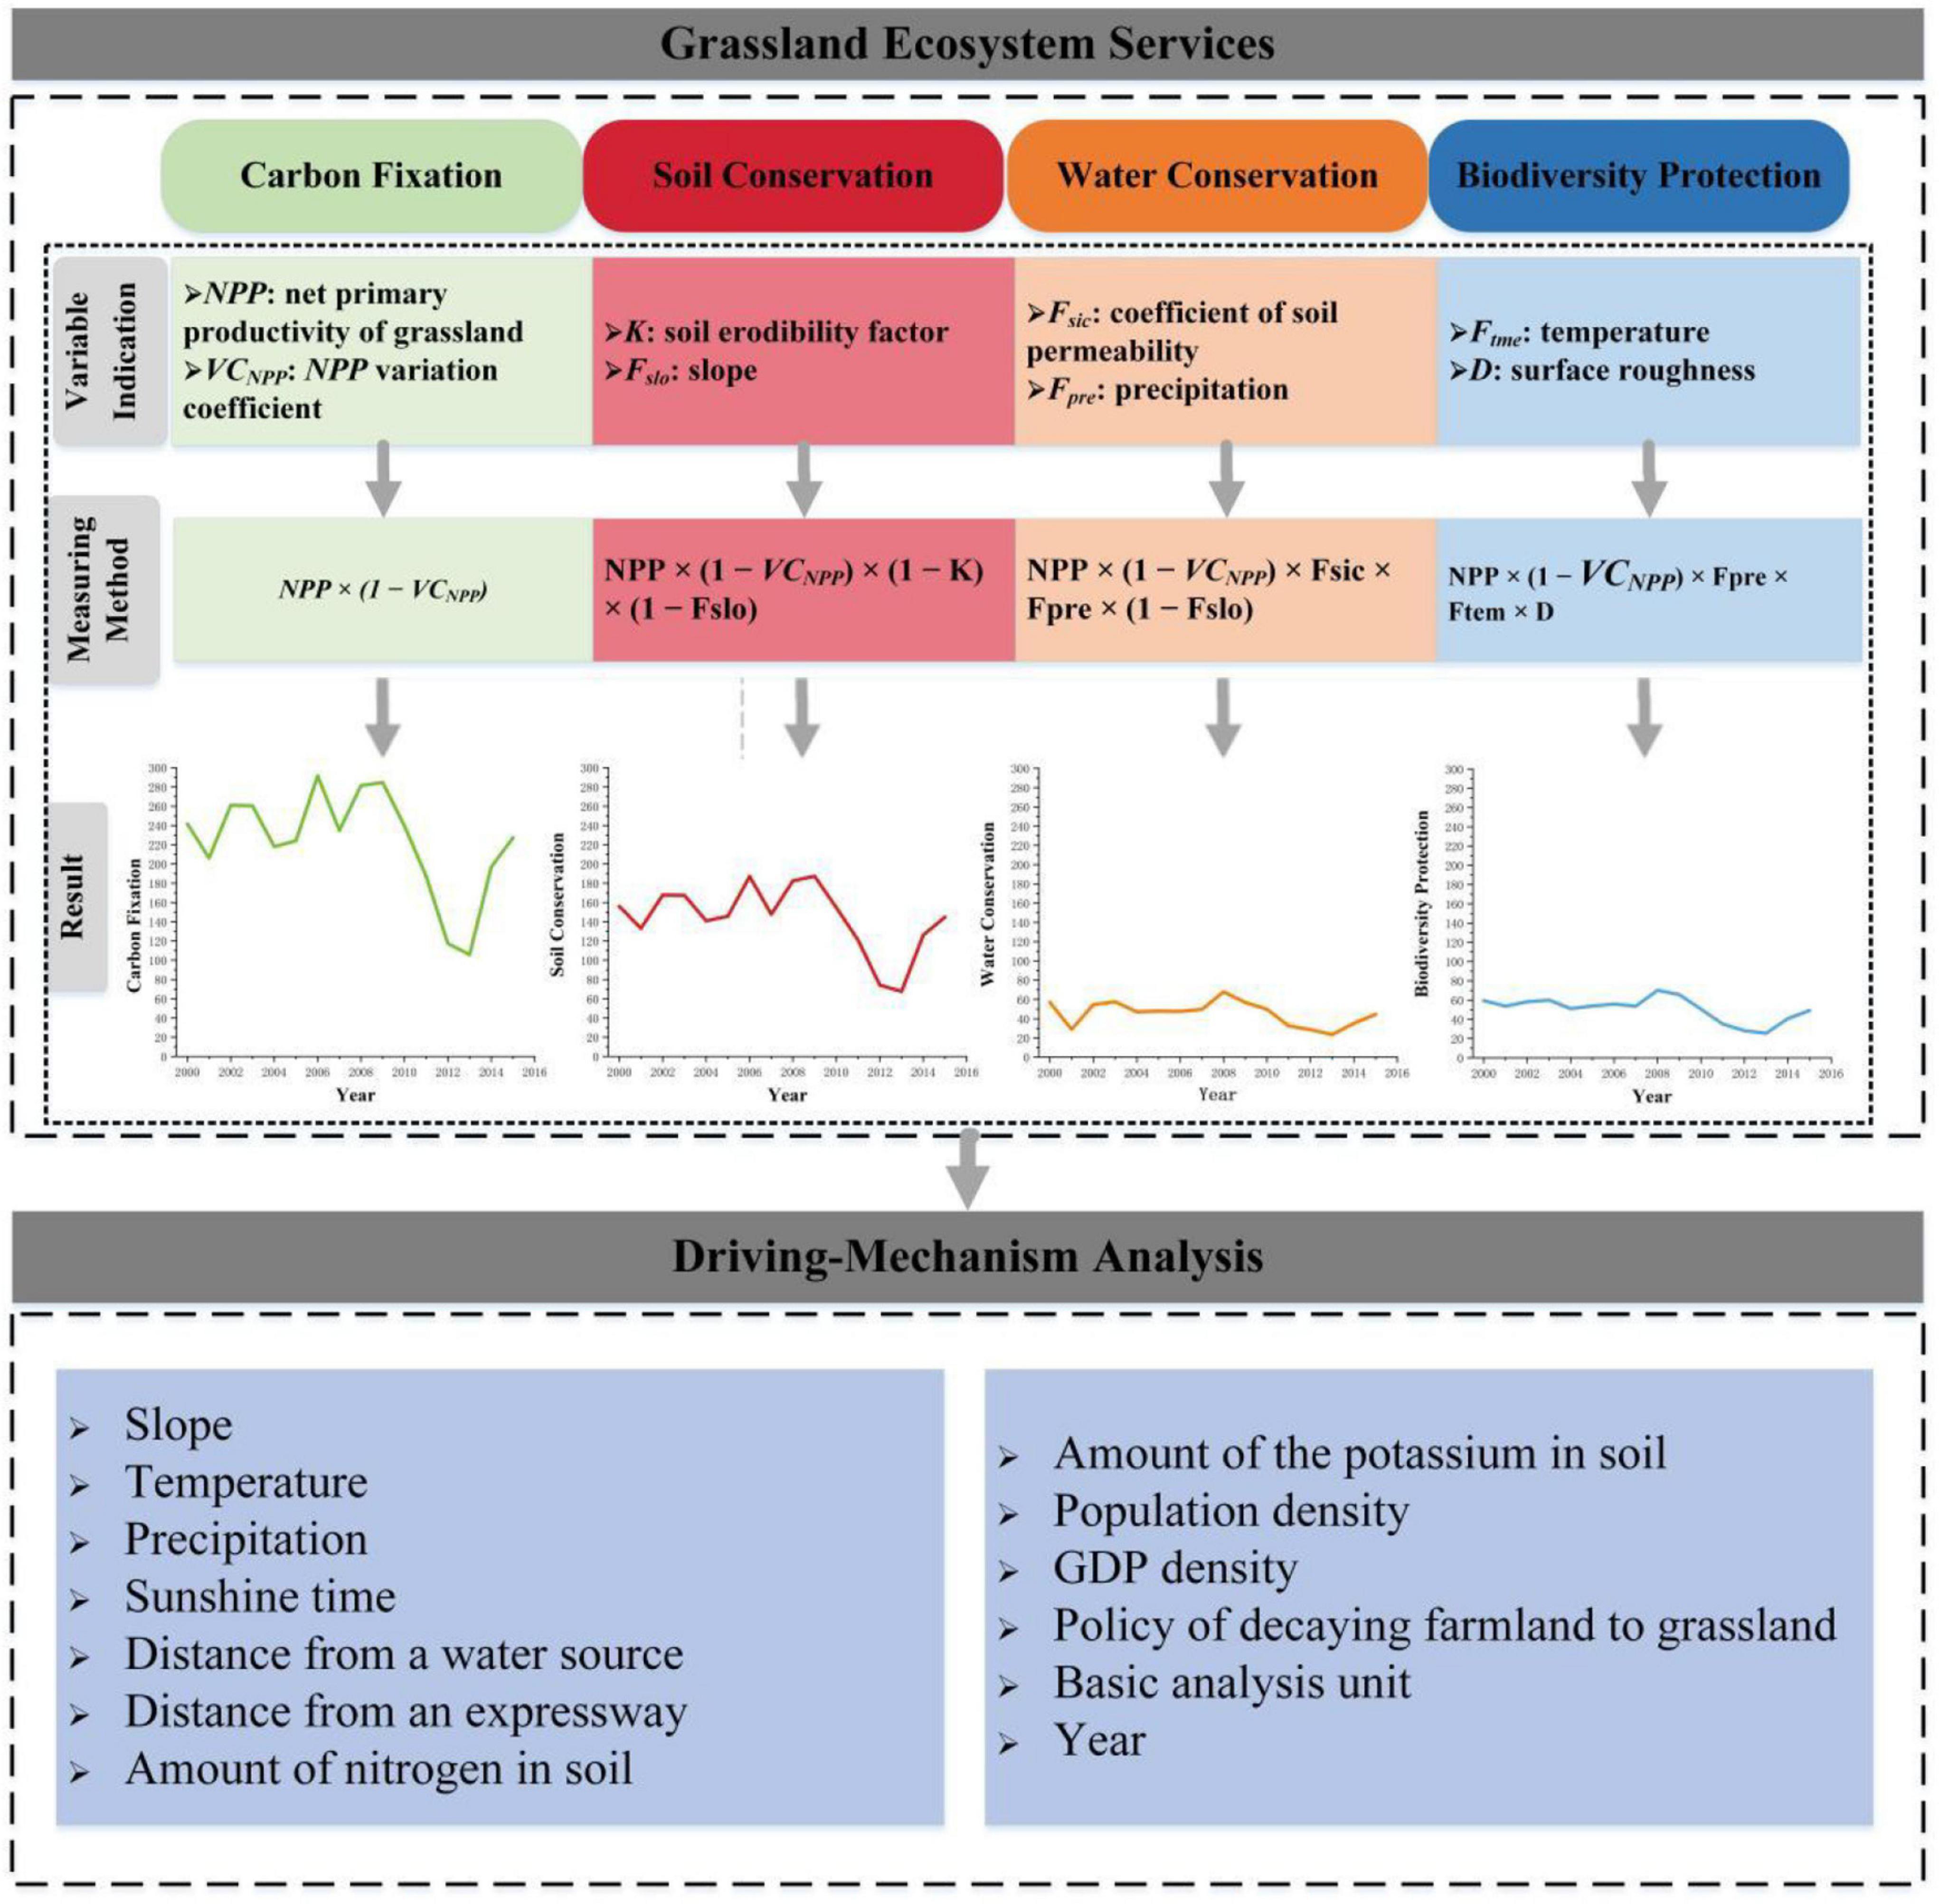
Figure 2. The changing mechanism of grassland ecosystem services.
Furthermore, the process of variable determination is shown as follows:
(1) Net primary production (NPP).
Net primary production refers to the total amount of organic matter accumulated by photosynthesis per unit area per unit time in green plants after deducting autotrophic respiration. It can represent well the capacity of grassland biomass and original production, and the production and accumulation process within the ecosystem can also influence the formation and balance of ESs. In existing research, NPP estimation methods mainly include site-based actual observation, traditional climate statistical models, remote-sensing-based eco-physiological process models, and light-utilization models. As remote-sensing and geographic information systems are constantly being developed and applied, the NPP estimation model based on remote-sensing information is important to study the NPP.
(2) NPP coefficient of variation (VCNPP).
VCNPP represents the annual variation of NPP, which can be calculated by using the ENVI5.0 software.
(3) Soil erodibility factor (K).
K is the soil erosion factor that can be calculated through the model of the erosion-productivity impact calculator (EPIC) from the study by Vadas et al. (2006):
where Sa, Si, Sl, and c represent the percentages of sand, clay, silt, and organic matter in the soil.
(4) Slope (Fslo).
This is specifically located in the spatial analysis module of the ArcGIS 10.2 software by means of 1:250,000 digital elevation model (DEM) image data provided by the Chinese Academy of Sciences (grid size was 1 km × 1 km, the numbers of rows and columns of each image were 1,201 × 1,801, and all maps were rectangles with the same size). Slope data could be obtained by merging the grids, transforming the projections, and dividing the watershed boundaries for DEM maps.
(5) Coefficient of soil permeability (Fsic).
Fsic is the coefficient of soil permeability, and 13 species of soil series were divided by the United States Department of Agriculture based on the soil texture. According to the subsequence of soil particle classification [in ascending sequence: clay (heavy), silty clay, clay, silty clay loam, clay loam, silt, silty loam, sandy clay, loam, sandy clay, sandy loam, loam sand, and sand], Fsic was assigned to 1/13, 2/13, 3/13, …, 1.
(6) Precipitation (Fpre) and air temperature (Ftem).
Fpre and Ftem represent the precipitation and air temperature, respectively. Specifically, in the geostatistical analysis module using the ArcGIS 10.2 software, the grid dataset of precipitation and temperature can be obtained by spatial interpolation on the basis of daily observational data from the China Meteorological Data Network. The spatial resolution was 1 km.
(7) Surface roughness (D).
D is surface roughness, which can be calculated by D = 1/cos(θ), in which θ is the slope of the radian. Both D and θ could be calculated in the spatial analysis module using the ArcGIS 10.2 software on the basis of DEM data.
Since all variables were normalized to the difference between the maximal and minimal values between 2000 and 2015, they all changed ranging from 0 to 1. Total ESs are the sum of all ESs, and results are dimensionless data.
To deeply explore the change mechanism of grassland ESs, we introduced a multiple regression model used in the economic analysis, and the key indicators were determined on the basis of relevant research, which is shown as:
where ESit represents the total amount of grassland ESs on grid units in each period; slope represents the slope; tem represents the annual average temperature; pre represents the annual precipitation; sun represents the sunshine time; d2water means the distance from a water source; d2highw is the distance from an expressway; soil_n represents the amount of nitrogen (N) in soil; soil_p represents the amount of phosphorus (P) in soil; soil_k represents the amount of the potassium (K) in soil; unitpop represents the population density; unitgdp represents the gross domestic product (GDP) density; rfg represents the policy of decaying farmland to grassland; i represents the basic analysis unit; and t represents the year.
According to data of the Hulunbuir grassland NPP from 2000 to 2015, extracted on the basis of the MOD17A2 product, the major years are shown in Figure 3. NPP saw a trend of partial improvement and overall deterioration after 2000. The decline in NPP was mainly concentrated in the areas bordering East and West Piedmont and the plain of Greater Khingan, which showed degradation from forest steppes to meadow grassland and desert grassland; the ecological restoration level of the western border with Mongolia is weak, and the value of NPP is generally below 200. NPP in 2015 was also lower than that in 2000, but still better than in 2005 and 2010. Overall, the ecological security of the Hulunbuir grassland is still greatly threatened.
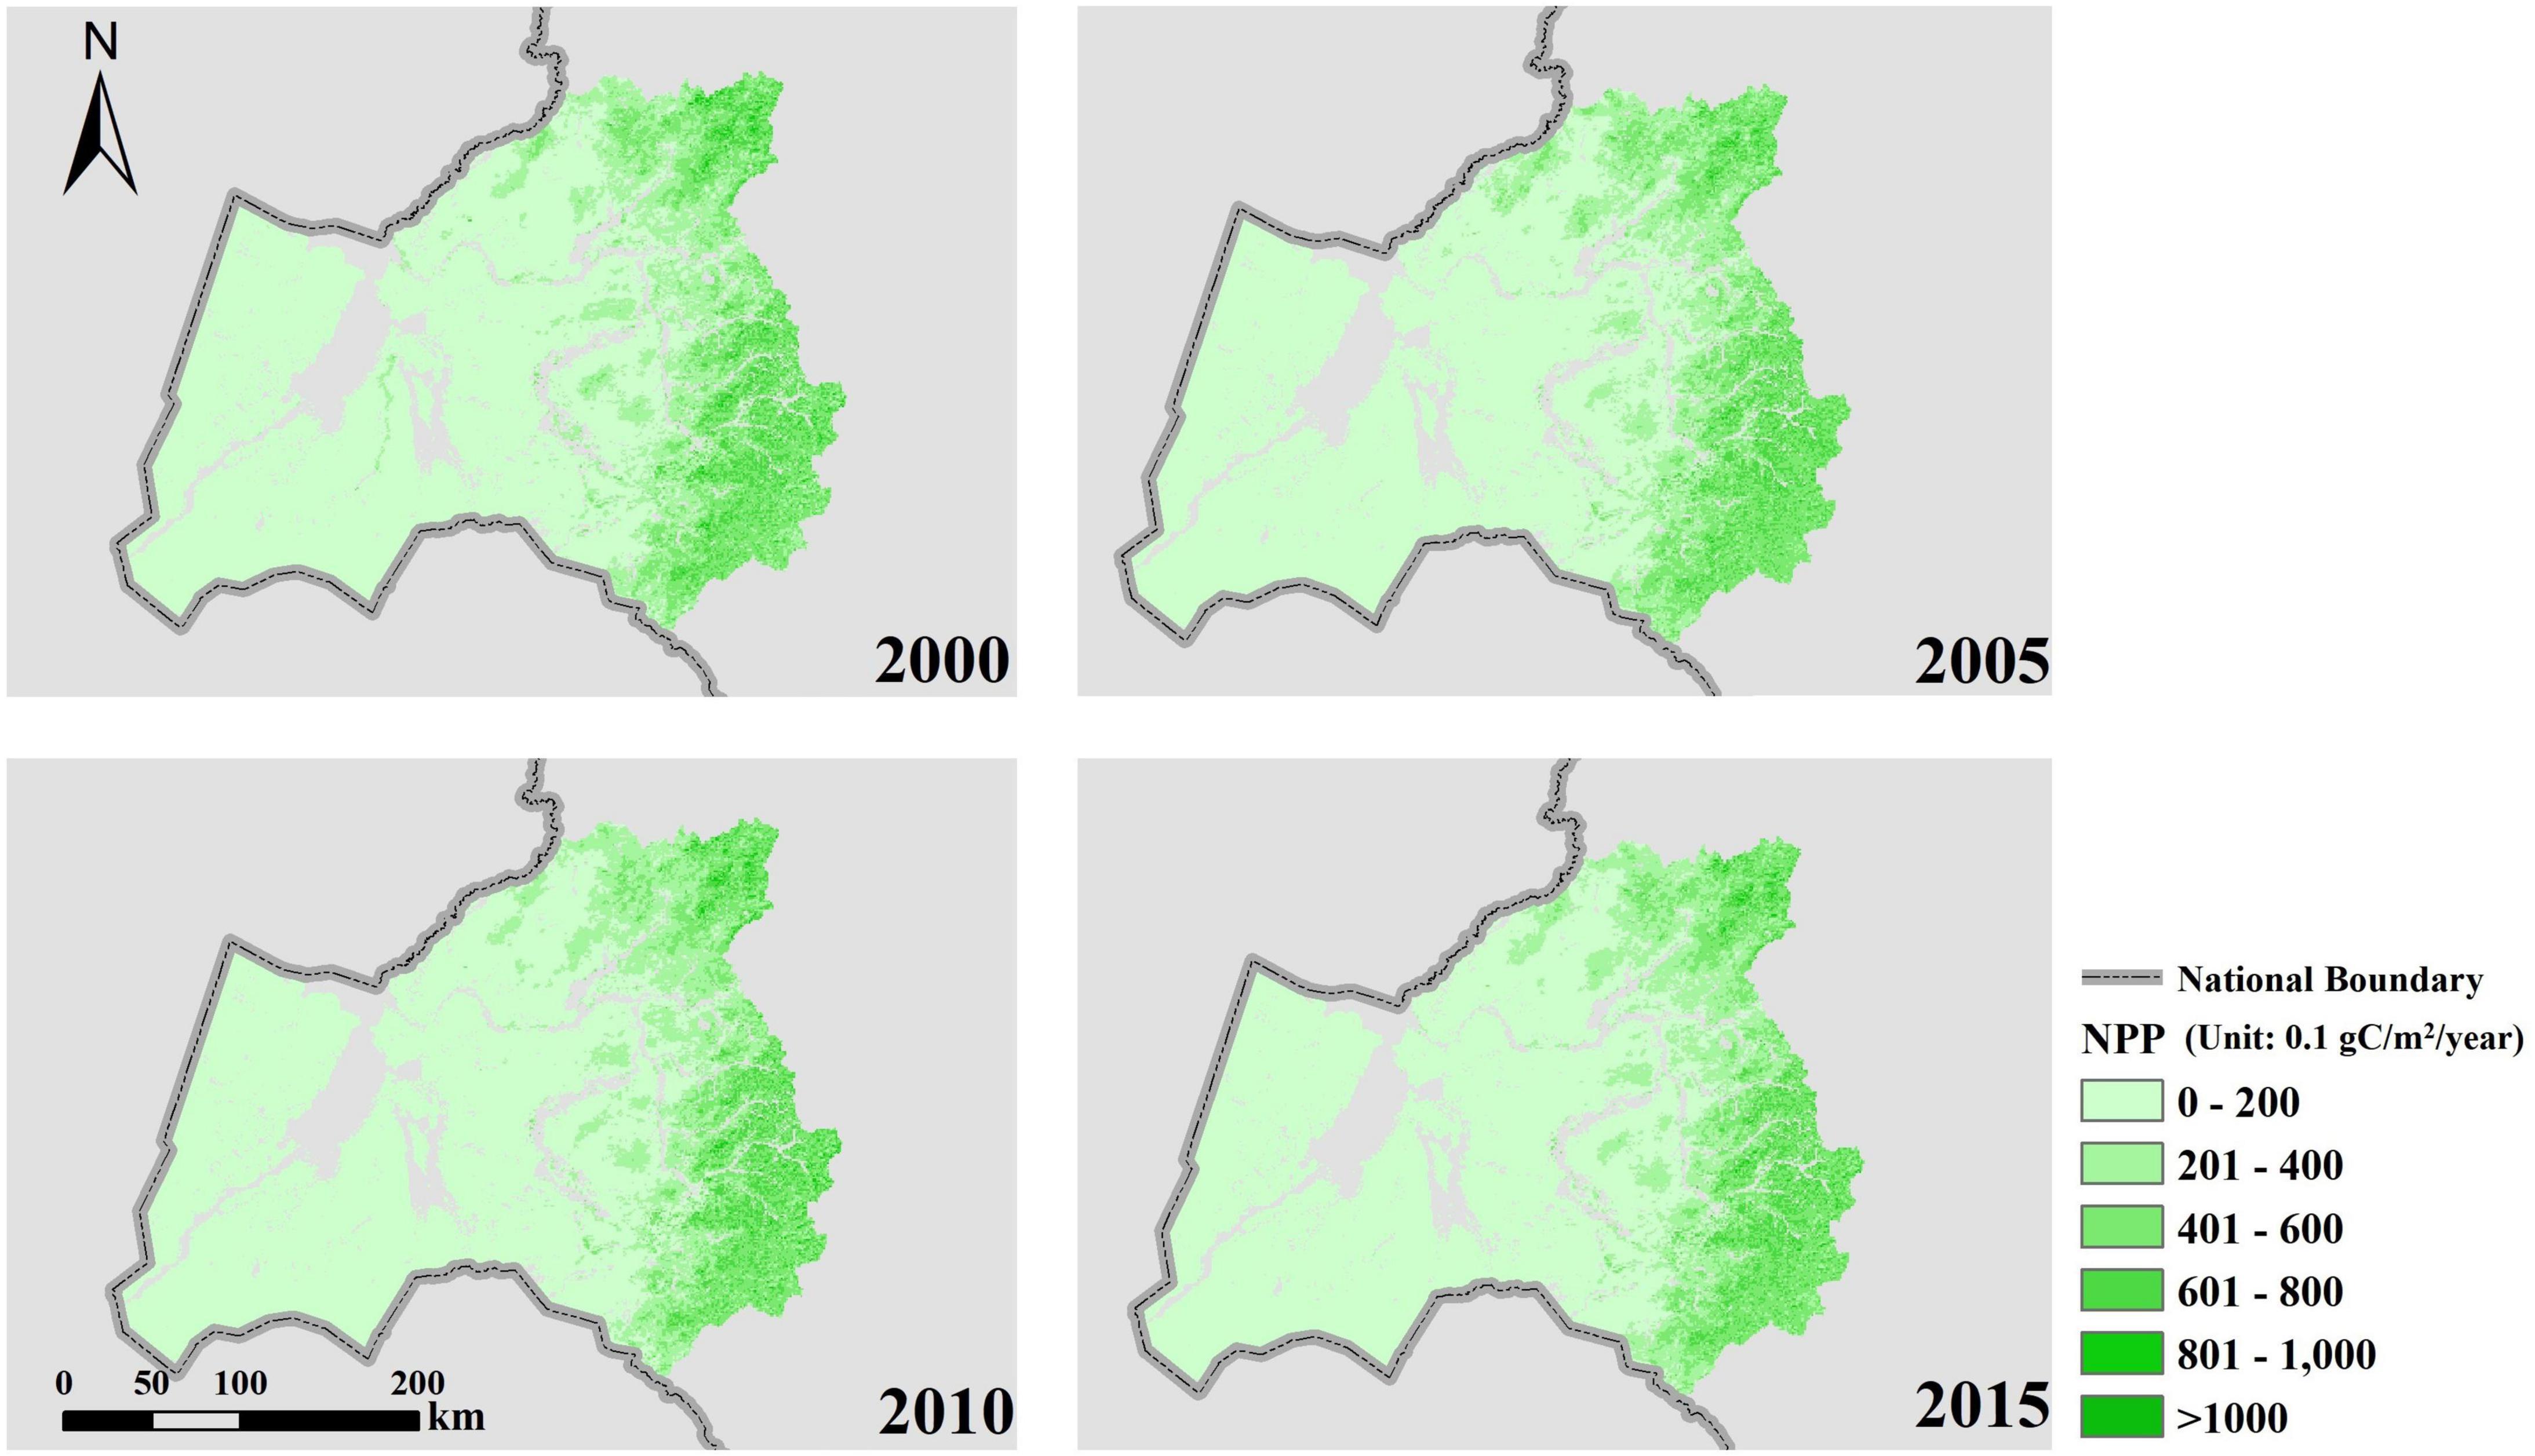
Figure 3. NPP changes in 2000–2015.
From NPP data from 2000 to 2015, dynamic changes in grassland ESs in Hulunbuir from 2000 to 2015 were obtained by combining the evaluation index and calculation method in Figure 2. By calculating the average value and sum of the four ES types of carbon fixation, namely, carbon fixation, soil protection, water purification and provision, and biodiversity conservation in Hulunbuir from 2000 to 2015 (dimensionless data), it is found that the carbon fixation ability of the study area is relatively outstanding, accounting for about half of the overall ESs. Correspondingly, the two ESs of water conservation and biodiversity protection are relatively weak; from the perspective of time evolution, the ES level of Hulunbuir grassland has shown a clear downward trend, and related ecological improvement work urgently needs to be strengthened (Figure 4).
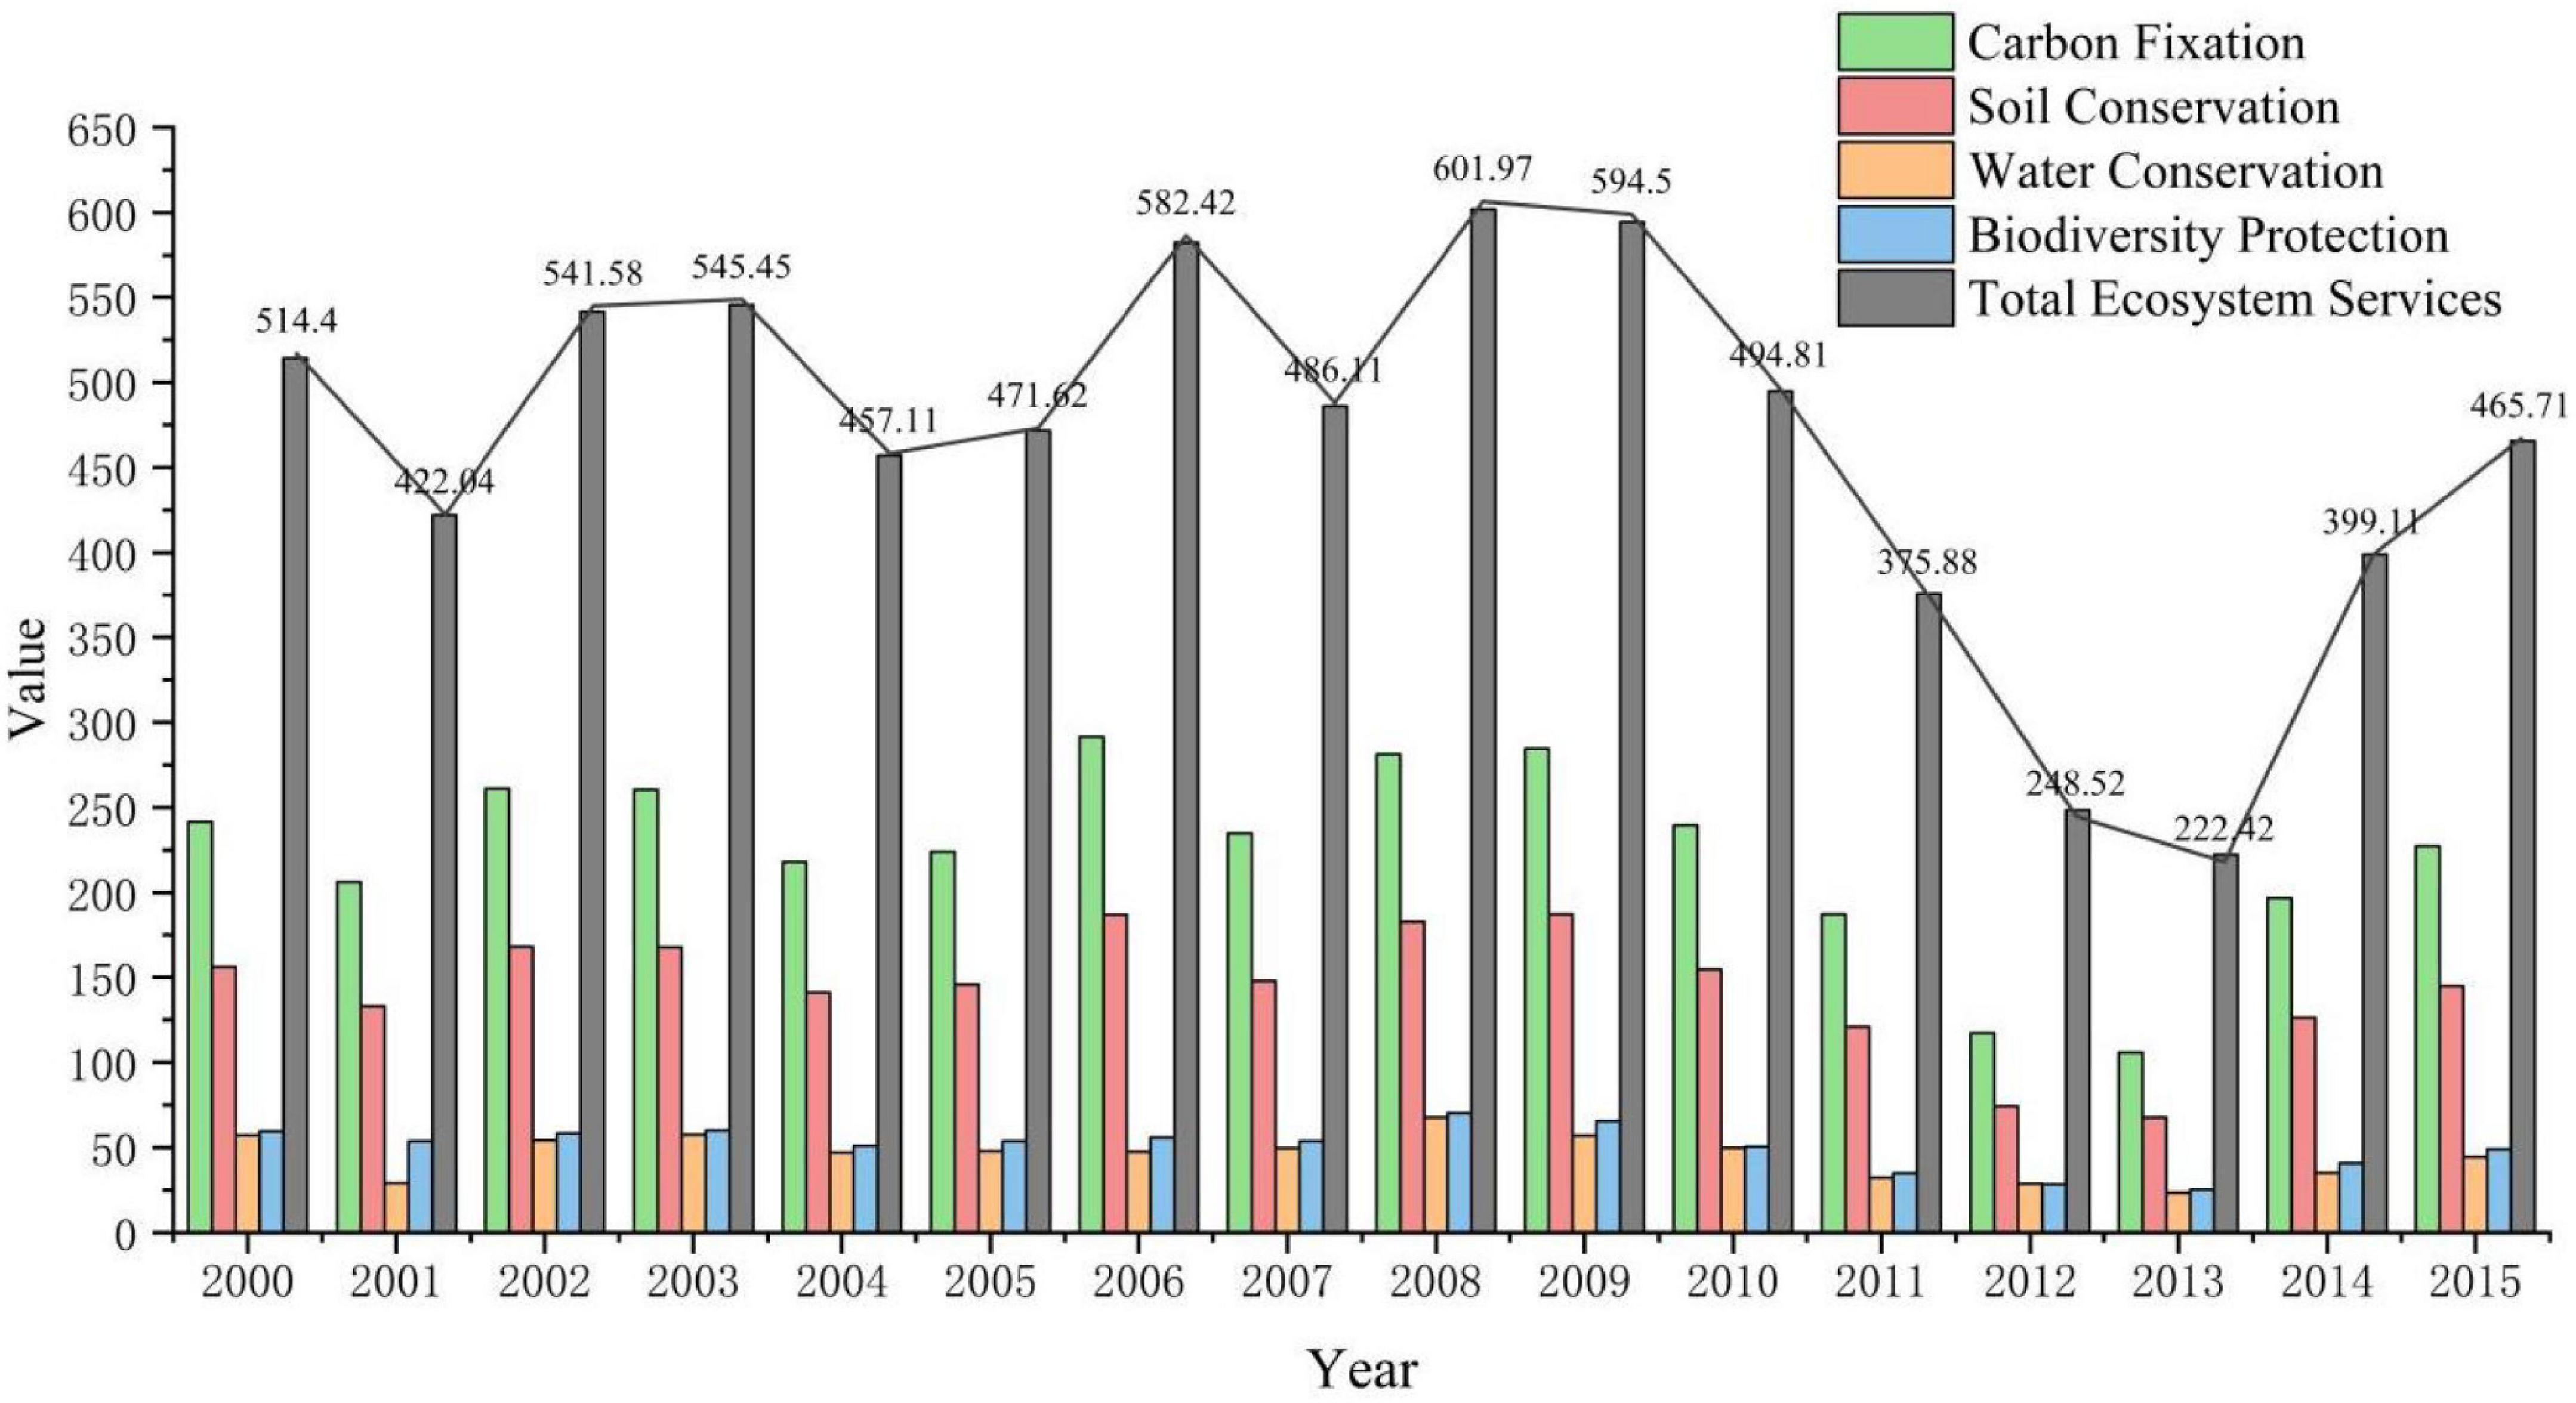
Figure 4. The changing trend of Hulunbuir ecosystem service from 2000 to 2015.
The various ESs are displayed in a more detailed and intuitive view of the time trend change graph. The grassland ES indicators generally show a slow undulating upward trend from 2000 to 2009 and show a rapid decline in 2010–2015 and a trend of later recovery. The changing trend of the overall ESs of each index is basically the same; especially, from 2009 to 2013, the downward trend is more obvious. During this period, the grassland ecological environment deteriorated, and the grassland ecological supply capacity was significantly weakened; in 2008, the level of Hulunbuir ES reached the highest value of 601.97, and it fell to the lowest value of 222.42 in 2013. The main reason behind this was the natural and extensive management of grassland resources during 2010–2013, which caused serious degradation of pastures.
To visualize the ESs of the main years in the time series, refer to Figure 5. We could find that the spatial distribution of each ES type is similar, but the spatial distribution of different ESs has some differences. From the perspective of the time change, the value of ESs in each time period is in a state of concentrated distribution of early extreme values and an even distribution in the later period. The value of carbon fixation is generally higher in the west than in the east, and as time evolves, the distribution of values is more even; while the value of soil conservation is generally higher in the east than in the west, the spatial distribution of water conservation values is more even, but the western value is relatively high; biodiversity protection from the concentrated distribution of the extreme value of ESs in the northern region in 2000 to a low value in 2015 showed a difference between east and west.
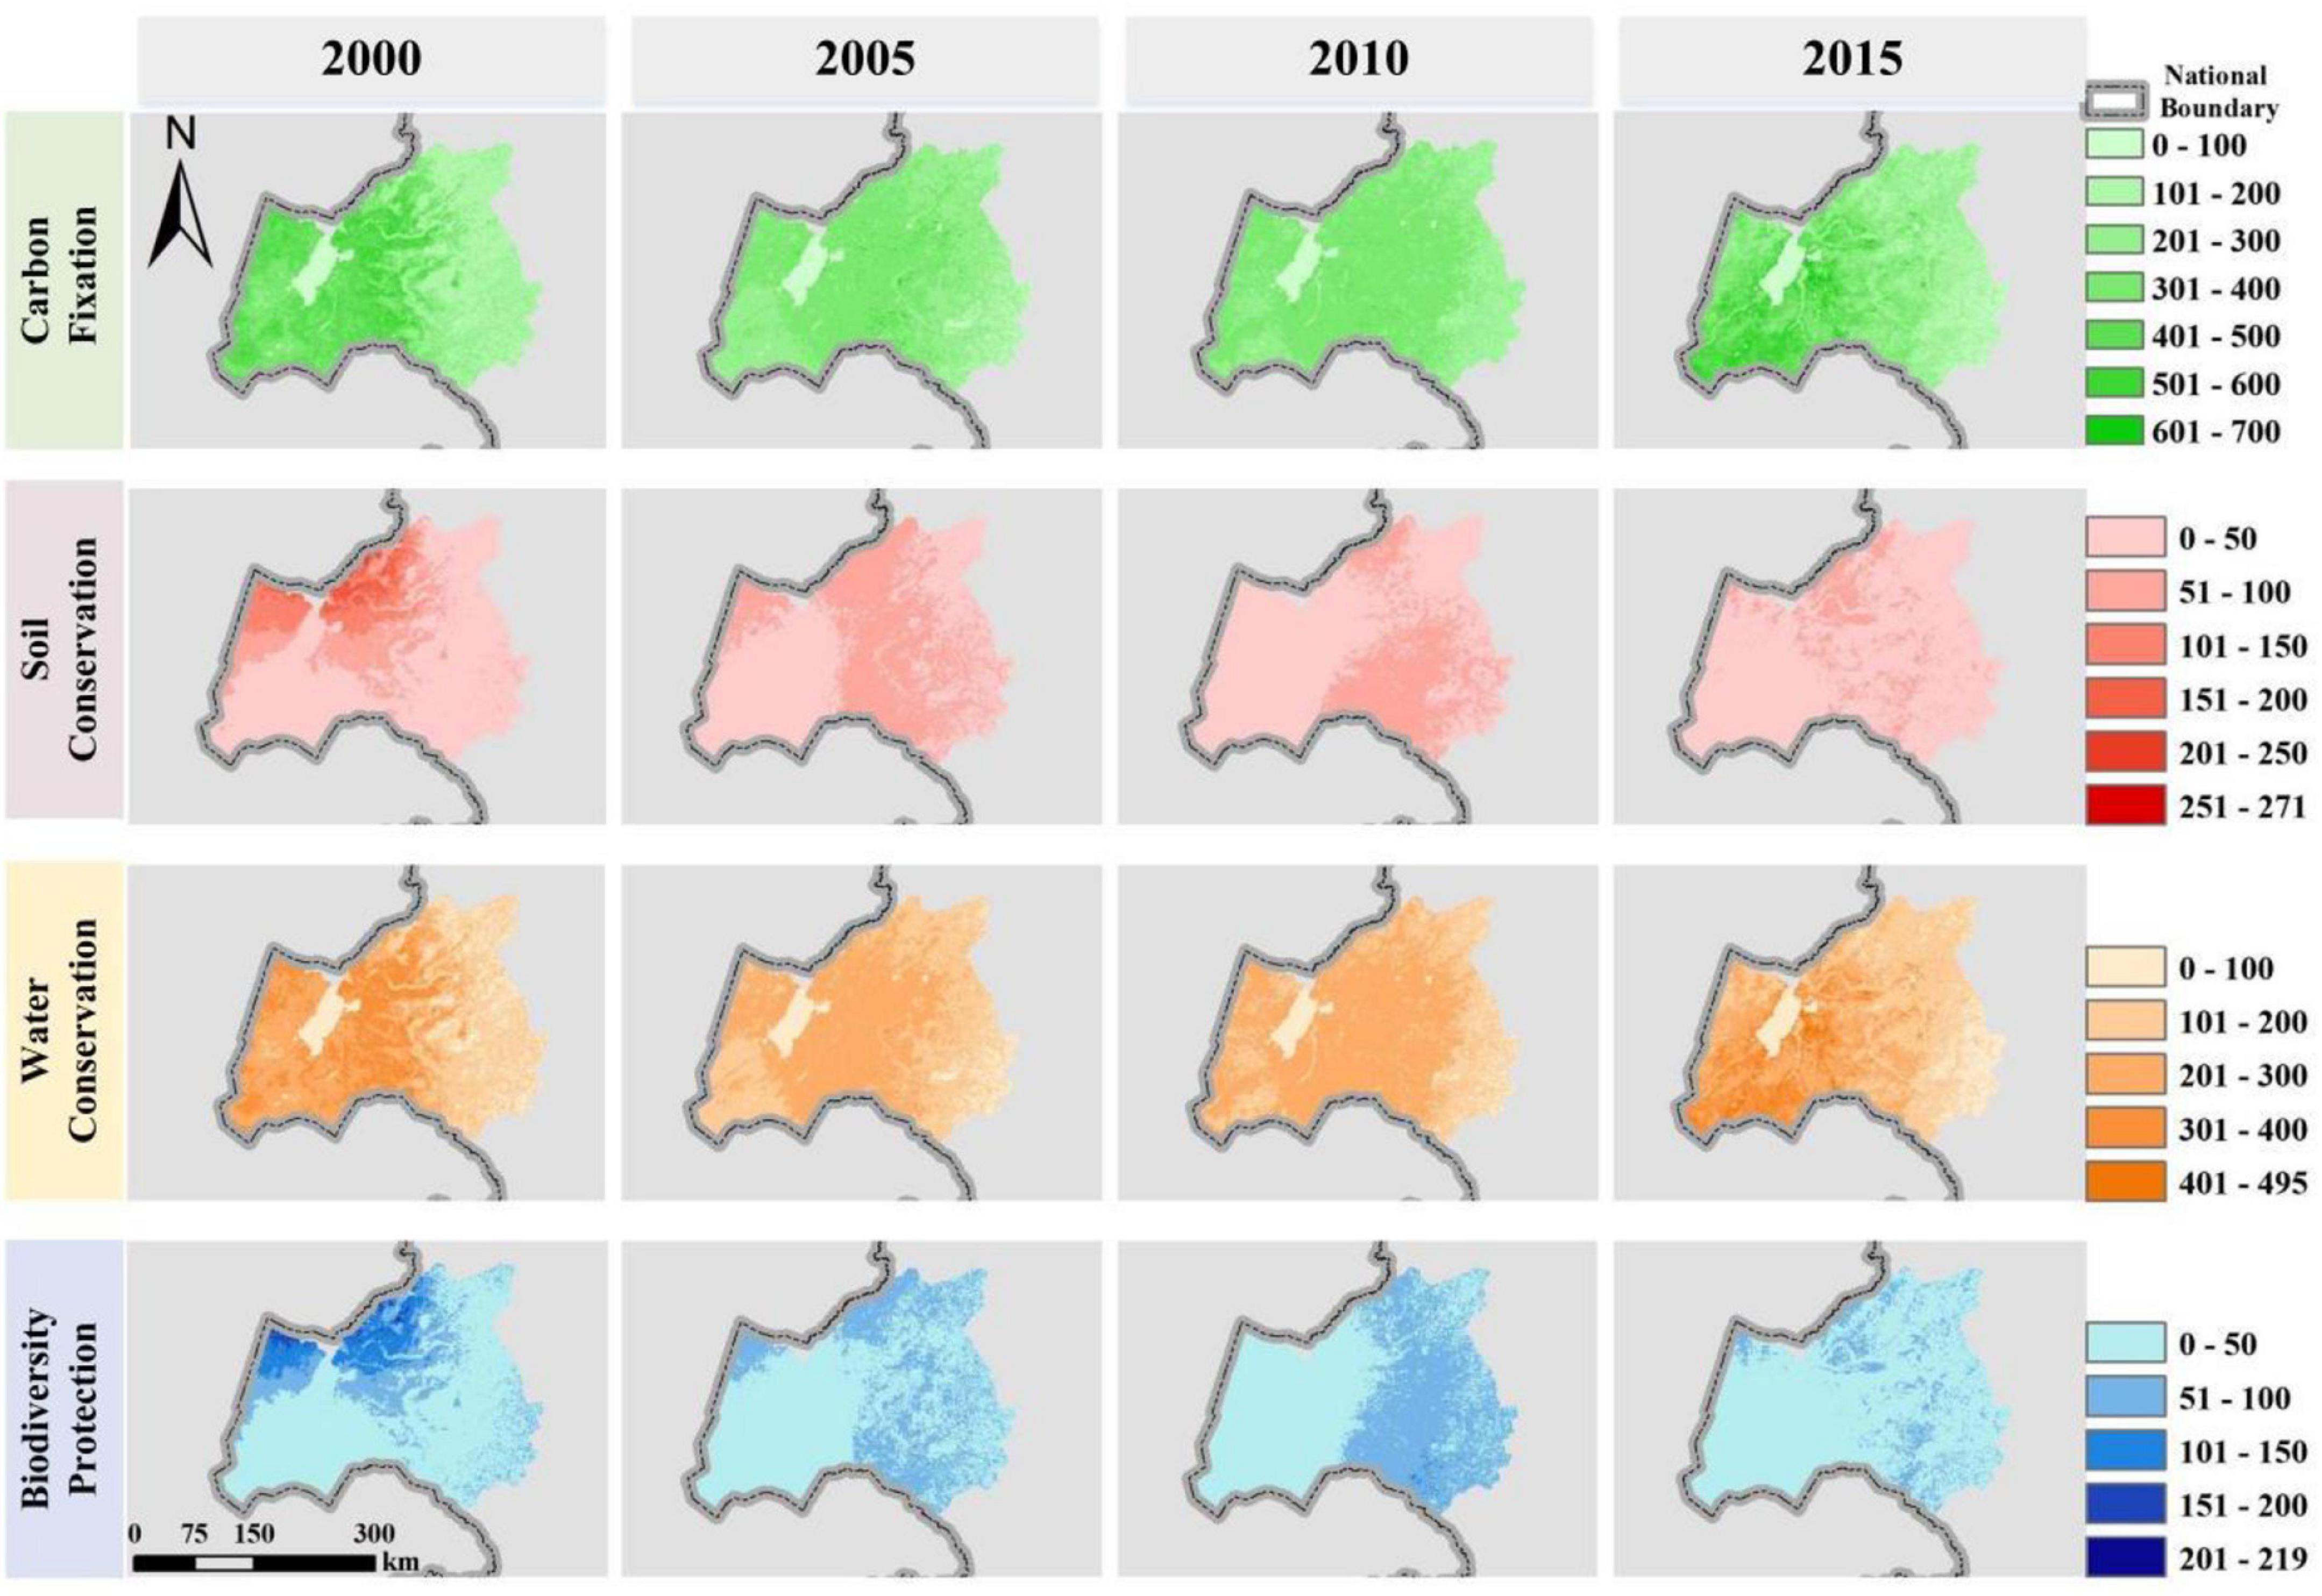
Figure 5. Spatial distributions of ecosystem services in 2000–2015.
In general, the spatial and temporal changes in the Hulunbuir grassland area have experienced the concentrated distribution of higher ESs in the northwestern region and gradually eased the uniform distribution changes in the eastern region. This is mainly due to the ecological restoration work in recent years.
Analysis results of the driving mechanisms on changes in grassland ESs in Hulunbuir are shown in Table 1. The results showed that the model passed the 1% significance test, which indicated that the overall fitting is better. Among natural environmental factors, slope, temperature, annual precipitation, and lighting time all passed the 1% significance test, which showed that the above variables could affect changes in grassland ESs. The coefficient of variables shows that temperature variables have a smaller influence on grassland ESs mainly because the temperature is a stable and less dynamic factor and does not greatly change within a short amount of time. The coefficient of the precipitation variable was significantly positive, which indicated that precipitation has a significant positive effect on the growth of grassland vegetation and the increase in grassland ESs. The coefficient of the slope variable was negative, which shows that the higher the slope is, the worse the growth of grassland vegetation is; the smoother the slope is, the better the growth of grassland vegetation is. The coefficient of the sunshine time variable was also negative, indicating that, when sunshine time exceeds a certain limit, the heat flux of the soil, transformed by the absorbing solar shortwave radiation, accelerates the evaporation of soil moisture, which is unfavorable to the growth of grassland vegetation. The research by Hu et al. (2019) obtained a similar conclusion.

Table 1. Results of panel model regression.
Among topographical factors, the distance from a water source was significantly positive, indicating that it is an important factor in explaining grassland ESs. Water sources are an important factor for grassland growth. As the distance to a water source increases, the more fragile the grassland ecosystem becomes, and the worse the grassland growth is. The distance from expressways and grass area per unit area is negatively affected, and this variable represents the degree to which grassland is disturbed by human activities. The nearer an expressway is, the more disturbed the grassland is by human activities, the worse the environment of grassland vegetation growth is, and the smaller the unit area of grassland is.
Among soil attribute factors, N, P, and K variables all passed the 1% significance test, in which the K variable had a significant positive effect on the growth of grassland ESs, while the N variable and P variable have an obvious negative influence. Related studies also showed that K is involved in the activation of over 60 enzyme systems, photosynthesis, the transportation of assimilation products, carbohydrate metabolism, and protein synthesis in the process of plant growth and development. Therefore, lodging, drought, and disease resistance can be improved, especially since the effect of the K fertilizer on the growth of leguminous forage is obvious (Read and Pratt, 2012).
Among social economic factors, the variable of GDP density could not explain the changes in grassland ES well. Although the variable of population density passed the significance test, the coefficient showed that it has a slightly negative effect on grassland ESs. As the population grows, urbanization deepens, rural populations shift to the cities, and the expansion of urban areas inevitably attacks the grassland ecosystem.
Among policy factors, analysis results showed that the policy of returning farmland to grassland has a negative effect on grassland ESs, which indicated that policy implementation has not played an expected role in the improving of the grassland ecological environment. Although we only took the policy of returning grazing to grassland as representative in this study, this variable passed a significant test, indicating that there is a strong correlation between the grassland ecological protection policy and the grassland ecological environment. Relevant studies also showed that the implementation of policies such as “grazing ban and conservation for purpose” and “returning grazing to grassland” has played a role in alleviating ecological pressure on natural grassland. However, the economic functions of the grassland system are neglected, which constrained the development of animal husbandry and the improvement of living standards of people to a certain extent. Illegal grazing is still prohibited, overgrazing is not fundamentally contained, and the resettlement program of ecological migration is not yet perfected, inflicting more poverty on people of herds. After the country has implemented ecological compensation, the current herdsmen who mainly rely on animal husbandry production, only rely on compensation to broaden their employment channels, and it will take a longer time to achieve the purpose of changing their lifestyles. However, relevant national policies are of great significance for enhancing the vitality of the regional economy and mobilizing the enthusiasm of farmers and herdsmen for production. In the process of implementing the policy, there have been some problems, such as quadratic disequilibrium in the process of policy resource distribution, a lack of effective supervision of the compensation fund, and the contradiction between ecological and economic benefits and between ecological welfare and benefits. Although the essence of implementing a grass-livestock balance policy is to ease the contradiction between ecological and productive functions, there are problems with implementing ecological protection and construction projects that make it difficult to form specific and feasible effective programs. Partial problems exist: there is no organic integration with innovations in the development model of grassland in pastoral areas, and there is a lack of balance between ecological and economic functions; clarifying and solving these problems is the next main task.
This study used a set of quantitative surrogate biophysical indicators to evaluate the capability of grassland ESs (i.e., carbon fixation, soil protection, water purification and provision, and biodiversity conservation) in the Hulunbuir grassland in 2000–2015. This was connected with the econometric model, location, and land use from the natural environment, terrain, soil properties, and policy aspects of in-depth analysis on its change mechanism, basically leading to the following conclusion: grassland ES assessment results showed that, in 2009–2012, each downward trend of the ES index was more obvious; in 2013 and 2015, indicators K improved but were still below the 2000 level overall. The K content of the soil is an important factor affecting ESs and needs to be focused on in future grassland conservation. Social and economic factors such as population and GDP have a relatively small impact on grassland ecosystems with natural attributes, but the intensity of grassland grazing also needs to be considered to prevent the degradation of grassland ecosystem functions caused by overgrazing. In addition, climatic, topographic, soil, socioeconomic, and grassland-management policies all have a significant impact on grassland ESs. Among them, factors such as increased precipitation, distance from water sources, and potash use all play a positive role in improving grassland ESs. In recent years, in the view of the prairie regions of worsening of the ecological environment, the continuous reduction in grassland area, and grassland quality problems such as decreasing area, the state has carried out many ecological protection and construction projects for the implementation of a series of policies for the protection of grassland ecology. However, the grassland area is shrinking, and the grassland ecological deterioration trend is not fundamentally curbed, and the ecological protection policy did not achieve the desired effect and partly inhibits the growth of the regional economy, so it is difficult to improve the people’s living standards with the contradiction between the ecological protection and economic growth.
Since 2003, China’s grain output has been on the rise and increased for the 12th year in 2015, which is of great positive significance to ensuring Chinese self-sufficiency in grain rations and maintaining food security (Wang et al., 2018). For nearly 10 years, China has imported beef and mutton, liquid milk, and milk powder almost every year; its self-sufficiency grain rate dropping is a serious threat to national food security (Huang et al., 2017). On the other hand, due to domestic food not matching actual market demand, it is much less popular than imported food. Due to the grain-production inventory overload, autumn grain purchases at the end of 2015, China’s three major staple food stocks were recorded high; in the agricultural-product market, excessive food products exist between the supply of and higher demand for animal food products. Meanwhile, China imported more than 100 million tons of grain in 2015. Under the impact of the high national grain-production inventory and the continuous increase in imported grain, the purchase price of grain in China has dropped to different degrees, and the income of growing grain has decreased. In addition, due to the backward agricultural production mode in China, an increase in the grain yield can only rely on the extensive resource input, including the massive consumption of water resources, and the extensive use of fertilizers and pesticides, which have caused a series of environmental problems and made it difficult to achieve sustainable development.
The main reason for problems of agricultural structures in China, such as the structures of grain production and consumption not matching, extensive resources, the unreasonable layout of agricultural production, and agricultural industry proportion coordination, is that agricultural production equal to “production” has yet to change its traditional thinking, backward agricultural production mode, and has not been paying enough attention to grassland productivity. In grassland areas, the contradiction between ecology and production function produces the contradiction of supply and demand on the market, so it is required to adjust agricultural structures and modes of production while protecting grassland ecological security to achieve the optimal allocation of grassland resources, reasonably and fully utilizing the grass production function, and improving the supply of high-quality animal products on the market. All these in order to meet the growing demand of people for a better life, speed up the development of the grass industry and improve the level of pastoral life and the vitality of the regional economic development, so as to realize the sustainable development of grassland areas. In 2015, Central File No. 1, for the first time, put forward speeding up the development of grass-based livestock husbandry in combination with support grass planting, and feeding is combined with planting and raising modes to promote the combination of grain, cash crops, the coordinated development of grass ternary planting structures, and the protection of grassland to realize a win-win of ecological and economic benefits.
The raw data supporting the conclusions of this article will be made available by the authors, without undue reservation.
ML wrote the article and did the laboratory analysis. XW contributed to the field analysis, while the latter also conceptualized the research. ML, XW, and JC provided conceptual and editorial inputs on the manuscript and discussed field methodology. All authors contributed to the article and approved the submitted version.
This study was supported by the Strategic Priority Research Program of the Chinese Academy of Sciences (XDA23070402).
The authors declare that the research was conducted in the absence of any commercial or financial relationships that could be construed as a potential conflict of interest.
The reviewer YX declared a shared affiliation, with no collaboration, with several of the authors JC and ML to the handling editor at the time of the review.
All claims expressed in this article are solely those of the authors and do not necessarily represent those of their affiliated organizations, or those of the publisher, the editors and the reviewers. Any product that may be evaluated in this article, or claim that may be made by its manufacturer, is not guaranteed or endorsed by the publisher.
We are also grateful to reviewers for their helpful comments on the manuscript.
Barral, M. P., and Oscar, M. N. (2012). Land-use planning based on ecosystem service assessment: A case study in the Southeast Pampas of Argentina. Agric. Ecosyst. Environ. 154, 34–43. doi: 10.1016/j.agee.2011.07.010
Burkhard, B., Crossman, N., Nedkov, S., Petz, K., and Alkemade, R. (2013). Mapping and modelling ecosystem services for science, policy and practice. Ecosyst. Serv. 4, 1–3. doi: 10.1016/j.ecoser.2013.04.005
Carreño, L., Frank, F., and Viglizzo, E. (2012). Tradeoffs between economic and ecosystem services in Argentina during 50 years of land-use change. Agric. Ecosyst. Environ. 154, 68–77. doi: 10.1016/j.agee.2011.05.019
Castellani, V., Sala, S., and Benini, L. (2017). Hotspots analysis and critical interpretation of food life cycle assessment studies for selecting eco-innovation options and for policy support. J. Clean. Prod. 140, 556–568. doi: 10.1016/j.jclepro.2016.05.078
Costanza, R., d’Arge, R., de Groot, R., Farber, S., Grasso, M., Hannon, B., et al. (1997). The value of the world’s ecosystem services and natural capital. Nature. 387, 253–260. doi: 10.1038/387253a0
Daily, C. C. (1997). Nature’s Service: Societal Dependence on Natural Ecosystems. Washington, DC, USA: Island Press.
Daily, G. C., Polasky, S., and Goldstein, J. (2009). Ecosystem services in decision making: time to deliver. Front. Ecol. Environ. 7:21–28. doi: 10.1890/080025
Deng, X., Gibson, J., and Wang, P. (2017). Quantitative measurements of the interaction between net primary productivity and livestock production in Qinghai Province based on data fusion technique. J. Clean. Prod. 142, 758–766. doi: 10.1016/j.jclepro.2016.05.057
Eigenbrod, F., Armsworth, P. R., Anderson, B. J., Heinemeyer, A., Gillings, S., Roy, D. B., et al. (2010). Error propa-gation associated with benefits transfer-based mapping of ecosystem services. Biol. Conserv. 143, 2487–2493. doi: 10.1016/j.biocon.2010.06.015
Fang, J., Yang, Y., Ma, W., Mohammat, A., and Shen, H. (2010). Ecosystem carbon stocks and their changes in China’s grasslands. Sci. China Life Sci. 53, 757–765. doi: 10.1007/s11427-010-4029-x
Hu, Z., Zhao, Z., Zhang, Y., Jing, H., Gao, S., and Fang, J. (2019). Does ‘Forage–Livestock Balance’ policy impact ecological efficiency of grasslands in China? J. Clean. Prod. 207, 343–349. doi: 10.1016/j.jclepro.2018.09.158
Huang, J., Wei, W., Cui, Q., and Xie, W. (2017). The prospects for china’s food security and imports: will china starve the world via imports? J. Integr. Agric. 16, 2933–2944. doi: 10.1016/S2095-3119(17)61756-8
Koschke, L., Fürst, C., Frank, S., and Makeschin, F. (2012). A multi-criteria approach for an integrated land-cover-based assessment of ecosystem services provision to support landscape planning. Ecol. Indic. 21, 54–66. doi: 10.1016/j.ecolind.2011.12.010
Liebig, M. A., Gross, J. R., Kronberg, S. L., and Phillips, R. L. (2010). Grazing management contributions to net global warming potential: A long-term evaluation in the Northern Great Plains. J. Environ. Qual. 39, 799–809. doi: 10.2134/jeq2009.0272
Plummer, M. L. (2009). Assessing benefit transfer for the valuation of ecosystem services. Front. Ecol. Environ. 7:38–45. doi: 10.1890/080091
Read, J. J., and Pratt, R. G. (2012). Potassium influences forage bermudagrass yield and fungal leaf disease severity in Mississippi. Online. Forage Grazinglands 10, *. doi: 10.1094/FG-2012-0725-01-RS
Reid, W. V., Watson, R. T., Rosswall, T., Steiner, A., Mooney, H. A., Arico, S., et al. (2005). Millennium Ecosystem Assessment: Ecosystems and Human Well Being - Synthesis Report. Washington DC: Island Press.
Vadas, P. A., Krogstad, T., and Sharpley, A. N. (2006). Modeling phosphorus transfer between labile and nonlabile soil pools. Soil Sci. Soc. Am. J. 70:736. doi: 10.2136/sssaj2005.0067
Wang, J., Zhang, Z., and Liu, Y. (2018). Spatial shifts in grain production increases in china and implications for food security. Land Use Policy 74, 204–213. doi: 10.1016/j.landusepol.2017.11.037
Wang, P., Deng, X., and Jiang, S. (2019). Global warming, grain production and its efficiency: Case study of major grain production region. Ecol. Indic. 105, 563–570. doi: 10.1016/j.ecolind.2018.05.022
Wang, Z., Deng, X., Song, W., Li, Z., and Chen, J. (2017). What is the main cause of grassland degradation? A case study of grassland ecosystem service in the middle-south Inner Mongolia. Catena. 150, 100–107. doi: 10.1016/j.catena.2016.11.014
Woodruff, S. C., and Bendor, T. K. (2016). Ecosystem services in urban planning: Comparative paradigms and guidelines for high quality plans. Landsc. Urban Plan. 152, 90–100. doi: 10.1016/j.landurbplan.2016.04.003
Zagonari, F. (2016). Using ecosystem services in decision-making to support sustainable development: Critiques, model development, a case study, and perspectives. Sci. Total Environ. 54, 25–32. doi: 10.1016/j.scitotenv.2016.01.021
Zhang, L., Lü, Y., Fu, B., Dong, Z., Zeng, Y., and Wu, B. (2017). Mapping ecosystem services for China’s ecoregions with a biophysical surrogate approach. Landsc. Urban Plan. 161, 22–31. doi: 10.1016/j.landurbplan.2016.12.015
Zhao, M., and Running, S. W. (2010). Drought-Induced Reduction in Global Terrestrial Net Primary Production from 2000 through 2009. Science. 329, 940–943. doi: 10.1126/science.1192666
Keywords: ecosystem services, spatial distribution, driving mechanism, Hulunbuir, grassland
Citation: Li M, Wang X and Chen J (2022) Assessment of Grassland Ecosystem Services and Analysis on Its Driving Factors: A Case Study in Hulunbuir Grassland. Front. Ecol. Evol. 10:841943. doi: 10.3389/fevo.2022.841943
Received: 23 December 2021; Accepted: 07 January 2022;
Published: 11 February 2022.
Edited by:
Fan Zhang, Institute of Geographic Sciences and Natural Resources Research, Chinese Academy of Sciences (CAS), ChinaReviewed by:
Yanmin Teng, Dongguan University of Technology, ChinaCopyright © 2022 Li, Wang and Chen. This is an open-access article distributed under the terms of the Creative Commons Attribution License (CC BY). The use, distribution or reproduction in other forums is permitted, provided the original author(s) and the copyright owner(s) are credited and that the original publication in this journal is cited, in accordance with accepted academic practice. No use, distribution or reproduction is permitted which does not comply with these terms.
*Correspondence: Jiancheng Chen, Y2hlbmpjX2JqZnVAMTI2LmNvbQ==
Disclaimer: All claims expressed in this article are solely those of the authors and do not necessarily represent those of their affiliated organizations, or those of the publisher, the editors and the reviewers. Any product that may be evaluated in this article or claim that may be made by its manufacturer is not guaranteed or endorsed by the publisher.
Research integrity at Frontiers
Learn more about the work of our research integrity team to safeguard the quality of each article we publish.