
95% of researchers rate our articles as excellent or good
Learn more about the work of our research integrity team to safeguard the quality of each article we publish.
Find out more
ORIGINAL RESEARCH article
Front. Ecol. Evol. , 03 March 2022
Sec. Urban Ecology
Volume 10 - 2022 | https://doi.org/10.3389/fevo.2022.838591
This article is part of the Research Topic Distribution Patterns, Driving Mechanisms and Ecological Service Functions of Urban Plant Biodiversity View all 6 articles
 Lin-Yuan Guo1
 Mir Muhammad Nizamani1
 A. J. Harris2
 Qin-Wen Lin3
 Kelly Balfour4
 Liang-Jun Da5
 Salman Qureshi6
 Hua-Feng Wang1*
Non-native plants spread to recipient areas via natural or human-mediated modes of dispersal, and, if the non-native species are invasive, introduction potentially causes impacts on native plants and local ecosystems as well as economic losses. Therefore, we studied the diversity and distributional patterns of non-native plant species diversity in the tropical island province of Hainan, China and its relationships with environmental and socioeconomic factors by generating a checklist of species and subsequently performing an analysis of phylogenetic diversity. To generate the checklist, we began with the available, relevant literature representing 19 administrative units of Hainan and determined the casual, naturalized, or invasive status of each species by conducting field surveys within 14 administrative units. We found that non-native plants of Hainan comprise 77 casual species, 42 naturalized species, and 63 invasive species. Moreover, we found that non-native plant species had diverse origins from North and South America, Africa, and Asia and that the most common species across administrative areas belong to the plant families Asteraceae and Fabaceae. Moreover, the numbers of non-native species distributed in the areas of Hainan bording the coast arer greater than those within interior areas of the province. Among the coastal areas, Haikou has the highest species richness and, simultaneously, the highest values for significantly, positively correlated predictor variables, population and GDP (R2 = 0.60, P < 0.01; R2 = 0.64, P < 0.01, respectively). In contrast, the landlocked administrative units of Tunchang and Ding’an have the smallest number of non-native species, while their populations are less than a quarter of that of Haikou and their GDP less than one tenth. Among natural environmental variables, we determined that the number of non-native species had the strongest correlation with the minimum temperature in the coldest month, which predicts a smaller number of non-native species. Additionally, non-native species are primarily distributed in urban and rural built-up areas and agricultural areas; areas that are dominated by human activities. Overall, our study provides a working checklist of the non-native plants of Hainan as well as a theoretical framework and reference for the control of invasive plants of the province.
Non-native species invasions have emerged as a major global environmental and economic issue (Liu et al., 2017; Xiong et al., 2018; Ju et al., 2020; Zhou et al., 2020) and are one of the leading causes of biodiversity loss worldwide (Guo et al., 2020). Therefore, studying non-native species, including potential invasives, is important for understanding their local diversity and distributions. The diversity and distributions of non-native species are known to be driven by socio-economic variables, which influence the time and pathways for and number of species to be introduced to recipient locations, and by natural environmental variables, which affect how many species are able to persist in these new locations (Kull et al., 2011; Tassin and Kull, 2015; Blackburn et al., 2016; Early et al., 2016; Dyer et al., 2017; Vaz et al., 2017; Bellard et al., 2018). With respect to invasive species specifically, their diversity and distributions are often attributable to extensive worldwide trade and transportation (Sardain et al., 2019), although cultural preferences for non-native species that happen to be invasive are also an underlying cause (Wang et al., 2011; Schelhas et al., 2021). Introduction of potentially invasive species often relies on economic and social activities, so wealthier and more populated countries or local areas may accidentally or deliberately import more invasive species (Zhai et al., 2018). Moreover, for all non-native species, including invasives, the environmental conditions of the native range can often accurately predict the invaded range (Wang et al., 2011; Beans et al., 2012). In particular, temperature and precipitation affect the distribution of non-native plants; specifically extreme cold and limited precipitation have a negative impact on non-native species richness (Beans et al., 2012). Previous studies have usually only focused on the impact of either natural environmental or socio-economic variables on the diversity and distribution of non-native plants. In contrast, our study, as explained below, comprehensively considers both types of variables as potential driving forces of the diversity and distributional patterns of non-native plants within the Chinese island province of Hainan.
Hainan boasts a tropical climate and lush forests that are rich in animal and plant diversity (Nunes Leonel et al., 2020) and is one of the most valuable biodiversity conservation areas in China (Zhang, 1998; IUCN, 2013; Wang et al., 2016). Hainan is economically strategically located between the mainland and Pacific Ocean and is an important maritime channel for China to connect with Southeast Asia and other regions (Cheng et al., 2021). Thus, Hainan has been at the forefront of Chinese economic policy reform (Central Committee of the Communist Party of China, and National Assembly of the PRC, 2018, 2020; NPC Standing Committee, 2021) and is home to a major port within China’s Belt and Road project (China National Development and Reform Commission et al., 2015). This project, and the construction of free trade ports in recent years, has promoted considerable foreign trade within Hainan. Moreover, Hainan attracts many domestic and foreign tourists (Lin, 2021), with 76,273,900 tourists visiting in 2018; an increase of 13.08% from 2017. The tourism revenue during this period was approximately 950.16 billion Yuan, an increase of 17.14% from the previous year (Hainan Provincial Bureau of Statistics, 2019). Trade and tourism are known to be positively correlated with non-native species, especially invasive; for example, ore trade increases the risk of plant invasions by sea and commercial vehicles (Lin et al., 2021), and patterns of tourism impact the arrival of invasive species intentionally and accidentally via the travel choices of visitors (González et al., 2008).
The introduction of non-native species to Hainan increases the risk of species invasions. The most current island-wide studies of non-native species are Shan and Wang (2011), who reported 140 species in 82 genera (see also Shan, 2003; Shan et al., 2006), and Peng et al. (2013), who reported 158 non-native plant species in 39 families and 117 genera. However, these previous studies neither clarified the invasive status of each non-native plant species nor inferred the driving forces behind their distributional patterns.
In this study, we compiled a comprehensive list of non-native plant species for each administrative unit (city or county) within Hainan based on field surveys and data from existing literature, and we used the list to gather molecular sequence data and perform an analysis of phylogenetic diversity. Within our study we addressed two main questions: (1) How are non-native plant species distributed across Hainan, and (2) What are the main socio-economic and natural environmental factors affecting their distributional? We especially sought to provide information for resource managers and policymakers to guide their efforts to limit the spread of invasive species on Hainan, and our work may have implications for other tropical islands, which are understudied in terms of non-native species distributions and plant species invasions (Fridley et al., 2007).
In this study, we categorized “non-native” species as those species that are not necessarily inherently dangerous but have spread beyond their native range or are being widely introduced into a new area. Non-native species are also sometimes called foreign species, alien species, and non-indigenous species (Jeschke and Strayer, 2005). We further divided non-native species into casual, invasive, and naturalized species. Among these, “casual” species as those that do not have self-replacing populations (Booth et al., 2003), while “naturalized” species are those that reproduce and maintain non-native populations without direct human interference, often producing abundant offspring typically in close proximity to parent plants, but largely lacking the ability to invade existing natural or semi-natural vegetation (Richardson et al., 2010). We use the term “invasive” to refer to non-native species that have all the characteristics of naturalized species but can also spread widely and/or quickly within natural areas and that have adverse effects, such as causing obvious damage or posing potential threats to natural habitats, ecosystems, and/or the economy (IUCN, 2013; McNeely, 2013). The term invasive species is similar to “transformers” or “weeds” as defined by Richardson et al. (2000) and Pyíek et al. (2003).
To develop a comprehensive list of the non-native vascular flora of Hainan, we first used relevant literature and national databases. We obtained papers from Scopus1 from October 2020 to May 2021 using the search terms “Hainan non-native species,” “Hainan invasive species,” and “Hainan Flora.” We also reviewed major regional floristic works, especially the Flora of China (Flora of China Editorial Committee, 2018) and the Flora Reipublicae Popularis Sinicae (Ma and Clemants, 2006), floras of the nearby provinces of Taiwan and Hong Kong (Li, 1975; South China Botanical Garden of Chinese Academy of Sciences and Hong Kong Herbarium, 2007–2011), and related references (e.g., Shan et al., 2006; Hu et al., 2011; Zhang and Xing, 2011; Ma et al., 2013; Peng et al., 2013; Yang et al., 2015). Moreover, we obtained a list of non-native plant species list for Hainan from China’s knowledge-base website,2 which is a key national research service led by Tsinghua University and supported by the People’s Republic of China Ministry of Education, the People’s Republic of China Ministry of Science, the Chinese Communist Party’s Propaganda Department, and the People’s Republic of China General Administration of Press and Publication. For each non-native species among all sources, we determined its invasive status using authoritative lists or compendiums, especially China’s non-native species list (Ministry of Environmental Protection, the People’s Republic of China [MEP-PRC], 2014), the Global Invasive Species Database,3 and the Global Compendium of Weeds.4 Species were also inferred as invasive in Hainan if they were listed as invasive elsewhere in the world. For casual and naturalized species, we determined their status based on fieldwork (see below). After obtaining and curating data from these sources, we performed taxonomic reconciliation based on the backbone taxonomy of the China Natural Herbarium.5
Hainan is divided into 19 administrative units. For these administrative units, we used the initial survey data from literature and database sources to determine the presence or absence of each non-native plant species, and we performed fieldwork for 14 of these: Haikou, Sanya, Wuzhishan, Wenchang, Qionghai, Wanning, Chengmai, Danzhou, Dongfang, Ledong, Qiongzhong, Baoting, Lingshui, and Changjiang (Figure 1). We conducted fieldwork from November 2015 to July 2016 at sites primarily along Hainan’s major, highly trafficked roadways, including along West Line Road (G225), Middle Road (G224), Dart Road (S304), East Road (G223), and Western High-Speed Road (G98). At these sites, we consulted local experts to learn the locations of populations of non-native species and completed surveys within vegetation plots (see the section “Field Survey Methods” of “Materials and Methods).
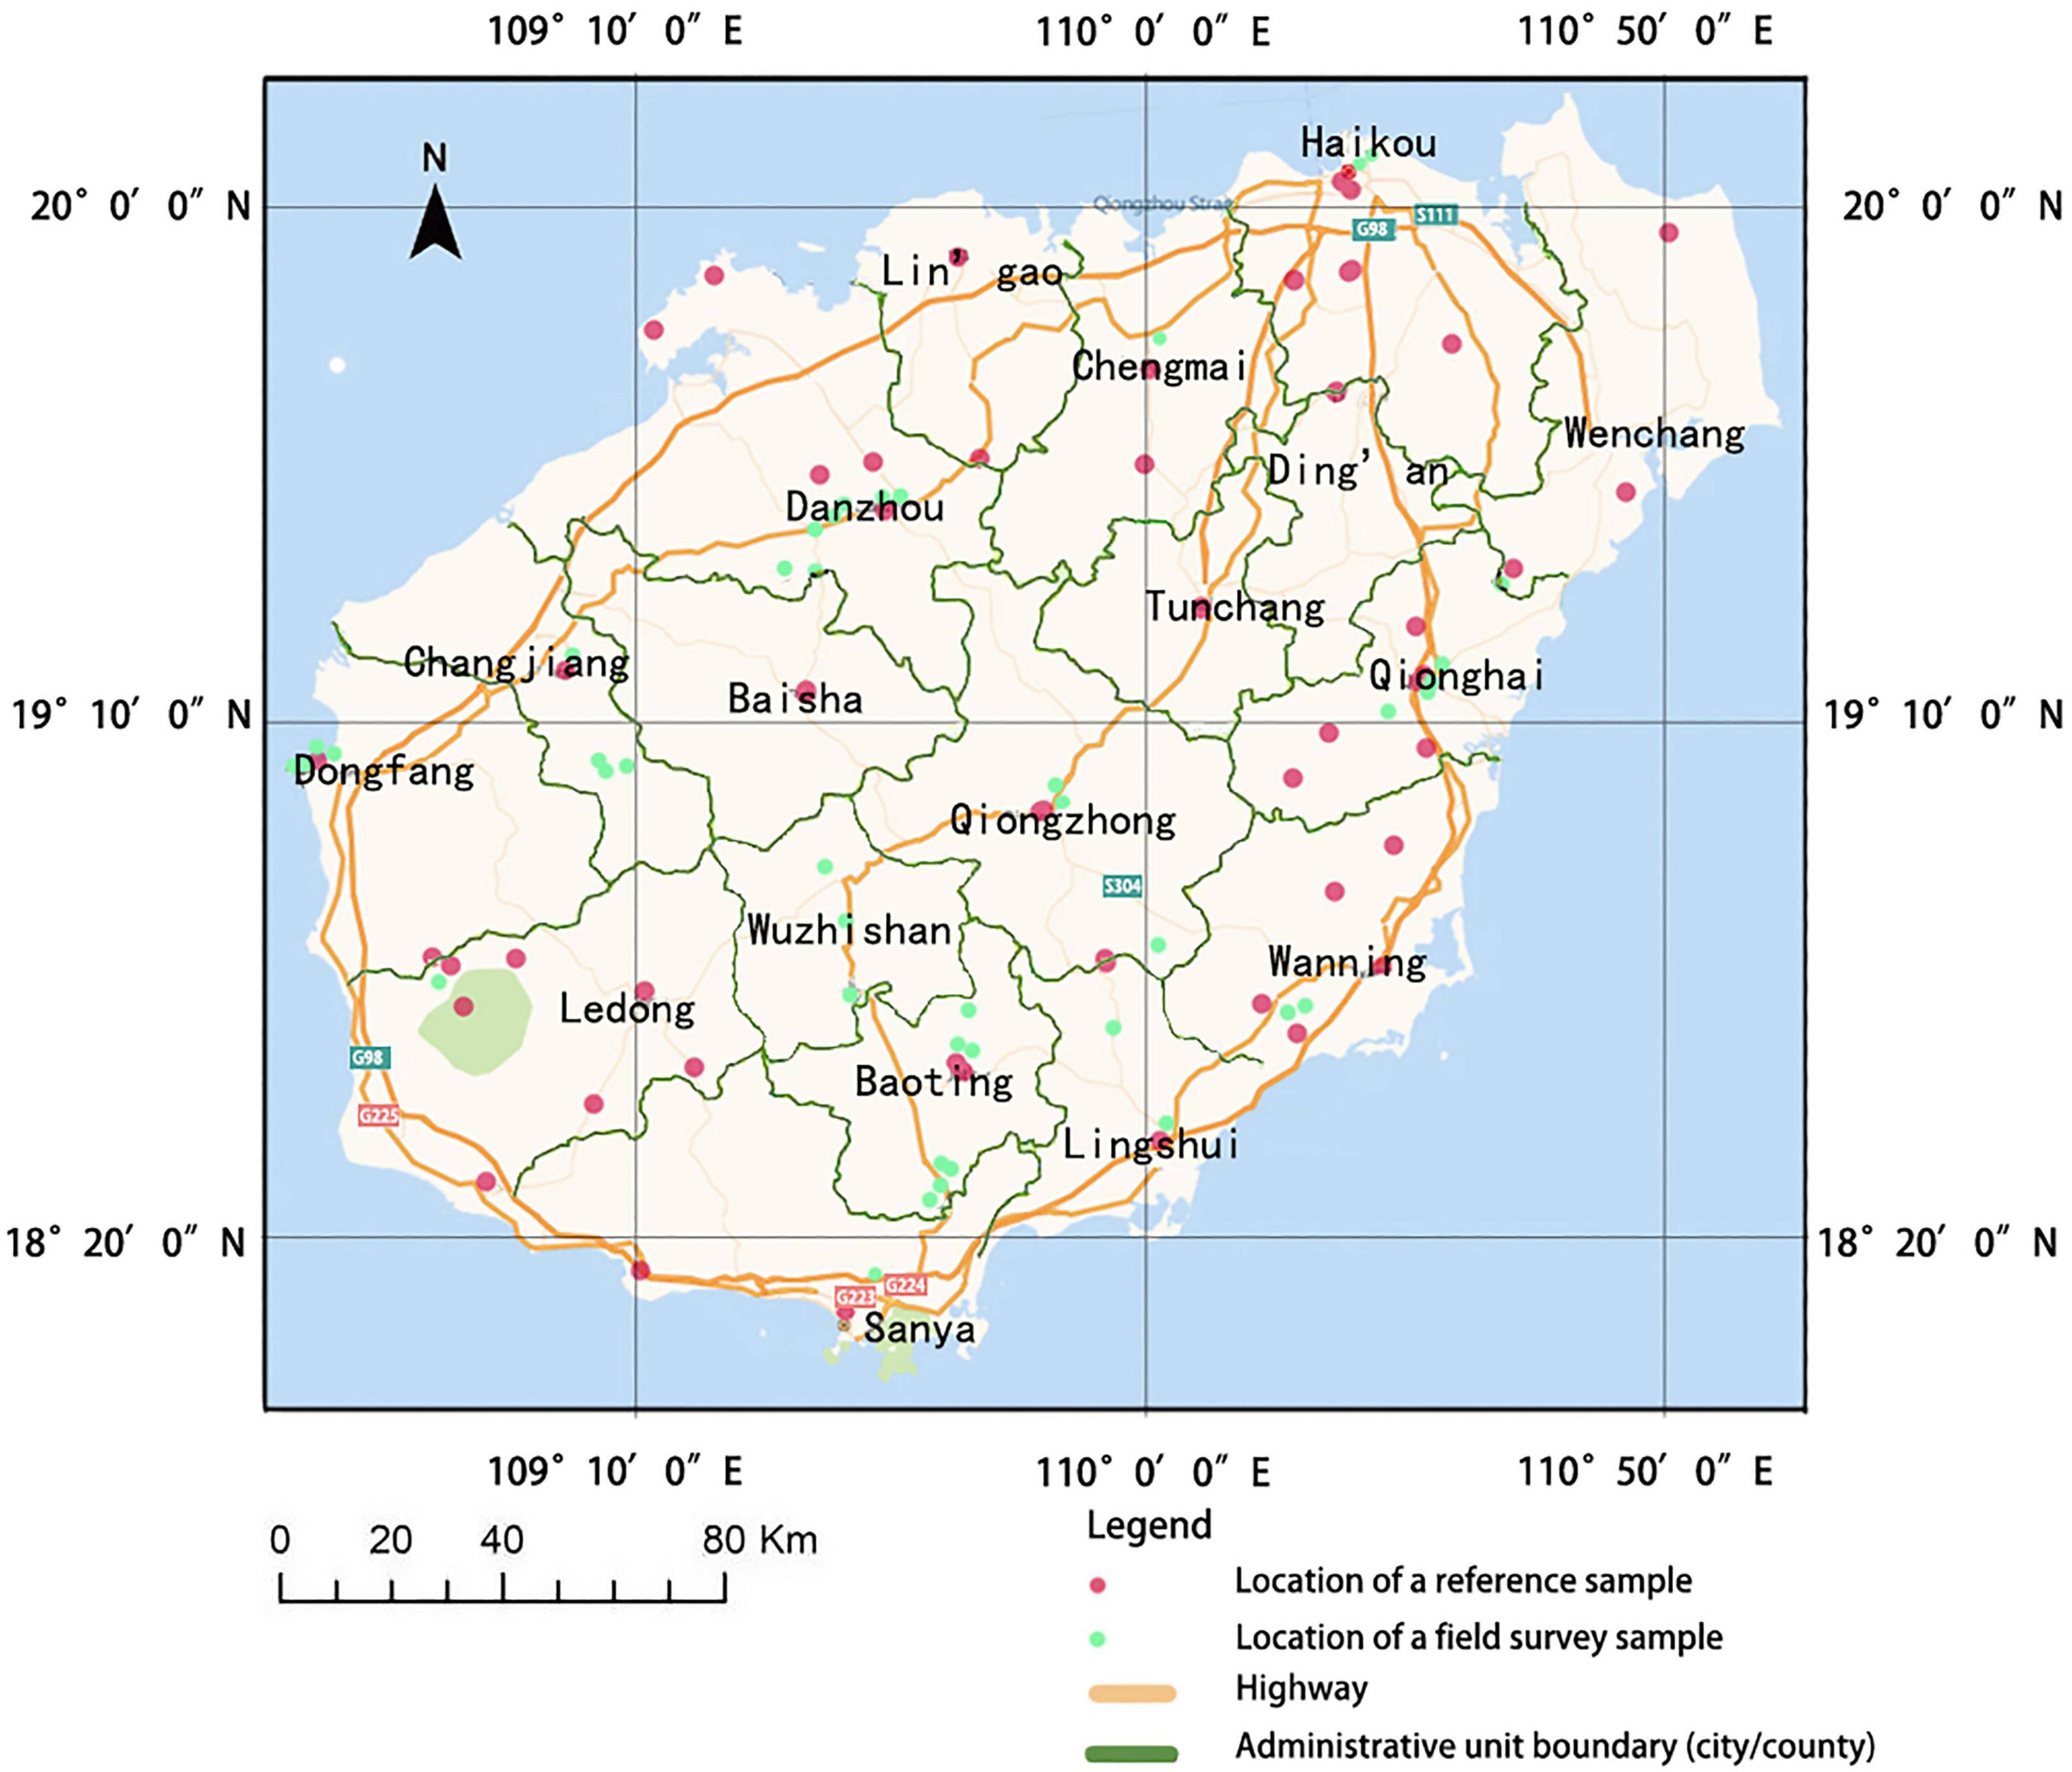
Figure 1. The locations of the sample plots in 19 administrative units of Hainan Island, China.
We selected vegetation plots representative of local plant diversity and richness. We examined potential sites based on conversations with local people, or walked several transects from the road to assess the local vegetation and ultimately to find an area for a plot with high species richness. Each vegetation plot comprised one large tree plot (20 m × 20 m) containing five shrub plots (5 m × 5 m) and five plots for sampling both herbs and vines (1 m × 1 m). The shrub, herb and vine plots were located at the four corners and center of the tree plot. We followed the Food and Agriculture Organization of the United Nations to define trees, shrubs, vines, and herbs. In brief, trees are woody perennial plants with a single main stem and a more-or-less distinct crown. Shrubs are woody perennial plants lacking a distinct crown and usually with heights between 0.5 and 5 m. We did not encounter species polymorphic for the tree and shrub habit. Vines are plants with relatively slender stems that can climb, creep, or trail, but cannot grow upright on their own and must be attached to other things to achieve height (FAO, 1998, 2004; UNECE/FAO, 2000). Herbs are all other vascular plant species and are usually annuals. Within plots, we identified species according to the backbone taxonomy of the China Natural Herbarium (see text footnote 5), and checked them against our non-native species list. Although our field work did not include late summer to early autumn months, the seasonal change in tropical Hainan is limited and is not expected to affect the presence or absence of plant species.
In addition to establishing and surveying field plots, we also consulted with residents and experts to determine whether certain populations of non-native species were self-reproducing. If they were, we considered these species to be naturalized instead of casual. Our consultations with locals and our observations in the field allowed us to designate some of the naturalized species as “tentatively” or “potentially” invasive (i.e., species that grow faster and have a wider habitat distribution, which indirectly affects the growth of other plants through competition, causing damage to local habitats or ecosystems) in Hainan, but these species had no negative impacts elsewhere in the world according to the literature. Nevertheless, the magnitude and extent of the impacts of these species (either environmental or economically) were not assessed in this study and merit further research.
Ultimately, our fieldwork yielded a vetted list of non-native species and their status as casual, naturalized, or invasive within 14 of 19 administrative units of Hainan. We also obtained the distribution of non-native plants in the remaining five administrative units and their status as naturalized, casual, or invasive from the literature (see above). To determine whether biogeographic structures exist in the organization of plant families or plants with different growth habits in urban landscapes, and to attempt to examine the distribution and abundance of non-native species in different habitat types and their assemblages based on geographic and climatic sources, we determined the following information for each species: (i) plant family affiliation, (ii) annual, biennial, or perennial habit, (iii) habitat, (iv) native range, and (v) native climate zone. For plant family affiliation, we followed the taxonomy of Flora of China (Flora of China Editorial Committee, 2018), and to determine if a species was annual, biennial, or perennial, we used Baidu Encyclopedia (https://baike.baidu.com). We determined the native ranges of species using the Germplasm Resources Information Network (GRIN) of the United States Department of Agriculture (www.ars-grin.gov), Wiersema and León (2016), and the Flora of China (Flora of China Editorial Committee, 2018), assigning species ranges by continental areas: Asia, Europe, North America, South America, Africa, Oceania, and unknown native range. Asia and Europe were split by the Ural Mountains, while Oceania comprised mainland Australia and many islands. For habitats, we followed Wang et al. (2011), who based habitat classification on the Flora of China (Flora of China Editorial Committee, 2018), but also accounted for human influence. Habitats were (1) urban and rural built-up areas (i.e., places with many human-made structures), (2) agricultural areas, (3) grasslands and shrublands, (4) forests and forest margins, (5) inland rocky outcrops, (6) inland wetlands and other water bodies, and (7) coastal areas. Using land survey results from a governmental data sharing platform,6 we obtained the area of each type of habitat within Hainan and its percentage of the total land area (Table 1). This data is mainly derived from the Second National Land Change Survey and the 2010–1016 National Land Change Survey, using the national standard of the People’s Republic of China “Classification of Land Use Status.”
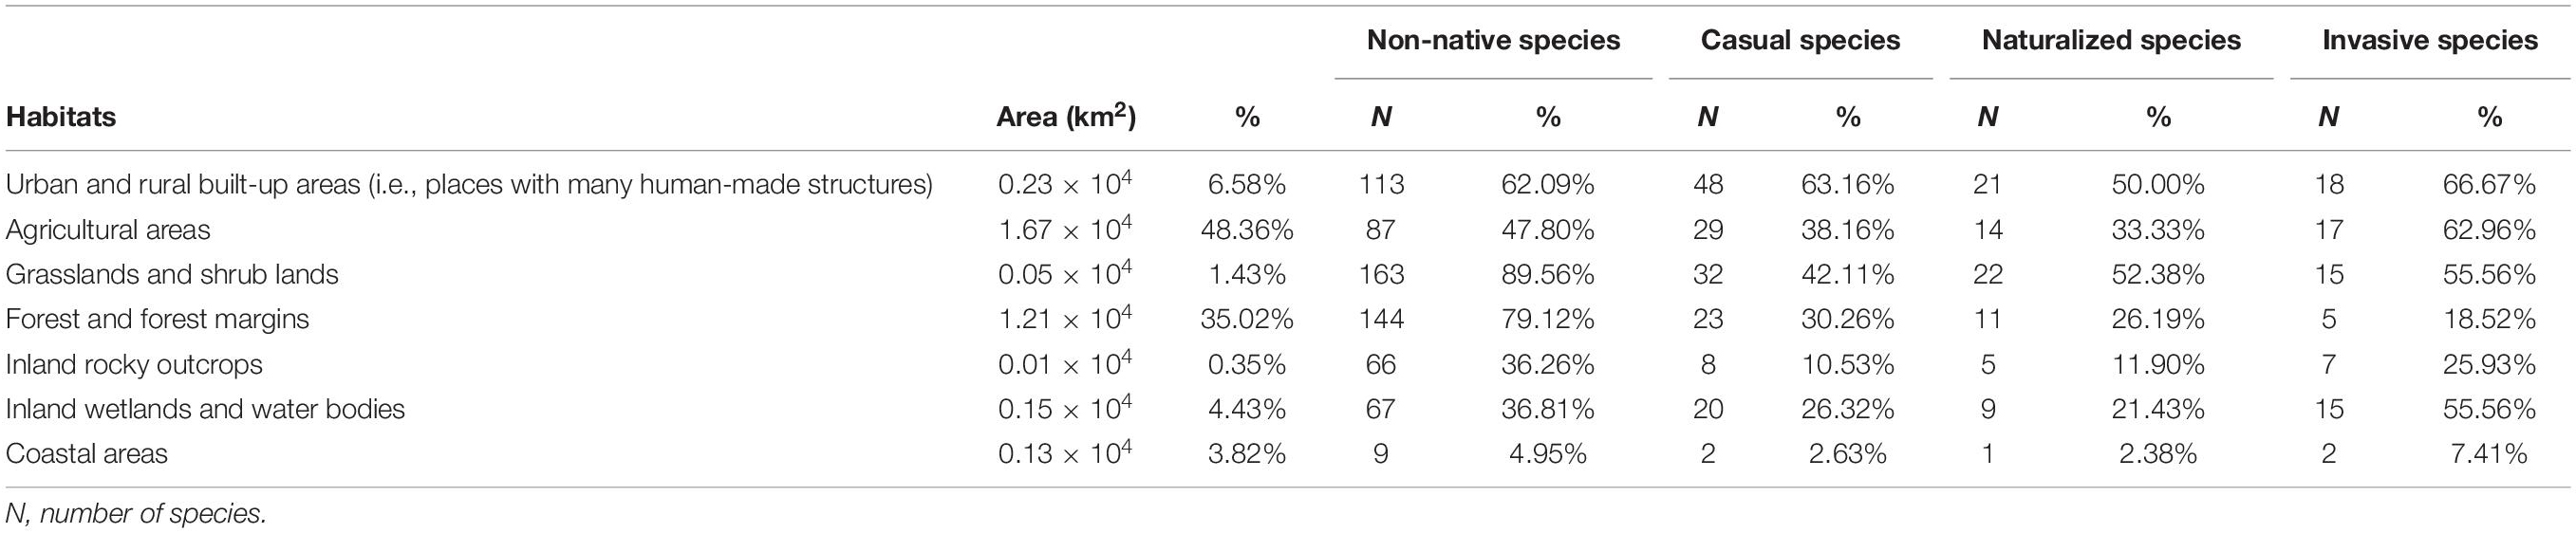
Table 1. The area and percentage of total area of each habitat, and the numbers and percentages of non-native and invasive species within each habitat.
To examine the drivers of geographic patterns of non-native species in Hainan, we investigated their distributional relationships to several socio-economic and natural environmental variables. To quantify the distributions of species we used our species list supplemented with field data and converted this to a presence/absence matrix for each of the 19 administrative units. For socio-economic variables, we measured (i) human population size, (ii) total agricultural revenue in 2013, (iii) industry revenue in 2013, (iv) total retail sales of social consumer goods for 2013, (v) number of tourists in 2013, (vi) bank deposits from residents in 2013, and (vii) GDP in 2013 for each administrative unit. We obtained these data from the Hainan Provincial Bureau of Statistics (2014), and we selected these variables because they are among the most important socio-economic determinates of non-native plant distributions globally (Sharma et al., 2010; Zhou et al., 2020; Gruber et al., 2021).
For natural environmental variables, we selected five variables of the Bioclim2 dataset from the WorldClim database,7 Data from this dataset represent averages over 30 years from 1970–2000 (Fick and Hijmans, 2017). For 19 administrative units, we obtained the following environmental varaobles: (1) minimum temperature of the coldest month (BIO6), (2) maximum temperature of the warmest month (BIO5), (3) mean temperature of the warmest quarter (BIO10), (4) mean temperature of the coldest quarter (BIO11), and (5) mean annual precipitation (BIO12). These variables are known to be key to determining land plant distributions (Harris et al., 2017; Cheval et al., 2020; Li et al., 2020; Xie et al., 2021; Zhu et al., 2021). Moreover, due to the well-known relationship between species diversity and area (Arrhenius, 1921; Barkman, 1989; Zhou et al., 2020), we also obtained land area data (km2). For all natural environmental variables, we acquired data at 30 arc second resolution, and for all variables including land area, we extracted values using ArcMap 10.8.
To measure the non-native plant diversity of each administrative unit, we used species richness as well as three metrics for each unit based on the phylogeny of species within each unit. These indices were: Faith’s phylogenetic diversity (PD), which is the sum of all phylogenetic distances, or branch lengths, within a phylogenetic tree; phylogenetic mean pairwise distance (MPD), which represents the mean distance between all possible pairs of species within a tree; and phylogenetic mean nearest taxon distance (MNTD), which is the mean distance between each species and its closest relative within the tree (Faith, 1992; Tucker et al., 2016). While PD is a measure of total diversity within a tree, MPD is more sensitive to diversity among deep nodes and MNTD is more sensitive to diversity at the tips.
For the measures of phylogenetic diversity, we constructed a phylogenetic tree including all vascular species and the non-native species in each administrative unit using the R package “V.PhyloMaker” (Jin and Qian, 2019), which can generate very large phylogenies for vascular plants, and we visualized the result in FigTree v1.4.4. In order to compare phylogenetic metrics between the 19 administrative units, we sought to generate indices that were independent of species richness. Thus, we compared the observed values of PD, MPD, and MNTD to their expected values under a null model using respective standardized effect sizes (ses) following Pavoine and Bonsall (2010): PD.ses, MPD.ses, and MNTD.ses. We conducted these analyses for all non-native species combined and invasive species. Naturalized and casual species have not shown their harm to the ecological environment, so we do not use PD.ses, MPD.ses, and MNTD.ses to evaluate their functional ecological traits. We generated the null models in the R package “picante” using the phylosor.rnd function to simulate 999 random assemblages, in which taxa were randomly assigned to the 19 administrative units with species richness and frequency maintained among units (Webb, 2010).
To identify outliers in species richness and the phylogenetic metrics of plant diversity, we calculated z-scores for all dependent variables (including the number of non-native, casual, invasive and naturalized species, PD, MPD.ses, and MNTD.ses of non-native and invasive species) in Microsoft Excel 2016. We regarded outliers as those values with a z-score greater than 3.0 or less than −3.0 following Kreyszig (1979). After we removed the outliers, we analyzed the relationship of species richness (SR) to the selected socio-economic and climatic variables (see above) as well as land area using linear models (LMs) with step-by-step selection in R (R Development Core Team, 2016). Finally, we selected the best model using the Akaike Information Criterion (AIC). We also built single factor regression models for SR, PD.ses, MPD.ses, and MNTD.ses of non-native species and socioeconomic environmental variables for each administrative unit.
We used the R package “circlize” (Gu et al., 2014) to draw chord diagrams to visualize (1) the relationships between the habitat, native range, and administrative units where the non-native species occur, and (2) the relationships between the habitat, native range, and the nine plant families with the largest numbers of non-native species. We used Jenks natural breaks in IBM SPSS Statistics 23.0 to determine that these nine families have statistically more non-native species in Hainan than other families. We used the K-means algorithm in IBM SPSS Statistics 23.0 to cluster the nine families into groups according to their representation within each administrative unit, and we show the families with the greatest representation in Figure 2.
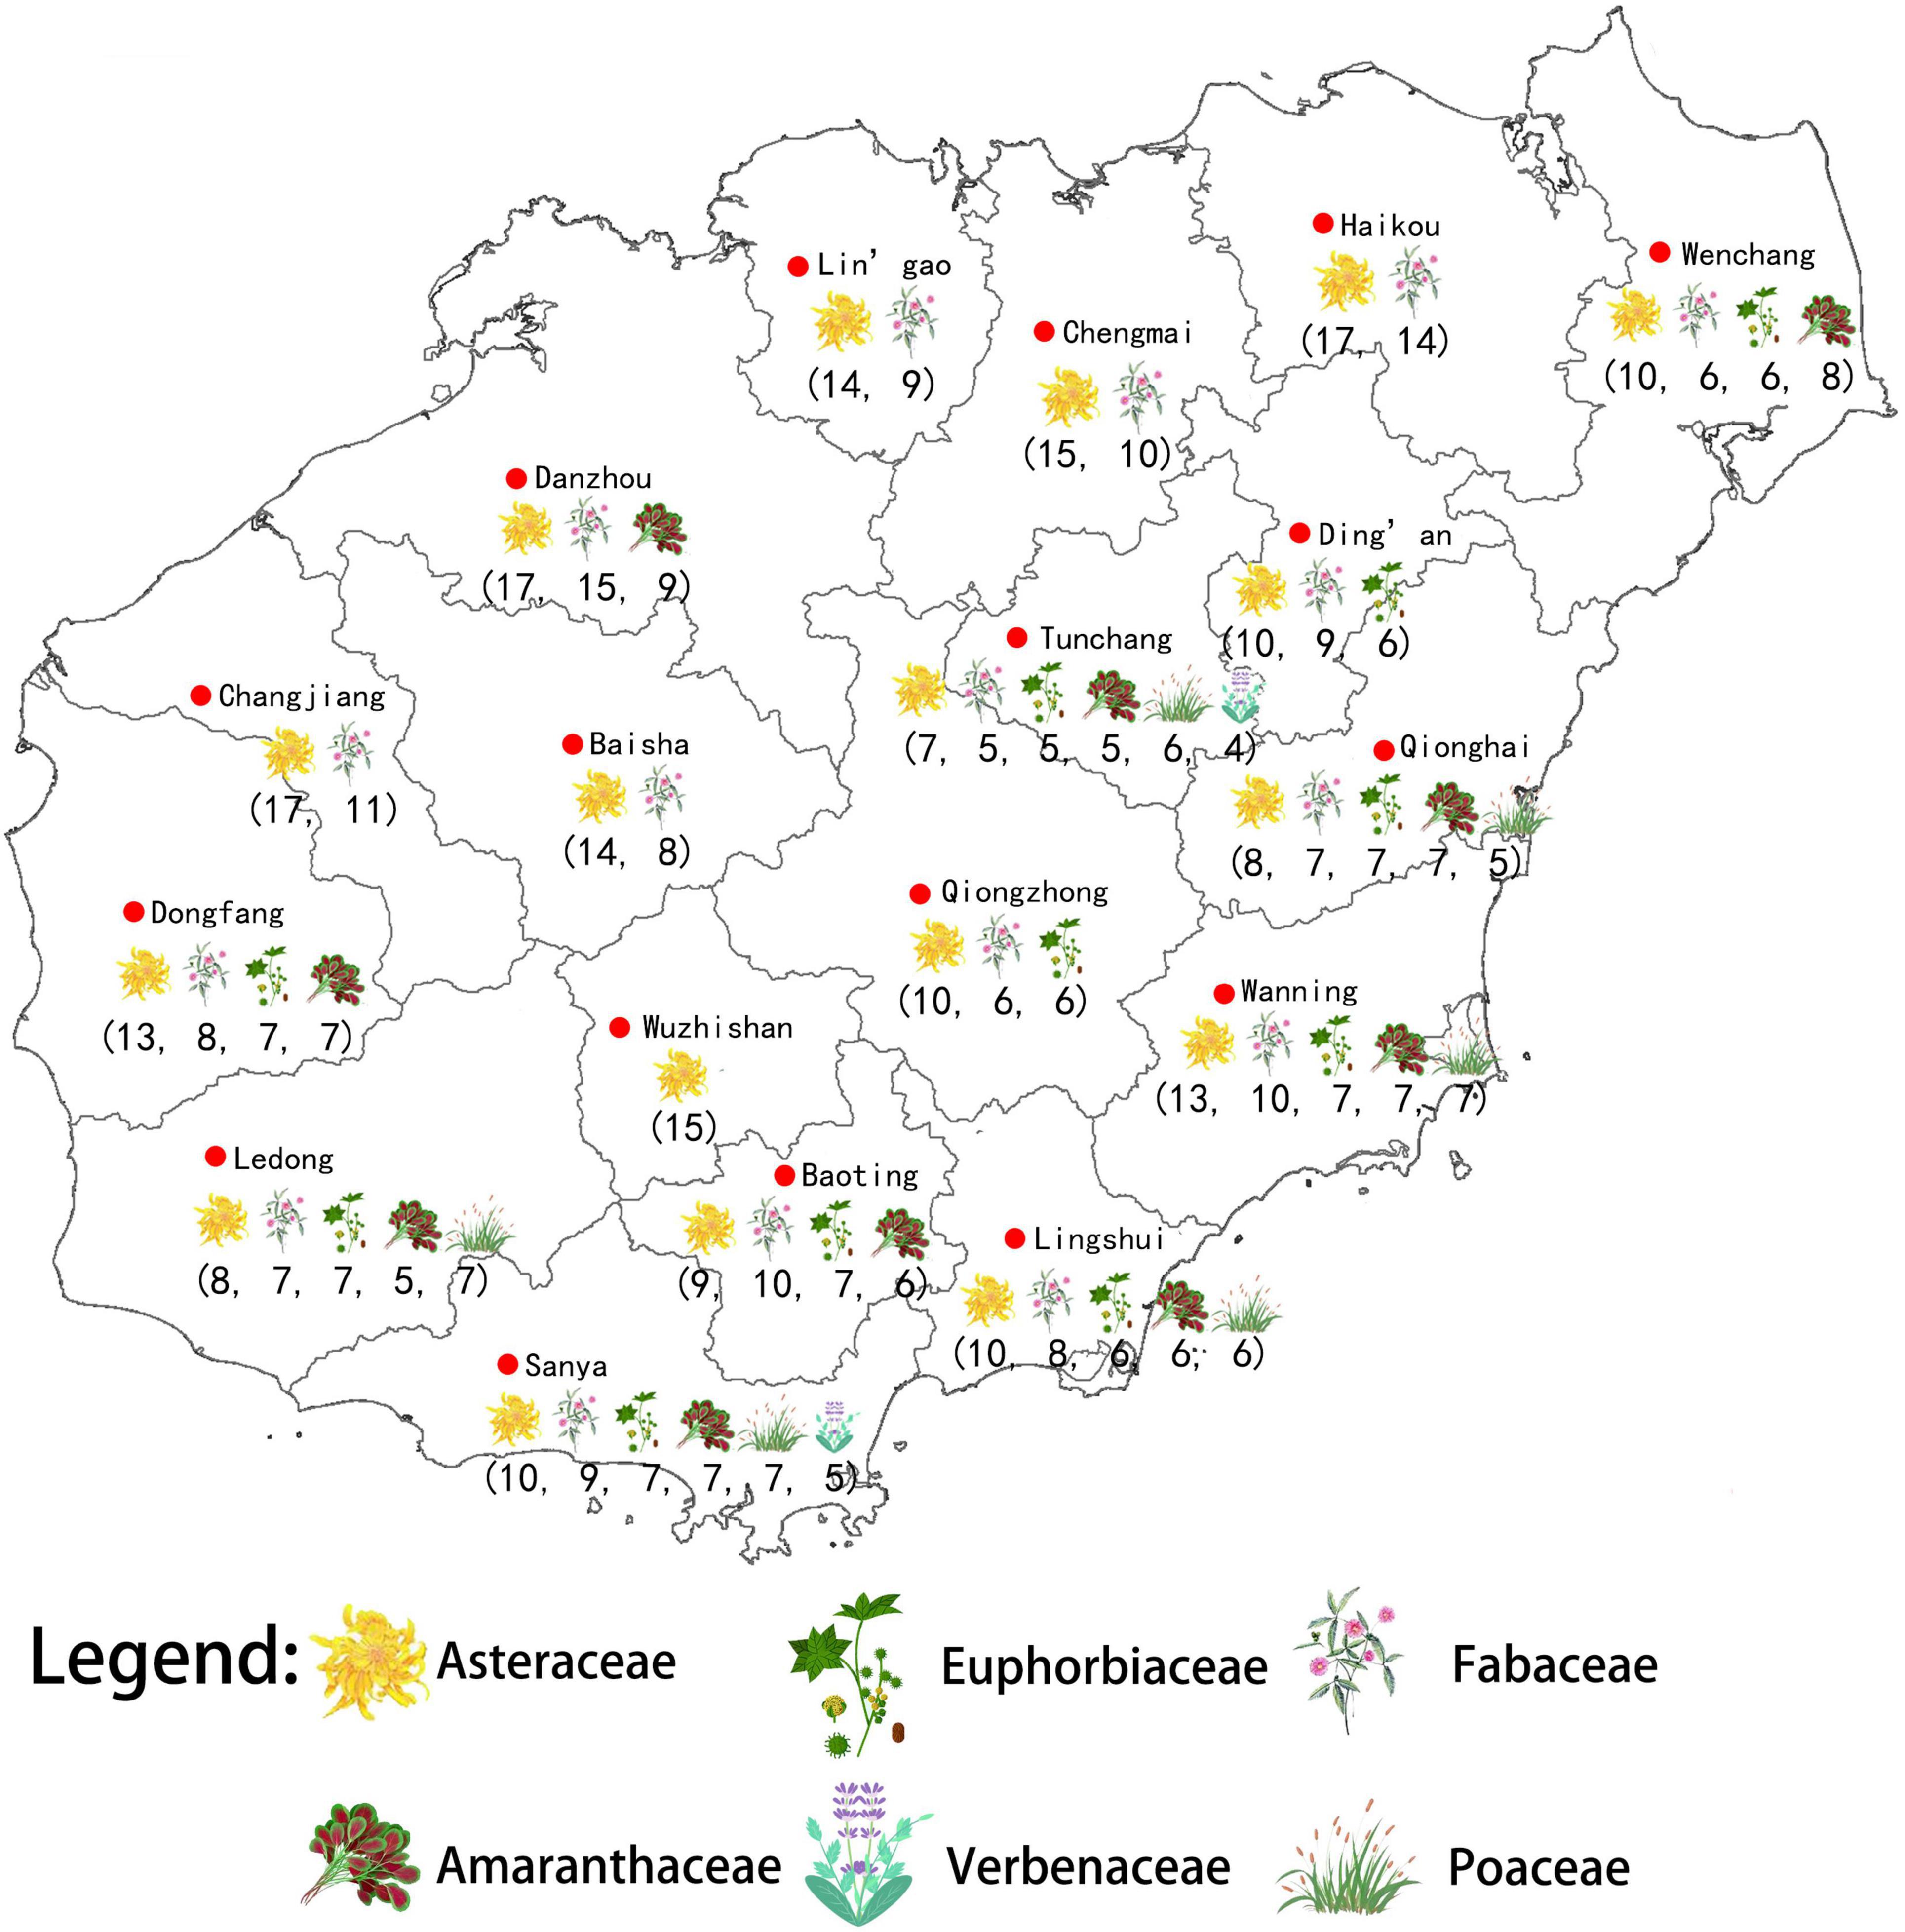
Figure 2. Major families of non-native plants and their number of species distributed in each administrative unit in Hainan.
We found a total of 182 non-native vascular plant species belonging to 45 families within Hainan according to our literature and field surveys. Of these species, 77 were casual, 42 were naturalized, and 63 were invasive, while 135 species were herbs, ten were trees, 27 were shrubs, and ten were vines (Supplementary Appendix 1 “Species list”). Additionally, among the non-native species of Hainan, 76 species are annual, two are biennial, 90 are perennial, five are annual or biennial, seven are annual or perennial, and two species are biennial or perennial. Representative images of some non-native plant species of Hainan are shown in Figure 3.
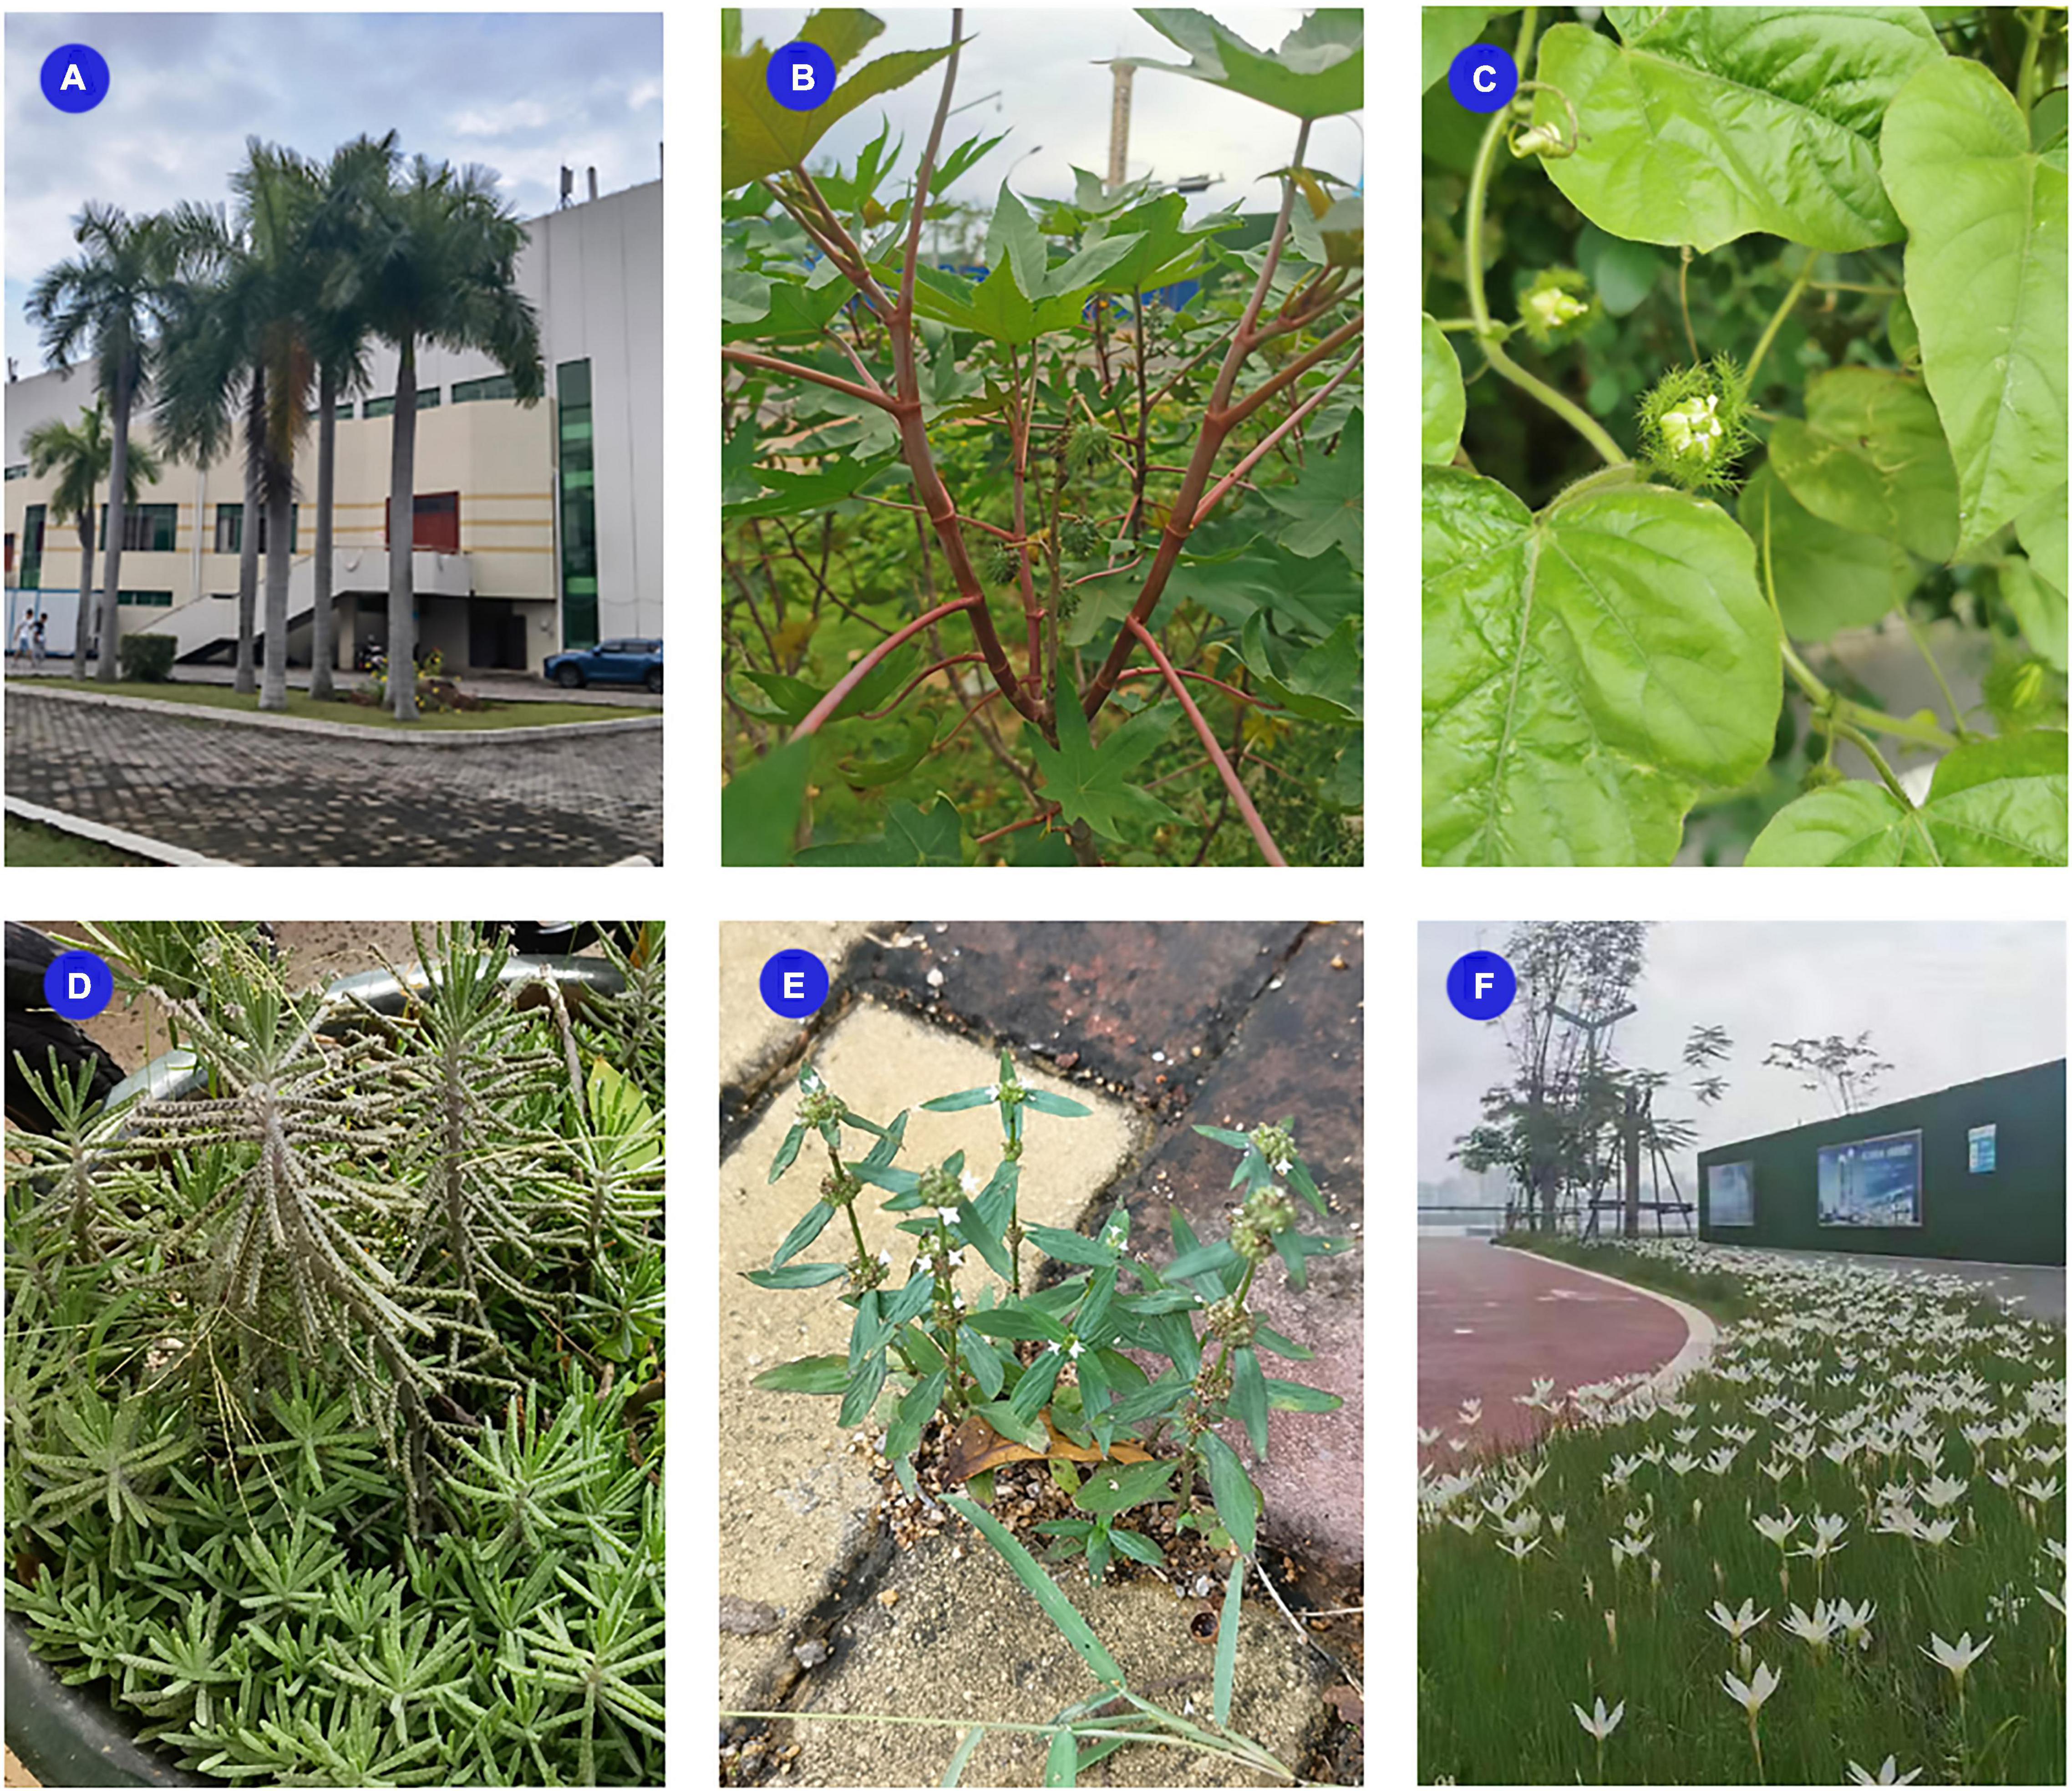
Figure 3. Some of the non-native plant species located within Hainan: (A) Wodyetia bifurcata (Arecaceae); (B) Ricinus communis (Euphorbiaceae); (C) Passiflora foetida (Passifloraceae); (D) Bryophyllum delagoense (Crassulaceae); (E) Spermacoce pusilla (Rubiaceae); (F) Zephyranthes candida (Amaryllidaceae).
The climatic origins of non-native, casual, invasive, and naturalized plant species in Hainan Province are mainly tropical and subtropical (Figure 4 and Supplementary Appendix 1 “2_Climate zone”). We found that non-native plants were distributed throughout all seven habitat categories inconsistently with the representation of the habitats on the landscape. Specifically, urban and rural built-up areas, agricultural areas, and forests and forest margins account for the largest percentages of the land area of Hainan, while non-native species have the highest occurrence rates in grasslands and shrub lands and forests and forest margins at 89.56 and 79.12%, respectively (Table 1). Among non-native species taken together, 26.92% appear in only one habitat, but only 14.81% of invasive species appear in only one habitat (Table 2). Except for some non-native species with unknown native ranges, the non-native species found in Hainan originate from all continents except Antarctica, but are most frequently native to South America (35.93%), North America (30.37%), and Asia (21.98%) (Figure 5 and Supplementary Appendix 1).
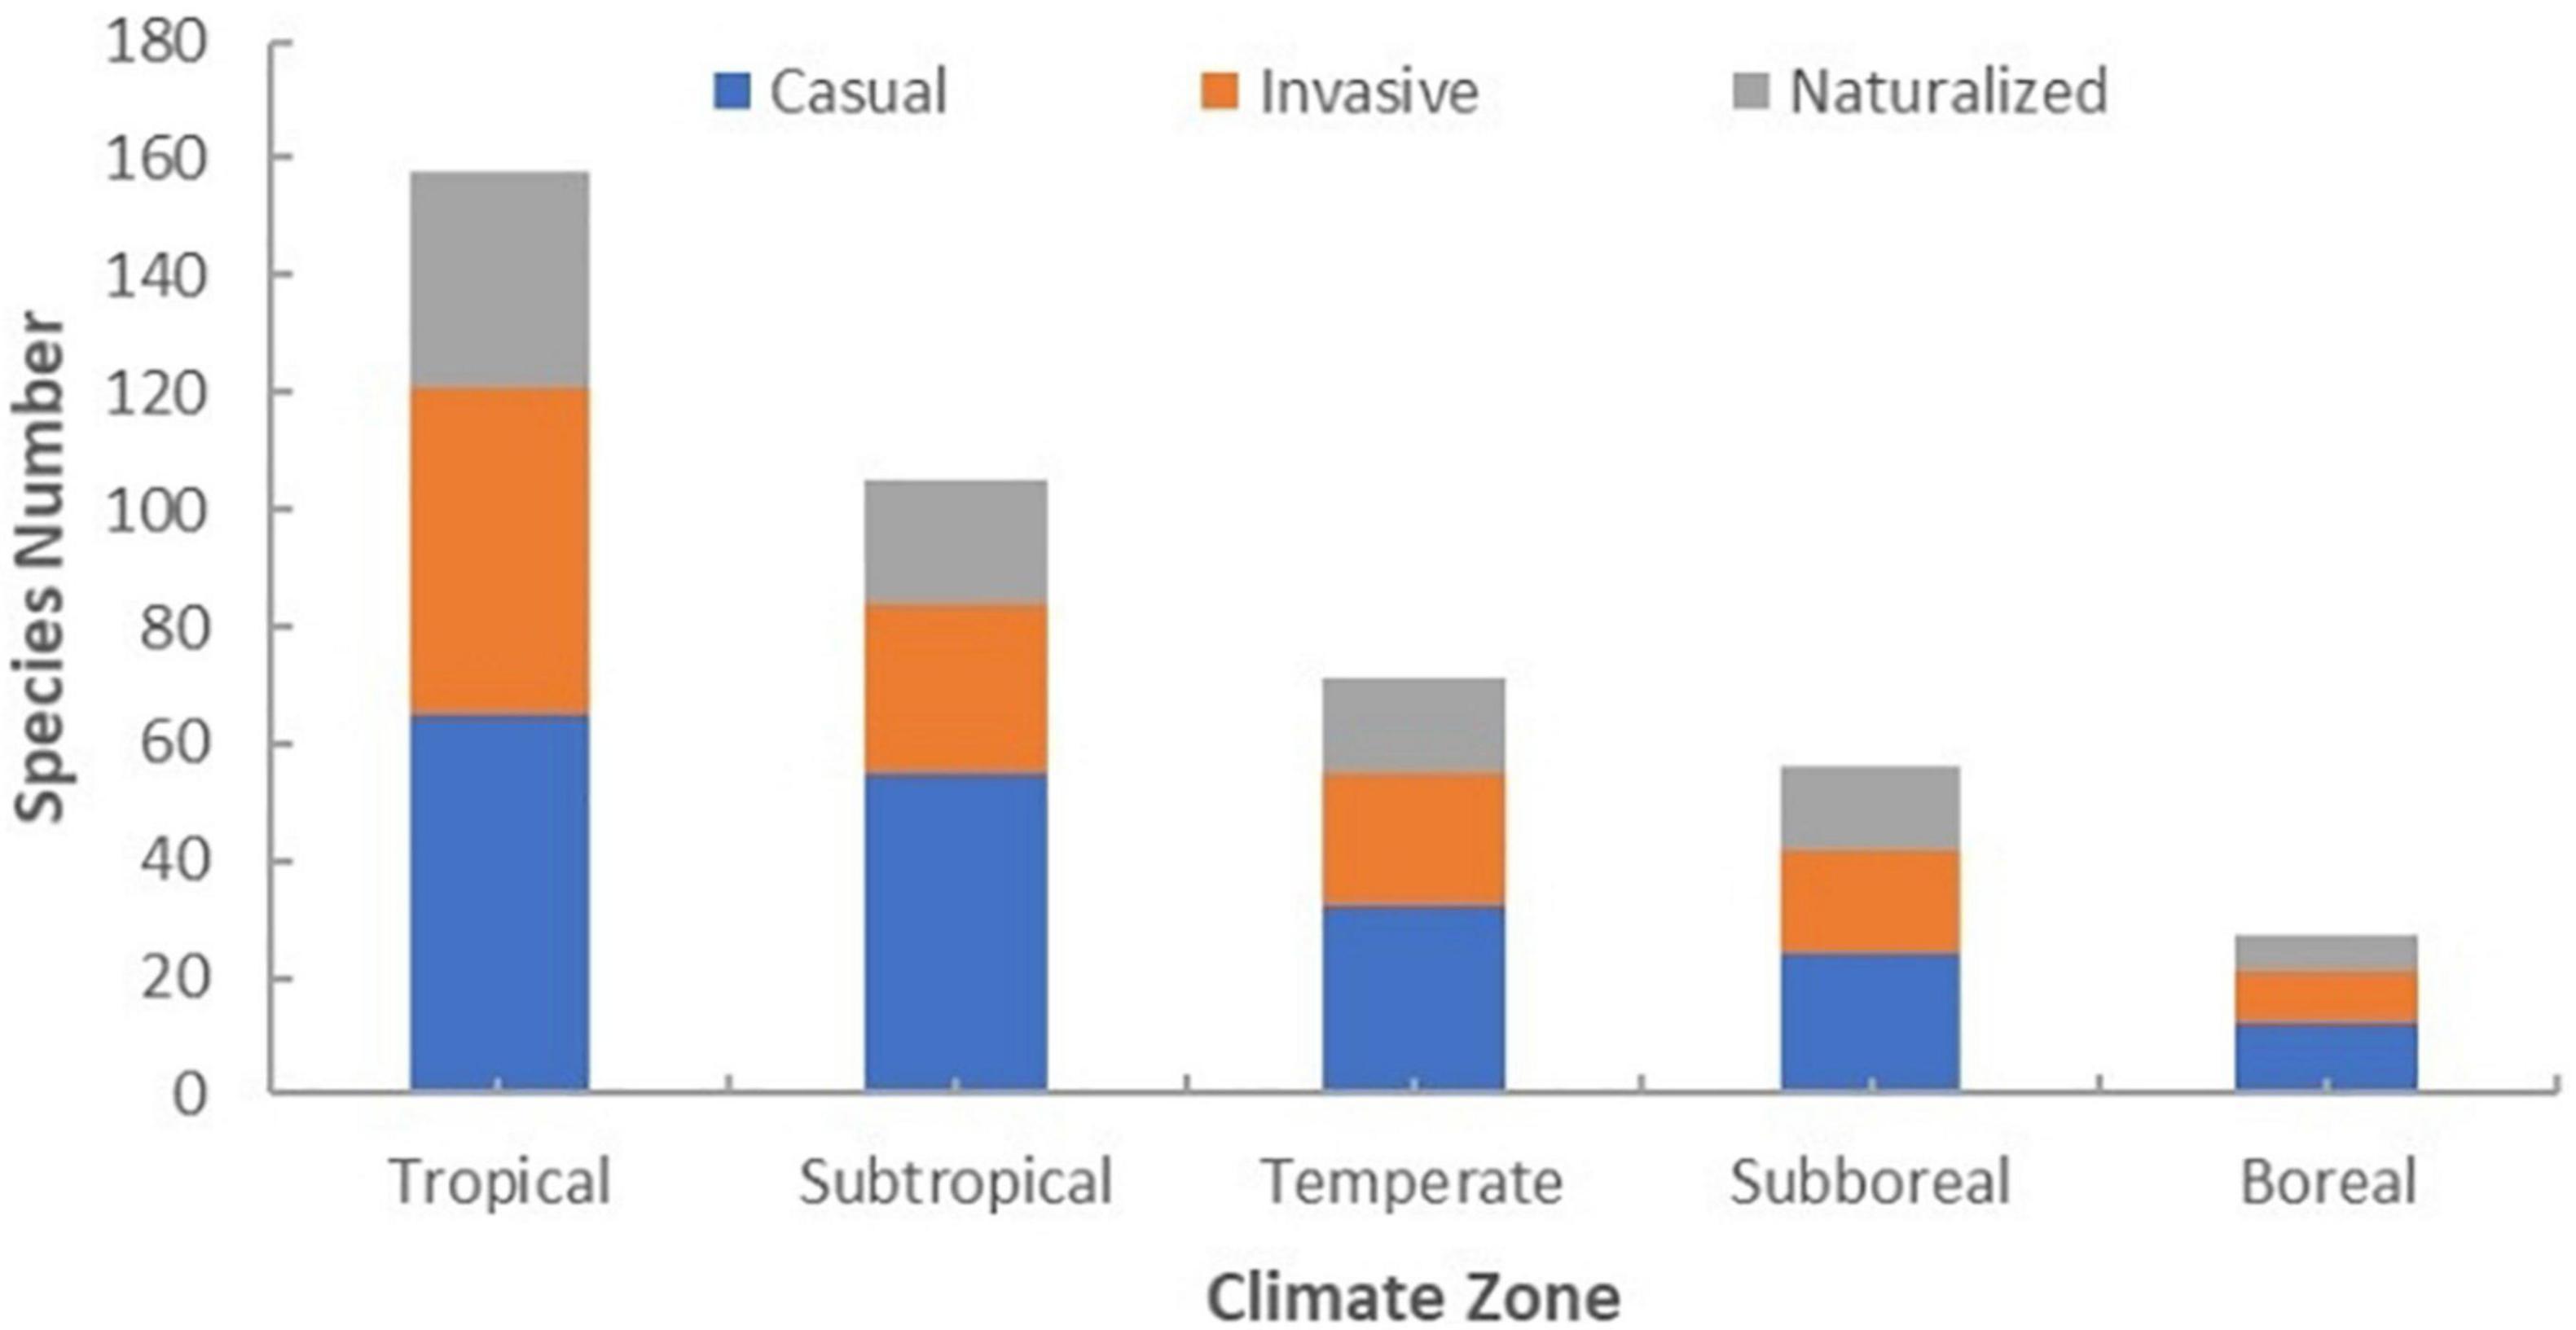
Figure 4. Statistical histogram of climatic origins of non-native, casual, invasive and naturalized plant species in Hainan.
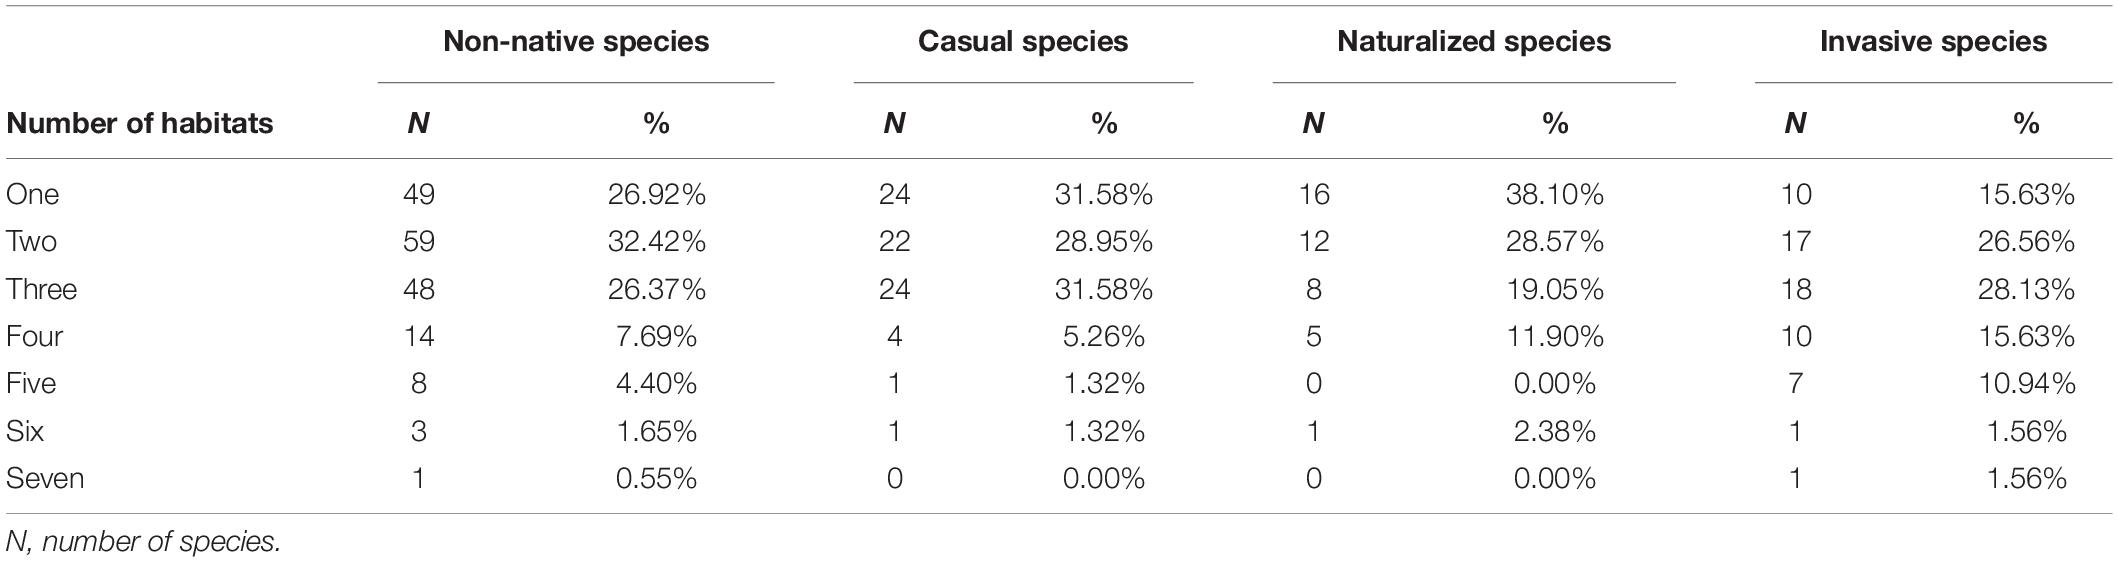
Table 2. The numbers and percentages of non-native and invasive species found within one or more of the seven habitats.
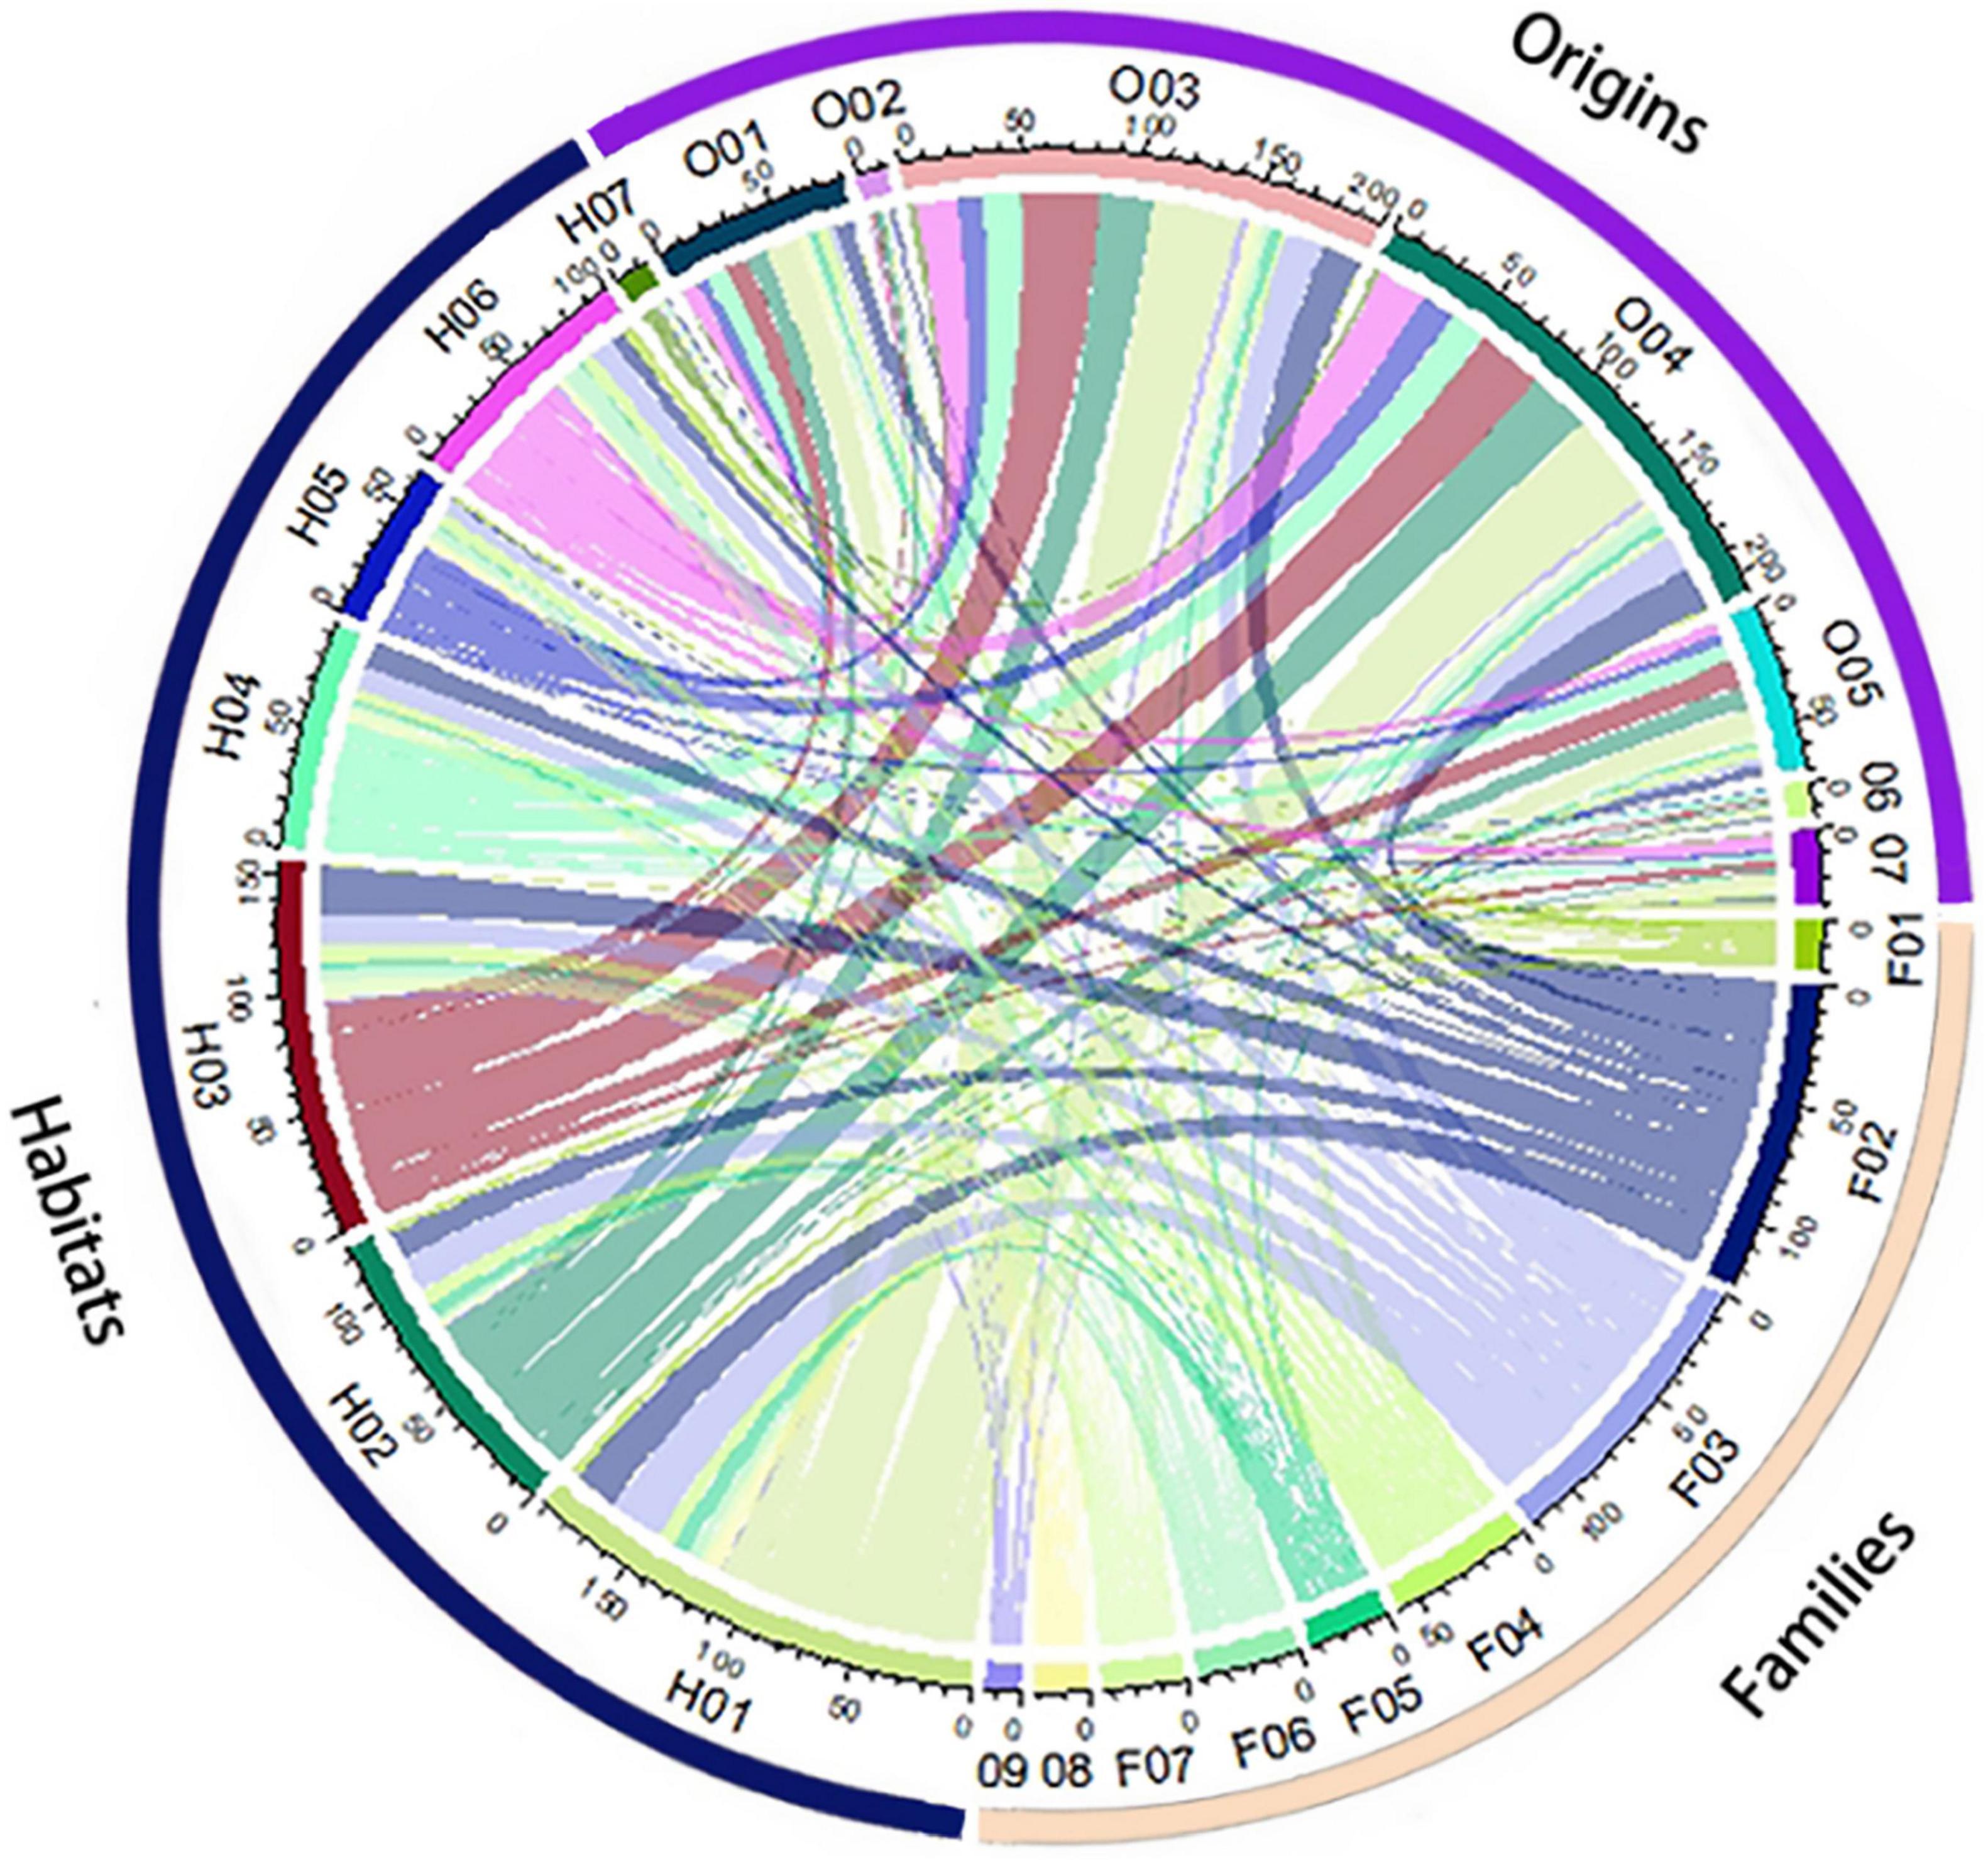
Figure 5. Chord diagram denoting the relationships among the habitat, place of origin, and top nine families of non-native plants. Habitats: (H01) rural and urban built-up areas, (H02) agricultural areas, (H03) grasslands and shrublands, (H04) forest and forest margins, (H05) inland rocky outcrops, (H06) inland wetlands and water bodies, (H07) coastal areas (including mangroves, beaches, etc.); origins: (O01) Asia, (O02) Europe, (O03) North America, (O04) South America, (O05) Africa, (O06) Oceania, (O07) Unknown; top nine families: (F01) Polygonaceae, (F02) Fabaceae, (F03) Asteraceae, (F04) Poaceae, (F05) Euphorbiaceae, (F06) Amaranthaceae, (F07) Malvaceae, (F08) Verbenaceae, and (F09) Cactaceae. The arc length of each chord terminus represents the cumulative number of the habitat, place of origin, and family of non-native plants. The thickness of the chord curves represents the number of non-native plants for the habitat, place of origin, and family.
In Hainan, the most common plant families in terms of non-native species richness were Fabaceae, Asteraceae, Euphorbiaceae, Poaceae, and Amaranthaceae, which accounted for 47.80% of all non-native species in total. Many species of Asteraceae and Fabaceae cames from North and South America, while many Amaranthaceae derived from South America. The species of Asteraceae, Euphorbiaceae, Poaceae, and Fabaceae mainly grow in rural and urban habitats and grasslands and shrublands in Hainan (Figures 5, 6).
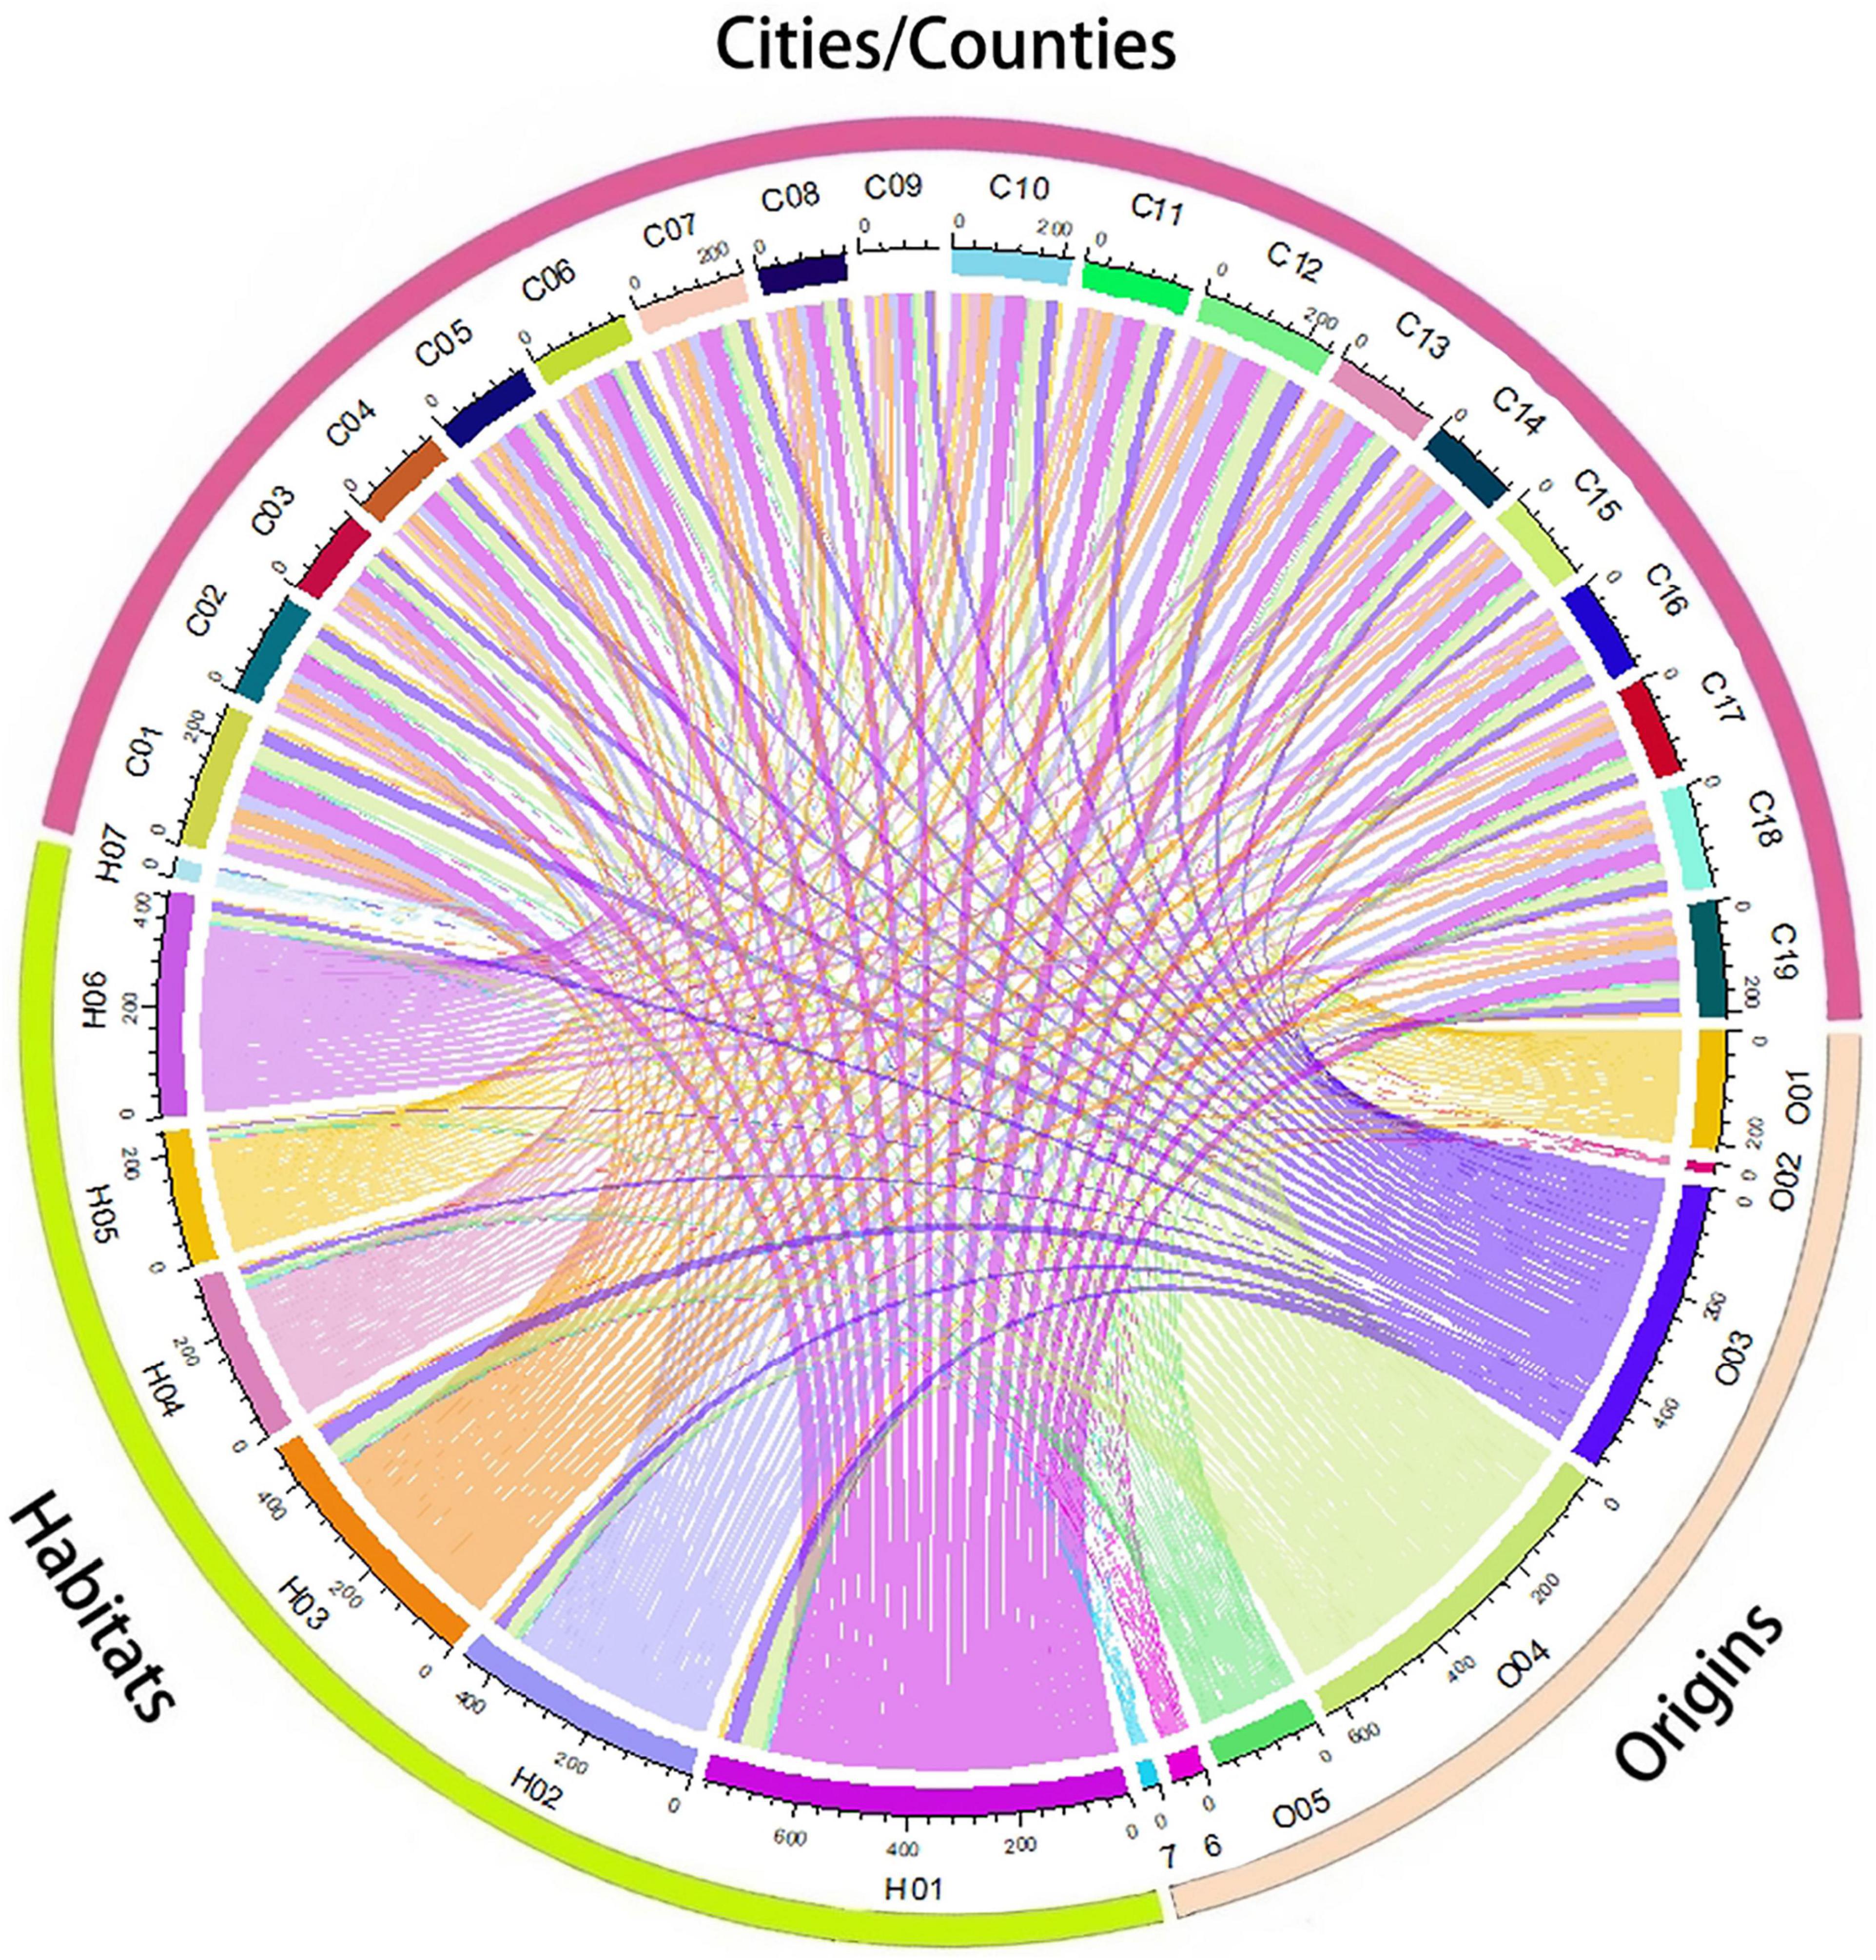
Figure 6. Chord diagram denoting the relationships among the habitat, place of origin, and distribution administrative unit (city/county) of non-native plants. Habitats: (H01) rural and urban built-up areas, (H02) agricultural areas, (H03) grasslands and shrublands, (H04) forest and forest margins, (H05) inland rocky outcrops, (H06) inland wetlands and water bodies, (H07) coastal areas (including mangroves, beaches, etc.); origins: (O01) Asia, (O02) Europe, (O03) North America, (O04) South America, (O05) Africa, (O06) Oceania, (O07) Unknown; distribution city/county: (C01) Haikou, (C02) Sanya, (C03) Sansha, (C04) Wuzhishan, (C05) Wenchang, (C06) Qionghai, (C07) Wanning, (C08) Ding’an, (C09) Tunchang, (C10) Chengmai, (C11) Lin’gao, (C12) Danzhou, (C13) Dongfang, (C14) Ledong, (C15) Qiongzhong, (C16) Baoting, (C17) Lingshui, (C18) Baisha, and (C19) Changjiang. The arc length of each chord terminus represents the cumulative number of the habitat, place of origin, and distribution city/county of non-native plants. The thickness of the chord curves represents the number of non-native plants for the habitat, place of origin, and distribution city/county.
We determined the number of non-native species in each administrative unit as well as their status as naturalized, casual, or invasive (Figure 7). Haikou had the highest number of non-native (109), casual (49), invasive (43), and naturalized (17) species, while Tunchang had the lowest for each (55, 20, 27, and eight, respectively) (Figure 7, 8 and Supplementary Appendix 1.
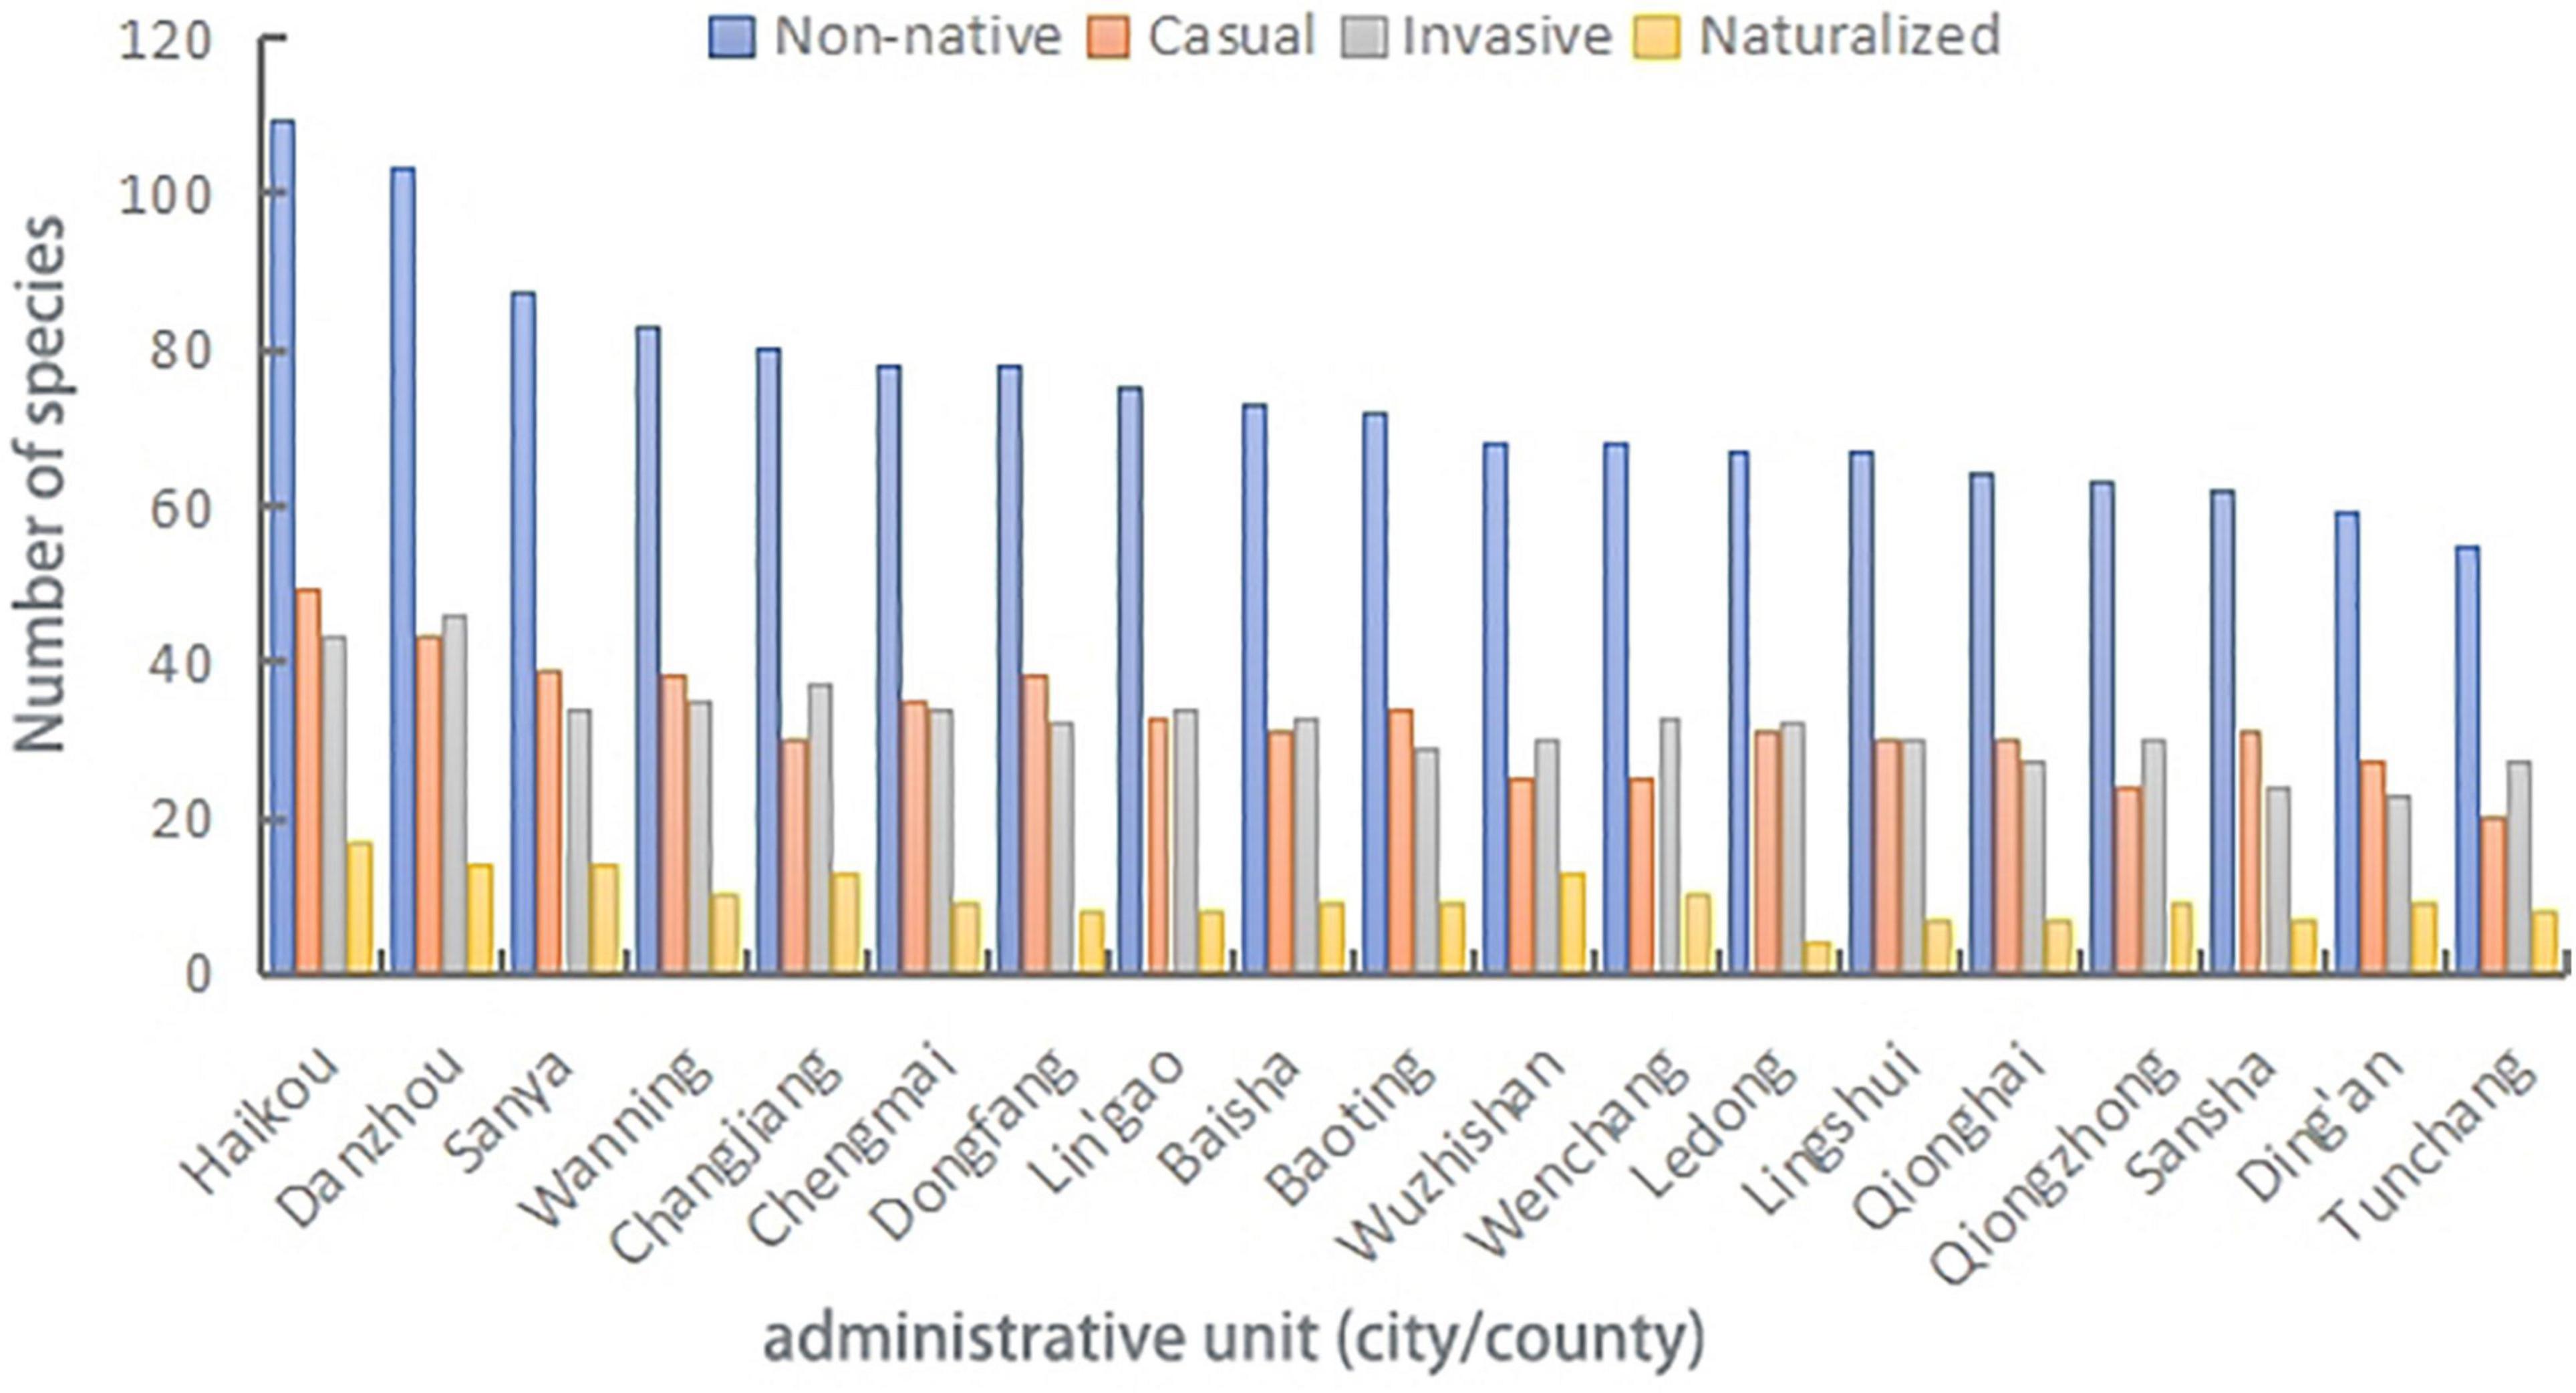
Figure 7. The number of non-native, casual, invasive, and naturalized plant species in each administrative unit (city/county) within Hainan island.
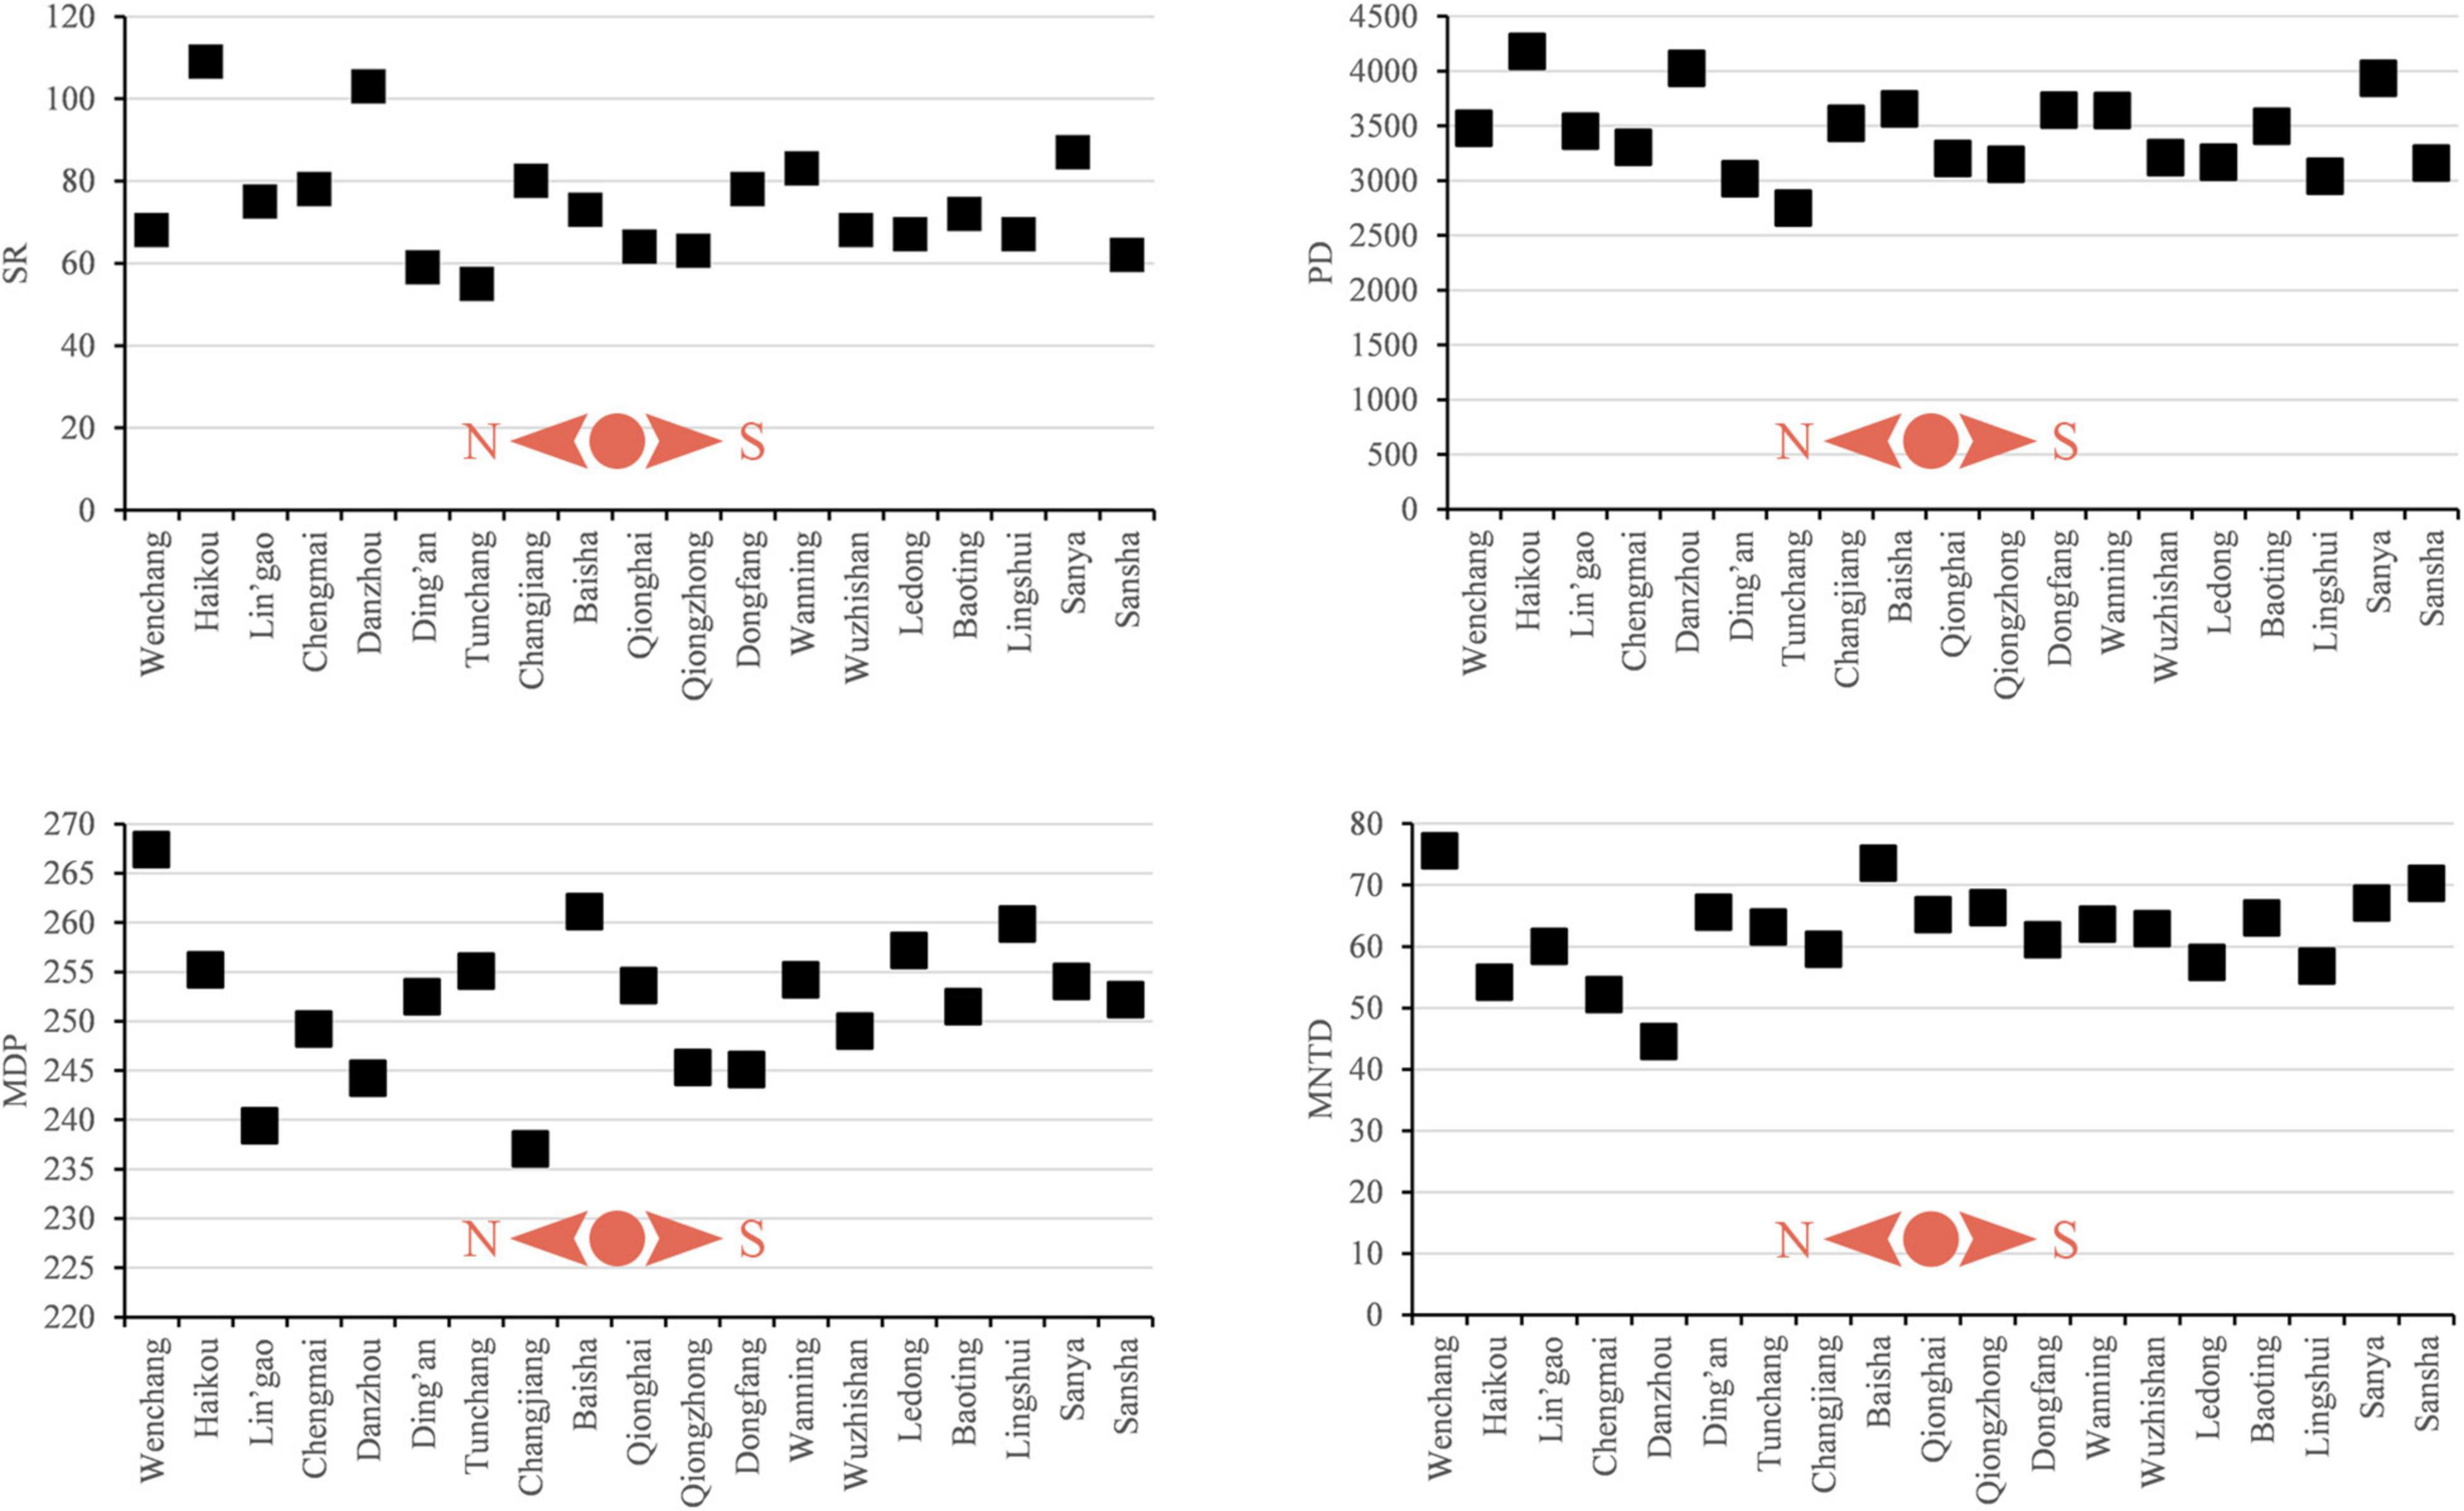
Figure 8. Line charts of the four measures of diversity of non-native plant species in each administrative unit (city/county) in Hainan. The four measures of taxonomic diversity are Species richness (SR), Faith’s phylogenetic diversity (PD), phylogenetic Mean Pairwise Distance (MPD), and phylogenetic Mean Nearest Taxon Distance (MNTD).
Overall, the frequencies of habitat types and geographic origins of non-native species are rather consistent across the 19 administrative units (Figure 6). In terms of the distribution pattern of each non-native plant family, Asteraceae is widely distributed and has more species in each administrative unit (Figure 2), e.g., Mikania micrantha (Asteraceae) occurs in 10 administrative units in Hainan while members of Fabaceae are dominant non-native species in all administrative units except Wuzhishan according to our analyses using K means (Figure 2).
The PD of non-native and invasive species mirrors SR by showing the highest values in Haikou (Tables 3, 4). With respect to MPD.ses (Table 3), values showed significant deep phylogenetic clustering (p ≤ 0.05) for Lin’gao, Danzhou, and Changjiang (Table 3), which are all adjacent to one another along the northwestern coast of Hainan (Figure 1). Among these, the lowest negative value was for Danzhou. Values of MNTD.ses (Table 3) showed significant clustering in Danzhou and Chengmai, which is located geographically between Lin’gao and Haikou (Figure 1). When considering only invasive species (Table 4), no values of MPD.ses or MNTD.ses showed significant phylogenetic clustering or overdispersion.
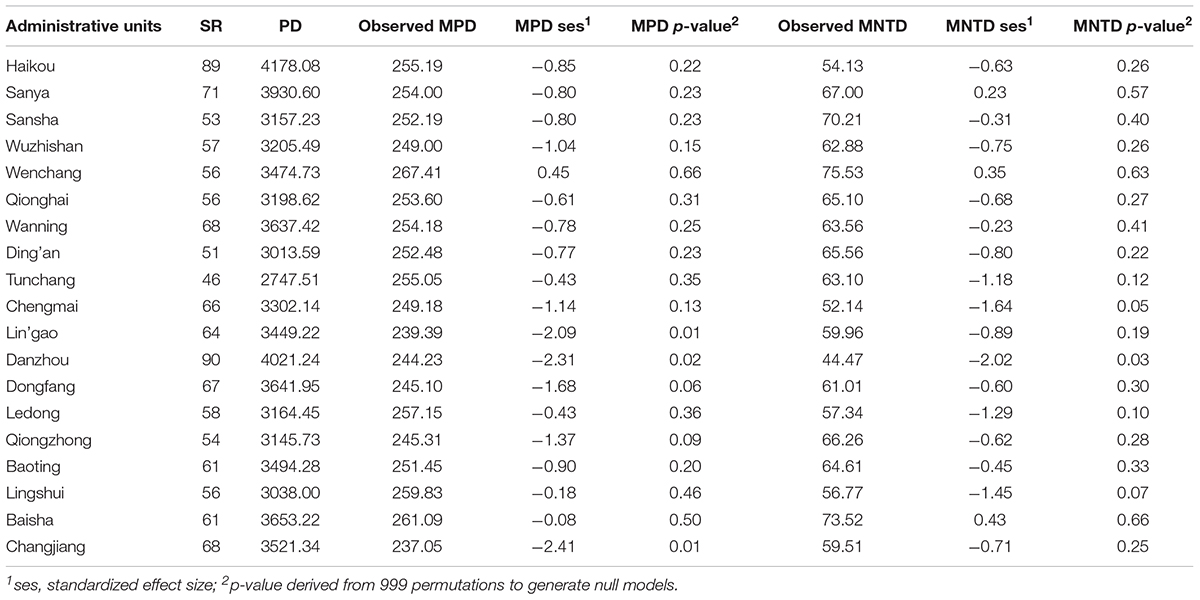
Table 3. The diversity of non-native species in each administrative unit within Hainan.
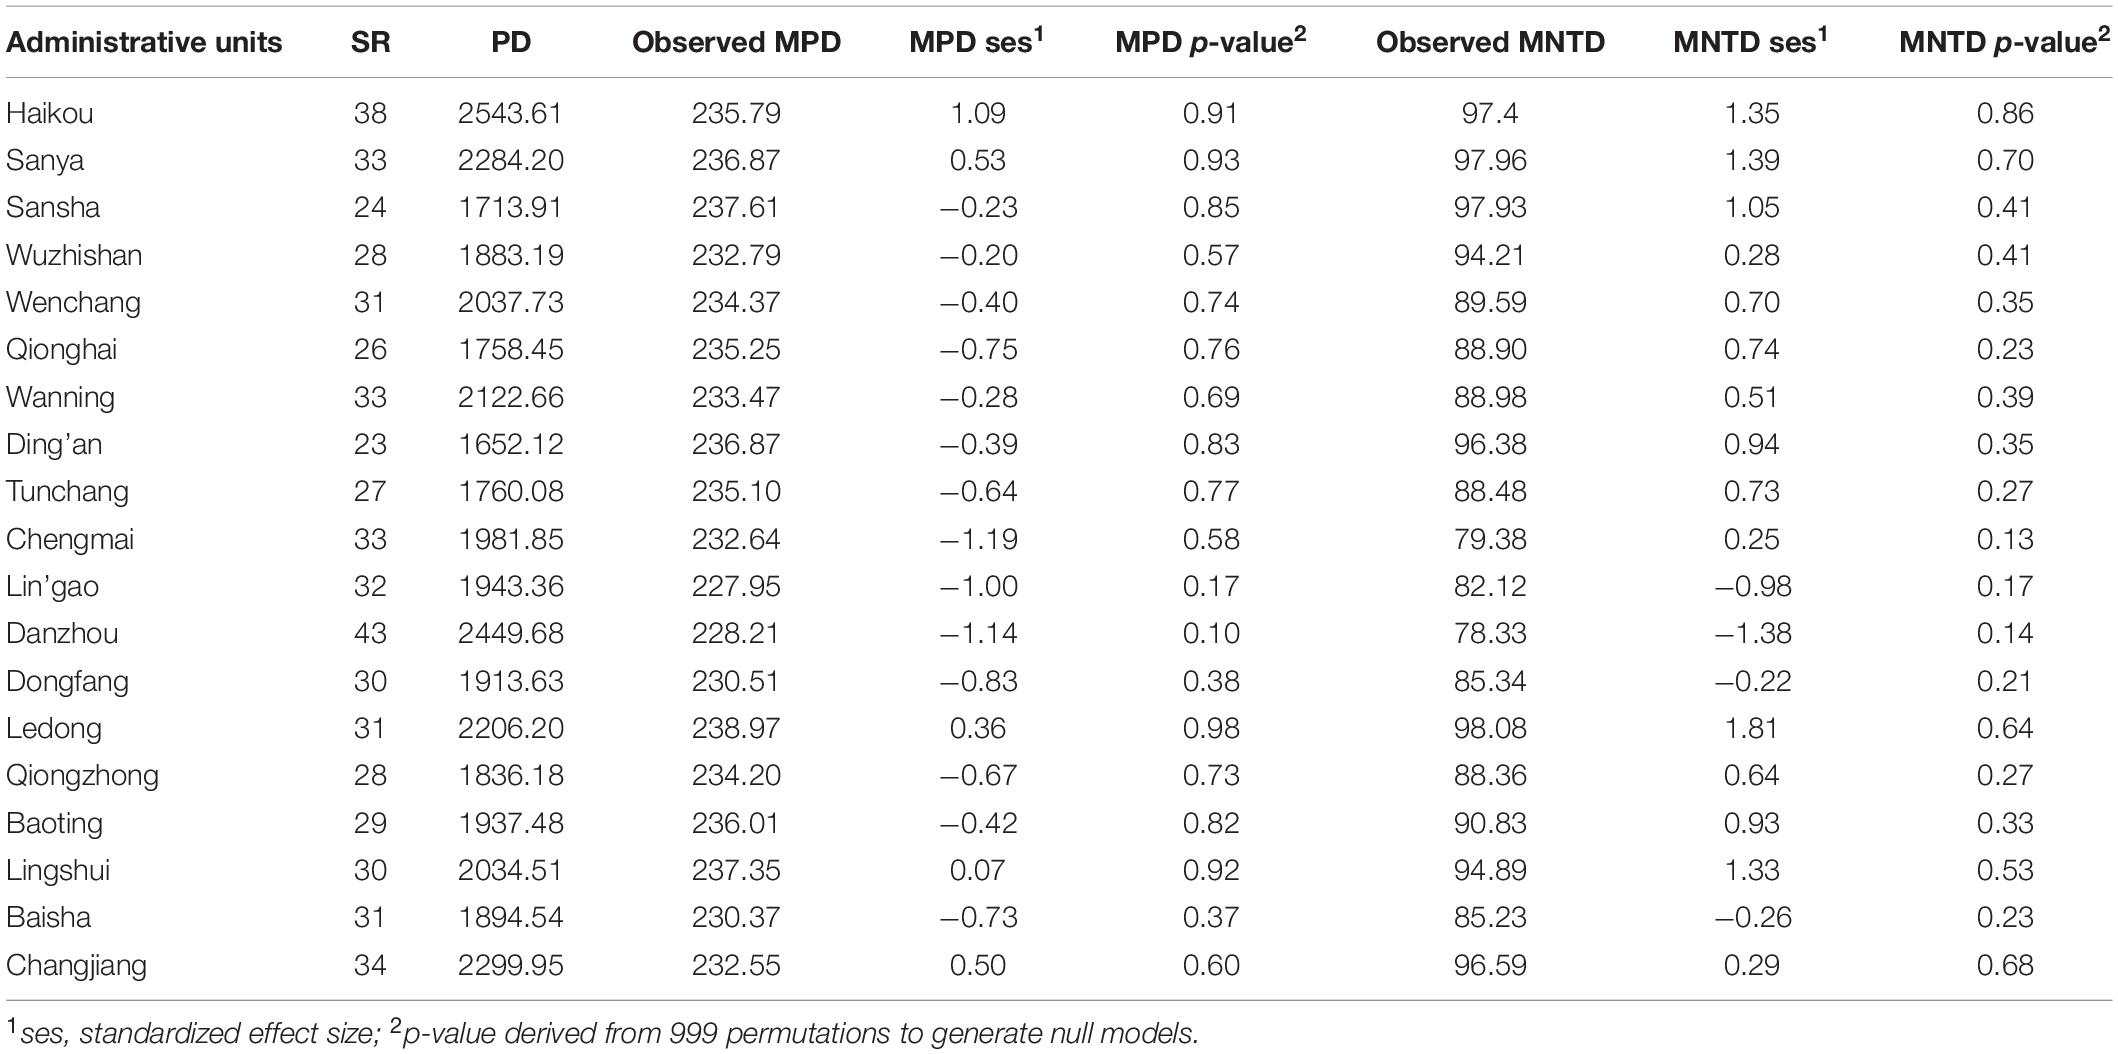
Table 4. The diversity of invasive species in each administrative unit within Hainan.
Based on multiple LMs, we found that, among socio-economic variables, GDP and savings deposits in 2013 were significantly positively correlated with non-native SR (Table 5). Based on simple LMs, we found that, among socio-economic variables, population, total output value of industry in 2013, total retail sales of social consumer goods, savings deposits in 2013, and GDP were significantly positively correlated with non-native, casual, invasive, and naturalized species richness (Table 6). Among climatic variables, the minimum temperature of the coldest month is negatively correlated with the number of non-native, casual, invasive, and naturalized species (Table 6).
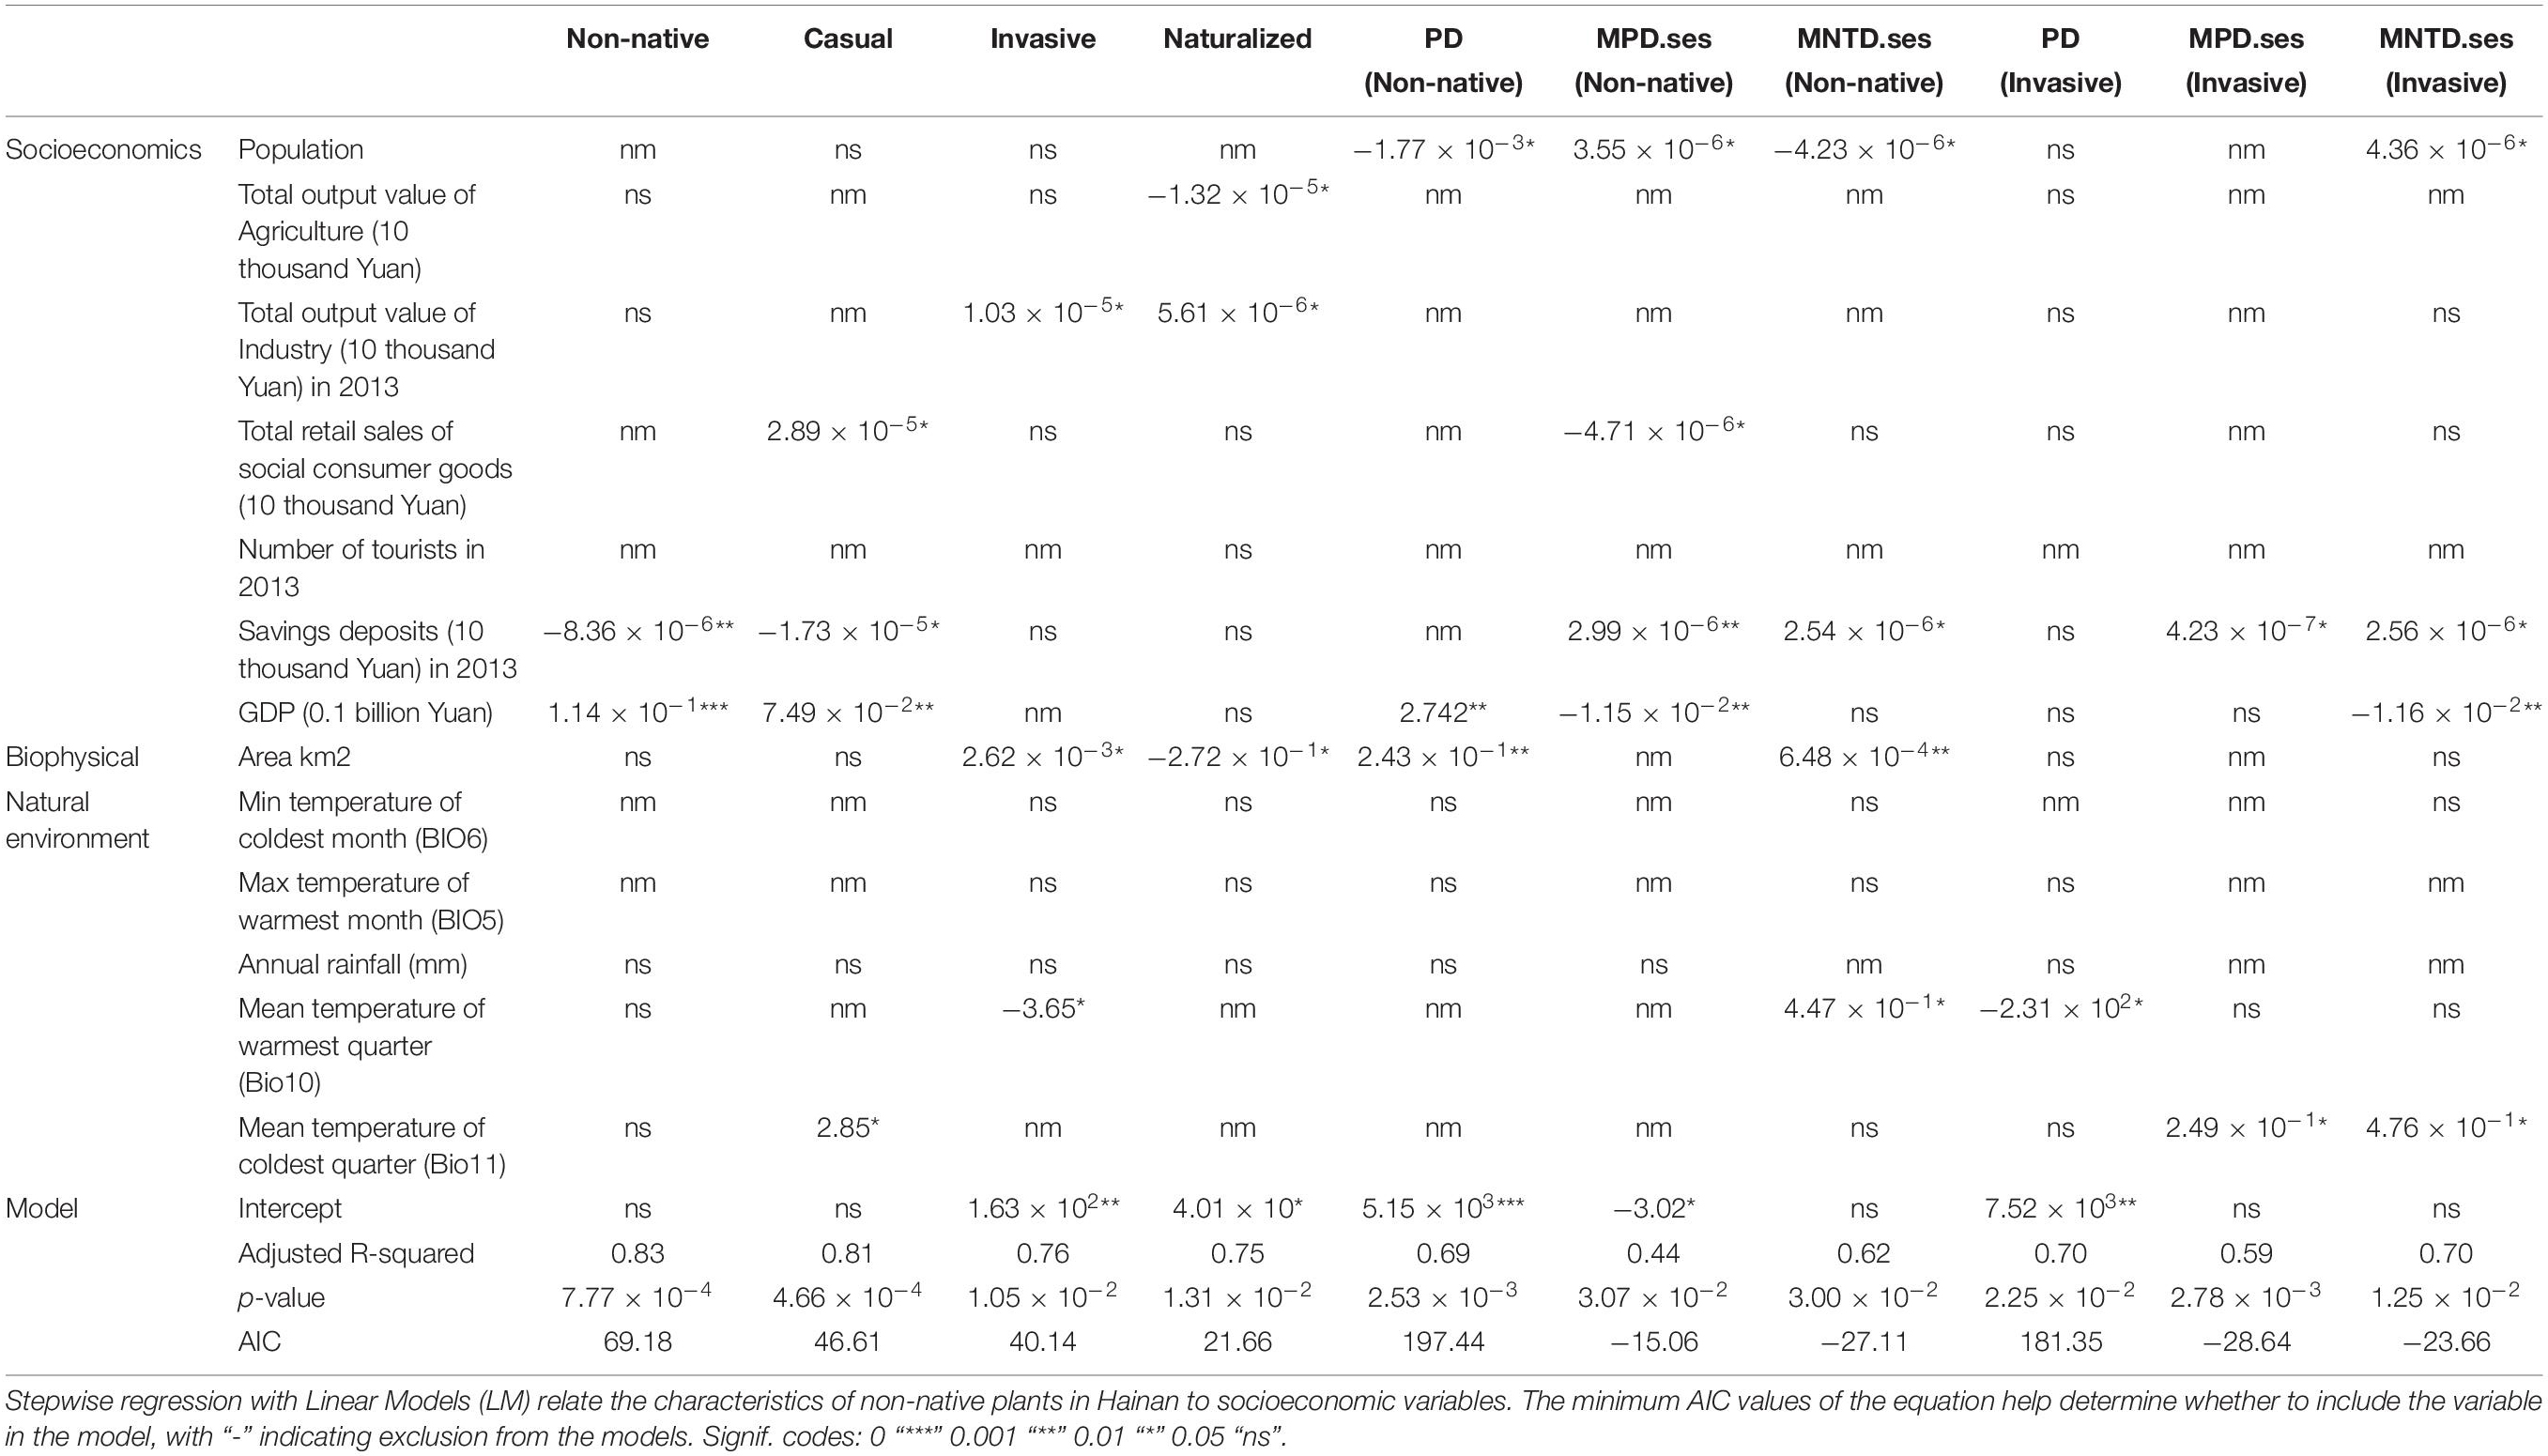
Table 5. Analysis of the factors influencing plant diversity in different administrative units of Hainan.
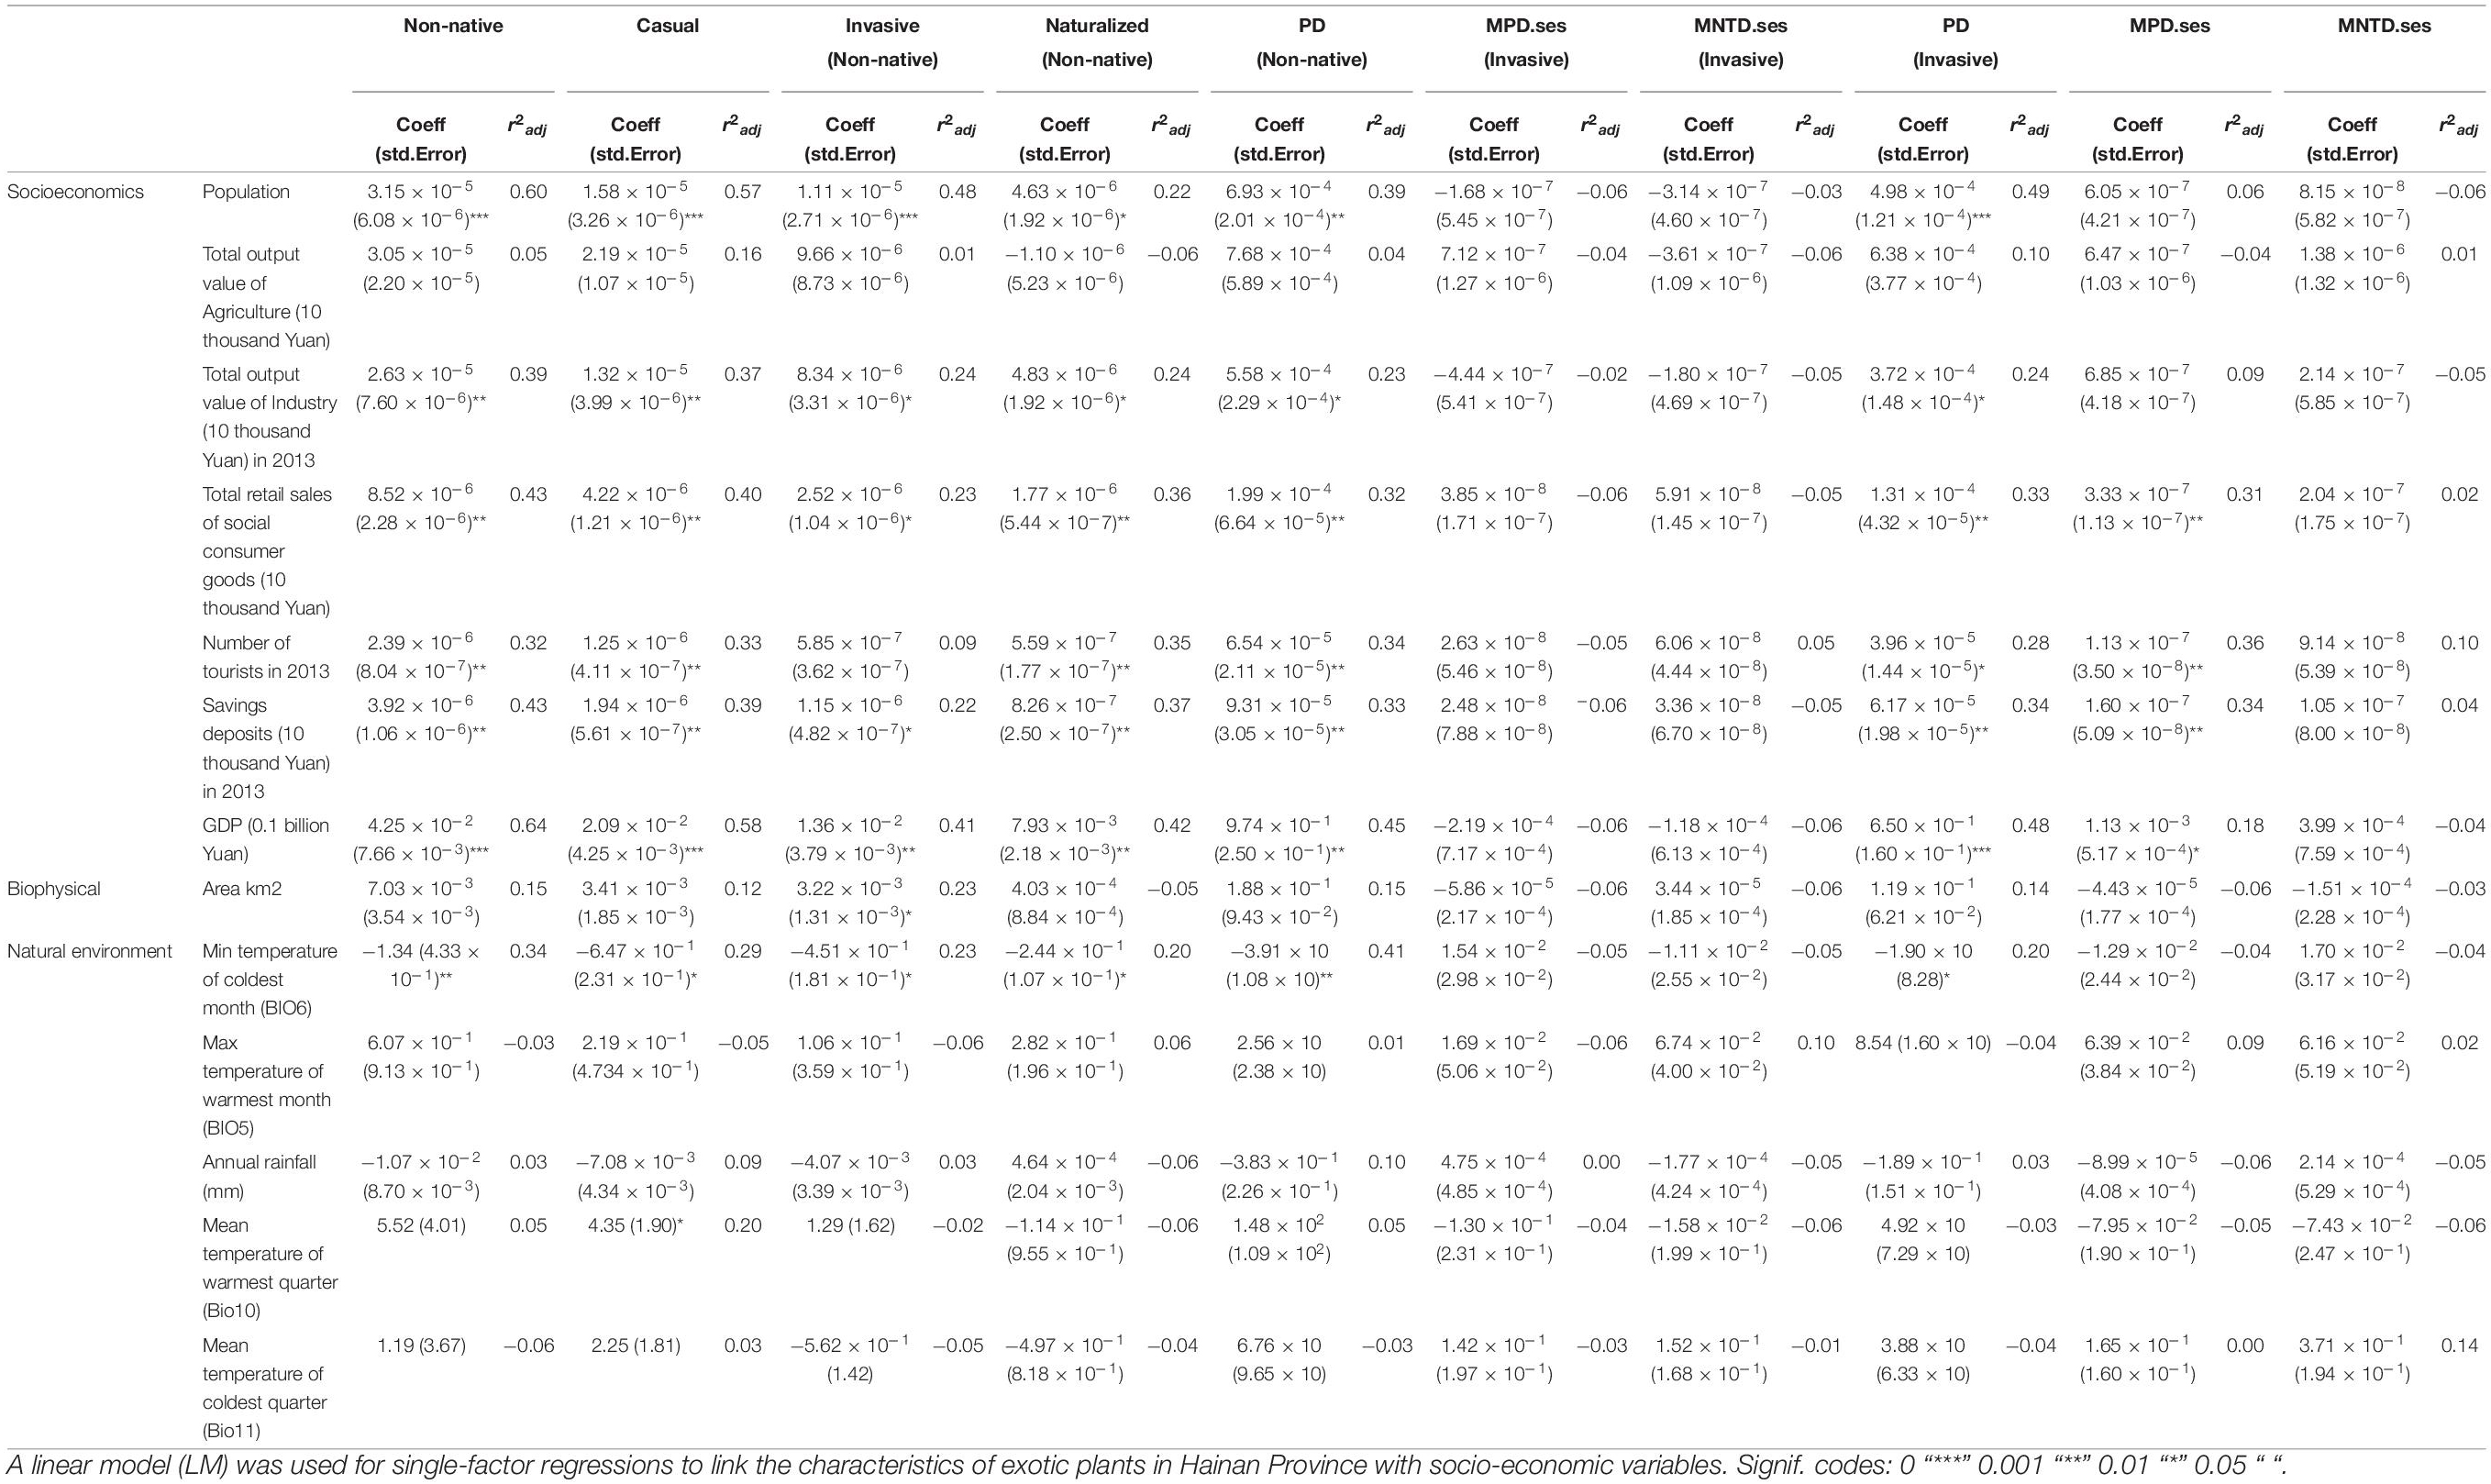
Table 6. Analysis of influencing factors in different administrative units in Hainan.
The relationship of socio-economic and climate variables as well as land area to phylogenetic diversity is shown in Table 5. We examined the curvilinear relationship between area and non-native species diversity and we found that they were not correlated (Supplementary Appendix 4). According to multiple LMs, the PD of non-native species has a significant positive correlation with land area and GDP. The PD of invasive species has a negative correlation with Mean temperature of warmest quarter (Table 5). The MPD.ses and MNTD.ses of non-native and invasive species are positive correlated with savings deposits in 2013 (Table 5). The MPD.ses and MNTD.ses of invasive species are positively correlated with mean temperature of coldest quarter (Bio11) (Table 5).
Our study used SR and PD to assess the biodiversity of non-native plants. PD is regarded as a highly useful metric of biodiversity for green infrastructure planning and biodiversity conservation strategies in urban ecosystems (Cadotte et al., 2012; Lopez et al., 2018; Cui et al., 2019), especially because it is a proxy for functional diversity (Knapp et al., 2008; Hooper and Dukes, 2010). Specifically, closely related species are often more similar to each other in terms of functional ecological traits than more distantly related ones (Hooper and Dukes, 2010; Chen and Li, 2018). In Hainan, herbs represent the most common type of non-native plant vascular plant species, and the majority of these are annual herbs. Consistent with previous studies of non-native plant families within the province (Shan, 2003; Shan et al., 2006; Zhang and Xing, 2011; Peng et al., 2013), herbs primarily represent Fabaceae, Asteraceae, Poaceae, Euphorbiaceae, and Amaranthaceae. Thus, although the herbaceous habit is distributed throughout the vascular plant tree of life, the non-native herbs of Hainan are concentrated within a few families, as is consistent with our finding that the non-native herbs in Hainan are distributed in 37 families, and 44.67% are concentrated in Fabaceae, Asteraceae and Poaceae (Supplementary Appendix 1 “Herb_family”).
Asteraceae and Amaranthaceae also account for 30.16%, or 63 of the invasive species among 182 non-native species in total (Supplementary Appendix 1 “Invasive_family”). For example, Ageratum conyzoides, Erigeron annuus, Praxelis clematidea, and Chromolaena odorata, are invasives within the Bawangling Nature Reserve of Changjiang where they lead to in situ simplification of species composition and community structure by crowding out other plants according to prior studies (Hu et al., 2011). Consistent with previous findings in other cities, invasive species of Hainan are mostly low-growing shrubs or herbs, which are known to have lower soil moisture and nutrients requirements than tree species and can often complete their life history within harsh environmental conditions (Wang et al., 2011; Pyšek et al., 2020). They also typically have very small seeds that are easily dispersed intentionally or unintentionally via human activities, such as via seed or seedling exchange among residents, transportation, or trade, as well as by natural migration along pathways of wind or water currents (Musselman, 1994; Cusack et al., 2009; Egawa, 2017; Haubrock et al., 2021).
Human socioeconomic activities can affect plant invasion processes (Wu et al., 2010; Wang et al., 2011; Zhang et al., 2015; Egawa, 2017; Salgado et al., 2019; Zhu et al., 2019; Pyšek et al., 2020), which is consistent with our findings for Hainan. Among the 19 administrative units of the province, the administrative unit with the highest population and GDP, Haikou, had the highest PD and SR of non-native and invasive species. Moreover, the high MPD.ses and MNTD.ses values for Haikou’s invasive species (even though not significant) suggest that they are phylogenetically overdispersed, meaning that Haikou may have a high probability of being a recipient area for additional invasive species. Haikou is located at the geographic intersection of several major regional trade routes, especially the Guangdong-Hong Kong-Macao Greater Bay Area, the Beibu Gulf Economic Circle, the ASEAN Economic Circle, and the Southeast Asian Economic Circle, and these may all facilitate the arrival of invasive species in the city, such as within ships’ ballasts and on tourists (Musselman, 1994; Cuthbert and Wu, 2013). Among the 19 administrative units in Hainan Province, Haikou’s service industries and commerce are well-developed, especially tourism and transportation, compared with other administrative units in Hainan Province. This implies that ongoing development in other parts of Hainan (Central Committee of the Communist Party of China, and National Assembly of the PRC, 2020; Hainan Provincial Bureau of Statistics, 2021a; NPC Standing Committee, 2021) may increase the risk of invasions if additional measures are not put in place to curtail them.
We found that the SR and PD of various non-native species is related to climatic factors, particularly that measures of diversity were negative correlated with the lowest temperature of the coldest month. Climatic factors are known to be related to the successful invasion of many non-native species (Zenni et al., 2014). For example, previous studies have shown that the seeds of some plants must undergo vernalization under colder temperatures before germination; this is especially true for plants from temperate regions. Therefore it is unsurprising that non-native species of Hainan originate primarily from low-latitude, warm, and humid regions of Africa, tropical Asia, tropical America and pan-tropics (Figures 4–6 and Supplementary Appendix 1). This suggests that reduction in the arrival of potentially invasive species in Hainan can be curbed by paying particular attention to arriving ships and aircraft from these areas.
Various explanations emphasize that population density and GDP are key factors related to the composition, occurrence, and persistence of non-native species (Wu et al., 2010; Wang et al., 2011; Zhang et al., 2015; Salgado et al., 2019; Zhu et al., 2019). Generally, the higher the density of human residents, the higher the concentration of economic activities. This is consistent with our findings, in which we found that urban and rural built up areas and agricultural areas are the main habitats for invasive species. Similarly, this is in agreement with findings in prior studies showing that most invasive plants prefer to live in plant communities experiencing high levels of anthropogenic disturbance (Shan, 2003; Shan et al., 2006; Hu et al., 2011; Zhang and Xing, 2011). This may be attributed to the fact that continuous land management in these areas provides more suitable habitat for invasive species. In addition, previous studies have shown that vegetation cover and species diversity are higher in wealthy urban areas (Hope et al., 2003; Walker et al., 2009; Fan et al., 2019; Lin et al., 2021), and our study found that non-native plant diversity may also fit this pattern. Specifically, we found that savings deposits and GDP significantly affect the distributional patterns of non-native species. This is consistent with economic development in Hainan due establishment of the Hainan Island Free Trade Port. This port and associated trade generates considerable travel and new wealth within the Haikou and Danzhou administrative units (Hainan Provincial Bureau of Statistics, 2021b; Hainan Provincial Development and Reform Commission, 2021). Thus, these units had the largest PD and, consequently, show greater evolutionary diversity and variability of non-native plants (Ricotta and Avena, 2003). They likely also have a higher risk of additional, future plant species invasions.
Our research indicates that the distributional patterns of non-native plant species in Hainan are determined by the interactions of several different factors. Specifically, we found that the diversity of non-native species is related to climatic factors, especially the highest temperature of the warmest month and the lowest temperature of the coldest month, as well as soci-economic factors, particularly GDP and tourism. The socio-economic status of the provincial capital, Haikou, appears to make it particularly vulnerable to species invasions. As an island, Hainan is surrounded by the sea on all sides, so that its ecosystem has little communication with other regional ecosystems and is thus, fragile and vulnerable to invasion by foreign organisms. Therefore, the entire island may be at relatively high risk from invasion. It is critical to strengthen research on the distribution of existing invasive species, the potential hazards of established non-native species, and probable invasion mechanisms. Training garden maintenance personnel to identify invasive species and their hazards and to take preventive measures can effectively enhance our control over their spread, while also restoring native species, reducing the introduction of non-native species, and establishing a stable ecosystem dominated by native plants. Future studies on the social and ecological complexity of Hainan and its impact on non-native plant distribution patterns can provide better strategies for preventing plant invasions and protecting native species.
The original contributions presented in the study are included in the article/Supplementary Material, further inquiries can be directed to the corresponding author.
L-YG: writing—original draft, data curation, formal analysis, investigation, and visualization. MN: methodology and data curation. AH: validation and writing—review and editing. Q-WL: conceptualization. KB: writing—review. L-JD: data collection and funding. SQ: data collection and curation. H-FW: conceptualization, supervision, project administration, and funding acquisition. All authors contributed to the article and approved the submitted version.
This study was funded by the National Natural Science Foundation of China (32160273) and Shanghai Key Lab for Urban Ecological Processes and Eco-Restoration (SHUES2020A07) both to H-FW.
The authors declare that the research was conducted in the absence of any commercial or financial relationships that could be construed as a potential conflict of interest.
All claims expressed in this article are solely those of the authors and do not necessarily represent those of their affiliated organizations, or those of the publisher, the editors and the reviewers. Any product that may be evaluated in this article, or claim that may be made by its manufacturer, is not guaranteed or endorsed by the publisher.
We thank the editor and two reviewers for valuable comments that improved the quality of the manuscript.
The Supplementary Material for this article can be found online at: https://www.frontiersin.org/articles/10.3389/fevo.2022.838591/full#supplementary-material
Supplementary Appendix 1 | List of non-native plants and statistical tables in Hainan Province, China.
Supplementary Appendix 2 | Socioeconomic and environmental variables for each administrative unit.
Supplementary Appendix 3 | Coordinates from the field survey sampling locations.
Supplementary Appendix 4 | Figure of the curvilinear relationship between land area and non-native species diversity.
Beans, C. M., Kilkenny, F. F., and Galloway, L. F. (2012). Climate suitability and human influences combined explain the range expansion of an invasive horticultural plant. Biol. Invasions 14, 2067–2078.
Bellard, C., Jeschke, J. M., Leroy, B., and Mace, G. M. (2018). Insights from modeling studies on how climate change affects invasive alien species geography. Ecol. Evol. 8, 5688–5700. doi: 10.1002/ece3.4098
Blackburn, T. M., Delean, S., Pyšek, P., and Cassey, P. (2016). On the island biogeography of aliens: a global analysis of the richness of plant and bird species on oceanic islands. Glob. Ecol. Biogeogr. 25, 859–868.
Booth, B. D., Murphy, S. D., and Swanton, C. J. (2003). Weed Ecology in Natural and Agricultural Systems. Oxford: Oxford University Press.
Cadotte, M. W., Dinnage, R., and Tilman, D. (2012). Phylogenetic diversity promotes ecosystem stability. Ecology 93, S223–S233.
Central Committee of the Communist Party of China, and National Assembly of the PRC (2018). Guiding Opinions on Supporting Hainan’s Comprehensive Deepening of Reform and Opening-up (In Chinese). Beijing: Xinhua News Agency.
Central Committee of the Communist Party of China, and National Assembly of the PRC (2020). Overall Plan for the Construction of Hainan Free Trade Port (In Chinese). Beijing: Xinhua News Agency.
Chen, Z. D., and Li, D. Z. (2018). Phylogenetic diversity and biodiversity conservation. Science 70, 22–25.
Cheng, Y. Q., Zhang, J. P., and Chen, Y. (2021). Resource endowment, economic oundation and the construction of Hainan Free Trade Port. Resour. Sci. 43, 229–240.
Cheval, S., Dumitrescu, A., Adamescu, M., and Cazacu, C. (2020). Identifying climate change hotspots relevant for ecosystems in Romania. Clim. Res. 80, 165–173.
China National Development and Reform Commission, Ministry of Foreign Affairs, and Ministry of Commerce (2015). Promoting the Joint Construction of the Silk Road Economic Belt and The Vision and Actions of the 21st Century Maritime Silk Road. Beijing: China National Development and Reform Commission.
Cui, Y. C., Song, K., Guo, X. Y., Van Bodegom, P. M., Pan, Y. J., Tian, Z. H., et al. (2019). Phylogenetic and functional structures of plant communities along a spatiotemporal urbanization gradient: effects of colonization and extinction. J. Veg. Sci. 30, 341–351.
Cusack, C., Harte, M., and Chan, S. (2009). The Economics of Invasive Species. Corvallis: Oregon Sea Grant.
Cuthbert, K. L., and Wu, H. W. (2013). Border security: spotlight on weeds. Plant Prot. Q. 28, 68–69.
Dyer, E. E., Cassey, P., Redding, D. W., Collen, B., and Blackburn, T. M. (2017). The global distribution and drivers of alien bird species richness. PLoS Biol. 15:e2000942. doi: 10.1371/journal.pbio.2000942
Early, R., Bradley, B. A., Dukes, J. S., Lawler, J. J., Olden, J. D., Blumenthal, D. M., et al. (2016). Global threats from invasive alien species in the twenty-first century and national response capacities. Nat. Commun. 7:12485. doi: 10.1038/ncomms12485
Egawa, C. (2017). Wind dispersal of alien plant species into remnant natural vegetation from adjacent agricultural fields. Glob. Ecol. Conserv. 11, 33–41. doi: 10.1016/j.gecco.2017.04.008
Faith, D. P. (1992). Conservation evaluation and phylogenetic diversity. Biol. Conserv. 61, 1–10. doi: 10.1016/0006-3207(92)91201-3
Fan, C., Johnston, M., Darling, L., Scott, F., and Liao, F. H. (2019). Land use and socio-economic determinants of urban forest structure and diversity. Landsc. Urban Plan. 181, 10–21.
FAO (1998). The Global Forest Resources Assessment 2000 (FRA 2000): Terms and Definitions. Rome: FAO.
FAO (2004). Global Forest Resources Assessment Update 2005 (FRA 2005): Terms and Definitions. Rome: FAO Forestry Department, 34.
Fick, S. E., and Hijmans, R. J. (2017). WorldClim 2: new 1 km spatial resolution climate surfaces for global land areas. Int. J. Climatol. 37, 4302–4315.
Fridley, J. D., Stachowicz, J. J., Naeem, S., Sax, D. F., Seabloom, E. W., Smith, M. D., et al. (2007). The invasion paradox: reconciling pattern and process in species invasions. Ecology 88, 3–17. doi: 10.1890/0012-9658(2007)88[3:tiprpa]2.0.co;2
González, J. A., Montes, C., Rodríguez, J., and Tapia, W. (2008). Rethinking the Galapagos Islands as a complex social-ecological system: implications for conservation and management. Ecol. Soc. 13, 582–592.
Gruber, M. A., Janssen-May, S., Santoro, D., Cooling, M., and Wylie, R. (2021). Predicting socio-economic and biodiversity impacts of invasive species: red imported fire ant in the developing western Pacific. Ecol. Manag. Restor. 22, 89–99. doi: 10.1111/emr.12457
Gu, Z. G., Gu, L., Eils, R., Schlesner, M., and Brors, B. (2014). Circlize implements and enhances circular visualization in R. Bioinformatics 30, 2811–2812. doi: 10.1093/bioinformatics/btu393
Guo, Q., Cen, X., Song, R., Mckinney, M. L., and Wang, D. (2020). Worldwide effects of non-native species on species–area relationships. Conserv. Biol. 35, 711–721. doi: 10.1111/cobi.13573
Hainan Provincial Bureau of Statistics (2014). Statistical Yearbook of Hainan 2014, China. Haikou: Hainan Provincial Bureau of Statistics.
Hainan Provincial Bureau of Statistics (2019). Statistical Yearbook of Hainan 2019, China. Haikou: Hainan Provincial Bureau of Statistics.
Hainan Provincial Bureau of Statistics (2021a). Statistical Yearbook of Hainan 2021, China. Haikou: Hainan Provincial Bureau of Statistics.
Hainan Provincial Bureau of Statistics (2021b). Statistical Communiqué on Hainan Province’s National Economic and Social Development in 2020 (In Chinese). Available online at: http://stats.hainan.gov.cn/tjj/tjgb/fzgb/n_81550/202102/t20210220_2936215.html (accessed December 30, 2021).
Hainan Provincial Development and Reform Commission (2021). The Fourteenth Five-Year Plan for National Economic and Social Development of Hainan Province and the Outline of Long-term Goals for 2035. Haikou: Hainan Provincial Development and Reform Commission.
Harris, AJ, Dee, J., and Palmer, M. W. (2017). The effects of taxonomic rank on climatic calibrations: a test using extant floras of United States counties. Rev. Palaeobot. Palynol. 244, 316–324.
Haubrock, P. J., Turbelin, A. J., Cuthbert, R. N., Novoa, A., and Courchamp, F. (2021). Economic costs of invasive alien species across Europe. NeoBiota 67, 153–190.
Hooper, D. U., and Dukes, J. S. (2010). Overyielding among plant functional groups in a long term experiment. Ecol. Lett. 7, 95–105.
Hope, D., Gries, C., Zhu, W., Fagan, W. F., Redman, C. L., Grimm, N. B., et al. (2003). Socioeconomics drive urban plant diversity. Proc. Natl. Acad. Sci. U. S. A. 100, 8788–8792. doi: 10.1073/pnas.1537557100
Hu, X. H., Xiao, Y. A., and Zen, J. J. (2011). Investigation and analysis on alien plants in bawangling national nature reserve in Hainan province. J. Jinggangshan Univ. 32, 131–136.
Jeschke, J. M., and Strayer, D. L. (2005). From the cover: invasion success of vertebrates in Europe and North America. Proc. Natl. Acad. Sci. U. S. A. 102, 7198–7202. doi: 10.1073/pnas.0501271102
Jin, Y., and Qian, H. (2019). V. PhyloMaker: an R package that can generate very large phylogenies for vascular plants. Ecography 42, 1353–1359.
Ju, R. T., Li, X., Jiang, J. J., Wu, J., Liu, J., Strong, D. R., et al. (2020). Emerging risks of non-native species escapes from aquaculture: call for policy improvements in China and other developing countries. J. Appl. Ecol. 57, 85–90.
Knapp, S., Kühn, I., Schweiger, O., and Klotz, S. (2008). Challenging urban species diversity: contrasting phylogenetic patterns across plant functional groups in Germany. Ecol. Lett. 11, 1054–1064. doi: 10.1111/j.1461-0248.2008.01217.x
Kull, C. A., Shackleton, C. M., Cunningham, P. J., Ducatillon, C., Dufour-Dror, J.-M., Esler, K. J., et al. (2011). Adoption, use and perception of Australian Acacias around the world. Divers. Distrib. 17, 822–836. doi: 10.1111/j.1472-4642.2011.00783.x
Li, J., Fan, G., and He, Y. (2020). Predicting the current and future distribution of three Coptis herbs in China under climate change conditions, using the MaxEnt model and chemical analysis. Sci. Total Environ. 698:134141. doi: 10.1016/j.scitotenv.2019.134141
Lin, J., Wang, Q., and Li, X. J. (2021). Socioeconomic and spatial inequalities of street tree abundance, species diversity, and size structure in New York City. Landsc. Urban Plan. 206:103992.
Lin, M. N. (2021). The development trend of tourism market economy under the background of Hainan Free Trade Port. Mark. Circle 38, 46–47.
Liu, C., He, D., Chen, Y., and Olden, J. D. (2017). Species invasions threaten the antiquity of China’s freshwater fish fauna. Divers. Distrib. 23, 556–566. doi: 10.1111/ddi.12541
Lopez, B. E., Urban, D., and White, P. S. (2018). Testing the effects of four urbanization filters on forest plant taxonomic, functional, and phylogenetic diversity. Ecol. Appl. 28, 2197–2205. doi: 10.1002/eap.1812
Ma, J. S., Yan, X. L., Shou, H. Y., Chen, L., Liu, Q. R., Liu, Y., et al. (2013). List of Alien Invasive Plants in China (In Chinese). Beijing: Higher Education Press.
Ma, J., and Clemants, S. (2006). A history and overview of the Flora Reipublicae Popularis Sinicae (FRPS, Flora of China, Chinese edition, 1959–2004). Taxon 55, 451–460.
McNeely, J. A. (2013). Global Efforts to Address the Wicked Problem of Invasive Alien Species. Berlin: Springer.
Ministry of Environmental Protection, the People’s Republic of China [MEP-PRC] (2014). Announcements of Publishing List of Invasive Alien Species in China (III). Available Online at: http://www.zhb.gov.cn/gkml/hbb/bgg/201408/t20140828_288367.htm
Musselman, L. J. (1994). Harmful non-indigenous species in the United States. Econ. Bot. 48, 138–138.
NPC Standing Committee (2021). Hainan Free Trade Port Law of the People’s Republic of China (In Chinese). Beijing: Xinhua News Agency.
Nunes Leonel, J. R., Raposo Mauro, A. M., and Gomes Carlos, J. P. (2020). The impact of tourism activity on coastal biodiversity: a case study at praia da cova redonda (Algarve—Portugal). Environments 7:88.
Pavoine, S., and Bonsall, M. B. (2010). Measuring biodiversity to explain community assembly: a unified approach. Biol. Rev. 86, 792–812. doi: 10.1111/j.1469-185X.2010.00171.x
Peng, Z. B., Wang, C. Y., and Jiang, Y. (2013). Alien invasion plants in Hainan Island and control measures. Trop. Agric. Sci. 33, 52–57.
Pyíek, P., Sadlo, J., Manda, K. B., and Jarošík, V. (2003). Czech alien flora and the historical pattern of its formation: what came first to central Europe? Oecologia 135, 122–130. doi: 10.1007/s00442-002-1170-7
Pyšek, P., Hulme, P. E., Simberloff, D., Bacher, S., Blackburn, T. M., Carlton, J. T., et al. (2020). Scientists’ warning on invasive alien species. Biol. Rev. 95, 1511–1534. doi: 10.1111/brv.12627
R Development Core Team (2016). R: A Language and Environment for Statistical Computing. Vienna: R foundation for statistical computing.
Richardson, D. M., Allsopp, N., D ’Antonio, C. M., Milton, S. J., and Rejmánek, M. (2010). Plant invasions–the role of mutualisms. Biol. Rev. 75, 65–93. doi: 10.1017/s0006323199005435
Richardson, D. M., Pyšek, P., and Rejmánek, M. (2000). Naturalization and invasion of alien plants: concepts and definitions. Divers. Distrib. 6, 93–107. doi: 10.1046/j.1472-4642.2000.00083.x
Ricotta, C., and Avena, G. C. (2003). An information-theoretical measure of taxonomic diversity. Acta Biotheor. 51, 35–41. doi: 10.1023/a:1023000322071
Salgado, J., Vélez, M. I., Caceres-Torres, L. C., Villegas-Ibagon, J. A., and González-Arango, C. (2019). Long-term habitat degradation drives neotropical macrophyte species loss while assisting the spread of invasive plant species. Front. Ecol. Evol. 7:140. doi: 10.3389/fevo.2019.00140
Sardain, A., Sardain, E., and Leung, B. (2019). Global forecasts of shipping traffic and biological invasions to 2050. Nat. Sustain. 2, 274–282.
Schelhas, J., Alexander, J., Brunson, M., Cabe, T., and Vukomanovic, J. (2021). “Social and cultural dynamics of non-native invasive species,” in Invasive Species in Forests and Rangelands of the United States, eds T. M. Poland, T. Patel-Weynand, D. M. Finch, C. F. Miniat, D. C. Hayes, and V. M. Lopez (Cham: Springer), 267–291. doi: 10.1007/978-3-030-45367-1_12
Shan, J. (2003). Preliminary studies on exotic plant communities in Hainan. Trop. Agric. Sci. 23, 1–4.
Shan, J. L., and Wang, X. B. (2011). Agrostidoideous Flora (Agrostidoideae) on the coastal region of Hainan Island. Trop. Agric. Sci. 32, 518–522.
Shan, J. L., Yang, F. C., and Zheng, X. Q. (2006). Exotic plants in Hainan province. Subtrop. Plant Sci. 35, 39–44.
Sharma, G. P., Esler, K. J., and Blignaut, J. N. (2010). Determining the relationship between invasive alien species density and a country’s socio-economic status. South Afr. J. Sci. 106, 1–6.
South China Botanical Garden of Chinese Academy of Sciences and Hong Kong South China Botanical Garden of Chinese Academy of Sciences, and Hong Kong Herbarium (2007–2011). Flora of Hong Kong, Vol. 4. Beijing: Chinese Academy of Sciences.
Tassin, J., and Kull, C. A. (2015). Facing the broader dimensions of biological invasions. Land. Use Policy 42, 165–169. doi: 10.1016/j.landusepol.2014.07.014
Tucker, C. M., Cadotte, M. W., Carvalho, S. B., Davies, T. J., Ferrier, S., Fritz, S. A., et al. (2016). A guide to phylogenetic metrics for conservation, community ecology and macroecology. Biol. Rev. 92, 698–715. doi: 10.1111/brv.12252
UNECE/FAO (2000). Forest resources of Europe, CIS, North America, Australia, Japan and New Zealand. New York: United Nations.
Vaz, A. S., Kueffer, C., Kull, C. A., Richardson, D. M., Vicente, J. R., Kühn, I., et al. (2017). Integrating ecosystem services and disservices: insights from plant invasions. Ecosyst. Serv. 23, 94–107.
Walker, J. S., Grimm, N. B., Briggs, J. M., Gries, C., and Dugan, L. (2009). Effects of urbanization on plant species diversity in central Arizona. Front. Ecol. Environ. 7, 465–470. doi: 10.1890/080084
Wang, H. F., Lopez-Pujol, J., Meyerson, L. A., Qiu, J. X., Wang, X. K., and Ouyang, Z. Y. (2011). Biological invasions in rapidly urbanizing areas: a case study of Beijing, China. Biodivers. Conserv. 20, 2483–2509. doi: 10.1007/s10531-011-9999-x
Wang, Z. Q., Guillot, D., Ren, M. X., and López-Pujol, J. (2016). Kalanchoe (Crassulaceae) as invasive aliens in China–new records, and actual and potential distribution. Nordic J. Bot. 34, 349–354.
Webb, C. O. (2010). Picante: r tools for integrating phylogenies and ecology. Bioinformatics 26, 1463–1464. doi: 10.1093/bioinformatics/btq166
Wiersema, J. H., and León, B. (2016). World Economic Plants. Boca Raton: CRC Press. doi: 10.1201/b13945
Wu, S. H., Sun, H. T., Teng, Y. C., Rejmanek, M., Chaw, S. M., Yang, T. A., et al. (2010). Patterns of plant invasions in China: taxonomic, biogeographic, climatic approaches and anthropogenic effects. Biol. Invasions 12, 2179–2206.
Xie, C., Zhang, G., Jim, C., Liu, X., Zhang, P., Qiu, J., et al. (2021). Bioclimatic suitability of actual and potential cultivation areas for Jacaranda mimosifolia in Chinese Cities. Forests 12:951. doi: 10.3390/f12070951
Xiong, W., Wang, H., Wang, Q., Tang, J., and Wang, Z. (2018). Non-native species in the three gorges dam reservoir: status and risks. BioInvasions Rec. 7, 153–158.
Yang, L., Maron, J. L., and Callaway, R. M. (2015). Inhibitory effects of soil biota are ameliorated by high plant diversity. Oecologia 179, 519–525. doi: 10.1007/s00442-015-3351-1
Zenni, R. D., Bailey, J. K., Simberloff, D., and Gurevitch, J. (2014). Rapid evolution and range expansion of an invasive plant are driven by provenance–environment interactions. Ecol. Lett. 17, 727–735. doi: 10.1111/ele.12278
Zhai, J., Grebner, D. L., Grala, R. K., Fan, Z., and Munn, I. A. (2018). Contribution of ecological and socioeconomic factors to the presence and abundance of invasive tree species in Mississippi, USA. Forests 9:38.
Zhang, R., and Xing, F. (2011). The composition and origin of alien plants in Ganshiling Nature Reserve in Hainan, China. Guizhou Agric. Sci. 39, 31–33.
Zhang, R., Zhao, Z., Su, W., and Xing, F. (2015). Distribution and assessment of rare and endangered plants in Ganshiling Nature Reserve, Hainan. Biodivers. Sci. 23, 11–17.
Zhang, W. (1998). China’s Biodiversity: A Country Study. Beijing: China Environmental Science Press.
Zhou, Q., Wang, Y., Li, X., Liu, Z., Wu, J., Musa, A., et al. (2020). Geographical distribution and determining factors of different invasive ranks of alien species across China. Sci. Total Environ. 722:137929. doi: 10.1016/j.scitotenv.2020.137929
Zhu, Z. X., Nizamani, M. M., Harris, AJ, and Wang, H. F. (2021). Anthropogenic factors are stronger drivers of patterns of endemic plant diversity on Hainan Island of China than natural environmental factors. PLoS One 16:e0257575. doi: 10.1371/journal.pone.0257575
Keywords: biodiversity, invasive plants, species richness, biogeography, urban green space, phylogenetic diversity, flora of Hainan
Citation: Guo L-Y, Nizamani MM, Harris AJ, Lin Q-W, Balfour K, Da L-J, Qureshi S and Wang H-F (2022) Socio-Ecological Effects on the Patterns of Non-native Plant Distributions on Hainan Island. Front. Ecol. Evol. 10:838591. doi: 10.3389/fevo.2022.838591
Received: 18 December 2021; Accepted: 03 February 2022;
Published: 03 March 2022.
Edited by:
Runguo Zang, Chinese Academy of Forestry, ChinaReviewed by:
Wang Zhitai, Guizhou University, ChinaCopyright © 2022 Guo, Nizamani, Harris, Lin, Balfour, Da, Qureshi and Wang. This is an open-access article distributed under the terms of the Creative Commons Attribution License (CC BY). The use, distribution or reproduction in other forums is permitted, provided the original author(s) and the copyright owner(s) are credited and that the original publication in this journal is cited, in accordance with accepted academic practice. No use, distribution or reproduction is permitted which does not comply with these terms.
*Correspondence: Hua-Feng Wang, aGZ3YW5nQGhhaW5hbnUuZWR1LmNu
Disclaimer: All claims expressed in this article are solely those of the authors and do not necessarily represent those of their affiliated organizations, or those of the publisher, the editors and the reviewers. Any product that may be evaluated in this article or claim that may be made by its manufacturer is not guaranteed or endorsed by the publisher.
Research integrity at Frontiers
Learn more about the work of our research integrity team to safeguard the quality of each article we publish.