- 1Wuxi Fisheries College, Nanjing Agricultural University, Wuxi, China
- 2National Demonstration Center for Experimental Fisheries Science Education, Shanghai Ocean University, Shanghai, China
- 3Rescues Center of Qinghai Lake Naked Carp, Xining, China
The genetic diversity in the naked carp (Gymnocypris przewalskii) of China is threatened by climate change, human activities, as well as natural factors, eliciting conservation concerns. To explore the genetic aspects of G. przewalskii, the genetic diversity, genetic structure, population differentiation, and historical demography of 566 representative individuals from seven geographically distinct ranges of Qinghai Lake were evaluated by mitochondrial DNA cytochrome oxidase subunit I (COI) and D-loop sequences. Estimates of genetic parameters showed that the seven populations of G. przewalskii had high levels of haplotype diversity (0.50243–0.94620) and low levels of nucleotide diversity (0.00079–0.00624). Haplotype genealogy indicated there was no obvious phylogenetic pattern between haplotypes. Both markers denoted the absence of population genetic structure [the genetic differentiation coefficient F-statistics (Fst) < 0] and the presence of high genetic flow (COI: 0.9731–1.0441; D-loop: 0.9480–1.0398). The mismatch between the distribution and neutrality tests supported the evidence of population expansion, which occurred during the late middle Pleistocene [COI: 0.36–0.108 MYA (Million Years Ago); D-loop: 0.497–0.165 MYA]. Furthermore, this work illustrated two simple, reliable, and inexpensive molecular markers for analysis of genetic diversity, while the sensitivity of the mitochondrial D-loop region as a reflection of genetic diversity in G. przewalskii is higher than that of the COI gene.
Introduction
Naked Carp (Gymnocypris przewalskii) is a cyprinid fish that mainly inhabits Qinghai Lake of China at an altitude of 3,000–4,000 m (Wu et al., 1964; Tong et al., 2015). This species, the unique dominant population in Qinghai Lake, is an endemic and ecologically important fish in the Northwest Plateau ecosystem (Zhang and Zhang, 1963; Wang and Xie, 2004; Wang et al., 2014). Particularly, G. przewalskii migrates into freshwater tributaries connected with Qinghai Lake to spawn from April to July every year. Then, they migrate back to Qinghai Lake after the reproductive behavior. However, much less is known about the specific migratory routes and whether there are genetic differences between different geographical populations of G. przewalskii. Due to overfishing, dam construction, water pollution, and environmental factors like climate, the wild populations of G. przewalskii have declined dramatically in size, and the utilization of this resource has far exceeded appropriate limits (He, 2008; Luo, 2015). In response, and to evaluate this resource, the government has developed a series of initiatives, including the artificial restoration of migratory channels and fishery stocking (Shi, 2008). Such a stocking may evaluate resources, but may also result in negative impacts, such as loss of genetic diversity and fitness, even causing genetic risk (Anneville et al., 2015). Thus, additional research is needed on the status of germplasm resources. Currently, research on G. przewalskii mainly focused on fingerling breeding technology, otolith marking, gene cloning, expression, and so on (Cao et al., 2009; Feng et al., 2019, 2021; Min et al., 2020; Wu et al., 2020; Jiang et al., 2021). Unfortunately, relatively little is understood about this species’ genetic characteristics (Shi, 2008).
China’s wildlife species account for approximately 11% of the world, so strengthening China’s wildlife conservation is of great significance to global biodiversity (Gong et al., 2020). Genetic characterizations of natural populations are key to providing a point of surveillance and conservation (Liu, 2004; Zhang et al., 2015; Yan et al., 2020). Knowledge of the genetic variation in natural populations and the implementation of an efficient management plan based on genetic features are important measures for its maintenance and recovery (Cross, 2015; Rômulo et al., 2018). Nevertheless, limited effort has been made to monitor the genetic diversity of G. przewalskii on wild populations in China. Therefore, it is necessary to assess the genetic diversity of G. przewalskii to understand the conservation status and develop effective protection measures.
According to present knowledge, early studies performed a restriction fragment length polymorphism analysis in G. przewalskii and reported high levels of genetic diversity (Zhao et al., 2001; Qi, 2002; Xu et al., 2003). Similarly, based on the mitochondrial D-loop region, Zhang et al. (2013) found that G. przewalskii possessed high levels of genetic diversity and a certain degree of differentiation among G. przewalskii in different geographical populations (Qinghai Lake, Crooke Lake, Ganzi River, and Cao Dalian). The analyses of amplified fragment length polymorphism and simple sequence repeat further demonstrated a high level of genetic diversity, which may be related to the origin and evolution of G. przewalskii and the specificity of the plateau environment (Jiang et al., 2009; Wang et al., 2015). Nonetheless, some researchers reported that there existed quite a weak genetic differentiation between the Heima River, Buha River, and Shaliu River populations and quite a strong gene exchange among the three populations, simultaneously (Zhang et al., 2005; Chen et al., 2006). This point of view was also supported by Zhao et al. (2006) who found evidence for the absence of extensive population structure and a low level of diversity. These issues addressed in previous studies obtained discrepant or even paradoxical results. Hence, it is urgently needed to have a better understanding of the genetic characteristics of G. przewalskii.
Fish mitochondrial DNA has a simple structure, small molecular weight, high conservation, and maternal inheritance. The genetic diversity of fish can be more reliably analyzed by comparing base sequence composition and analyzing mutation sites (Perez-Enriquez et al., 1999). Mitochondrial cytochrome oxidase subunit I (COI) is a relatively conservative gene sequence with a moderate evolution rate. It is one of the most thoroughly studied mitochondrial genes and is ideal as a molecular marker (Sari et al., 2015). At the same time, the D-loop control region has the characteristics of rapid evolution and more genetic variation because of no coding pressure, which is suitable for detecting the genetic diversity within and between populations (Gatt et al., 2000). In this study, the genetic diversity and population differentiation of G. przewalskii from 7 different locations in Qinghai Lake were evaluated based on the COI gene and D-loop control region to provide a theoretical basis for their resource protection.
Materials and Methods
Materials
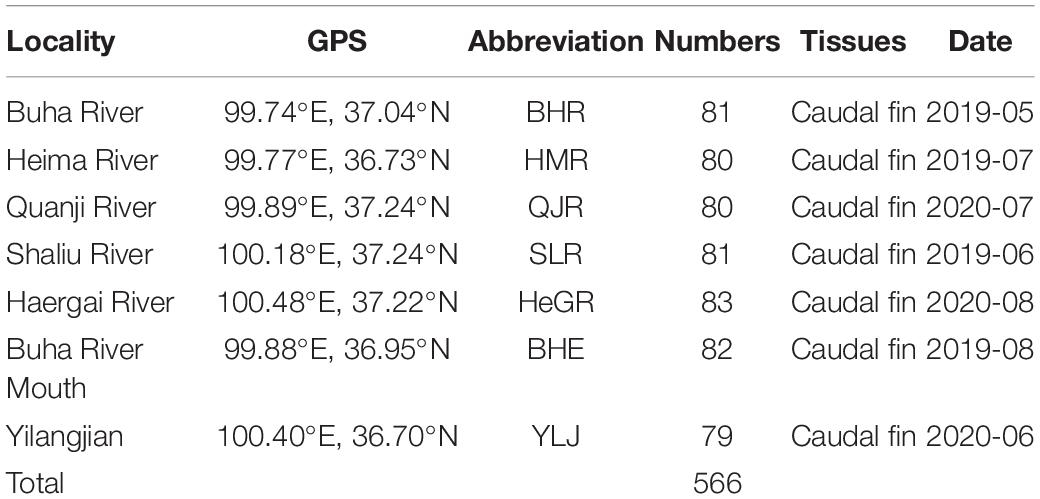
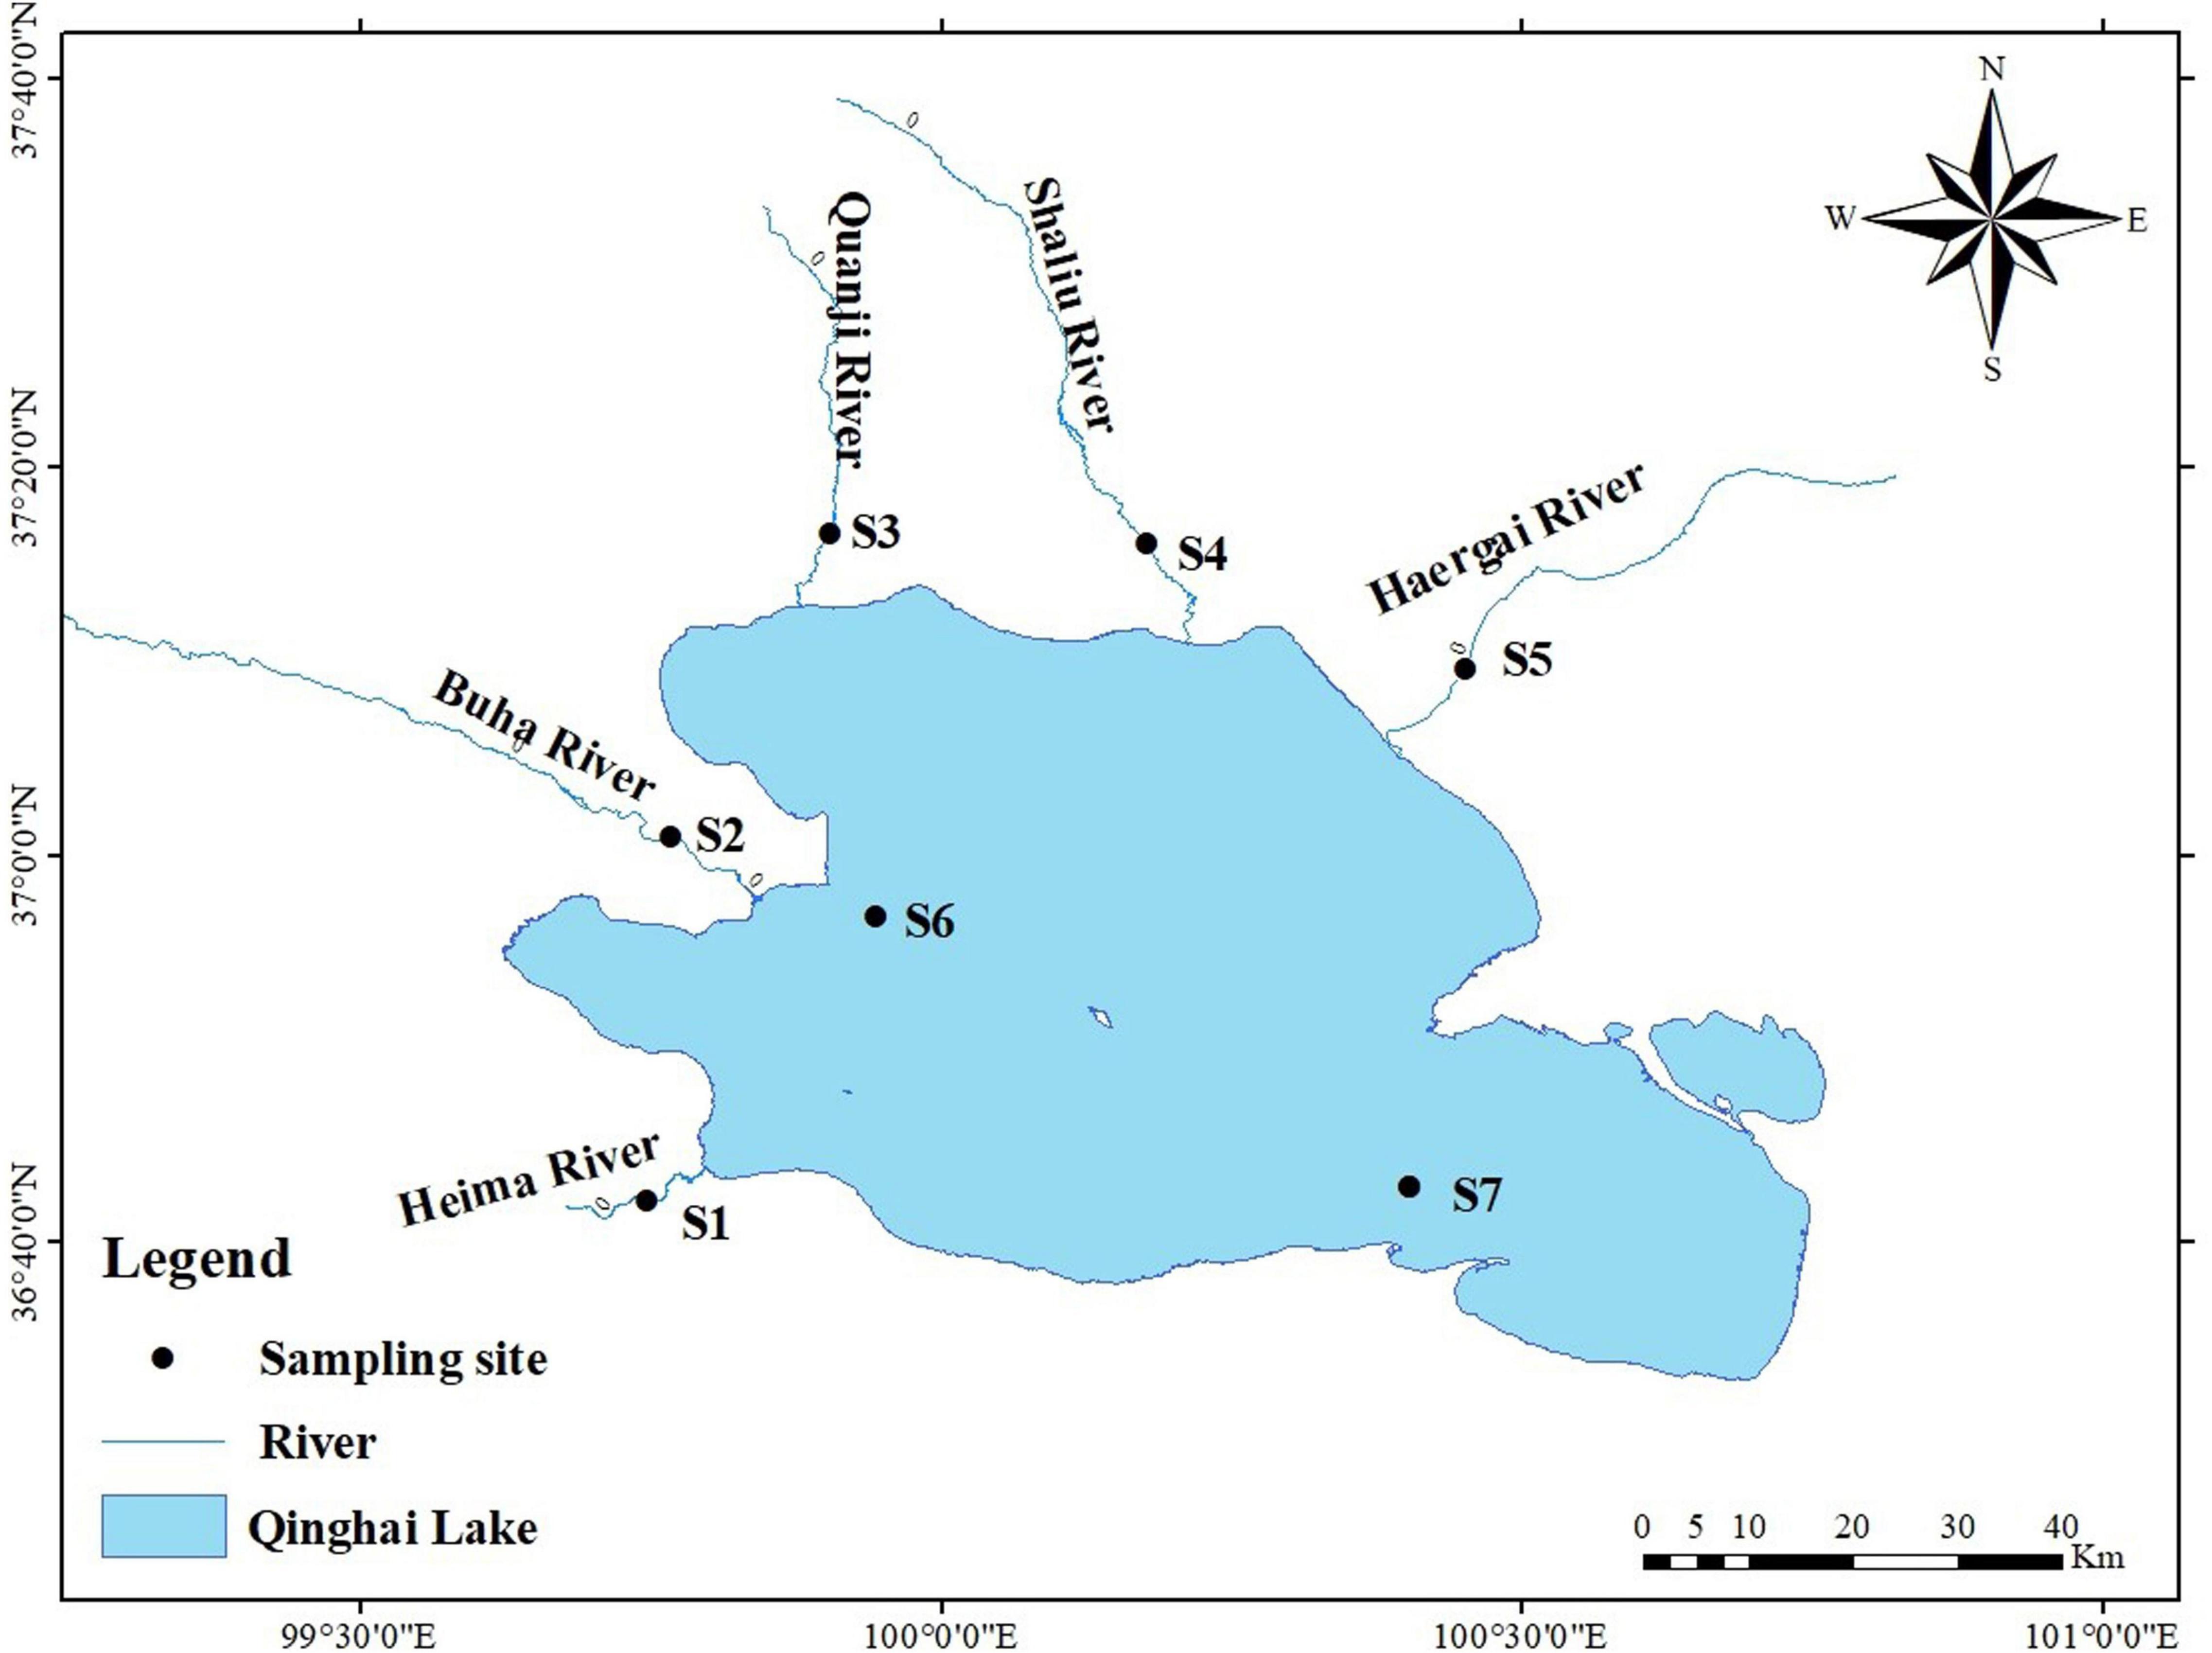
A total of 566 G. przewalskii individuals were collected randomly from the Buha River Estuary (BHE), Yilang Jian (YLJ), Heima River (HMR), Buha River (BHR), Quanji River (QJR), Shaliu River (SLR), and Haergai River (HeGR) from 2019 to 2020 (Table 1 and Figure 1), which were representative. The detailed geographical positions can be seen in Figure 1. These five rivers are the largest tributaries connected with Qinghai Lake, where G. przewalskii migrate to spawn annually, and the YLJ area is located in the Qinghai Lake area, where G. przewalskii returns after spawning. After the morphological identification (Zhao et al., 2005), the caudal fins of each individual were collected and preserved in anhydrous ethanol at room temperature for later use.
DNA Extraction, Amplification, and Sequencing of the Mitochondrial Fragments
No more than 30 mg of each fin were used for genomic DNA extraction using a genomic DNA extraction kit (TIANamp Marine Animals DNA Kit, TIANGEN) in the laboratory. The extracted DNA was verified by electrophoresis in 1% agarose gel and then stored at -20°C until use. The fragments of the COI gene were amplified with primers L5956-COI (5′-CACAAAGACATTGGCACCCT-3′) and H6855-COI (5′-AGTCAGCTGAAKCTTTTAC-3′) (Miya and Nishida, 2000). The fragments of the D-loop control region were amplified with primers D-loop-F5 (5′-GGGATATGTCATCCTTTATGG-3′) and D-loop-R5 (5′-GGGTTTGACAAGAATAACAGG-3′) (Zhang et al., 2015). PCR analysis was performed using 25 μl final volume containing 2 μl template DNA, 1.25 μl of upstream and downstream primers, 12 μl of premix, and 8.5 μl of double-distilled H2O. After an initial 5 min denaturing step at 94°C, 35 cycles of amplification were performed at 94°C for 10 s, annealing for 10 s (COI 57°C and D-loop 58°C), elongation at 72°C for 30 s, and a final extension at 72°C for 10 min. The PCR products were verified by 2% agarose gel electrophoresis. The purified PCR products were sequenced at the Shanghai Yixin Biotechnology Company (Shanghai, China).
Data Analysis
Nucleotide sequences obtained were aligned using Clustal X 2.0 with the default settings and manually examined (Larkin et al., 2007). The base composition, genetic distance within and between populations, variable sites, and parsimony-informative sites were determined using the MEGA X (Kumar et al., 2018) software. The phylogenetic neighbor-joining (NJ) tree was built using the Kimura 2-parameters method with MEGA X, with 1,000 bootstrap replicates (Kumar et al., 2018). We compared our COI sequences with Gymnocypris dobula (accession number HQ198864.1), Gymnocypris namensis (accession number HQ198865.1), Gymnocypris firmispinatus (accession number MF122270.1), and Gymnocypris potanini (accession number MK716230.1), and compared our D-loop sequences with G. dobula (accession number MK886318.1), G. namensis (accession number MK886398.1), Gymnocypris waddellii (accession number KY461279.1), and G. potanini (accession number MG756690.1) that were downloaded from GenBank. We used the COI sequence (accession number JX983283.1) and D-loop sequence (accession number KX576711.1) of Cyprinus carpio from GenBank as the outgroup. Additionally, the gene flow (Nm) and genetic diversity parameters such as haplotype number (h), haplotype diversity (Hd), and nucleotide diversity (pi) were inferred using the program DnaSP v6.0 (Julio et al., 2017) for downstream analyses. The relationships among the samples were visualized using a haplotype network constructed based on the Network 10.2 software (Bandelt et al., 1999). The analysis of molecular variance (AMOVA) was determined in Arlequin 3.5 (Laurent and Heidi, 2010). Furthermore, the historical population expansion was examined using a neutrality test and the mismatch distribution in DnaSP v6.0. For the neutrality test, the values of Tajima’s D and Fu’s FS were calculated (Tajima, 1989; Fu and Li, 1993). The timing of possible population expansions (t) was calculated from the relationship t = Tτ /2 μk, where T was the generation time, τ was the mode of the mismatch distribution, μ was the mutation rate per nucleotide, and k was the number of nucleotides of the analyzed fragment (Rogers and Harpending, 1992). The time of initial maturity for G. przewalskii was estimated to be 3–4 years. Here, we used 4 years as the generation time (Ministry of Agriculture and Rural Affairs of the People’s Republic of China, 2003). We used a range of mutation rates (COI: 1–3% per million years, D-loop: 3–10% per million years) (Donaldson and Wilson, 1999; Wang et al., 2013) and the value of τ was calculated using Arlequin 3.5 (Laurent and Heidi, 2010).
Results
Nucleotide Composition
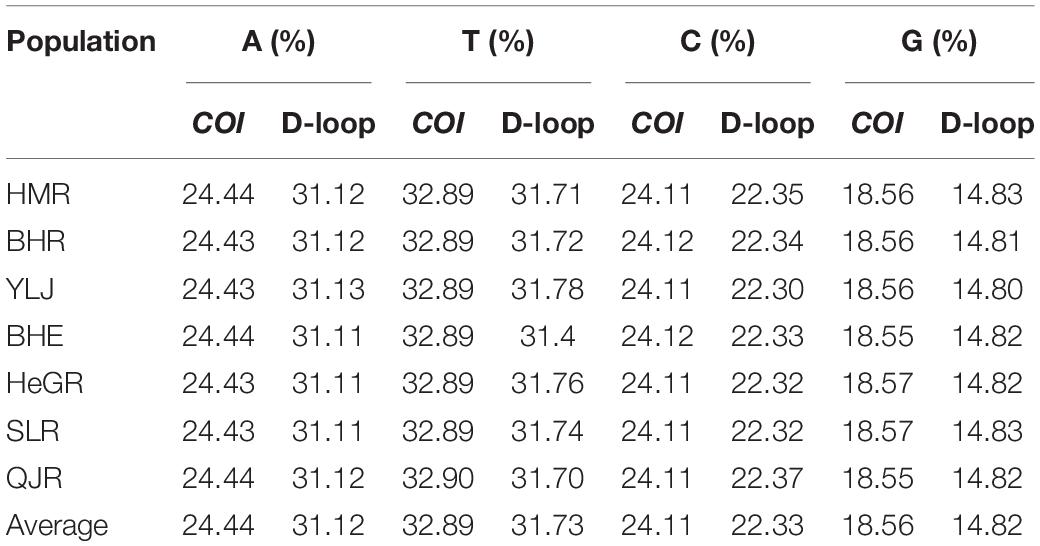
After submitting the company’s sequencing results to the NCBI database and editing for calibration, among the 566 individuals of seven regional populations of G. przewalskii, the partial sequences of the COI gene were 725 base pairs (bp), and the length of the D-loop region was 611 bp. The A+T content was rich (57.33 and 62.85%, respectively) in the nucleotide composition of the COI and D-loop sequences, and the D-loop region had the higher A+T content compared to that in COI (Table 2).
For the COI gene, 17 haplotypes were identified. Among them, only four haplotypes (Hap 1, Hap 2, Hap 5, and Hap 6) were found in seven populations, and Hap1 was the most frequent one (Table 3 and Figure 2). For the D-loop region, 66 haplotypes were identified. Among them, eleven haplotypes were found in seven populations, and Hap1 and Hap4 were the most frequent ones (Table 3 and Figure 3).
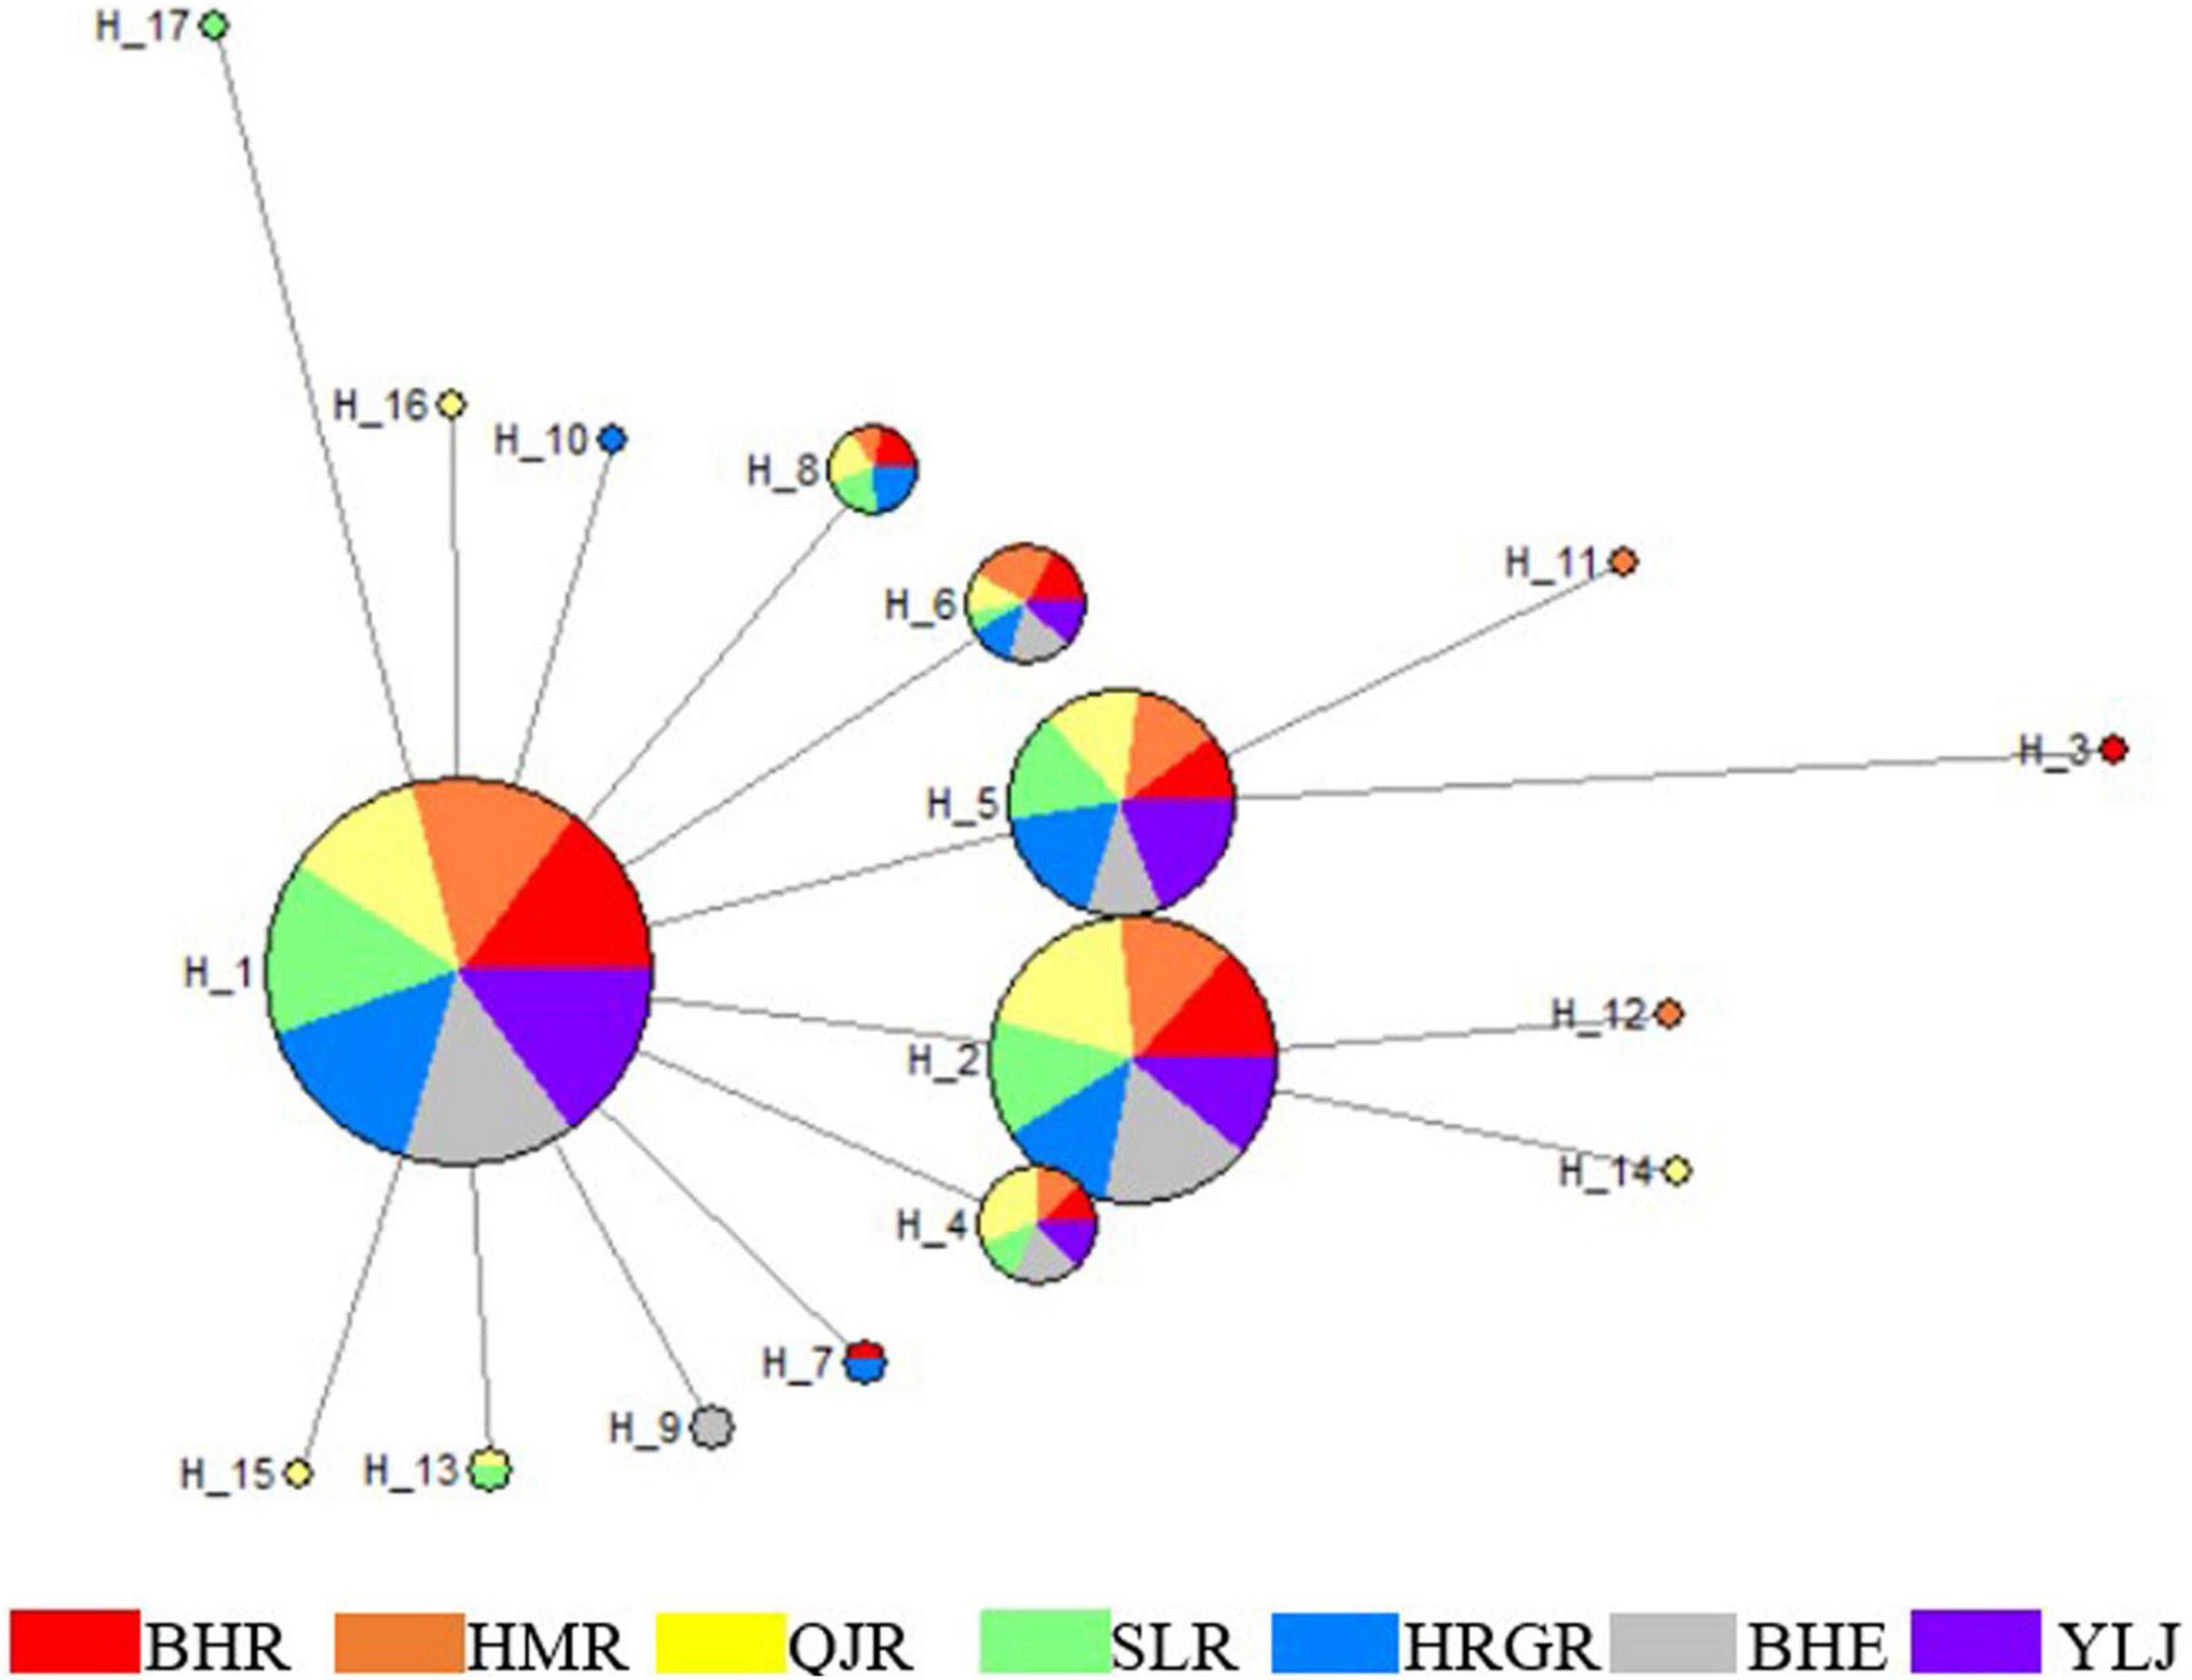
Figure 2. Haplotype network of G. przewalskii based on COI gene. Each circle represents a haplotype and its size is proportional to haplotype frequency. Numbers indicate the name of haplotypes and colors represent geographic locations.
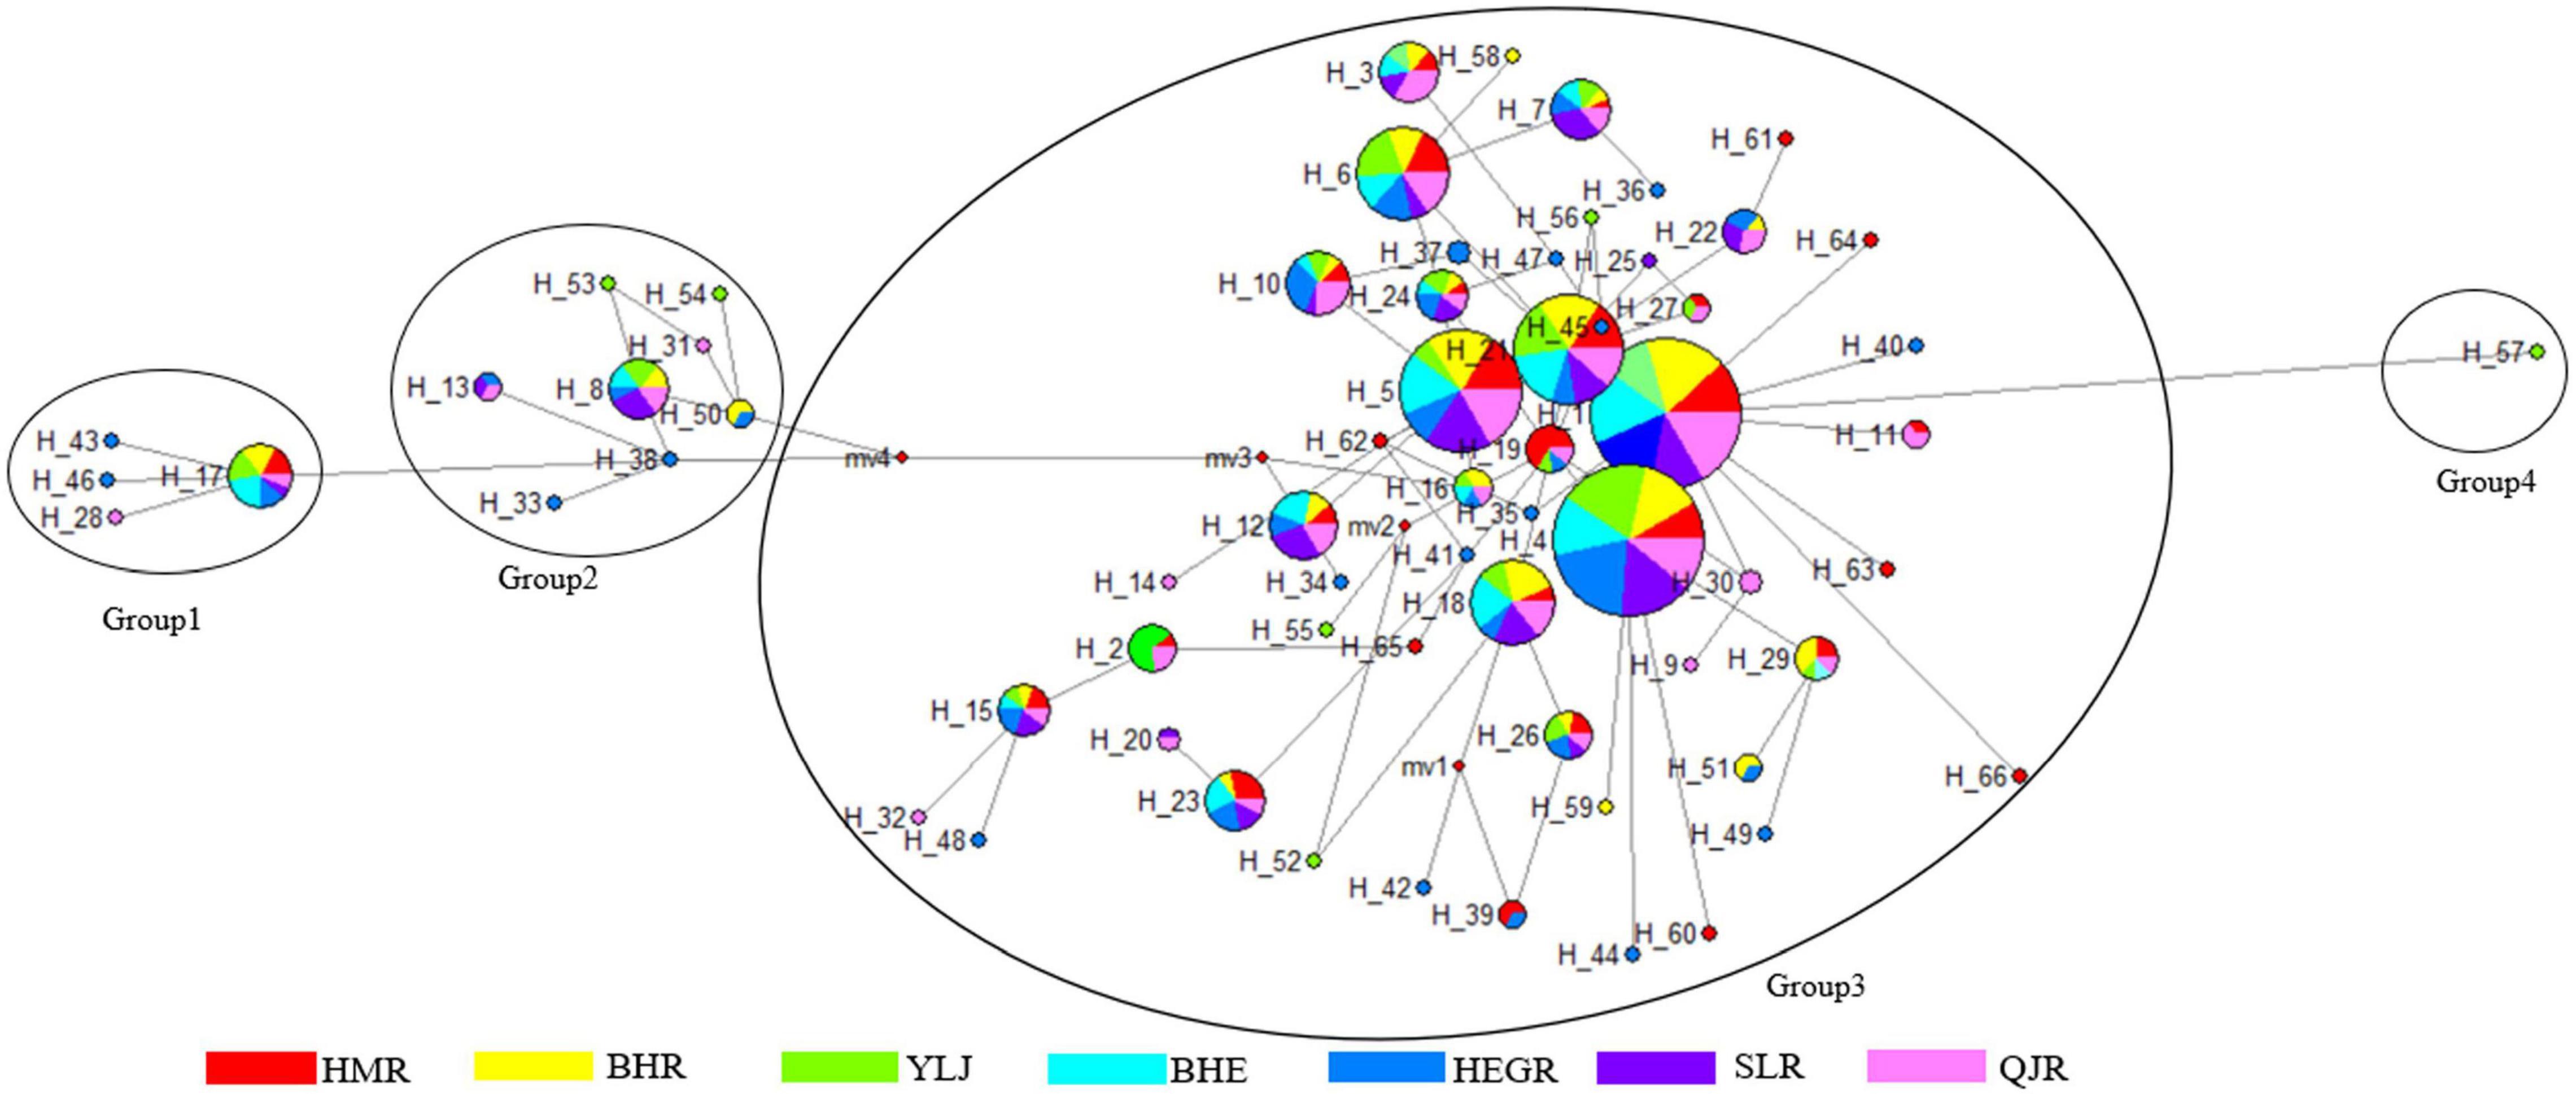
Figure 3. Haplotype network of D-loop region in G. przewalskii. Each circle represents a haplotype and its size is proportional to the haplotype frequency. The numbers indicate the name of the haplotypes and the colors represent geographic locations.
Genetic Diversity
A total of 15 and 55 variable sites, including 8 and 38 parsimony informative sites, were observed in the COI and D-loop region sequences, respectively. The h, Hd, and Pi of the COI gene in different populations ranged from 5 to 10, 0.50243 to 0.67184, and 0.00079 to 0.00118, respectively (Table 3). Among them, the QJR population had the highest h, Hd, and Pi (10, 0.67184, and 0.00118, respectively) (Table 3).
Additionally, the h, Hd, and Pi of the D-loop region in different populations ranged from 23 to 31, 0.91790 to 0.94620, and 0.00509 to 0.00632, respectively (Table 3). A closer inspection of the table showed the h, Hd, and Pi, for each population based on the D-loop region, were higher than those based on the COI gene. Besides, the Nm values based on the COI and D-loop sequence ranged from 0.9731 to 1.0441 and 0.9480 to 1.0398, respectively (Table 4). The gene flow between the HMR population and the QJR population was minimal based on two markers.
Population Differentiation and Structure
The construction of the COI haplotype network (Figure 2) was based on 17 different haplotypes. Some haplotypes were shared by different groups, while others were exclusive to one group. For example, Hap 1, Hap 2, Hap 5, and Hap 6 were shared by all seven populations. On the contrary, Hap 3 was exclusive to the BHR population, Hap 14 was exclusive to the QJR population, and Hap 12 was exclusive to the HMR population. Many haplotypes formed clusters around Hap 1, and Hap 1 appeared the most frequently. Other haplotypes, except Hap 3, Hap 11, Hap 12, and Hap 14, were all differentiated from Hap 1. It is inferred that Hap 1 was the initial haplotype, and there was no obvious phylogenetic pattern between haplotypes.
The NJ tree was based on the COI marker, and the same samples gave similar results (Figure 4). The results showed that the haplotypes were divided into two branches with Hap 1 as the axis and the other three small branches outside. It should be noticed that G. dobula and G. namensis had the closest relation with G. przewalskii. In addition, the genetic distance between the haplotypes of G. przewalskii ranged from 0.00139 to 0.00698 based on the COI gene. The genetic distances between Hap 1, Hap 2, Hap 5, and other haplotypes were relatively small, and the genetic distances between Hap 3, Hap 14, and Hap 12 were the farthest.
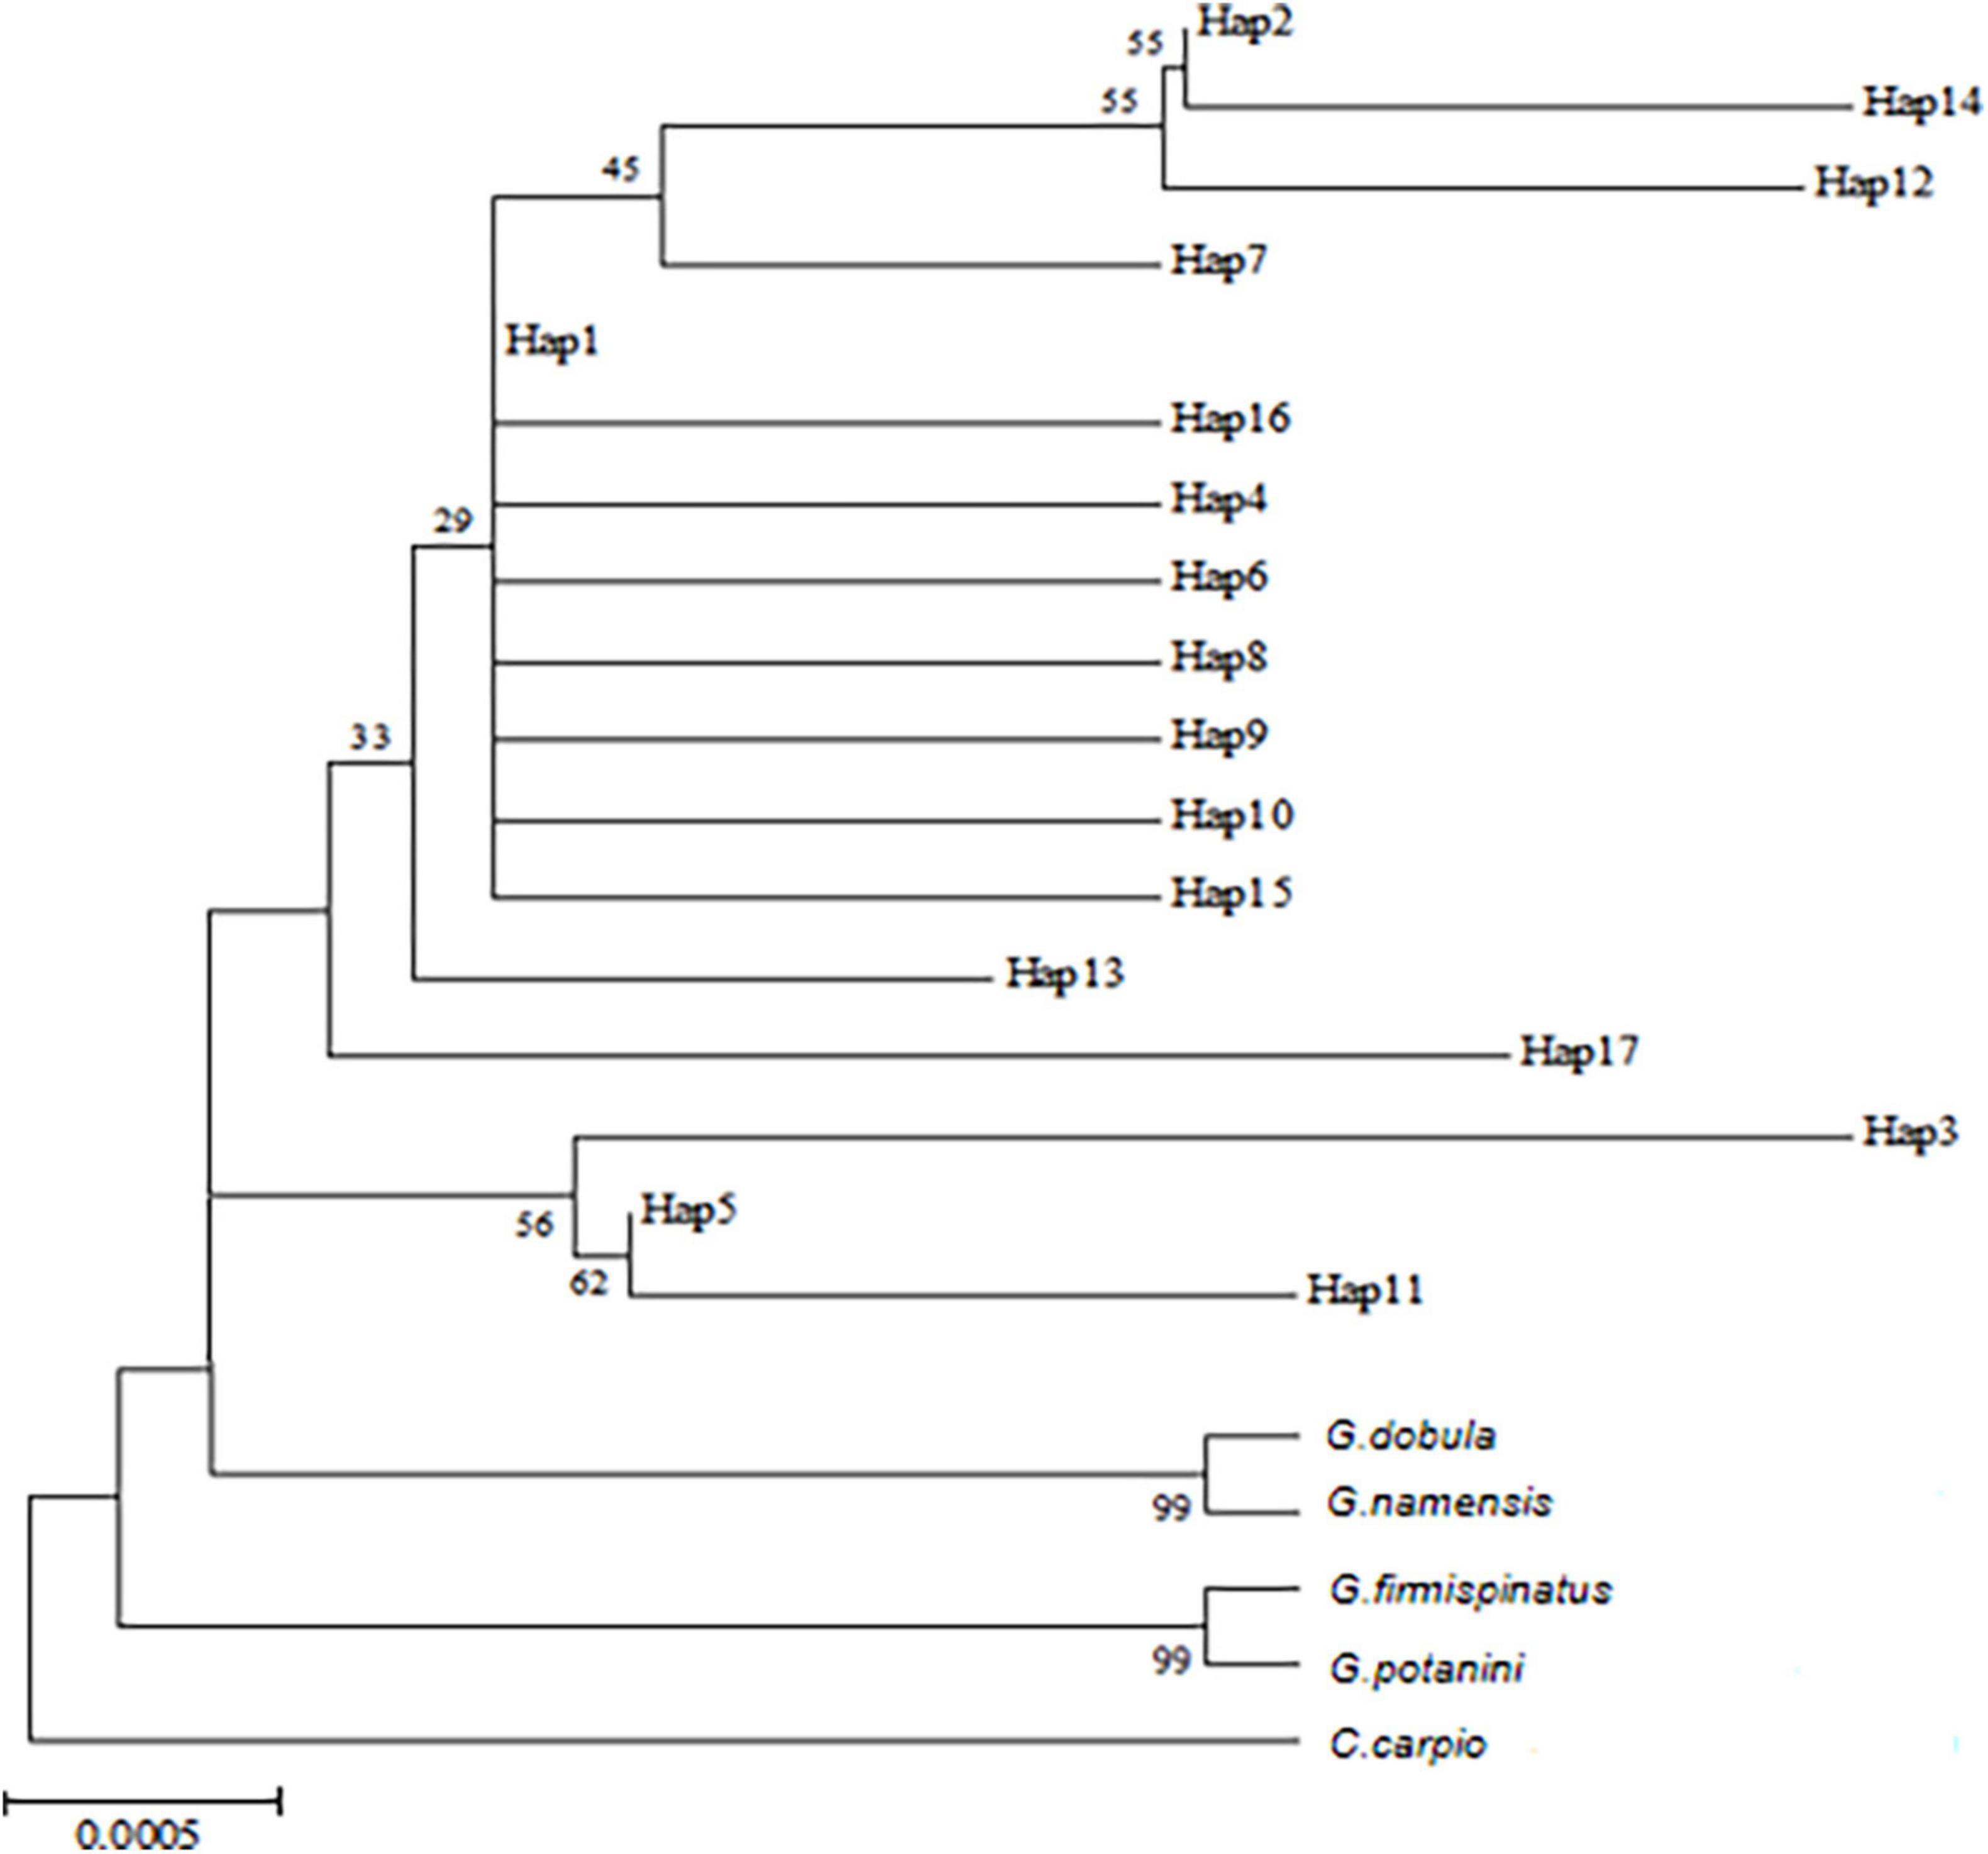
Figure 4. NJ tree of COI gene of G. przewalskii based on Kimura-2-parameter model. Numbers at the nodes represent bootstrap values.
Turning now to the experimental evidence on the D-loop region, the construction of the D-loop haplotype network (Figure 3) was based on 66 different haplotypes. The 66 haplotypes were divided into 4 clusters: Group 1 centered around Hap 17, Group 2 centered around Hap 8, Group 3 centered around Hap 1, and Hap 57 as a single group. In addition, Hap 61, Hap 62, and Hap 63 were exclusive to the HMR population, Hap 28 and Hap 31 were exclusive to the GJR population, and Hap 20 was shared by the QJR and SLR population.
A ring for the NJ tree of the D-loop region was used for better presentation. The NJ phylogenetic tree of the D-loop region showed that the lineages of G. przewalskii were divided into several single families and were not clustered according to each region. It should be noticed that G. potanini and G. waddellii had the closest relation with G. przewalskii (Figure 5). Furthermore, the results of the sequence analysis based on the D-loop region showed the genetic distance that spans between haplotypes was small, ranging from 0 to 0.02831. Among them, the genetic distances between Hap 31 and Hap 61, Hap 28 and Hap 62, and Hap 20 and Hap 63 were 0. The genetic distances between Hap 57 and Hap 53 as well as Hap 57 and Hap 13 were both the maximum value of 0.02831. Hap 57 and Hap 53 were exclusive to the YLJ population, while Hap 13 was shared by the HeGR, SLR, and QJR populations.
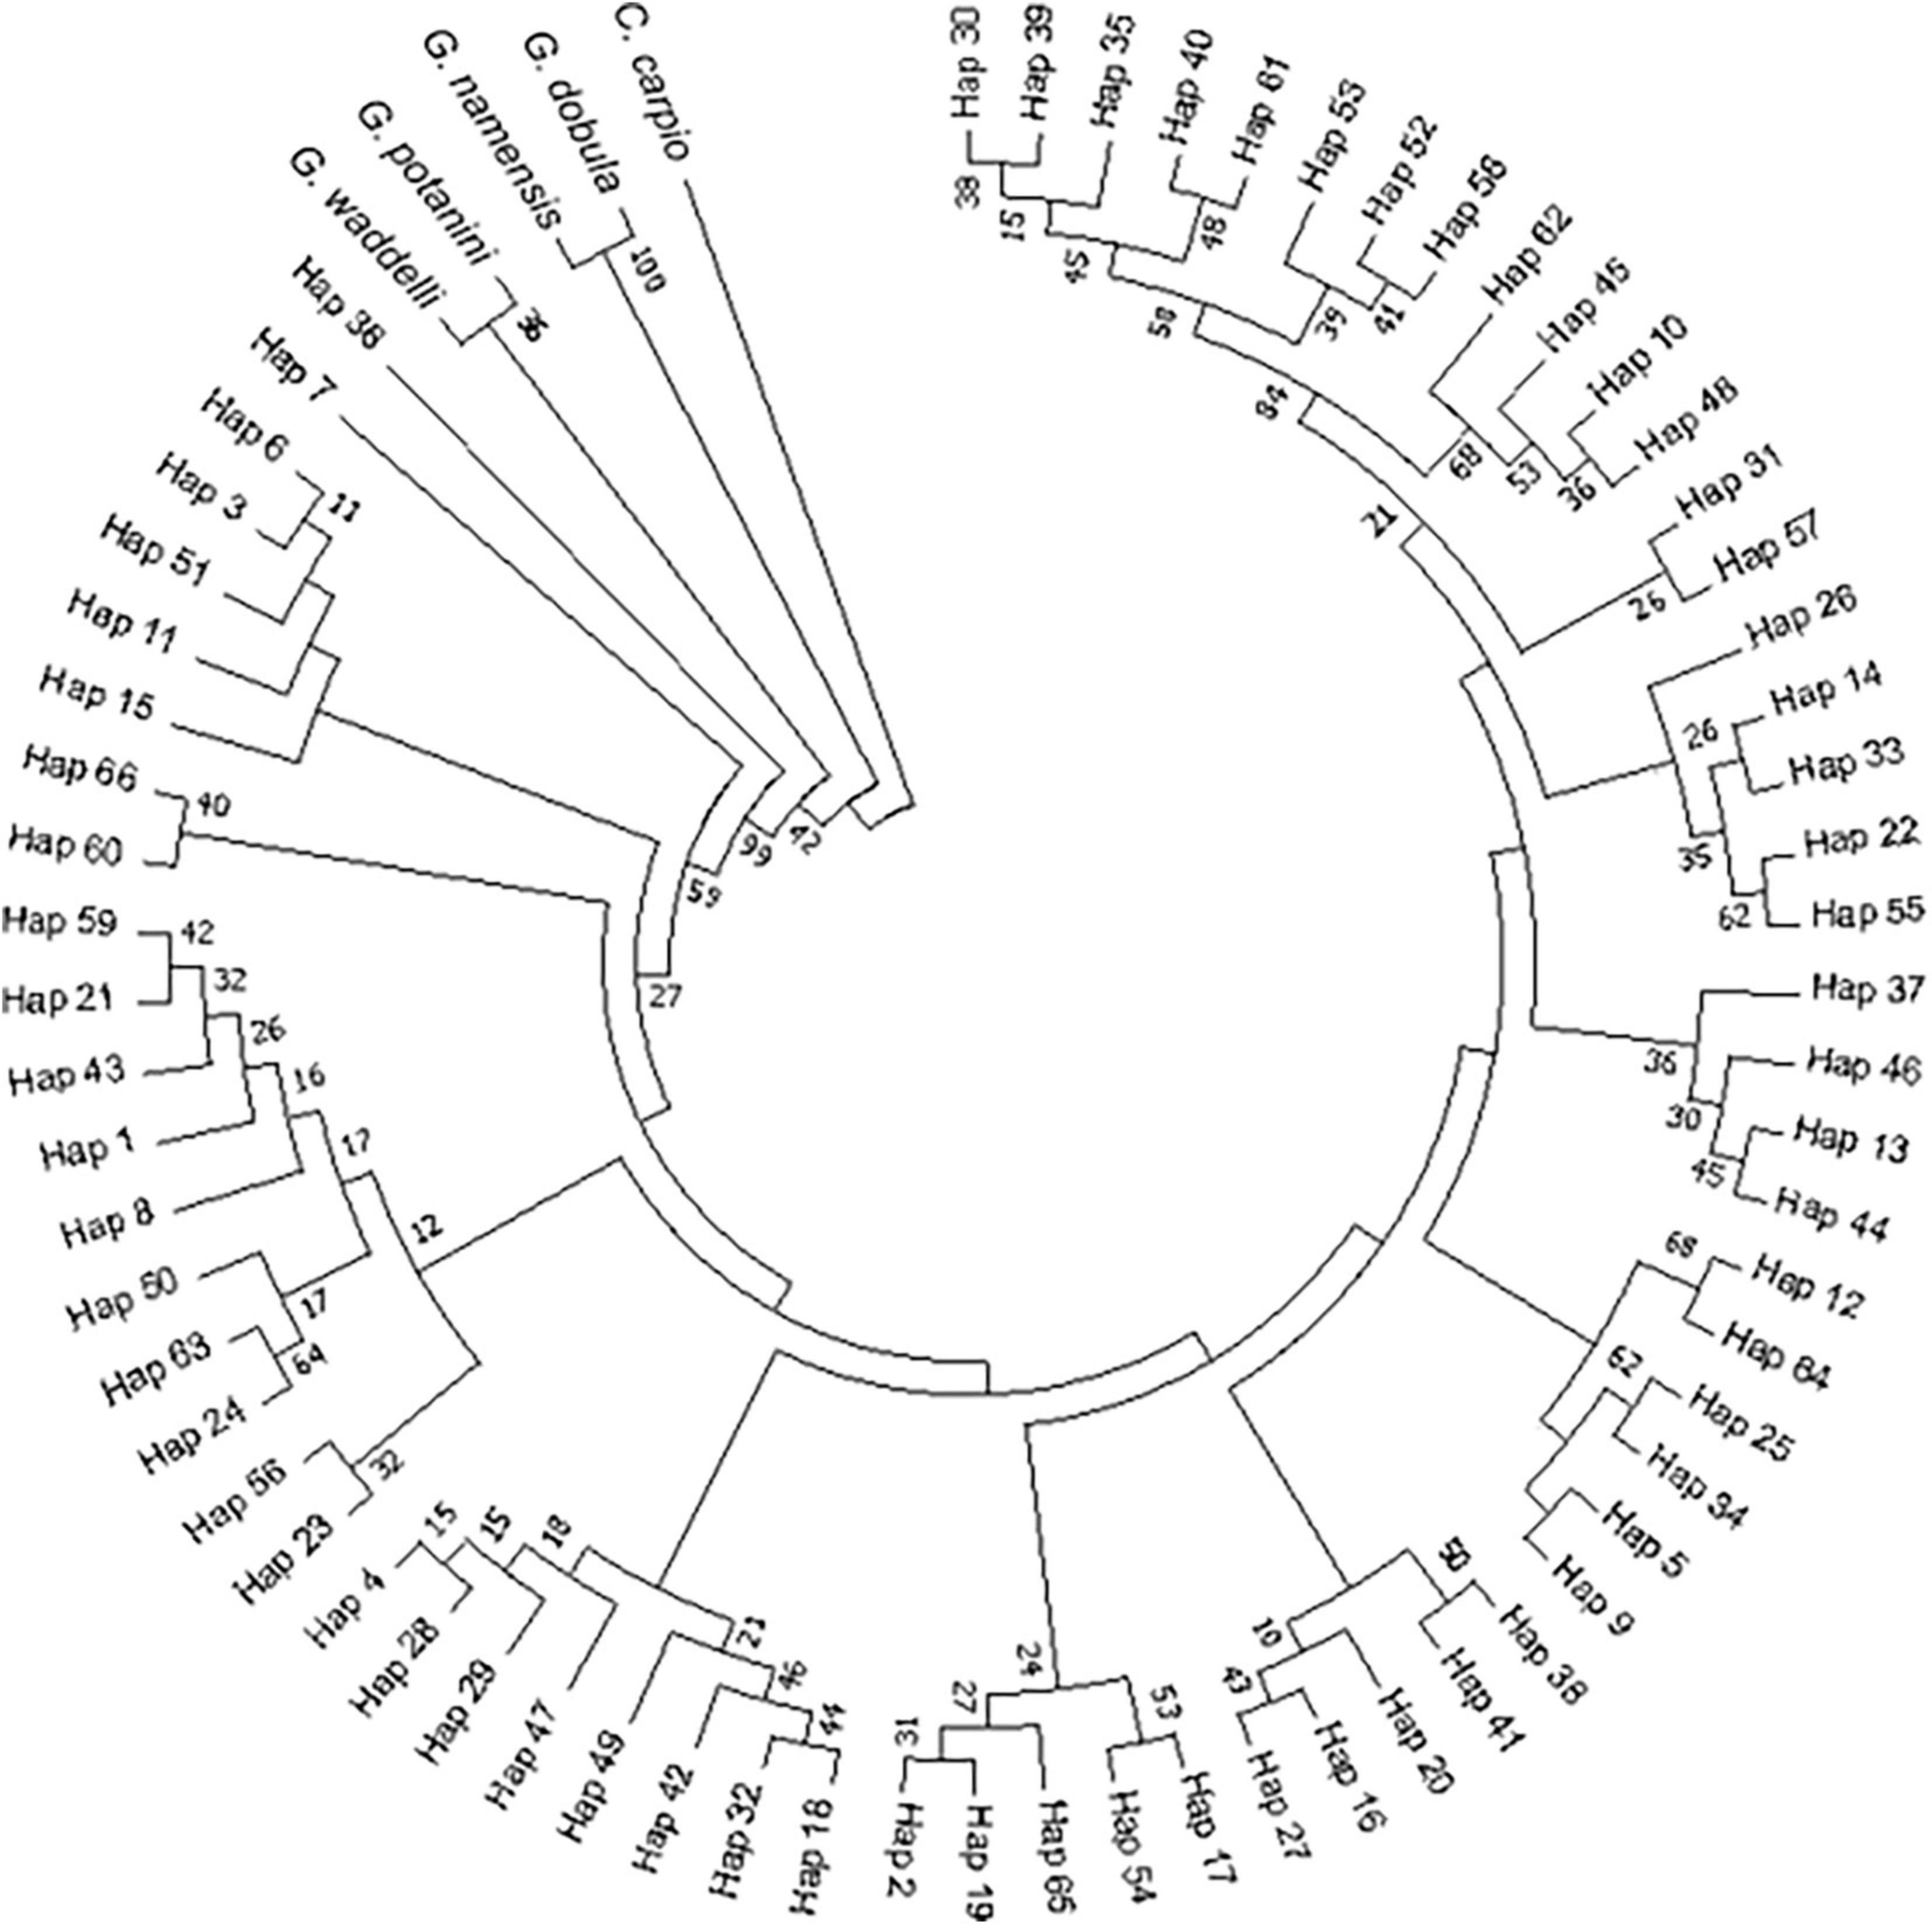
Figure 5. NJ tree of the D-loop region of G. przewalskii based on Kimura-2-parameter model. The numbers at the nodes represent the bootstrap values.
The AMOVA revealed that most of the molecular variance came from the within-population based on the two markers (Table 5). The total variability observed among populations in the COI and D-loop region sequences were –0.31 and –0.24, respectively, whereas 100.31 and 100.24% of the variation were found within populations, respectively. Moreover, the genetic differentiation coefficient F-statistics (Fst) for both the mt DNA molecular markers were negative values, which indicated that the degree of genetic differentiation of G. przewalskii was not high and there was no obvious genetic differentiation between G. przewalskii populations (Table 5).
Historical Demography
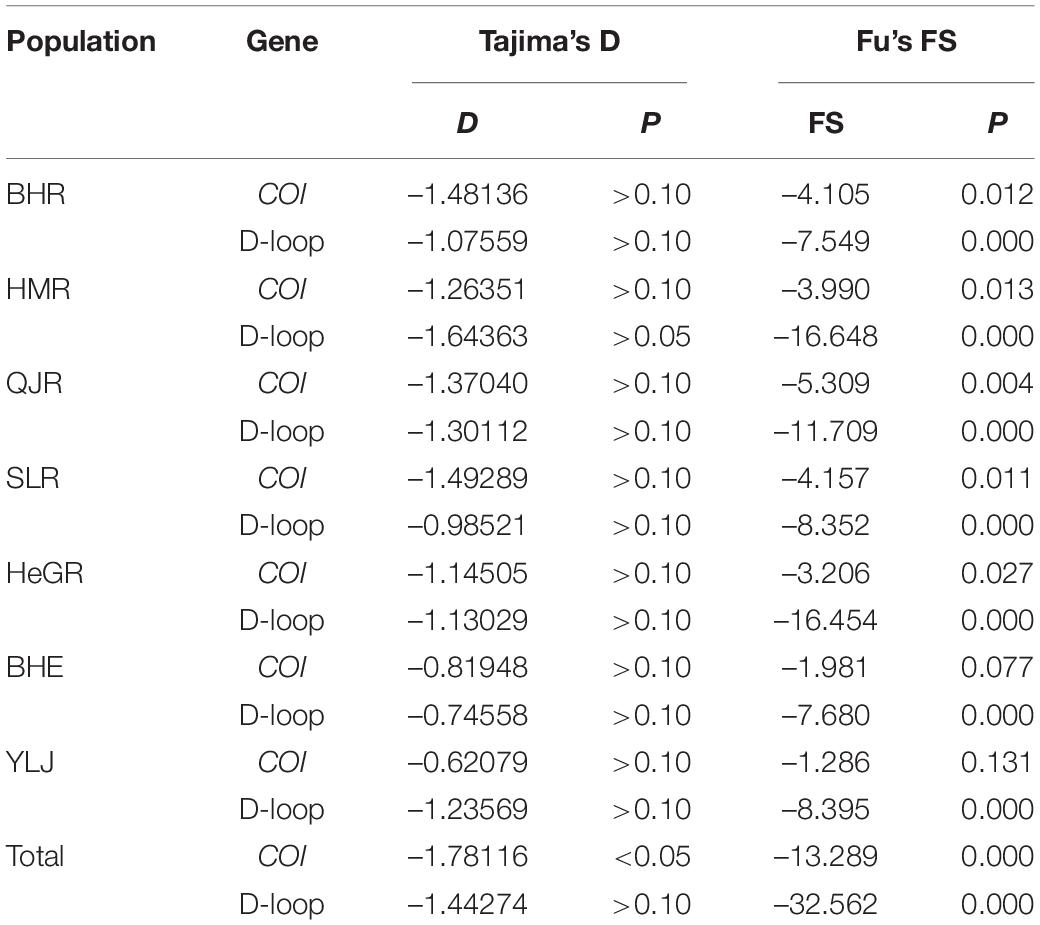
The neutrality tests (Table 6) and mismatch distribution (Figure 6) based on the COI gene supported the hypothesis of population expansion of G. przewalskii. The Tajima’s D-test and the Fu’s FS-test of COI gene showed negative values that reached a significant level (total: P < 0.05, Table 6). Also, a unimodal pattern was observed for all populations except the YLJ population in the mismatch distribution analyses based on the COI gene (Supplementary Figure 1). However, both the Tajima’s D-test and the Fu’s FS-test of the D-loop region were negative, with the former not reaching a significant level while the latter did (Tajima’s D p-value > 0.05, Fu’s FS p-value < 0.05, Table 6). The bimodal distribution was observed for all populations in the mismatch analyses based on the D-loop region (Figure 6 and Supplementary Figure 2). In terms of the beginning of population expansion, the τ value of 0.781 and 3.038 derived based on COI and D-LOOP suggested a time of approximately 0.36–0.108 MYA (Million Years Ago) and 0.497–0.165 MYA, occurring during the late middle Pleistocene.
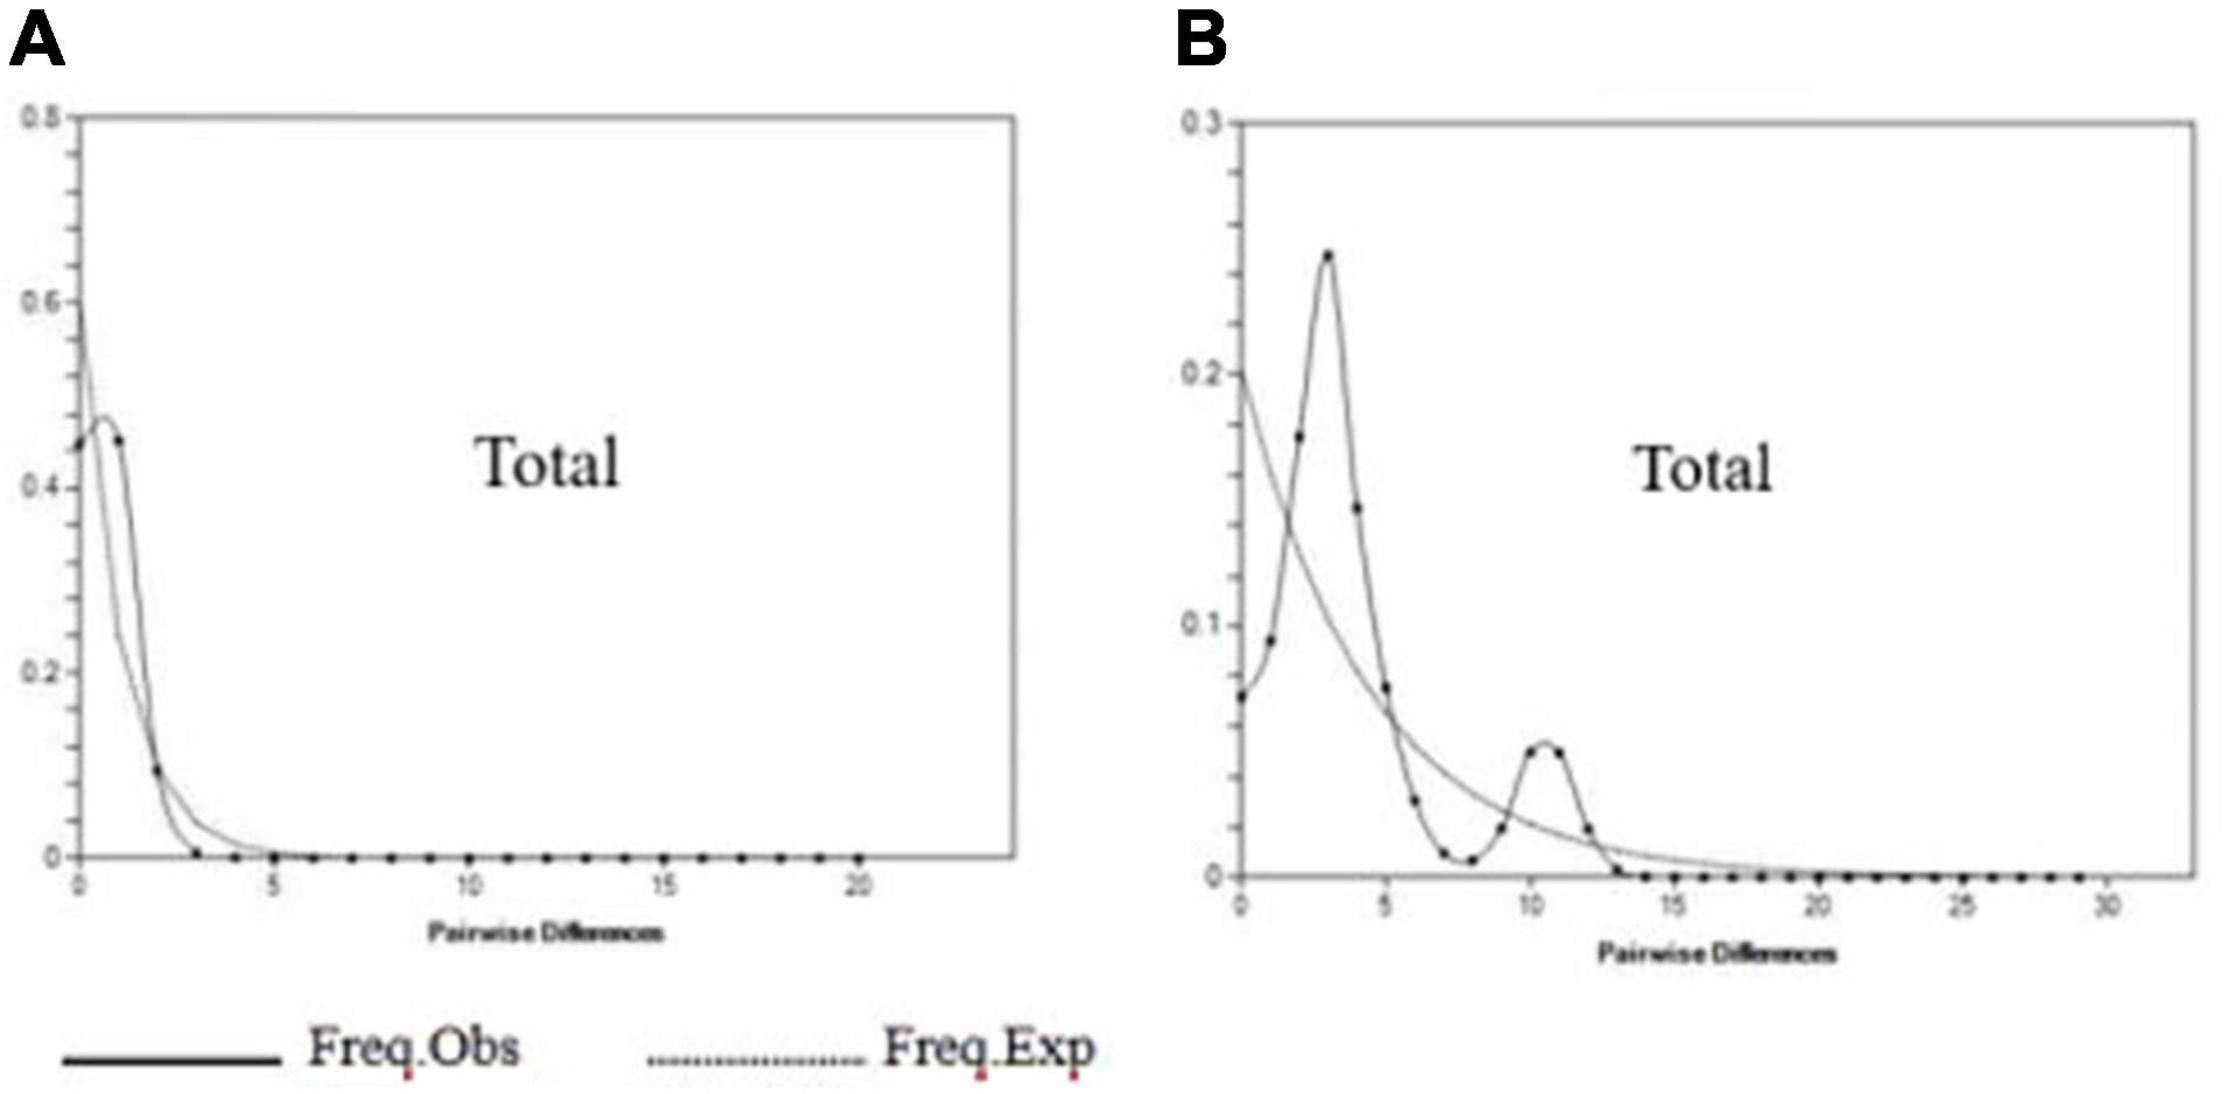
Figure 6. Nucleotide mismatch distribution in G. przewalskii of all populations for two markers: (A) COI and (B) D-loop.
Discussion
Nucleotide Composition
Our finding that the content of A+T (57.33%) was higher than that of C+G (42.67%) of COI gene in G. przewalskii is consistent with the previous research in Aspiorhynchus laticeps (A+T = 54.9%), Schizothorax biddulphi (A+T = 53%, 53.1%), and Schizothorax irregularis (A+T = 53.2%) (Yang et al., 2011, 2013). This confirms our findings and indicates that the content of A+T was higher than that of C+G, which was common in the sequence composition of the COI gene of schizothoracids. In addition, our result based on the D-loop region reflects that of Zhang et al. (2013) who also found that the content of A+T (63.1%) was significantly higher than the content of C+G (36.9%) in G. przewalskii.
Comparison of Genetic Diversity Based on Cytochrome Oxidase Subunit I Gene and D-Loop Region
One interesting finding is that the h (17 and 66, respectively) and Hd (0.55221 and 0.92822, respectively) among populations of G. przewalskii differed by the COI and D-loop regions. The difference may be attributed to the evolutionary rate of different molecular markers (Wu, 2017; Yan et al., 2020). The mutation rate and evolution rate in the D-loop region, as no selection pressure for coding, are higher than that in the COI gene. Clearly, the current results showed both the mitochondrial COI gene and D-loop region markers can be very helpful in analyzing the genetic variation of G. przewalskii. In addition, the Pi of mitochondrial DNA is one of the crucial indicators to measure the genetic diversity of the population. The larger the Pi value, the higher the polymorphism of the population. What emerges from the results reported here is that both the h and Pi of G. przewalskii from the COI gene were lower than those from the D-loop region, indicating that the sensitivity of the D-loop control region to reflect the genetic diversity of G. przewalskii is higher than that of the COI gene. It also confirmed the view that the evolution rate of the D-loop control region is higher than that of the COI gene.
Moreover, according to Millar et al. (1991), when Nm > 1, the gene flow between populations is considered high and genetic similarity is high. Except for the weak genetic flow between the YLJ and QJR, BHE, BHR, HMR populations, respectively, all other populations showed a high genetic flow (Nm > 1), indicating high genetic similarity among the populations, thus, causing a low level of genetic differentiation, as has been reported previously for Macropodus ocellatus in the Yellow River and Yangtze River (Zhang et al., 2019). Next, the gene flow among YLJ and the other populations was low based on two markers. This might be because the YLJ population is located in the southeast of Qinghai Lake and no rivers are entering the lake nearby, which makes it more difficult to migrate to other rivers. Therefore, the YLJ population may not participate in reproductive migration.
Population Differentiation
Another momentous finding is that the genetic variation of G. przewalskii primarily occurred within the population (Fst COI = –0.00308; Fst D-loop = –0.00240) based on the above two molecular markers. The result may be associated with the reproductive migration of G. przewalskii. The migration route of G. przewalskii may be varied every year. Such a migration process has greatly increased the gene exchange of the entire lake area. In this study, the result based on the D-loop region was similar to the results of the previous study (Fst = 0.01926) in the HMR, BHR, and SLR (Chen et al., 2006). The previous studies estimated from the D-loop sequence demonstrated that there was little genetic differentiation among the three reproductive populations of G. przewalskii, and genetic variation mainly existed within the population (Chen et al., 2006). Likewise, it was previously reported that the gene exchange of G. przewalskii was so frequent that no obvious population structure was found by sequencing the mitochondrial cytochrome b (Cytb) gene (Zhao et al., 2006). However, using an evaluation based on random amplified polymorphic DNA (RAPD) markers, Zhang et al. (2005) showed that there was little genetic differentiation (Fst = 0.1070) between three G. przewalskii populations. This differs slightly from the findings presented here probably due to the different molecular marker methods.
Genetic Structure
Estimates of population genetic parameters showed that G. przewalskii had high levels of haplotype diversity (0.55221 and 0.92822, respectively) and low levels of nucleotide diversity (0.00092 and 0.00578, respectively) based on the COI gene and D-loop region. Historically, the values defining the level of haplotype diversity and nucleotide diversity by Grant were 0.5 and 0.005, respectively (Grant and Bowen, 1998). Hence, the structure of G. przewalskii in this study was more inclined to the type of high haplotype and low nucleotide diversity as previously reported (Zhang et al., 2013). Similarly, previous research recorded the haplotype and nucleotide diversities from the mitochondrial DNA Cytb gene of populations of G. przewalskii (0.8042 ± 0.0424 and 0.00201 ± 0.00124, respectively), G. eckloni of the Yellow River (0.8720 ± 0.0205 and 0.00485 ± 0.00249, respectively), and G. eckloni of the Geerm River (0.5771 ± 0.1182 and 0.00096 ± 0.00073, respectively) (Zhao et al., 2005).
Generally, a large population, different environments, and living habits suitable for the rapid growth of the population are required for the persistence of high haplotype diversity of the population in nature (Grant and Bowen, 1998). As it happens, these situations are present on G. przewalskii. First, through the measures implemented by the Qinghai Provincial Government, such as embargo fishing and stock enhancement of G. przewalskii, the resource of G. przewalskii has been restored to 29% of the original reserve. The resource has increased from 26,000 tons in 2002 to 50,000 tons in 2014 and 93,000 tons in 2019. Second, the ecological environments of lakes and rivers are different, which can better provide diverse conditions for the feeding, reproduction, and over-wintering of G. przewalskii. Finally, G. przewalskii will undergo reproductive migration from April to July every year. They migrate from the Qinghai Lake into the various rivers connected with the Qinghai Lake. After the reproductive behavior is over, they swim back to the Qinghai Lake. The routine habits have led to a yearly recovery of G. przewalskii year by year. Therefore, it is speculated that the type of high haplotype and low nucleotide diversity of G. przewalskii comes from these conditions.
Population History
The Tajima’s D-tests and the Fu’s Fs-test were not uniform for the D-loop region, which has a slightly faster evolutionary rate and cannot accurately analyze the population dynamics of G. przewalskii combined with the nucleotide mismatch distribution. Therefore, the results of the COI gene analysis were applied to determine whether there was population expansion. In short, evidence from the neutrality tests and mismatch distribution revealed that G. przewalskii may have experienced population expansion (Tajima, 1989; Fu and Li, 1993). This may be the primary reason why little population differentiation was detected. A similar result was obtained for G. dobula from three localities (Pali, Lasa, and Yanghu) in the Tibetan plateau (Chan et al., 2016). Simultaneously, these outcomes were in accordance with the pattern of high haplotype diversity and low nucleotide diversity observed, with the “star-like” shape of the haplotype network in this study, and with the variation of resources in G. przewalskii.
To our knowledge, the complicated climatic changes as the Tibetan plateau uplift play a crucial role in the demographic history of fish species (Gang et al., 2009; Chan et al., 2016). In the Tibetan plateau, the largest glacial retreat has been occurring since 0.17 MYA (Zheng et al., 2002). Based on the expansion time we studied (0.36–0.108 MYA, 0.497–0.165 MYA), the demographic history could conform with the period of the largest glacial retreat during the Pleistocene. Therefore, we suggest that climatic conditions during the Pleistocene period had a degree of influence on the contemporary distribution of the genetic variation of G. przewalskii, as reported in G. dobula (Chan et al., 2016). Additionally, the population expansion occurring in the Pleistocene agreed with the previous findings of schizothoracine fishes in the Yellow River. The Yellow River schizothoracine fishes have younger expansion than G. przewalskii (Duan et al., 2009).
Germplasm Protection Mechanism
Historical records showed that the Qinghai Lake was originally connected to the ancient Yellow River, but after the strong uplift of the Qinghai-Tibet Plateau, the water could not be drained to the Yellow River, so the Qinghai Lake was separated from the Yellow River and became a closed inland lake (Chen et al., 1964; Li et al., 1996). The Qinghai Lake provided opportunities for the lineage diversification of G. przewalskii (Zhao et al., 2006). Although the lake area has increased in recent years, this established geographic barrier combined with the continued decline in water level, increased mineralization of the water, and shrinking of the water column in early years has led to a reduction in the size of spawning areas, a decrease in the numbers of the spawning population, a single genetic structure, low genetic diversity, and even the risk of inbreeding (Zhao et al., 2005; Liu et al., 2019). A large number of seedlings are put into the Qinghai Lake every year to replenish the stock and expand the size of the population. Fishery stocking has restored the naked carp resources in the Qinghai Lake to some extent. However, if the parents from the same place or same batch are used for breeding for many years, negative genetic effects such as genetic drift are likely to occur (Araki and Schmid, 2010).
There is a definite need for preventing inbreeding and maintaining population heritability. A reasonable approach to tackle this issue could be to rationally introduce multi-water parents and regularly expand and replace the parental population during artificial breeding and release. More specifically, parents can be Qinghai Lake naked carp from different geographic regions, such as the Lake Crooke and the seven geographical regions mentioned in this study. It also may be different subspecies of G. przewalskii, such as G. przewalskii ganzilronensis, and even other Gymnocypris fishes, such as G. herzensten. On the other hand, translocation is a usual measure for the effective conservation of imperiled species (Schäfer et al., 2020). Studies on the adaptation of introduced G. przewalskii in other semi-saline lakes in the Qinghai Province are conducive to successfully protecting genetic diversity by creating various evolutionary units.
In conclusion, both markers indicated high haplotypic diversity, low nucleotide diversity, and low differentiation of G. przewalskii. With the launch of the “10-year fishing ban” and the sixth embargo fishing of the Qinghai Lake in 2020, it will play a considerable role in the conservation and restoration of the germplasm resources of G. przewalskii. Therefore, scientific management must be achieved in stock enhancement to avoid damaging the natural genetic structure of G. przewalskii.
Data Availability Statement
The original contributions presented in the study are included in the article/Supplementary Material, further inquiries can be directed to the corresponding author/s.
Ethics Statement
The animal study was reviewed and approved by the Regulations for the Administration of Affairs Concerning Experimental Animals, approved and authorized by the State Council of People’s Republic of China.
Author Contributions
D-aF was responsible for data scoring and analyses, and writing the manuscript. HL, CcM, MH, ZK, HfQ, DpX, LfT, and YdL helped in selecting the fish sample and data analysis during the manuscript preparation. All authors have read and approved the final manuscript.
Funding
This study was supported by the Fishery Resources and Environmental Investigation Special Qinghai Lake in Key Waters of Northwest China (2019–2021) and the National Infrastructure of Fishery Germplasm Resources (2021DKA3047003).
Conflict of Interest
The authors declare that the research was conducted in the absence of any commercial or financial relationships that could be construed as a potential conflict of interest.
Publisher’s Note
All claims expressed in this article are solely those of the authors and do not necessarily represent those of their affiliated organizations, or those of the publisher, the editors and the reviewers. Any product that may be evaluated in this article, or claim that may be made by its manufacturer, is not guaranteed or endorsed by the publisher.
Supplementary Material
The Supplementary Material for this article can be found online at: https://www.frontiersin.org/articles/10.3389/fevo.2022.827654/full#supplementary-material
References
Anneville, O., Lasne, E., Guillard, J., Eckmann, R., Stockwell, J. D., Gillet, C., et al. (2015). Impact of fishing and stocking practices on coregonid diversity. Food Nutr. Sci. 6, 1045–1055. doi: 10.4236/fns.2015.611108
Araki, H., and Schmid, C. (2010). Is hatchery stocking a help or harm?: evidence, limitations and future directions in ecological and genetic surveys. Aquaculture 308(Suppl.–S1), S2–S11.
Bandelt, H. J., Forster, P., and Röhl, A. (1999). Median-joining networks for inferring intraspecific phylogenies. Mol. Biol. Evol. 16, 37–48. doi: 10.1093/oxfordjournals.molbev.a026036
Cao, Y.-B., Chen, X.-Q., Wang, S., Chen, X.-C., Wang, Y.-X., Chang, J. P., et al. (2009). Growth hormone and insulin-like growth factor of naked carp (Gymnocypris przewalskii) in Lake Qinghai: expression in different water environments. Gen. Comp. Endocrinol. 161, 400–406. doi: 10.1016/j.ygcen.2009.02.005
Chan, J., Li, W., Hu, X., Liu, Y., and Xu, Q. (2016). Genetic diversity and population structure analysis of Qinghai-Tibetan plateau schizothoracine fish (Gymnocypris dobula) based on mtDNA D-loop sequences. Biochem. Syst. Ecol. 69, 152–160. doi: 10.1016/j.bse.2016.09.004
Chen, D., Zhang, C., Lu, C., and Zhang, X. (2006). Polymorphism of D-loop sequence from mitochondrial genomes of different brood- stocks of Gymnocypris przewalskii (Kessler). J. Fish. Sci. China 13, 800–806.
Chen, K., Huang, D., and Liang, D. (1964). The formation and development of Qinghai Lake. Acta Geogr. Sin. 30, 214–233.
Cross, T. F. (2015). Genetic implications of translocation and stocking of fish species, with particular reference to Western Australia. Aquac. Res. 31, 83–94. doi: 10.1046/j.1365-2109.2000.00439.x
Donaldson, K. A., and Wilson, R. R. (1999). Amphi-Panamic geminates of snook (Percoidei: Centropomidae) provide a calibration of the divergence rate in the mitochondrial DNA control region of fishes. Mol. Phylogenet. Evol. 13, 208–213. doi: 10.1006/mpev.1999.0625
Duan, Z., Zhao, K., Peng, Z., Li, J., Diogo, R., Zhao, X., et al. (2009). Comparative phylogeography of the Yellow River schizothoracine fishes (Cyprinidae): vicariance, expansion, and recent coalescence in response to the Quaternary environmental upheaval in the Tibetan Plateau. Mol. Phylogenet. Evol. 53, 1025–1031. doi: 10.1016/j.ympev.2009.03.034
Feng, C., Yu, L., Fu, S., Wei, P., and Zhou, W. (2021). Cultivation measures of “spring sliced” fish species in naked carp pond in Qinghai Lake. Sci. Fish Farm. 3, 11–12.
Feng, C., Yu, L., Luo, Y., Wu, H., and Yan, L. (2019). Water quality conditioning technique in fingerling of Qinghai Lake naked carp. Sci. Fish Farm. 5, 7–9.
Fu, Y. X., and Li, W. H. (1993). Statistical tests of neutrality of mutations. Genetics 133, 693–709. doi: 10.1093/genetics/133.3.693
Gang, S., Yanhua, Q., Zuohua, Y., Shouhsien, L., Naifa, L., and Fumin, L. (2009). Phylogeography of the Alcippe morrisonia (Aves: Timaliidae): long population history beyond late Pleistocene glaciations. BMC Evol. Biol. 9:143. doi: 10.1186/1471-2148-9-143
Gatt, M. H., Ferguson, M. M., and Liskauskas, A. P. (2000). Comparison of control region sequencing and fragment RFLP analysis for resolving mitochondrial DNA variation and phylogenetic relationships among Great Lakes Walleyes. Trans. Am. Fish. Soc. 129, 1288–1299. doi: 10.1577/1548-8659(2000)129<1288:cocrsa>2.0.co;2
Gong, S., Wu, J., Gao, Y., Fong, J. J., Parham, J. F., and Shi, H. (2020). Integrating and updating wildlife conservation in China. Curr. Biol. 30, R915–R919. doi: 10.1016/j.cub.2020.06.080
Grant, W., and Bowen, B. (1998). Shallow population histories in deep evolutionary lineages of marine fishes: insights from sardines and anchovies and lessons for conservation. J. Heredity 89, 415–426. doi: 10.1093/jhered/89.5.415
He, W. (2008). The cause of exhaustion of Gymnocypris przewalskii resources and the way of recovery. Sci. Fish Farm. 2, 5–85.
Jiang, H., Wu, J., Wu, Y., Qi, H., Zhou, W., Fu, S., et al. (2021). Effect of alizarin complexone on otolith marking of juvenile Qinghai-lake naked carp. Sci. Fish Farm. 3, 72–74.
Jiang, P., Shi, J., Zhang, Y., Qi, H., and Sun, X. (2009). Microsatellite variation analysis ofgenetic diversity in six wild populations of naked common carp. Acta Ecol. Sin. 29, 939–945.
Julio, R., Albert, F. M., Carlos, S. D. J., Sara, G. R., Pablo, L., Ramos-Onsins, S. E., et al. (2017). DnaSP 6: DNA sequence polymorphism analysis of large data sets. Mol. Biol. Evol. 34, 3299–3302. doi: 10.1093/molbev/msx248
Kumar, S., Stecher, G., Li, M., Knyaz, C., and Tamura, K. (2018). MEGA X: molecular evolutionary genetics analysis across computing platforms. Mol. Biol. Evol. 35, 1547–1549. doi: 10.1093/molbev/msy096
Larkin, M. A., Blackshields, G., Brown, N. P., Chenna, R., McGettigan, P. A., McWilliam, H., et al. (2007). Clustal W and Clustal X version 2.0. Bioinformatics 23, 2947–2948. doi: 10.1093/bioinformatics/btm404
Laurent, E., and Heidi, L. (2010). Arlequin suite ver 3.5: a new series of programs to perform population genetics analyses under Linux and Windows. Mol. Ecol. Resour. 10, 564–567. doi: 10.1111/j.1755-0998.2010.02847.x
Li, J., Fang, X., Ma, H., Zhu, J., Pan, B., and Chen, H. (1996). Geomorphological and environmental evolution in the upper reaches of the Yellow River during the late Cenozoic. Sci. China 39, 380–390.
Liu, J. (2004). A quantitative analysis on threat and priority of conservation order of the endemic fishes in upper reaches of the Yangtze River. China Environ. Sci. 24, 395–399.
Liu, Q., Sha, Z., Wang, Q., Li, Q., and Ma, Y. (2019). “The variation characteristics and climate response of Qinghai Lake area in the past 32 years,” in Proceedings of the 2019 World Congress on Computational Intelligence, Engineering and Information Technology (WCEIT 2019), San Francisco, CA, 445–452.
Luo, L. (2015). The Protection of Qinghai Lake Naked Carp Must Also be Added With a Heavy Fist. Qinghai: Qinghai University for Nationalities.
Millar, C. I., Libby, W. J., Falk, D. A., and Holsinger, K. E. (1991). “Strategies for conserving clinal, ecotypic, and disjunct population diversiv in widespread species,” in Genetics and Conservation of Rare Plants, eds D. A. Falk and K. E. Holsinger (Oxford: Oxford University Press), 149–170.
Min, Q., Zhang, X., Zhou, Q., Li, J., Zeng, S., Chen, F., et al. (2020). Cloning and preliminary function analysis of foxk1 gene in Gymnocypris przewalskii. Guizhou Agric. Sci. 48, 73–76.
Ministry of Agriculture and Rural Affairs of the People’s Republic of China (2003). Naked carp of Qinghai lake (SC 1063-2003). Beijing: Ministry of Agriculture and Rural Affairs of the People’s Republic of China.
Miya, M., and Nishida, M. (2000). Use of mitogenomic information in teleostean molecular phylogenetics: a tree-based exploration under the maximum-parsimony optimality criterion. Mol. Phylogenet. Evol. 17, 437–455. doi: 10.1006/mpev.2000.0839
Perez-Enriquez, R., Takagi, M., and Taniguchi, N. (1999). Genetic variability and pedigree tracing of a hatchery-reared stock of red sea bream (Pagrus major) used for stock enhancement, based on microsatellite DNA markers. Aquaculture 173, 413–423. doi: 10.1016/s0044-8486(98)00469-4
Qi, D. (2002). Study on Genetic Diversity of Qinghai-Lake Naked Carps. Hangzhou: Zhejiang University.
Rogers, A. R., and Harpending, H. (1992). Population growth makes waves in the distribution of pairwise genetic differences. Mol. Biol. Evol. 9, 552–569. doi: 10.1093/oxfordjournals.molbev.a040727
Rômulo, P., Josiane, R., and Evoy, Z.-F. (2018). Genetic variation of the endangered neotropical catfish steindachneridion scriptum (Siluriformes: Pimelodidae). Front. Genet. 9:48. doi: 10.3389/fgene.2018.00048
Sari, A., Duran, M., Sen, A., and Bardakci, F. (2015). Investigation of Chironomidae (Diptera) relationships using mitochondrial COI gene. Biochem. Syst. Ecol. 59, 229–238. doi: 10.1006/mpev.2001.0898
Schäfer, D., Vincent, H., Fischer, M., and Kempel, A. (2020). The importance of genetic diversity for the translocation of eight threatened plant species into the wild. Glob. Ecol. Conserv. 24:e01240. doi: 10.1016/j.gecco.2020.e01240
Shi, J. (2008). Status of research on naked carp in Qinghai Lake and measures for resource conservation. Qinghai Sci. Technol. 05, 13–16.
Tajima, F. (1989). Statistical method for testing the neutral mutation hypothesis by DNA polymorphism. Genetics 123, 585–595. doi: 10.1093/genetics/123.3.585
Tong, C., Zhang, C., Shi, J., Qi, H., Zhang, R., Tang, Y., et al. (2015). Characterization of two paralogous myostatin genes and evidence for positive selection in Tibet fish: Gymnocypris przewalskii. Gene 565, 201–210. doi: 10.1016/j.gene.2015.04.009
Wang, L., Shi, X., Su, Y., Meng, Z., and Lin, H. (2013). Genetic divergence and historical demography in the endangered large yellow croaker revealed by mtDNA. Biochem. Syst. Ecol. 46, 137–144. doi: 10.1016/j.bse.2012.09.021
Wang, Y., Jin, Z., Zhou, L., Li, F., Zhang, F., Chen, L., et al. (2014). Stratigraphy and otolith microchemistry of the naked carp Gymnocypris przewalskii (Kessler) and their indication for water level of Lake Qinghai during the Ming Dynasty of China. Sci. China 57, 2512–2521. doi: 10.1007/s11430-014-4836-1
Wang, Z., Shi, J., Wei, F., Qi, D., Shi, Y., Zhang, Y., et al. (2015). AFLP genmetic diversity of scaleless carp (Gymnocypris przewalskii) in different freshwater tributaries of Qinghai Lake. Genom. Appl. Biol. 34, 82–89.
Wu, X. (2017). The Morphologic Feature and mtDNA Phylogeny of Rhinogobius SP. Hefei: Anhui Agricultural University.
Wu, X., Cao, W., Yi, B., Yang, G., and Luo, Y. (1964). Records of Cyprinidae fishes in China (Volume I and II). Hefei: Anhui Agricultural University, 181–182.
Wu, Y., Jiang, H., and Fu, S. (2020). Commercial fish culture technology of naked carp in Qinghai Lake in industrialized circulating waterwheel workshop. Sci. Fish Farm. 04, 82–83.
Xu, S., Li, T., Li, J., Zhu, S., and Zhao, K. (2003). Mitochondrial DNA diversity in naked carps in Qinghai Lake. Heilongjiang J. Anim. Sci. Vet. Med. 01, 11–12.
Yan, T., Wang, X., Li, S., He, Z., Luo, J., Zhang, Q., et al. (2020). Genetic analysis of wild Ancherythroculter nigrocauda in tributaries and the main stream of the upper Yangtze River basin of China. Mitochondrial DNA A 31, 17–24. doi: 10.1080/24701394.2019.1698558
Yang, T., Meng, W., Guo, Y., and Ma, Y. (2013). Morphological and COI sequences analysis of two schizothoracinae fishes in Xinjiang. Chinese J. Fish. 26, 10–14. doi: 10.3724/SP.J.1005.2014.1013
Yang, T., Meng, W., Zhang, R., Guo, Y., Hai, S., and Xie, C. (2011). Comparative analysis of mtDNA gene between two rare schizothoracine fishes. Chinese J. Zool. 46, 47–54.
Zhang, C., Chen, D., Shi, J., Qi, H., and Lu, C. (2005). Genetic diversity analysis of different populations of Gymnocypris przewalskii by RAPD. J. Fish. China 29, 307–312.
Zhang, C., and Zhang, Y. (1963). New species of fishes from Qinghai II. Acta Zool. Sin. 04, 146–149.
Zhang, Q., Sun, C., Zhu, Y., Xu, N., and Liu, H. (2019). Genetic diversity and structure of the round-tailed paradise fish (Macropodus ocellatus): implications for population management. Glob. Ecol. Conserv. 21:e00876. doi: 10.1016/j.gecco.2019.e00876
Zhang, R., Li, G., Tang, Y., Zhang, C., and Zhao, K. (2013). Genetic diversity and differentiation of mitochondrial DNA D-loop region in Gymnocypris przewalskii. Chinese Agric. Sci. Bull. 29, 71–76.
Zhang, X., Gao, X., Wang, J., and Cao, W. (2015). Extinction risk and conservation priority analyses for 64 endemic fishes in the Upper Yangtze River, China. Environ. Biol. Fishes 98, 261–272. doi: 10.1007/s10641-014-0257-4
Zhao, K., He, S., Peng, Z., and Li, J. (2006). Mitochondrial diversity and population structure of Gymnocypris przewalskii (Teleostei:Cyprinidae). J. Qinghai Univ. 24:5.
Zhao, K., Li, J., Yang, G., Duan, Z., He, S., and Chen, Y. (2005). Molecular phylogenetics of Gymnocypris (Teleostei: Cyprinidae) in Lake Qinghai and adjacent drainages. Chinese Sci. Bull. 50, 1325–1333. doi: 10.1360/982005-223
Zhao, K., Li, J., Zhang, Y., Luo, J., Li, T., Wu, H., et al. (2001). Mitochondrial DNA diversity in naked carps in Qinghai-lake (Gymnocypris prezwalskii). Hereditas 23, 445–448.
Keywords: Gymnocypris przewalskii, genetic diversity, mitochondrial DNA, habitat fragmentation, germplasm protection
Citation: Fang D-a, Luo H, He M, Mao Cc, Kuang Z, Qi Hf, Xu Dp, Tan Lf and Li Yd (2022) Genetic Diversity and Population Differentiation of Naked Carp (Gymnocypris przewalskii) Revealed by Cytochrome Oxidase Subunit I and D-Loop. Front. Ecol. Evol. 10:827654. doi: 10.3389/fevo.2022.827654
Received: 02 December 2021; Accepted: 01 March 2022;
Published: 11 April 2022.
Edited by:
Shaokui Yi, Huzhou University, ChinaCopyright © 2022 Fang, Luo, He, Mao, Kuang, Qi, Xu, Tan and Li. This is an open-access article distributed under the terms of the Creative Commons Attribution License (CC BY). The use, distribution or reproduction in other forums is permitted, provided the original author(s) and the copyright owner(s) are credited and that the original publication in this journal is cited, in accordance with accepted academic practice. No use, distribution or reproduction is permitted which does not comply with these terms.
*Correspondence: Dongpo Xu, eHVkcEBmZnJjLmNu
 Di-an Fang
 Hui Luo2
 Dongpo Xu