 Baoqiang Wang
 Yajing He
 Yongjing Zhao1
94% of researchers rate our articles as excellent or good
Learn more about the work of our research integrity team to safeguard the quality of each article we publish.
Find out more
ORIGINAL RESEARCH article
Front. Ecol. Evol., 03 March 2022
Sec. Population, Community, and Ecosystem Dynamics
Volume 10 - 2022 | https://doi.org/10.3389/fevo.2022.817708
This article is part of the Research TopicEffects of Non-Random Sources of Alteration on Biodiversity and Ecosystem FunctioningView all 19 articles
Biodiversity patterns along the elevational gradient of vertebrates have been widely focused on in previous studies, but they are still insufficient on invertebrates in lakes to a wide elevational extent. Based on field samplings and literature, we compared biodiversity patterns among different taxonomic groups of benthic macroinvertebrates in 104 lakes of China and India along an elevational gradient of 2–5,010 m a.s.l. and revealed the key driving factors, and then, we discussed the key mechanisms underlying elevational biodiversity patterns. We found that elevational biodiversity patterns of different taxonomic groups were not uniform, e.g., an exponentially decreasing pattern of Bivalvia, a first horizontal and then decreasing pattern of Gastropoda, and a linear decreasing pattern of Oligochaeta and Insecta. Elevation and elevation-controlled variables (temperature and salinity) were the key driving factors to biodiversity patterns. Their effects were strongest on Bivalvia and less on Gastropoda, whereas they were relatively weak on Oligochaeta and Insecta. Finally, we discussed three important mechanisms that shaped elevational biodiversity patterns and assemblage variations of benthic macroinvertebrates by linking our results with the classic hypotheses about biodiversity patterns, including climate/productivity, environmental heterogeneity, and dispersal/history. These results could improve our understanding of biodiversity patterns and biodiversity conservation.
Understanding the distribution patterns and their underlying mechanisms of biodiversity is one of the central objectives in biogeography and ecology (Gaston, 2000; Lomolino, 2001; Mittelbach et al., 2007; Laiolo et al., 2018). Large-scale spatial biodiversity patterns have recently received extensive attention, especially in the context of global climate change (Collen et al., 2014; Birrell et al., 2020). Along elevational gradients, organisms generally show a decreasing trend in species richness, and this pattern has been verified in several taxonomic groups (Bryant et al., 2008; Teittinen et al., 2017). Learning this elevational biodiversity pattern is helpful not only for determining the underlying drivers of biodiversity but also for predicting the biological response to global climate change, which is very important for biodiversity maintenance and protection (Lomolino, 2001; Rahbek, 2005; Liu et al., 2021).
In the previous studies, it was widely thought that biodiversity decreased monotonically with increasing elevation. However, recent studies showed that elevational biodiversity may show either a monotonically decreasing or a hump-shaped pattern (McCain, 2005; Rahbek, 2005; Fu et al., 2006; Beck et al., 2017; Teittinen et al., 2017). Whatever the distribution pattern has shown, climatic, area, and local environmental variables are the most cited driving factors (Lomolino, 2001; Hawkins et al., 2003; McCain, 2004, 2007, 2009; Birrell et al., 2020). Besides those explanatory factors above, biodiversity distribution along elevational gradient also varies due to specific taxonomic groups (Bryant et al., 2008; Kessler et al., 2011; Nunes et al., 2020; Pandey et al., 2021). Therefore, it is necessary to study elevational biodiversity patterns on different taxonomic groups.
Biodiversity patterns along elevational gradient have been well-examined for vertebrates, such as mammals (Brown, 2001; McCain, 2005, 2007; Gebert et al., 2019), birds (McCain, 2009; Neate-Clegg et al., 2021), reptiles (McCain, 2010; Jins et al., 2021), amphibians (Fu et al., 2006; Wang et al., 2019), and fishes (Bhatt et al., 2012; Qian et al., 2021). However, we have insufficient data about invertebrates (Sanders et al., 2003; Beck et al., 2017; Albrecht et al., 2018; Nunes et al., 2020; He et al., 2021), especially benthic macroinvertebrates in lakes (de Mendoza and Catalan, 2010; Wang et al., 2011). This limits our general understanding of biodiversity distribution. Benthic macroinvertebrates are diverse and abundant and play an important role in ecosystem functions (Lin et al., 2020). Meanwhile, benthic macroinvertebrates are sensitive to environmental changes, which makes them useful as good indicators for disturbances and pollution (Edegbene et al., 2021).
In this article, we studied benthic macroinvertebrates (i.e., Bivalvia, Gastropoda, Oligochaeta, and Insecta) in 104 lakes along an elevational gradient of 2~5,010 m a.s.l. in China and India. Our objectives were to compare elevational biodiversity patterns among different benthic macroinvertebrate groups and to unravel whether the effects of elevation on the biodiversity patterns were uniform. Through explaining the relationship between elevation and elevation-related variables, we tried to reveal the mechanisms underlying these patterns. Our study could enrich the cognition about elevational biodiversity patterns of different benthic macroinvertebrate groups to a complete and wide extent and verify that those patterns were primarily determined by climate/productivity factors.
Study areas are located in China and India. A total of 104 lakes were studied with an elevational gradient of 2–5,010 m a.s.l. (Figure 1). In our study, benthic macroinvertebrates from 41 lakes in the Tibetan Plateau were collected from our field investigations in 2015 and 2016. To ensure the comparability of data, referring to our field investigations, we filtered the studies that used similar collecting methods and summarized the distribution data of benthic macroinvertebrates from 63 lakes, including 25 lakes from the Eastern Plain of China, 10 lakes from the Inner Mongolia-Xinjiang Plateau of China, 11 lakes from the Yunnan-Guizhou Plateau of China, three lakes from the Tibetan Plateau of China, and 14 lakes from the mainland of India (PRISMA flow diagram for literature searching and filtering is presented in Appendix 1). Locations, elevation and collecting methods, and data sources of studied lakes are presented in Appendix 2. To avoid the incomparability of taxonomic information from different sampling efforts among studies, we classified benthic macroinvertebrates groups into the uniform taxonomic level. Oligochaetes, gastropods, and bivalves were unified into genus. Insects were unified into family or genus.
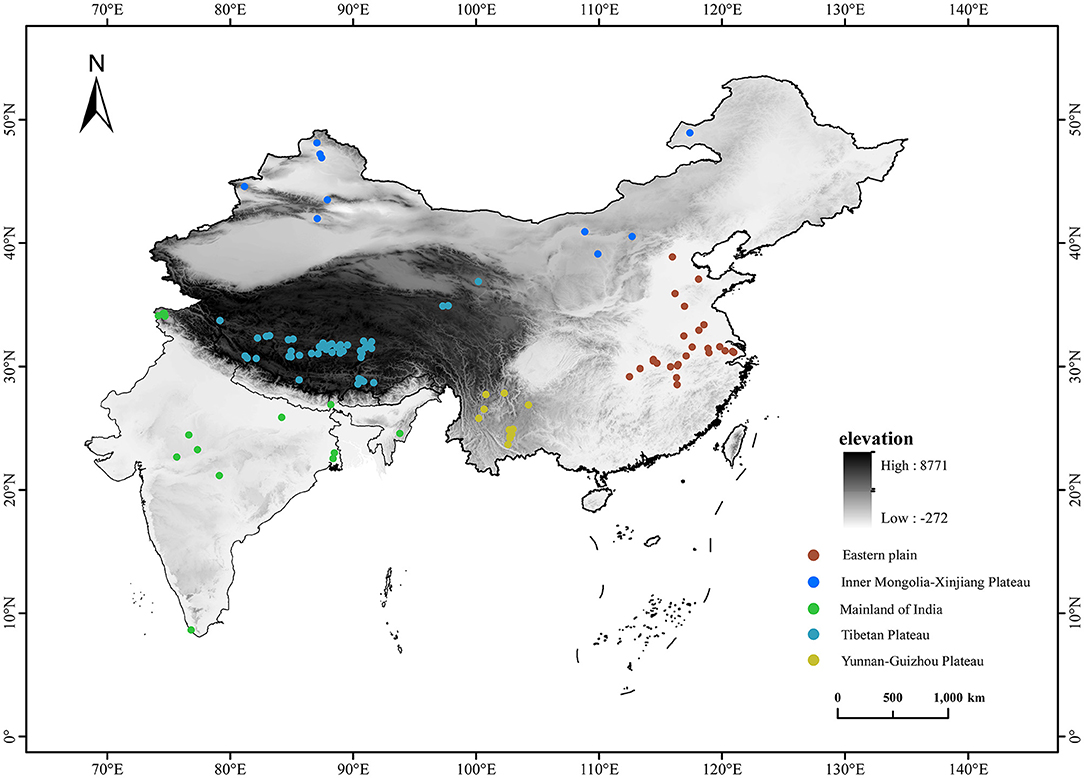
Figure 1. Geographical position of 104 studied lakes distributed in China and India along an elevational gradient of 2–5,010 m a.s.l.
The macroinvertebrates sampling habitats included pelagic zones and littoral zones in each lake. In pelagic zones, six samples in two different stations were collected with a weighted Petersen grab (0.0625 m2). In littoral zones, different habitats in two stations were randomly selected along the shoreline between depths of 15–30 cm, and two samples were collected using a D net (0.25 × 2 m, with 420 μm mesh). All the samples were sieved with a 420 μm sieve in the field. Specimens were manually picked from sediment with a white porcelain plate in the field and preserved in a 10% formalin solution. All specimens were brought back to the laboratory for microscopic examination, counting, and weighing. Benthic macroinvertebrates were identified to the uniform taxonomic level according to professional references (Liu et al., 1979; Morse et al., 1994; Epler, 2001; Wang, 2002).
In the field investigations, elevation was measured with a handheld GPS produced by GARMIN, USA. Water dissolved oxygen (DO), pH, and salinity were measured with a YSI ProPlus (Yellow Spring Inc., USA). Water transparency (transparency) was measured with a Secchi disk. Total nitrogen (TN), total phosphorus (TP), ammonium nitrogen (), nitrate nitrogen (), and chemical oxygen demand (COD) were measured according to the environmental quality standards for surface water of China (GB 3838-2002; Wei et al., 1989). The DO, pH, salinity, transparency, TN, TP, , , and COD of collected lakes were extracted from the literature.
Drainage area, lake area, lake length, lake width, recharge coefficient, average water depth, and precipitation were collected from in the book of Lakes of China (Wang and Dou, 1998). Annual mean temperature (Temp_mean), maximum temperature of the warmest month (Temp_max), minimum temperature of the coldest month (Temp_min), temperature annual range (Temp_range), and evaporation were downloaded from WorldClim website (http://www.worldclim.org/; Fick and Hijmans, 2017), and values were extracted at each lake scale in ArcGIS 10.1.
First, we examined the relationship between elevation and other environmental variables with Spearman's rank correlation analysis to explore whether other variables were significantly correlated with elevation. Principal component analysis (PCA) was used to analyze the relationship among 22 environmental variables. According to the relationships above, we divided environmental variables into two groups, namely, elevation-related variables (significant correlation with elevation), and elevation-unrelated variables (no significant correlation with elevation). Then, by exploring the relationships between species richness (uniform genus or family level) of different groups (Bivalvia, Gastropoda, Oligochaeta, and Insecta) and elevation by regression analysis and quantile regression with the packages of quantreg (Koenker, 2021) in R 3.4.3 (R Core Team, 2017), we aimed to understand the distribution variations of different groups along the elevational gradient. Canonical correspondence analysis (CCA) was used to examine the relationship between macroinvertebrates composition and the explanatory variables. Forward selection with Monte Carlo permutation tests (999 permutations) was used to select a parsimonious set of explanatory variables under the cutoff point of p < 0.05. Partial canonical correlation analysis (pCCA) was used to analyze the relative importance of elevation-related variables and elevation-unrelated variables. Then, the total variation in macroinvertebrate composition was partitioned into four independent fractions: elevation-unrelated variance, elevation-related variance, shared variance, and unexplained variance. Some environmental variables were log-transformed before analyzing. PCA, CCA, and pCCA analyses were performed using the software CANOCO for Windows 5.0 version (Ter Braak and Šmilauer, 2012).
A PCA of 22 environmental variables showed that the first ordination axis was driven by elevation and elevation-related variables (mainly climatic variables) and explained 28.6% of the variance. The second ordination axis was mainly related to the area and other environmental variables and explained 16.0% of the variance (Figure 2). Temp_max, Temp_mean, precipitation, , Temp_min, longitude, DO, TN, COD, and TP showed negative correlations with elevation (p < 0.05). Conversely, transparency, evaporation, average water depth, pH, and salinity showed positive correlations with elevation (p < 0.05). Other environmental variables including lake length, lake width, latitude, recharge coefficient, lake area, drainage area, Temp_range, and showed no significant correlation with elevation (p > 0.05). Minimum, maximum, and mean value of environmental variables and their relationships with elevation are given in Appendix 3.
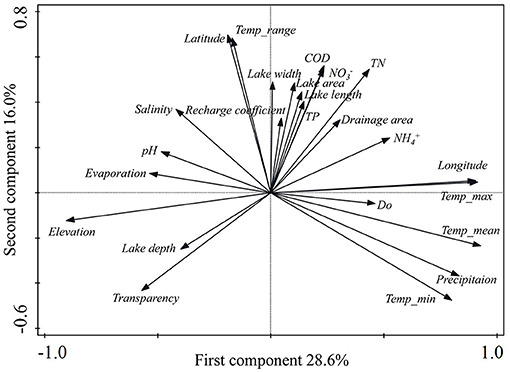
Figure 2. Plot of the principal component analysis for the 104 lakes with 24 environmental variables in China and India. COD, chemical oxygen demand; DO, water dissolved oxygen; , ammonium nitrogen; , nitrate nitrogen; Temp_mean, annual mean temperature; Temp_max, maximum temperature of the warmest month; Temp_min, minimum temperature of the coldest month; Temp_range, temperature annual range; TN, total nitrogen; TP, total phosphorus.
A total of 638 taxa belonging to four classes and 106 families were recorded in our studied lakes. Insecta was the most diverse group with 353 taxa belonging to 76 families. Gastropoda was also a diverse group with 137 taxa belonging to 17 families. There were fewer taxa of Oligochaeta and Bivalvia, which were recorded as 78 taxa belonging to five families and 70 taxa belonging to eight families, respectively.
Taxa distributions along the elevational gradient were not uniform among different taxonomic groups of benthic macroinvertebrates (Figure 3). Insecta and Oligochaeta were the widely distributed groups, and some taxa only occurred in high-elevational lakes. The distributions of Bivalvia and Gastropoda were relatively narrow.
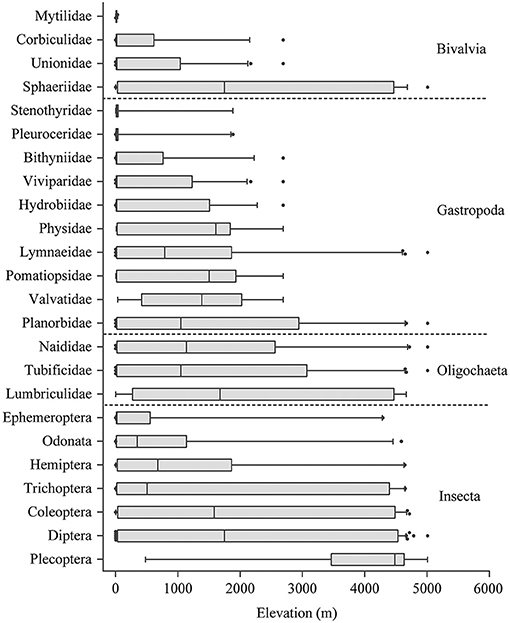
Figure 3. Distributions of different groups of benthic macroinvertebrates along elevational gradient in lakes of China and India.
The responses of benthic macroinvertebrate incidence to elevation were mostly negative, and only a few taxa showed a positive response (see Appendix 4 for details). Species richness of benthic macroinvertebrates showed decreasing tendency along elevation. However, these decreasing patterns were different among taxonomic groups: Bivalvia showed an exponentially decreasing pattern that showed a rapid decline in biodiversity at low elevation; Gastropoda richness showed a horizontal and then decreasing pattern and presented a significant decline over 2,000 m a.s.l.; and Oligochaeta and Insecta showed a linear decreasing pattern (Figure 4).
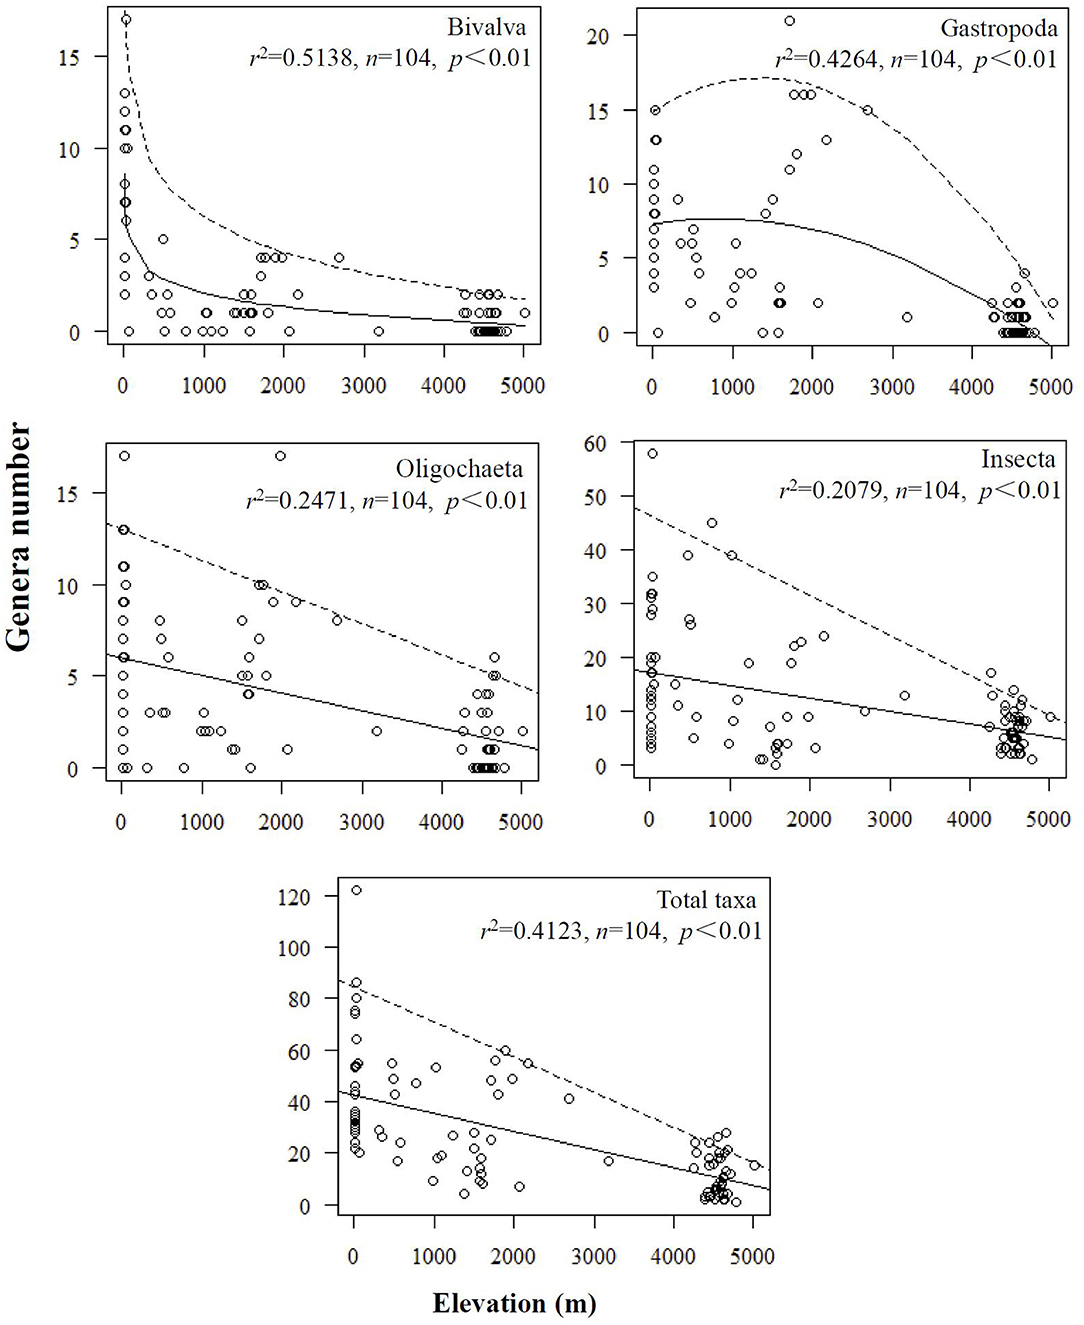
Figure 4. Biodiversity patterns along elevational gradient in different groups of benthic macroinvertebrates in lakes of China and India. Oligochaetes, gastropods, and bivalves were identified to genus or species. Insects were identified to family or genus. The solid lines represent the best regression curve using the least-squares method (statistical significance of r2 values is shown). The dashed lines represent the quantile regression curve of 95th percentiles.
Climatic variables were the most important explanatory factors for assemblage variation of benthic macroinvertebrates. Variables controlled by climate such as temperature, precipitation, salinity, and pH have significant effects on taxa distribution (Table 1). Area variables were also important factors in explaining assemblage variations, such as watershed area and water depth, which showed a significant impact on the distributions of Bivalvia and Gastropoda. Moreover, the watershed area showed a significant impact on the distribution of Insecta (Table 1). Compared with climatic variables and area variables, the impacts of other environmental variables on assemblage variation were relatively weak (Table 1). In general, elevation and elevation-controlled variables were the key driving factors for assemblage variation of benthic macroinvertebrates (Table 1).
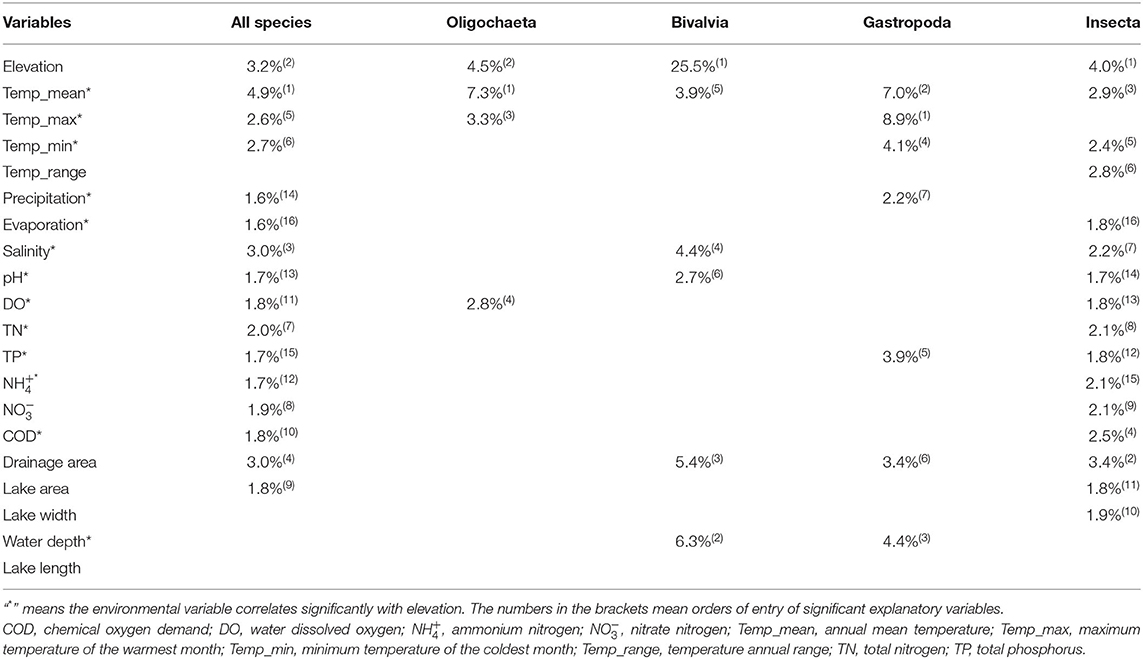
Table 1. Explanations (%) and order of entry of significant explanatory variables in the forward selection with Monte Carlo permutation tests to the assemblage variation of benthic macroinvertebrates (α = 0.05).
Elevation-related variables explained much more variation than elevation-unrelated variables. However, the proportions of assemblage variation explained by elevation-related variables and elevation-unrelated variables were different among taxonomic groups (Figure 5). Bivalvia showed the largest proportion of variation explained by the pure effect of elevation-related variables, followed by Gastropoda, while Oligochaeta and Insecta showed a relatively small proportion of variation explained by the pure effect of elevation-related variables (Figure 5). In total, the effect of elevation on taxa distribution was strongest in Bivalvia and less strong in Gastropoda, whereas it was relatively weak in Oligochaeta and Insecta.
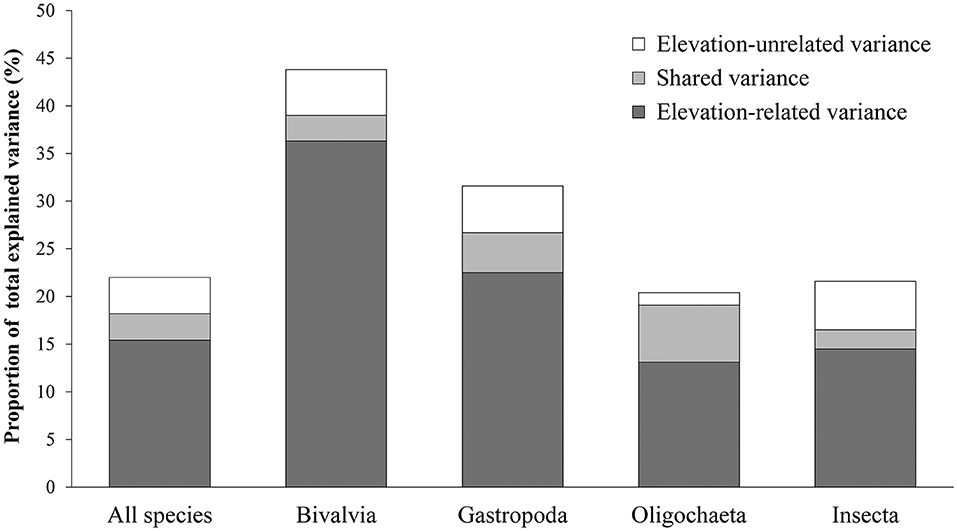
Figure 5. Proportion of total explained variance related to elevation-related variance, shared variance, and elevation-unrelated variance in different groups of benthic macroinvertebrates. Oligochaetes, gastropods, and bivalves were identified to genus or species. Insects were identified to family or genus.
It is a comprehensive study that explored the biodiversity patterns of multiple taxonomic groups of benthic macroinvertebrates (including Bivalvia, Gastropoda, Oligochaeta, and Insecta) along such an extensive elevational gradient at a large geographical scale. Our results elucidated that species richness of benthic macroinvertebrates declined with increasing elevation, but the patterns varied among taxonomic groups, which showed an exponentially decreasing pattern of Bivalvia, a horizontal and then decreasing pattern of Gastropoda, and a linear decreasing pattern of Oligochaeta and Insecta.
Rahbek (2005) summarized 204 data sets from 140 studies on elevational biodiversity patterns, including plants, vertebrates, and invertebrates, and assigned them to one of five patterns, namely, monotonic decreasing; horizontal, then decreasing; hump-shaped; increasing, and other. Among the patterns above, a hump-shaped elevational biodiversity pattern was more typical (c. 50%) than a monotonic decreasing pattern (c. 25%). However, the elevational range of previous studies was not wide enough (e.g., <500 m, or more than 2,000 m) to reflect the continuous biodiversity pattern. For example, a hump-shaped pattern would be concealed if elevations below 500 m were excluded (Neate-Clegg et al., 2021). And if the elevation was over 4,000 m, the monotonic increasing pattern would often hardly appear.
Our results showed a decreasing elevational biodiversity pattern in species richness, rather than the more typical hump-shaped elevational biodiversity pattern in the literature, which may be caused by the studied groups. For example, nonvolant small mammals showed a clear hump-shaped elevational biodiversity pattern in species richness (McCain, 2005; Gebert et al., 2019). The hump-shaped pattern was also typical in vertebrates such as birds (McCain, 2009; Neate-Clegg et al., 2021), reptiles (McCain, 2010), and amphibians (Fu et al., 2006; Wang et al., 2019), and terrestrial invertebrate species, such as beetles (da Silva et al., 2018; McCabe and Cobb, 2020), moths (Beck et al., 2017), and ants (Szewczyk and McCain, 2016; Nunes et al., 2020). However, aquatic biological groups often showed a decreasing elevational biodiversity pattern in species richness, such as fish (Fu et al., 2004; Bhatt et al., 2012; Qian et al., 2021), crustacean (Hessen et al., 2007; Ramos et al., 2021), rotifer (Obertegger et al., 2010), aquatic plants (Jones et al., 2003; Stefanidis et al., 2021), phytoplankton and cyanobacteria (Jankowski and Weyhenmeyer, 2006; Teittinen et al., 2017).
Three important hypotheses, namely, climate/productivity, environmental heterogeneity, and dispersal/history, have been most mentioned to explain the biodiversity patterns (Field et al., 2009; He et al., 2020). In our study, elevation-related variables (i.e., temperature and salinity) and elevation play a dominant role in biodiversity patterns, which could be corresponded with the three hypotheses above. Among them, temperature, which represents the climate/productivity hypothesis, is the most important explanatory variable in explaining assemblage variation for macroinvertebrates and different groups (Bivalvia, Gastropoda, Oligochaeta, and Insecta; Table 1). Temperature has been mostly recognized as a primary factor to shape biodiversity patterns for the groups to adjust quickly to changing climate (He et al., 2020). Temperature monotonically declines with elevation, so some tropical species find it hard to survive at high elevational areas, which leads to the decrease of species richness (Fu et al., 2004; Wang et al., 2019). In addition, low temperature could limit the species richness in two ways. One way is to reduce metabolic rates, thereby increasing generation times, and then hinder evolutionary processes (Rozen-Rechels et al., 2019). The other way is to lead to foraging restrictions in ectotherms and reduce their ability to utilize food resources (Sanders et al., 2003; Classen et al., 2015). All in all, the temperature has important impacts on almost all biological processes, such as interspecific relationships, gene mutation, speciation, extinction, and evolution. Through those ways, it affects the biodiversity patterns (Rozen-Rechels et al., 2019).
Salinity, which represents the environmental heterogeneity hypothesis, is also an important explanatory variable to explain assemblage variation in this study. Elevation generally influences the precipitation and evaporation and ultimately determines the salinity of the lakes and finally affects the biodiversity patterns (Williams et al., 1990). Several studies have shown that salinity is an ecological barrier to determining geographical distribution. With salinity increased, biodiversity declined exponentially. Lin et al. (2017) invested zooplankton communities in 45 lakes of the Tibetan Plateau and found that species richness declined significantly with salinity. In addition, our unpublished data of benthic macroinvertebrates in 40 lakes of the Tibetan Plateau showed that the taxa composition in saline lakes was significantly different from that in freshwater lakes. Oligochaeta, Gastropoda, and Bivalvia were generally distributed in freshwater lakes with salinity below 3 g/L. Chironomidae were distributed in saline lakes with salinity up to 35 g/L. Only a few taxa of Insecta (i.e., Ephydridae and Hydrophilidae) can survive in lakes with salinity over 35 g/L.
Besides the influences of temperature and salinity, elevation, which represents the dispersal/history hypothesis, also plays an important role in determining biodiversity patterns (Currie et al., 2004; Hagen et al., 2021). Elevational patterns in China were characterized by complex geological tectonic histories since the Cenozoic (Favre et al., 2015). Dispersal ability is a key condition for species distributions (e.g., Heino, 2013; Siefert et al., 2015). Island biogeography studies have shown that weak dispersers are often absent from distant islands or habitat fragments, leading to a decrease in species richness with isolation (Prugh et al., 2008; Sandel et al., 2020). Our results confirmed that this phenomenon also occurs in lake ecosystems. Most bivalves with passive movement ability are absent from high altitude areas, leading to the poor biodiversity of bivalves in Tibetan Plateau lakes. Furthermore, we have also investigated two genera of small bivalves (Pisidium and Sphaerium) in Tibetan Plateau lakes, as small bivalves may be easier to be transferred from the lowland to high plateau areas by waterbirds (Cai et al., 2018). Compared with strong aerial dispersers with flying adults (i.e., Insecta), weak and passive dispersers with aquatic adults (i.e., Gastropoda and Bivalvia) are more sensitive to elevation restrictions (Heino, 2013). This is consistent with our study. In addition, McCulloch et al. (2017) studied New Zealand's entire plecopteran fauna (100 species), observed a positive correlation between geographical range and relative wing length, and found that even small reductions in wing size could significantly influence geographical range.
In summary, the impacts of elevation on biodiversity patterns of benthic macroinvertebrates may be controlled through three important mechanisms (Figure 6): (i) with the elevation increasing, the air temperature drops sharply, leading to decreasing of the water temperature and ultimately reducing the biodiversity of benthic macroinvertebrates; (ii) precipitation and evaporation are significantly affected by the increasing elevation, which eventually increases the salinity of lakes and thereby reduces the biodiversity of benthic macroinvertebrates; (iii) due to isolation, elevation hinders the exchange and diffusion of species and ultimately affects biodiversity.
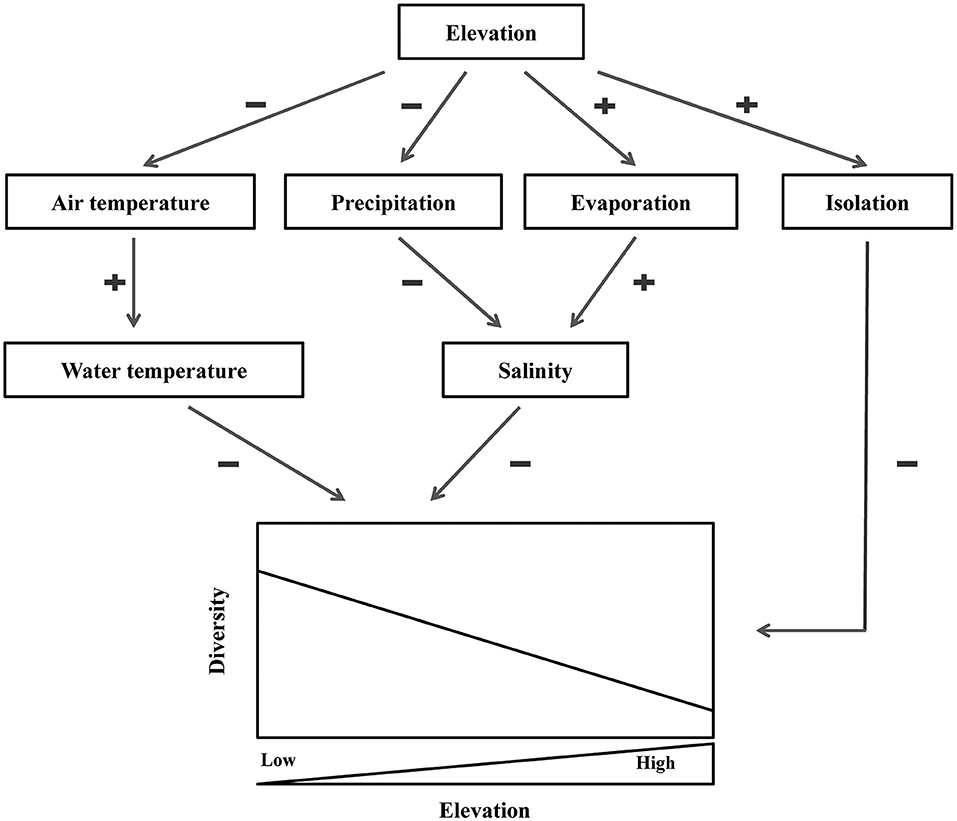
Figure 6. Mechanisms of elevational effects on benthic macroinvertebrates biodiversity in lakes of China and India. “±” indicate whether there is a positive or a negative tendency between two variables.
Our study concluded different biodiversity patterns for different groups of benthic macroinvertebrates along the elevational gradient. Climatic factors played a key role in the elevational biodiversity patterns in all the groups. Insecta distribute along a wider elevational gradient than Gastropoda and Bivalvia. Finally, we revealed three mechanisms that shaped the biodiversity patterns of benthic macroinvertebrates.
The original contributions presented in the study are included in the article/Supplementary Material, further inquiries can be directed to the corresponding author.
BW and YC put forward the scientific hypothesis and participated in the investigations in the fields. BW, YZ, and YH identified the macrozoobenthos. BW and YH collected the literature data and analyzed the data. BW wrote the manuscript. YC, YH, and YZ edited the manuscript. All authors read and approved the manuscript. All authors contributed to the article and approved the submitted version.
This study was supported by the National Natural Science Foundation of China (No. 31471962) and the National Science and Technology Basic Special (2014FY210700).
The authors declare that the research was conducted in the absence of any commercial or financial relationships that could be construed as a potential conflict of interest.
All claims expressed in this article are solely those of the authors and do not necessarily represent those of their affiliated organizations, or those of the publisher, the editors and the reviewers. Any product that may be evaluated in this article, or claim that may be made by its manufacturer, is not guaranteed or endorsed by the publisher.
We are grateful to Dekui He and Xiong Xiong from the Institute of Hydrobiology, Chinese Academy of Sciences, for the acquisitions of lake environmental data from Tibet Plateau and comments on this manuscript.
The Supplementary Material for this article can be found online at: https://www.frontiersin.org/articles/10.3389/fevo.2022.817708/full#supplementary-material
Albrecht, J., Classen, A., Vollstädt, M. G., Mayr, A., Mollel, N. P., Costa, D. S., et al. (2018). Plant and animal functional diversity drive mutualistic network assembly across an elevational gradient. Nat. Commun. 9, 1–10. doi: 10.1038/s41467-018-05610-w
Beck, J., McCain, C. M., Axmacher, J. C., Ashton, L. A., Bartschi, F., Brehm, G., et al. (2017). Elevational species richness gradients in a hyperdiverse insect taxon: a global meta-study on geometrid moths. Glob. Ecol. Biogeogr. 26, 412–424. doi: 10.1111/geb.12548
Bhatt, J. P., Manish, K., and Pandit, M. K. (2012). Elevational gradients in fish diversity in the Himalaya: water discharge is the key driver of distribution patterns. PLoS ONE 7:e46237. doi: 10.1371/journal.pone.0046237
Birrell, J. H., Shah, A. A., Hotaling, S., Giersch, J. J., Williamson, C. E., Jacobsen, D., et al. (2020). Insects in high-elevation streams: life in extreme environments imperiled by climate change. Glob. Change Biol. 26, 6667–6684. doi: 10.1111/gcb.15356
Brown, J. H. (2001). Mammals on mountainsides: elevational patterns of diversity. Glob. Ecol. Biogeogr. 10, 101–109. doi: 10.1046/j.1466-822x.2001.00228.x
Bryant, J. A., Lamanna, C., Morlon, H., Kerkhoff, A. J., Enquist, B. J., and Green, J. L. (2008). Microbes on mountainsides: contrasting elevational patterns of bacterial and plant diversity. Proc. Natl. Acad. Sci. U. S. A. 105, 11505–11511. doi: 10.1073/pnas.0801920105
Cai, Y. J., Zhang, M., Xu, J., and Heino, J. (2018). Geographical gradients in the biodiversity of chinese freshwater molluscs: implications for conservation. Divers. Distrib. 24, 485–496. doi: 10.1111/ddi.12695
Classen, A., Peters, M. K., Kindeketa, W. J., Appelhans, T., Eardley, C. D., Gikungu, M. W., et al. (2015). Temperature versus resource constraints: which factors determine bee diversity on mount Kilimanjaro, Tanzania? Glob. Ecol. Biogeogr. 24, 642–652. doi: 10.1111/geb.12286
Collen, B., Whitton, F., Dyer, E. E., Baillie, J. E. M., Cumberlidge, N., Darwall, W. R. T., et al. (2014). Global patterns of freshwater species diversity, threat and endemism. Glob. Ecol. Biogeogr. 23, 40–51. doi: 10.1111/geb.12096
Currie, D. J., Mittelbach, G. G., Cornell, H. V., Field, R., Guégan, J. F., Hawkins, B. A., et al. (2004). Predictions and tests of climate-based hypotheses of broad-scale variation in taxonomic richness. Ecol. Lett. 7, 1121–1134. doi: 10.1111/j.1461-0248.2004.00671.x
da Silva, P. G., Lobo, J. M., Hensen, M. C., Vaz-de-Mello, F. Z., and Hernandez, M. I. M. (2018). Turnover and nestedness in subtropical dung beetle assemblages along an elevational gradient. Divers. Distrib. 24, 1277–1290. doi: 10.1111/ddi.12763
de Mendoza, G., and Catalan, J. (2010). Lake macroinvertebrates and the altitudinal environmental gradient in the Pyrenees. Hydrobiologia 648, 51–72. doi: 10.1007/s10750-010-0261-4
Edegbene, A. O., Odume, O. N., Arimoro, F. O., and Keke, U. N. (2021). Identifying and classifying macroinvertebrate indicator signature traits and ecological preferences along urban pollution gradient in the Niger Delta. Environ. Pollut. 281:117076. doi: 10.1016/j.envpol.2021.117076
Epler, J. H. (2001). Identification Manual for the Larval Chironomidae (Diptera) of North and South Carolina. Raleigh, NC: North Carolina Department of Environment and Natural Resources.
Favre, A., Päckert, M., Pauls, S. U., Jähnig, S. C., Uhl, D., Michalak, I., et al. (2015). The role of the uplift of the qinghai-tibetan plateau for the evolution of tibetan biotas. Biol. Rev. 90, 236–253. doi: 10.1111/brv.12107
Fick, S. E., and Hijmans, R. J. (2017). Worldclim 2: new 1-km spatial resolution climate surfaces for global land areas. Int. J. Climatol. 37, 4302–4315. doi: 10.1002/joc.5086
Field, R., Hawkins, B. A., Cornell, H. V., Currie, D. J., Diniz-Filho, J. A. F., Guegan, J. F., et al. (2009). Spatial species-richness gradients across scales: a meta-analysis. J. Biogeogr. 36, 132–147. doi: 10.1111/j.1365-2699.2008.01963.x
Fu, C. Z., Hua, X., Li, J., Chang, Z., Pu, Z. C., and Chen, J. K. (2006). Elevational patterns of frog species richness and endemic richness in the Hengduan mountains, China: geometric constraints, area and climate effects. Ecography 29, 919–927. doi: 10.1111/j.2006.0906-7590.04802.x
Fu, C. Z., Wu, J. H., Wang, X. Y., Lei, G. C., and Chen, J. K. (2004). Patterns of diversity, altitudinal range and body size among freshwater fishes in the Yangtze River Basin, China. Glob. Ecol. Biogeogr. 13, 543–552. doi: 10.1111/j.1466-822X.2004.00122.x
Gebert, F., Njovu, H. K., Treydte, A. C., Steffan-Dewenter, I., and Peters, M. K. (2019). Primary productivity and habitat protection predict elevational species richness and community biomass of large mammals on mt. Kilimanjaro. J. Anim. Ecol. 88, 1860–1872. doi: 10.1111/1365-2656.13074
Hagen, O., Skeels, A., Onstein, R. E., Jetz, W., and Pellissier, L. (2021). Earth history events shaped the evolution of uneven biodiversity across tropical moist forests. Proc. Natl. Acad. Sci. U. S. A. 118:e2026347118. doi: 10.1073/pnas.2026347118
Hawkins, B. A., Field, R., Cornell, H. V., Currie, D. J., Guegan, J. F., Kaufman, D. M., et al. (2003). Energy, water, and broad-scale geographic patterns of species richness. Ecology 84, 3105–3117. doi: 10.1890/03-8006
He, D. K., Sui, X. Y., Sun, H. Y., Tao, J., Ding, C. Z., Chen, Y. F., et al. (2020). Diversity, pattern and ecological drivers of freshwater fish in china and adjacent areas. Rev. Fish Biol. Fisher. 30, 387–404. doi: 10.1007/s11160-020-09600-4
He, Y. J., Wang, H. Z., Zhao, Y. J., and Cui, Y. D. (2021). Predicting the biodiversity hotspots of macrozoobenthos in the yangtze river basin. Ecol. Indic. 133:108428. doi: 10.1016/j.ecolind.2021.108428
Heino, J. (2013). Does dispersal ability affect the relative importance of environmental control and spatial structuring of littoral macroinvertebrate communities? Oecologia 171, 971–980. doi: 10.1007/s00442-012-2451-4
Hessen, D. O., Bakkestuen, V., and Walseng, B. (2007). Energy input and zooplankton species richness. Ecography 30, 749–758. doi: 10.1111/j.2007.0906-7590.05259.x
Jankowski, T., and Weyhenmeyer, G. A. (2006). The role of spatial scale and area in determining richness-altitude gradients in Swedish lake phytoplankton communities. Oikos 115, 433–442. doi: 10.1111/j.2006.0030-1299.15295.x
Jins, V., Panigrahi, M., Jayapal, R., and Bishop, T. R. (2021). Elevational gradients of reptile richness in the southern western Ghats of India: evaluating spatial and bioclimatic drivers. Biotropica 53, 317–328. doi: 10.1111/btp.12878
Jones, J. I., Li, W., and Maberly, S. C. (2003). Area, altitude and aquatic plant diversity. Ecography 26, 411–420. doi: 10.1034/j.1600-0587.2003.03554.x
Kessler, M., Kluge, J., Hemp, A., and Ohlemüller, R. (2011). A global comparative analysis of elevational species richness patterns of ferns. Glob. Ecol. Biogeogr. 20, 868–880. doi: 10.1111/j.1466-8238.2011.00653.x
Koenker, R. (2021). Quantreg: Quantile Regression. Available online at: https://CRAN.R-project.org/package=quantreg
Laiolo, P., Pato, J., and Obeso, J. R. (2018). Ecological and evolutionary drivers of the elevational gradient of diversity. Ecol. Lett. 21, 1022–1032. doi: 10.1111/ele.12967
Lin, Q., Zhang, Y., Marrs, R., Sekar, R., Luo, X., and Wu, N. (2020). Evaluating ecosystem functioning following river restoration: the role of hydromorphology, bacteria, and macroinvertebrates. Sci. Total Environ. 743:140583. doi: 10.1016/j.scitotenv.2020.140583
Lin, Q. Q., Xu, L., Hou, J. Z., Liu, Z. W., Jeppesen, E., and Han, B. P. (2017). Responses of trophic structure and zooplankton community to salinity and temperature in Tibetan lakes: implication for the effect of climate warming. Water Res. 124, 618–629. doi: 10.1016/j.watres.2017.07.078
Liu, S., Li, X., Tan, L., Fornacca, D., Fang, Y., Zhu, L., et al. (2021). The ecological niche and terrestrial environment jointly influence the altitudinal pattern of aquatic biodiversity. Sci. Total Environ. 800:149404. doi: 10.1016/j.scitotenv.2021.149404
Liu, Y. Y., Zhang, W. Z., and Wang, Y. X. (1979). Economic Fauna of China: Freshwater Mollusca. Beijing: Science Press.
Lomolino, M. V. (2001). Elevation gradients of species-density: historical and prospective views. Glob. Ecol. Biogeogr. 10, 3–13. doi: 10.1046/j.1466-822x.2001.00229.x
McCabe, L. M., and Cobb, N. S. (2020). From bees to flies: global shift in pollinator communities along elevation gradients. Front. Ecol. Evol. 8:626124. doi: 10.3389/fevo.2020.626124
McCain, C. M. (2004). The mid-domain effect applied to elevational gradients: species richness of small mammals in Costa Rica. J. Biogeogr. 31, 19–31. doi: 10.1046/j.0305-0270.2003.00992.x
McCain, C. M. (2005). Elevational gradients in diversity of small mammals. Ecology 86, 366–372. doi: 10.1890/03-3147
McCain, C. M. (2007). Area and mammalian elevational diversity. Ecology 88, 76–86. doi: 10.1890/0012-9658(2007)88[76:AAMED]2.0.CO;2
McCain, C. M. (2009). Global analysis of bird elevational diversity. Glob. Ecol. Biogeogr. 18, 346–360. doi: 10.1111/j.1466-8238.2008.00443.x
McCain, C. M. (2010). Global analysis of reptile elevational diversity. Glob. Ecol. Biogeogr. 19, 541–553. doi: 10.1111/j.1466-8238.2010.00528.x
McCulloch, G. A., Wallis, G. P., and Waters, J. M. (2017). Does wing size shape insect biogeography? Evidence from a diverse regional stonefly assemblage. Glob. Ecol. Biogeogr. 26, 93–101. doi: 10.1111/geb.12529
Mittelbach, G. G., Schemske, D. W., Cornell, H. V., Allen, A. P., Brown, J. M., Bush, M. B., et al. (2007). Evolution and the latitudinal diversity gradient: speciation, extinction and biogeography. Ecol. Lett. 10, 315–331. doi: 10.1111/j.1461-0248.2007.01020.x
Morse, J. C., Yang, L. F., and Tian, L. X. (1994). Aquatic Insects of China Useful for Monitoring Water Quality. Nanjing: Hohai University Press.
Neate-Clegg, M. H., Jones, S. E., Tobias, J. A., Newmark, W. D., and Sekercioglu, Ç. H. (2021). Ecological correlates of elevational range shifts in tropical birds. Front. Ecol. Evol. 9:215. doi: 10.3389/fevo.2021.621749
Nunes, C. A., Castro, F. S., Brant, H. S., Powell, S., Solar, R., Fernandes, G. W., et al. (2020). High temporal beta diversity in an ant metacommunity, with increasing temporal functional replacement along the elevational gradient. Front. Ecol. Evol. 8:571439. doi: 10.3389/fevo.2020.571439
Obertegger, U., Thaler, B., and Flaim, G. (2010). Rotifer species richness along an altitudinal gradient in the alps. Glob. Ecol. Biogeogr. 19, 895–904. doi: 10.1111/j.1466-8238.2010.00556.x
Pandey, B., Pan, K., Dakhil, M. A., Liao, Z., Timilsina, A., Khanal, M., et al. (2021). Contrasting gymnosperm diversity across an elevation gradient in the ecoregion of China: the role of temperature and productivity. Front. Ecol. Evol. 9:679439. doi: 10.3389/fevo.2021.679439
Prugh, L. R., Hodges, K. E., Sinclair, A. R. E., and Brashares, J. S. (2008). Effect of habitat area and isolation on fragmented animal populations. Proc. Natl. Acad. Sci. U. S. A. 105, 20770–20775. doi: 10.1073/pnas.0806080105
Qian, H., Cao, Y., Chu, C., Li, D., Sandel, B., Wang, X., et al. (2021). Taxonomic and phylogenetic β-diversity of freshwater fish assemblages in relationship to geographical and climatic determinants in north america. Glob. Ecol. Biogeogr. 30, 1965–1977. doi: 10.1111/geb.13358
R Core Team (2017). R: A Language and Environment for Statistical Computing. Vienna: R Foundation for Statistical Computing.
Rahbek, C. (2005). The role of spatial scale and the perception of large-scale species-richness patterns. Ecol. Lett. 8, 224–239. doi: 10.1111/j.1461-0248.2004.00701.x
Ramos, L., Epele, L. B., Grech, M. G., Manzo, L. M., Macchi, P. A., and Cusminsky, G. C. (2021). Modelling influences of local and climatic factors on the occurrence and abundance of non-marine ostracods (Crustacea: Ostracoda) across Patagonia (Argentina). Hydrobiologia 7, 1–16. doi: 10.1007/s10750-021-04722-7
Rozen-Rechels, D., Dupoué, A., Lourdais, O., Chamaillé-Jammes, S., Meylan, S., Clobert, J., et al. (2019). When water interacts with temperature: ecological and evolutionary implications of thermo-hydroregulation in terrestrial ectotherms. Ecol. Evol. 9, 10029–10043. doi: 10.1002/ece3.5440
Sandel, B., Weigelt, P., Kreft, H., Keppel, G., van der Sande, M. T., Levin, S., et al. (2020). Current climate, isolation and history drive global patterns of tree phylogenetic endemism. Glob. Ecol. Biogeogr. 29, 4–15. doi: 10.1111/geb.13001
Sanders, N. J., Moss, J., and Wagner, D. (2003). Patterns of ant species richness along elevational gradients in an arid ecosystem. Glob. Ecol. Biogeogr. 12, 93–102. doi: 10.1046/j.1466-822X.2003.00324.x
Siefert, A., Lesser, M. R., and Fridley, J. D. (2015). How do climate and dispersal traits limit ranges of tree species along latitudinal and elevational gradients? Glob. Ecol. Biogeogr. 24, 581–593. doi: 10.1111/geb.12287
Stefanidis, K., Oikonomou, A., and Papastergiadou, E. (2021). Responses of different facets of aquatic plant diversity along environmental gradients in mediterranean streams: results from rivers of greece. J Environ. Manage. 296:113307. doi: 10.1016/j.jenvman.2021.113307
Szewczyk, T., and McCain, C. M. (2016). A systematic review of global drivers of ant elevational diversity. PLoS ONE 11:e0155404. doi: 10.1371/journal.pone.0155404
Teittinen, A., Wang, J. J., Stromgard, S., and Soininen, J. (2017). Local and geographical factors jointly drive elevational patterns in three microbial groups across subarctic ponds. Glob. Ecol. Biogeogr. 26, 973–982. doi: 10.1111/geb.12607
Ter Braak, C. J. F., and Šmilauer, P. (2012). Canoco Reference Manual and User's Guide: Software for Ordination, Version 5.0. Ithaca, NY: Microcomputer Power.
Wang, H. Z. (2002). Studies on Taxonomy, Distribution and Ecology of Microdrile Oligochaetes of China, With Descriptions of Two New Species From the Vicinity of the Great Wall Station of China, Antarctica. Beijing: Higher Education Press.
Wang, J., Liu, Y.-H., Martin, K., Luo, F., and Meng, L.-Z. (2019). Implications of continuous amphibian diversity monitoring in daweishan national nature reserve in tropical se yunnan, China. Glob. Ecol. Conserv. 20:e00694. doi: 10.1016/j.gecco.2019.e00694
Wang, J. J., Soininen, J., Zhang, Y., Wang, B. X., Yang, X. D., and Shen, J. (2011). Contrasting patterns in elevational diversity between microorganisms and macroorganisms. J. Biogeogr. 38, 595–603. doi: 10.1111/j.1365-2699.2010.02423.x
Wei, F. S., Kou, H. R., and Hong, S. J. (1989). Methods for the Examination of Water and Wastewater. Beijing, China: China Environmental Science Press.
Keywords: elevational gradient, distribution variation, elevational mechanism, macroinvertebrates, Chinese and Indian lakes
Citation: Wang B, He Y, Zhao Y and Cui Y (2022) Distribution and Assemblage Variation of Benthic Macroinvertebrates: A Uniform Elevational Biodiversity Pattern Among Different Groups? Front. Ecol. Evol. 10:817708. doi: 10.3389/fevo.2022.817708
Received: 18 November 2021; Accepted: 19 January 2022;
Published: 03 March 2022.
Edited by:
Tian Zhao, Chengdu Institute of Biology (CAS), ChinaCopyright © 2022 Wang, He, Zhao and Cui. This is an open-access article distributed under the terms of the Creative Commons Attribution License (CC BY). The use, distribution or reproduction in other forums is permitted, provided the original author(s) and the copyright owner(s) are credited and that the original publication in this journal is cited, in accordance with accepted academic practice. No use, distribution or reproduction is permitted which does not comply with these terms.
*Correspondence: Yongde Cui, eWRjdWlAaWhiLmFjLmNu
Disclaimer: All claims expressed in this article are solely those of the authors and do not necessarily represent those of their affiliated organizations, or those of the publisher, the editors and the reviewers. Any product that may be evaluated in this article or claim that may be made by its manufacturer is not guaranteed or endorsed by the publisher.
Research integrity at Frontiers
Learn more about the work of our research integrity team to safeguard the quality of each article we publish.