
94% of researchers rate our articles as excellent or good
Learn more about the work of our research integrity team to safeguard the quality of each article we publish.
Find out more
METHODS article
Front. Ecol. Evol., 27 April 2022
Sec. Conservation and Restoration Ecology
Volume 10 - 2022 | https://doi.org/10.3389/fevo.2022.793307
This article is part of the Research TopicNew Century Wolf Conservation and Conflict ManagementView all 19 articles
 Ane Eriksen1*†
 Erik Versluijs1†
 Boris Fuchs1
 Barbara Zimmermann1
 Petter Wabakken1
 Andrés Ordiz2
 Peter Sunde3
 Camilla Wikenros4Håkan Sand4
 Benjamin Gillich5
 Frank Michler5
 Kristoffer Nordli1David Carricondo-Sanchez1
 Lucrezia Gorini1Siegfried Rieger5
As wolves recolonize areas of Europe ranging from moderate to high anthropogenic impact, fear of wolves is a recurring source of conflict. Shared tools for evaluating wolf responses to humans, and comparing such responses across their range, can be valuable. Experiments in which humans approach wild wolves can increase our understanding of how wolves respond to humans, facilitating human-wolf coexistence. We have developed the first standardized protocol for evaluating wolf responses to approaching humans using high-resolution GPS data, and tested it on wild wolves. We present a field protocol for experimentally approaching GPS-collared wolves, a descriptive comparison of two statistical methods for detecting a measurable flight response, a tutorial for identifying wolf flight initiation and resettling positions, and an evaluation of the method when reducing GPS positioning frequency. The field protocol, a data collection form, and the tutorial with R code for extracting flight parameters are provided. This protocol will facilitate studies of wolf responses to approaching humans, applicable at a local, national, and international level. Data compiled in a standardized way from multiple study areas can be used to quantify the variation in wolf responses to humans within and between populations, and in relation to predictors such as social status, landscape factors, or human population density, and to establish a baseline distribution of wolf response patterns given a number of known predictors. The variation in wolf responses can be used to assess the degree to which results can be generalized to areas where GPS studies are not feasible, e.g., for predicting the range of likely wolf behaviors, assessing the likelihood of wolf-human encounters, and complementing existing tools for evaluating reports of bold wolves. Showing how wolves respond to human encounters should help demystify the behavior of wild wolves toward humans in their shared habitat.
After centuries of decline and subsequent legal protection, large carnivores are recolonizing parts of their historical European range (Trouwborst, 2010; Chapron et al., 2014). The multifunctional patchwork landscapes to which they are returning vary from moderate to high anthropogenic impact, and across Europe, large carnivores are settling in managed forests (Wabakken et al., 2001; Gurarie et al., 2011), forest-farmland mosaics (Sunde and Olsen, 2018), agro-ecosystems (Blanco and Cortés, 2007), and sometimes near human settlements (Carricondo-Sanchez et al., 2020) and urban areas (Basille et al., 2009; Bateman and Fleming, 2012; López-Bao et al., 2013). The distribution ranges of large carnivores are still increasing, and ecological niche models indicate that European human-dominated landscapes still provide ample space for further range expansions (Milanesi et al., 2017). Hence, although wilderness areas may be essential to keep favorable trends in the long term (Gilroy et al., 2015), the idea that large carnivores can only survive in remote or protected wilderness areas does not apply to today’s Europe (Chapron et al., 2014).
Among the European large carnivores, wolves (Canis lupus) have adapted to the most populated areas, with a mean human density of 36.7 inhabitants/km2 (range = 0–3,050) in areas of permanent wolf presence in Europe (Chapron et al., 2014). For instance, Europe hosts more wolves than the United States, despite being half the size and more than twice as densely populated (Chapron et al., 2014; Boitani, 2018). This land sharing between wolves and humans gives increased potential for direct wolf-human interactions (Bateman and Fleming, 2012).
The prospect of encountering wolves is a factor that can affect human attitudes toward the species (Bath, 2000; Røskaft et al., 2007). Fear of wolves is a recurring source of conflict, and has been associated with a lack of knowledge about the species (Bath, 2000; Bath and Majic, 2001), a perception that wolves are dangerous and unpredictable (Johansson et al., 2012), and a fear of the unknown (Zimmermann et al., 2001). Some people living in areas recolonized by wolves report that a concern for their own or their family’s safety results in diminished quality of life (Røskaft et al., 2007). In modern times, non-rabid wolf attacks on humans are very rare, and documented cases are usually linked to habituation to anthropogenic food sources (Linnell and Alleau, 2016; Reinhardt et al., 2020; Linnell et al., 2021; Nowak et al., 2021). In developed countries, recent focus has been on wolves developing fearless behavior, and on human behaviors that may enhance the risk of attacks (Linnell and Alleau, 2016; Penteriani et al., 2016; LCIE, 2019; Reinhardt et al., 2020). However, there is a lack of research to understand the processes that may lead to risky situations (Löe and Röskaft, 2004; Linnell and Alleau, 2016). Knowledge about wolf behavior toward humans should help mitigate fear and thus facilitate wolf-human coexistence.
Because fear of wolves is a common challenge across their recolonized European range (e.g., Bath, 2000; Bath and Majic, 2001; Røskaft et al., 2007; Johansson et al., 2012; Reinhardt et al., 2020), shared tools for evaluating wolf responses to humans, and comparing such responses across their range, can be valuable. Experiments in which human observers approach marked wolves can increase the knowledge about how wolves can be expected to respond to interactions with humans (Karlsson et al., 2007). Experimental human approaches have been done previously on species such as common buzzards (Buteo buteo) (Sunde et al., 2009a), reindeer (Rangifer tarandus) (Colman et al., 2012), red deer (Cervus elaphus) (Sunde et al., 2009b), moose (Alces alces) (Viljanen, 2019), polar bears (Ursus maritimus) (Andersen and Aars, 2008), brown bears (Ursus arctos) (Moen et al., 2012, 2018; Ordiz et al., 2013, 2019), lynx (Lynx lynx) (Sunde et al., 1998), and wolves (Karlsson et al., 2007; Wam et al., 2012, 2014). However, previous studies on wolves used VHF collars (Karlsson et al., 2007; Wam et al., 2012, 2014), limiting the level of detail at which the wolf response could be recorded without subsequent snow tracking (Karlsson et al., 2007). Today’s GPS collars provide movement data at much higher temporal resolution and spatial precision and accuracy, without the need for snow cover. Additionally, a standardized protocol will allow comparative studies across different study areas, e.g., comparing responses within and between populations, and among areas of varying human density. Hence, a baseline distribution of wolf response patterns can be established given a number of known predictors. Such knowledge about likely wolf responses to humans may increase predictability of wolf behavior to people living in wolf areas.
Large carnivores can show physiological and behavioral antipredator responses to humans (Ordiz et al., 2011; Støen et al., 2015), and may show a proactive fight or flight, or a reactive freeze or hide response (Koolhaas et al., 1999; Roelofs, 2017). The presence or absence of a flight response, and the distance from the disturbance at which the animal flees (flight initiation distance, hereafter FID), are therefore useful parameters to describe the responses of wild animals to human disturbance (for examples, see Colman et al., 2012; Moen et al., 2012; Ordiz et al., 2019; Viljanen, 2019). As shown in brown bears, extensive experimental approaches on GPS collared animals make it possible to compare flight initiation distances between individuals and demographic groups, and to study potential habituation and lasting behavior when approached repeatedly (Ordiz et al., 2013, 2019; Sahlen et al., 2015). For detecting flight initiation during human approaches, two statistical methods have been used previously, i.e., Upper Control Limit (UCL; Moen et al., 2012; Sahlen et al., 2015; Ordiz et al., 2019) and changepoint analyses (Killick et al., 2012; Viljanen, 2019; Græsli et al., 2020). However, it is not known if the methods differ in results for FID calculations.
In this paper, we present (1) a standardized field protocol for experimentally approaching GPS-collared wolves to assess their responses to encounters with humans, controlling for factors such as habitat parameters and number of approaching humans; (2) a descriptive comparison of two statistical methods (changepoint analysis and UCL) to detect the presence or absence of a measurable flight response, and to identify the time and location of both flight initiation and resettling; (3) a tutorial for using changepoint analyses to identify wolf flight initiation and resettling positions as a basis for extracting a number of flight parameters; and (4) a quantitative assessment of the effects on success rate and precision when extracting flight parameters from wolf GPS data at reduced temporal resolution. Lowering the GPS positioning frequency for the approach trials can be an alternative to increase collar battery life. The field protocol, a field data collection form, and a tutorial with the R code for extracting the time and coordinates for flight initiation and resettling are provided as Supplementary Presentations 1–3. This standardized protocol will facilitate studies of wolf responses to direct interactions with humans, and it is applicable at local, national, and international levels.
The protocol requires wolves equipped with GPS collars with positioning frequency programmable down to 1-min intervals, and with two-way wireless radio or satellite communication allowing remote re-programming of positioning schedule and data transmission after a set number of acquired positions. The field trials require a handheld GPS unit that can record a track log with 1-s positioning intervals, and an anemometer for measuring wind speed and direction (optional). The post-trial visibility measurements require a brightly colored cylinder (60 cm tall and 30 cm diameter) as described by Ordiz et al. (2009), or an equivalent structure.
Wolf captures were carried out in Scandinavia (Norway and Sweden), and Germany, and experimental human approaches were carried out in Scandinavia, Germany and Poland. These are areas where wolf populations have been recolonizing former grounds in recent decades (e.g., Chapron et al., 2014).
All wolves were chemically immobilized using tiletamine-zolazepam (Zoletil forte®, Virbac, Carros, France) and equipped with VERTEX GPS PLUS collars (Vectronics aerospace GmbH, Berlin Germany). The collars had two-way wireless communication (GSM or Iridium), enabling remote re-programming of GPS positioning schedule down to 1-min intervals and transmission of data batches after a set number of acquired GPS positions.
In central Scandinavia, a total of 11 wolves in six different territories were immobilized by darting from a helicopter during the winters of 2017–2021. The captures were conducted by the Scandinavian Wolf Research Project (SKANDULV), and the technique is described in detail by Sand et al. (2006), and followed the ethically approved procedures described by Arnemo and Evans (2017). Captures and experimental human approach trials were approved by the Norwegian Food Safety Authority (FOTS ID 15370) and the Animal Welfare Ethics Committee of Uppsala, Sweden (ref. 5.8.18–13246/2019). At the time of the approach trials, all of the collared wolves were territory-marking adults.
In eastern Germany, three wolves were captured and collared during the winters of 2019–2021 as part of the projects “Interspecific interaction behavior of wolves and red deer” and “Interaction behavior of wolves and mega herbivores (Konik horses and Heck cattle) on a large year-round grazing area.” The wolves were captured with foothold-traps (equipped with trap transmitters from MinkPolice or VECTRONIC Aerospace GmbH, Berlin Germany) and immobilized within 30 min after capture using a blowpipe. One of the wolves (ID4) dispersed across the border to western Poland, close to the river Oder, where it was a non-territorial single wolf at the time of the trials. The other two were still in Germany at the time of the trials, one as a territory-marking adult (ID5) and one as a yearling (ID6) which, based on the GPS data, was not fully included in the natal pack anymore, but still tolerated close by.
The Norwegian/Swedish study area is mainly dominated by coniferous forest, with a lower abundance of deciduous species. The intensively managed forests consist of a mosaic of stands with different age classes, with an extensive network of forest roads (Sand et al., 2008). The human population density in the area ranges from two to ten inhabitants per km2 (Statistisk Sentralbyrå, 2020,1). Moose is the most important prey for wolves and is found throughout the study area (Zimmermann, 2014; Zimmermann et al., 2015; Sand et al., 2016).
The study area in eastern Germany is dominated by mixed forests and agriculture areas, as well as moorland and open grassland with scattered villages. The area provides numerous hiking trails and forest roads, providing easy access to the public. The average human population density is around 80 inhabitants per square kilometer, but in the wolf territories less than 10 inhabitants per square kilometer. The main prey species for wolves in summer are roe deer (Capreolus capreolus), red deer, and wild boar (Sus scrofa) (Ansorge et al., 2006).
The Polish study area (with the GPS collared German immigrant wolf) is an end moraine region dominated by beech and mixed forests, as well as wetland habitats, agricultural land, and floodplains. The human density and infrastructure in this area is very low. Roe deer, fallow deer (Dama dama), and wild boar are prey species for the wolves in the area.
The field protocol was first developed and tested in two Scandinavian wolf territories in 2018. Subsequent fine-tuning and testing of the protocol took place in 2019–2021 in Scandinavia, Germany and Poland. Trials were not conducted in the period of May to mid-August to avoid disturbance in the denning and early pup rearing period, and we allowed on average 38 days (min = 14, max = 98) between consecutive trials on the same individuals within the same trial year (Aug-April).
The GPS collars were programmed to a baseline positioning frequency of one position every 4 h, optimized for longer-term research projects. Collars were programmed to send positions in batches of seven using GSM or Iridium communication, i.e., every 28 h at 100% GPS success and adequate conditions for data transmission. The two-way communication also allowed for remote re-programming of the positioning schedule. A new schedule could be sent at any time and would be received next time the collar would connect to transmit acquired positions. Hence, when planning an approach trial, the positioning schedule had to be sent in time for the collar to receive the programming.
As a trade-off between collar battery usage and allowing sufficient time to carry out the trial and register the wolf response, we decided on a 2-h approach period at 1-min positioning frequency. This would give high-resolution raw data, which could then be down-sampled to evaluate the effects of lower positioning frequency. We scheduled a preparation period with 10-min positioning intervals prior to the approach period to locate the wolf. In 2018 we used a preparation period of 2 h. However, to increase the chances of receiving updated positions in time to start the trial, we increased the preparation period to 4 h from 2019. We scheduled a post-disturbance period with 10-min positioning intervals immediately following the approach period to capture the flight of the wolf until it resettled. In 2018 we used a post-disturbance period of 1 h, but changed it to 3 h from 2019 to increase the likelihood of capturing the entire flight until resettling.
Based on published data on wolf circadian activity patterns (Merrill and Mech, 2003; Theuerkauf, 2009; Eriksen et al., 2011) and similar approach studies on brown bears (e.g., Moen et al., 2012), we scheduled the approach period to start at noon local time (13:00 during Daylight Savings Time DST) to maximize the likelihood of the wolf being at a day bed. Hence, on the day of an approach trial, the GPS collar was programmed for 10-min positions during 08:00–12:00, 1-min positions during 12:00–14:00, and 10-min positions from 14:00–17:00 (1 h later for all three periods during DST). With this schedule, the wolf collar was programmed to take a total of 163 positions during one 9-h trial period (08:00–17:00). For considerations of battery life trade-offs, this corresponds to 27 days of four-hourly positions.
Following our standardized approach route (AR, Figure 1), the observer would walk in a straight line from a starting distance (SD) of at least one km from the wolf start position (WSP), pass the passing position (PP) at a passing distance (PD) of 50 m from the WSP, and continue walking for another 500 m to the observer end position (OEP) before walking back in an arc away from the WSP to the observer start position (OSP).
Figure 1. Spatial arrangement of a standardized experimental human approach trial on wild wolves. OSP, observer start position; WSP, wolf start position; SD, starting distance; AR, approach route; PP, passing position; PD, passing distance; OEP, observer end position. Note that the graphic is not drawn to scale. Illustration: Juliana Spahr.
On approach days, we used incoming GPS positions during the preparation period to determine the location of the wolf. Centered on the last acquired wolf position (assumed WSP), we plotted a circle with a 1 km radius, and selected a suitable OSP on or outside this circle. Then, centered on the assumed WSP, we plotted another circle with a 50 m radius, and plotted the AR as a straight line starting at OSP, tangent to the 50 m circle, and continuing for another 500 m. The tangent point between the line (AR) and the 50 m circle defined the PP, and the end point defined the OEP. We selected an AR that facilitated walking in a straight line, preferably from an OSP that was accessible from a forest road, and with no ridges between AR and WSP that might potentially obstruct detection. Before starting the trial, we made the final corrections to the AR based on the last wolf position available, when possible, after receiving the first batch of 1-min positions. For some trials, wolf positions were monitored and AR was determined in the field. In most cases however, this was done more conveniently at the office and communicated to the field team.
The trials were conducted by either one or two human observers. Once the final AR was set, the observers would initiate track log with a handheld GPS unit and start walking at a regular hiking pace from OSP along AR in as straight a line as possible. The handheld GPS unit was set to log one position per second to facilitate matching with simultaneous wolf positions. In order for the trials to represent relevant and realistic scenarios of human hikers, observers did not try to be quiet, and pairs of observers would talk with each other while walking. Observers would leave the OSP in time to pass the PP at least 10 min before the end of the approach period to ensure at least 10 min of 1-min positions from the wolf after the observer passed the PP.
During the trial, environmental variables were recorded in a field form (Supplementary Presentation 2), including air temperature, wind strength and direction relative to AR, precipitation, humidity, vegetation cover, noise level from moving through the vegetation, and habitat type, following instructions for data registration given in the form (Supplementary Presentation 2).
As long as no wolf was seen, observers would follow the “standard approach protocol” as described above and outlined in Figure 2A, walking from OSP to OEP. However, in the case of a direct encounter with a wolf, observers were instructed to switch to the “direct encounter approach protocol” outlined in Figure 2B. We defined a direct encounter as: (1) visual observation of a wolf ahead of the observer when facing OEP, (2) observer would have noticed the wolf in a non-trial situation, (3) wolf being aware of observer, and (4) wolf not leaving immediately. All four criteria would need to be met, but the observer was not required to verify that the wolf was wearing a collar, before moving from the standard protocol to the direct encounter protocol. The direct encounter protocol consisted of a sequence of actions of increasing intensity: (1) stopping and waiting for 1 min, (2) counting to ten loudly, (3) waving arms and shouting loudly. Whenever the wolf would leave, the sequence would be terminated and the observers would resume the trial, walking toward OEP. If the wolf would not leave after completing the sequence, the observer would turn around and walk back to OSP. Direct encounters would be registered in the field form (Supplementary Presentation 2).
Figure 2. Sequence of a standardized experimental human approach trial on wild wolves. Observer will switch from standard protocol (A) to direct encounter protocol (B) if all the following criteria for direct encounter are met: (1) visual observation of a wolf ahead of the observer when observer is facing OEP, (2) observer would have noticed the wolf in a non-trial situation, (3) wolf is aware of observer, and (4) wolf does not leave immediately. OSP, observer start position; PP, passing position; OEP, observer end position (defined in Figure 1).
After the trial we identified the locations of flight initiation and resettling using the methods described under Data analyses and in Supplementary Presentation 3, and/or through visual inspection of the wolf positions. After the focal wolf had moved at least one km from the flight initiation and resettling position, we measured the visibility at these two locations as a measure of the concealment provided by vegetation. Following the description by Ordiz et al. (2009), we used a brightly colored cylinder (60 cm tall and 30 cm diameter), placed the cylinder at the coordinate of flight initiation/resettling, and measured the maximum distance in the four cardinal directions at which the cylinder could be seen.
A comprehensive field protocol for conducting the trials and the field form for data registration are provided in Supplementary Presentations 1, 2, respectively.
We used the R environment (R Core Team, 2019) within the interface of R-Studio (RStudio Team, 2016) for data preparation and analyses. Time and date formats were handled with the lubridate package (Grolemund and Wickham, 2011). Time was corrected to time zone GMT + 01:00, as approach trials during daylight saving time were in GMT + 02:00. The data from wolves and observers were extracted and trimmed to a period from 12:00 to 17:00 of the approach day. We visually assessed the data by plotting and animating individual approach trials with the ggplot2 package (Wickham, 2016) and the MoveVis package (Schwalb-Willmann, 2019). We calculated step lengths as the Euclidean distance between consecutive wolf positions. The speed was calculated as meters per minute by dividing the step length by the difference in time.
We used the sp package (Bivand et al., 2013) to transform the coordinates from the observer data to a projected coordinate system (WGS84/UTM zone 33N). We joined the observer data with the wolf data based on the date and time using the dplyr package (Wickham et al., 2019). If the observer data was lacking positions, we used the data.table package (Dowle and Srinivasan, 2019) to select the observer position that was the closest in time to the wolf position. We then calculated the Euclidean distance between simultaneous wolf and observer positions. Final coordinates for the WSP (to replace the assumed WSP used when setting up the AR prior to the trial) was defined as the first wolf position after the observer started walking from OSP.
We used changepoint analysis of wolf speed at 1-min resolution to identify flight initiation. For this purpose, we adjusted the wolf speed to a gamma distribution by changing values of 0 m/min to 0.01 m/min based on the assumption that a speed of exactly zero will be nearly impossible, due to GPS measurement error. We then applied a pruned exact linear time (PELT) algorithm with a gamma distribution on both mean and variance of the wolf speed with MBIC (Modified Bayes Information System) penalty on 95% CI using the function cpt.meanvar from the ChangePoint package (Killick et al., 2016). We chose the MBIC penalty, as the AIC and BIC penalties are prone to overestimating changepoints (Lavielle, 2005). The flight initiation was defined as the first changepoint after the observer started the approach trial (Figure 3).
Figure 3. Visualization of the detection of flight initiation and resettling positions of a wolf during experimental human approach trials. For detection, we used changepoint analysis with change in mean and variance of wolf movement speed using the MBIC penalty. The first changepoint indicates the moment of flight initiation based on 1-min GPS positioning intervals (solid line). Resettling location is defined as the first position after the first changepoint after flight initiation, based on 10-min positioning intervals (dashed line).
For comparison, we also extracted flight initiation using a different statistical method, estimating an Upper Control Limit (UCL), i.e., a defined threshold for the movement speed to distinguish between stationary and non-stationary wolf behavior (Montgomery, 2007; Moen et al., 2012; Ordiz et al., 2019). As opposed to changepoint analyses, UCL calculations rely on control data representing the baseline condition, which in this case was GPS data from stationary wolves. As control, we used 1099 positions from days when wolf collars were programmed for an approach trial, but no trial was carried out, and from wolf GPS data from successful trials during which the wolves did not move. We only used control data for which visual inspection of the GPS positions indicated no movement, and the time difference between positions was between 30 and 90 s. The movement speed from this dataset was assumed to primarily represent GPS error. This gave us a UCL of 23 m/min. We defined the flight initiation as the last position before the movement speed exceeded the UCL for at least two consecutive intervals.
For all trials for which flight initiation was identified, we used 10-min positioning intervals to identify the position where the wolf resettled after the flight. We down-sampled the data to 10-min intervals for the period 12:00 to 17:00 using the data.table package (Dowle and Srinivasan, 2019), and applied changepoint analysis as described for flight initiation. We defined resettling as the first position after the first changepoint after flight initiation, i.e., the start of a stationary period (Figure 3).
We extracted the following variables to describe the wolf flight response (Table 1): We classified the wolf response as either Flight when flight initiation was identified, or No flight when no flight initiation was identified and the wolf remained stationary. Based on the 1-min positioning intervals, we calculated the Minimum wolf-observer distance as the minimum distance between simultaneous wolf and observer positions, Flight initiation distance (FID) as the wolf-observer distance at flight initiation, and Passing-flight time difference as the time difference between flight initiation and the observer passing the passing position. For the first 10 min after flight initiation and at 1-min resolution, we calculated Initial speed as the average speed and Initial straightness as the sum of the step lengths divided by the linear displacement. We calculated Flight duration and Flight displacement as the time and the distance from flight initiation to resettling, respectively. For the total flight (from flight initiation to resettling) and at 10-min resolution, we calculated Total distance travelled as the sum of the step lengths, Overall speed as the average speed, and Overall straightness as the average straightness index across the flight based on the straightness between every three consecutive positions (Table 1).
Table 1. Description, temporal resolution and time period of the extracted variables used to describe the responses of wild wolves when approached by humans.
An instruction manual with R code for identifying flight initiation and resettling using changepoint analysis with MBIC penalty, and for calculating the flight response variables listed in Table 1, is provided in Supplementary Presentation 3.
To quantify the effects of reduced GPS positioning frequency on the calculation of wolf response variables for studies that need to preserve collar battery, we down-sampled the original data from 1-min to 2-, 3-, and 5-min resolution for calculating flight initiation, and from 10- to 20-min resolution for calculating resettling. Down-sampling was done by creating a new data frame with the intended time stamps, and then adding GPS positions from the original data set to the new data frame by using roll = “nearest” from the data.table package (Dowle and Srinivasan, 2019). We then removed double observations resulting from the same position being the nearest to more than one time stamp (in cases of gaps in the data), and we used the original time stamp of the data. This created a time series including gaps, as would be expected in a real-life situation. With these down-sampled datasets, we identified flight initiation and resettling and calculated the flight response variables as described above. To compare the down-sampled data to the original temporal 1- and 10-min resolutions of GPS positions, we used generalized linear mixed models (GLMMs) from the lme4 package (Bates et al., 2015) for each of the flight response variables. For all models, GPS interval was the single fixed-effects variable with the original 1- and 10-min intervals as the reference (intercept), and trial ID as a random effect. To meet the assumption of normally distributed residuals, minimum wolf-observer distance was transformed by , flight initiation distance by , and overall straightness by log(1-x). We considered results from the down-sampled data significantly different when their 95% confidence intervals (CIs) did not overlap with the predicted value for the original data (i.e., the intercept). This coincided with an alpha level of 0.05.
Between September 2018 and September 2021, experimental approach trials were attempted in eleven wolf territories/home ranges in Scandinavia, Germany and Poland, resulting in 25 successful trials in seven different territories/home ranges (Table 2). On eleven occasions, wolf collars were programmed for an approach trial, but the trial was unsuccessful because the wolf did not settle at a day bed, but kept moving throughout the approach period (n = 5), the wolf collars did not send positions in time to start the trial (n = 4), the wolf moved to an area where we did not have an ethical permit at the time (n = 1), we could not reach the start position in time due to inaccessible roads (n = 1). Notably, after increasing the preparation period with 10-min positioning intervals from 2 to 4 h, we did not miss any trials due to not receiving positions in time. In one last case in Germany in 2019, the approach schedule was not picked up by the collar but the approach was conducted anyway. This was the only case in which the observers saw the wolves (seven individuals including the collared wolf), but the wolves moved away from the observers before the direct encounter protocol was initiated. The trial was considered unsuccessful due to the lack of wolf GPS positions. On a few additional occasions, an approach schedule was sent but not picked up by the wolf collar, and therefore no approach trial was attempted.
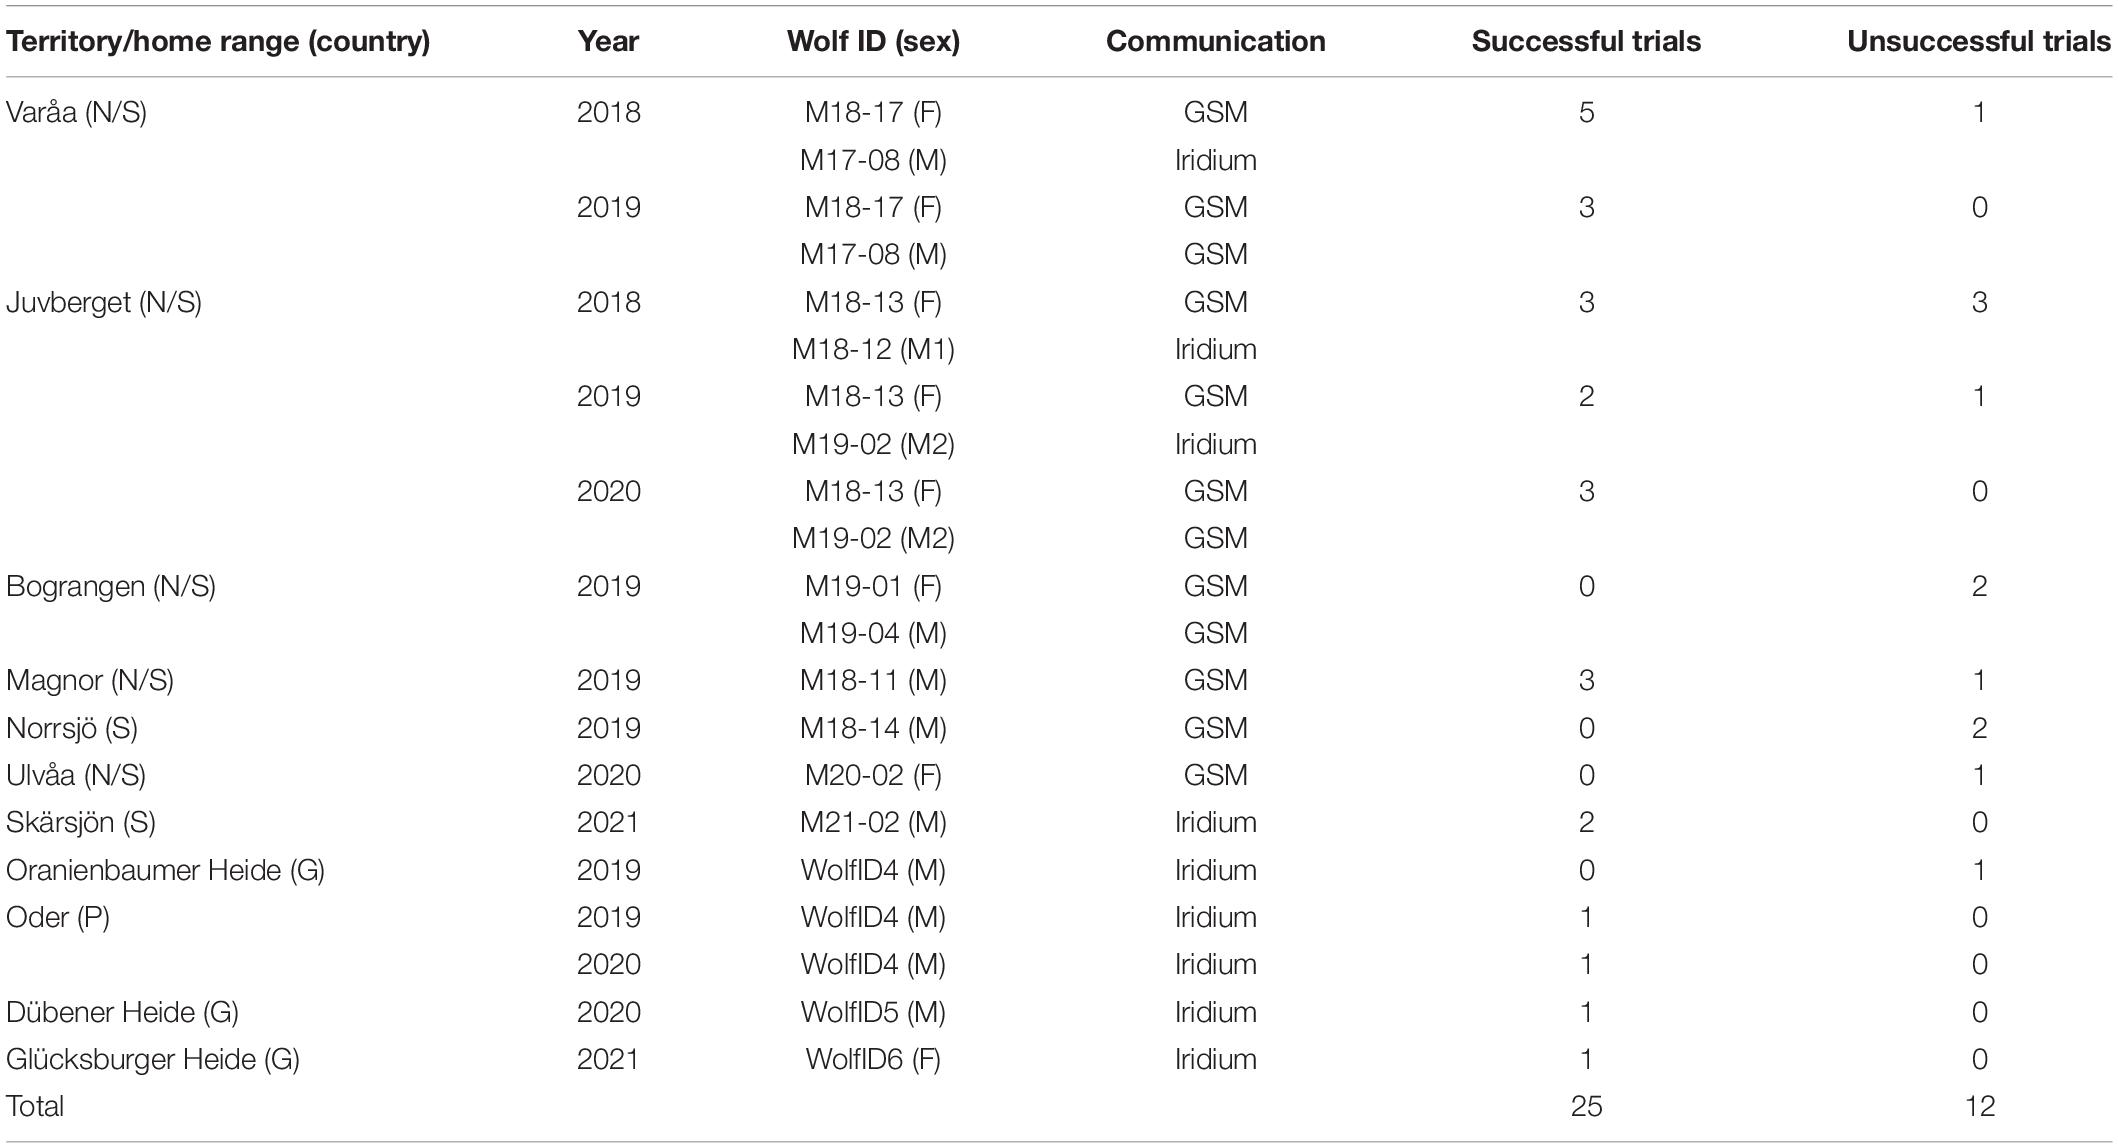
Table 2. Overview of successful and unsuccessful experimental human approach trials on wild wolves in Norway (N), Sweden (S), Poland (P), and Germany (G) during 2018–2021.
When two collared wolves were together during a single approach trial, we used data from the interactions between the observer and each individual wolf, although the behavior of the two wolves would not be independent of each other in such cases. However, the objective at this stage was to test the method rather than to interpret the wolf behavior. This resulted in a total of 35 individual wolf-human interactions (hereafter called interactions) involving nine different wolves, from which we could test the extraction of response variables.
At 1-min intervals, the GPS success rate of the wolf collars was 78% (range = 52–99, Table 3). The gaps encompassed on average 3 ± 1.4 missing positions, whereas the 10-min interval data did not show any gaps.
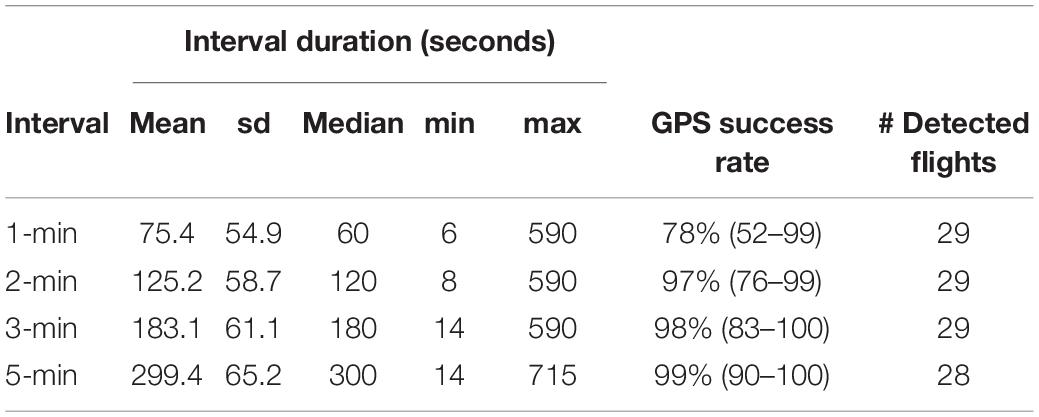
Table 3. Variation in interval duration (seconds), GPS success rate (max–min), and number of flights detected using changepoint analysis with MBIC penalty, for different positioning frequencies down-sampled from original 1-min resolution wolf GPS data from experimental human approach trials.
For 14 interactions, the observer data lacked positions, e.g., if the GPS track log was not programmed correctly. For those cases, we selected the nearest observer position in time relative to the wolf position. Average time difference between wolf and observer positions that were matched using this method was 6 s (range = 0–78 s), and maximum time difference in gaps that encompassed the flight initiation was 41 s.
Visual inspection of the GPS positions indicated that the wolf fled in 29 out of 35 interactions (Supplementary Presentation 4). Changepoint analysis with MBIC penalty detected a flight for 27 interactions and the UCL detected a flight for 29 interactions, all of which matched the flights detected by visual inspection. Neither method detected flights that were not identified by visual inspection. There was no significant difference between flight initiation distances based on changepoint analysis and UCL (Wilcoxon signed-rank test: V = 41, p = 0.9, Figure 4). In two interactions, the changepoint analysis failed to detect a flight that was identified by both visual inspection and UCL analysis. For these interactions, we reran the changepoints analysis using the AIC penalty instead of the MBIC penalty, resulting in changepoints corresponding with the flights detected by visual inspection and UCL (Supplementary Presentation 4, Panel 5).
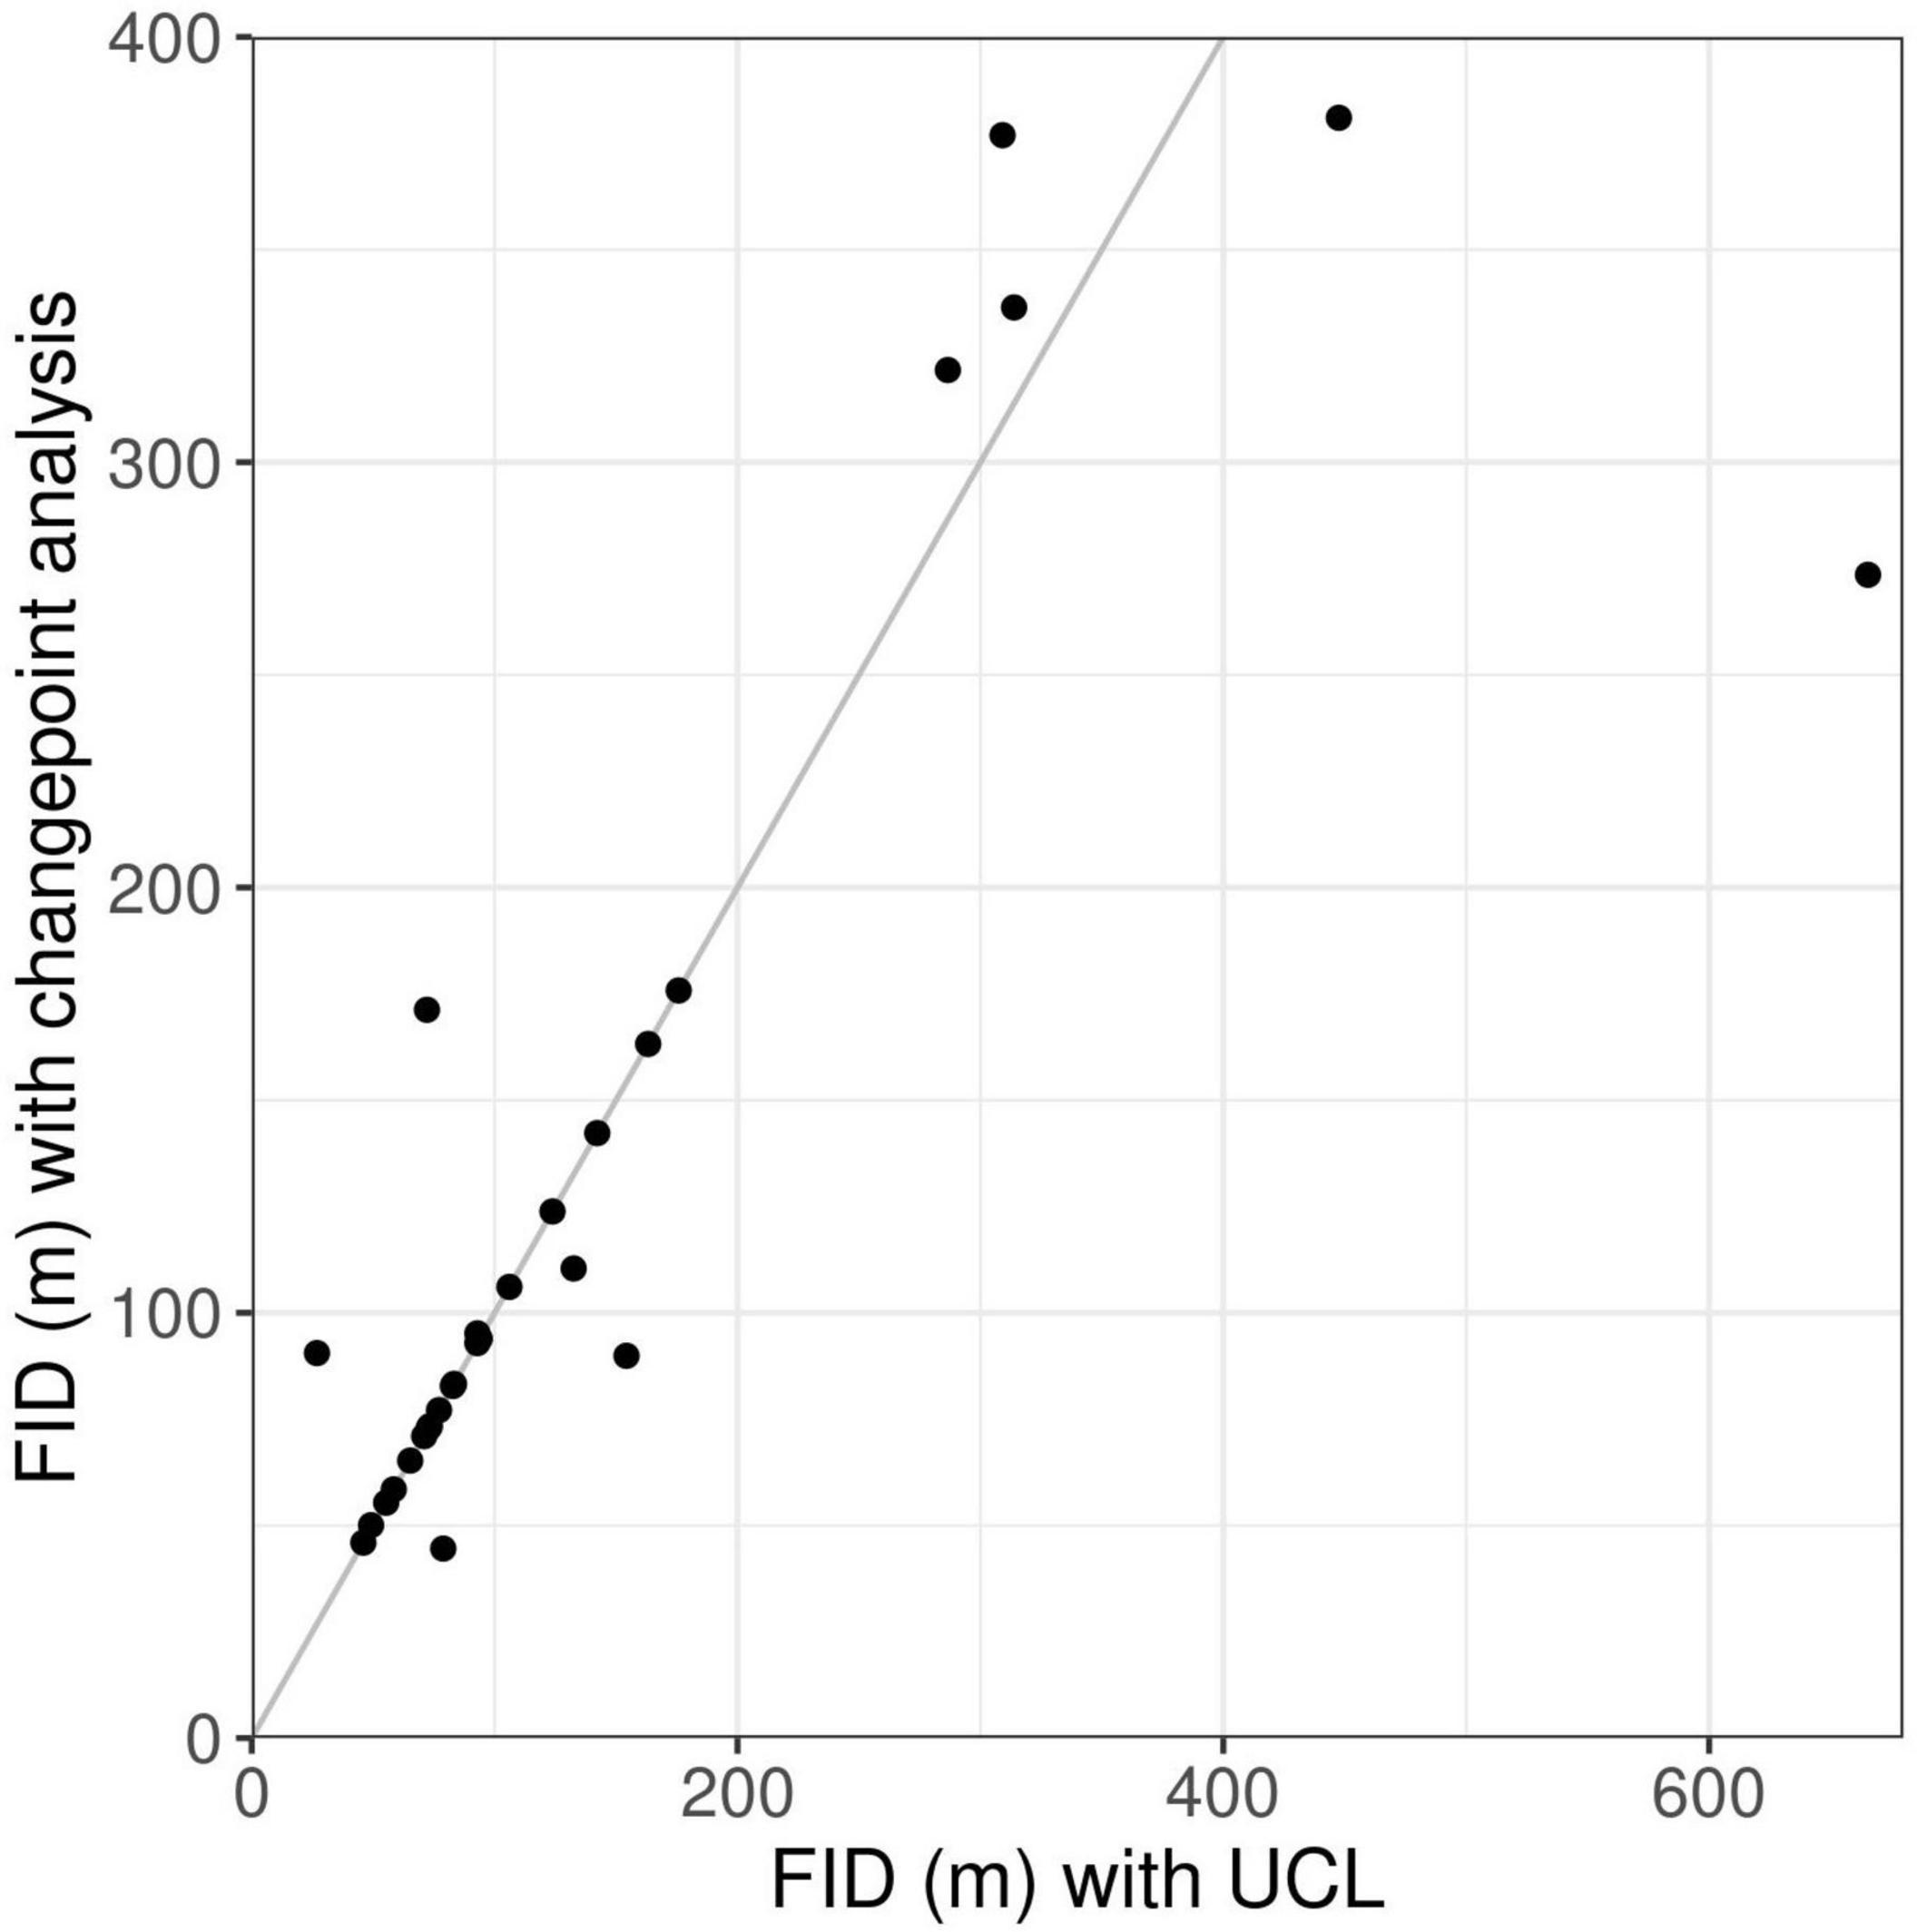
Figure 4. Comparison of values for flight initiation distances (FID) of wolves when approached by humans, obtained using the two alternative methods changepoint analysis and upper control limit (UCL). Each dot represents one wolf-human interaction. Dots on the gray line indicate interactions in which the two methods gave identical FID values.
To assess whether AIC might be generally preferable over MBIC for detecting flight initiation, we reran the changepoint analysis for all interactions using the AIC penalty. This resulted in 31 interactions for which the first changepoint after the start of the trial did not correspond to flight initiation identified using MBIC penalty, UCL or visual inspection. Among the 29 flight initiations detected with the MBIC penalty, 26 were also identified as changepoints when using the AIC penalty. However, AIC found on average 2.8 ± 2.3 additional changepoints per interaction, which did not represent flight initiation detected using the other methods. A full overview of the flight initiations identified for all interactions with all methods can be found in Supplementary Presentation 4.
The time and location of resettling were identified as changepoints for 26 out of the 29 interactions for which we identified a flight. In two interactions, the total flight, as observed visually, lasted for less than 20 min. As the temporal resolution of the GPS positions used to identify resettling was 10 min, a flight of 20 min was too short to be detected with the changepoint analysis. For another interaction, visual inspection as well as changepoint analysis indicated no resettling within the post-disturbance period of 3 h.
Down-sampling the original 1-min interval data to longer GPS intervals (2-, 3- and 5-min intervals) resulted in datasets in which gaps and missing data were replicated (Table 3). We consider this to be representative for data originally sampled at these temporal resolutions. Re-running the changepoint analyses at 2- and 3-min resolution did not reduce the number of detected flights, however, one flight was missed when running the analyses at 5-min resolution (Table 3). The down-sampling did affect the values of the flight variables (Table 4 and Figure 5). Minimum wolf-observer distance and flight initiation distance increased with the longer sampling intervals, and became significantly larger at ≥ 3-min intervals compared to the original 1-min intervals (Table 4 and Figures 5A,B). Passing-flight time difference and initial straightness became significantly different at 5-min intervals (Table 4 and Figures 5C,E), whereas the initial speed decreased significantly with each successively longer interval, as none of the 95% CIs overlapped (Table 4 and Figure 5D).
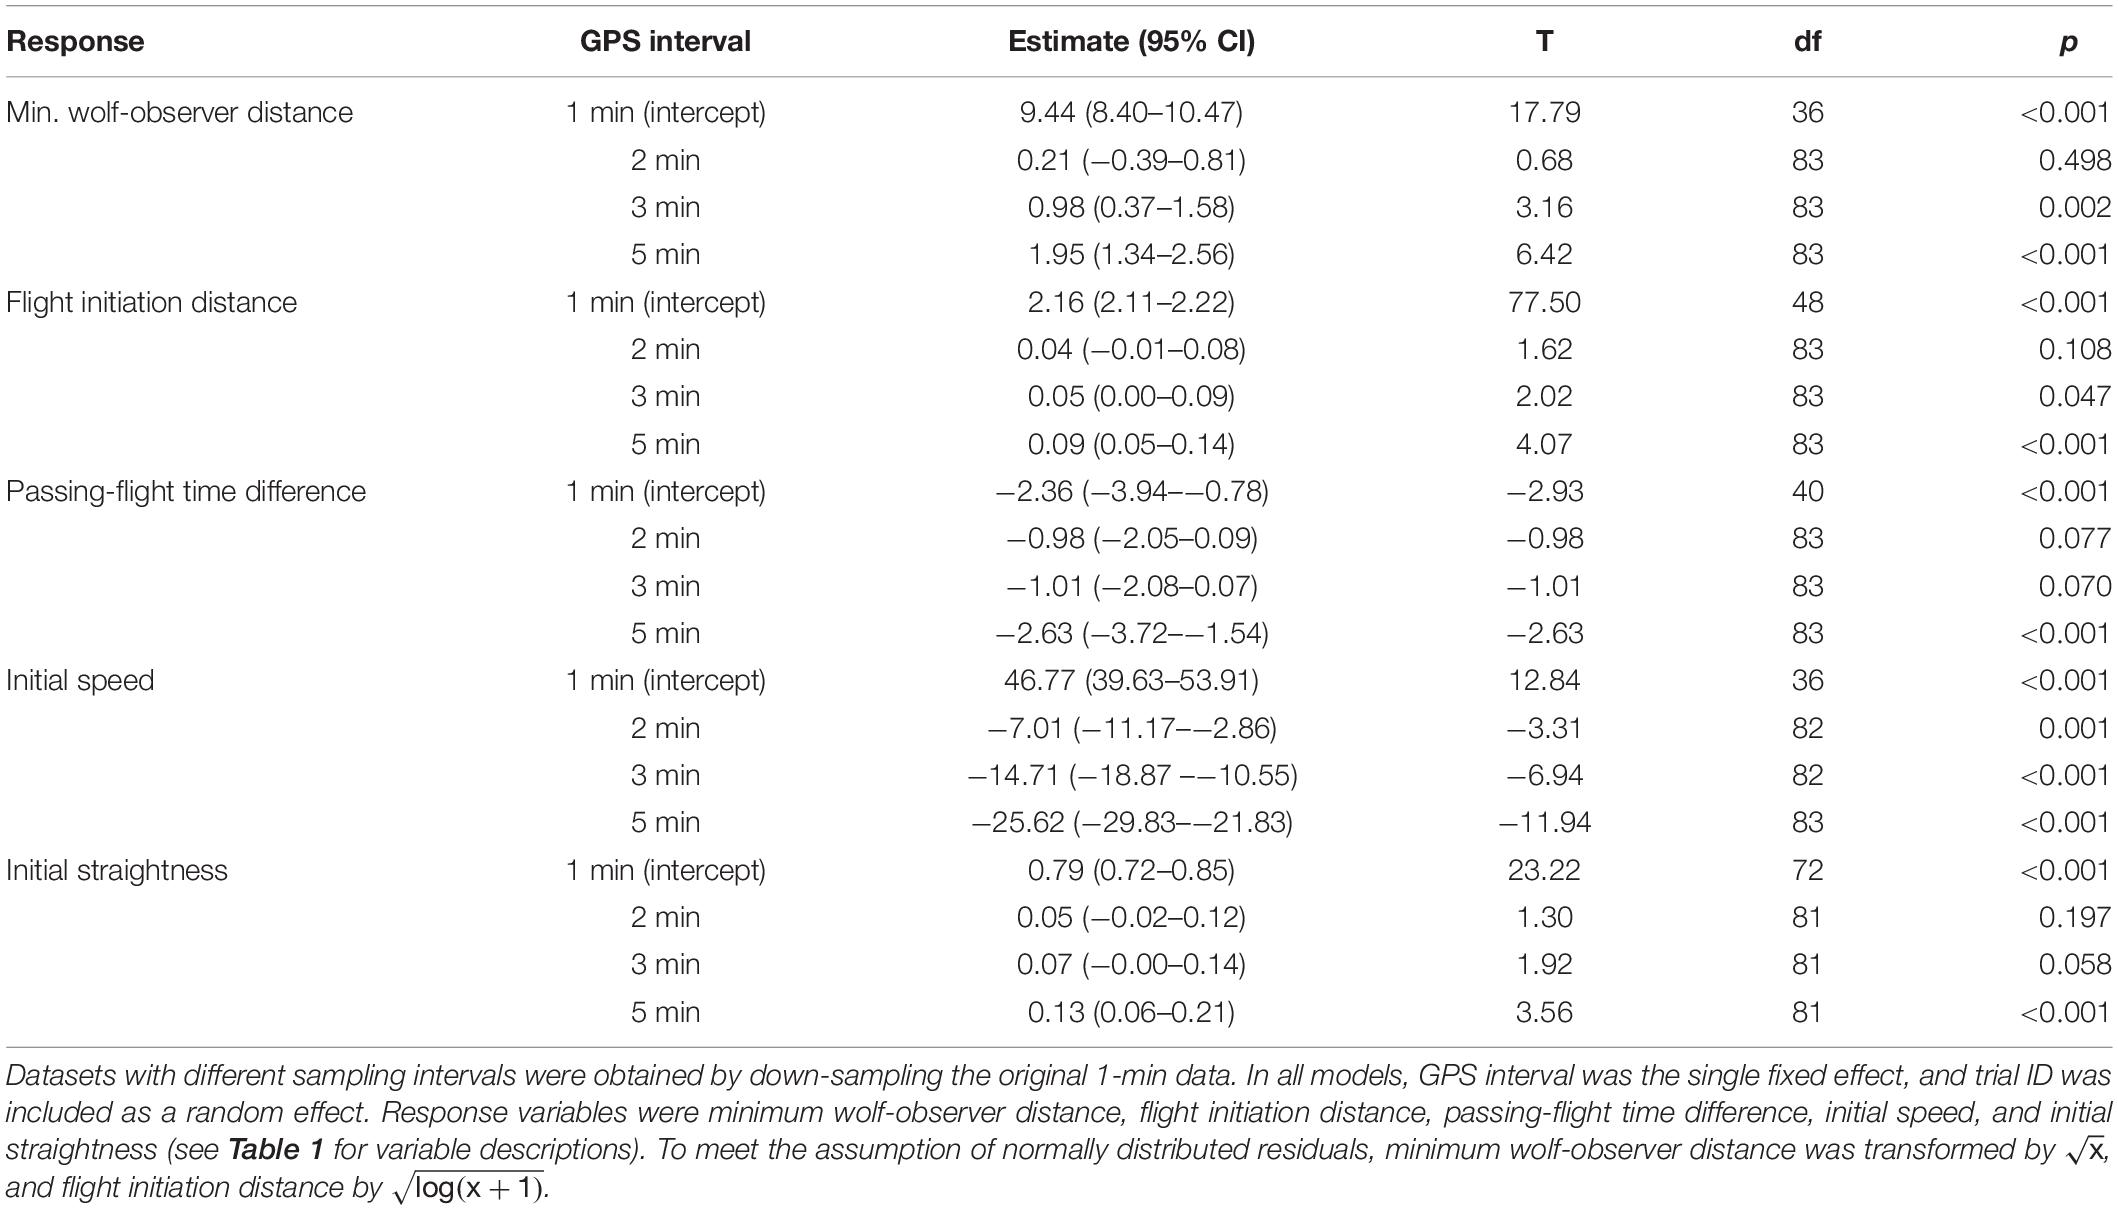
Table 4. Generalized linear mixed models (GLMMs) comparing initial wolf flight responses calculated from GPS data at varying sampling intervals during experimental human approach trials on wild wolves (first 10 min after flight initiation).
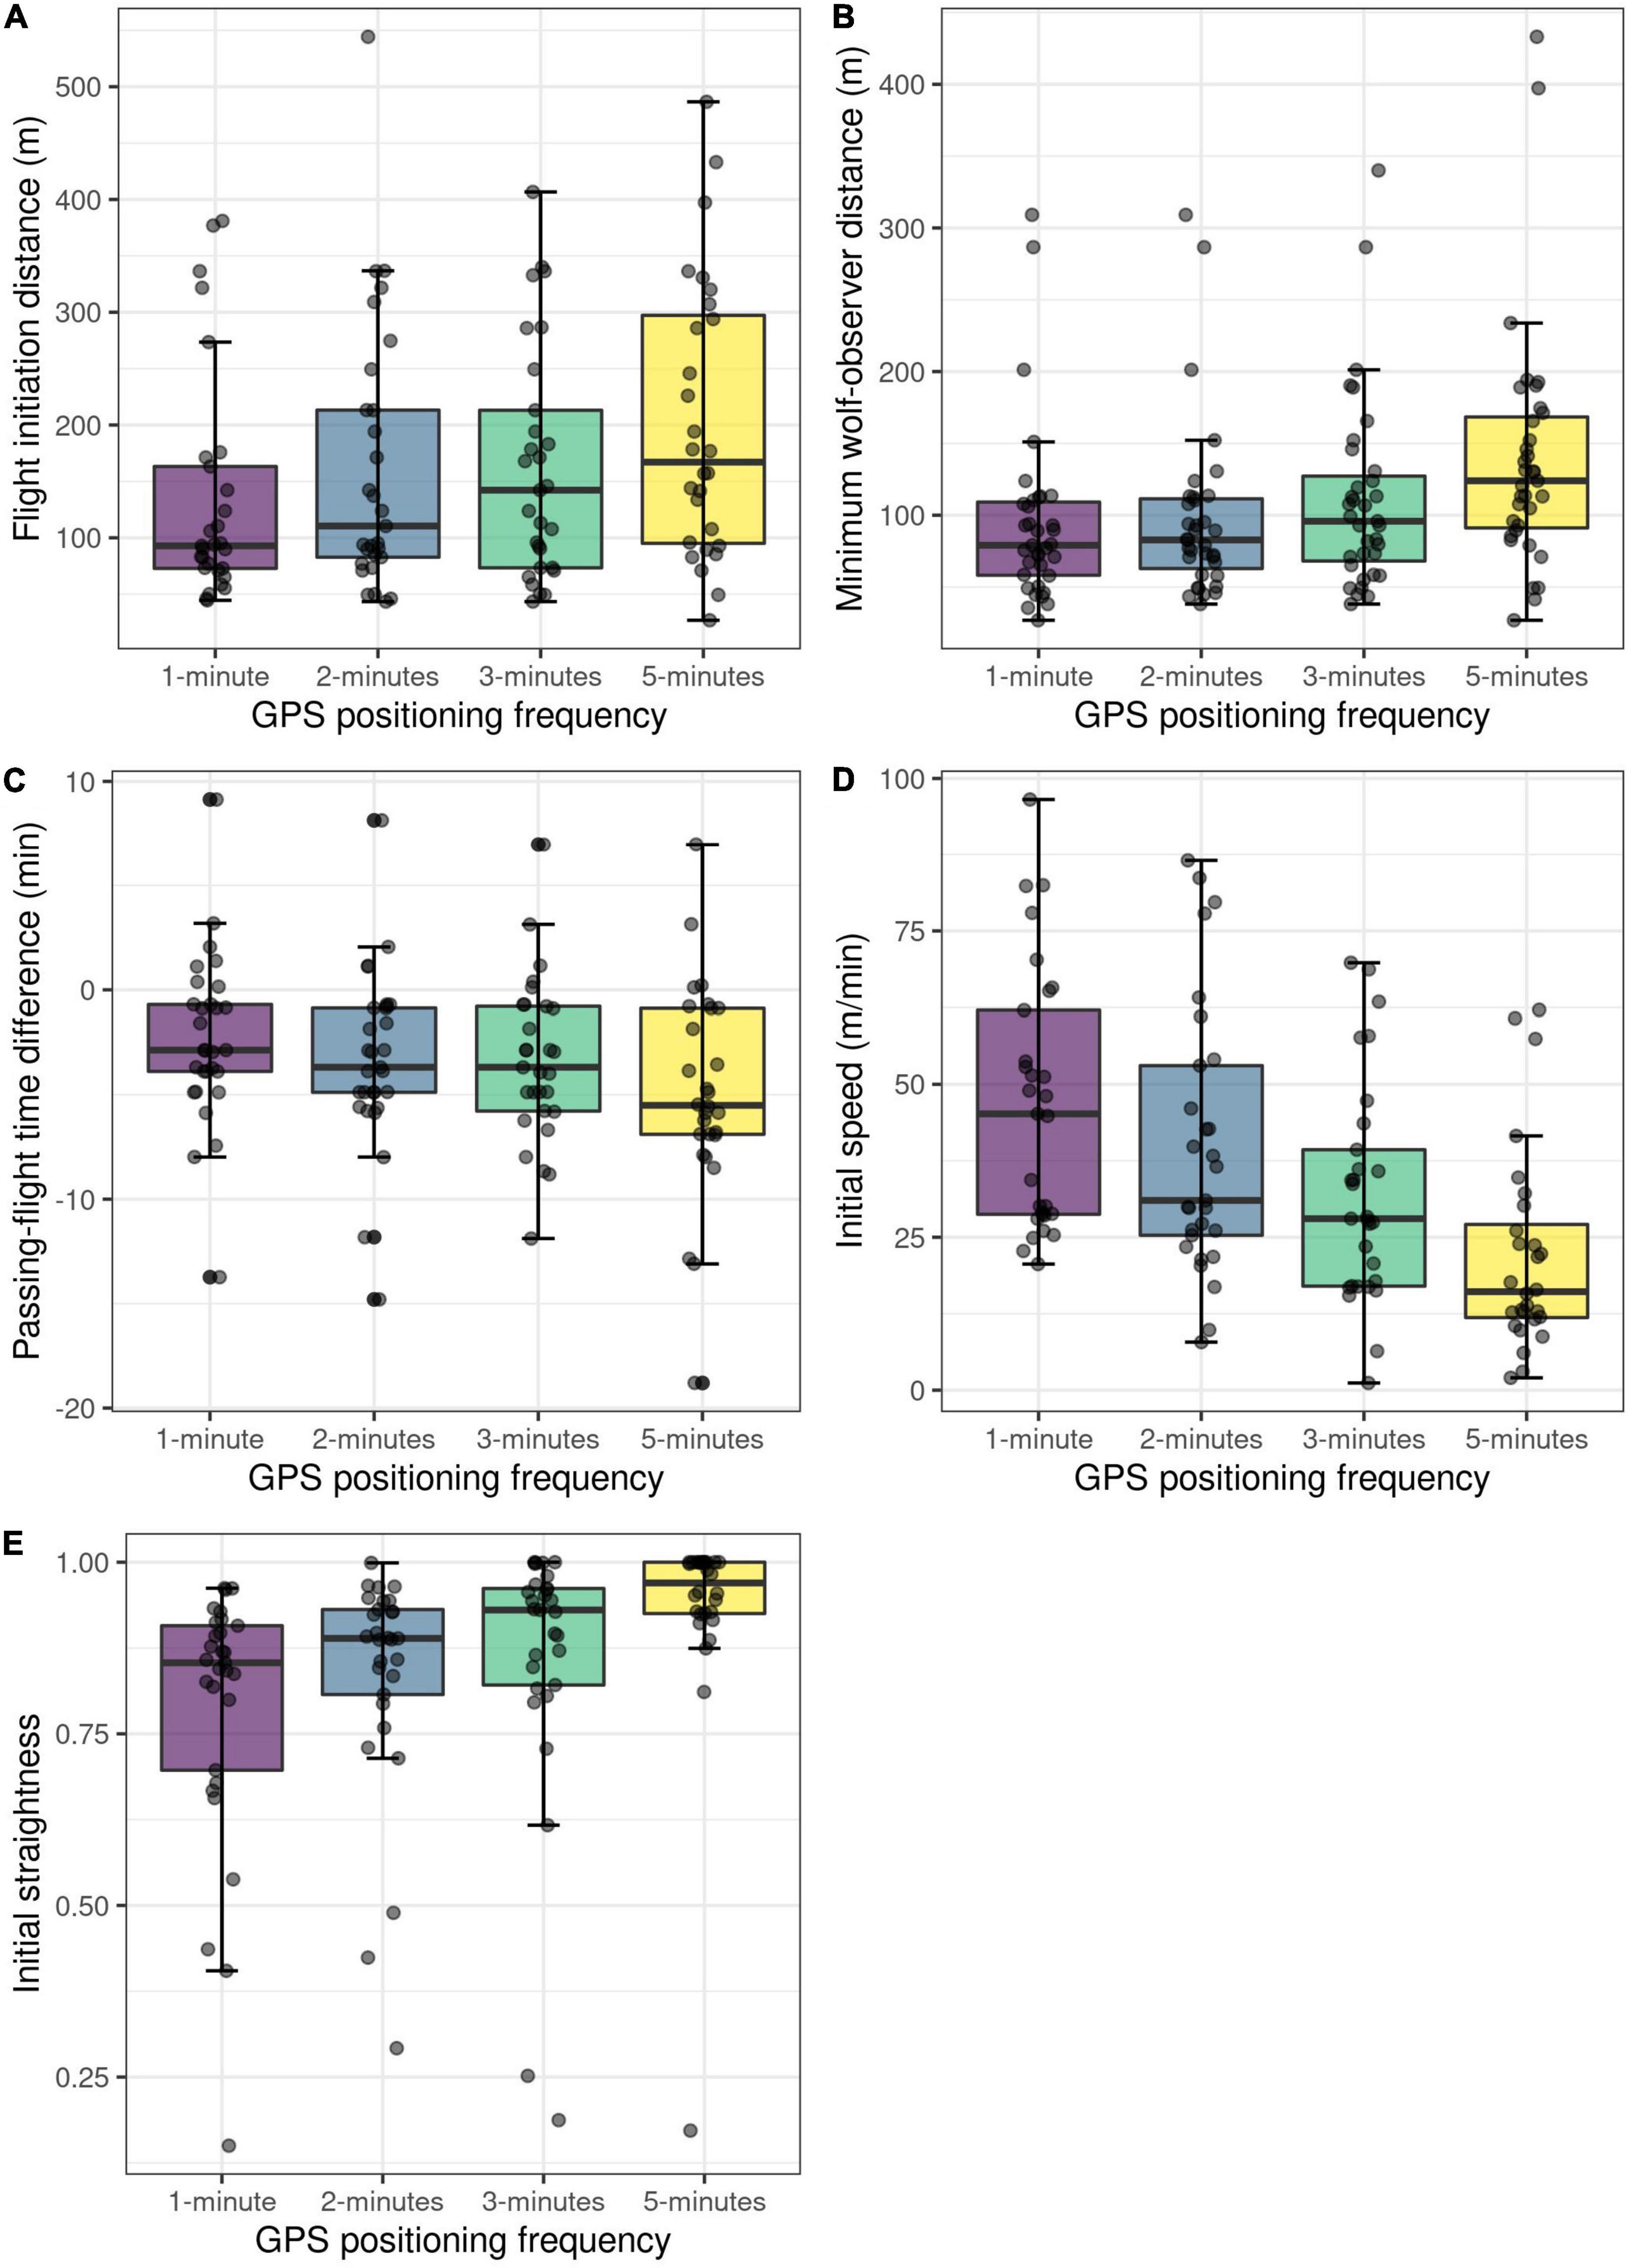
Figure 5. Comparison of five different wolf response variables (A–E) from experimental human approach trials, calculated with varying GPS positioning frequency. Variables were calculated from data from the first 10 min after flight initiation.
Down-sampling the original 10-min GPS data to 20-min intervals did not result in loss of detection of resettling. However, at 20-min intervals, calculated flight duration increased, total distance travelled decreased, and flight displacement decreased (Table 5 and Figures 6A–C). Overall speed did not differ significantly between different temporal resolutions (Table 5 and Figure 6D), but overall paths became straighter (Table 5 and Figure 6E).
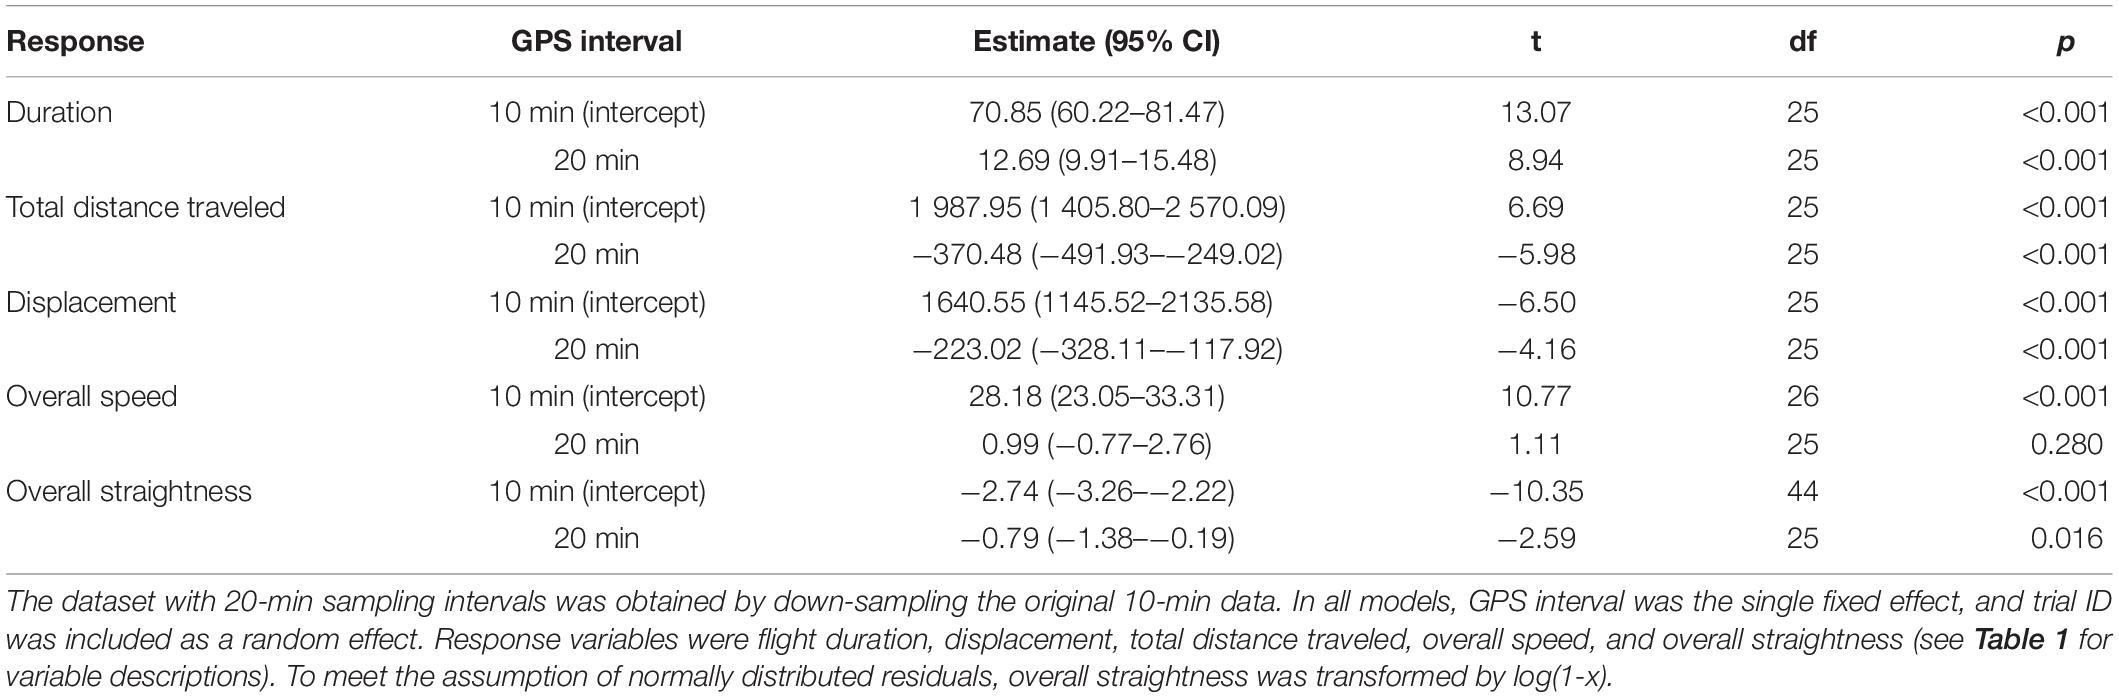
Table 5. Generalized linear mixed models (GLMMs) comparing overall wolf flight responses calculated from GPS data at varying sampling intervals during experimental human approach trials on wild wolves (from flight initiation to resettling).
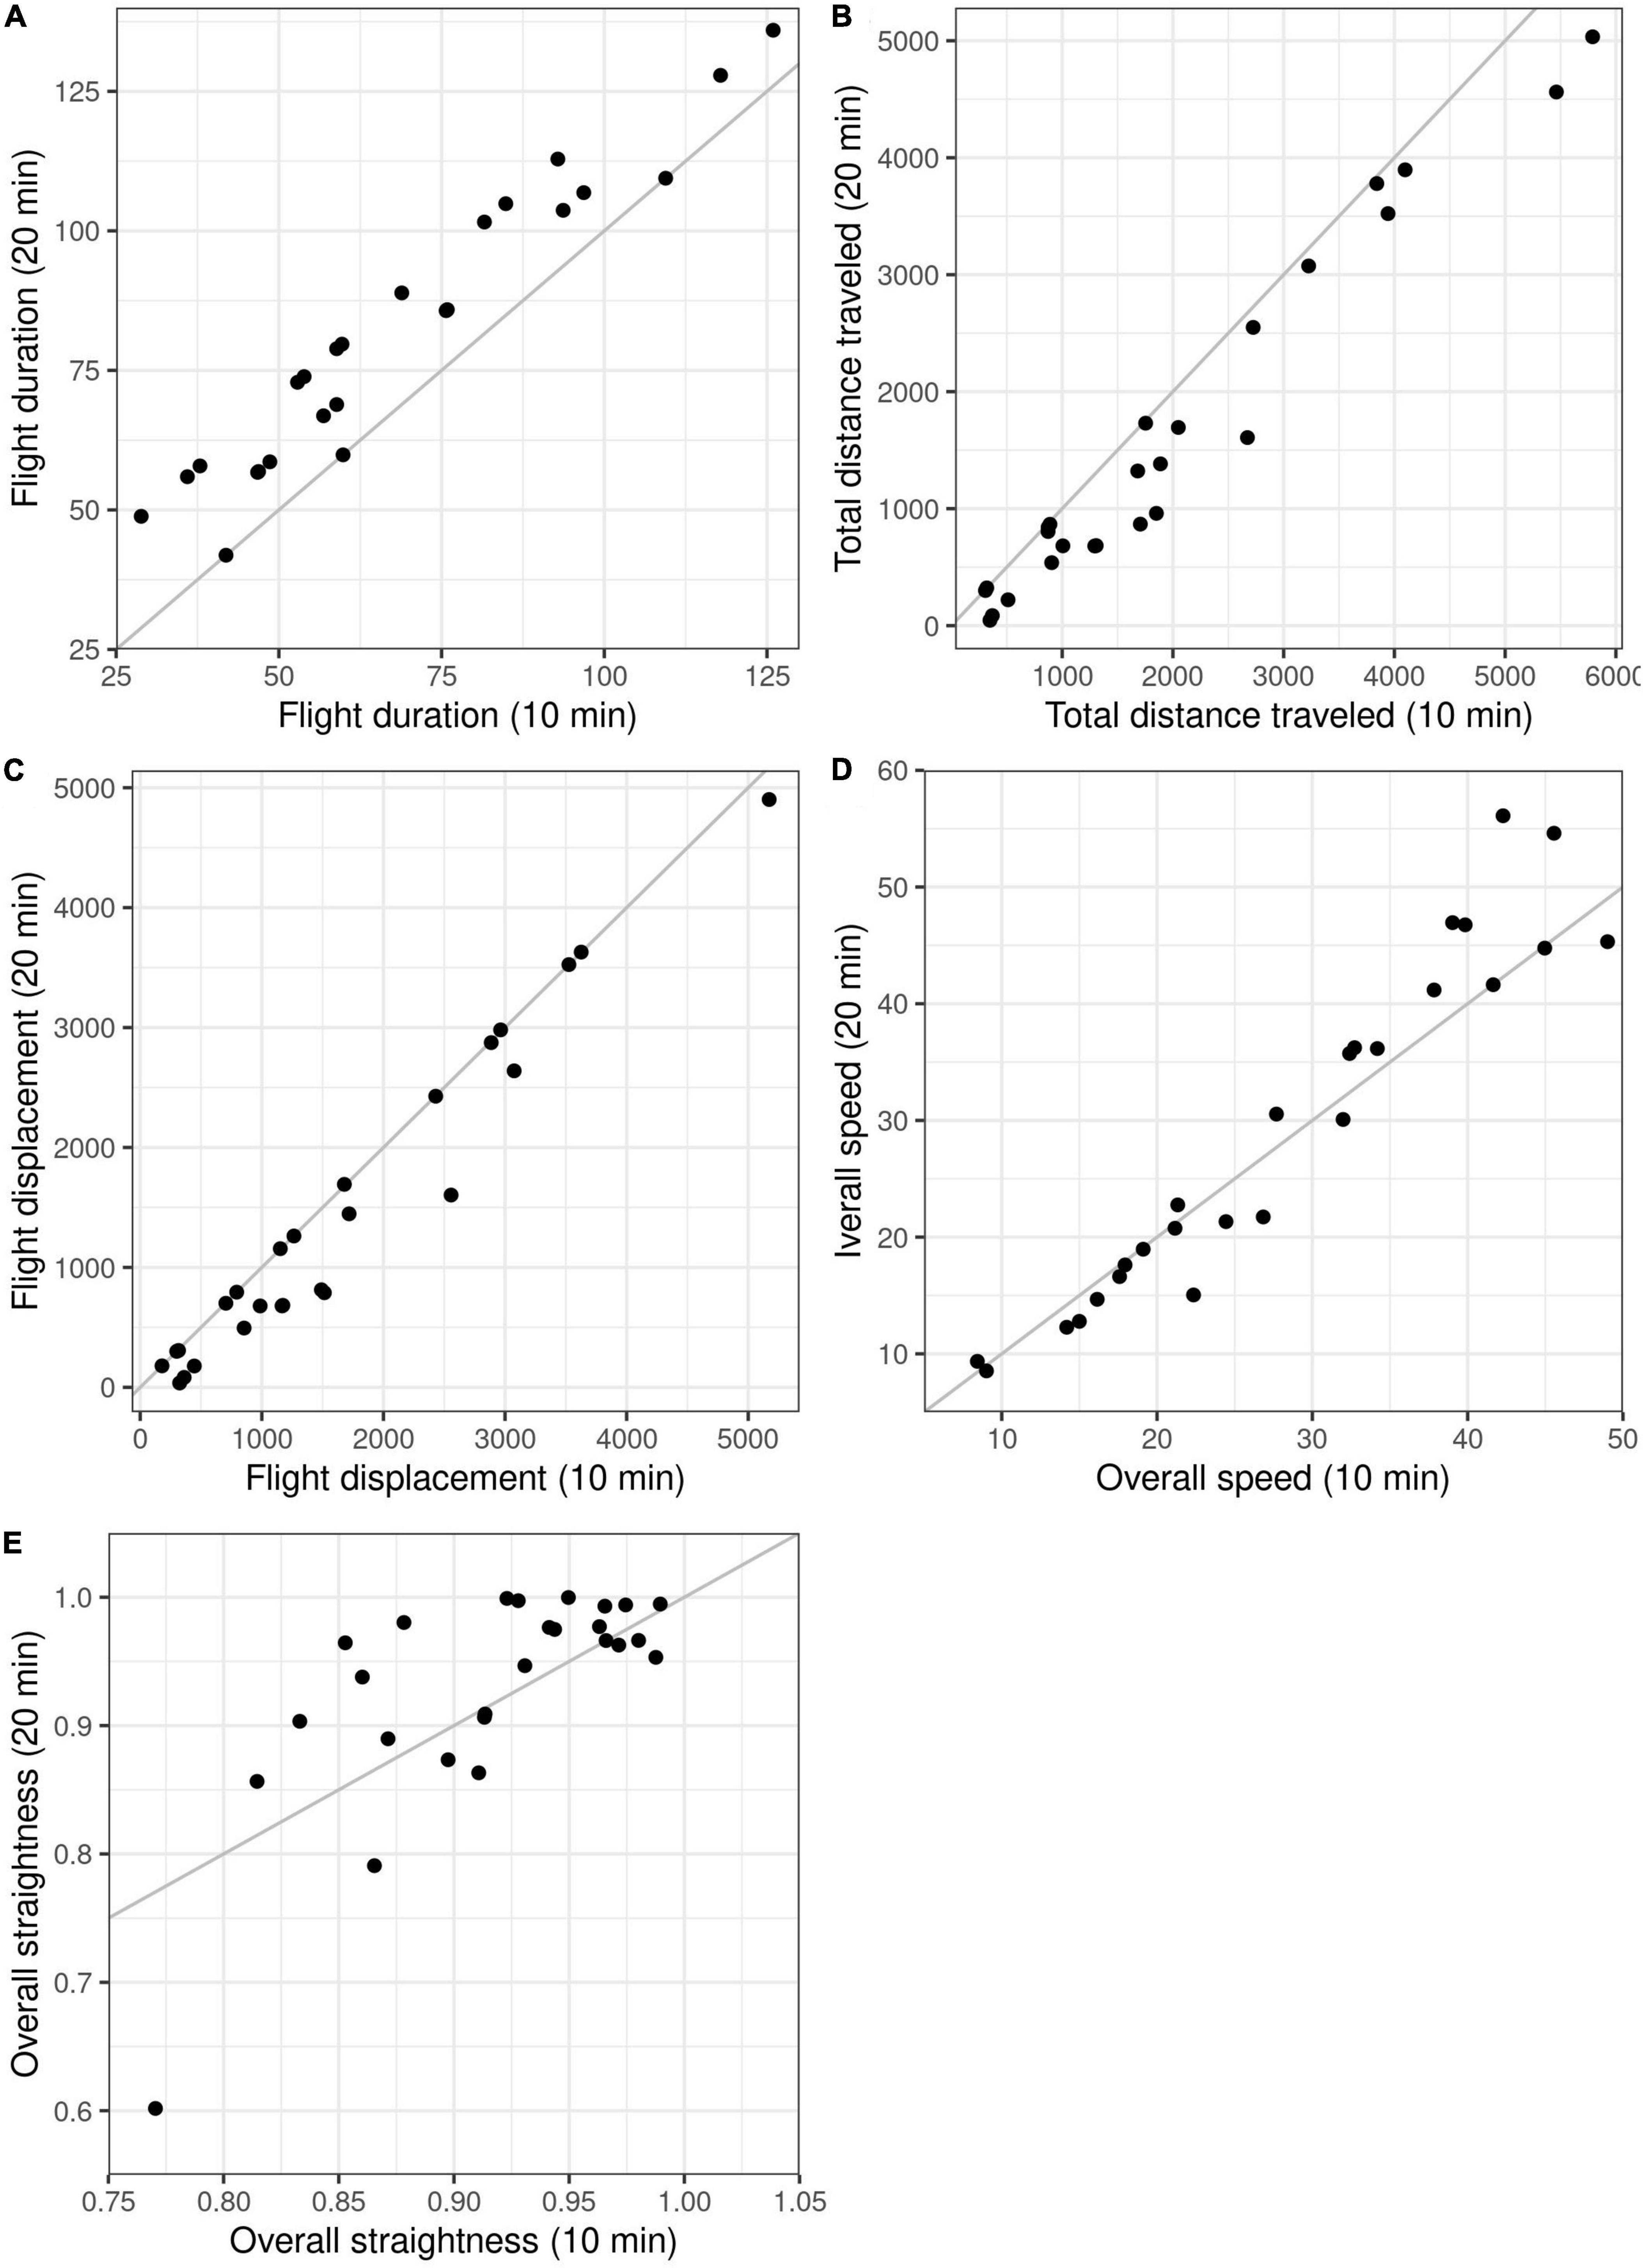
Figure 6. Comparison of five different wolf response variables (A–E) from experimental human approach trials, calculated from GPS data at 10- and 20-min resolution. Variables were calculated for the duration of the flight, i.e., from flight initiation to resettling. Each dot represents one wolf-human interaction. Dots on the gray lines indicate interactions in which the temporal resolutions gave identical values.
We developed and successfully tested a standardized protocol for experimental human approach trials on wild, GPS-collared wolves. The wolves generally avoided the observers, as described in detail by Versluijs et al. (2022). The purpose of the experimental set-up was to create a realistic but standardized representation of human off-trail hikers in wolf habitat, to assess the wolf flight response at high temporal resolution. The protocol can be expanded, e.g., to involve observers that are jogging, skiing, or accompanied by a dog. Similarly, the purpose of the direct encounter criteria and the actions outlined in the direct encounter protocol, was to mimic the likely response of a hiker when meeting a wolf outside of an experimental setting. It provides information about potential wolf responses while leaving the opportunity for the wolf to retreat rather than provoking an aggressive response. In a non-trial situation, hikers may not detect a wolf that is not obviously visible ahead of them (criterion 2). Once seeing a wolf, we believe that most hikers would stop rather than continue walking toward it. In the presumably rare event that criterion 2 is met, but the wolf does not appear to have detected the observer (criterion 3 not met), we propose walking until detected, so that the wolf detects the observer approaching rather than suddenly counting out loud. The stepwise intensification of the actions in the direct encounter protocol provides the wolf the opportunity to assess and react upon increasing levels of human-induced stress, and its response can be scored accordingly. Notably, we were not able to test our direct encounter protocol as none of the trials fulfilled the direct encounter criteria.
Each approach trial is a large investment in terms of time as well as collar battery life. In the following, we discuss factors that can affect the likelihood of successful trials and the quality of the acquired data, weighed against collar battery usage. Our recommendations are summarized in Table 2 of the field protocol (Supplementary Presentation 1).
Consistent with previous studies of wolf circadian activity patterns in Scandinavia (Eriksen et al., 2011) and elsewhere (Merrill and Mech, 2003; Theuerkauf, 2009), most of the wolves approached in this study were mainly stationary in the middle of the day when the approach trials were initiated. Similar timing has been used in studies approaching brown bears, which have a similar circadian rhythm (e.g., Moen et al., 2012). In two wolf territories however, we were unable to conduct any successful trials due to wolves moving throughout the approach period. Prior to the first approach trial on an individual wolf, it is advisable to inspect the GPS data of the specific wolf. If the wolf shows consistently high activity during the day, the trial can be scheduled for the time of day when the wolf tends to be the least active. Any variation in the time of day of the trials will need to be considered when interpreting the results.
Depending on the collar’s mode of communication, poor coverage can result in a lack of updated positions during the preparation period. The duration and positioning frequency of the preparation period, and the data transmission frequency, can be adjusted to suit each project or study area. Increasing any of these will increase the number of times at which the collar tries to send positions and hence the chances of receiving updated positions in time to start the trial, albeit at battery cost. After we increased the preparation period from 2 h in 2018 to 4 h in 2019–2021, we did not miss any trials due to not receiving updated positions in time. Poor coverage can also result in the collar needing multiple attempts before picking up the approach schedule. This should be considered when planning a trial, making sure to send the programming long enough in advance. In areas with poor GSM coverage, other communication options can be considered. In the case of our study, the four trials that failed due to collars not sending positions were all conducted in territories where one wolf had Iridium and one had GSM communication. Hence, neither of these two communication methods is a guarantee against this problem.
The challenge of reaching the start position in time will depend on accessibility, territory size, and wolf activity during the preparation period, i.e., whether the start position needs to be changed due to the wolves moving. In our Scandinavian study area, the high road density ranging from 0.5 to 1.1 km/km2 allowed us to access the start position by car for most of the trials, although access was sometimes restricted by gated or snow-covered roads. Reaching the start position may be a bigger challenge in more remote study areas.
We expected a starting distance of one kilometer to be far enough that the wolves would not immediately respond to our presence, as previous studies have reported average FIDs of 106 m (Karlsson et al., 2007) and 248 m (Wam et al., 2014), and average alert distances of 293 m (Wam et al., 2014). In our trials, flight initiation distance never exceeded 400 m, hence we believe that a 1 km starting distance will be sufficient in most cases. A shorter starting distance can be considered in areas of high human impact, where it is not feasible to find a starting position at 1 km without other sources of disturbance (e.g., roads) between the wolf and the observer. However, given the range in FIDs and alert distances, the starting distance should not be less than 500 m. We used a passing distance of 50 m rather than walking straight toward the wolf to give the wolf an opportunity to either stay or flee. A 50 m passing distance has also been used during human approaches on Scandinavian brown bears (Ordiz et al., 2013). Even when planning a passing distance of 50 m, the real passing distance will vary due to GPS error, wolves moving between the last acquired wolf position and the passing time, and the difficulty of walking in a perfectly straight line in rugged terrain. However, keeping the passing distance as standardized as possible within and between studies is important for comparing the tendency for the wolves to stay or flee, as it is reasonable to assume that wolves are less likely to stay when passing distances are shorter.
The somewhat arbitrary choice of analyzing the first 10 min of the flight at 1-min resolution (“initial flight”) does not reflect an observed change in flight parameters after 10 min of fleeing (Supplementary Figure 1). However, considering the battery cost of the high positioning frequency, we allocated 2 h of 1-min positioning to each approach. This was assumed to be enough to confirm the wolves being stationary, walk the approach route and have a minimum of ten 1-min positions for analysis. The duration of the post-disturbance positioning (10-min intervals) is set to 3 h in this protocol, but most importantly, it should be long enough to include the entire flight period as defined in the instruction manual for data analyses (Supplementary Presentation 3).
In the vast majority of trials with a detected flight, it seemed convincing from visual inspection that the wolf movement was in fact a response to the approaching human. Only one case was unclear, as visual inspection of the GPS positions revealed two movements, the first of which was detected as the flight initiation by the changepoint analysis (Supplementary Presentation 4, Panel 3D). Importantly, in any given trial and regardless of the definition criteria, one can never exclude the possibility that what we interpret as a flight response is just coincidental movement. Nevertheless, without ever being able to unequivocally identify a flight response, we believe that the frequency of incorrectly inferred flights will be low enough to justify general inference about wolf flight response using our protocol.
The collars were programmed to transmit the maximum available batch size of seven positions. During data transmission the GPS is turned off, and in areas of low network coverage, transmission might exceed 1 min resulting in data gaps on high-frequency schedules. This will result in an earlier detected flight initiation if the flight starts during a gap, since the flight initiation will be the last position before the gap. Excluding approach trials with missing data around the time of the suspected flight initiation is a way to avoid a bias in FID (Moen et al., 2012). However, the potential bias should be weighed against the reduction of the sample size if such gaps are frequent. Imputation as an alternative method to account for gaps is inappropriate in this case, as it is usually based on an assumption of constant speed. Furthermore, different imputation techniques can differ in results (Moritz et al., 2015).
To increase collar battery life, it may be desirable to conduct the trials using GPS data at lower temporal resolution. Furthermore, reducing the positioning frequency may allow enough time for data transmission between fixes, thus reducing the number of gaps. In this study, 23% of the positions on a 1-min schedule were missing versus 4% for 2-min schedule. Calculating flight initiation from GPS data at 2- and 3-min resolution did not reduce the number of detected flights compared to the 1-min positioning data. With the exception of initial speed, we did not detect significant differences in the response variables calculated at 2-min resolution. However, at 3-min intervals, the calculated minimum wolf-observer distance, flight initiation distance, as well as initial speed, differed significantly from those calculated from the original 1-min positioning data. At 5-min resolution, all initial flight variables differed significantly from those calculated from the original 1-min data. Notably, with a larger sample size, significant differences may also be found at 2-min intervals, as the same tendency was observed for all variables also at this resolution. Similarly, down-sampling from 10- to 20-min intervals did not result in loss of detection of resettling, but it did result in increased flight duration and overall straightness, and reduced flight displacement and total distance travelled. Reducing the GPS positioning frequency can be considered in future wolf approach trials to increase collar battery life. However, flight parameters cannot be directly compared across datasets collected at different temporal resolution, and consequently, comparative studies will need to down-sample all data sets to match the one with the lowest resolution. Additionally, with a reduced positioning frequency, it may not be feasible to wait for the first batch of positions from the approach period before making the final corrections to the approach route and starting the trial, increasing the risk of unsuccessful trials. All things considered, when possible, we recommend keeping the 1- and 10-min positioning frequency for the approach period and post-disturbance period, respectively. Nevertheless, our results show that the protocol can generate useful data also at lower temporal resolution.
Changepoint analyses require data point segments of a certain length to detect a change in mean and variance. Hence it is important to have enough data before and after the change (Killick et al., 2012). If the flight happens too early or too late within the 2-h timeslot of 1-min positions, there is a chance that none or inaccurate changepoints are found. As a rule, we intended to reach the passing position (PP) minimum 10 min before the end of the approach period to ensure fine-resolution data for the first 10 min of the flight. However, since gaps in the data exist with an average length of 3 ± 1.4 positions per gap, we rather recommend reaching the passing position (PP) at least 15 min before the end of the approach period. Using 15 min as a buffer will likely create a minimum of ten 1-min positions after flight initiation, which is unlikely to create problems with the changepoint analyses.
Changepoint analysis uses a penalty structure to test the likelihood of a change happening. Different penalty methods are available, and in certain cases it is known which penalty gives the most accurate results in changepoint location (Killick et al., 2012; Truong et al., 2020). The AIC penalty is prone to overestimation as it increases the probability of detecting changepoints (Lavielle, 2005). However, in approach trials with a short flight duration, changepoint analyses with MBIC penalty may not be able to detect changepoints. When visual inspection shows a flight that is not detected using MBIC penalty, AIC penalty may be used, as changepoint analyses are done independently for every individual interaction. However, flight initiations identified with this method should always be checked visually.
In most cases, changepoint analysis detected the resettling with 10-min positioning intervals. Exceptions were if the resettling did not take place within the post-disturbance period or when the flight was too short. Both exceptions can be detected by visual inspection of the data. When the flight is short, detecting the resettling with the 1-min positions might be considered.
The obtained UCL of 23 m/min is comparable to the UCL found in brown bears approached by humans (15.1 m/min, Ordiz et al., 2019). With this UCL, flight initiation could be identified for all interactions where a flight was confirmed by visual inspection. However, filtering the control data on intervals between 30 and 90 s was necessary to calculate the UCL. As the UCL was used as a defined threshold between stationary and non-stationary behavior, a high UCL resulted in the inability to identify flight initiation. Therefore, omitting the deviating time intervals resulted in a better estimate for the UCL, as we were interested in the baseline speed that is detected due to GPS measurement error even when wolves are not moving. As described by Montgomery (2007), a process is out-of-control when exceeding the UCL, which in this case means that the wolf exceeds the speed at which it can be considered stationary. In the brown bear approach studies, the UCL was set and checked visually before defining the FID (Moen et al., 2012; Ordiz et al., 2019). Occasionally the UCL was exceeded with only one position, and visual inspection showed no spatial movement when this occurred. Therefore, we added the condition that the UCL is exceeded for more than one position.
Overall, both changepoint analysis and UCL performed similarly well for detecting flight initiation. Hence, as previous studies have shown, both can be used successfully to detect flight initiation (Moen et al., 2012, 2018; Ordiz et al., 2019; Viljanen, 2019). However, both methods have limitations, and neither performed flawlessly in our study. It might be necessary to calculate the UCL separately for different areas as GPS measurement error can vary between collar type, location and environmental factors. Additionally, UCL calculations rely on control data. Using control data from when the wolves were not moving, based on visual inspection, can result in interpretation errors. In this study, UCL detected all flights which were also confirmed by visual inspection. However, Moen et al. (2012, 2018) reported cases in which visual inspection indicated a flight, but speed did not exceed the UCL. Changepoint analysis does not require control data, and it requires less data preparation, as it can handle various data distributions. However, limitations such as the bias toward the start and the end of the time series, and the probability that a short flight might not result in a changepoint, should be considered. Furthermore, changepoint analyses can be done in various ways, with a broad palette of possible requirements. This makes it customizable to many types of data (Killick et al., 2012, 2016; Truong et al., 2020). However, there is a risk of adjusting changepoint analyses to a desired result. (Le Corre et al., 2014; Edelhoff et al., 2016; Gurarie et al., 2016; Barry et al., 2020). We used visual inspection of the GPS data to confirm the flight initiations detected using automated methods, which we recommend doing given that future studies of this kind will have a limited sample size.
We suggest using changepoint analysis in combination with visual inspection for studying the flight response of wolves during experimental human approaches, as it increases reproducibility and comparability for this type of studies, does not need control data, and can be used in a variety of situations. This is consistent with the objective of the protocol, which is to provide a standardized method which increases reproducibility and is applicable across different study areas.
Although we found that speed alone is a simple and suitable variable for flight detection, other, more spatially explicit tools (such as First Passage Time) have been explored for identifying changes in animal movement patterns (McKenzie et al., 2009; Le Corre et al., 2014; Edelhoff et al., 2016; Gurarie et al., 2016; Barry et al., 2020), and could also be considered.
The standardized protocol developed in this study (Supplementary Presentations 1–3) will facilitate studies of wolf behavioral responses to direct interactions with humans, applicable at a local, national, and international level. From a scientific perspective, data compiled in a standardized way from multiple study areas can be used to quantify the variation in wolf responses to humans within and between populations, and in relation to predictors such as social or reproductive status of the wolves, landscape factors, human population density, and proxies of anthropogenic impact. Once standardized data with a sufficient range in the above-mentioned predictors have been collected, the variation in wolf responses can be used to quantify the degree to which results can be generalized for comparable areas and circumstances. This is of particular importance, as a likely limitation for the extensive application of this protocol is the cost associated with equipping wolves with programmable GPS collars. Hence, from a management perspective, results might be used to establish a baseline distribution of wolf response patterns given a number of known predictors. This information can contribute to the knowledge base for management authorities also in areas where GPS studies are not feasible, e.g., for predicting the range of likely wolf behaviors, assessing the likelihood of wolf-human encounters, and complementing existing tools for evaluating reports of wolves that are perceived as bold (Karlsson et al., 2006; LCIE, 2019; Reinhardt et al., 2020). From a dissemination perspective, showing how wolves in general, as well as in specific cases, respond to human encounters, should help demystify the behavior of wild wolves toward humans in their shared habitat. In fact, to date, neither brown bears nor wolves have shown any aggressive reaction to standardized approach trials in Scandinavia (Karlsson et al., 2007; Wam et al., 2012, 2014; Ordiz et al., 2019; Versluijs et al., 2022), which is by itself an important message for managers and the general public. Fine-scale GPS data from experimental approach trials gives ample opportunities for displaying the results graphically, e.g., in videos or animations. However, finding effective ways of disseminating such information to the general public is a challenge, as the scientific literature reports mixed results from efforts to use dissemination to reduce fear of carnivores (Johansson et al., 2016a). Some studies propose animal or habitat exposure to increase predictability of animal behavior (Johansson et al., 2016a), and in Scandinavia, bringing people along for guided brown bear approach trials resulted in reduced self-reported feelings of fear among the participants (Johansson et al., 2016b). However, Johansson et al. (2016a) points out that any intervention aimed at reducing fear toward large carnivores should be accompanied by thorough evaluations of the effects of the intervention, preferably as part of an adaptive management scheme. From a conservation perspective, human approach trials generate important information on the behavioral reactions of large carnivores inhabiting human-dominated landscapes, such as the time it takes to resume their regular circadian activity patterns after being disturbed. Altering the time budgets from more profitable activities (foraging, resting) to increased vigilance after disturbance may have fitness costs (Ordiz et al., 2013). Therefore, quantifying how human activities can affect carnivore behavior, and the potential implications for energy budgets (e.g., Bryce et al., 2022), can elucidate the role of wilderness areas for large carnivore conservation (Gilroy et al., 2015).
The raw data supporting the conclusions of this article will be made available by the authors, without undue reservation.
The animal study was reviewed and approved by the Norwegian Food Safety Authority (FOTS ID 15370) and the Animal Welfare Ethics Committee of Uppsala, Sweden (ref. 5.8.18-13246/2019).
PW, BZ, PS, AE, and LG conceived the study. AE, LG, PS, PW, BF, BZ, AO, DC-S, FM, BG, and SR secured the funding. AE, EV, PS, BF, BZ, PW, AO, KN, DC-S, CW, HS, FM, and BG developed the field protocol. EV, BF, AE, FM, BG, KN, BZ, and PW conducted the field trials. EV, AO, and KN developed the analytical methods. EV conducted the analyses. AE and EV drafted the manuscript. All authors contributed to the ideas and edits to the manuscript and approved the submitted version.
This study was funded by Innlandet Regional Research Fund and the County Governors of Hedmark, Innlandet, and Oslo og Viken.
The authors declare that the research was conducted in the absence of any commercial or financial relationships that could be construed as a potential conflict of interest.
All claims expressed in this article are solely those of the authors and do not necessarily represent those of their affiliated organizations, or those of the publisher, the editors and the reviewers. Any product that may be evaluated in this article, or claim that may be made by its manufacturer, is not guaranteed or endorsed by the publisher.
We would like to thank Henrike Hensel for collar programming, and to Morten Heim and Henrike Hensel for technical assistance and troubleshooting for GPS data access. We would also like to thank Theresa Kirchner, Erling Maartmann, Giorgia Ausilio, Juuli Vänni, Irene Garcia Noa, Malena Diaz Gómez, Emma Den Hartog, Rick Heeres, Roberto Lo Monaco, Ilka Reinhard, and Doris Friedrich for conducting or participating in field trials. The illustration of the approach trial (Figure 1) was made by Juliana Spahr.
The Supplementary Material for this article can be found online at: https://www.frontiersin.org/articles/10.3389/fevo.2022.793307/full#supplementary-material
Andersen, M., and Aars, J. (2008). Short-term behavioural response of polar bears (Ursus maritimus) to snowmobile disturbance. Polar Biol. 31, 501–507. doi: 10.1007/s00300-007-0376-x
Ansorge, H., Kluth, G., and Hahne, S. (2006). Feeding ecology of wolves Canis lupus returning to Germany. Acta Theriol. 51, 99–106. doi: 10.1007/bf03192661
Arnemo, J. M., and Evans, A. (2017). Biomedical protocols for free-ranging brown bears, wolves, wolverines and lynx. Elverum: Hedmark University College.
Barry, T., Gurarie, E., Cheraghi, F., Kojola, I., and Fagan, W. F. (2020). Does dispersal make the heart grow bolder? Avoidance of anthropogenic habitat elements across wolf life history. Anim. Behav. 166, 219–231. doi: 10.1016/j.anbehav.2020.06.015
Basille, M., Herfindal, I., Santin-Janin, H., Linnell, J. D., Odden, J., Andersen, R., et al. (2009). What shapes Eurasian lynx distribution in human dominated landscapes: selecting prey or avoiding people? Ecography 32, 683–691. doi: 10.1111/j.1600-0587.2009.05712.x
Bateman, P. W., and Fleming, P. A. (2012). Big city life: carnivores in urban environments. J. Zool. 287, 1–23. doi: 10.1111/j.1469-7998.2011.00887.x
Bates, D., Machler, M., Bolker, B. M., and Walker, S. C. (2015). Fitting Linear Mixed-Effects Models Using lme4. J. Stat. Softw. 67, 1–48.
Bath, A. (2000). Human dimensions in wolf management in Savoie and Des Alpes Maritimes, France. Large Carnivore Initiative for Europe. St. John’s, NL: Memorial University of Newfoundland.
Bath, A., and Majic, A. (2001). “Human dimensions in wolf management in Croatia,” in Report for the Large Carnivore Initiative for Europe, (LCIE). doi: 10.1080/10871209.2021.1967526
Bivand, R. S., Pebesma, E., and Gomez-Rubio, V. (2013). Applied spatial data analysis with R. New York, NY: Springer.
Blanco, J., and Cortés, Y. (2007). Dispersal patterns, social structure and mortality of wolves living in agricultural habitats in Spain. J. Zool. 273, 114–124. doi: 10.1111/j.1469-7998.2007.00305.x
Boitani, L. (2018). Canis lupus (errata version published in 2019). The IUCN Red List of Threatened Species 2018. e:e.T3746A144226239. Available online at: https://www.iucnredlist.org/species/3746/144226239#errata (accessed September 15, 2021).
Bryce, C. M., Dunford, C. E., Pagano, A. M., Wang, Y., Borg, B. L., Arthur, S. M., et al. (2022). Environmental correlates of activity and energetics in a wide-ranging social carnivore. Anim. Biotelem. 10, 1–16.
Carricondo-Sanchez, D., Zimmermann, B., Wabakken, P., Eriksen, A., Milleret, C., Ordiz, A., et al. (2020). Wolves at the door? Factors influencing the individual behavior of wolves in relation to anthropogenic features. Biolog. Conserv. 244:108514. doi: 10.1016/j.biocon.2020.108514
Chapron, G., Kaczensky, P., Linnell, J. D. C., von Arx, M., Huber, D., Andren, H., et al. (2014). Recovery of large carnivores in Europe’s modern human-dominated landscapes. Science 346, 1517–1519. doi: 10.1126/science.1257553
Colman, J. E., Lilleeng, M. S., Tsegaye, D., Vigeland, M. D., and Reimers, E. (2012). Responses of wild reindeer (Rangifer tarandus tarandus) when provoked by a snow-kiter or skier: a model approach. Appl. Anim. Behav. Sci. 142, 82–89. doi: 10.1016/j.applanim.2012.08.009
Dowle, M., and Srinivasan, A. (2019). data.table: Extension of ’data.frame. Available online at: https://cran.r-project.org/package=data.table (accessed date 2021-September-27).
Edelhoff, H., Signer, J., and Balkenhol, N. (2016). Path segmentation for beginners: an overview of current methods for detecting changes in animal movement patterns. Mov. Ecol. 4, 1–21. doi: 10.1186/s40462-016-0086-5
Eriksen, A., Wabakken, P., Zimmermann, B., Andreassen, H. P., Arnemo, J. M., Gundersen, H., et al. (2011). Activity patterns of predator and prey: a simultaneous study of GPS-collared wolves and moose. Anim. Behav. 81, 423–431. doi: 10.1016/j.anbehav.2010.11.011
Gilroy, J. J., Ordiz, A., and Bischof, R. (2015). Carnivore coexistence: value the wilderness. Science 347:382. doi: 10.1126/science.347.6220.382-a
Græsli, A. R., Le Grand, L., Thiel, A., Fuchs, B., Devineau, O., Stenbacka, F., et al. (2020). Physiological and behavioural responses of moose to hunting with dogs. Conserv. Physiol. 8:coaa122. doi: 10.1093/conphys/coaa122
Grolemund, G., and Wickham, H. (2011). Dates and times made easy with lubridate. J. Stat. Softw. 40, 1–25.
Gurarie, E., Bracis, C., Delgado, M., Meckley, T. D., Kojola, I., and Wagner, C. M. (2016). What is the animal doing? Tools for exploring behavioural structure in animal movements. J. Anim. Ecol. 85, 69–84. doi: 10.1111/1365-2656.12379
Gurarie, E., Suutarinen, J., Kojola, I., and Ovaskainen, O. (2011). Summer movements, predation and habitat use of wolves in human modified boreal forests. Oecologia 165, 891–903. doi: 10.1007/s00442-010-1883-y
Johansson, M., Ferreira, I. A., Støen, O.-G., Frank, J., and Flykt, A. (2016a). Targeting human fear of large carnivores—Many ideas but few known effects. Biolog. Conserv. 201, 261–269. doi: 10.1016/S0140-6736(16)00619-X
Johansson, M., Støen, O.-G., and Flykt, A. (2016b). Exposure as an intervention to address human fear of bears. Hum. Dimen. Wildlife 21, 311–327. doi: 10.1080/10871209.2016.1152419
Johansson, M., Karlsson, J., Pedersen, E., and Flykt, A. (2012). Factors governing human fear of brown bear and wolf. Hum. Dimen. Wildlife 17, 58–74. doi: 10.1080/10871209.2012.619001
Karlsson, J., Eriksson, M., and Liberg, O. (2007). At what distance do wolves move away from an approaching human? Can. J. Zool. 85, 1193–1197. doi: 10.1139/z07-099
Karlsson, J., Svensson, L., Jaxgård, P., Levin, M., Angsteg, I., and Johansson, O. (2006). Rovdjur, tamdjur, hundar och människor. PM til rovdjursutredningen 2006. Riddarhyttan: Swedish University of Agricultural Sciences.
Killick, R., Fearnhead, P., and Eckley, I. A. (2012). Optimal detection of changepoints with a linear computational cost. J. Am. Stat. Assoc. 107, 1590–1598. doi: 10.1007/s11222-016-9687-5
Killick, R., Haynes, K., and Eckley, I. A. (2016). changepoint: An R package for changepoint analysis. Available online at: https://CRAN.R-project.org/package=changepoint (accessed date 2022-March-14).
Koolhaas, J., Korte, S., De Boer, S., Van Der Vegt, B., Van Reenen, C., Hopster, H., et al. (1999). Coping styles in animals: current status in behavior and stress-physiology. Neurosci. Biobehav. Rev. 23, 925–935. doi: 10.1016/s0149-7634(99)00026-3
Lavielle, M. (2005). Using penalized contrasts for the change-point problem. Sign. Proc. 85, 1501–1510. doi: 10.1002/bimj.201700196
LCIE (2019). Management of bold wolves. Policy support statements of the large carnivore initiative for Europe (LCIE). Available: https://ec.europa.eu/environment/nature/conservation/species/carnivores/pdf/190513_4_LCIE_boldwolves.pdf (accessed 29-July-2021).
Le Corre, M., Dussault, C., and Côté, S. D. (2014). Detecting changes in the annual movements of terrestrial migratory species: using the first-passage time to document the spring migration of caribou. Mov. Ecol. 2, 1–11. doi: 10.1186/s40462-014-0019-0
Linnell, J. D., and Alleau, J. (2016). Predators that kill humans: myth, reality, context and the politics of wolf attacks on people. Problem. Wildlife 2016, 357–371. doi: 10.1007/978-3-319-22246-2_17
Linnell, J. D., Kovtun, E., and Rouart, I. (2021). Wolf attacks on humans: an update for 2002–2020. NINA Rep. 2021:1944.
Löe, J., and Röskaft, E. (2004). Large carnivores and human safety: a review. J. Hum. Env. 33, 283–288. doi: 10.1579/0044-7447-33.6.283
López-Bao, J. V., Sazatornil, V., Llaneza, L., and Rodríguez, A. (2013). Indirect effects on heathland conservation and wolf persistence of contradictory policies that threaten traditional free-ranging horse husbandry. Conserv. Lett. 6, 448–455. doi: 10.1111/conl.12014
McKenzie, H. W., Lewis, M. A., and Merrill, E. H. (2009). First passage time analysis of animal movement and insights into the functional response. Bull. Mathemat. Biol. 71, 107–129. doi: 10.1007/s11538-008-9354-x
Merrill, S. B., and Mech, L. D. (2003). The usefulness of GPS telemetry to study wolf circadian and social activity. Wildlife Soc. Bull. 2003, 947–960.
Milanesi, P., Breiner, F. T., Puopolo, F., and Holderegger, R. (2017). European human-dominated landscapes provide ample space for the recolonization of large carnivore populations under future land change scenarios. Ecography 40, 1359–1368. doi: 10.1111/ecog.02223
Moen, G. K., Ordiz, A., Kindberg, J., Swenson, J. E., Sundell, J., and Støen, O.-G. (2018). Behavioral reactions of brown bears to approaching humans in Fennoscandia. Écoscience 2018, 1–11. doi: 10.1080/11956860.2018.1513387
Moen, G. K., Støen, O.-G., Sahlén, V., and Swenson, J. E. (2012). Behaviour of solitary adult Scandinavian brown bears (Ursus arctos) when approached by humans on foot. PLoS One 7:e31699. doi: 10.1371/journal.pone.0031699
Montgomery, D. C. (2007). Introduction to statistical quality control. Hoboken, NJ: John Wiley & Sons.
Moritz, S., Sardá, A., Bartz-Beielstein, T., Zaefferer, M., and Stork, J. (2015). Comparison of different methods for univariate time series imputation in R. arXiv 2015:03924.
Nowak, S., Szewczyk, M., Tomczak, P., Całus, I., Figura, M., and Mysłajek, R. W. (2021). Social and environmental factors influencing contemporary cases of wolf aggression towards people in Poland. Eur. J. Wildlife Res. 67, 1–12.
Ordiz, A., Moen, G. K., Sæbø, S., Stenset, N., Swenson, J. E., and Støen, O.-G. (2019). Habituation, sensitization, or consistent behavioral responses? Brown bear responses after repeated approaches by humans on foot. Biol. Conserv. 232, 228–237. doi: 10.1016/j.biocon.2019.01.016
Ordiz, A., Støen, O. G., Delibes, M., and Swenson, J. E. (2011). Predators or prey? Spatio-temporal discrimination of human-derived risk by brown bears. Oecologia 166, 59–67. doi: 10.1007/s00442-011-1920-5
Ordiz, A., Støen, O. G., Saebo, S., Sahlen, V., Pedersen, B. E., Kindberg, J., et al. (2013). Lasting behavioural responses of brown bears to experimental encounters with humans. J. Appl. Ecol. 50, 306–314. doi: 10.1111/1365-2664.12047
Ordiz, A., Støen, O.-G., Langebro, L. G., Brunberg, S., and Swenson, J. E. (2009). A practical method for measuring horizontal cover. Ursus 20, 109–113. doi: 10.2192/08sc031.1
Penteriani, V., Delgado, M. D., Pinchera, F., Naves, J., Fernandez-Gil, A., Kojola, I., et al. (2016). Human behaviour can trigger large carnivore attacks in developed countries. Scientific Reports 6, 20552. doi: 10.1038/srep20552
R Core Team (2019). R: A Language and Environment for Statistical Computing. Vienna: R Foundation for Statistical Computing.
Reinhardt, I., Kaczensky, P., Frank, J., Knauer, F., and Kluth, G. (2020). How to deal with bold wolves–Recommendations of the DBBW. Bonn: Bundesamt für Naturschutz (BfN) Federal Agency for Nature Conservation.
Roelofs, K. (2017). Freeze for action: neurobiological mechanisms in animal and human freezing. Philosoph. Trans. R. Soc. B 372:20160206. doi: 10.1098/rstb.2016.0206
Røskaft, E., Händel, B., Bjerke, T., and Kaltenborn, B. P. (2007). Human attitudes towards large carnivores in Norway. Wildlife Biol. 13, 172–185. doi: 10.2981/0909-6396(2007)13[172:hatlci]2.0.co;2
RStudio Team (2016). RStudio: Integrated Development Environment for R, 463 Edn. Available online at: http://www.rstudio.com/ (accessed date 25-May-2022)
Sahlen, V., Ordiz, A., Swenson, J. E., and Stoen, O. G. (2015). Behavioural Differences between Single Scandinavian Brown Bears (Ursus arctos) and Females with Dependent Young When Experimentally Approached by Humans. PLoS One 10:16. doi: 10.1371/journal.pone.0121576
Sand, H., Eklund, A., Zimmermann, B., Wikenros, C., and Wabakken, P. (2016). Prey Selection of Scandinavian Wolves: single Large or Several Small? PLoS One 11:e0168062. doi: 10.1371/journal.pone.0168062
Sand, H., Wabakken, P., Zimmermann, B., Johansson, O., Pedersen, H. C., and Liberg, O. (2008). Summer kill rates and predation pattern in a wolf-moose system: can we rely on winter estimates? Oecologia 156, 53–64. doi: 10.1007/s00442-008-0969-2
Sand, H., Wikenros, C., Wabakken, P., and Liberg, O. (2006). Effects of hunting group size, snow depth and age on the success of wolves hunting moose. Anim. Behav. 72, 781–789. doi: 10.1016/j.anbehav.2005.11.030
Schwalb-Willmann, J. (2019). moveVis: Movement Data Visualization. Available online at: https://CRAN.R-project.org/package=moveVis (accessed date 2020-March-28).
Statistisk Sentralbyrå (2020). Areal og befolkning i kommuner, fylker og hele landet (K) 2007 - 2020. Available: https://www.ssb.no/statbank/table/11342/tableViewLayout1/ (accessed October 1, 2021).
Støen, O.-G., Ordiz, A., Evans, A. L., Laske, T. G., Kindberg, J., Fröbert, O., et al. (2015). Physiological evidence for a human-induced landscape of fear in brown bears (Ursus arctos). Physiol. Behav. 152, 244–248. doi: 10.1016/j.physbeh.2015.09.030
Sunde, P., and Olsen, K. (2018). Ulve (Canis lupus) i Danmark 2012-2017: Oversigt og analyse af tilgængelig bestandsinformation. Denmark: DCE-Nationalt Center for Miljø og Energi, Aarhus Universitet.
Sunde, P., Odderskær, P., and Storgaard, K. (2009a). Flight distances of incubating common buzzards Buteo buteo are independent of human disturbance. Ardea 97, 369–372. doi: 10.5253/078.097.0313
Sunde, P., Olesen, C. R., Madsen, T. L., and Haugaard, L. (2009b). Behavioural responses of GPS-collared female red deer Cervus elaphus to driven hunts. Wildlife Biol. 15, 454–460. doi: 10.2981/09-012
Sunde, P., Stener, S. O., and Kvam, T. (1998). Tolerance to humans of resting lynxes Lynx lynx in a hunted population. Wildlife Biol. 4, 177–183. doi: 10.2981/wlb.1998.020
Theuerkauf, J. (2009). What drives wolves: fear or hunger? Humans, diet, climate and wolf activity patterns. Ethology 115, 649–657. doi: 10.1111/j.1439-0310.2009.01653.x
Trouwborst, A. (2010). Managing the carnivore comeback: international and EU species protection law and the return of lynx, wolf and bear to Western Europe. J. Env. Law 22, 347–372. doi: 10.1093/jel/eqq013
Truong, C., Oudre, L., and Vayatis, N. (2020). Selective review of offline change point detection methods. Signal Proc. 167:107299. doi: 10.1016/j.sigpro.2019.107299
Versluijs, E., Eriksen, A., Fuchs, B., Wikenros, C., Sand, H., Wabakken, P., et al. (2022). Wolf responses to experimental human approaches using high resolution GPS data. Front. Ecol. Evol. 10:792916. doi: 10.3389/fevo.2022.792916
Viljanen, A. S. (2019). Moose (Alces alces) flight response when disturbed by off-track skiing. Master thesis. Hamar: Inland Norway University of Applied Sciences.
Wabakken, P., Sand, H., Liberg, O., and Bjarvall, A. (2001). The recovery, distribution, and population dynamics of wolves on the Scandinavian peninsula, 1978-1998. Can. J. Zool. Revue Canad. De Zool. 79, 710–725. doi: 10.1139/cjz-79-4-710
Wam, H., Eldegard, K., and Hjeljord, O. (2012). From overlooking to concealed: predator avoidance in an apex carnivore. Eur. J. Wildlife Res. 58, 1001–1003. doi: 10.1007/s10344-012-0670-y
Wam, H., Eldegard, K., and Hjeljord, O. (2014). Minor habituation to repeated experimental approaches in Scandinavian wolves. Eur. J. Wildlife R es. 60, 839–842. doi: 10.1007/s10344-014-0841-0
Wickham, H. (2016). ggplot2: Elegant Graphics for Data Analysis. Available online at: https://ggplot2.tidyverse.org (accessed January 20, 2020).
Wickham, H., François, R., Henry, L., and Müller, K. (2019). dplyr: A Grammar of Data Manipulation. Available online at: https://CRAN.R-project.org/package=dplyr (accessed date 2022-February-08).
Zimmermann, B. (2014). Predatory behaviour of wolves in Scandinavia. PhD thesis. Elverum: Hedmark University College.
Zimmermann, B., Sand, H., Wabakken, P., Liberg, O., and Andreassen, H. P. (2015). Predator-dependent functional response in wolves: from food limitation to surplus killing. J. Anim. Ecol. 84, 102–112. doi: 10.1111/1365-2656.12280
Keywords: carnivores, Canis lupus, changepoint analysis, field experiments, flight initiation distance (FID), upper control limit (UCL), wildlife-human interaction
Citation: Eriksen A, Versluijs E, Fuchs B, Zimmermann B, Wabakken P, Ordiz A, Sunde P, Wikenros C, Sand H, Gillich B, Michler F, Nordli K, Carricondo-Sanchez D, Gorini L and Rieger S (2022) A Standardized Method for Experimental Human Approach Trials on Wild Wolves. Front. Ecol. Evol. 10:793307. doi: 10.3389/fevo.2022.793307
Received: 11 October 2021; Accepted: 01 April 2022;
Published: 27 April 2022.
Edited by:
Miguel Ferrer, Spanish National Research Council (CSIC), SpainReviewed by:
Robby R. Marrotte, Trent University, CanadaCopyright © 2022 Eriksen, Versluijs, Fuchs, Zimmermann, Wabakken, Ordiz, Sunde, Wikenros, Sand, Gillich, Michler, Nordli, Carricondo-Sanchez, Gorini and Rieger. This is an open-access article distributed under the terms of the Creative Commons Attribution License (CC BY). The use, distribution or reproduction in other forums is permitted, provided the original author(s) and the copyright owner(s) are credited and that the original publication in this journal is cited, in accordance with accepted academic practice. No use, distribution or reproduction is permitted which does not comply with these terms.
*Correspondence: Ane Eriksen, YW5lLmVyaWtzZW5AaW5uLm5v
†These authors have contributed equally to this work and share first authorship
Disclaimer: All claims expressed in this article are solely those of the authors and do not necessarily represent those of their affiliated organizations, or those of the publisher, the editors and the reviewers. Any product that may be evaluated in this article or claim that may be made by its manufacturer is not guaranteed or endorsed by the publisher.
Research integrity at Frontiers
Learn more about the work of our research integrity team to safeguard the quality of each article we publish.