
94% of researchers rate our articles as excellent or good
Learn more about the work of our research integrity team to safeguard the quality of each article we publish.
Find out more
ORIGINAL RESEARCH article
Front. Ecol. Evol., 16 February 2022
Sec. Ecophysiology
Volume 10 - 2022 | https://doi.org/10.3389/fevo.2022.787623
This article is part of the Research TopicEcophysiological Adaptations Associated with Animal MigrationView all 15 articles
 Christopher G. Guglielmo1*†
 Yolanda E. Morbey1†
 Lisa V. Kennedy1,2
 Jessica E. Deakin1J. Morgan Brown1,3
 Andrew T. Beauchamp1
Fat contributes most of the energy for migratory flight of birds, whereas lean body tissues (muscles and organs) contribute amino acids and water to maintain metabolic and osmotic homeostasis. During refueling at stopover sites, both fat and lean mass are recovered, but the dynamics of this recovery are poorly understood. We used non-invasive quantitative magnetic resonance (QMR) analysis to measure fat and lean mass of > 3,500 individuals of 25 songbird species during six spring and three autumn migration seasons between 2009 and 2019 at Long Point, ON, Canada. We used allometric scaling analysis and linear mixed-effects modeling of body composition data at both the population level (single capture) and the individual level (recapture). In the population-level analysis, lean mass scaled hypoallometrically with body mass, such that for every 20% increase in body mass, lean mass was predicted to increase by 12.1% in spring and 12.8% in autumn. Fat scaled hyperallometrically with body mass, such that for every 20% increase in body mass, fat mass was predicted to increase by 144% in spring and 136% in autumn. At the individual level, these allometric relationships were more extreme. As a result of this differential allometry, at low body masses, lean and fat mass contributes nearly equally to changes in mass, but at high body mass fat deposition becomes progressively more dominant. Spring migrants deposited relatively more fat than autumn migrants, and in autumn juvenile birds tended to have greater lean mass than adults. Our findings show that lean mass deposition during refueling by songbirds is substantial, and in line with the losses of protein expected in flight. The process of fat and lean mass deposition is characterized by non-linear dynamics which are influenced by the current body composition, season, and, to a lesser extent, age. The patterns suggest that the need for dietary protein to rebuild lean mass will be greater when body mass is low, during autumn migration, and in juvenile birds.
Knowledge of the changes in body composition that occur at staging and stopover sites is essential to our understanding of how migratory birds budget fuel, and of the nutrients they require when fueling. Early work on fuel storage of migratory birds produced the airplane paradigm where lean body components stayed constant, and fat was used as fuel for flight (Connell et al., 1960; Odum et al., 1964). It was later recognized that although stored fat provides the majority of energy for migratory flight, the catabolism of lean body components during flight and their anabolism (i.e., growth) during fueling is substantial and widespread among migratory birds (Piersma and Jukema, 1990; Lindström and Piersma, 1993; Klaassen et al., 1997; Bauchinger and Biebach, 1998; Jenni and Jenni-Eiermann, 1998; Karasov and Pinshow, 1998; Schwilch et al., 2002). Some of the most dramatic examples come from situations where birds prepare to cross, or have just finished crossing, large ecological barriers such as the Sahara Desert or Pacific Ocean. For example, when Garden Warblers (Sylvia borin) migrate across the Sahara, 70% of mass lost is fat and 30% is lean tissue protein from muscles and organs (Biebach, 1998). Trans-Pacific migrant shorebirds show extreme changes in both fat and lean body components as they prepare for and undertake multi-day flights (Piersma and Gill, 1998; Battley et al., 2000). However, the limited evidence available indicates that even songbirds refueling at stopovers where there is no ecological barrier appear to deposit significant amounts of lean mass along with fat (Karasov and Pinshow, 1998; Seewagen and Guglielmo, 2011; Wojciechowski et al., 2014). Unlike body fat, which can be synthesized from dietary fat, carbohydrate, or protein, the deposition and maintenance of lean mass stores require dietary protein intake. Thus, factors that influence lean mass deposition could influence diet selection for protein-rich foods, such as invertebrates, during refueling (Carpenter et al., 1993).
The composition of fuel deposited at stopover is related to the fuel mixture in flight. Wind tunnel studies have confirmed that lean mass (protein) provides about 5–10% of the energy for endurance flight of birds (Klaassen et al., 2000; Jenni-Eiermann et al., 2002; Gerson and Guglielmo, 2011; Guglielmo et al., 2017; Dick and Guglielmo, 2019; Groom et al., 2019). Catabolism of protein occurs as a result of normal protein turnover, to maintain stable blood glucose concentration, to provide key intermediates of the citric acid cycle, and to provide water under dehydrating conditions (Klaassen, 1996; Bauchinger and Biebach, 1998; Jenni and Jenni-Eiermann, 1998; Gerson and Guglielmo, 2011; Groom et al., 2019). It may also confer an adaptive advantage for long flights by reducing excess mass, and thus power costs for flying (Pennycuick, 2008). Because wet lean tissue has a much lower energy density than fat (5.4 vs. 37.6 kJ g–1 wet; Jenni and Jenni-Eiermann, 1998), the small contribution of protein to flight energy results in a proportionally large loss of mass, which has been estimated to be 30 and 47% of total mass loss for a 5 and 10% contribution to energy, respectively (Salewski et al., 2009). Thus, it may be expected that lean mass deposition at refueling sites will be in the same range as birds prepare for the next flight.
Along with recognizing the importance of lean mass dynamics, some previous studies have argued that the body lean and fat masses can be partitioned into components associated with structural size (Piersma and Davidson, 1991), some of which may be used as “reserves” in extreme situations, and “stores” which are deposited above the basic structure in anticipation of activities like enduring periods of food shortage, surviving a cold winter night, migration, or reproduction (van der Meer and Piersma, 1994). Under the assumption that there is a distinct difference between reserves and stores, authors interested in the composition of stores have attempted to estimate and subtract off the structural component (e.g., mass of birds with zero visible fat; Salewski et al., 2009), or have fitted breakpoint regression models to identify an abrupt change at the threshold of stores and reserves (van der Meer and Piersma, 1994). The latter is based on the physiological transition in fuel use between phase II and phase III of fasting in long-term starved birds (Le Mayo et al., 1981), which may not be equivalent to the physiology of fuel deposition, and may not be relevant for songbirds at stopover. Alternatively, others have fit breakpoints in lean and fat mass at high body masses where an assumed threshold of maximum lean mass had been attained (biphasic mass gain; Carpenter et al., 1993; Wojciechowski et al., 2014), while others have reported that fuel deposition may even occur in three phases in shorebirds preparing for a long barrier crossing (Piersma et al., 1999; Hua et al., 2013).
An important point raised by Lindström and Piersma (1993), in reference to population-level analyses of body composition (i.e., one sample per individual), was that the relative deposition of lean mass in stores could be overestimated by regression of lean mass on body mass due to a poor accounting of how structural mass increases with structural size. Instead, they suggested that reliable estimates of lean and fat deposition required sampling synchronously migrating populations through time as they refueled at stopover. They were only able to apply this method to shorebirds and waterfowl because they did not find examples of synchronously arriving and departing songbirds, but they anticipated a future where non-invasive technologies would allow repeated measurements of recaptured individuals as they refueled. Such methods are now available.
Quantitative magnetic resonance (QMR) allows quick, safe, and accurate repeated measurement of fat and lean mass of awake birds (Guglielmo et al., 2011; Kennedy et al., 2016; Kelsey et al., 2019). This technology has been validated on a variety of taxa including small animals like mice, rats, bats, and birds (Taicher et al., 2003; McGuire and Guglielmo, 2010; Guglielmo et al., 2011). QMR predicts the masses of fat, wet lean, and total body water of small birds with precisions of < ± 3% and accuracies of approximately ± 11, ± 2 and ± 2%, respectively (Guglielmo et al., 2011). Seewagen and Guglielmo (2011) used QMR to measure the deposition of fat and lean mass in migrant passerines at a stopover site and showed that on average 35% of the total mass gained in four individual recaptured birds was lean mass. At the population level, they also used regression analysis of body composition of single captured birds and estimated lean mass contributions of similar magnitude in four species (Seewagen and Guglielmo, 2011). Kelsey and Bairlein (2019) used QMR to measure body composition changes during migratory fueling of captive wheatears (Oenanthe oenanthe) (Kelsey and Bairlein, 2019). Kelsey et al. (2019, 2021) used QMR to derive predictive equations of lean mass and fuel load of birds at stopover, and to test for differences in lean mass relative to size in bird species with different migration strategies (Kelsey et al., 2019, 2021). We have used QMR in a variety of contexts to study fuel use in flight (Gerson and Guglielmo, 2011; Guglielmo et al., 2017; Dick and Guglielmo, 2019) and the influence of fat and lean mass on migration behavior (Brown et al., 2014; Kennedy et al., 2016; Morbey et al., 2018; Beauchamp et al., 2020). Other non-invasive methods include dual x-ray absorptiometry (DEXA) (Korine et al., 2004; Wojciechowski et al., 2014), heavy water dilution (Ellis and Jehl, 1991; Karasov and Pinshow, 1998; McWilliams and Whitman, 2013), and total body electrical conductivity (TOBEC) (Karasov and Pinshow, 1998; McWilliams and Whitman, 2013). DEXA requires anesthesia and X-ray safety precautions, while TOBEC is no longer commercially available. Heavy water dilution is relatively easy, practical, and inexpensive, but requires holding birds for about 15–30 min and usually requires taking body fluid samples (e.g., blood, but urine is a suitable alternative). It can be made even less invasive if breath deuterium enrichment is measured in real time with laser spectroscopy (Mitchell et al., 2015).
In contrast to accounting for structural mass when exploring the composition of stores, a more fundamental approach is to statistically model the scaling relationships of lean and fat mass with body size and body mass. Scaling relationships describe how body parts or components change in size with a change in overall size (Schmidt-Nielsen, 1984). Isometric scaling means that a component changes in direct proportion (i.e., linearly) to body size. Hypoallometric scaling means that the component increases with body size, but at less than proportionality. Under hyperallometric scaling, the component increases in both absolute size and relative proportion with body size. This phenomenological approach is simple, avoids making assumptions about the underlying physiology, and has the potential to describe non-linearities that approximate breakpoint-like phenomena. Moreover, scaling analyses can be applied across species and contexts to derive generalities and test for the effects of covariates of interest.
Although lean mass deposition may be widespread among migratory birds, covariates or factors that determine variation in the relative deposition of fat and lean mass are very poorly understood. Factors such as species, season, sex, age, or migration strategy may affect the mixture of fuels deposited. Species could differ in the relative deposition of lean and fat mass at stopover due to differences in diet (Gannes, 2001), body size (Lindström and Piersma, 1993), or migration distance (Kelsey et al., 2021). Seasonal differences in fuel accumulation may be attributed to different ultimate goals between spring (reproduction) and autumn (overwintering), or because food and weather conditions are more unpredictable in spring (Newton, 2008). There is some evidence that body mass and fat stores are greater in the spring (Seewagen and Slayton, 2008; Kennedy, 2012; Schmaljohann et al., 2018), but there is little information on seasonal variability in lean mass (Salewski et al., 2009; Wojciechowski et al., 2014).
Age could affect fat and lean mass accumulation, particularly during autumn. Passerine birds generally have low survival rates in their first year of life, and mortality may be especially great during migration (Sillet and Holmes, 2002; McKim-Louder et al., 2013). The energy demands of migration may be greater for juveniles since they may have greater maintenance metabolic costs than adults (McCabe and Guglielmo, 2019), convert less of ingested energy to stores (McCabe and Guglielmo, 2019), and tend to struggle more to maintain stored fuel relative to adults (Swanson et al., 1999). Hatch year birds in fall may be poorer foragers (Heise and Moore, 2003; Vanderhoff and Eason, 2007), may choose poorer quality foods, or may be out-competed for food by adults (Sol et al., 1998). Differences in gut size and continued maturation in hatch year birds could also lead to differences in lean mass dynamics, particularly in the gut (Hume and Biebach, 1996; Guglielmo and Williams, 2003; McCabe and Guglielmo, 2019).
We used QMR to measure body composition of a variety of songbird species at a single site during 6 spring and 3 autumn migrations over a 10-year period. Here we use a scaling approach of population-level (cross-sectional) and individual-level (recapture) data to analyze the composition of fuel accumulated at stopover. We use linear mixed modeling to examine general effects of season, age, and migration distance while allowing for random effects of species and year. Based on previous studies and the known contribution of lean mass to energy in flight, we hypothesized that both fat and lean mass change during refueling, with lean mass accounting for about 30–50% of mass gain. We also tested for non-linearity in the deposition of fat and lean mass. We predicted that spring migrants would accumulate a greater proportion of fat than lean mass and that juvenile birds would accumulate less fat relative to adults. Finally, we sought to assess the congruence between individual- and population-level analyses. If individual-level assessment supported population-level analysis, then future studies on migrant refueling would not need to rely on recaptures, which are less common and may be biased toward birds that remain at stopover longer.
The research procedures were approved by the University of Western Ontario Animal Care Committee (protocols 2006-014, 2010-020, 2017-160) and permitted by the Canadian Wildlife Service (Migratory Bird Banding Permit 10169). A variety of songbirds were sampled at the Old Cut study site of the Long Point Bird Observatory (LPBO) on Long Point, ON, Canada (42°34′57.71″N, 80°23′51.48″W) in six spring and three autumn migration periods between 2009 and 2019 for several different research projects (Kennedy, 2012; Brown et al., 2014; Morbey et al., 2018; Beauchamp et al., 2020; Deakin et al., unpublished data). Spring data were collected as early as April 25 and as late as May 26, whereas autumn data were collected as early as August 27 and as late as October 21. Each day 14 mist-nets in a woodlot were opened 30 min before sunrise and remained open for 6 h. Nets were not open during periods of heavy rain or wind. Birds were individually banded with a unique nine-digit number on a Canadian Wildlife Service/United States Fish and Wildlife Service aluminum band. For each bird, LPBO staff recorded species, age, sex, unflattened wing chord (mm), mass (0.1 g), visible fat (scored on a scale of 0–7) (LPBO, 2019), date, and time of capture. Sex and age were determined by species-specific plumage and molt criteria, eye and/or tongue coloration, and degree of skull pneumatization for age during autumn (Pyle, 1997). All spring birds were considered to be adults. In autumn, birds were classified as adult (i.e., after-hatch-year) or juvenile (i.e., hatch-year).
Birds were then brought to a mobile laboratory at the site to be scanned in the QMR body composition analyzer (Echo-MRI-B, Echo Medical Systems, Houston, TX, United States), which measures dry fat and wet lean mass of small birds with high precision (CV of 2.4 and 0.7% for fat and wet lean mass, respectively) and accuracy (relative errors of 6–11% for fat and 1–2% for wet lean mass) (Guglielmo et al., 2011). Birds were scanned once using the “small bird” (< 50 g) and “two-accumulation” settings as described in Guglielmo et al. (2011). Scanning once decreases precision and thus increases experimental error, but allows one to scan many more species and individuals. In this study, the maximum number of birds scanned in a 6 h period was 140. The QMR was calibrated using a 94 g canola oil standard provided by the manufacturer. A daily “system test” was done with the 94 g oil standard and, depending on the year of study, scans of 3, 5, and/or 10 g canola oil standards were taken periodically throughout the day to ensure scanning accuracy. Each bird was held in a ventilated plexi-glass tube appropriate for its size for a 1.5–2 min scan. Birds were selected for scanning after banding only if there was sufficient time for processing since no bird was held after capture for more than 1 h. All birds were released immediately after scanning. Fat mass and wet lean body mass values were adjusted using two calibration equations (calibrated fat mass = raw QMR fat x 0.94, and calibrated lean body mass = raw QMR wet lean body mass x 1.021) derived from a laboratory validation developed from house sparrows (Passer domesticus) and zebra finches (Taeniopygia guttata) (Guglielmo et al., 2011).
For the cross-sectional analysis of single scan data (not recaptures), only data for initial scans were included. Data were first filtered to include all species with at least 20 unique individuals with complete information for wing chord, mass, fat mass, and lean mass. Outliers, which were attributed to transcription errors, were detected and removed following standard procedures (Zuur et al., 2010). We removed observations with fat ≤ 0 g (n = 20) as these values were unrealistic and could not be log10-transformed. By species, we removed points outside of the 99% confidence interval for mass and wing chord. We also removed large residuals (absolute value > 0.04) in the log10(mass) vs. log10(fat mass + lean mass) regression (n = 67). If any year-season-species combination fell below a sample size of 20, this combination was removed from the dataset. We also removed female Red-winged Blackbirds (Agelaius phoeniceus, n = 5), as they showed different scaling relationship than males. The number of species sampled per season and year is shown in Figure 1, and included 3,549 observations (Table 1).
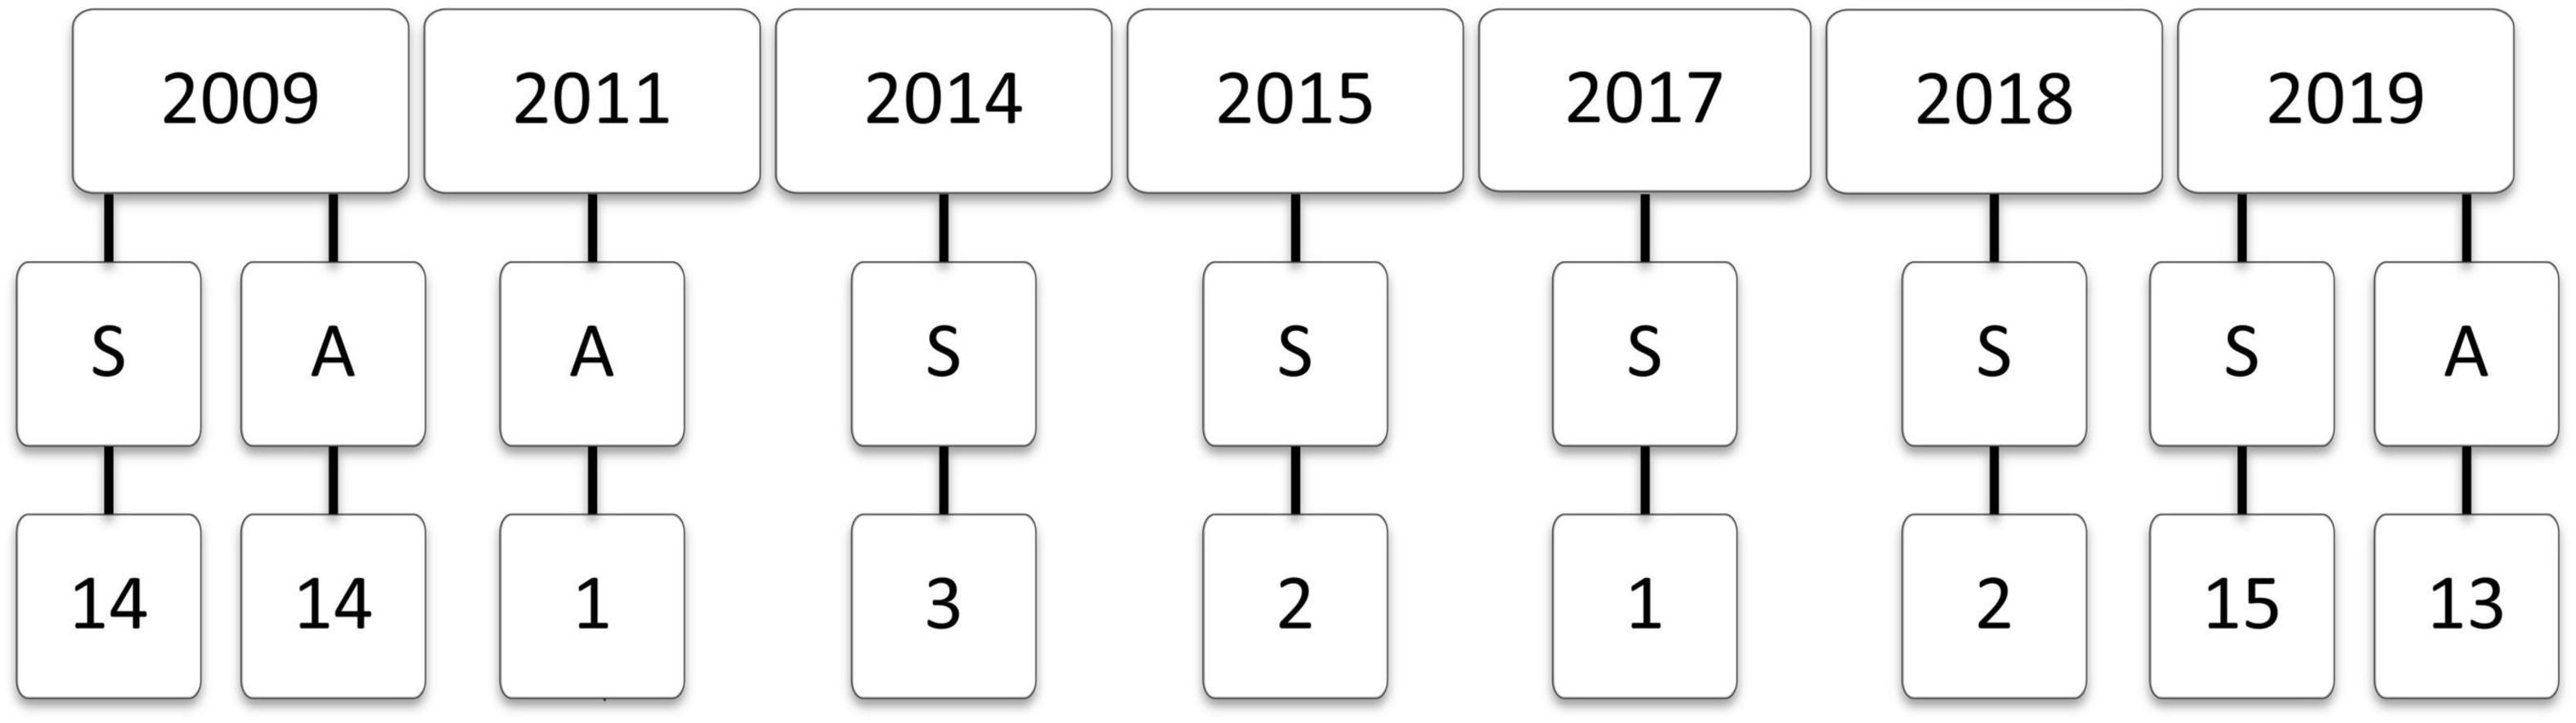
Figure 1. The number of songbird species with n ≥ 20 individuals sampled across seasons (S, spring; A, autumn) in 2009 (Kennedy, 2012), 2011 (Brown et al., 2014), 2014 and 2015 (Morbey et al., 2018), 2017 (Beauchamp et al., 2020), and 2018 and 2019 (Deakin et al., unpublished data).
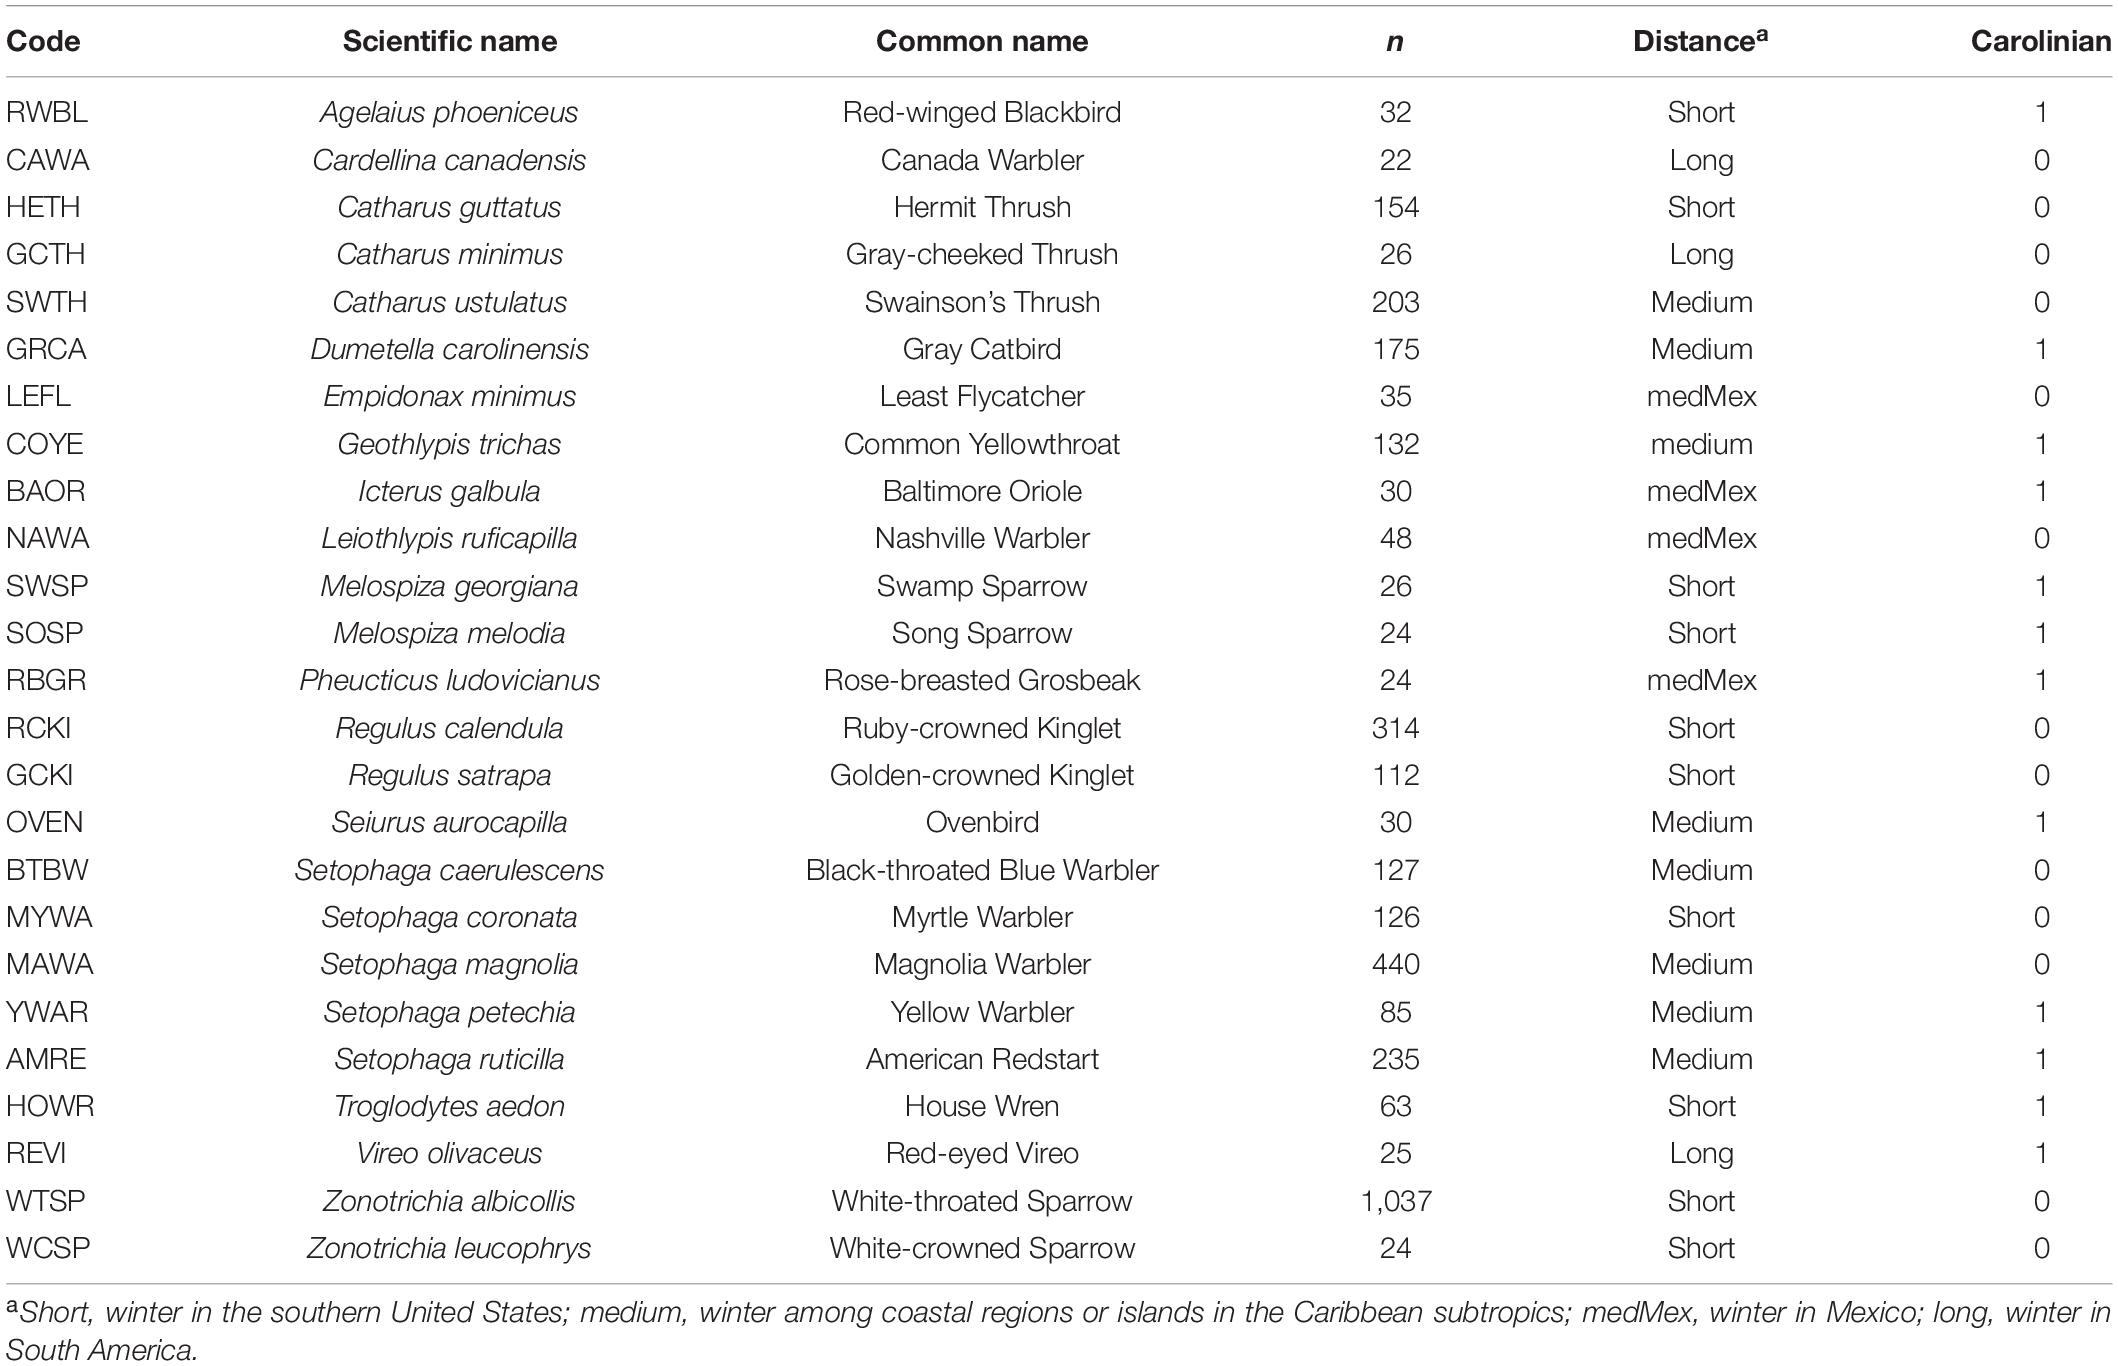
Table 1. Songbird species used in the study of lean and fat mass scaling, showing the species code, scientific name, common name, single scan sample size, migration distance, and breeding location (Carolinian Zone or not).
We used a linear mixed modeling approach to summarize average scaling relationships for species stopping over at Long Point, where a scaling relationship follows this form:
For scaling relationships between body mass, lean mass, and fat mass with structural size, we used wing chord as an index of structural size. The only other structural size metric available was tarsus length, but this was not always measured and was less correlated with body mass within species. In models, mass and wing chord were log10-transformed, which is the convention for scaling studies, and the slope represents the scaling exponent β. Because wing chord is a linear measurement and mass is a volumetric measurement, isometry would be indicated by mass scaling with the cube of wing chord. Thus, when interpreting β for scaling with wing chord, we classified β < 3 as hypoallometric, β = 3 as isometric, and β > 3 as hyperallometric.
In the scaling models, we specified random effects for species (n = 25) and year-season combinations (n = 9). This allowed us to account for variation in the scaling relationships among distinct species and sampling seasons and permitted us to obtain the expected scaling relationship for a typical bird at this stopover location. The compromise is that group-level slopes show shrinkage (i.e., are less extreme) relative to group-level linear model estimates (Hector, 2015). For species random effects, we selected between random intercept and random intercept and slope models using likelihood ratio tests (LRTs). We retained random intercepts for the year-season combination because this was an essential component of the sampling scheme. Sex and age class were excluded from the global model as they were sampled unevenly across species, but exploratory analyses showed consistent scaling relationships regardless of sex or age class (except for the aforementioned Red-winged Blackbird). For all linear mixed models, we were interested in the variance components, the fixed effects, and the marginal and conditional R2-values (Nakagawa and Schielzeth, 2013), which are the proportion of variance explained by fixed and fixed + random effects, respectively. In R version 4.0.0 (R Core Team, 2020), we used function lmer in package lme4 to fit linear mixed models (Bates et al., 2015), and r.squaredGLMM in MuMIn for R2-values (Barton, 2020). Model fit and homogeneity of variance were confirmed through visual inspection of residuals.
For species with sufficient sample sizes for evaluation of functional relationships (n > 60), we used standardized major axis (SMA) regression to estimate β in the bivariate relationships between each mass component and wing chord. As opposed to ordinary least squares regression, SMA regression minimizes the area formed by the right triangles between the point and regression line (Warton et al., 2006). SMA was selected over major axis regression as the former is appropriate when variables have different units. However, SMA regression was not done for weak bivariate relationships, as this contraindicates a true functional relationship.
We next examined scaling relationships between the fat and lean components of body mass and total body mass. Again, the component masses and body mass were log10-transformed, and the slope represents the scaling exponent β. Now when interpreting β, we classified β < 1 as hypoallometric, β = 1 as isometric, and β > 1 as hyperallometric. In models, we specified random effects for species and year-season combinations. For random effects for species, we selected between random intercept and random intercept and slope models using LRTs. We retained random intercepts for the year-season combination. Sex and age class were excluded from the global model. However, we included season and the mass-by-season interaction, as we were specifically interested in comparing scaling relationships between spring and autumn. To interpret how the scaling coefficients (βs) would translate into a refueling bird, we predicted the effect of a 20% increase in body mass, calculated as (1.2β–1)*100%, which applies regardless of body mass. We also predicted the effect of an absolute +1 g difference in body mass from the median body mass for each species, but caution that these effects cannot be extrapolated because we are modeling multiplicative, not additive, effects.
We determined whether there was support to include age (autumn only), and migration distance as fixed effects in the models of body composition using LRTs. For age comparisons in autumn, species with fewer than 20 observations of each age class (adults, juvenile) were excluded. We considered two aspects of the migration distance. Based on the Birds of the World (Billerman et al., 2020), we assigned species as short distance (winter in the southern United States), Caribbean medium distance (winter among coastal regions or islands in the subtropics), Mexico medium distance (winter in Mexico), or long-distance migrants (winter in South America). We also assigned breeding region as a binary variable based on whether the species breeds at high density in the Carolinian region of Ontario (where our study site was located) or further north based on the Atlas of the Breeding Birds of Ontario (Cadman et al., 2007).
In the mixed-effects models, species were assumed to be independent even though species with shared ancestry may be more similar in their response variables. We considered using phylogenetically controlled analyses, which typically use species-level data. However, with our individual-level data, it was not straightforward to incorporate phylogenetic similarity as random intercepts and slopes, while also allowing for random intercepts for year-season combinations. To partially address the issue of phylogenetic similarity, we explored structure in the random slope estimates for species with and without controlling for phylogeny (for methods, see Supplementary Material).
To evaluate body composition change within individuals over time while at the stopover site, we selected all birds that were recaptured and scanned on two or more occasions on different days less than 8 days apart, and then selected the initial and final scans. We compared the change in body mass measured gravimetrically by a balance to the change in body mass (fat + wet lean mass) measured by the QMR (Mq), and removed 6 large residuals (<–1 or > 1). The final data included 145 recaptures across 25 species, with 52 recaptures for White-throated Sparrows and 1–11 recaptures in each of the remaining species. Change in Mq was strongly correlated with change in body mass (R = 0.966; OLS intercept –0.014 [CI: –0.066, 0.037], slope 0.878 [CI: 0.839, 0.917]). We calculated percent fat mass change and percent lean mass change and determined how these related to percent body mass change using general linear models. Given the allometric relationships between the body mass components and body mass determined from single scan analysis, we expected these relationships to be linear. We tested for the inclusion of season and species grouping (White-throated Sparrows Zonotrichia albicollis vs. all other species) using LRTs. Species grouping was considered because the dataset was dominated by recaptures of White-throated Sparrows.
To facilitate prediction of energy stores in migrants we constructed species-specific predictive equations for fat (g) as a function of body mass, wing chord, and fat score. Data for both first captures and recaptures were used (n = 4,016), which increased the number of species with ≥ 20 samples from 25 to 32. Due to collinearity among variables, we used LASSO regression to lessen the problem of high variance and to allow for the elimination of highly correlated predictors (Dormann et al., 2013). This was done using functions in glmnet (Friedman et al., 2010). We also ran these models using half of each dataset as the training set, and the other half as the test dataset. The predicted R2 provided an index for how well the training model predicted fat in the test data. Other linear model constructions were considered, including log-transformations and use of the scaled mass index (Peig and Green, 2009) instead of including mass and wing chord separately, but these did not perform better than the simple linear equations. We did not attempt to predict lean mass stores because the data lacked an index of lean mass, such as a muscle score (Salewski et al., 2009).
In the pooled dataset, body mass and wing chord were strongly, positively correlated (R = 0.857, P < 0.0001, n = 3,549). In the analysis of body mass scaling, there was evidence to support a random intercept and slope model over a random intercept only model (LRT: χ2 = 8.3, df = 2, P = 0.016), and the random effects accounted for more of the variance (87.0%) than the fixed effect of wing chord (11.0%). Overall, the intraspecific body mass scaling coefficient (i.e., the fixed effect of wing chord) was 0.906 (CI: 0.793, 1.036), which indicates hypoallometry (Figure 2A). Among the random effects, species effects contributed much more than year-season effects (Table 2). Among species, the random slope estimates increased with wing length, with or without controlling for phylogeny (Supplementary Material). This suggests that log10-transformation did not completely linearize the relationship between body mass and wing chord. However, variation in the random slopes was subtle compared to the global body mass scaling coefficient. Among the 13 species with n > 60 observations, the mean SMA slope was 2.18; 10 of 13 species showed hypoallometry of body mass with wing chord with SMA slopes < 3, and three species showed isometry with SMA slopes not different from 3.0 (Table 3).
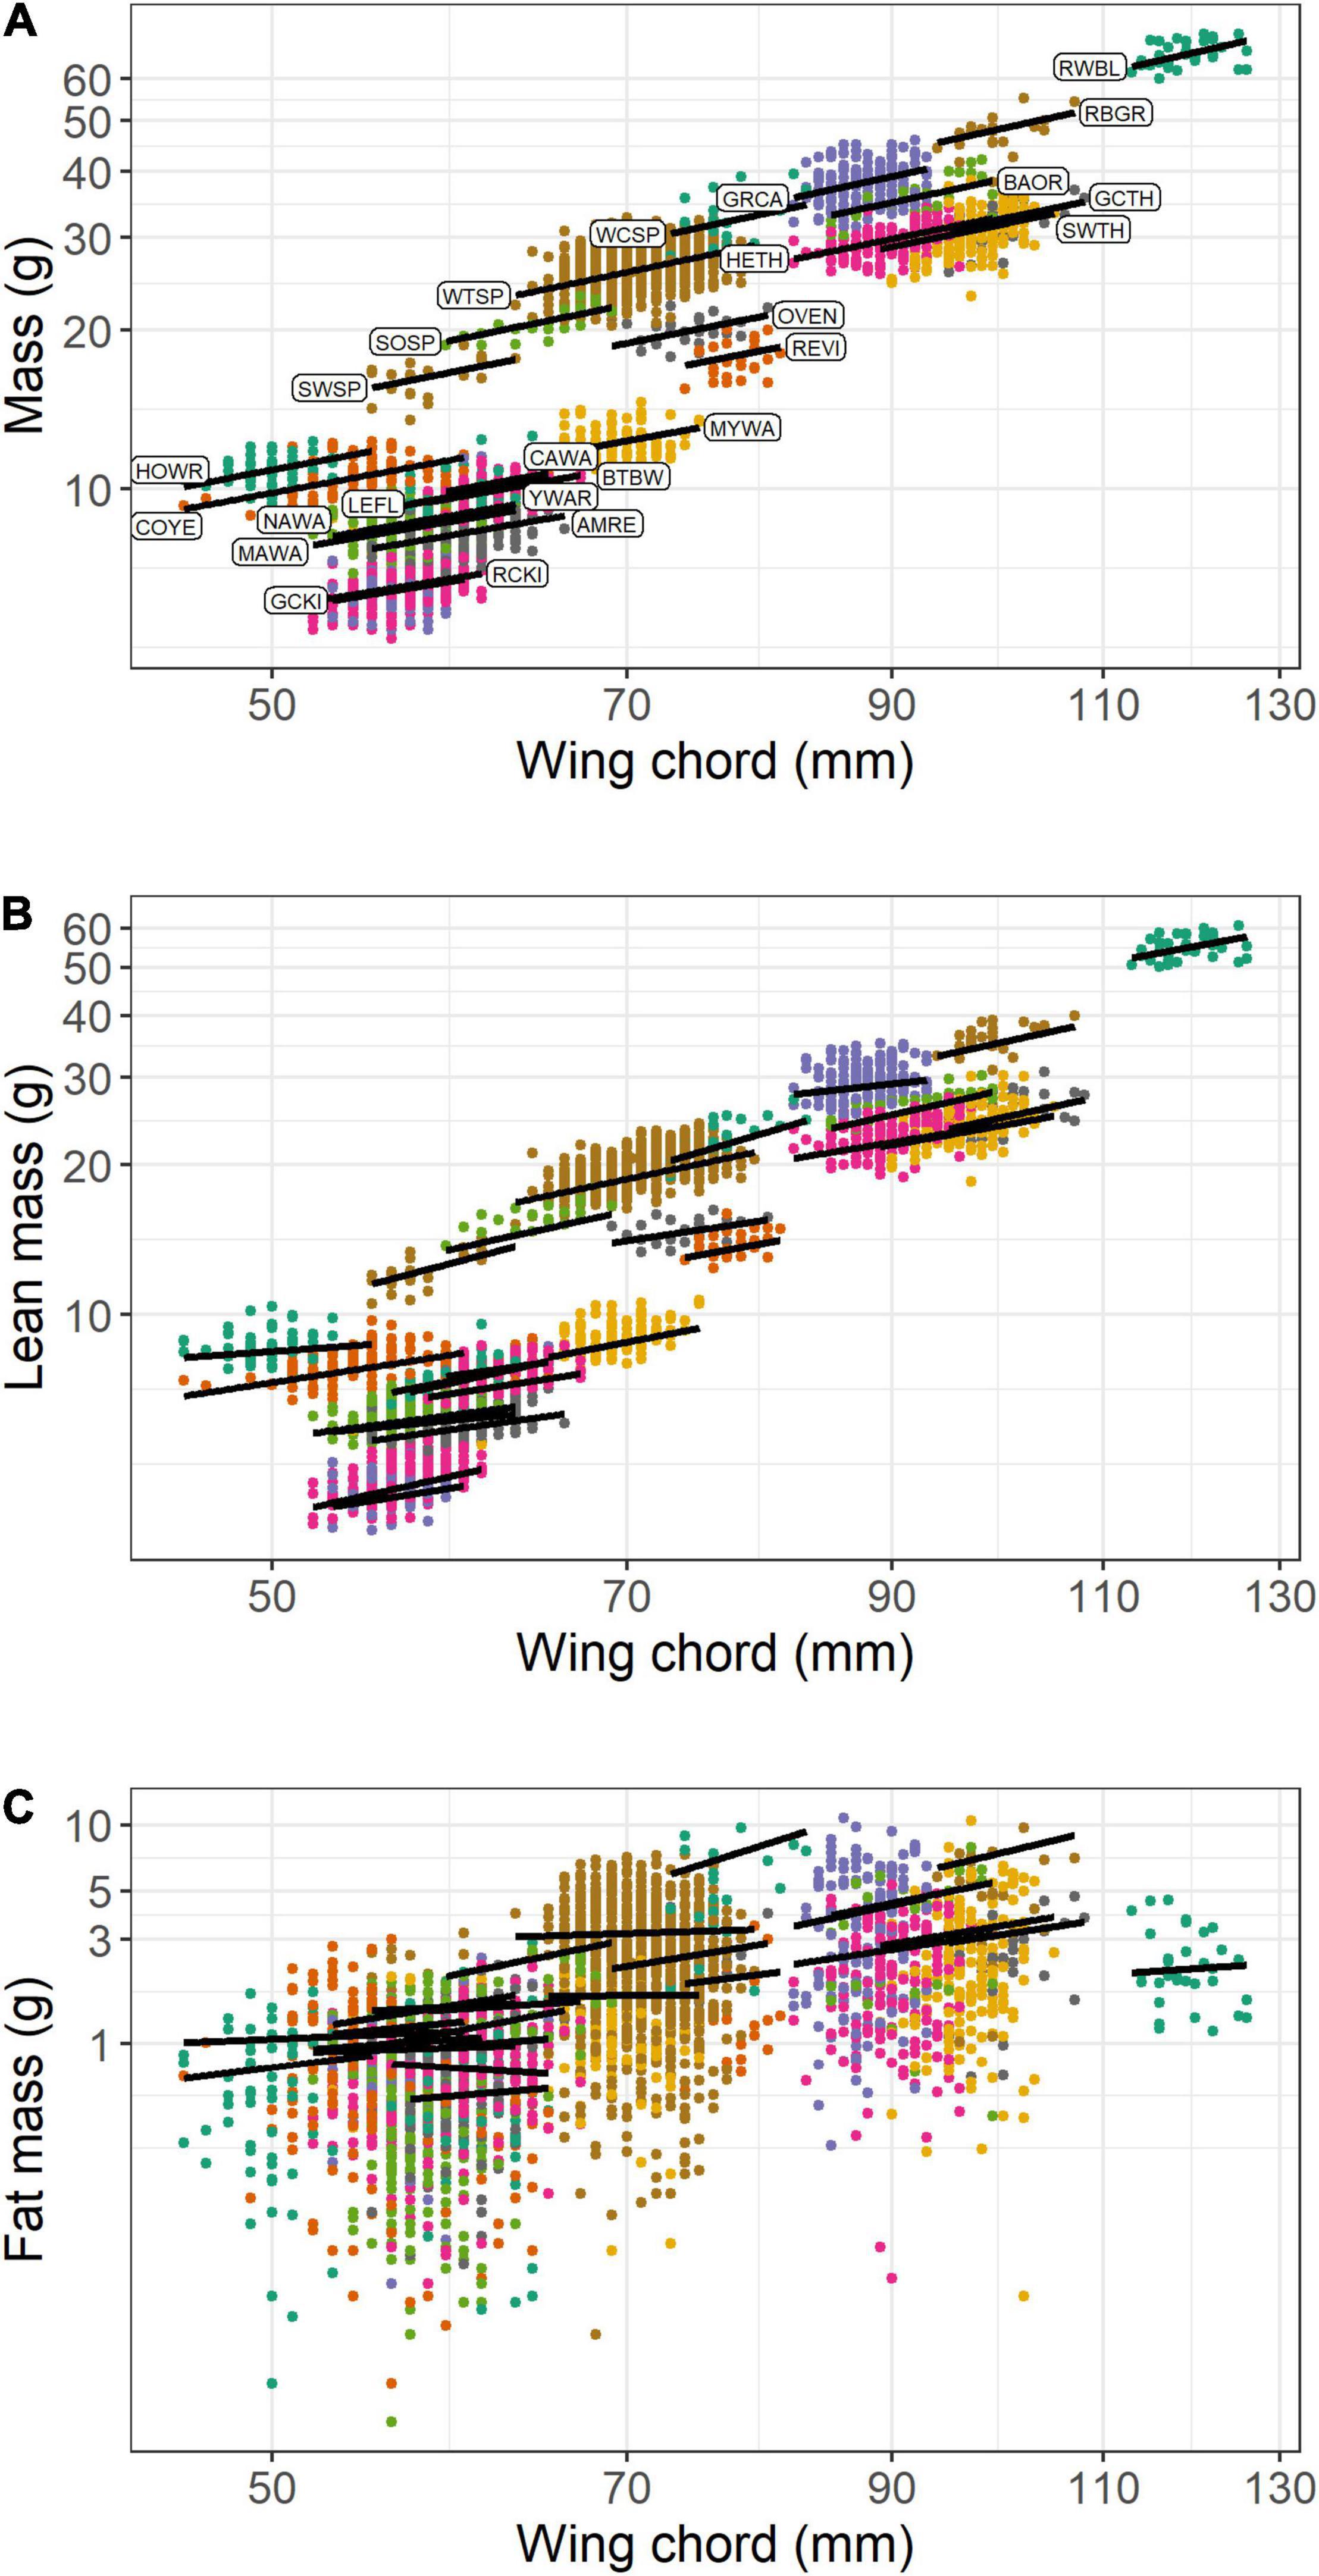
Figure 2. Scaling of body mass (A), lean mass (B), and fat mass (C) with wing chord for 25 species of songbirds stopping over at Long Point, Ontario (n = 3,549). The lines show the linear mixed model predictions when year = 2009 and season = spring. Species codes are shown in panel A and defined in Table 1.
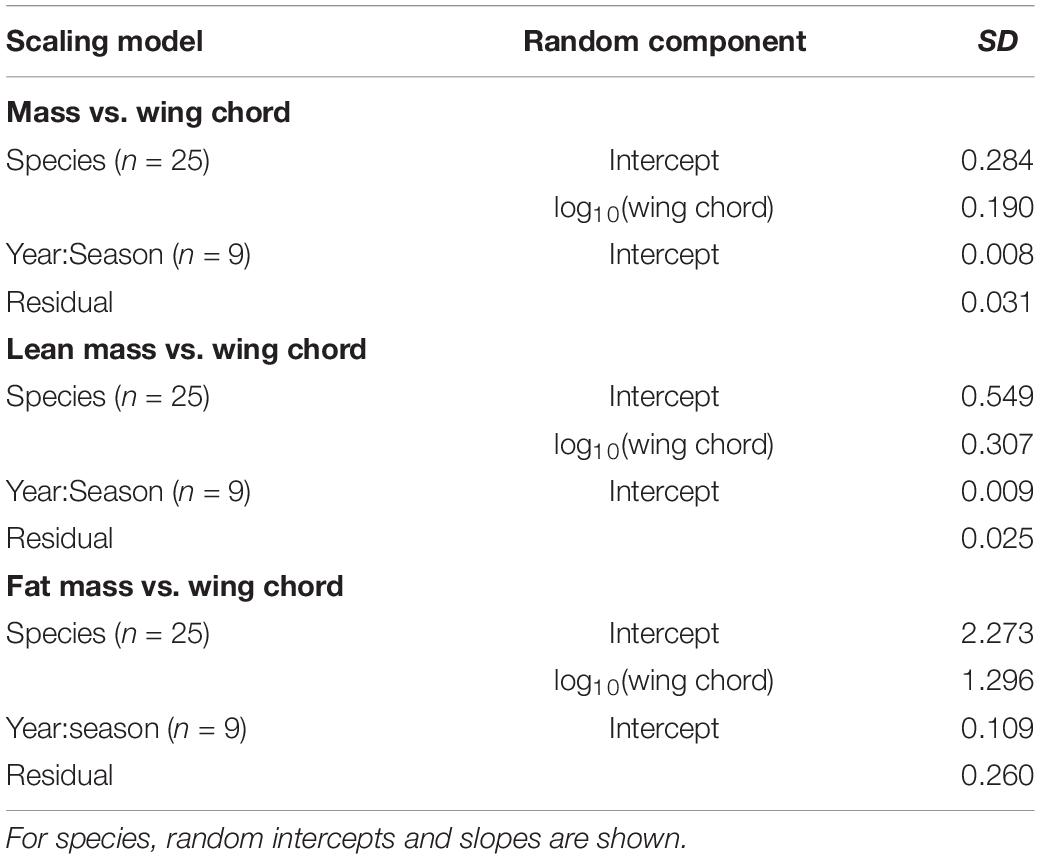
Table 2. Random effects in scaling relationships with structural size for songbirds stopping over at Long Point, Ontario.
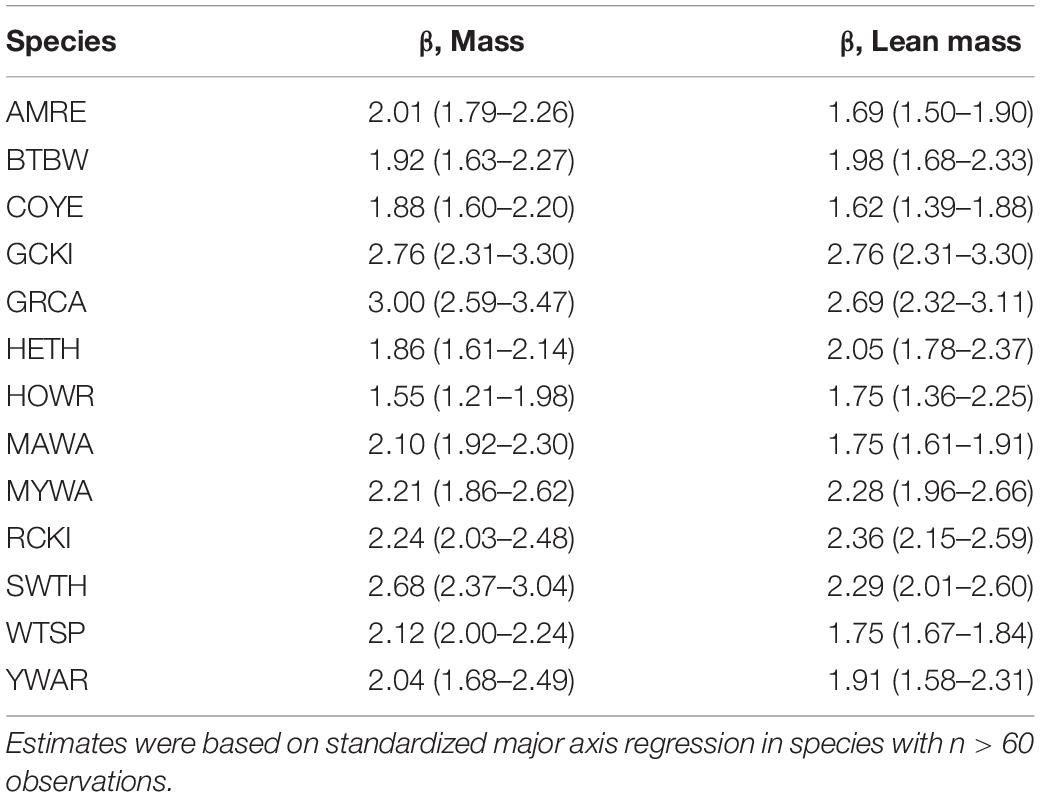
Table 3. Exponents (with 95% confidence interval) in body mass and lean mass scaling relationships with wing chord for songbirds stopping over at Long Point, Ontario.
Lean mass and wing chord were also strongly, positively correlated (R = 0.865, P < 0.0001, n = 3,549). In the analysis of lean mass scaling, there was strong evidence to support a random intercept and slope model over a random intercept only model (LRT: χ2 = 38.7, df = 2, P < 0.0001), and the random effects accounted for more of the variance (89.9%) than the fixed effect of wing chord (9.0%). Overall, the intraspecific lean mass scaling exponent was 0.878 (CI: 0.732, 1.035), which indicates hypoallometry with structural size (Figure 2B). Among the random effects, species effects contributed much more than year-season effects (Table 2). Among species, the random slope estimates varied independently of wing length (Supplementary Material). This suggests that log10-transformation effectively linearized the relationship between lean mass and wing chord. Overall, random slopes were subtle compared to the global intraspecific lean mass scaling coefficient. Among the 13 species with n > 60 observations, the mean SMA slope was 2.07; 11 of 13 species showed hypoallometry of lean mass with wing chord with SMA slopes < 3, and two species showed isometry with SMA slopes not different from 3.0 (Table 3).
Fat mass and wing chord were significantly positively correlated (R = 0.541, P < 0.0001, n = 3,549), but less so than for lean mass. In the analysis of fat mass scaling, there was evidence to support a random intercept and slope model over a random intercept only model (LRT: χ2 = 8.0, df = 2, P = 0.019). The random effects accounted for more of the variance (45.5%) than fixed effects (7.9%), but there was also substantial unexplained variation. Overall, the intraspecific fat mass scaling exponent was 1.311 (CI: 0.527, 2.137), which indicates an overall pattern of hypoallometry with structural size (Figure 2C). Among the random effects, species effects contributed more than year-season effects (Table 2). Among species, the random slope estimates increased with wing length, and more so when accounting for phylogeny (Supplementary Material). This suggests that log10-transformation did not completely linearize the relationship between fat mass and wing chord. However, random slopes were subtle compared to the global intraspecific fat mass scaling coefficient. SMA regression was not warranted, as fat mass was not functionally related to wing chord within species.
In the analysis of lean mass scaling with body mass, there was strong evidence to support a random intercept and slope model over a random intercept only model (LRT: χ2 = 51.4, df = 2, P < 0.0001). Random effects accounted for less of the variance (30.5%) than fixed effects (68.7%). Overall, the relationship between lean mass and the fixed effect of body mass was hypoallometric (Figure 3A), and slightly more hypoallometric in spring (β = 0.627) than in autumn (β = 0.658; difference in β = 0.032 [CI: 0.025, 0.038]). For a 20% increase in body mass, lean mass was predicted to increase by 12.1% in spring and 12.8% in autumn. In terms of absolute values, birds that differed by +1 g in body mass (from the species-specific median), were predicted to differ in lean mass by +0.260 to +0.646 g in spring (mean = +0.457 g) and +0.304 to 0.733 g in fall (mean = +0.495 g). Model predictions by season are shown for the 11 species that had sufficient spring and fall data (Figure 4A). The figure indicates the subtle difference in scaling between seasons and shows that birds generally had less lean mass at the same body mass in spring than in autumn. Among the random effects, species effects contributed much more than year-season effects (Table 4), and random slopes did not vary with mean body mass, with or without phylogenetic correction (Supplementary Material).
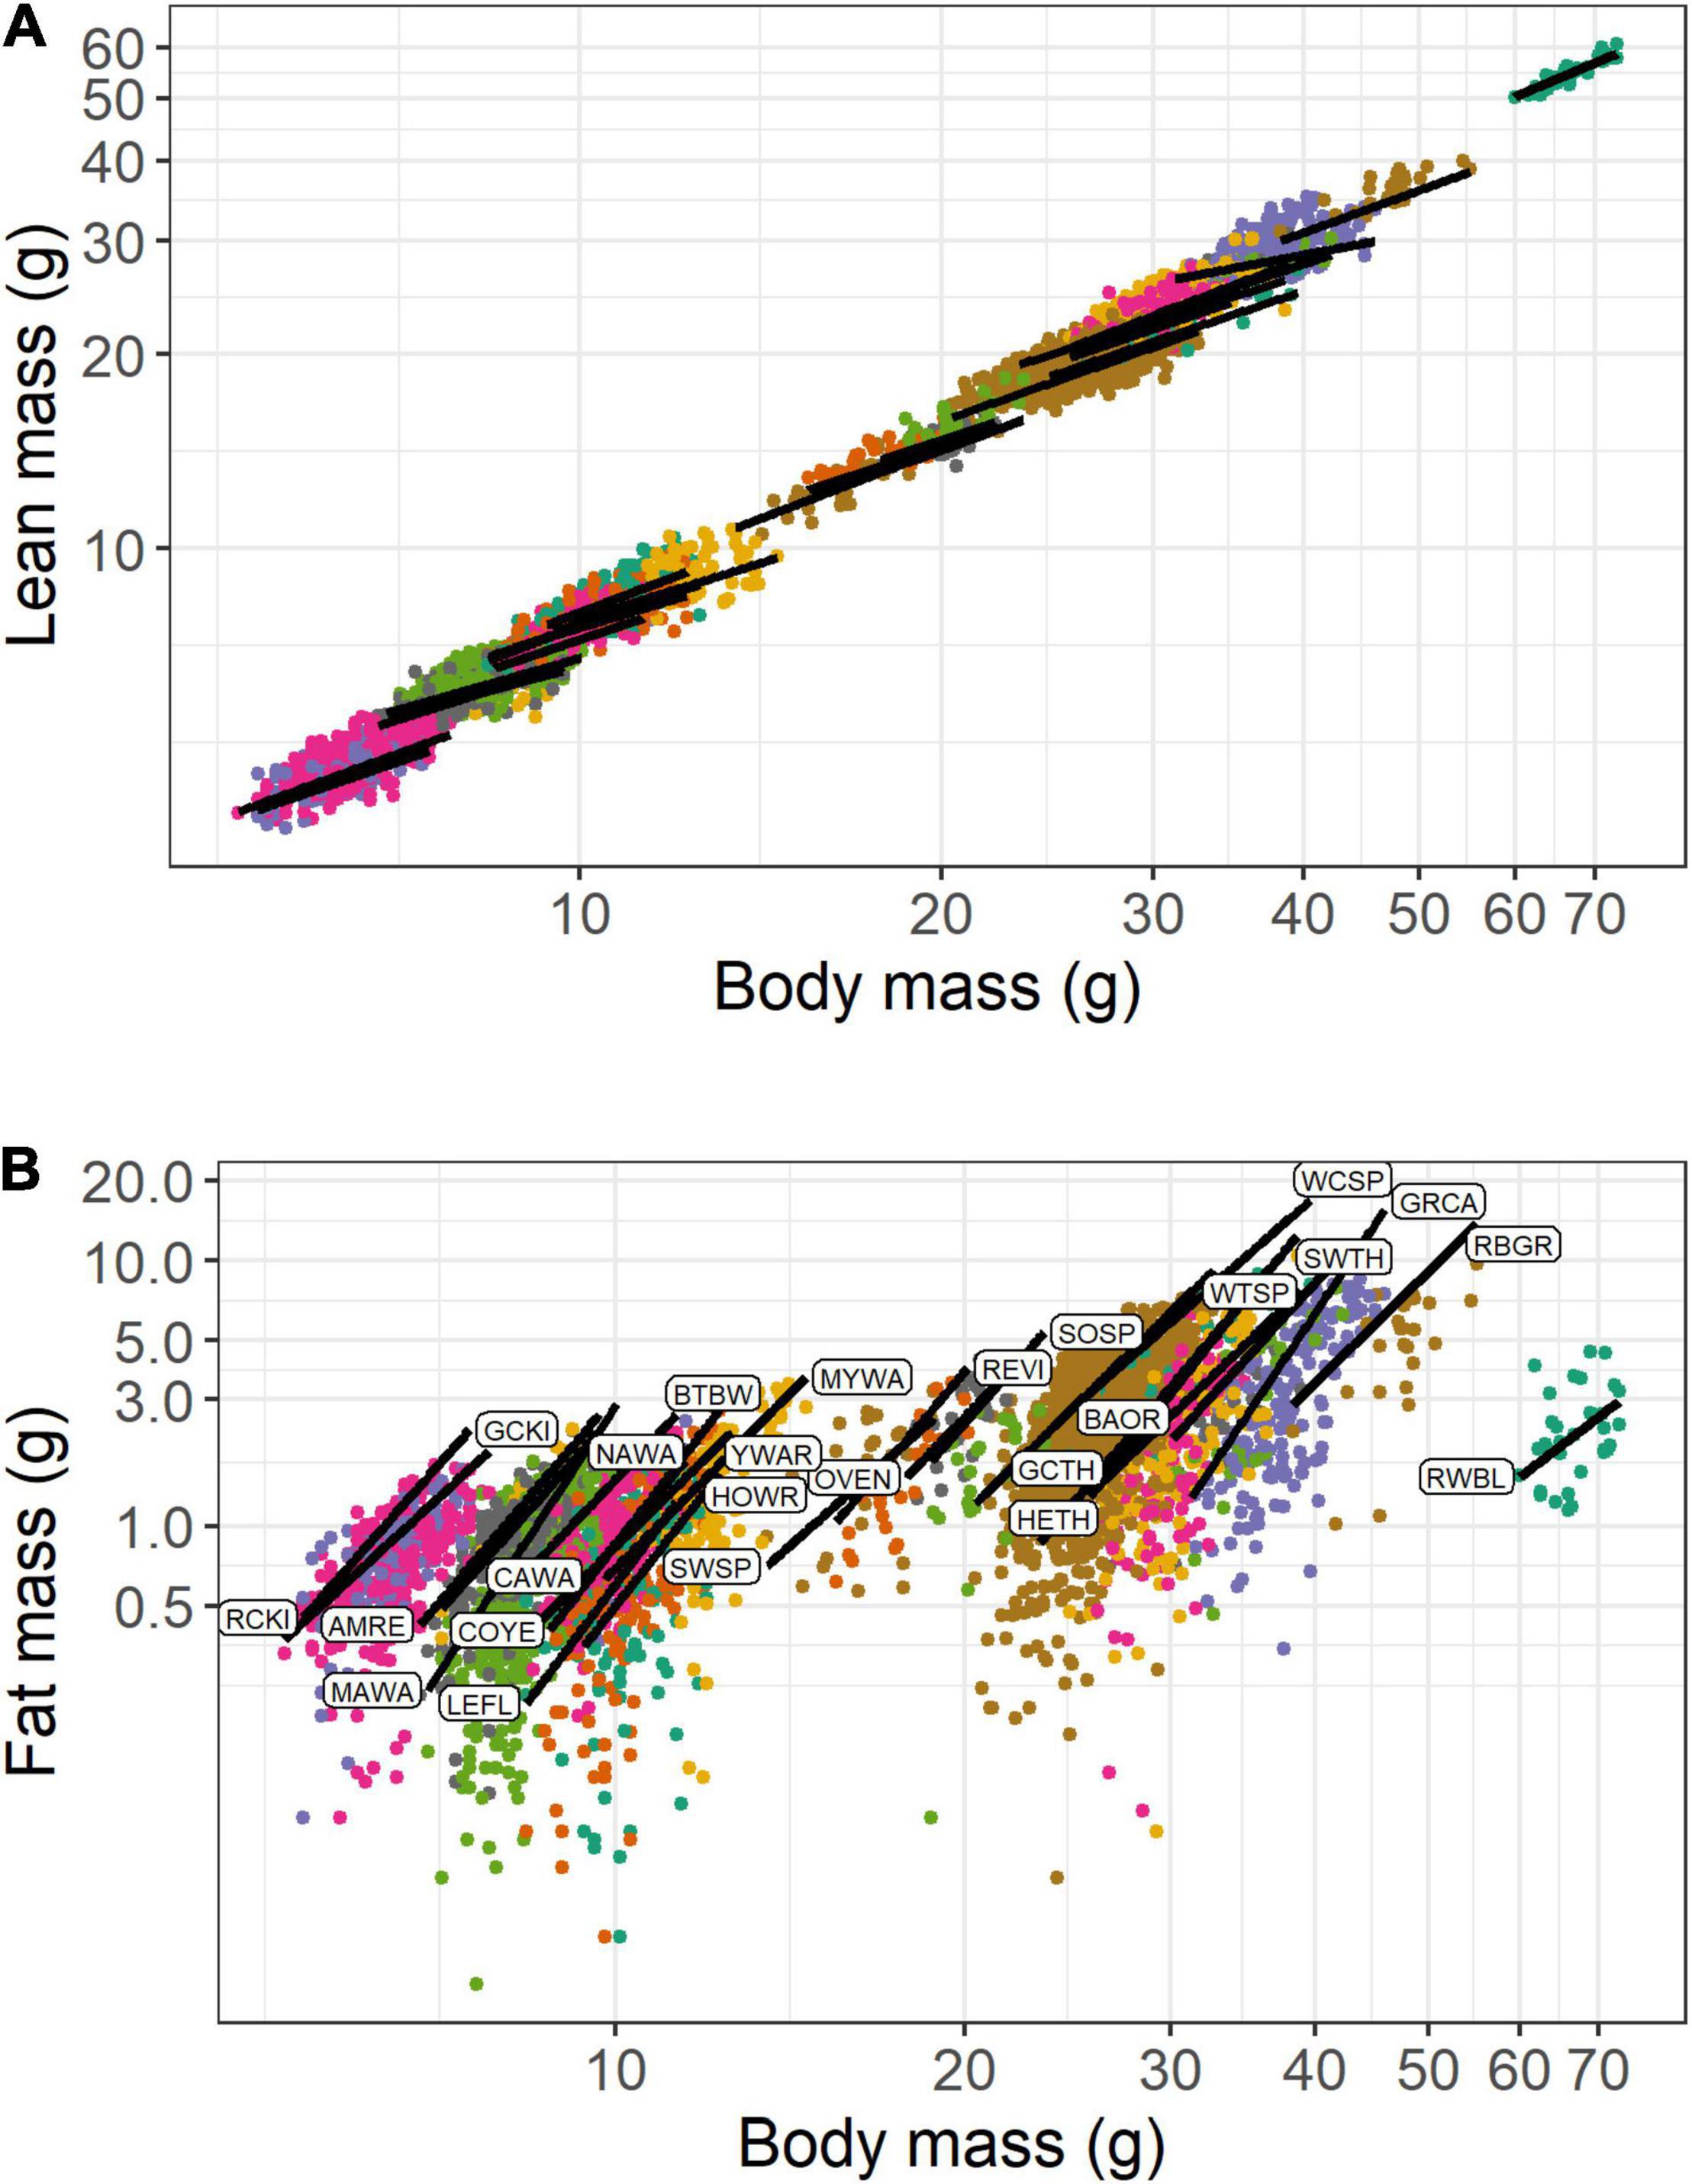
Figure 3. Scaling of lean mass (A) and fat mass (B) with body mass for 25 species of songbirds stopping over at Long Point, Ontario (n = 3,549). The lines show the linear mixed model predictions when year = 2009 and season = spring. Species codes are shown in panel B and defined in Table 1.
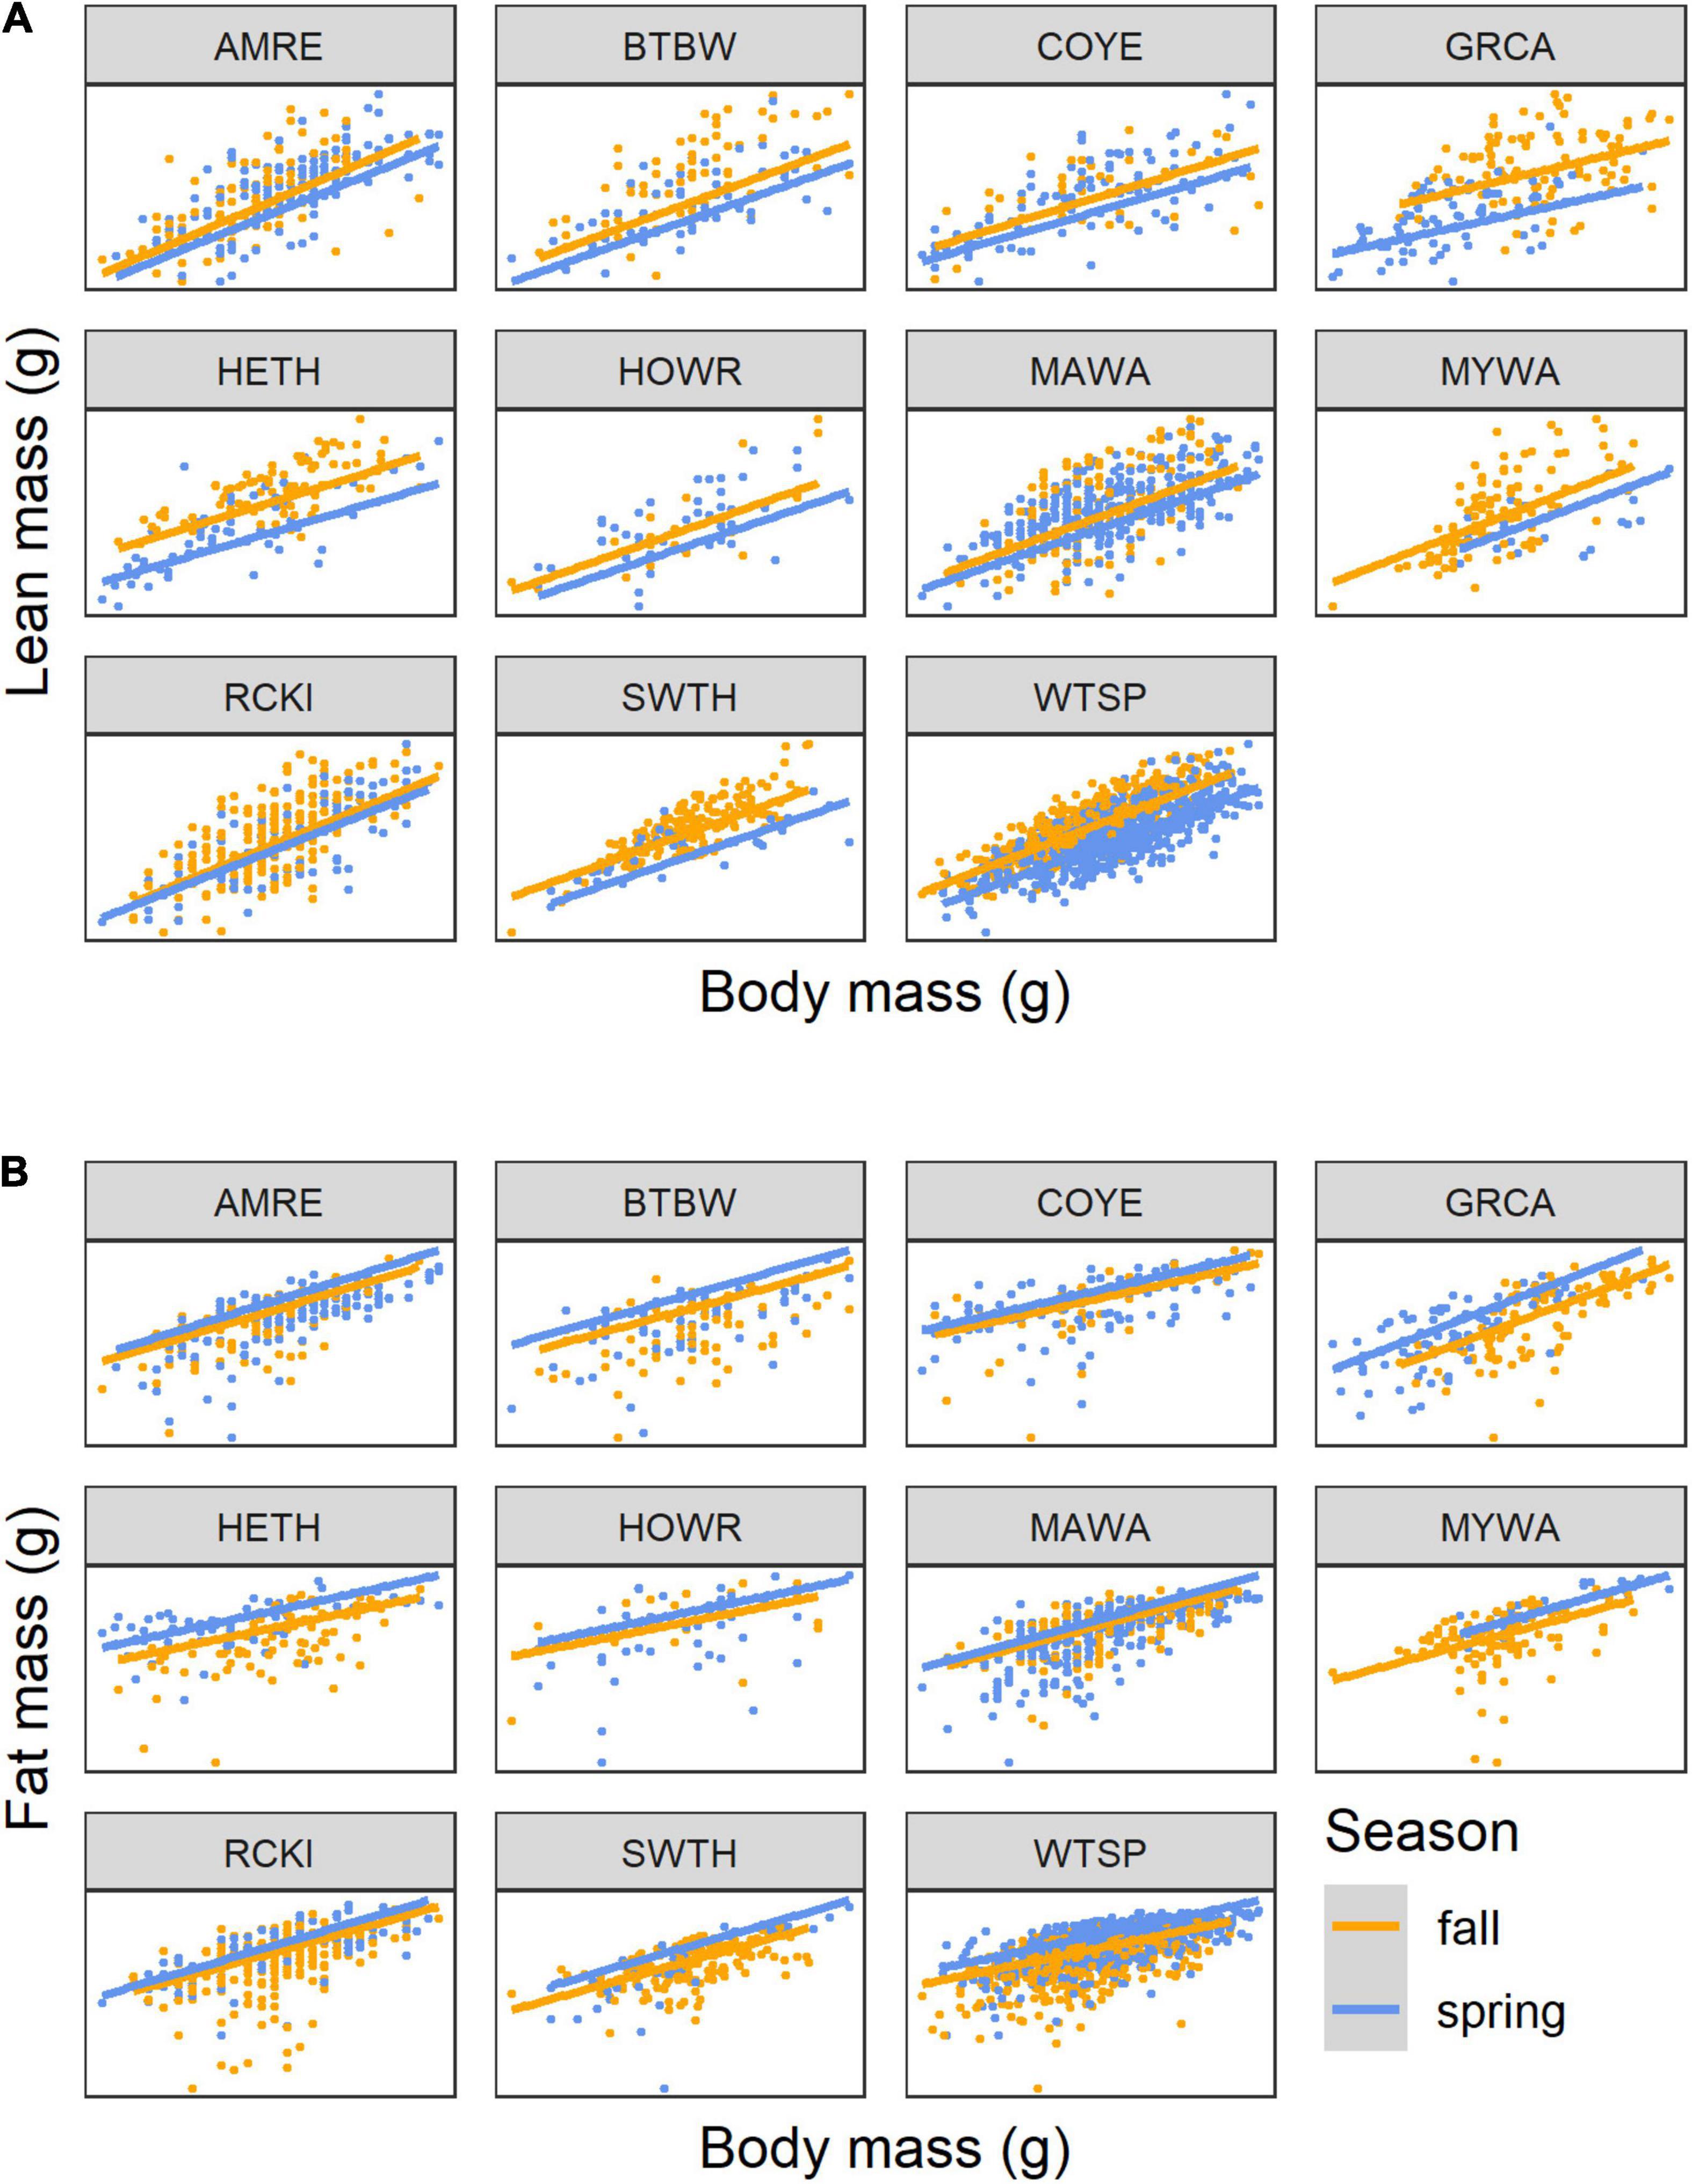
Figure 4. Scaling of lean mass (A) and fat mass (B) with body mass for 11 species of songbirds stopping over at Long Point, Ontario, highlighting differences between seasons. The lines show the linear mixed model predictions for spring (blue) and autumn (orange) when year = 2009. Ranges of masses can be cross-referenced with Figure 3. Species codes are defined in Table 1.
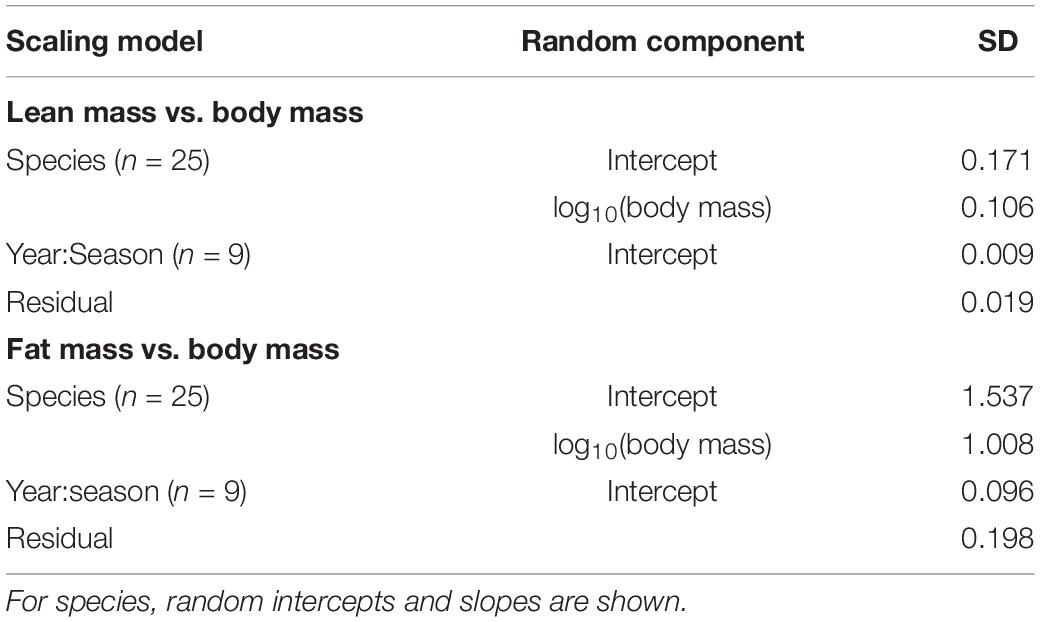
Table 4. Random effects in scaling relationships with body mass for songbirds stopping over at Long Point, Ontario.
In the analysis of fat mass scaling with body mass, there was strong evidence to support a random intercept and slope model over a random intercept only model (LRT: χ2 = 63.6, df = 2, P < 0.0001). Random effects accounted for less of the variance (43.0%) than fixed effects (55.7%). Overall, the relationship between fat mass and body mass was consistently hyperallometric (Figure 3B), and slightly more hyperallometric in spring (β = 4.89) than in autumn (β = 4.70; difference in β = 0.186 [CI: 0.120–0.252]). Model predictions by season are shown for the 11 species that had sufficient spring and autumn data (Figure 4B). The figure indicates the subtle difference in scaling between seasons and shows that birds generally had more fat mass at the same body mass in spring than in autumn. Among all birds, for a 20% increase in body mass, fat mass was predicted to increase by 144% in spring and 136% in autumn. Birds that differed by +1 g in body mass (from the median), differed in fat mass by +0.111 to +1.109 g (mean = +0.656 g) in spring and by +0.060 to +0.936 g (mean = +0.477) in autumn. Among the random effects, species effects contributed much more than year-season effects (Table 4), and random slopes did not vary with mean body mass, with or without phylogenetic correction (Supplementary Material).
The seasonal differences in body composition are unlikely to be caused by the autumn samples being sometimes dominated by juvenile birds (21–96%, median 84% juvenile) because age differences in body composition in autumn were very subtle (see below) compared to the seasonal differences. In addition, in the White-throated Sparrow where there were > 20 observations for adult birds in a spring and fall season of the same year (2009), the increase in lean mass in the spring was less steep than in the fall (β = –0.326, CI: –0.558, –0.095, df = 98, t = –2.80, P = 0.006), and overall lean mass was greater in the fall (β = 0.433, CI: 0.108, 0.758, df = 98, t = 2.64, P = 0.010). For fat, the relationship between log10(fat) and log10(mass) did not depend on season (t = 1.39, df = 98, P = 0.168), and after dropping the interaction, fat mass was greater in the spring than in the fall (β = 0.217, CI: 0.150, 0.283, t = 6.48, df = 99, P < 0.0001).
To illustrate the interaction between hypoallometry of lean mass and hyperallometry of fat, the effect of a broad range of mass change (–5 to +5 g) on predicted changes in lean mass and fat is shown for White-throated Sparrows (Figure 5). At low and intermediate masses fat and lean mass are deposited in nearly equal amounts, and at high body masses fat deposition exceeds lean mass deposition.
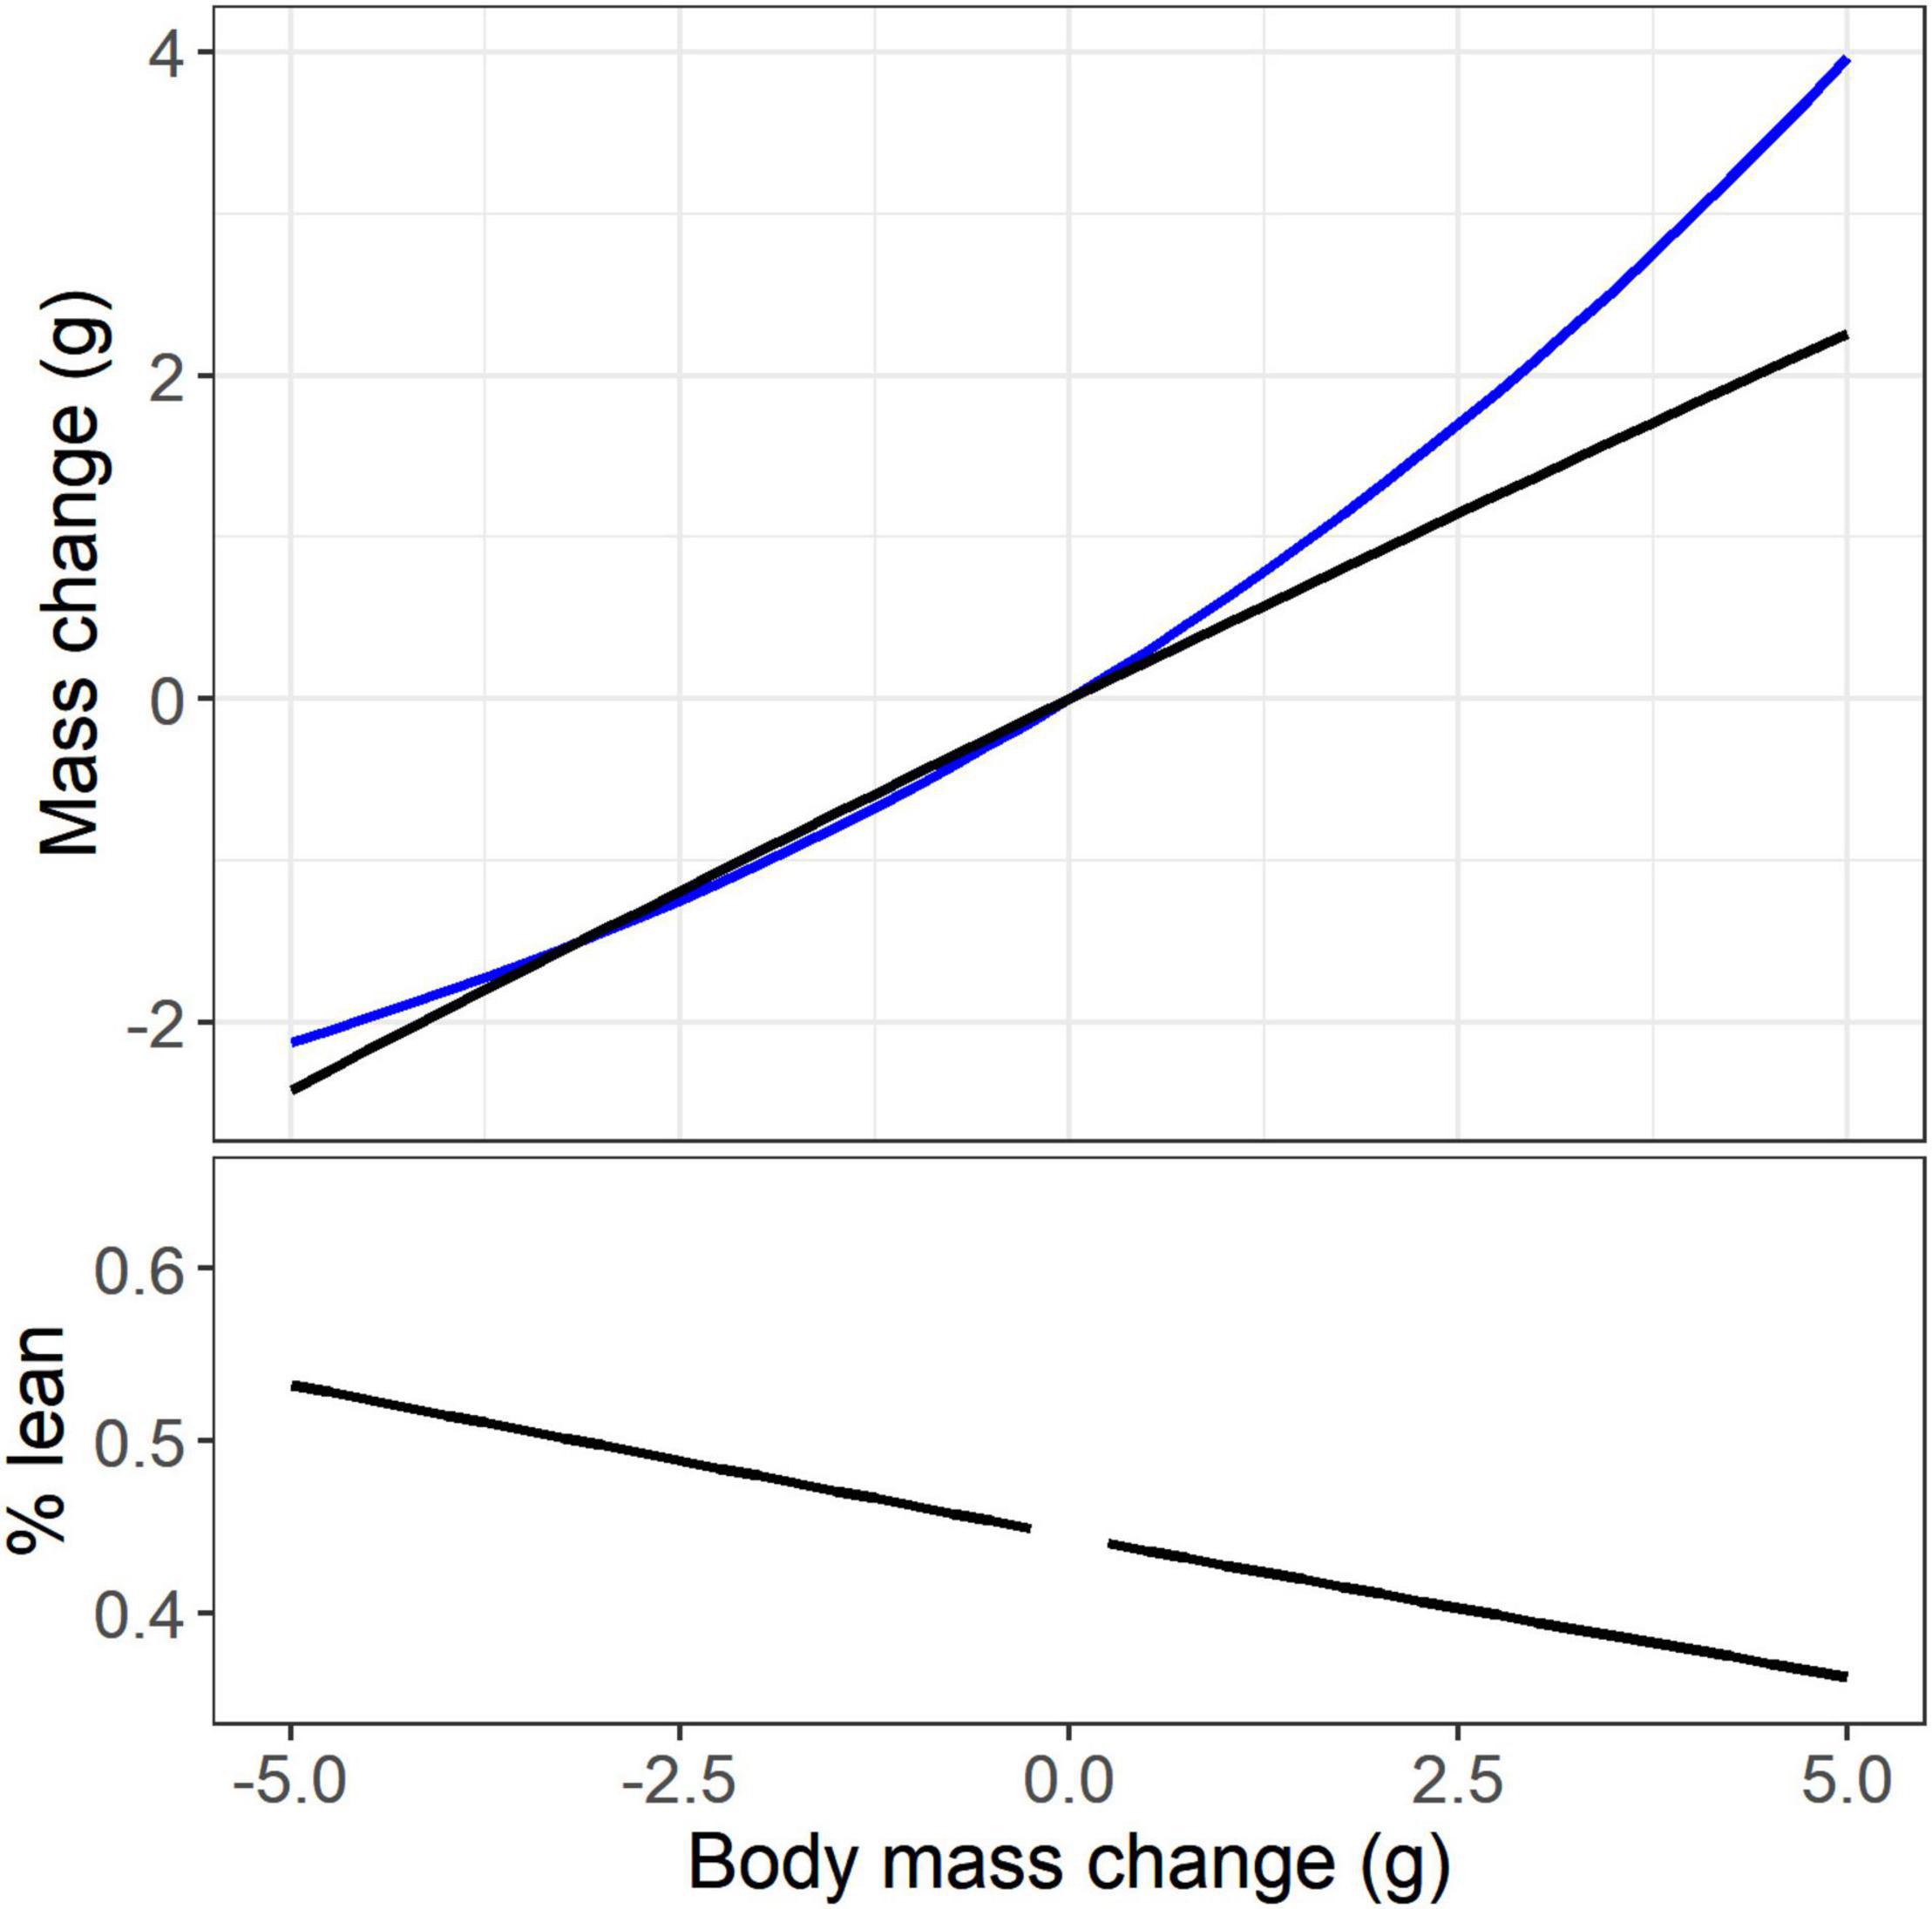
Figure 5. The interaction between the predicted hyperallometry of fat mass change (blue line) and the predicted hypoallometry of lean mass change (black line) relative to body mass change for a White-throated Sparrow of median body mass. The % change of total mass that is lean mass is shown in the bottom panel. The observed range of body mass for White-throated Sparrow was 12.3 g.
Compared to the linear mixed models for scaling with body mass as a fixed effect, shown above, there was some weak evidence that breeding region improved model fit for lean mass (LRT: χ2 = 2.83, df = 1, P = 0.092) and fat mass (χ2 = 2.46, df = 1, P = 0.117), with Carolinian species predicted to have higher lean mass (+1.19 g) and higher fat mass (+0.20 g) than those species typically breeding further north. There was no evidence of any body mass-by-breeding region interaction. In addition, there was no evidence that migration distance improved model fit for lean mass (χ2 = 0.28, df = 3, P = 0.964) or fat mass (χ2 = 0.33, df = 3, P = 0.955).
Three species, Ruby-crowned Kinglet (Regulus calendula, adult = 37, juvenile = 181), Swainson’s Thrush (Catharus ustulatus, adult = 37, juvenile = 128) and White-throated Sparrow (adults = 51, juvenile = 155), had sufficient autumn data to fit linear mixed models with factors age and body mass, and random effects for species and years (2009 and 2019). In the analysis of lean mass, random intercepts for species were selected over random intercepts and slopes (LRT: χ2 = 0.49, df = 2, P = 0.784). Compared to this model, there was evidence to support the inclusion of age and the age-by-body mass interaction as fixed effects (χ2 = 7.24, df = 2, P = 0.027), and some support to retain the interaction over a model with main effects only (χ2 = 2.89, df = 1, P = 0.089). Overall, juveniles had slightly greater lean mass than adult birds, and the scaling relationship showed slightly greater hypoallometry of lean mass in adults (β = 0.729) than in juveniles (β = 0.740; difference in β = 0.011 [CI: –0.002, 0.024]; Figure 6). For a 20% increase in body mass, this corresponded to a predicted increase in lean mass of 14.2% in adults and 14.4% in juveniles. In the analysis of fat mass, random intercepts for species were selected over random intercepts and slopes (LRT: χ2 = 0.89, df = 2, P = 0.640). There was no evidence to support the inclusion of age class (χ2 = 0.23, df = 1, P = 0.636).
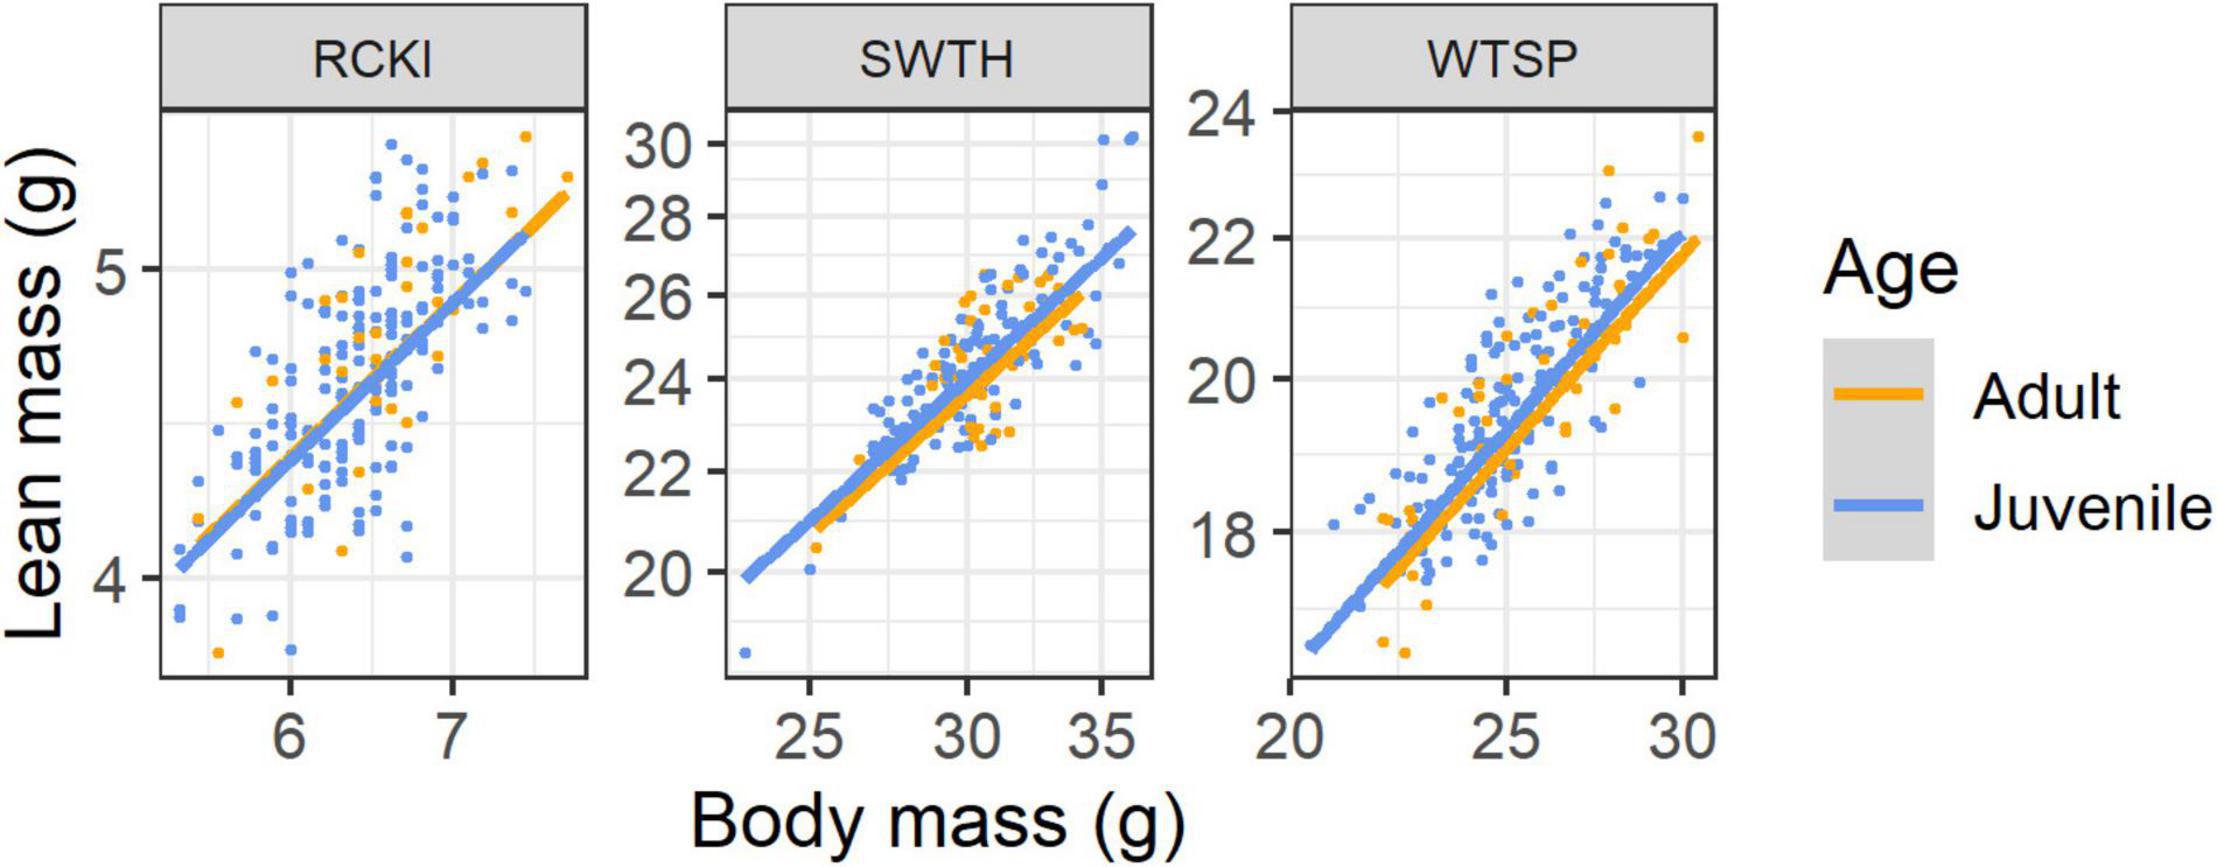
Figure 6. Scaling of lean mass with body mass for 3 species of songbirds stopping over at Long Point, Ontario, highlighting differences between age classes in autumn. The lines show the linear mixed model predictions for juvenile (blue) and adult (orange) birds when year = 2009. Species codes are defined in Table 1.
In recaptured individuals mass change varied from –5.1 to 4.6 g, with 9 (6%) birds having 0 mass change and 60 (41%) having positive mass change. During data exploration, an additional 3 influential values for percent fat or lean mass change were removed. In contrast to the expectation of linear relationships, which follows from the allometric relationships observed using cross-sectional data, the relationships between percent change in body mass components and percent change in mass were non-linear, and conformed to quadratic relationships [fat: F(2, 139) = 87.9, p < 0.0001, R2 = 0.56; lean: F(2, 139) = 112.2, P < 0.001, R2 = 0.62]. Thus, percent change in fat mass showed greater hyperallometry than seen for single scan analysis, with greater fat gain than expected for birds that gained a lot of mass. On the other hand, percent change in lean mass showed greater hypoallometry than expected from the single scan analysis, with less lean mass gain than expected for birds that gained a lot of mass (Figure 7). There was little evidence for the inclusion of season or species grouping (White-throated Sparrow vs. others) in these models (all P > 0.165).
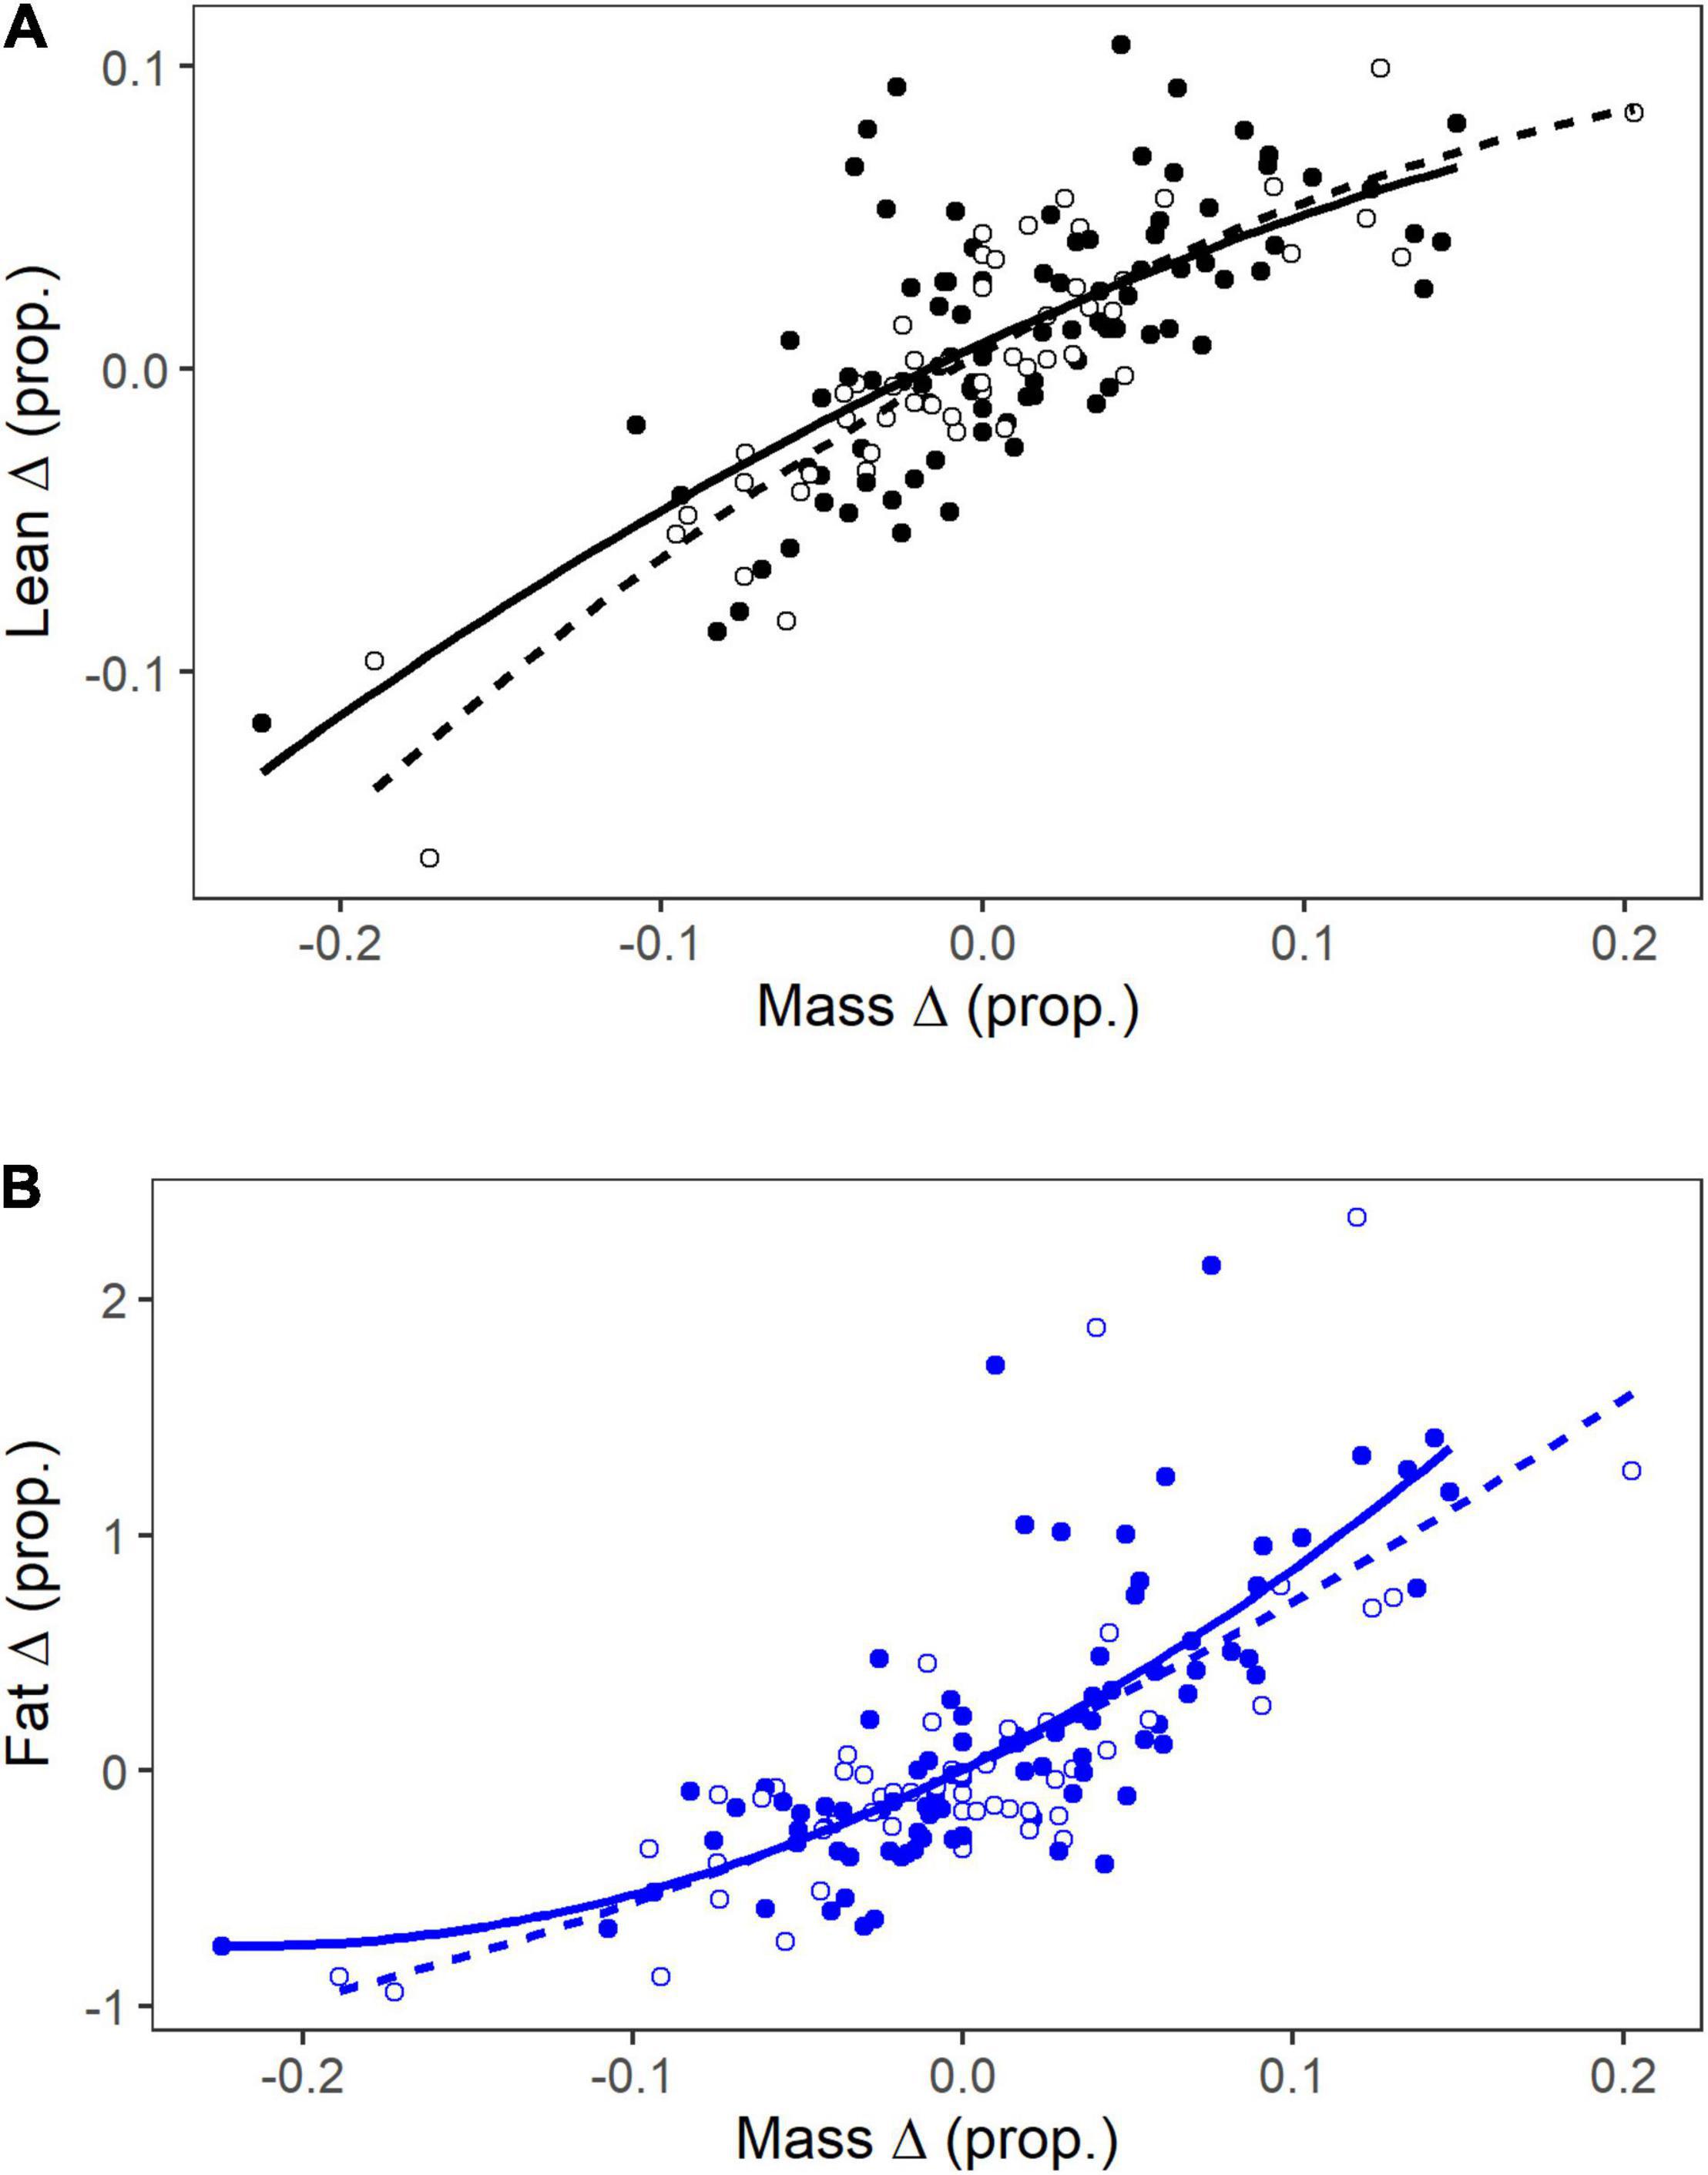
Figure 7. Proportional change in lean mass (A) and fat mass (B) in relation to proportional change in total mass for recaptured songbirds at Long Point, Ontario. Shown are the quadratic relationships for all birds omitting White-throated Sparrows (solid symbols and lines) and White-throated Sparrows alone (open symbols and dashed lines).
Using data for first captures and subsequent recaptures, median percent fat ranged from 3.2 to 15% among species. Predictive equations for fat (g) are shown in Supplementary Table 2. In a few species, collinearity resulted in wing chord or fat score being removed from the model. Among species, R2 values for these predictive equations ranged from 0.431 to 0.934. When using one-half of the dataset as a training dataset to predict fat values in the remaining data, predicted R2-values dropped to 0.068–0.844. In part, this reduction in fit could be due to small sample sizes for some species or variation attributable to year and season effects. The higher the R2 and predicted R2 values, the more generalizable the predictive equations will be to new data at the same site. These species are indicated in Supplementary Table 2.
Scaling analysis is an effective method to understand patterns of fat and lean mass deposition and loss using either cross-sectional or longitudinal data. We found that lean mass deposition is significant during stopover in songbirds, and of the magnitude predicted from the losses of lean mass in flight. We also found that the relative gains of fat increase as birds deposit fuel and become heavier, that migration distance and breeding region had minimal effects, and that there were effects of season and age on body composition dynamics. Non-invasive analysis of body composition, in this case by a portable QMR instrument, makes it possible to take measurements of large numbers of birds without harming them. This creates opportunities for novel studies and measurements of rare or at-risk species. Most importantly, QMR analysis allows for longitudinal studies of individuals as they change body mass and composition, as well as cross-sectional studies at the population level.
Body structural size, as indicated by wing chord, strongly affected total body mass and lean mass, but did not explain much variation in fat. This result is expected because lean mass makes up the majority of body mass, and because muscle masses and the sizes of organs that support them must increase with overall skeletal structure, while fat is an energy storage tissue that is quite dynamic and only weakly determined by structural size. Body mass was a stronger predictor of both lean and fat mass than was wing chord, as evidenced by the much larger proportion of variation explained by fixed effects than random effects in models where body mass was the independent variable. This indicates that structural morphology does not explain lean and fat mass as much as the total mass of tissue that a bird has. Random effects were always important, with species being much more influential than year-season. This shows that species varied in body components and how they scaled with size and mass, whereas variation due to sampling episode was less important.
Among individuals, lean and fat mass showed fundamentally different patterns of allometric scaling with body mass. The general pattern across species was that fat mass increased hyperallometrically with body mass, increasing by about 140% for every 20% increase in body mass. Lean mass, in contrast, showed hypoallometry and increased by only 12–13% for every 20% increase in mass. Within recaptured individuals, where body structural size is constant, the patterns of change in lean and fat mass resembled the population-level analysis, but showed greater hyperallometry of fat and greater hypoallometry of lean mass. This finding is reminiscent of the pattern described previously where population-level regression analyses may overestimate the deposition of lean mass and underestimate fat deposition due to the fact that some of the variation in lean mass is related to structural size (Lindström and Piersma, 1993; van der Meer and Piersma, 1994). However, on the whole, the individual level analysis supports the population-level results, and taken together they demonstrate that lean mass deposition is common and substantial (30–50% of mass change; Figure 5) when songbirds refuel at stopover. Lindström and Piersma (1993) estimated that lean mass deposition ranged from 2 to 60% of mass gain across a variety of shorebirds and waterfowl. Other studies report lean mass deposition of similar magnitude (Karasov and Pinshow, 1998; Guglielmo and Williams, 2003; Guglielmo et al., 2011; Seewagen and Guglielmo, 2011; Wojciechowski et al., 2014). Thus, our findings are congruent with previous observations and with first principles based on the rate of catabolism of lean mass in flight.
The intraspecific allometric scaling of lean mass and fat with body mass means that changes are multiplicative, and the amount of each body component that is deposited or lost with changing mass depends on the starting body mass. The hypoallometric scaling of lean mass with body mass indicates that increases in lean mass with increasing total mass will be steeper at low body masses and tend to plateau toward large body masses, similar to a breakpoint pattern. The strong hyperallometry of fat shows that small amounts of fat are deposited when body mass is low and fat deposition accelerates at high body masses, again producing a breakpoint-like pattern. These patterns may relate to birds needing to rebuild the gut and liver before rapid fat deposition can occur (Karasov and Pinshow, 2000; McWilliams and Karasov, 2001; Bauchinger et al., 2005), or to the functional benefits of additional muscles and organs plateauing while fat stores continue to increase to extend flight distance. If we had birds that reached extreme fat levels, such as at major ecological barriers, we may have in fact detected a plateau in lean mass at very high body masses (Carpenter et al., 1993; Wojciechowski et al., 2014), but songbirds refueling at Long Point generally carry modest fat loads.
Using recaptured birds measured longitudinally through time eliminates the confounding variation of body structural size, and so allows one to examine directly changes in lean mass and fat as individual birds refuel at stopover. However, recaptures are rare—145 of 3,549 birds in our study—and they may represent a biased sample of birds that remain at the stopover longer than randomly sampled individuals. Thus, recaptures could be low-quality birds or individuals that were stressed by initial capture. In fact, about half of our recaptured birds lost mass between captures, meaning that many in the sample had not been able to refuel. This provided an opportunity for us to fully model mass gain and loss, and we found very similar results as the analysis of the larger population-level, single-capture dataset. Using single captures has the added benefits of larger sample sizes of more species, and it can be used to test for effects of important covariates, such as season, age, and migration distance.
Seasonal differences in body composition and its dynamics were subtle but likely to be biologically important. Previous studies have reported larger fat loads in songbirds during spring migration (Seewagen and Slayton, 2008; Schmaljohann et al., 2018), including at Long Point (Kennedy, 2012). In our study, at the same body mass, spring birds were fatter and showed greater hyperallometry of fat than migrants in the autumn. Greater fat loads in spring may be adaptive by providing birds more energy to cope with colder and more variable weather during migration, which can be a factor limiting migration timing and success (Drake et al., 2014), or as insurance against unpredictable food supply at the breeding destination (Sandberg and Moore, 1996; Drent, 2006). An analysis of 48 species over 17 years showed that refueling conditions at Long Point are poorer in the spring than in autumn (Dunn, 2001). Spring migrants under time constraints to reach the breeding areas also may prioritize fat storage to support longer flights (Dierschke et al., 2005), or may be following a general policy whereby they depart stopover sites with greater fuel loads (Hedenström and Alerstam, 1997). While the autumn samples were often dominated by juveniles, it appears that the seasonal differences were robust as they were larger than the age differences we detected and were apparent when only adults were compared between seasons in the White-throated Sparrow. The greater relative lean mass deposition of autumn migrants suggests that they may have greater dietary protein requirements than spring migrants, despite the former’s tendency toward greater frugivory (Parrish, 1997). Thus, invertebrates and other high protein foods are likely to be important for refueling migrant songbirds in both spring and autumn. Focused physiological studies are needed to explore whether there are seasonal differences in the metabolism and routing of nutrients to fat and lean mass.
Although the magnitude of the effect was small, juvenile Swainson’s Thrushes and White-throated Sparrows tended to have greater lean mass and to deposit relatively more lean mass than adults. There was no age effect in the much smaller Ruby-crowned Kinglet. This finding supports the results of McCabe and Guglielmo (2019) who found using salvaged carcasses that juvenile songbirds of three of four species studied (including Swainson’s Thrush and White-throated Sparrow) had 8–9% greater lean mass than adults. More noticeable was that in all four species studied, juveniles allocated more of their lean mass to digestive organs than adults, and enlarged digestive systems have been reported in juveniles of other birds (Hume and Biebach, 1996; Guglielmo and Williams, 2003). The gut and associated organs like the liver have much greater metabolic turnover than other lean tissues (e.g., muscle; Bauchinger and McWilliams, 2009), and young animals that are still growing and maturing generally have greater rates of protein turnover than adults (Yousef and Johnson, 1970). Juvenile White-throated Sparrows and Swainson’s Thrushes had higher basal metabolic rates than adults, which may reflect the added metabolic costs of these active tissues (McCabe and Guglielmo, 2019), and they converted less ingested energy into stores. In our study, QMR allowed us to detect a slight difference in total lean mass, but not to measure how lean mass was allocated within birds, which would require magnetic resonance imaging (MRI) or other imaging technologies (ultrasound or micro-CT). If juvenile songbirds have more lean mass that turns over more rapidly, then they may require greater protein intake during refueling than adults. More studies are needed on songbird protein requirements (Langlois and McWilliams, 2010), protein turnover, lean mass flexibility, and its energetic costs in juvenile songbirds.
The species-specific predictive equations for fat mass (fat mass ∼ body mass + wing chord + fat score) can be applied when QMR data is not available, but the accuracy of these predictions will depend on several factors. Accuracy will be maximized when using predictive equations with high R2-values, and when the covariance structure among wing chord, body mass, and fat score are the same (Dormann et al., 2013). Thus, the predictive equations will be most applicable when applied to the same site as we used. For example, it should now be possible to evaluate annual trends in predicted fat using long-term migration monitoring datasets from Long Point Bird Observatory or nearby stations. When applying these predictive equations in a different context, care should be taken to evaluate the covariance structure of the variables and to ensure variables (e.g., fat score) are measured in a consistent way. Ideally, QMR could be used to develop predictive equations at other banding sites based on training datasets.
Scaling analysis has been a standard method used by comparative physiologists and morphologists for many decades to describe how body components and other traits vary with body size (Schmidt-Nielsen, 1984). Many previous studies of fuel deposition in migratory birds have used various regression methods on raw fat and lean mass data, yet we should expect body composition changes to be non-linear. Our study shows how the allometric scaling of lean and fat mass can be analyzed in a straightforward manner using log10 transformation and linear mixed-effects models to allow for random effects and test important covariates of interest. The allometric slopes (ß) are very intuitive to understand and nicely describe the multiplicative nature of changes in lean mass and fat as total body mass changes. Regarding breakpoints that may exists at the extremes of body mass, these could still be explored in scaling analysis. But for migrant songbirds refueling at a typical stopover, and not facing or arriving after a major ecological barrier, standard allometric scaling analysis will adequately describe the dynamics of fat and lean mass. When combined with non-invasive technologies to measure body composition, such as QMR, this approach should facilitate a wide variety of new studies.
The raw data supporting the conclusions of this article will be made available by the authors, without undue reservation.
The animal study was reviewed and approved by the University of Western Ontario Animal Care Committee.
CG co-designed all of the studies which provided data, co-wrote the manuscript, and assisted with data analysis. YM co-designed several of the studies which provided data, reanalyzed all the data, and co-wrote the manuscript. LK helped design the initial study in 2009, analyzed the data, contributed sections to the manuscript, and edited the manuscript. JD, JB, and AB contributed data to the study and edited the manuscript. All authors contributed to the article and approved the submitted version.
Funding for this study was provided by grants to CG from the Natural Sciences and Engineering Research Council of Canada (05245-2015 RGPIN), the Canada Foundation for Innovation (11743), an Ontario Early Researcher Award, and the Ontario Research Fund. Funding was provided to YM from the Natural Sciences and Engineering Research Council of Canada (05361-2015 RGPIN).
The authors declare that the research was conducted in the absence of any commercial or financial relationships that could be construed as a potential conflict of interest.
All claims expressed in this article are solely those of the authors and do not necessarily represent those of their affiliated organizations, or those of the publisher, the editors and the reviewers. Any product that may be evaluated in this article, or claim that may be made by its manufacturer, is not guaranteed or endorsed by the publisher.
We thank the Stuart MacKenzie of Birds Canada for facilitating our studies at the Long Point Bird Observatory for many years. We are grateful to volunteers and staff of the observatory for their assistance with bird capture and data collection. We thank Brendan J. McCabe, Taylor Brown, Jacopo Cecere, Alexander Macmillan, Ivan Maggini, Taylor Marshall, Alain Parada, Sarah Bonnett, Lauren Negrazis, Brittany Cooke, and David Burgess for assistance in the field.
The Supplementary Material for this article can be found online at: https://www.frontiersin.org/articles/10.3389/fevo.2022.787623/full#supplementary-material
Barton, K. (2020). MuMIn: Multi-Model Inference. R package version 1.43.17. Available online at: https://CRAN.R-project.org/package=MuMIn (accessed April 15, 2020).
Bates, D., Mächler, M., Bolker, B., and Walker, S. (2015). Fitting linear mixed-effects models using lme4. J. Stat. Softw. 67, 1–48. doi: 10.18637/jss.v067.i01
Battley, P. F., Piersma, T., Dietz, M. W., Tang, S., Dekinga, A., and Hulsman, K. (2000). Empirical evidence for differential organ reductions during trans-oceanic bird flight. Proc. R. Soc. Lond. B 267, 191–195. doi: 10.1098/rspb.2000.0986
Bauchinger, U., and Biebach, H. (1998). The role of protein during migration in passerine birds. Biol. Conserv. Della Fauna 102, 299–305.
Bauchinger, U., and McWilliams, S. R. (2009). Carbon turnover in tissues of a passerine bird: allometry, isotopic clocks, and phenotypic flexibility in organ size. Physiol. Biochem. Zool. 82, 787–797. doi: 10.1086/605548
Bauchinger, U., Wohlmann, A., and Biebach, H. (2005). Flexible remodeling of organ size during spring migration of the garden warbler (Sylvia borin). Zoology 108, 97–106. doi: 10.1016/j.zool.2005.03.003
Beauchamp, A. T., Guglielmo, C. G., and Morbey, Y. E. (2020). Stopover refueling, movement, and departure decisions in the white-throated sparrow: the influence of intrinsic and extrinsic factors during spring migration. J. Anim. Ecol. 89, 2553–2566. doi: 10.1111/1365-2656.13315
Biebach, H. (1998). Phenotypic organ flexibility in Garden Warblers Sylvia borin during long-distance migration. J. Avian Biol. 29, 529–535. doi: 10.2307/3677172
Billerman, S. M., Keeney, B. K., Rodewald, G., and Schulenberg, T. S. (eds) (2020). Birds of the World. Ithaca, NY: Cornell Laboratory of Ornithology. doi: 10.2173/bow
Brown, J. M., McCabe, B. J., Kennedy, L. V., and Guglielmo, C. G. (2014). Genetically-based behavioural morph affects stopover refuelling performance in white-throated sparrows (Zonotrichia albicollis). J. Avian Biol. 45, 522–527. doi: 10.1111/jav.00334
Cadman, M. D., Sutherland, D. A., Beck, G. G., Lepage, D., and Couturier, A. R. (eds) (2007). Atlas of the Breeding Birds of Ontario, 2001-2005. Toronto, ON: Bird Studies Canada.
Carpenter, F. L., Hixon, M. A., Beuchat, C. A., Russell, R. W., and Paton, D. C. (1993). Biphasic mass gain in migrant hummingbirds: body composition changes, torpor, and ecological significance. Ecology 74, 1173–1182. doi: 10.2307/1940487
Connell, C. E., Odum, E. P., and Kale, H. (1960). Fat-free weights of birds. Auk 77, 1–9. doi: 10.2307/4082380
Dick, M. F., and Guglielmo, C. G. (2019). Dietary polyunsaturated fatty acids influence flight muscle oxidative capacity, but not endurance flight performance in a migratory songbird. Am. J. Physiol. Regul. Comp. Integr. Physiol. 316, R362–R375. doi: 10.1152/ajpregu.00206.2018
Dierschke, V., Mendel, B., and Schmaljohann, H. (2005). Differential timing of spring migration in northern wheatears Oenanthe oenanthe: hurried males or weak females? Behav. Ecol. Sociobiol. 57, 470–480. doi: 10.1007/s00265-004-0872-8
Dormann, C. F., Elith, J., Bacher, S., Buchmann, C., Carl, G., Carré, G., et al. (2013). Collinearity: a review of methods to deal with it and a simulation study evaluating their performance. Ecography 36, 27–46. doi: 10.1111/j.1600-0587.2012.07348.x
Drake, A., Rock, C. A., Quinlan, S. P., Martin, M., and Green, D. J. (2014). Wind speed during migration influences the survival, timing of breeding, and productivity of a Neotropical migrant, Setophaga petechia. PLoS One 9:e97152. doi: 10.1371/journal.pone.0097152
Drent, R. H. (2006). The timing of birds’ breeding seasons: the Perrins hypothesis revisited especially for migrants. Ardea 94, 305–322.
Dunn, E. H. (2001). Mass change during migration stopover: a comparison of species, groups and sites. J. Field Ornithol. 72, 419–432. doi: 10.1648/0273-8570-72.3.419
Ellis, H. I., and Jehl, J. R. (1991). Total body water and body composition in phalaropes and other birds. Physiol. Zool. 64, 973–984. doi: 10.1086/physzool.64.4.30157952
Friedman, J., Hastie, T., and Tibshirani, R. (2010). Regularization paths for generalized linear models via coordinate descent. J. Stat. Soft. 33, 1–22. doi: 10.18637/jss.v033.i01
Gannes, L. Z. (2001). Comparative fuel use of migrating passerines: effects of fat stores, migration distance, and diet. Auk 118, 665–677. doi: 10.1093/auk/118.3.665
Gerson, A. R., and Guglielmo, C. G. (2011). Endurance flight at low ambient humidity increases protein catabolism in migratory birds. Science 333, 1434–1436. doi: 10.1126/science.1210449
Groom, D. J. E., Deakin, J. E., Lauzau, M. C., and Gerson, A. R. (2019). The role of humidity and metabolic status on lean mass catabolism in migratory Swainson’s thrushes (Catharus ustulatus). Proc. R. Soc. Lond. B 286:20190859. doi: 10.1098/rspb.2019.0859
Guglielmo, C. G., and Williams, T. D. (2003). Phenotypic flexibility of body composition in relation to migratory state, age, and sex in the western sandpiper (Calidris mauri). Physiol. Biochem. Zool. 76, 84–98. doi: 10.1086/367942
Guglielmo, C. G., Gerson, A. R., Price, E. R., and Hays, Q. R. (2017). The effects of dietary macronutrients on flight ability, energetics, and fuel metabolism of yellow-rumped warblers Setophaga coronata. J. Avian Biol. 48, 133–148. doi: 10.1111/jav.01351
Guglielmo, C. G., McGuire, L. P., Gerson, A. R., and Seewagen, C. L. (2011). Simple, rapid, and non-invasive measurement of fat, lean, and total water masses of live birds using quantitative magnetic resonance. J. Ornithol. 152, 75–85. doi: 10.1007/s10336-011-0724-z
Hector, A. (2015). The New Statistics With R: An Introduction for Biologists. Oxford: Oxford University Press. doi: 10.1093/acprof:oso/9780198729051.001.0001
Hedenström, A., and Alerstam, T. (1997). Optimum fuel loads in migratory birds: distinguishing between time and energy minimization. J. Theor. Biol. 189, 227–234. doi: 10.1006/jtbi.1997.0505
Heise, C. D., and Moore, F. R. (2003). Age-related differences in foraging efficiency, molt, and fat deposition of gray catbirds prior to autumn migration. Condor 105, 496–504. doi: 10.1093/condor/105.3.496
Hua, N., Piersma, T., and Ma, Z. (2013). Three-phase fuel deposition in a long-distance migrant, the red knot (Calidris canutus piersmai), before the flight to high arctic breeding grounds. PLoS One 8:e62551. doi: 10.1371/journal.pone.0062551
Hume, I. D., and Biebach, H. (1996). Digestive tract function in the long-distance migratory garden warbler, Sylvia borin. J. Comp. Physiol. B 166, 388–395. doi: 10.1007/BF02336922
Jenni, L., and Jenni-Eiermann, S. (1998). Fuel supply and metabolic constraints in migrating birds. J. Avian Biol. 29, 521–528. doi: 10.2307/3677171
Jenni-Eiermann, S., Kvist, A., Lindström, Å, Jenni, L., and Piersma, T. (2002). Fuel use and metabolic response to endurance exercise: a windtunnel study of a long-distance migrant shorebird. J. Exp. Biol. 205, 2453–2460. doi: 10.1242/jeb.205.16.2453
Karasov, W. H., and Pinshow, B. (1998). Changes in lean mass and in organs of nutrient assimilation in a long-distance passerine migrant at a springtime stopover site. Physiol. Zool. 71, 435–448. doi: 10.1086/515428
Karasov, W. H., and Pinshow, B. (2000). Test for physiological limitation to nutrient assimilation in a long-distance passerine migrant at a springtime stopover site. Physiol. Biochem. Zool. 73, 335–343. doi: 10.1086/316746
Kelsey, N. A., and Bairlein, F. (2019). Migratory body mass increase in Northern Wheatears (Oenanthe oenanthe) is the accumulation of fat as proven by quantitative magnetic resonance. J. Ornithol. 160, 389–397. doi: 10.1007/s10336-018-1621-5
Kelsey, N. A., Schmaljohann, H., and Bairlein, F. (2019). A handy way to estimate lean body mass and fuel load from wing length: a quantitative approach using magnetic resonance data. Ring. Migr. 34, 8–24. doi: 10.1080/03078698.2019.1759909
Kelsey, N. A., Schmaljohann, H., and Bairlein, F. (2021). The avian lightweights: trans-Saharan migrants show lower lean body mass than short-/medium-distance migrants. J. Evol. Biol. 34, 1010–1021. doi: 10.1111/jeb.13787
Kennedy, L. V. (2012). Dynamics of Fat and Lean Mass in Refuelling Migrant Passerines Measured Using Quantitative Magnetic Resonance. M.Sc. Thesis. London, ON: The University of Western Ontario.
Kennedy, L. V., Morbey, Y. E., Mackenzie, S. A., Taylor, P. D., and Guglielmo, C. G. (2016). A field test of the effects of body composition analysis by quantitative magnetic resonance on songbird stopover behaviour. J. Ornithol. 158, 593–601. doi: 10.1007/s10336-016-1399-2
Klaassen, M. (1996). Metabolic constraints on long-distance migration in birds. J. Exp. Biol. 199, 57–64. doi: 10.1242/jeb.199.1.57
Klaassen, M., Kvist, A., and Lindström, Å (2000). Flight costs and fuel composition of a bird migrating in a wind tunnel. Condor 102, 444–451. doi: 10.1093/condor/102.2.444
Klaassen, M., Lindström, Å, and Zijlstra, R. (1997). Composition of fuel stores and digestive limitations to fuel deposition rate in the long-distance migratory thrush nightingale, Luscinia luscinia. Physiol. Zool. 70, 125–133. doi: 10.1086/639556
Korine, C., Daniel, S., van Tets, I. G., Yosef, R., and Pinshow, B. (2004). Measuring fat mass in small birds by dual-energy x-ray absorptiometry. Physiol. Biochem. Zool. 77, 522–529. doi: 10.1086/383507
Langlois, L. A., and McWilliams, S. R. (2010). Protein requirements of an omnivorous and a granivorous songbird decrease during migration. Auk 127, 850–862. doi: 10.1525/auk.2010.10068
Le Mayo, Y., Vu Van Ka, H., Kuobi, H., Dewasmes, G., Girard, G., Ferré, J., et al. (1981). Body composition, energy expenditure, and plasma metabolites in long-term fasting geese. Am. J. Physiol. Endocrinol. Metab. 241, 342–354. doi: 10.1152/ajpendo.1981.241.5.E342
Lindström, Å, and Piersma, T. (1993). Mass changes in migrating birds: the evidence for fat and protein storage re-examined. Ibis 135, 70–78. doi: 10.1111/j.1474-919X.1993.tb02811.x
LPBO (2019). Long Point Bird Observatory: Migration Monitoring Protocol [Online]. Available online at: www.bsc-eoc.org/download/LPBOMigrationProtocol.pdf (accessed January 30, 2022).
McCabe, B. J., and Guglielmo, C. G. (2019). Migration takes extra guts for juvenile songbirds: energetics and digestive physiology during the first journey. Front. Ecol. Evol. 7:381. doi: 10.3389/fevo.2019.00381
McGuire, L. P., and Guglielmo, C. G. (2010). Quantitative magnetic resonance: a rapid, non-invasive body composition analysis technique for live and salvaged bats. J. Mammal. 91, 1375–1380. doi: 10.1644/10-MAMM-A-051.1
McKim-Louder, M. I., Hoover, J. P., Benson, T. J., and Schelsky, W. M. (2013). Juvenile survival in a neotropical migratory songbird is lower than expected. PLoS One 8:e56059. doi: 10.1371/journal.pone.0056059
McWilliams, S. R., and Karasov, W. H. (2001). Phenotypic flexibility in digestive system structure and function in migratory birds and its ecological significance. Comp. Biochem. Physiol. A 128, 579–593. doi: 10.1016/S1095-6433(00)00336-6
McWilliams, S. R., and Whitman, M. (2013). Non-destructive techniques to assess body composition of birds: a review and validation study. J. Ornithol. 154, 597–618. doi: 10.1007/s10336-013-0946-3
Mitchell, G. W., Guglielmo, C. G., and Hobson, K. A. (2015). Measurement of whole body CO2 production in birds using real-time laser-derived measurements of hydrogen (δ2H) and oxygen (δ18O) isotope concentrations in water vapor from breath. Physiol. Biochem. Zool. 88, 599–606. doi: 10.1086/683013
Morbey, Y. E., Guglielmo, C. G., Taylor, P. D., Maggini, I., Deakin, J. E., Mackenzie, S. A., et al. (2018). Evaluation of sex differences in the stopover behavior and postdeparture movements of wood-warblers. Behav. Ecol. 29, 117–127. doi: 10.1093/beheco/arx123
Nakagawa, M., and Schielzeth, H. (2013). A general and simple method for obtaining R2 from generalized linear mixed-effects models. Methods Ecol. Evol. 4, 133–142. doi: 10.1111/j.2041-210x.2012.00261.x
Odum, E. P., Rogers, D. T., and Hicks, D. L. (1964). Homeostasis of the nonfat components of migrating birds. Science 143, 1037–1039. doi: 10.1126/science.143.3610.1037
Parrish, J. D. (1997). Patterns of frugivory and energetic condition in Nearctic landbirds during autumn migration. Condor 99, 681–697. doi: 10.2307/1370480
Peig, J., and Green, A. J. (2009). New perspectives for estimating body condition from mass/length data: the scaled mass index as an alternative method. Oikos 118, 1883–1891. doi: 10.1111/j.1600-0706.2009.17643.x
Piersma, T., and Gill, R. E. J. (1998). Guts don’t fly: small digestive organs in obese bar-tailed godwits. Auk 115, 196–203. doi: 10.2307/4089124
Piersma, T., and Jukema, J. (1990). Budgeting the flight of a long-distance migrant: changes in nutrient reserve levels of bar-tailed godwits at successive spring staging sites. Ardea 78, 315–337. doi: 10.5253/arde.v78.p315
Piersma, T., Gudmundsson, G. A., and Lilliendahl, K. (1999). Rapid changes in the size of different functional organ and muscle groups during refueling in a long-distance migrating shorebird. Physiol. Biochem. Zool. 72, 405–415. doi: 10.1086/316680
Pyle, P. (1997). Identification Guide to North American Birds. Part 1. Bolinas, CA: Slate Creek Press.
R Core Team (2020). R: A Language and Environment for Statistical Computing. Vienna: R Foundation for Statistical Computing.
Salewski, V., Kery, M., Herremans, M., Liechti, F., and Jenni, L. (2009). Estimating fat and protein fuel from fat and muscle scores in passerines. Ibis 151, 640–653. doi: 10.1111/j.1474-919X.2009.00950.x
Sandberg, R., and Moore, F. R. (1996). Fat stores and arrival on the breeding grounds: reproductive consequences for passerine migrants. Oikos 77, 577–581. doi: 10.2307/3545949
Schmaljohann, H., Müller, F., Klinner, T., and Eikenaar, C. (2018). Potential age differences in the migratory behaviour of a nocturnal songbird migrant during autumn and spring. J. Avian Biol. 49:e01815. doi: 10.1111/jav.01815
Schmidt-Nielsen, K. (1984). Scaling: Why is Animal Size so Important?. New York, NY: Cambridge University Press. doi: 10.1017/CBO9781139167826
Schwilch, R., Grattarola, A., Spina, F., and Jenni, L. (2002). Protein loss during long-distance migratory flight in passerine birds: adaptation and constraint. J. Exp. Biol. 205, 687–695. doi: 10.1242/jeb.205.5.687
Seewagen, C. L., and Guglielmo, C. G. (2011). Quantitative magnetic resonance analysis and a morphometric predictive model reveal lean body mass changes in migrating Nearctic-Neotropical migrating passerines. J. Comp. Physiol. B 181, 413–421. doi: 10.1007/s00360-010-0534-2
Seewagen, C. L., and Slayton, E. J. (2008). Mass changes of migratory landbirds during stopovers in a New York city park. Wilsons J. Ornithol. 120, 296–303. doi: 10.1676/07-087.1
Sillet, T. S., and Holmes, R. T. (2002). Variation in survivorship of a migratory songbird throughout its annual cycle. J. Anim. Ecol. 71, 296–308. doi: 10.1046/j.1365-2656.2002.00599.x
Sol, D., Santos, D. M., Garcia, J., and Cuadrada, M. (1998). Competition for food in urban pigeons: the cost of being a juvenile. Condor 100, 298–304. doi: 10.2307/1370270
Swanson, D. L., Liknes, E. T., and Dean, K. L. (1999). Differences in migratory timing and energetic condition among sex/age classes in migrant ruby-crowned kinglets. Wilson Bull. 111, 61–69.
Taicher, G. Z., Tinsley, F. C., Reiderman, A., and Heiman, M. L. (2003). Quantitative magnetic resonance (QMR) method for bone and whole-body-composition analysis. Anal. Bioanal. Chem. 377, 990–1002. doi: 10.1007/s00216-003-2224-3
van der Meer, J., and Piersma, T. (1994). Physiologically inspired regression models for estimating and predicting nutrient stores and their composition in birds. Physiol. Zool. 67, 305–329. doi: 10.1086/physzool.67.2.30163851
Vanderhoff, N. E., and Eason, P. K. (2007). Disparity between adult and juvenile American Robins Turdus migratorius foraging for ground invertebrates and cherry fruits. Ethology 113, 1212–1218. doi: 10.1111/j.1439-0310.2007.01434.x
Warton, D. I., Wright, I. J., Falster, D. S., and Westoby, M. (2006). Bivariate line-fitting methods for allometry. Biol. Rev. 81, 259–291. doi: 10.1017/S1464793106007007
Wojciechowski, M. S., Yosef, R., and Pinshow, B. (2014). Body composition of north and southbound migratory blackcaps is influenced by the lay-of-the-land ahead. J. Avian Biol. 45, 264–272. doi: 10.1111/j.1600-048X.2013.00345.x
Yousef, M. K., and Johnson, H. D. (1970). Effects of heat, diet and hormones on total body protein turnover rate in young and old rats. Proc. Soc. Exp. Biol. Med. 135, 763–766. doi: 10.3181/00379727-135-35139
Keywords: body composition, allometry, migration, bird, energetics, nutrition
Citation: Guglielmo CG, Morbey YE, Kennedy LV, Deakin JE, Brown JM and Beauchamp AT (2022) A Scaling Approach to Understand the Dynamics of Fat and Lean Mass in Refueling Migrant Songbirds Measured by Quantitative Magnetic Resonance. Front. Ecol. Evol. 10:787623. doi: 10.3389/fevo.2022.787623
Received: 01 October 2021; Accepted: 21 January 2022;
Published: 16 February 2022.
Edited by:
Ivan Maggini, University of Veterinary Medicine Vienna, AustriaReviewed by:
Natalie Kelsey, Institute of Avian Research, GermanyCopyright © 2022 Guglielmo, Morbey, Kennedy, Deakin, Brown and Beauchamp. This is an open-access article distributed under the terms of the Creative Commons Attribution License (CC BY). The use, distribution or reproduction in other forums is permitted, provided the original author(s) and the copyright owner(s) are credited and that the original publication in this journal is cited, in accordance with accepted academic practice. No use, distribution or reproduction is permitted which does not comply with these terms.
*Correspondence: Christopher G. Guglielmo, Y2d1Z2xpZTJAdXdvLmNh
†These authors have contributed equally to this work and share first authorship
Disclaimer: All claims expressed in this article are solely those of the authors and do not necessarily represent those of their affiliated organizations, or those of the publisher, the editors and the reviewers. Any product that may be evaluated in this article or claim that may be made by its manufacturer is not guaranteed or endorsed by the publisher.
Research integrity at Frontiers
Learn more about the work of our research integrity team to safeguard the quality of each article we publish.