
95% of researchers rate our articles as excellent or good
Learn more about the work of our research integrity team to safeguard the quality of each article we publish.
Find out more
ORIGINAL RESEARCH article
Front. Ecol. Evol. , 27 January 2022
Sec. Paleoecology
Volume 10 - 2022 | https://doi.org/10.3389/fevo.2022.787345
This article is part of the Research Topic Past Interactions Between Climate, Land Use, and Vegetation View all 22 articles
Relative Pollen Productivity is an essential parameter for quantitative reconstruction of past land cover from pollen records, but published studies have produced a range of different values for the same taxa. Heathland habitats have limited plant diversity and strong spatial patterning, therefore are useful case studies to investigate aspects of pollen dispersal and deposition, but the estimated spatial area “sensed” by pollen records in these habitats also varies widely between studies. In this study, we estimate pollen productivity from two different microhabitats in a heathland ecosystem in order to investigate the role of local environmental conditions in any observed differences. Vegetation survey was carried out using the Crackles Bequest Project method, pollen assemblages from moss samples counted using standard methods, and relative pollen productivity and estimated source area derived using Extended R-Value analysis. Analysis of the data suggests that at least two pollen source areas exist at the sites studied, reflecting scales of landscape organisation. Microhabitat does not appear to have a marked effect on estimates of Relative Pollen Productivity in this heathland system. This study confirms earlier findings that the estimates obtained for some taxa from heathlands are substantially different than those from agricultural landscapes, especially Poaceae. The findings suggest that the factors controlling Relative Pollen Productivity are still not fully understood, and that differences between locations may reflect real, habitat-led differences. Further investigation of this parameter, which is central to reconstruction of past land cover from pollen records whether overtly incorporated via an algebraic model or less explicitly present via ecological narrative, biomisation or modern analog approaches, is clearly necessary.
Reconstruction of past land cover from pollen records is currently an important research area (e.g., Gaillard et al., 2008, 2010), since most research questions about past vegetation are concerned with land cover, not with pollen per se. The translation of pollen records into meaningful measures of past vegetation which can be compared with other data or models, or used to inform ecological understanding, conservation planning, or the context of archaeological sites is challenging since the relationship between pollen assemblages and the vegetation which produced the pollen grains is complex (e.g., Jackson, 1994; Bunting et al., 2013). One approach which is currently producing interesting results and growing in use is the model calibration approach, which uses an algebraic model of the relationship between pollen deposited at a point and vegetation surrounding that point. The model is first calibrated against a modern dataset where vegetation cover and pollen assemblages can be directly measured and compared, then the calibrated model is applied to pollen assemblages from the sedimentary archive to obtain quantitative reconstructions of properties of the unknown past vegetation cover (e.g., Sugita, 2007a,b; Middleton and Bunting, 2009). This approach assumes that the relationship between parent plant and pollen assemblage is constant for a given taxon across the geographic range of the taxon as well as over time, and therefore that modern calibration terms can be used for past situations.
Most work in this area has been built on the development of a simple linear model, the history of which is reviewed elsewhere (e.g., Gaillard et al., 2008). The current model takes the basic form:
where yik is the pollen influx of taxon i at point k in the landscape, αi is the pollen productivity of taxon i (usually expressed as a relative pollen productivity term rather than an absolute value), ψik is a measure of the abundance and distribution of plants producing pollen classed as taxon i in the landscape around site k within a specified distance often defined by the radius z (e.g., a distance weighted measure of abundance) and ωi is the background pollen influx of type i, that is, the regionally averaged pollen component originating from source plants growing beyond the specified distance, beyond radius z.
The model is calibrated using the Extended R-Value (ERV) method (Parsons and Prentice, 1981; Prentice and Parsons, 1983; see methods) against a modern dataset consisting of paired measurements of yik and ψik collected for a range of locations within a region; the distribution of these sampling points aims to capture a range of values of both yik and ψik, and can then be applied to reconstruct past land cover. This approach produces estimates of productivity expressed relative to a reference taxon, which are termed Relative Pollen Productivity (RPP) values (αi) in this paper. Other authors (e.g., Mazier et al., 2012) use the abbreviation PPE (pollen productivity estimate) to refer to the same output.
Biologically, the assumption that a single measure of RPP can be assigned to a taxon across its range is problematic. In many cases, pollen taxa can be sourced from multiple plant species or genera (e.g., Quercus pollen in the United Kingdom can originate from Quercus robur, Quercus petraea or various non-native ornamental species of oak, whilst Rubiaceae pollen can originate from several different Galium species or from Sherardia arvensis, and Poaceae pollen can come from most wild grass genera). Different taxonomic mixtures of source plants are known to have varying flowering frequencies, flower abundances and other aspects of reproductive biology, as well as growth height and architecture of the flower-bearing structures, therefore are likely to also have variations in pollen production and dispersal. Even within a single species, variations in resource allocation in response to environmental variation is expected to affect flowering—individual plants in stressful environments may flower more or less than individuals of the same genotype grown in less stressful conditions (May et al., 2017). The flowering of species also varies across the geographic range, with some plants showing substantial range in terms of the balance of reproductive strategies between sexual (pollen requiring) and asexual (e.g., vegetative, non-pollen requiring), and others showing reduced occurrence of flowering at range margin positions (e.g., Hicks, 2006; Kuoppamaa et al., 2009; Nielsen et al., 2010). All models are wrong, and this simplifying assumption of constant RPP is not entirely unjustified—the pollen signal reflects quite a wide spatial area, and is therefore likely to average the range of local habitats, and it is possible during vegetation survey to record flowering plants differently from non-flowering ones, especially where there are clear habitat differences (e.g., woodland versus open land) and through analysis of modern datasets identify which members of a palynological equivalent plant taxon group are typically contributing to the pollen signal and which are not.
Synthesis of multiple published sets of RPP values from broad biogeographic regions (e.g., north-west Europe, Mazier et al., 2012; extra-tropical China, Li et al., 2018) show considerable variation between studies, but used these data to recommend standardised sets of RPP values which are then applied throughout the region. The potential reasons for these variations are many. The range of data collection strategies used is considerable—for example pollen samples might come from mosses, soil samples or traps (e.g., Lisitsyna et al., 2012), and vegetation data can be recorded at different spatial intervals and using different methods and measurement types. Data analysis using the ERV method also requires specification of a reference taxon. Poaceae is most often used, since the pollen type is readily identified, found in almost all samples, and originates from a dominant plant taxon. However, the Poaceae pollen type can originate from the majority of wild grass species, and therefore from plants with a wide range of ecological requirements and traits.
Calluna-dominated heathland vegetation communities have previously been used as model systems for exploring controls on estimated values of RPP. Bunting and Hjelle (2010) showed that vegetation survey method can alter RPP estimates markedly by surveying vegetation around sample points in heathland using several different methods, and comparing RPP estimates obtained from the same pollen data when paired with the resulting different vegetation datasets. Heathland systems are particularly suitable for use as model systems for several reasons:
• They have a relatively limited flora and a wide geographic range.
• A widespread, monospecific pollen type (Calluna vulgaris) is available to use as a reference taxon – although the climatic and habitat range of the taxon suggests that it is highly adaptable, and therefore likely to have more intraspecific variation in at least some traits than a species with a narrower niche, it is less variable than the Poaceae family.
• They have a relatively simple vegetation structure with a low canopy, which makes the model assumption of above-canopy pollen transport more robust. An additional advantage is that modern vegetation recording is relatively rapid compared with a multi-layered woodland or a highly diverse meadow, meaning more data can be collected.
• They typically support abundant natural pollen traps (mosses), mostly of the preferred polster/hummock forming growth form (Boyd, 1986).
• These natural pollen traps are mostly found in gaps in the ericaceous canopy, therefore the potential complications caused by gravity deposition from a canopy taxon or dilution of pollen deposition through impaction on overhanging vegetation (Tauber, 1965, 1967) are reduced.
• Wetter parts of heathlands are peat-forming, and heathland areas tend to be characterised by a larger number of surviving sedimentary basins than the landscape as a whole due to both acidic preserving conditions and lower suitability for intensive human activity than surrounding land cover types, meaning that they are likely to be the source of sedimentary archives and Holocene pollen records.
Table 1 summarises published and unpublished estimates of RPP for selected heathland taxa in northern Europe. European reviews (Broström et al., 2008; Mazier et al., 2012) incorporate studies including multiple landscape elements, e.g., grazed and mown grassland, cropland, woodlands of different types, and heaths, and most carried out ERV analysis using a dataset including both tree and herb taxa. Hjelle (1998) studied only herbaceous taxa, but sampled grasslands as well as heathlands and used a rooted frequency vegetation survey method which is known to alter the apparent RPP of some taxa (Bunting and Hjelle, 2010); Bunting (2003); Bunting (unpublished) has presented RPP estimates from heathland systems in western Scotland, and Bunting and Hjelle (2010) presented estimates from coastal Norway, both using just the heathland taxa in their analyses. Clear differences in estimated RPP between these areas are noted (see Table 1), but methodological differences in vegetation survey and differences in site characteristics may also have a major effect (particularly for Moine Mhòr, where Molinia caerulea tussocks dominated part of the site where cutting and draining had created a hummocky heathland in poor condition – the hummocks and apparent hydrological fluctuations are considered to have affected the pollen taphonomy). In this study we chose to estimate RPP within heath communities only in order to investigate the effect of local habitat conditions on RPP without the added complications of additional plant communities which do not support the same taxa.
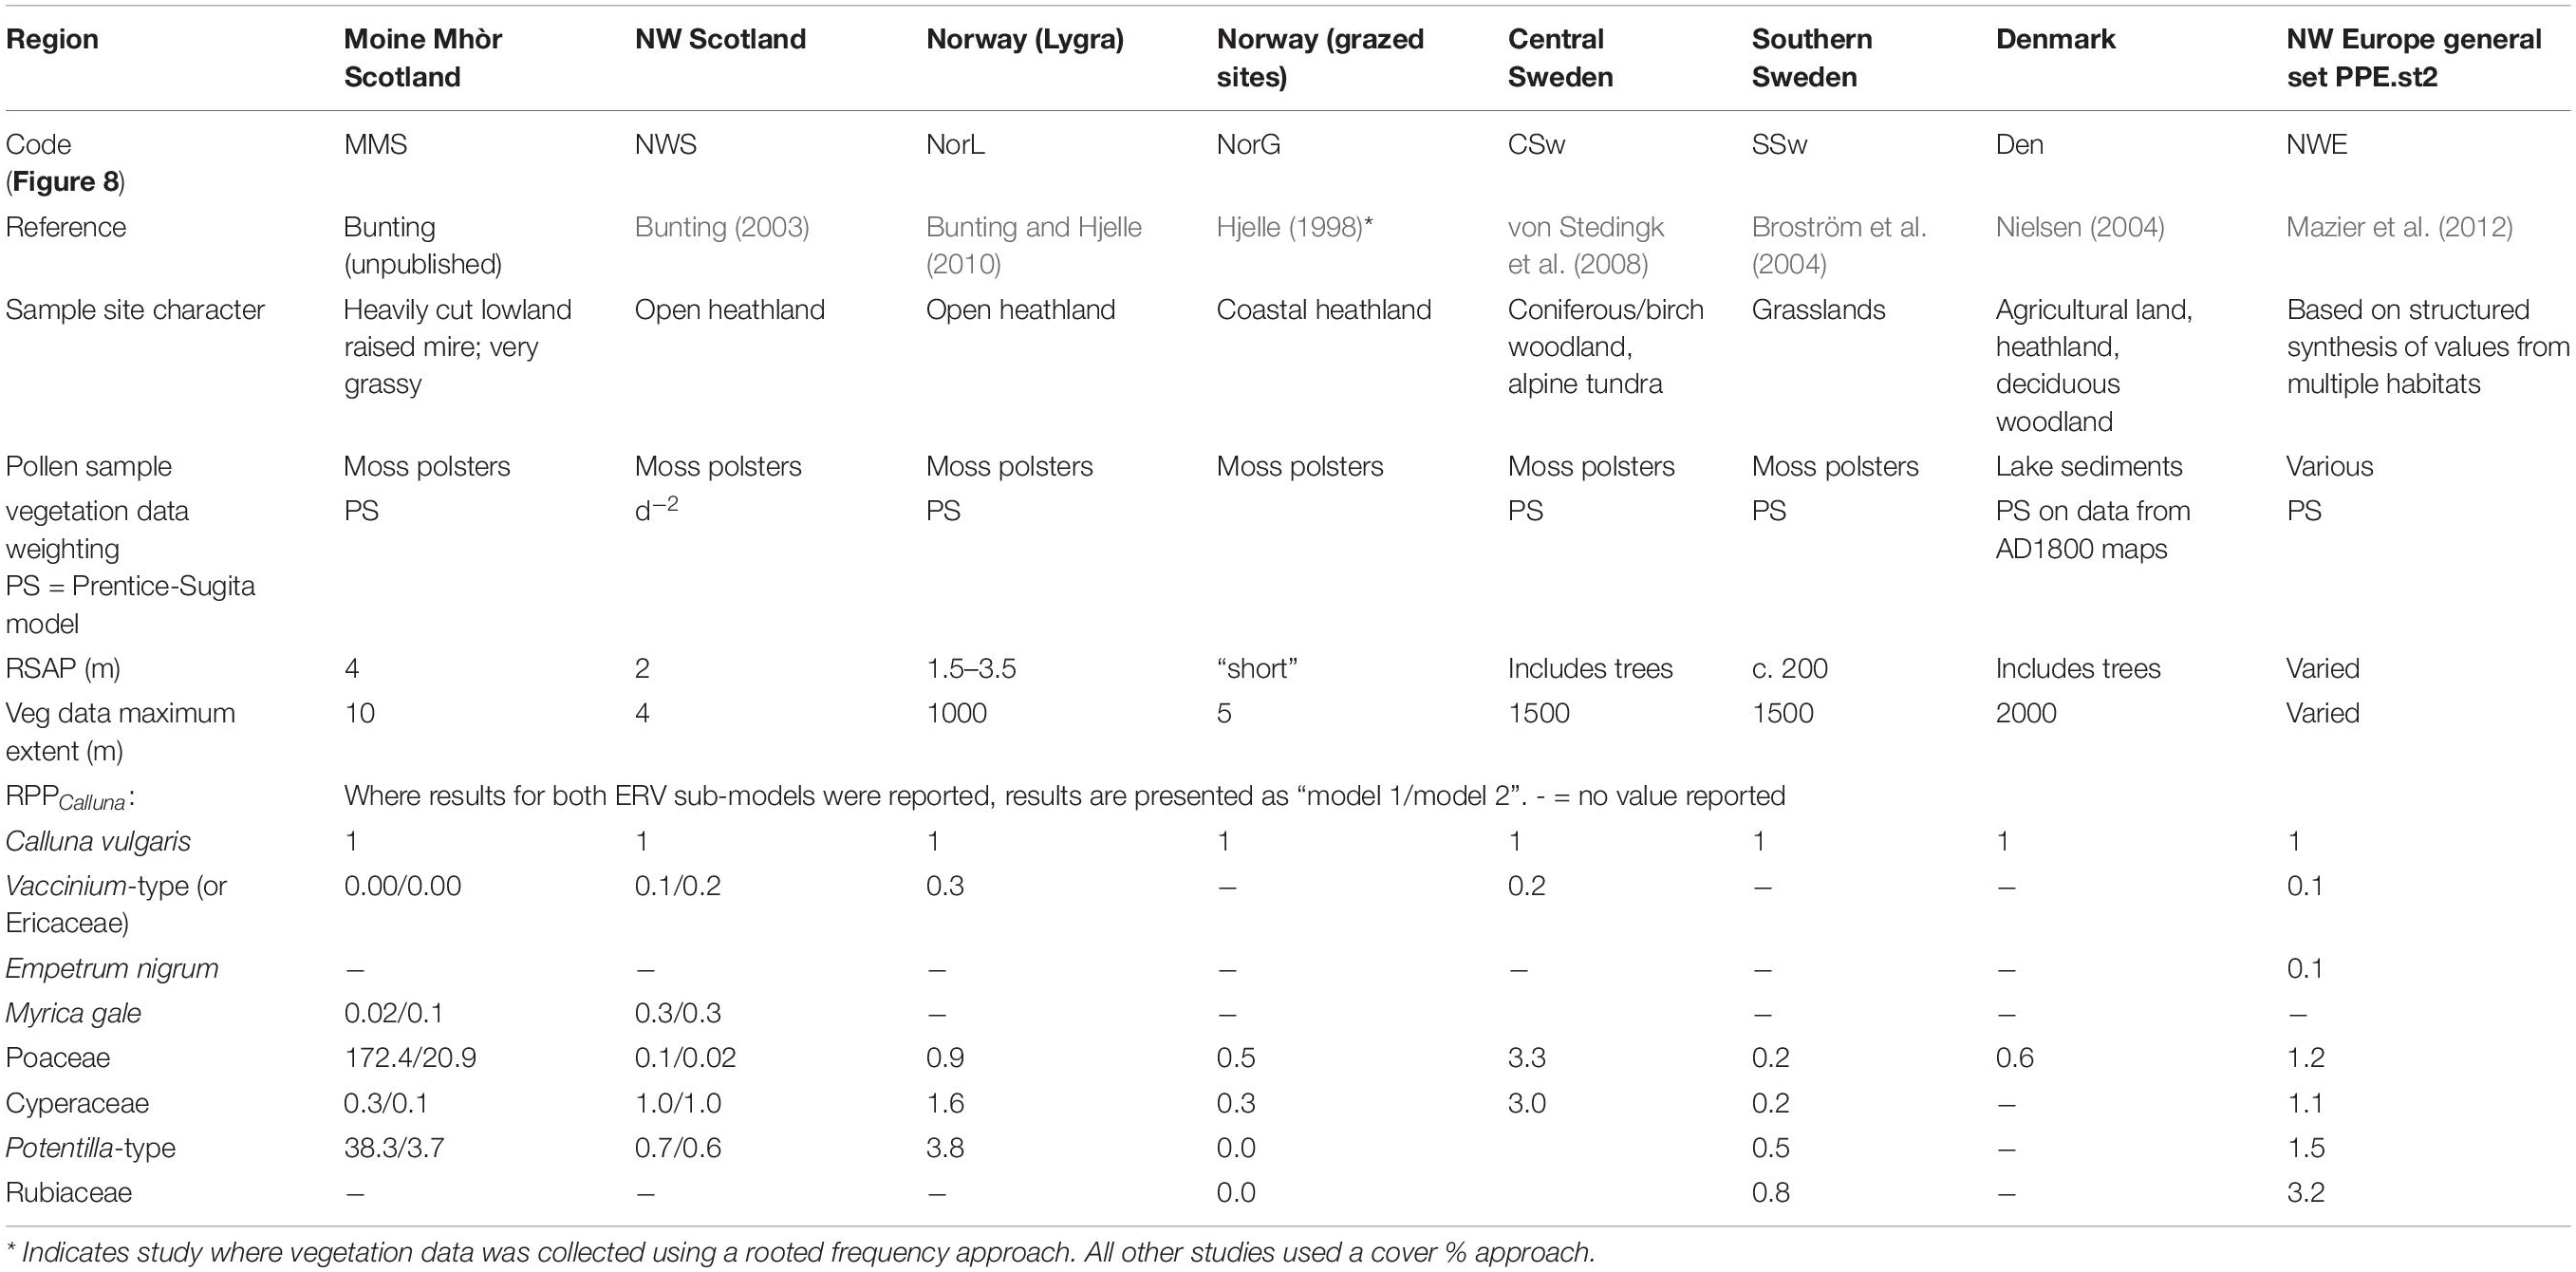
Table 1. Comparison of Relevant Source Area of Pollen and Relative Pollen Productivity (reference taxon recalculated where necessary to Calluna vulgaris) for other studies from heathland dominated landscapes.
All studies where data analysis included only heath taxa produced sub-10m estimates of the Relevant Source Area of Pollen (RSAP – Table 1; sensu Sugita, 1994, the radial distance from the sample point marking the outer limit of the area where changes in the position of plants relative to the sample point affect the pollen assemblage, even if the proportions of plants within the area remain the same). A study of herbaceous pollen types from grazed and mown grasslands in Southern Sweden found an RSAP of 200 m (Broström et al., 2004), and in open community landscapes such as the Chinese steppe RSAPs of around 2000 m are reported (Li et al., 2018). Most of the heathland studies cited in Table 1 either included woodland patches in their analysis or did not collect vegetation data at greater distances, so could not determine whether the RSAP was real or an artefact of sampling strategy. The Lygra study (Bunting and Hjelle, 2010) is an exception where vegetation data to a distance of 1000m from the sampling points were included in the analysis.
This paper has three aims:
1) To estimate RPP for common taxa in a heathland area using the standardised Crackles Bequest Project method of vegetation survey (Bunting et al., 2013);
2) To investigate whether local habitat conditions affect the estimates of RPP obtained;
3) To test the assumption that heathlands have a RSAP of less than 10 m.
The chosen field area is the Coigach peninsula in north-west Scotland (Figure 1). The low lying gently undulating topography minimises possible topographic or altitudinal effects on pollen assemblage formation at the larger scale. The landscape is dominated by heathland, managed by a mixture of low-density extensive grazing of sheep and deer and occasional burning, with small patches of commercial forestry and fragments of native woodland. Sample points were identified using a semi-stratified approach. Sample points were chosen to ensure a gradient of sites across the peninsula (to allow for the possibility of a climatic gradient from coastal to inland locations which might affect results). At each location sampling areas were randomly selected and then sample points were placed within patches of relatively uniform heathland which were identified as being wetter or drier in the field. Sample locations were at least 200 m apart, and moss polsters were collected and placed into sample bags (Bunting et al., 2013). A total of 18 samples were collected.
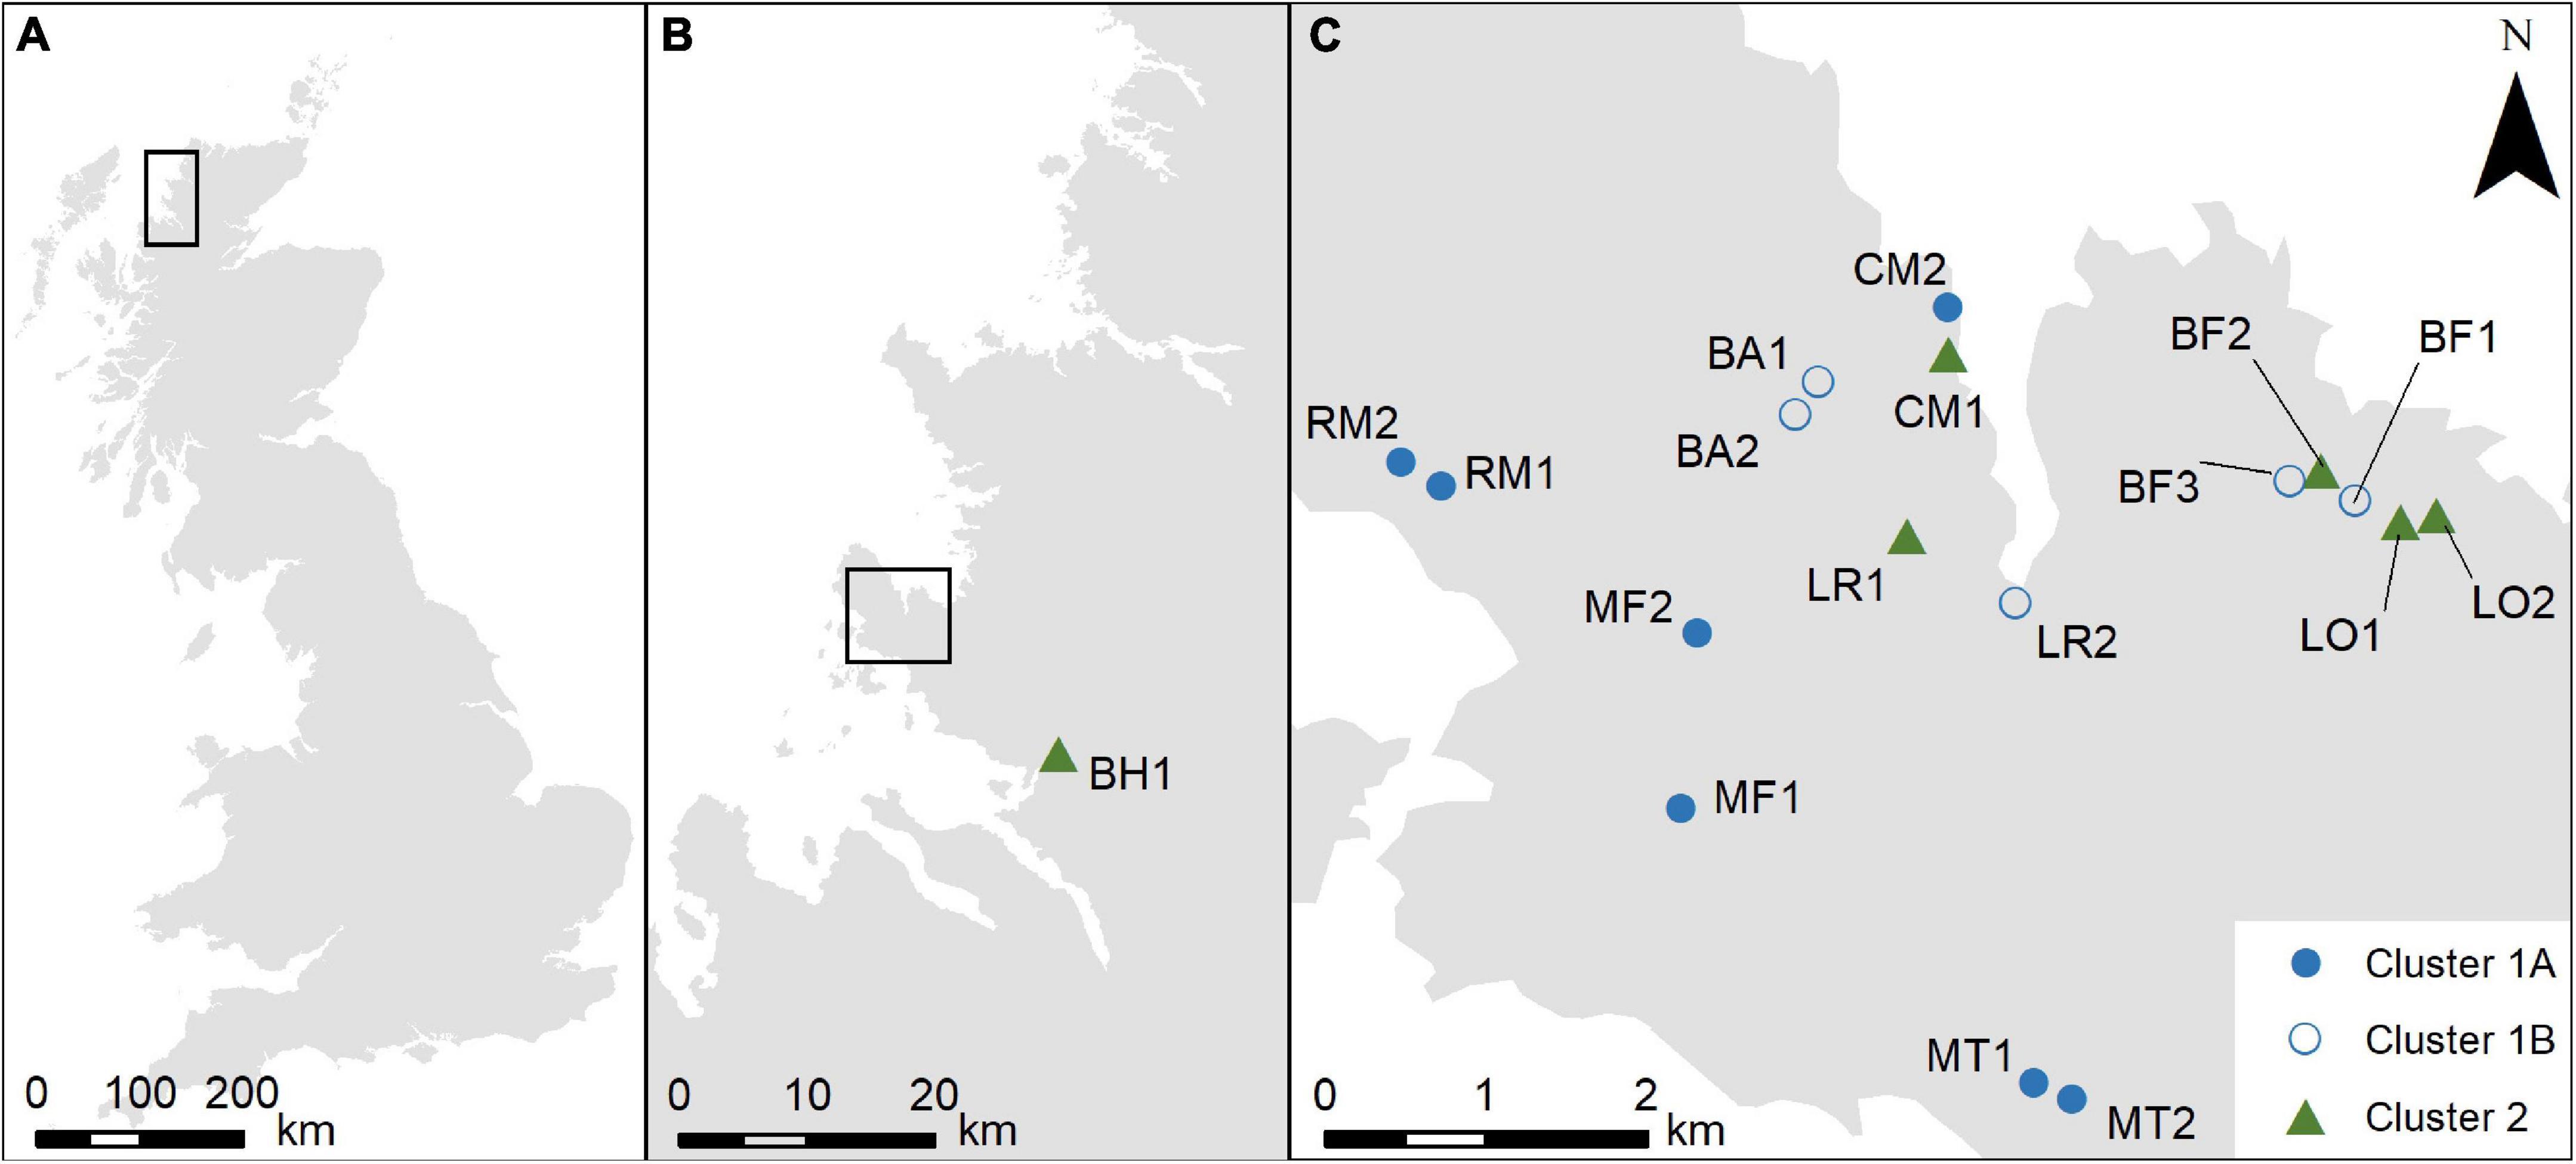
Figure 1. (A) Location of the field area within Britain; (B) location of the Coigach peninsula and the sampling site at Blughasary (BH); (C) distribution of sampling sites on the Coigach peninsula. BA = Brae of Achnahaird; BF = Bad Fhluich; CM = Cnoc Mòr; MF = Meall an Fheadain; MT = Mòine Tomach; LO = Loch Osgaig; LR = Loch Raa; RM = Rubha Mòr.
Vegetation survey around each sample point (see Figures 1B,C for locations) followed the Crackles Bequest Project protocol (Bunting et al., 2013), using a standardised layout of 21 1mx1m quadrats within 10 m radius (zone A), then community mapping and composition recording between 10 m and 100 m (zone B). All vegetation was recorded as vertical cover estimated by eye. Beyond 100 m (zone C) vegetation maps were extracted from the land cover mapping provided in LCM2015 (Rowland et al., 2017), the closest available date to the fieldwork. Vegetation composition for the LCM2015 communities was extrapolated from the field-mapped communities (see Table 2 for community compositions).

Table 2. Correlation of field mapped vegetation communities (Crackles Bequest Project zone B) with LCM2015 classes (used for Crackles Bequest Project Survey Zone C; Bunting et al., 2013).
Vegetation data was stored and processed using the Survey programme (Middleton, unpublished), and extracted in the form of concentric rings for distance weighting using the Prentice-Sugita model and comparison with the pollen data. Fall speeds for Calluna vulgaris, Cyperaceae, Poaceae and Potentilla-type were taken from Mazier et al. (2012), and for Drosera rotundifolia-type, Empetrum nigrum, Myrica gale-type, Pteropsida (monolete) indet. and Vaccinium-type were calculated using Stokes’ Law with Falck’s correction (Gregory, 1973) based on measurements of 30 grains from pollen slides collected in the region. Wind speed was set to 3 m/s. Ring widths for 0–10 m followed the Crackles Bequest Project protocol (Bunting et al., 2013). A ring width of 10m was used for 10–100 m, then 50 m widths were used to 2500 m.
Moss polsters were collected from the centre of each survey area, sealed in ziplock bags and stored at 4°C in the dark. Samples were prepared for pollen analysis using standard methods (Moore et al., 1991) and counted under ×400 magnification, with ×1000 used for critical identifications. A base sum of 1000 total land pollen grains was counted. Taxonomy follows Bennett (1995-present), and identifications were made with the aid of the keys of Moore et al. (1991) and Beug (2004) and the reference collection at the University of Hull.
Sample habitat was summarised into a small number of habitats on the basis of the vegetation within the inner 10m survey area, and samples grouped using WinTWINS (Hill and Šmilauer, 2005). Vegetation data from the 21 quadrats in the inner 10m radius area was area-weighted (i.e., weighted according to the area of each ring) to give a single average for each sample as input for grouping. In order to explore how vegetation communities mapped onto pollen assemblages, Principal Components Analysis was carried out using CANOCO v4.5 (Lepš and Šmilauer, 2003) with a square root transformation on the pollen assemblages, using all 45 pollen types recorded.
Calibration of the pollen-vegetation equation (Equation 1) is achieved through regression analysis allowing estimation of the parameters αi and ωi, as long as yik and ψik are both measured independently for each taxon i. However, measuring pollen influx in absolute terms is non-trivial – measuring the length of time that pollen accumulates in natural traps such as lake surface sediments or moss polsters, or running pollen traps for a period of 5-10 years to minimise annual variation (e.g., Räsänen et al., 2004; Lisitsyna and Hicks, 2014), is both difficult and costly. Pollen analysts typically present and handle data as proportions, pik (proportion of taxon i at site k), where , therefore the values of pik are interdependent. Depending on the methods used for recording vegetation data (ψik), this term can also be interdependent across the taxon set. Where variables are interdependent, single-taxon regression analysis is not effective, and an iterative approach to estimating the values of the parameters αi and ωi is adopted (Parsons and Prentice, 1981; Prentice and Parsons, 1983). This iterative calibration process is generally referred to as ERV analysis. The basic approach is to modify Equation 1 as follows:
where pik is the proportion of taxon i recorded at point k in the landscape, αi is the relative pollen productivity of taxon i, χik is a measure of the abundance and distribution of plants producing pollen classed as taxon i in the landscape around site k within a specified distance (e.g., a distance weighted measure of abundance) and zi is the corrected background pollen term for type i, that is, a term expressing the regionally averaged pollen component originating from source plants growing beyond the specified distance. The term fk is a site-specific correction factor calculated from a combination of α and z values for all taxa present.
Three “models,” variants on Equation 2, have been proposed, and are differentiated by how the site specific correction factor is built into the equation and how the term zi is calculated. Models 1 and 2 assume that the term χik is based on proportion data and is therefore also interdependent for all i (Parsons and Prentice, 1981; Prentice and Parsons, 1983) whilst model 3 assumes that χik is measured independently for each taxon (Sugita, 1994).
Output from ERV analysis comprises a likelihood function score for the best fit solution identified, and estimates of αi and zi for all taxa. By carrying out ERV analysis using χik values obtained from different zones around the sample points k, it is possible to investigate how the fit of the model changes as the spatial area considered changes. When the vegetation survey zone for χik is defined using a radial distance z from point k, and ERV analysis is carried out for multiple values of z, plots of the changes in the likelihood function score are used to estimate a ‘best fit’ distance, a point beyond which adding vegetation data does not improve the fit of the parameterised model to the calibration dataset, which is termed the Relevant Source Area of Pollen (RSAP). This provides a measure of the spatial resolution of the pollen signal, and is used in some reconstruction methods (Sugita, 2007b).
Taxa were selected for ERV analysis on the basis of being present in both pollen and vegetation data for at least 4 locations, and from inspection of scatter plots of their abundance in the pollen and vegetation datasets. Six taxa characteristic of heathlands are included in the final analyses presented here (Calluna vulgaris, Cyperaceae, Myrica gale, Poaceae, Potentilla-type and Vaccinium-type), giving a revised pollen count base sum of 529-964 grains (mean 796 grains). Extended R-Value analysis was carried out using PolERV (Middleton, unpublished), which uses the same analysis code as Sugita’s software (Sugita, 1994). 200 iterations were run at each distance. Calluna vulgaris was selected as the reference taxon, being both monospecific and widely recorded across the landscape. The two primary WinTWINS clusters (wet heath and dry heath) were then separately subjected to ERV analysis using the same method to determine whether estimated RPP values differed under different growing conditions.
Pollen samples and vegetation data were collected from eighteen sites (Figure 1), and the pollen assemblages and vegetation composition are summarised in Figure 2.
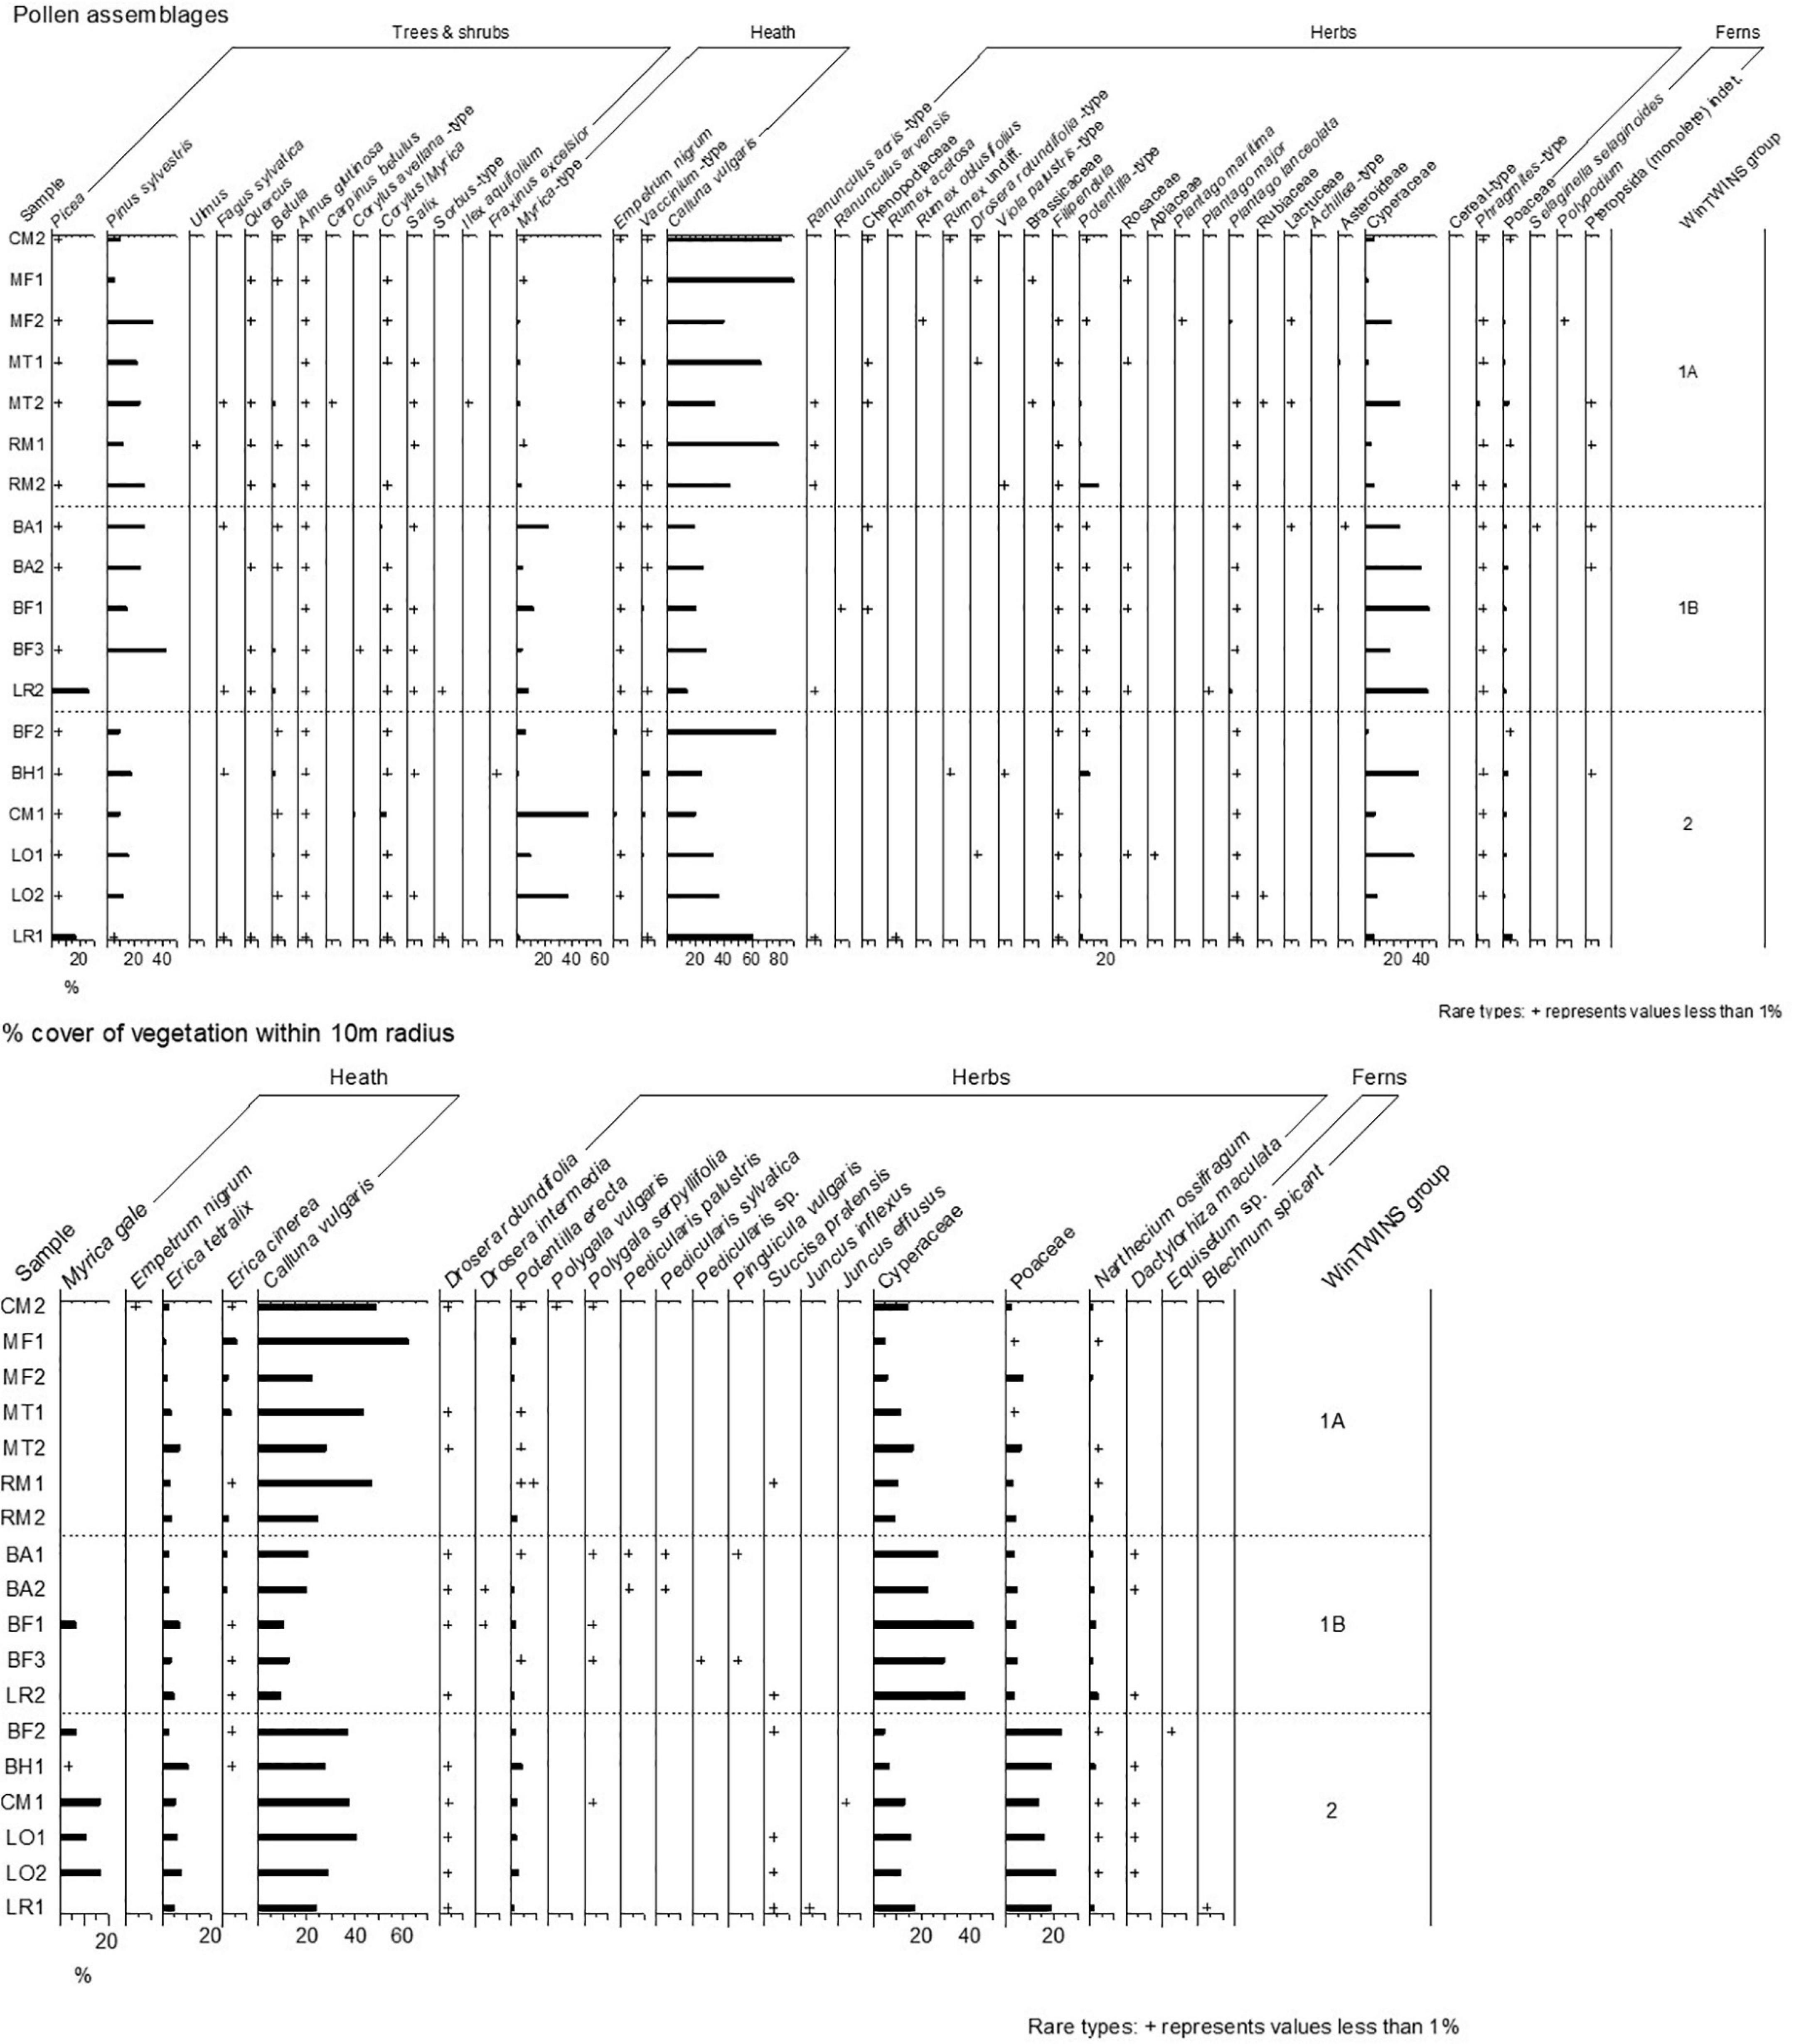
Figure 2. Pollen percentages and % vegetation cover within 10 m of the sample point for samples collected in this study. Vegetation cover is grouped into palynological equivalents. Sample locations and codes are shown in Figure 1.
The WinTWINS analysis identified three groups of samples (Figure 3), which show geographic overlap (see Figure 1). All samples have high abundance of Calluna vulgaris. Cluster 1A (WinTWINS group 00) has high abundance of Calluna vulgaris, intermediate Cyperaceae abundance, and comparatively low Poaceae abundance, along with the most Erica cinerea of the three clusters. Cluster 1B (01) has the highest Cyperaceae abundance and lowest Calluna vulgaris abundance of the three clusters, with comparatively low Poaceae abundance, and occasional presence of Myrica gale. Cluster 2 (10/11) has relatively low abundance of Cyperaceae, highest Poaceae and high Calluna vulgaris, and most samples also have quite strong presence of Myrica gale. Cluster 2 consists of sites from the wettest parts of the heathland mosaic, and Cluster 1 of samples from drier locations. Cluster 1 is then divided between sites with higher abundances of Erica cinerea which showed some visible signs of soil erosion and/or past peat cutting in the field (1A), and sites with higher abundances of Carex sedges and apparently intact soils (1B).
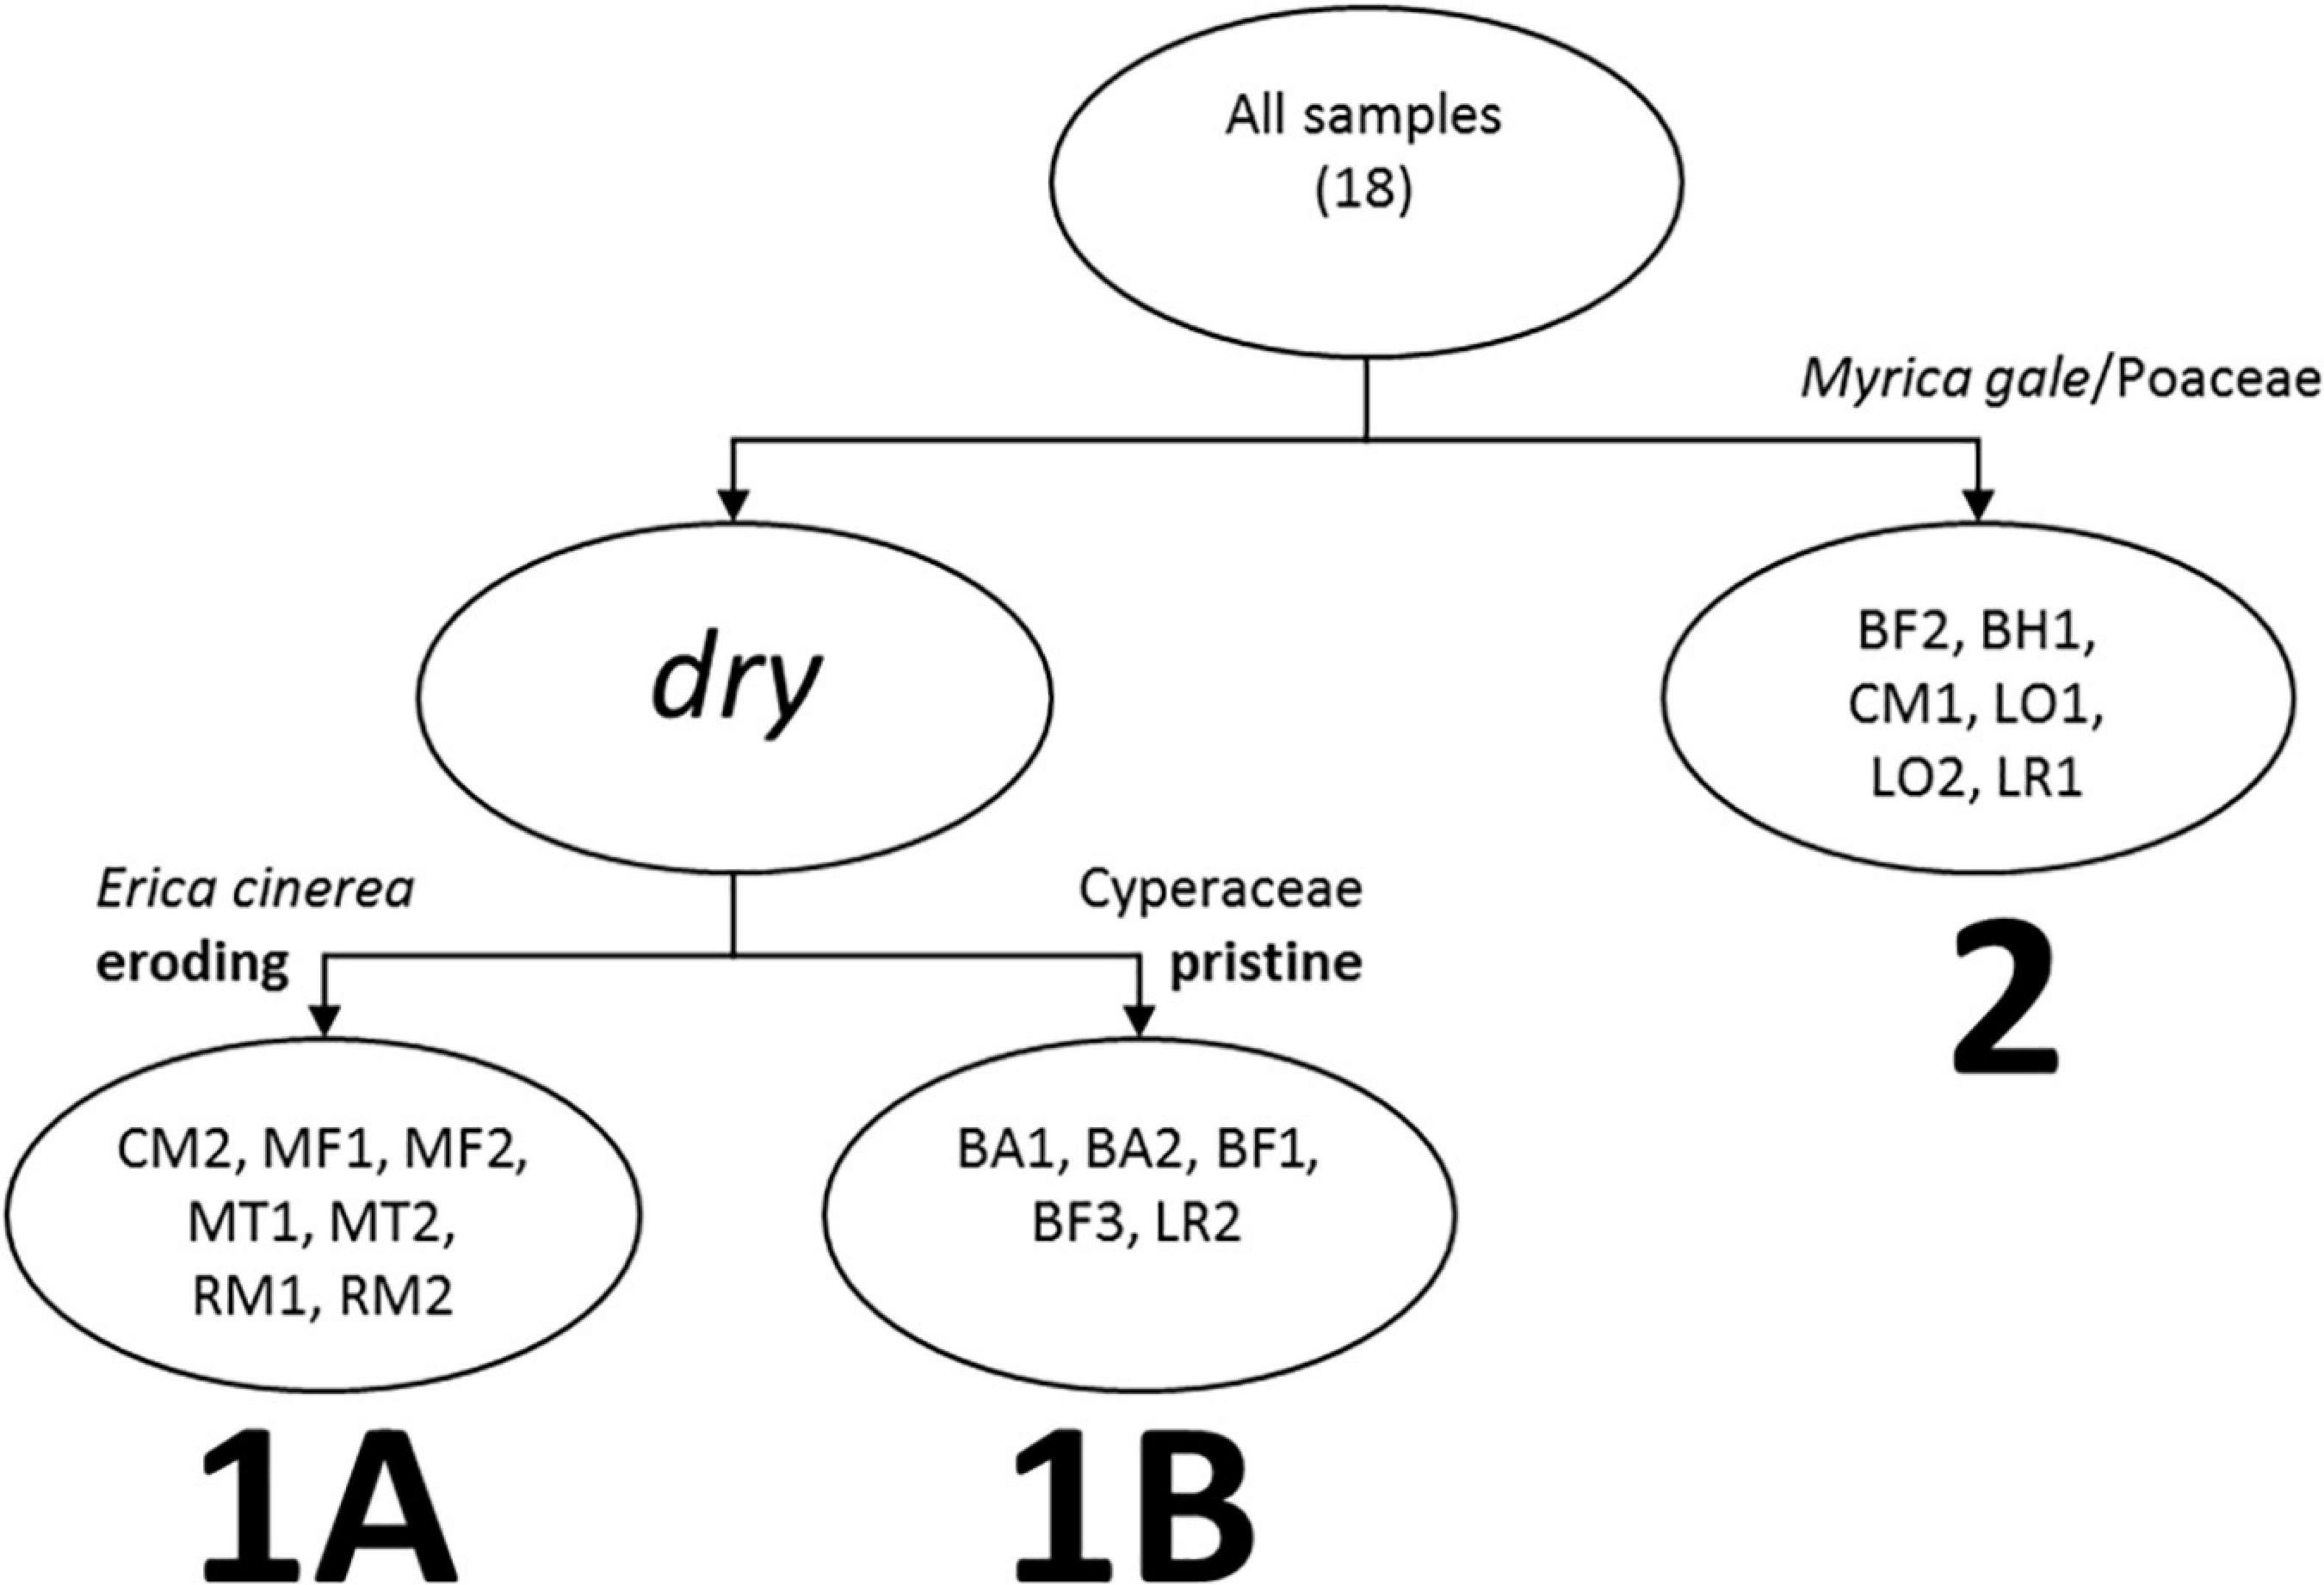
Figure 3. Visual representation of WinTWINS clustering based on % areal cover of vegetation within 10 m radius of the pollen sampling point. Sample locations and codes are shown in Figure 1.
Figure 4 shows the results of PCA analysis of the pollen data, with symbol coding showing the WinTWINS clusters based on the vegetation data. The first two axes together explain 70.4% of the variance with eigenvalues of 0.363 and 0.341, respectively. Axis 1 separates sites with higher proportions of Calluna vulgaris and Drosera rotundifolia from sites with higher levels of Cyperaceae, Poaceae and Myrica gale-type. Cluster 1A samples are more likely to be found at the negative end of this axis and Cluster 1B more likely on the positive end along with most Cluster 2 samples, but there is overlap between the three clusters. This axis appears to be dominated by local wetness, with wetter sites at the right hand side. Axis 2 is dominated by Pinus and Sorbus-type, both background pollen types (in the sense that mature individuals of their source plants were not present within 100m of any survey location), suggesting that this axis is effectively geographical. It separates LR1 and LR2 from the other samples, probably reflecting the relative abundance and proximity of native woodland stands around Loch Raa compared with all other sites.
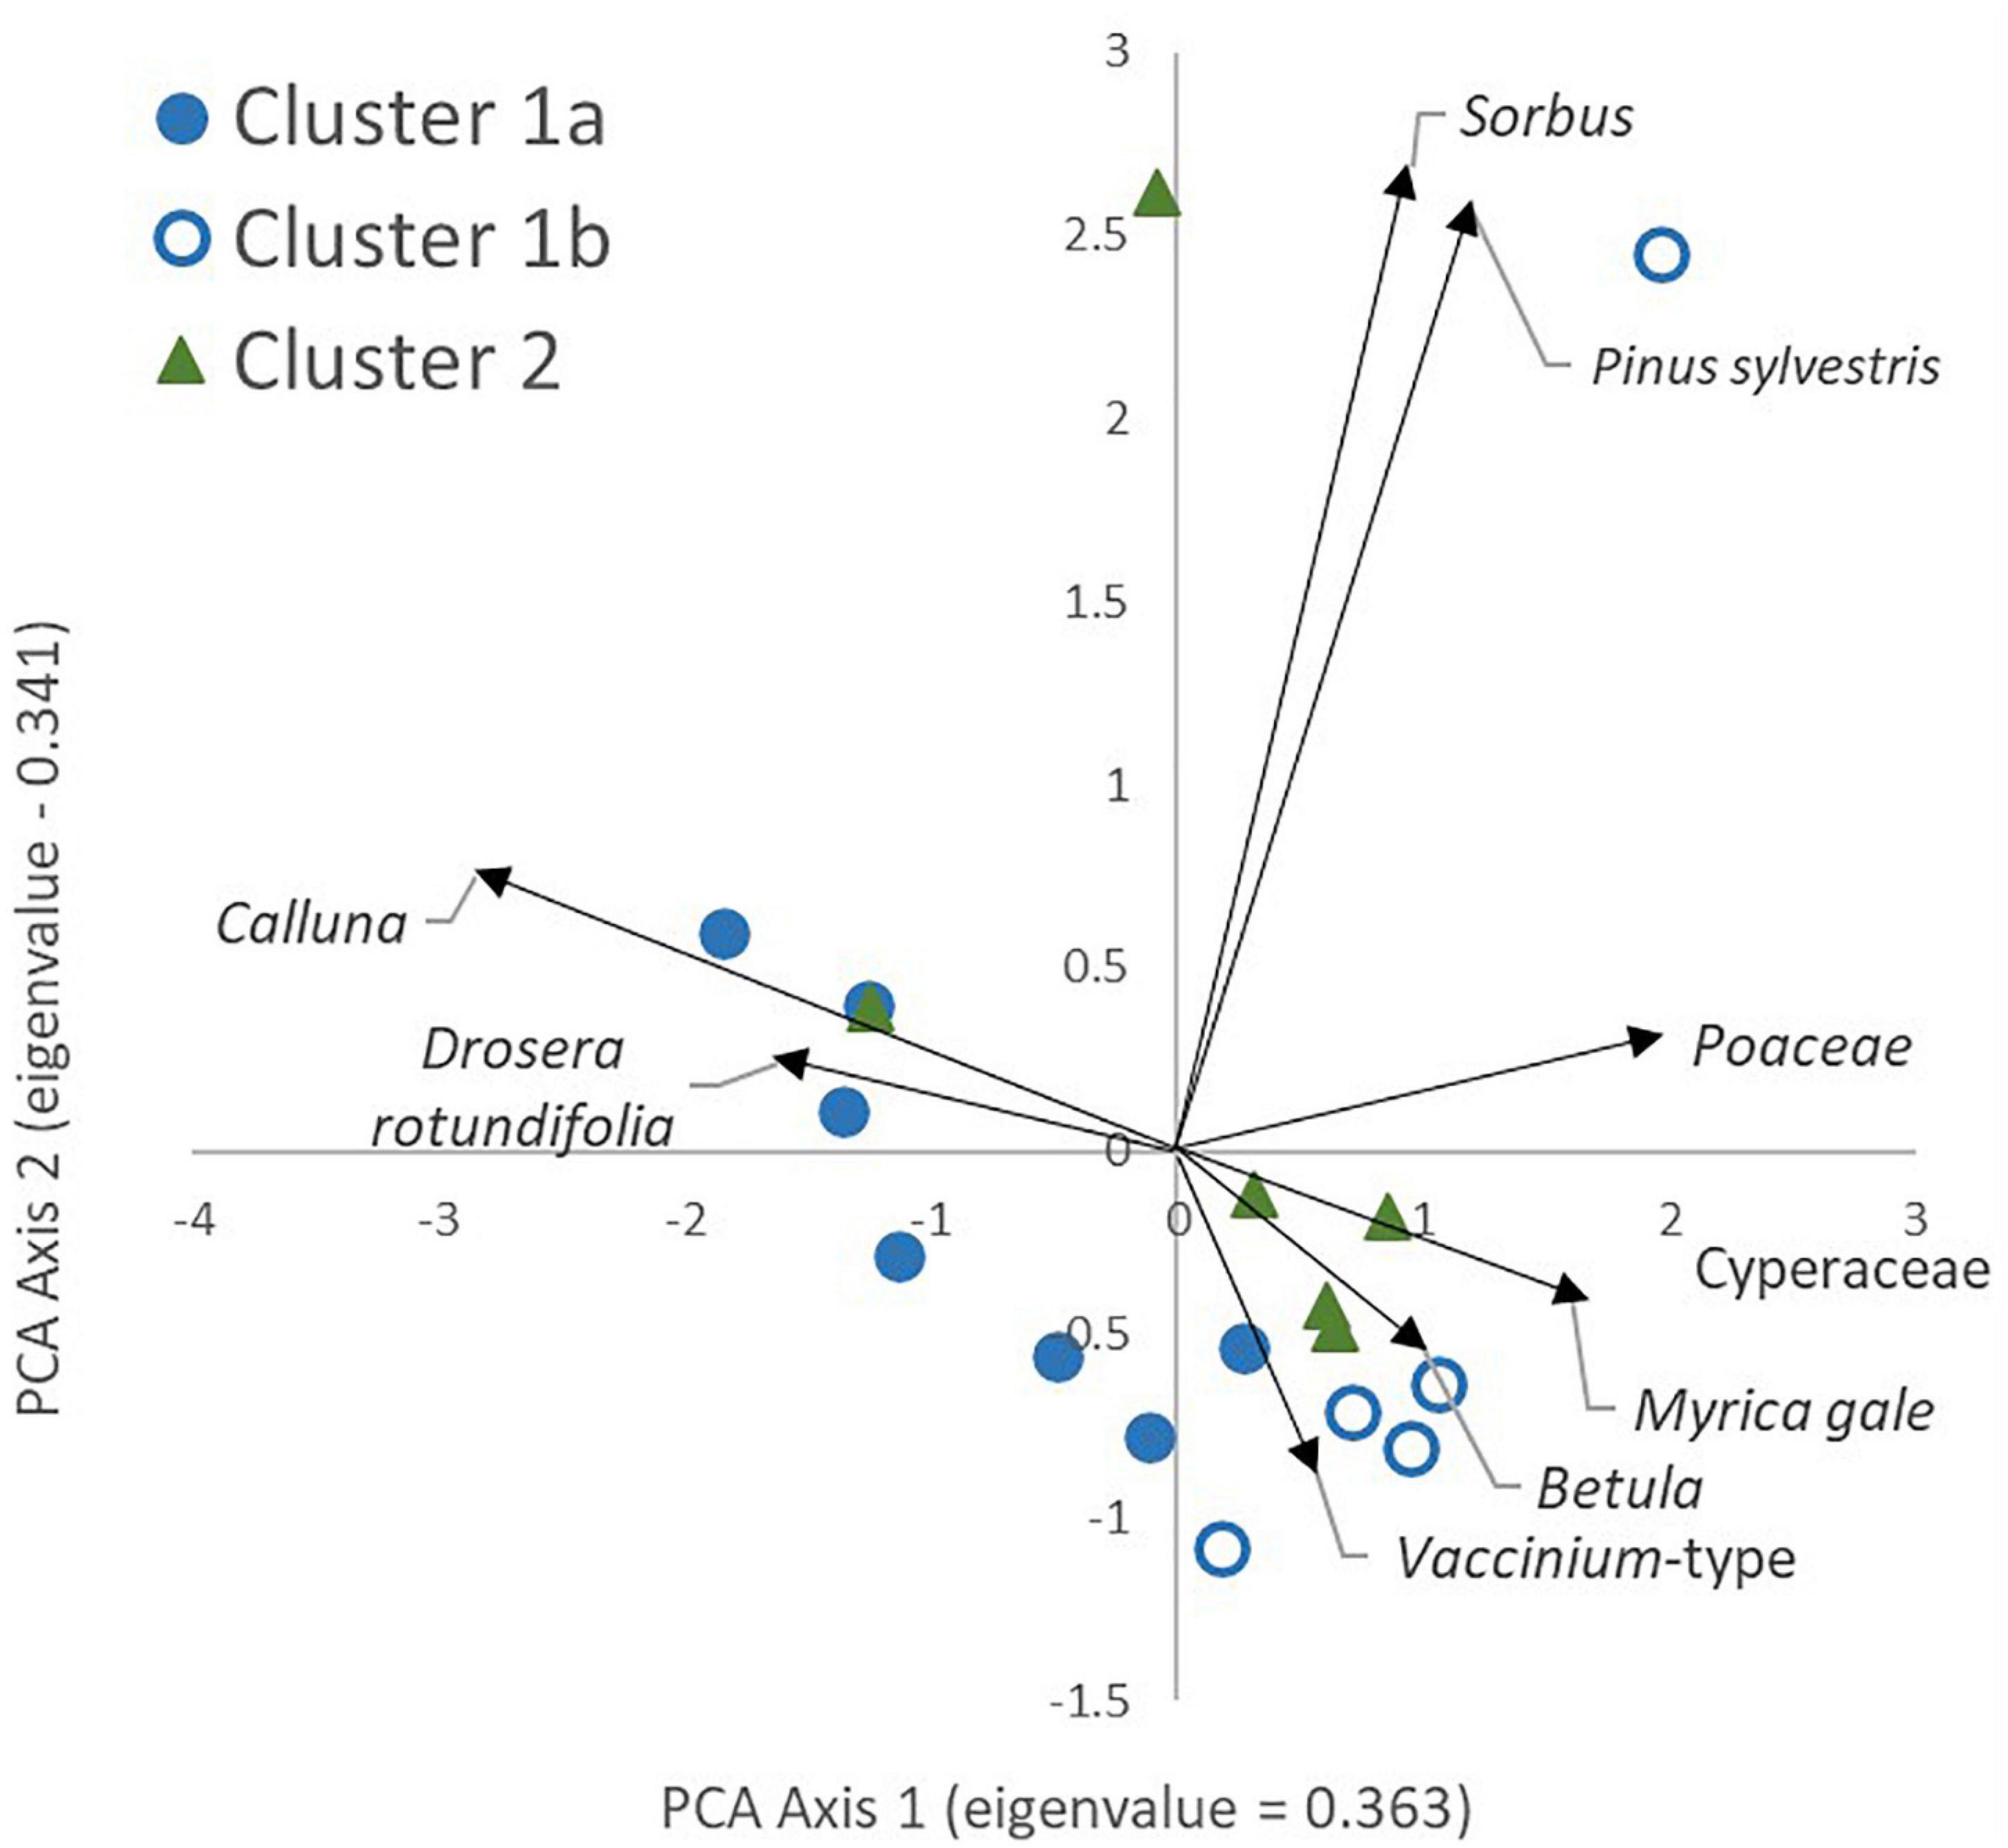
Figure 4. Principal Components Analysis of pollen assemblages (percentage data, square root transformation). Colour/fill of sample locations denotes the WinTWINS vegetation cluster each belongs to. Only the nine most abundant pollen types are shown on the figure for clarity.
Although Clusters 1A and 1B are ecologically separable, we combined them for ERV analysis due to the small number of samples in Cluster 1B. Figure 5 shows scatter plots of the nine most abundant taxa recorded in both the vegetation and pollen datasets (excluding the three arboreal taxa, Betula, Pinus and Sorbus-type). Calluna vulgaris is clearly a suitable reference taxon for Cluster 1, with a clear gradient of values, but may be problematic for Cluster 2, where the gradient of vegetation values is comparatively short. On the basis of scatter plot inspection, Drosera, Empetrum nigrum and Pteropsida (monolete) indet. were excluded from further analysis, and the remaining six taxa were used for ERV analysis as presented in the next section.
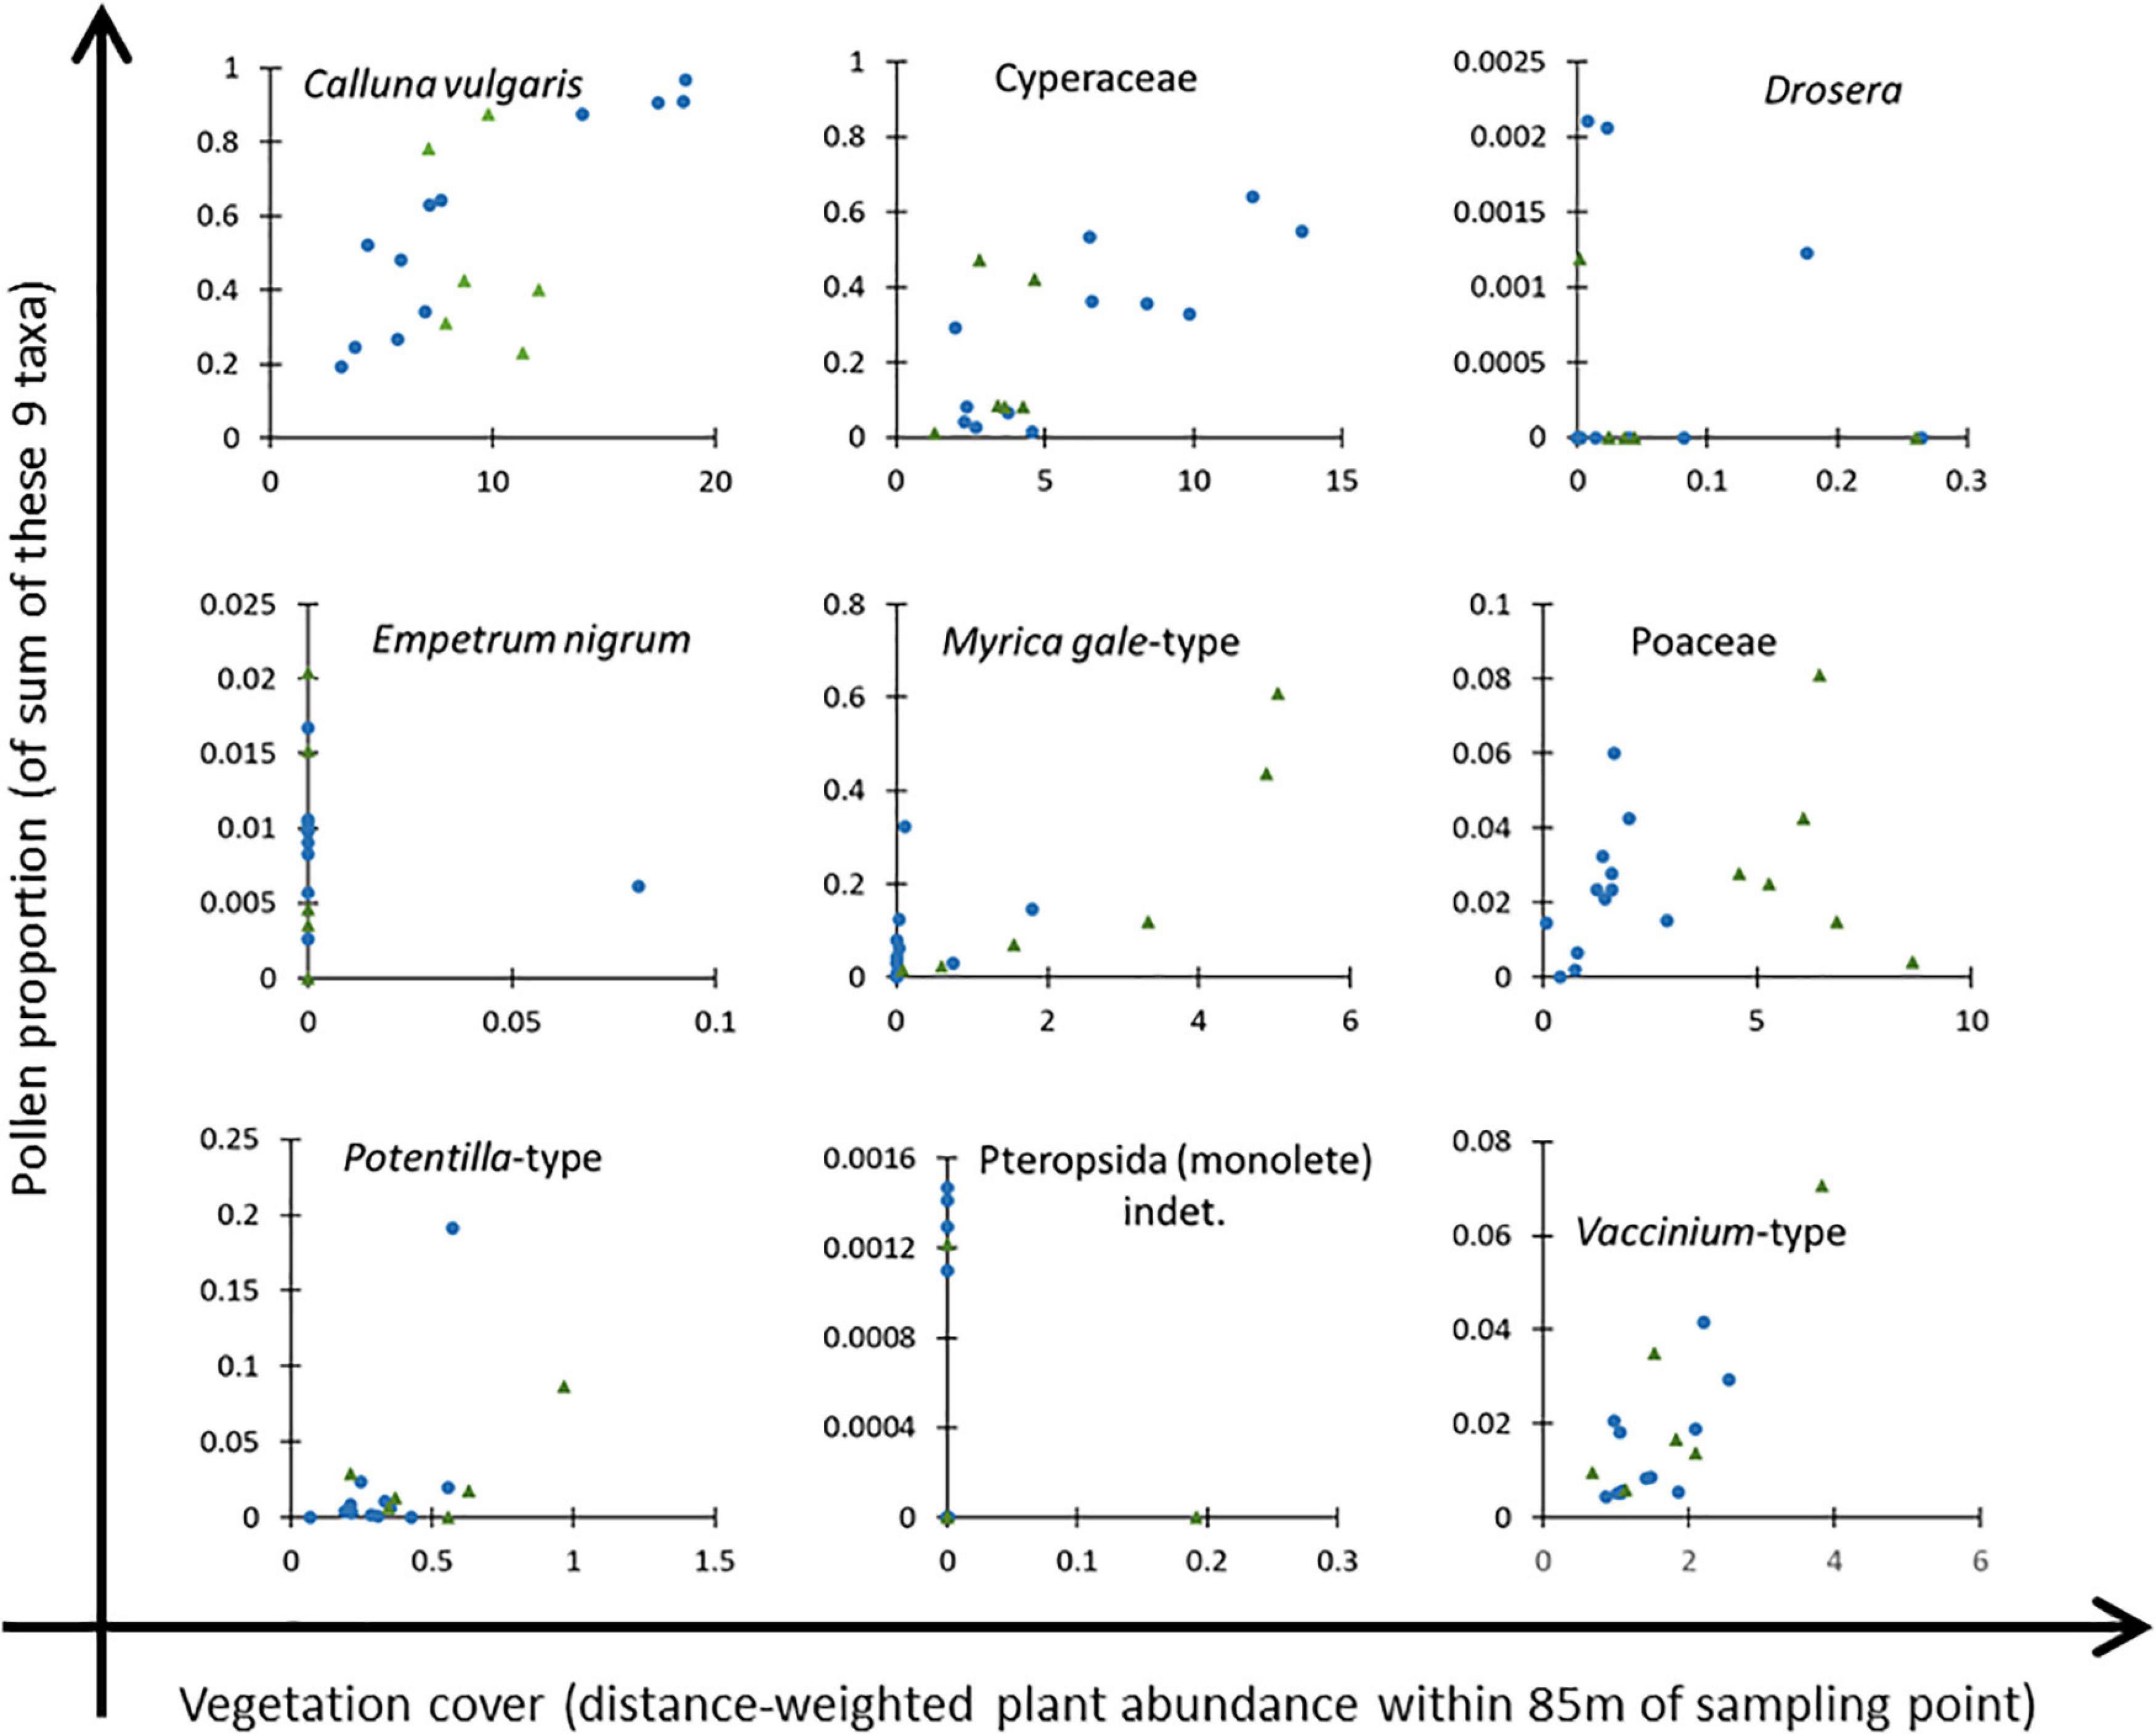
Figure 5. Scatter plots of pollen proportion (on a base sum of these nine taxa) against distance-weighted plant abundance within 95 m radius of the sampling point for nine taxa considered for analysis. Drosera, Empetrum nigrum and Pteropsida (monolete) indet. were excluded from the final dataset. Blue circles denote samples in Cluster 1, green triangles samples in Cluster 2 (see Figure 3 and text for details).
Likelihood function scores for ERV models 1 and 2 are shown in Figure 6 for all datasets, plotted against two different distance scales. Figure 7 summarises the RPPCalluna estimates obtained (also given in Table 3).
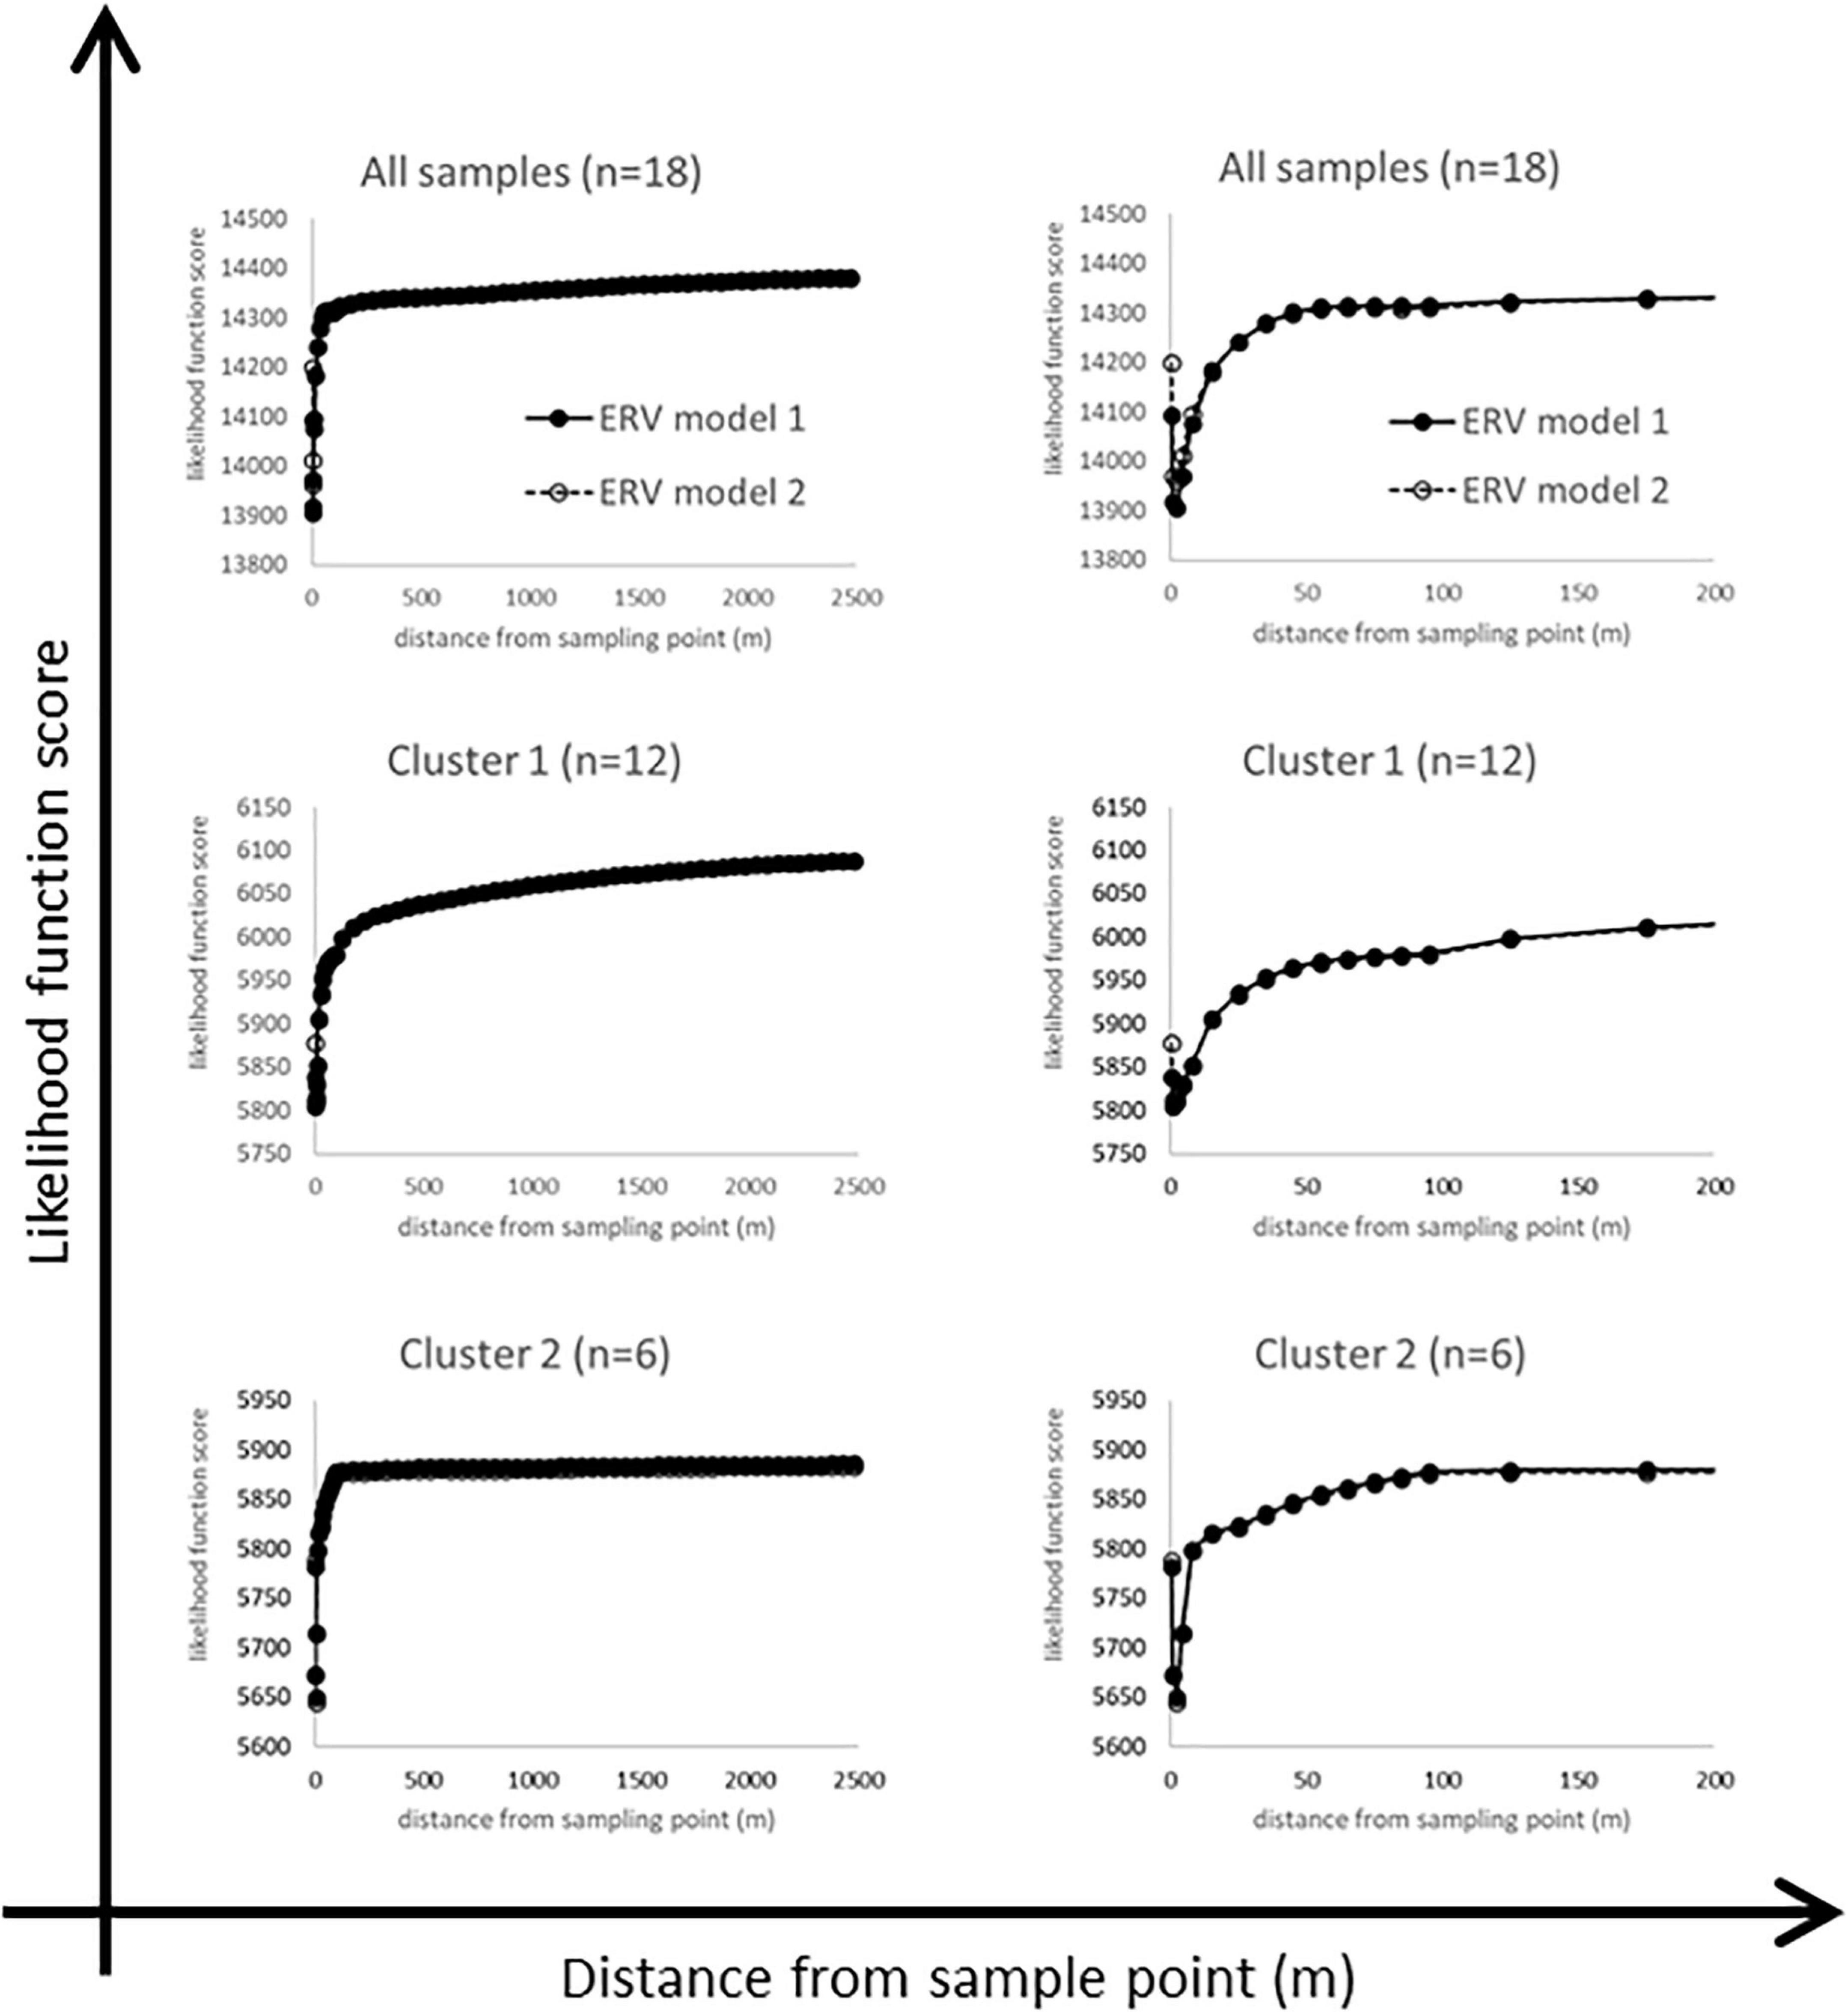
Figure 6. Likelihood function scores for the full dataset and the two clusters, plotted against two different distance scales to show key features (see text for discussion).
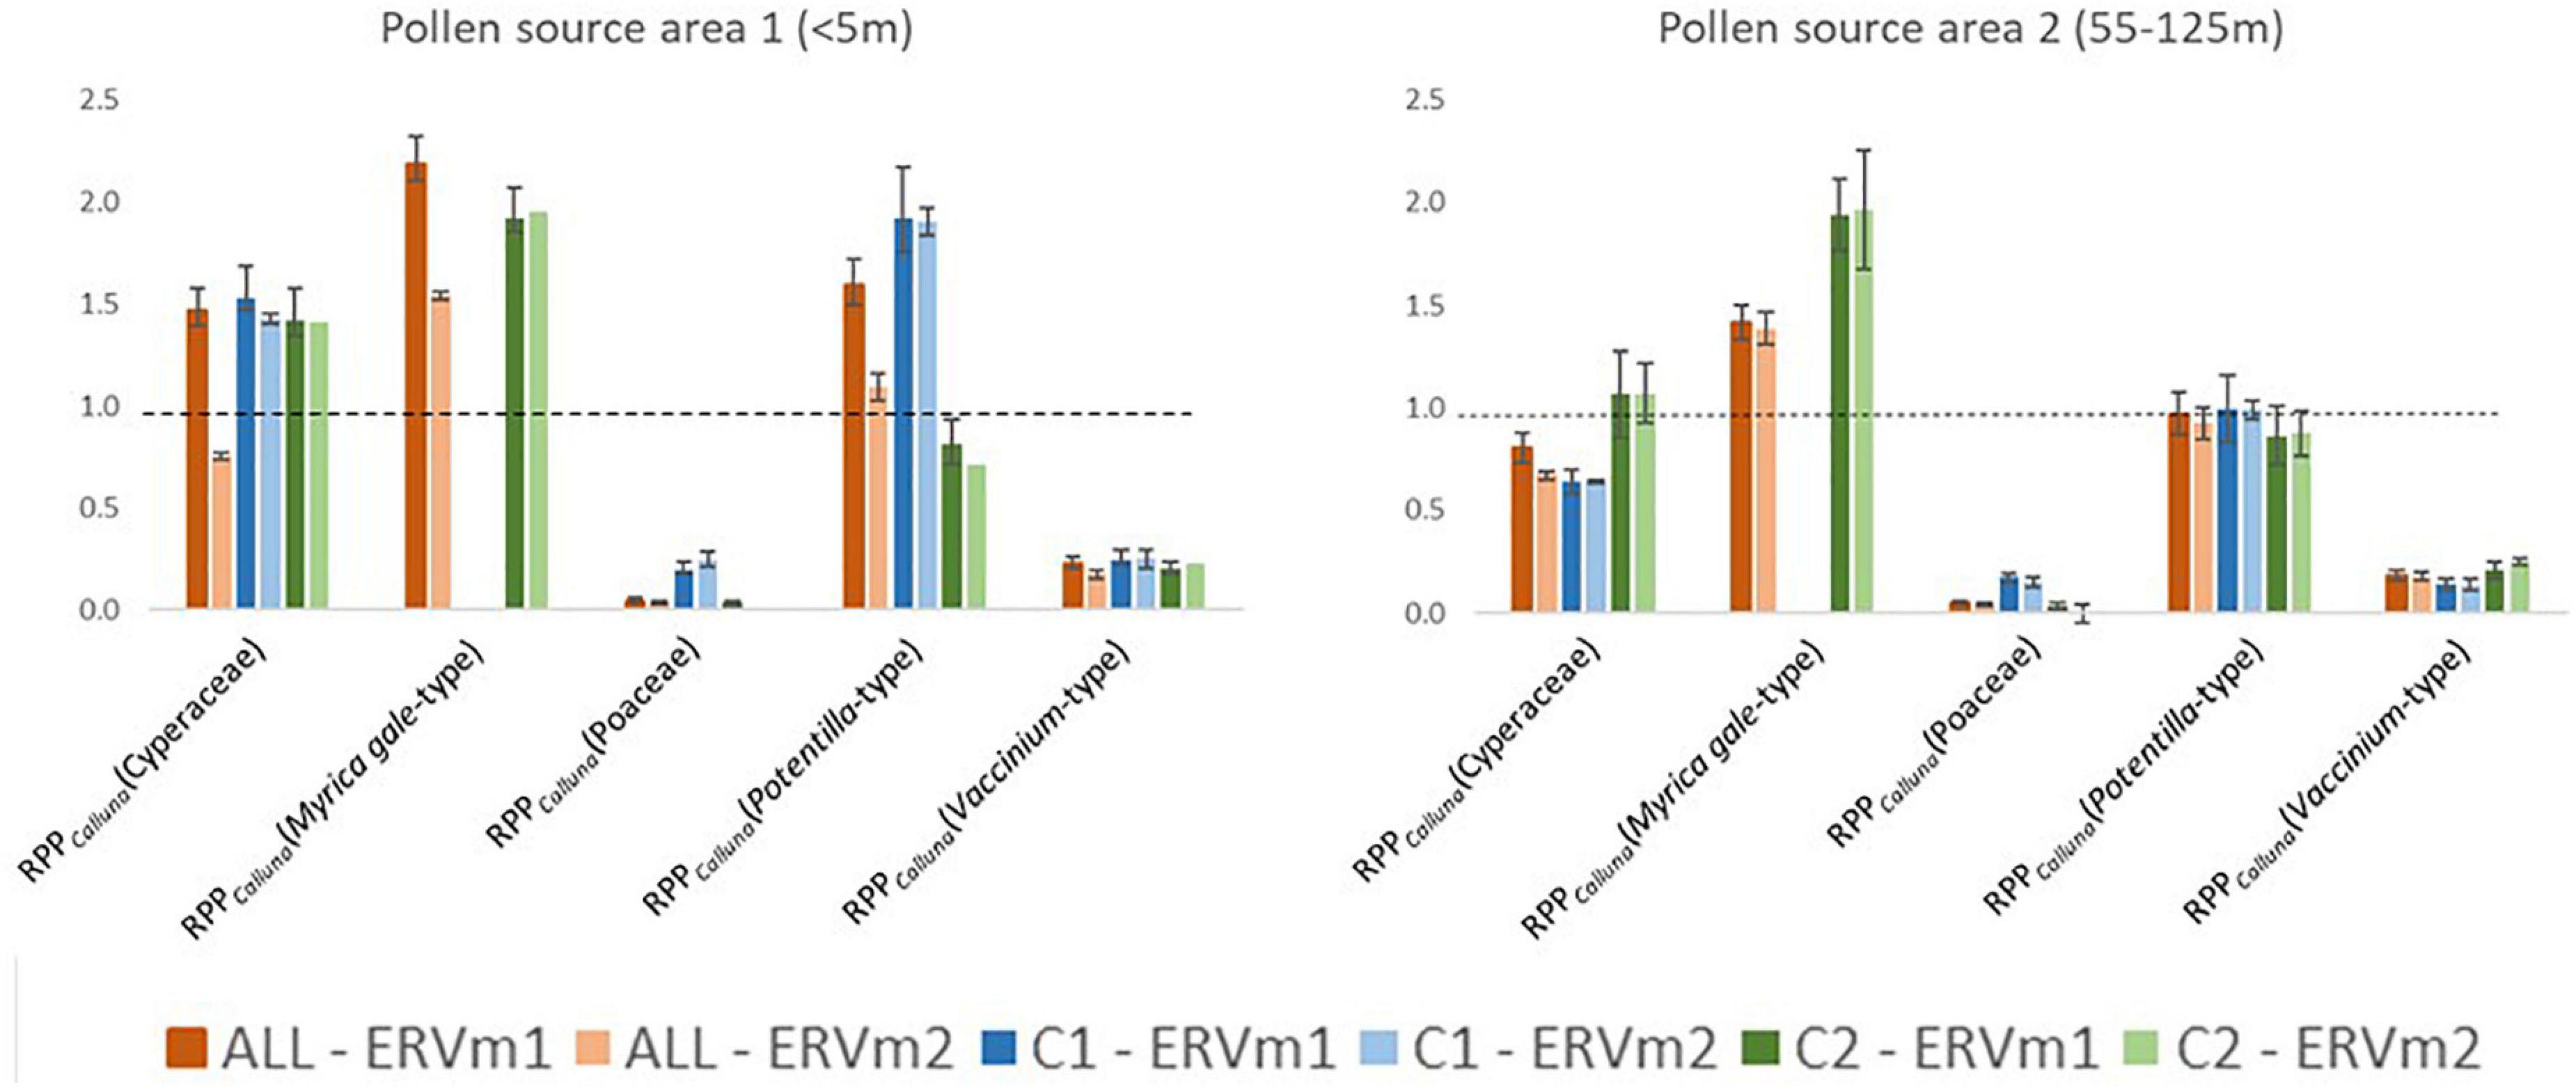
Figure 7. Comparison of estimates of Relative Pollen Productivity (reference taxon is Calluna vulgaris) obtained using different combinations of sample dataset (ALL = all samples, C1 = Cluster 1, C2 = Cluster 2—see Figure 3 for definition of clusters) and Extended R Value sub-model (ERVm1 = Extended R-Value sub-model 1)—see text for details. Dashed line at 1.0.
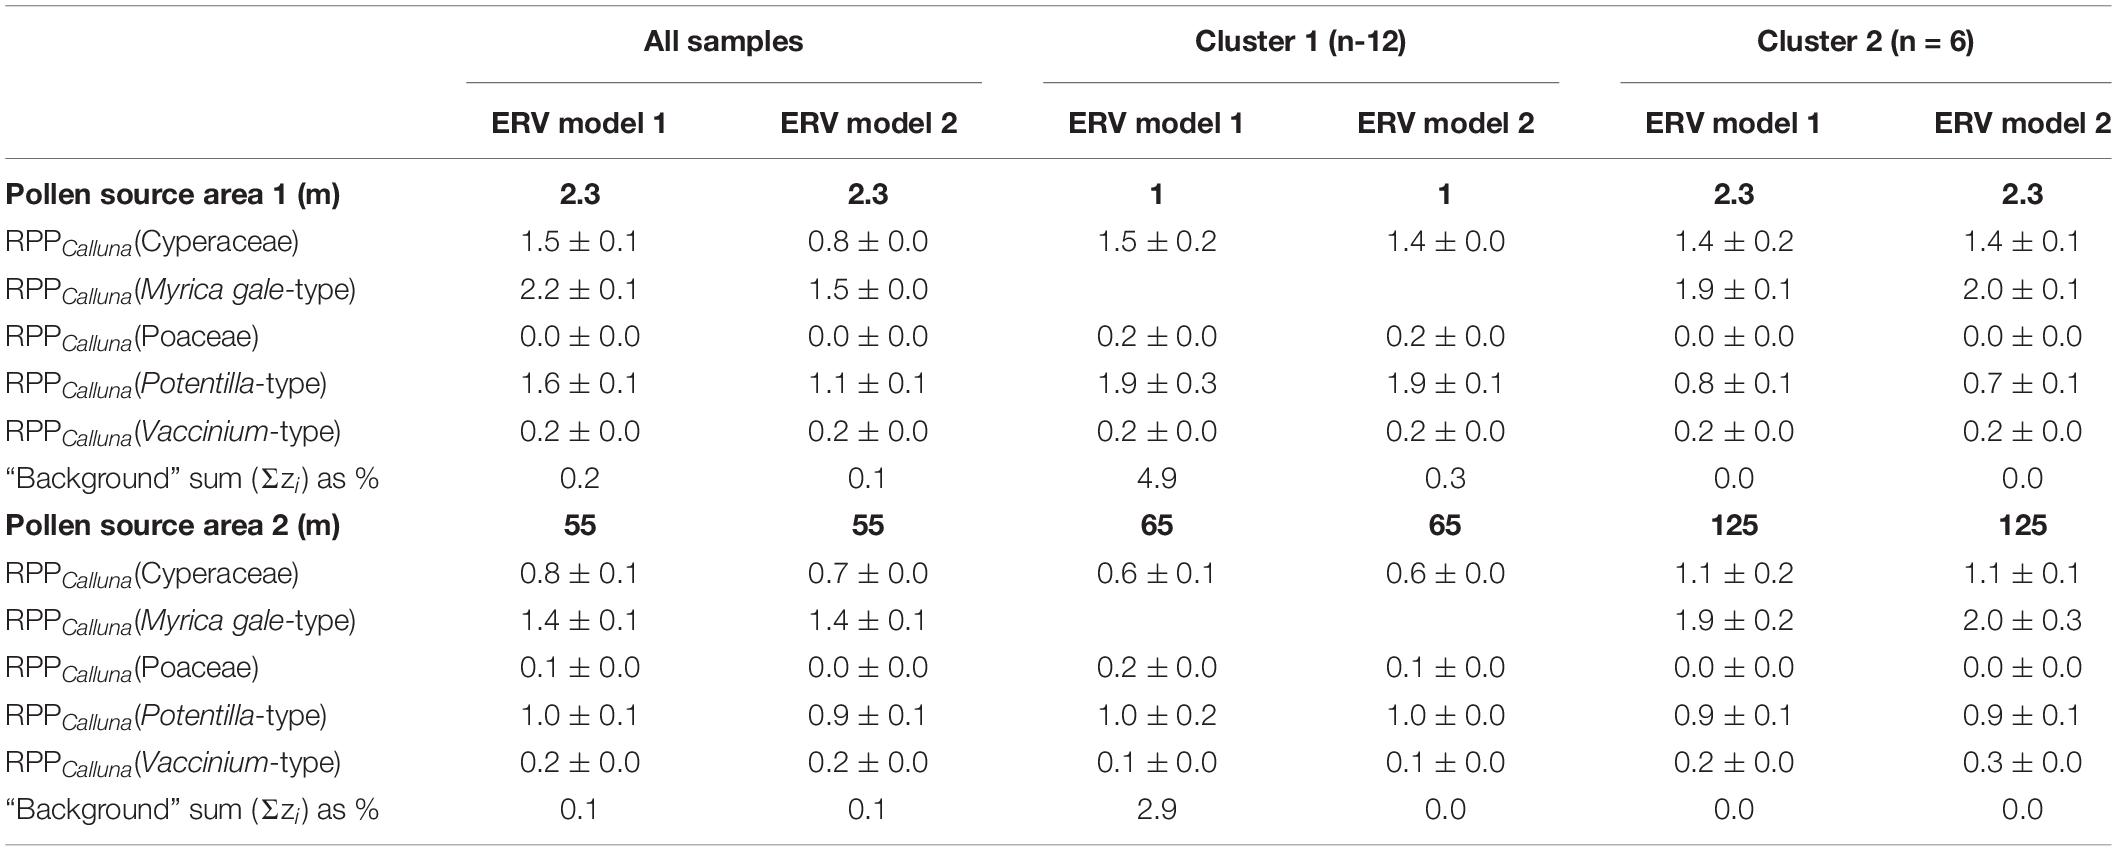
Table 3. Estimates of Pollen Productivity relative to Calluna vulgaris produced by this study (see also Figure 7).
The likelihood function score (lfs) plots are not as expected (Figure 6). An ‘ideal’ lfs plot would show a monotonic fall to a clearly defined single asymptote, which is used to identify the RSAP for the studied assemblages. However, these plots show an initial sharp fall within a few metres of the sampled point, then rise abruptly. The whole dataset plot flattens out by around 60 m, then rises gently and steadily to 2500 m. The same pattern is seen with both ERV models for all samples and for the two local habitat clusters.
We interpret this pattern as showing multiple pollen source areas (PSA) within the datasets – that is, multiple distances at which a local “best fit” between vegetation and pollen data is obtained using the ERV model fitting approach. The changes in survey method with increasing distance from the sample point are not considered to be the main cause of these effects, since most PSAs identified are located within a survey method zone rather than at the edge of one. Zone A surveys the area to 10 m, and the first PSA is at a radius of 1–3 m or so, then zone B surveys the area to 100 m and the second PSA has a radius of 55–65 m for all samples and for Cluster 2, and for Cluster 1 of around 125 m.
Table 3 summarises the RPPCalluna values at both of these apparent source areas, and values are plotted in Figure 7.
At PSA1, the shortest source area with the lowest lfs (therefore the best ERV model-data fit), the range of estimated RPPCalluna values is generally greater. Myrica gale-type always has estimated values above 1 and Vaccinium-type values below 1, around 0.2. Cyperaceae estimated values are around 1.5 except for the analysis run using model 2 on the all sample dataset. Poaceae values are unexpectedly low—effectively zero for some distances. Potentilla-type values are the most variable. At PSA2, the pattern of results differs slightly. Cyperaceae is below 1 for the full dataset and for Cluster 1, but averages 1 for Cluster 2. Poaceae again has unexpectedly low values, and Potentilla-type now averages around 1. Vaccinium-type is similar for all clusters.
The proportion of pollen found to come from beyond each PSA is also given in Table 3 (Σzi, the sum of the background term, which differs in mathematical definition between models 1 and 2). As would be expected, values at PSA1 are generally higher than values at PSA2. In several cases the background component has a value of zero, which can be interpreted as showing that all pollen from the selected taxa originated within the PSA distance. The background pollen component is typically on the order of 40-60% at the RSAP for landscapes with mosaic woodland land cover (Sugita, 1994), but here is noticeably lower. This suggests that the pollen signal of these heathland surface samples is strongly local in character, partly as a result of the small size of individual patches within the heath vegetation mosaic.
This study set out to calibrate the widely used Prentice-Sugita pollen dispersal and deposition model for common heathland taxa by applying the ERV method to different subsets of a dataset of 18 samples. Standard practice is to carry out ERV analysis at multiple distances, identify the RSAP from a plot of lfs against distance, then use either the values of the RPP coefficients estimated at that distance or a mean of the values estimated at that distance and all greater distances with similar lfs values. The standard lfs curve is monotonic and asymptotic, but in this study analysis produced a more complex curve.
We argue that this is not an artefact of small sample size or data collection strategy, but represents a real phenomenon in the way in which pollen assemblages record the surrounding vegetation which may result from multiple levels of structure within the vegetation mosaic. Bunting et al. (2004) showed that mosaic structure and patch size had a strong effect on RSAP values in simulated vegetation communities, and within this landscape it is possible to identify multiple levels of patterning, from the fine scale variability of individual tussocks, dwarf shrubs and mossy hollows which repeats on a 1-5m scale to the larger scale distribution of wet and dry communities reflecting the undulating meso-scale topography along with large-scale patches of water, woodland, plantation, moorland, road and rock which make up the landscape as a whole. The two pollen source areas identified appear to reflect this landscape characteristic. Different modes of pollen dispersal and deposition may be more or less important at the different PSAs, and may not all be modelled equally well by the Prentice-Sugita model.
This identification of multiple pollen source areas within a single dataset may also explain some of the apparent contradictions in the literature, where very different RSAPs are defined for similar landscapes. Reported RSAP for studies including only heathland communities are between 1 and 5 m (Table 1; a similar distance to that estimated for Empetrum nigrum alone by Tallis, 1997) whilst studies of other open vegetation types (Broström et al., 2004; Li et al., 2018) reported much larger RSAPs. This study suggests that multiple Pollen Source Areas may exist, depending on the scale of study, which may explain much of this apparent contradiction. This idea has significant implications for site selection and reconstruction strategies which we will explore below.
Sugita (1994) found that the estimated background pollen rain component at RSAP is 40–60%, whereas here even the shortest identified PSA has a much lower background pollen component (see Table 3), again suggesting that the pollen signal of the heathland pollen taxa recorded by these surface samples is strongly local in character.
Problems with ensuring consistent mapping of vegetation beyond 100 m were encountered, and extrapolation of community composition is not always sound, especially for the wet heath communities, since not all wet heaths have the Myrica gale-type dominance recorded within the 100 m zone. There is definitely scope to make better use of remote sensed data to improve vegetation mapping (e.g., Middleton et al., 2012) in this wider zone which should be explored in future studies.
RPPCalluna values vary somewhat according to both which definition of the pollen source area is used and which subset of data are used for analysis. Figure 7 visually summarises the variations in estimated RPPCalluna of the studied taxa. Vaccinium-type and Poaceae always have RPPCalluna less than one, and Myrica gale-type always has RPPCalluna above 1. Potentilla-type and Cyperaceae show more variability, with values ranging from 0.7 to 1.9 for Potentilla-type and from 0.6 to 1.5 for Cyperaceae. This range of values is less than that seen in Bunting and Hjelle’s (2010) investigation of the effects of different vegetation survey methods, but still sufficient to make a marked difference in simulated pollen assemblages or reconstructed vegetation cover.
One possible explanation is that these changes are the result of poor study design; sample size for Cluster 2 is small, the scatter plots (Figure 5) show a limited range of vegetation cover for the reference taxon, and Myrica gale-type is excluded from the analysis of Cluster 1. Whilst a larger number of samples would doubtless strengthen our conclusions, we consider that the patterns observed are real properties of the dataset, and should be considered seriously.
A second explanation is that these variations reflect actual differences in the RPP of the affected taxa, or of the reference taxon, in the different habitats represented by the two groups of samples. Calluna vulgaris flowering phenology is known to be altered by moisture availability (Jentsch et al., 2009) and flowering intensity can be affected by even small changes in nitrogen deposition (Phoenix et al., 2012), therefore variations in flowering and hence pollen production between the wetter and drier soil conditions represented in the habitats sampled by Clusters 1 and 2 might be expected. Local-scale changes in the pollen productivity of Calluna vulgaris would affect the RPPCalluna values of all other taxa, especially at PSA1 (since the heterogeneity of patches is most marked at those scales; Clusters 1 and 2 were defined on the basis of vegetation composition within 10m of the sampling point, and sample locations were placed within distinct plant communities). However, RPPCalluna(Poaceae) and RPPCalluna(Vaccinium-type) are consistent across all three datasets and at both distances, which suggests that, if the variation is driven by differential pollen productivity, the difference observed is due to variations in the pollen production of Cyperaceae and Potentilla-type. For Cyperaceae, this may reflect differences in the species present rather than, or in addition to, microhabitat effects. For Potentilla-type, where only Potentilla erecta was recorded in the vegetation communities included in this analysis, the variation is likely to be due to microhabitat effects such as different amounts of flowering in different habitats (taxon presence was mapped on the basis of leaf cover). This could be usefully explored in a future study by quantifying the flowering and pollen production of Calluna vulgaris and other key taxa in contrasting habitats (e.g., Waller et al., 2012 applied a similar approach to explore pollen productivity of selected woody taxa in response to different stages of the coppicing cycle).
Results from other published work are presented in Table 1, recalculated where necessary to RPPCalluna, and included graphically in Figure 8 for the four taxa where multiple comparators exist.
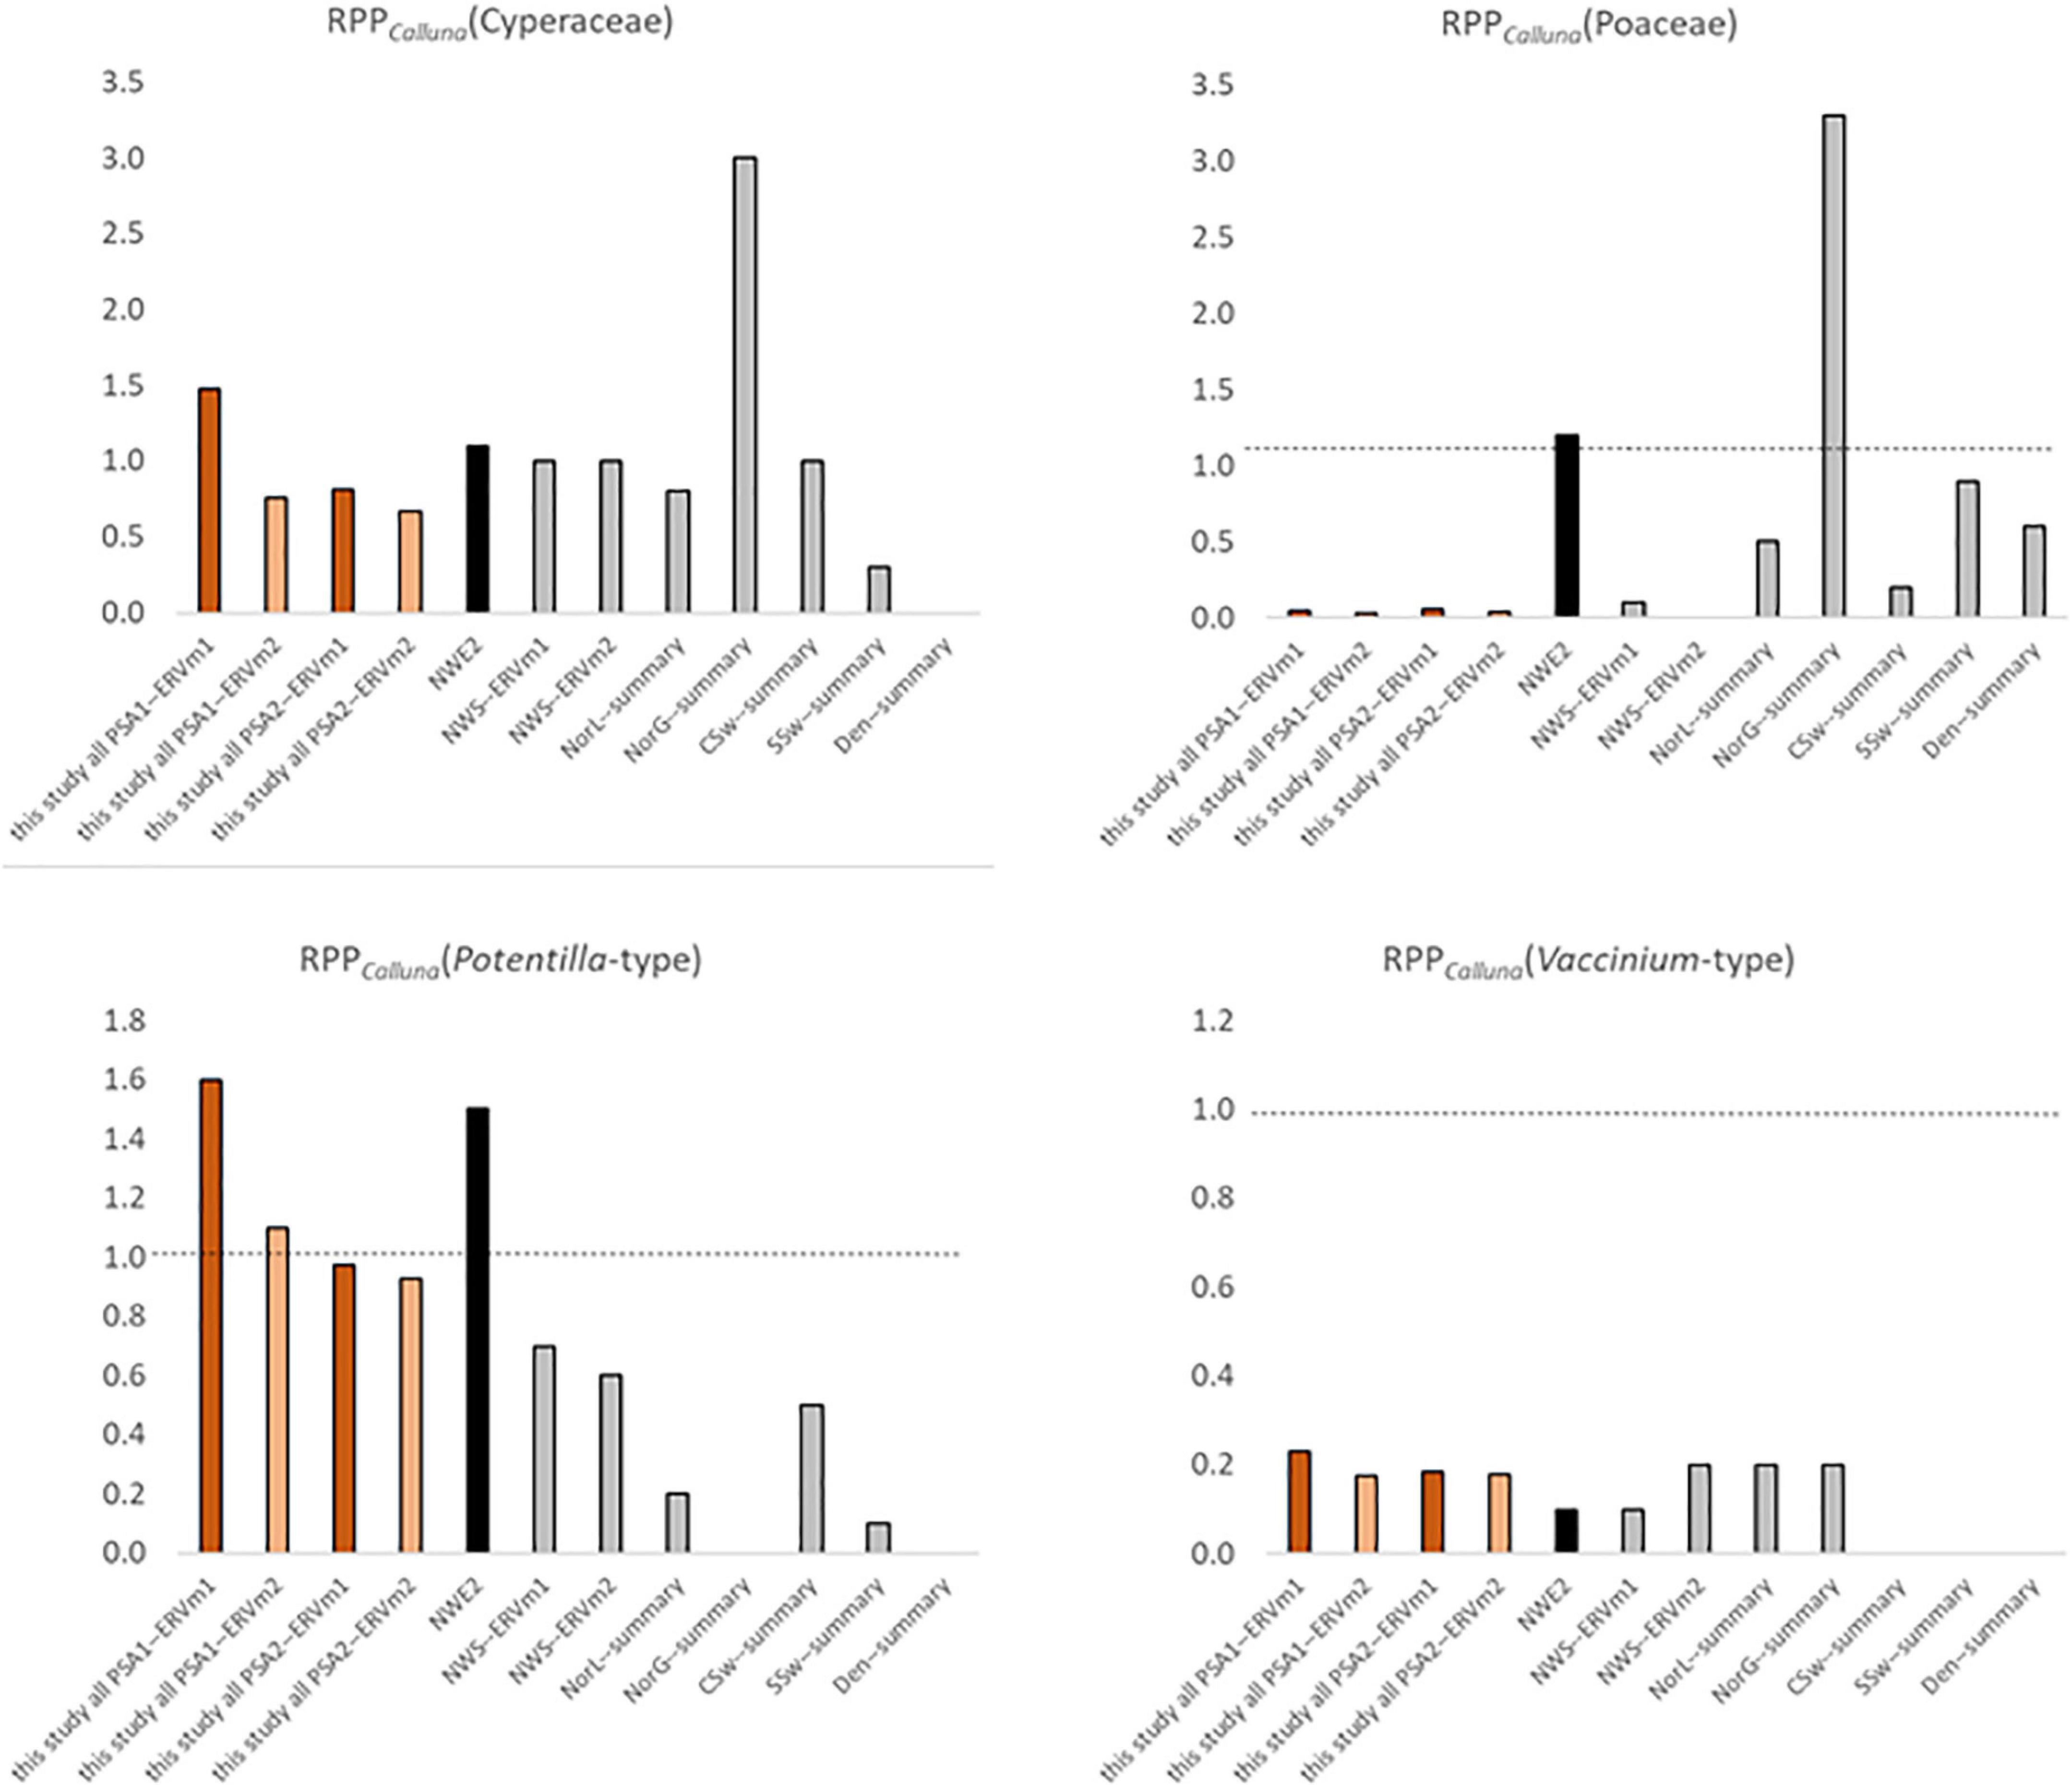
Figure 8. Comparison of Pollen Productivity relative to Calluna vulgaris for heathland taxa from multiple studies (see Table 1 for more details). Orange bars—this study, black—north-west European PPE.st2 values (Mazier et al., 2012), grey—single region studies (Table 1). Dashed line at 1.0, note varied y-axis scales, and x indicates that a taxon was not included in the original study.
The value for Poaceae is much lower than the value in the standard north-west European dataset (Mazier et al., 2012, PPE.st2), which is reasonable given that in this landscape grasses are relatively rare and subject to heavy grazing, in contrast to most of the landscapes where RPP studies have been done. It is interesting though not surprising that results from the Assynt dataset (Bunting, 2003) are very similar to this study – sample sites used were within a few tens of kilometres of each other. Bunting (2003) used a different vegetation survey method (maximum distance 4m), and sampled locations were either small basin mires or blanket peat on sloping ground near gullies supporting woodland fragments, but the RPPs seem to be reasonably robust. The range of values for RPPCalluna(Cyperaceae) and RPPCalluna(Poaceae) from previous studies in heathland-rich areas is wide. The highest values come from a Central Swedish montane region (von Stedingk et al., 2008), where Calluna is not a dominant taxon. RPPCalluna(Potentilla-type) values are generally lower than those reported here other than a very high estimate from coastal Norway (Bunting and Hjelle, 2010), and RPPCalluna(Vaccinium-type) values are broadly comparable in all studies where they were reported.
A primary implication of this study is that it is important when working with palaeoecological data to be aware that the pollen source area is a multi-faceted concept, and the pollen signal has considerable spatial complexity. In this case, the highly local nature of the signal of heathland taxa may be masked within a pollen assemblage which includes elements found only in the wider landscape, such as trees, or may not be considered during narrative interpretation of records. Separating which parts of the signal originate from local or extra-local pollen sources is a known challenge for pollen records collected from mires (e.g., Bunting and Tipping, 2004), and the clear detection of a strong, short source area within mire type communities in this study emphasises the importance of considering local conditions before interpreting the wider record. Further empirical study of modern surface samples collected from mire basins, rather than just from surface mosses within a heathland landscape, and associated vegetation data from multiple scales, would offer a better insight into how substantial the problem is, and could be coupled with testing the effectiveness of other proxies such as non-pollen palynomorphs in detecting the local and extra-local community types.
This study shows that estimating RPP values remains problematic—whilst standard values have been proposed based on comparison of multiple studies, without better understanding what controls variation in pollen production by plants within the same pollen type, decisions about which values to include or exclude risk missing some important features of the system they aim to quantify. Random sampling has been demonstrated to be more appropriate than selective sampling for RPP estimation via ERV analysis (Broström et al., 2005), but since sedimentary records are by their nature non-randomly located, understanding how local habitat affects pollen production and pollen assemblage characters is important. Ensuring that the full range of growth contexts of a species are sampled improves the likelihood that the RPP estimate will reflect the average value across the whole landscape. A particular concern raised by these findings is that, as the surface hydrology changes due to wetland evolution or regional climate change, the RPP of some of the taxa recorded may also change, presenting an additional challenge for reconstruction of past vegetation. An example of another case where unintended selective sampling may have affected the RPP estimates is Alnus in Europe. Values estimated from extensive alder-carr woodlands in a floodplain system (Bunting et al., 2005) were found to be three times higher than those reported from a non-wetland landscape (Broström et al., 2004).
This study illustrates that there is still a great deal to be understood about the natural variability of the parameters used in current models of pollen dispersal and deposition. All models require simplifying assumptions, and all models are to some degree “wrong” (Box and Draper, 1987). All pollen-based land cover reconstructions make some assumption about pollen production, whether overt or covert, and the vast majority assume that production is constant and therefore that changes in pollen proportions at different points in a core sequence imply changes in the abundance or position of the pollen-producing plants rather than a change in the amount of pollen produced by one taxon relative to another. Our findings suggest that the assumption of constant RPP may not be tenable in some cases (see also Theuerkauf et al., 2015). Given the importance of this assumption for both the many uses of pollen dispersal and deposition models and for wider interpretation of pollen records, further research is needed to determine how widespread this phenomenon is, and whether it can be incorporated into reconstruction approaches.
Further research could include replicating the type of study presented here using a wider range of sampling locations within the same type of landscape (to include woodland, grassland etc. as well as types of heath) and a larger number of samples, working with different types of natural pollen traps (e.g., small lakes, valley mires) or studying a different ecosystem which also has a range of habitat types occupied by a similar suite of palynological equivalent plant types. Another approach to this problem is to include studies of actual flowering and pollen production of plants in the field (e.g., Waller et al., 2012), or to carry out experimental studies to determine the effects of environmental factors on pollen production.
1) Analysis of heathland pollen data suggests that at least two pollen source areas exist within the dataset, reflecting scales of landscape organisation.
2) Microhabitat does not appear to have an effect on estimates of Relative Pollen Productivity in the heathland system which can be detected over the variation due to differences in source area and data analysis method. Since these RPP values were collected from a single habitat, they should be used with caution for reconstruction of past landscape scale land cover.
3) This study confirms earlier findings of markedly different values of Relative Pollen Productivity for some taxa in Atlantic heathlands, especially Poaceae, which is substantially lower than values estimated from other parts of Europe in agricultural landscapes.
4) The findings suggest that the factors controlling Relative Pollen Productivity are still not fully understood, and that differences between locations may reflect real, habitat-led differences. The assumption of constant Relative Pollen Productivity, with variations seen in the data explained as the result of sampling and methodology, needs to be re-examined. Further investigation of this parameter, which is central to reconstruction of past land cover from pollen records whether overtly incorporated via an algebraic model or less explicitly present via ecological narrative, biomisation or modern analog approaches, is clearly necessary.
The raw data supporting the conclusions of this article will be made available by the authors, without undue reservation.
MJB designed the overall project and secured the funding. MJB and MF worked together to design and carry out fieldwork, on data analysis, and preparation of the manuscript. MF counted the pollen and prepared all vegetation data for analysis. Both authors contributed to the article and approved the submitted version.
This work was funded by the Crackles Bequest Project Grant, funded by the University of Hull via a bequest from the will of F. Eva Crackles.
The authors declare that the research was conducted in the absence of any commercial or financial relationships that could be construed as a potential conflict of interest.
All claims expressed in this article are solely those of the authors and do not necessarily represent those of their affiliated organizations, or those of the publisher, the editors and the reviewers. Any product that may be evaluated in this article, or claim that may be made by its manufacturer, is not guaranteed or endorsed by the publisher.
This is manuscript number 3 from the Crackles Bequest Project. Thanks are due to Mr. & Mrs. Rex of Badentarbat, David Davies of Inverpolly, Iain McFadyen of Langwell, Angus Davidson of Ledmore, Commons Grazing Clerks Willie MacLeod, Alasdair MacLeod, Iain MacLeod, Innes Mackenzie, Anne Girvan, and Iain Campbell, and Mark Foxwell of the Scottish Wildlife Trust for granting access to sites. We are also grateful to Jodie Hall, Kim Rosewell, Laura Tunnicliff and Emma Wright, who provided cheerful and invaluable assistance with fieldwork.
Bennett, K. D. (1995). Catalogue of Pollen Types. Available Online at: http://chrono.qub.ac.uk/pollen/pc-intro.html (accessed 26 September 2021)
Beug, H.-J. (2004). Leitfaden der Pollenbestimmung für Mitteleuropa und angrenzende Gebiete. Munich: Verlag Friedrich Pfeil.
Box, G. E. P., and Draper, N. R. (1987). Empirical Model-Building and Response Surfaces. Chichester: Wiley.
Boyd, W. E. (1986). The role of mosses in modern pollen analysis: the influence of moss morphology on pollen entrapment. Pollen Spores 28, 243–256.
Broström, A., Nielsen, A. B., Gaillard, M.-J., Hjelle, K., Mazier, F., Binney, H., et al. (2008). Pollen productivity estimates of key European plant taxa for quantitative reconstruction of past vegetation: a review. Veg. Hist. Archaeobot. 17, 461–468. doi: 10.1007/s00334-008-0148-8
Broström, A., Sugita, S., and Gaillard, M.-J. (2004). Pollen productivity estimates for the reconstruction of past vegetation cover in the cultural landscape of southern Sweden. Holocene 14, 368–381. doi: 10.1191/0959683604hl713rp
Broström, A., Sugita, S., Gaillard, M.-J., and Pilesjö, P. (2005). Estimating the spatial scale of pollen dispersal in the cultural landscape of southern Sweden. Holocene 15, 252–262. doi: 10.1191/0959683605hl790rp
Bunting, M. J. (2003). Pollen-vegetation relationships in non-arboreal moorland taxa. Rev. Palaeobot. Palynol. 125, 285–298. doi: 10.1016/s0034-6667(03)00005-8
Bunting, M. J., Armitage, R., Binney, H. A., and Waller, M. (2005). Estimates of ‘relative pollen productivity’ and ‘relevant source area of pollen’ for major tree taxa in two Norfolk (UK) woodlands. Holocene 15, 459–465. doi: 10.1191/0959683605hl821rr
Bunting, M. J., Farrell, M., Broström, A., Hjelle, K. L., Mazier, F., Middleton, R., et al. (2013). Palynological perspectives on vegetation survey: a critical step for model-based reconstruction of Quaternary land cover. Quat. Sci. Rev. 82, 41–55. doi: 10.1016/j.quascirev.2013.10.006
Bunting, M. J., Gaillard, M. J., Sugita, S., Middleton, R., and Broström, A. (2004). Vegetation structure and pollen source area. Holocene 14, 651–660. doi: 10.1191/0959683604hl744rp
Bunting, M. J., and Hjelle, K. L. (2010). Effect of vegetation data collection strategies on estimates of relevant source area of pollen (RSAP) and relative pollen productivity estimates (relative PPE) for non-arboreal taxa. Veg. Hist. Archaeobot. 19, 365–374.
Bunting, M. J., and Tipping, R. M. (2004). Complex hydroseral vegetation succession and ‘dryland’ pollen signals: a case study from north-west Scotland. Holocene 14, 53–63.
Gaillard, M.-J., Sugita, S., Bunting, M. J., Middleton, R., Broström, A., Caseldine, C., et al. (2008). The use of modelling and simulation approach in reconstructing past landscapes from fossil pollen data: a review and results from the POLLANDCAL network. Veg. Hist. Archaeobot. 17, 419–443. doi: 10.1007/s00334-008-0169-3
Gaillard, M. J., Sugita, S., Mazier, F., Trondman, A. K., Broström, A., Hickler, T., et al. (2010). Holocene land-cover reconstructions for studies on land cover-climate feedbacks. Clim. Past 6, 483–499.
Hicks, S. (2006). When no pollen does not mean no trees. Veg. Hist. Archaeobot. 15, 253–261. doi: 10.1007/s00334-006-0063-9
Hill, M. O., and Šmilauer, P. (2005). TWINSPAN for Windows version 2.3. Èeské Budìjovice: Centre for Ecology and Hydrology and University of South Bohemia.
Hjelle, K. L. (1998). Herb pollen representation in surface moss samples from mown meadows and pastures in western Norway. Veg. Hist. Archaeobot. 7, 79–96. doi: 10.1007/bf01373926
Jackson, S. T. (1994). “Pollen and spores in Quaternary lake sediments as sensors of vegetation composition: theoretical models and empirical evidence,” in Sedimentation of Organic Particles, ed. A. Traverse (Cambridge: Cambridge University Press), 253–286.
Jentsch, A., Kreyling, J., Borttcher-Treschkow, J., and Beierkuhnlein, C. (2009). Beyond gradual warming: extreme weather events alter flower phenology of European grassland and heath species. Glob. Chang. Biol. 15, 837–849.
Kuoppamaa, M., Huusko, A., and Hicks, S. (2009). Pinus and Betula pollen accumulation rates from the northern boreal forest as a record of interannual variation in July temperature. J. Quat. Sci. 24, 513–521. doi: 10.1002/jqs.1276
Lepš, J., and Šmilauer, P. (2003). Multivariate Analysis of Ecological Data using CANOCO. Cambridge: Cambridge University Press.
Li, F., Gaillard, M.-J., Xu, Q., Bunting, M. J., Li, Y., Li, J., et al. (2018). A review of relative pollen productivity estimates from temperate China for pollen-based quantitative reconstruction of past plant cover. Front. Plant Sci. 9:1214. doi: 10.3389/fpls.2018.01214
Lisitsyna, O. V., and Hicks, S. (2014). Estimation of pollen deposition time-span in moss polsters with the aid of annual pollen accumulation values from pollen traps. Grana 53, 232–248. doi: 10.1080/00173134.2014.916344
Lisitsyna, O. V., Hicks, S., and Huusko, A. (2012). Do moss samples, pollen traps and modern lake sediments all collect pollen in the same way? A comparison from the forest limit area of northernmost Europe. Veg. Hist. Archaeobot. 21, 187–199. doi: 10.1007/s00334-011-0335-x
May, R. L., Warner, S., and Wingler, A. (2017). Classification of intra-specific variation in plant functional strategies reveals adaptation to climate. Ann. Bot. 119, 1343–1352. doi: 10.1093/aob/mcx031
Mazier, F., Gaillard, M.-J., Kuneš, P., Sugita, S., Trondman, A.-K., and Broström, A. (2012). Testing the effect of site selection and parameter setting on REVEALS-model estimates of plant abundance using the Czech Quaternary Palynological Database. Rev. Palaeobot. Palynol. 187, 38–49. doi: 10.1016/j.revpalbo.2012.07.017
Middleton, M., Narhi, P., Arkimaa, H., Hyvonen, E., Kuosmanen, V., Treitz, P., et al. (2012). Ordination and hyperspectral remote sensing approach to classify peatland biotopes along soil moisture and fertility gradients. Remote Sens. Environ. 124, 596–609. doi: 10.1016/j.rse.2012.06.010
Middleton, R., and Bunting, M. J. (2009). Equifinality and uncertainty in the interpretation of pollen data: the Multiple Scenario Approach to reconstruction of past vegetation mosaics. Holocene 19, 799–803. doi: 10.1177/0959683609105304
Moore, P. D., Webb, J. A., and Collinson, M. E. (1991). Pollen Analysis, 2nd Edn. Oxford: Blackwell.
Nielsen, A. B. (2004). Modelling pollen sedimentation in Danish lakes at c. AD 1800: an attempt to validate the POLLSCAPE model. J. Biogeogr. 31, 1693–1709.
Nielsen, A. B., Møller, P. F., Giesecke, T., Stavngaard, B., Fontana, S. L., and Bradshaw, R. H. W. (2010). The effect of climate conditions on inter-annual flowering variability monitored by pollen traps below the canopy in Draved Forest, Denmark. Veg. Hist. Archaeobot. 19, 309–323.
Parsons, R. W., and Prentice, I. C. (1981). Statistical approaches to R-values and the pollen–vegetation relationship. Rev. Palaeobot. Palynol. 32, 127–152. doi: 10.1016/0034-6667(81)90001-4
Phoenix, G. K., Emmett, B. A., Britton, A. J., Caporn, S. J. M., Dise, N. B., Helliwell, R., et al. (2012). Impacts of atmospheric nitrogen deposition: responses of multiple plant and soil parameters across contrasting ecosystems in long-term field experiments. Glob. Chang. Biol. 18, 1197–1215. doi: 10.1111/j.1365-2486.2011.02590.x
Prentice, I. C., and Parsons, R. W. (1983). Maximum likelihood linear calibration of pollen spectra in terms of forest composition. Biometrics 39, 1051–1057. doi: 10.2307/2531338
Räsänen, S., Hicks, S., and Odgaard, B. V. (2004). Pollen deposition in mosses and in a modified ‘Tauber trap’ from Hailuoto, Finland: what exactly do the mosses record? Rev. Palaeobot. Palynol. 129, 103–116. doi: 10.1016/j.revpalbo.2003.12.001
Rowland, C. S., Morton, R. D., Carrasco, L., McShane, G., O’Neil, A. W., and Wood, C. M. (2017). Data from: land Cover Map 2015 (vector, GB). United Kingdom: NERC Environmental Information Data Centre. doi: 10.5285/6c6c9203-7333-4d96-88ab-78925e7a4e73
Sugita, S. (1994). Pollen representation of vegetation in Quaternary sediments: theory and method in patchy vegetation. J. Ecol. 82, 881–897. doi: 10.2307/2261452
Sugita, S. (2007a). Theory of quantitative reconstruction of vegetation I: pollen from large sites REVEALS regional vegetation composition. Holocene 17, 229–241. doi: 10.1177/0959683607075837
Sugita, S. (2007b). Theory of quantitative reconstruction of vegetation II: all you need is LOVE. Holocene 17, 243–257. doi: 10.1177/0959683607075838
Tallis, J. H. (1997). The pollen record of Empetrum nigrum in southern Pennine peats: implications for erosion and climate change. J. Ecol. 85, 455–465. doi: 10.2307/2960569
Tauber, H. (1965). Differential pollen dispersion and the interpretation of pollen diagrams. Danmarks Geologiske Undersøgelse 89, 1–69. doi: 10.34194/raekke2.v89.6880
Tauber, H. (1967). Investigations of the mode of pollen transfer in forested areas. Rev. Palaeobot. Palynol. 3, 277–286. doi: 10.1016/0034-6667(67)90060-7
Theuerkauf, M., Dräger, N., Kienel, U., Kuparinen, A., and Brauer, A. (2015). Effects of changes in land management practices on pollen productivity of open vegetation during the last century derived from varved lake sediments. Holocene 25, 733–744. doi: 10.1177/0959683614567881
von Stedingk, H., Fyfe, R. M., and Allard, A. (2008). Pollen productivity estimates from the forest-tundra ecotone in west-central Sweden: implications for vegetation reconstruction at the limits of the boreal forest. Holocene 18, 323–332. doi: 10.1177/0959683607086769
Keywords: multiple pollen source areas, Relative Source Area of Pollen (RSAP), extended R-value (ERV) analysis, Scotland, Relative Pollen Productivity (RPP), heathland
Citation: Bunting MJ and Farrell M (2022) Do Local Habitat Conditions Affect Estimates of Relative Pollen Productivity and Source Area in Heathlands? Front. Ecol. Evol. 10:787345. doi: 10.3389/fevo.2022.787345
Received: 30 September 2021; Accepted: 05 January 2022;
Published: 27 January 2022.
Edited by:
Laurent Marquer, Max Planck Institute for Chemistry, GermanyReviewed by:
Triin Reitalu, Tallinn University of Technology, EstoniaCopyright © 2022 Bunting and Farrell. This is an open-access article distributed under the terms of the Creative Commons Attribution License (CC BY). The use, distribution or reproduction in other forums is permitted, provided the original author(s) and the copyright owner(s) are credited and that the original publication in this journal is cited, in accordance with accepted academic practice. No use, distribution or reproduction is permitted which does not comply with these terms.
*Correspondence: Mairi Jane Bunting, bS5qLmJ1bnRpbmdAaHVsbC5hYy51aw==
Disclaimer: All claims expressed in this article are solely those of the authors and do not necessarily represent those of their affiliated organizations, or those of the publisher, the editors and the reviewers. Any product that may be evaluated in this article or claim that may be made by its manufacturer is not guaranteed or endorsed by the publisher.
Research integrity at Frontiers

Learn more about the work of our research integrity team to safeguard the quality of each article we publish.