 Geruza L. Melo1†
 Felipe O. Cerezer
 Nilton C. Cáceres
95% of researchers rate our articles as excellent or good
Learn more about the work of our research integrity team to safeguard the quality of each article we publish.
Find out more
ORIGINAL RESEARCH article
Front. Ecol. Evol. , 22 August 2022
Sec. Population, Community, and Ecosystem Dynamics
Volume 10 - 2022 | https://doi.org/10.3389/fevo.2022.740371
This article is part of the Research Topic Drivers of Small-Mammal Community Structure in Tropical Savannas View all 14 articles
The focus of research and conservation in tropical regions is mainly devoted to forest ecosystems, usually neglecting the processes underlying widespread, more open biomes, like savannas. Here we test a wide range of sampled woodland sites across the South American savanna for the direct and indirect effects of habitat loss and vegetation density on the diversity of small-mammal species. We quantify the direction and magnitude of the effects of habitat amount (habitat loss), vegetation density (tree or foliage density), and patch size (species-area effect) on species composition and richness. We also test whether the relative effect sizes of landscape and patch-related metrics predict a persistence gradient from habitat specialist to generalist species across 54 sites. We used structural equation models (SEM) to test our predictions. After 22,032 trap-nights considering all sampled sites and 20 small-mammal species identified, the structural equation model explained 23.5% of the variance in the richness of small-mammal species. Overall, we found that landscape-level metrics were more important in explaining species richness, with a secondary role of patch-level metrics such as vegetation density. The direct effect of local landscape was significant for explaining species richness variation, but a strong positive association between regional and local landscapes was also present. Furthermore, considering the direct and indirect paths, SEM explained 46.2% of the species composition gradient. In contrast to species richness, we recorded that the combined landscape-level and patch-level metrics are crucial to determining small-mammal species composition at savanna patches. The small mammals from the South American woodland savanna exhibit clear ecological gradients on their species composition and richness, driven by habitat specialist (e.g., Thrichomys fosteri, Monodelphis domestica, and Thylamys macrurus) and generalist (e.g., Didelphis albiventris, Rhipidomys macrurus, and Calomys callosus) species’ responses to habitat amount and/or vegetation density, as seen in dense-forest Neotropical biomes.
In Conservation Biology, alternative hypotheses have been proposed to explain diversity loss such as the habitat amount and fragmentation per se hypotheses (Saura, 2020). The Habitat Amount Hypothesis (HAH) deals with the habitat amount that remains in a given landscape after disturbance and its effects on species diversity (Fahrig, 2013). On the other hand, fragmentation per se deals with habitat configuration, which is given by, e.g., the proportion of patches and edges (Haddad et al., 2015; Saura, 2020) or the landscape connectance (Horváth et al., 2019) present in a regional or local unit. Empirical supports for the effects of HAH and fragmentation per se have been found but they are difficult to disentangle (e.g., Melo et al., 2017; Gardiner et al., 2018), although there are tentative claims to put them in a more integrative framework (Horváth et al., 2019; Saura, 2020).
This debate is mainly fueled by the overall lack of standardization in such studies, such as the considered extension of landscape size (e.g., buffer of 1 km or 2 km radius), or configuration attribute (e.g., edges, patches, and isolation), leading to an at times biased conclusion in favor of one or the other (Chase et al., 2018; Horváth et al., 2019). Concerning landscape extension, some studies applied a “landscape scale effect” approach, which consists of a buffer around the sample site that varies in size according to species dispersal capacity (Melo et al., 2017; Viana and Chase, 2019). However, other studies claimed that such a local landscape view would be biased since the local landscape is inserted in a broader regional landscape context, which, in turn, will influence the local landscape dynamic (Hanski, 2015; Saura, 2020). Therefore, it’s important to disentangle and understand the effect of habitat amount at different spatial scales and even in a nested landscape configuration (e.g., a local landscape nested in a regional one). Furthermore, habitat quality has been relatively successful in explaining biodiversity loss (Curran, 1982; Goward et al., 1985; Fischer and Lindenmayer, 2007). For example, habitat heterogeneity is one of the main drivers of mammalian richness and nestedness, overcoming habitat amount in a Neotropical savanna (Regolin et al., 2020). Specifically, Regolin et al. (2020) used a buffer extent of 8-km radius and concomitantly tested the effect of heterogeneity and habitat amount on mammals of different body sizes. Furthermore, patch size can affect (e.g., Lindenmayer et al., 2000) and explain local diversity (the so-called species-area relationship) by including edge effect, which decreases with patch size, and habitat diversity, which increases with patch size (Murcia, 1995; Chown et al., 1998). Therefore, there are different hypotheses for explaining the decay of biodiversity across disturbed sites, but we highlight the need of an overall standardization in studies dealing with these subjects. Combining them into an integrative framework can provide important insights (Horváth et al., 2019; Saura, 2020), particularly in poorly studied ecosystems like savannas.
The patterns and processes involved in the current biodiversity loss have been subjected to extensive studies (Dirzo and Raven, 2003). These studies have revealed important findings such as the biotic gradient in the occurrence of specialist and generalist species across landscapes or the extinction threshold in which species may or may not endure depending on the habitat amount in the landscape (Banks-Leite et al., 2014). However, research and conservation in tropical regions mainly focus on forest ecosystems, neglecting the processes underlying widespread open biomes like savannas (Olson et al., 2001; Pennington et al., 2018).
Small mammals from the South American savannas are a diversified mammalian group composed of a mix of marsupials and rodents weighing less than 1 kg on average. They exhibit different lifestyles, including arboreal, scansorial, terrestrial, and semifossorial species (Paglia et al., 2012). Essentially, marsupials tend to be more arboreal and scansorial, while rodents tend to be more terrestrial and semifossorial (Bubadué et al., 2019). In the forest biome, there are clues that they respond to the habitat fragmentation with local extinction of potentially habitat specialist species (Banks-Leite et al., 2014). On the other hand, it appears that there are common generalist species capable of occurring in different habitats of savanna, including disturbed landscapes of adjacent dense forest biomes (Melo et al., 2017; Palmeirim et al., 2020).
Studies in forest ecosystems have revealed that specialized species are more prone to local extinction in a disturbed landscape (Pardini et al., 2010). In fact, specialized species are more dependent on habitat particularities like proper microhabitats or food resources (Devictor et al., 2008; Gardiner et al., 2018). Yet, they can persist in landscapes with more habitat amounts or larger patches (Pardini et al., 2010; Melo et al., 2017; Gardiner et al., 2018). Interestingly, disturbed landscapes may be invaded by generalist species common in savannas (Maracahipes et al., 2018). This phenomenon has been observed in South America biomes such as the dense forests of Amazon and the Atlantic forest, which are invaded by species typically from the adjacent savanna (regionally named Cerrado) (Palmeirim et al., 2020). That suggests an ecological process of habitat specialization in the South American savanna biome, which is historically composed of a mosaic of grassland, woodland-savanna, and forest vegetation, but which is indeed dominated by woodlands rather than the African traditional open, grassland savanna (Eiten, 1982; De Vivo and Carmignotto, 2004). Such woodland savanna has a different characteristic regarding the forest biome, being essentially dry, highly seasonal, and less tall regarding tree or shrub height (Eiten, 1982). Therefore, one question here is to determine if there is a gradient from woodland habitat specialist to generalist species in such savannas as occurs in dense humid forests and if that species-composition gradient closely follows the habitat amount as a predictor or another habitat index such as vegetation density.
Here we test a wide range of sampled sites across the South American woodland savannas for the direct and indirect effects of habitat loss and vegetation density on the variation of small-mammal species diversity under the hypotheses of habitat amount (Fahrig, 2013) versus habitat complexity (August, 1983) as drivers of species diversity. Precisely, we quantify the direction and magnitude of the effects of habitat amount (habitat loss), patch size, and vegetation density (which are measures of habitat quality) on species composition and richness. We also test if the relative effect sizes of local, regional, and habitat-related metrics predict the species richness variation and a persistence gradient from habitat specialist to generalist species across savanna sampled sites. We predict that (1) overall habitat amount will be more critical than patch size (based on Melo et al., 2017, for small mammals using a 2-km radius buffer) in explaining the response variables. However, (2) vegetation density will be more important than habitat amount or patch size in driving the species-composition gradient (based on Regolin et al., 2020, for mammals). Overall (3) we expect to find negative effects of habitat loss and habitat quality on both species composition and richness, especially in savanna landscapes with low and intermediate levels of habitat amount (Pardini et al., 2010). That is, (4) we expect to find different community compositions according to habitat amount and vegetation density, (5) with more woodland-specialist species (disregarding taxonomic group, marsupial or rodent, but segregating those functionally more terrestrial species; Melo, 2023) occurring in landscapes with more woodland cover or in patches with high density of trees or foliage (Pardini et al., 2005).
Our studied samples are located in a woodland savanna region in the central portion of South America, regionally named Cerrado. The Cerrado occupies approximately 22% of Brazilian territory, extending to smaller parts of Paraguay and Bolivia. The vegetation is heterogeneous and contains different physiognomies, including grasslands, scrub-like savanna, woodland areas, and gallery forests (Eiten, 1982). We selected our samples from the southern part of this ecoregion (Cerrado) where the woodland savanna (regionally called as “cerradão”) is highly dominant (Silva et al., 2006). In this vegetation type, the occurrence of arboreal trees typical of savanna is common, giving an overall appearance of a dense forest (Supplementary Figure 1). Most open areas consist of highly modified grazing lands composed of exotic species.
The region has undergone intensive agricultural and pastoral expansion over recent years, being under a rapid conversion of natural areas to croplands and grazed lands. Some studies estimated the loss of around 50% of the Cerrado natural vegetation, replaced by anthropic land use, and that about 80% are under some form of human use (Mittermeier et al., 1999; Machado et al., 2004; Klink and Machado, 2005). Besides, only 6.5% of the Cerrado is legally protected (Françoso et al., 2015).
We sampled six regional square landscapes of 15 × 15 km (hence 22,500 ha each), between the coordinates 20°17′–21°15′S and 54°53′–56°31′W (Figure 1). These samples included different percentages of habitat amount (i.e., woodland savanna which occurs in more or less isolated patches): two with 10, two with 30, and two with 50% of natural habitat cover. The landscapes are similar in topography and climate but differ in the average distance between patches, which is higher in landscapes with less habitat amount. The maximum distance between the six regional landscapes was ∼ 160 km and the minimum distance between sampled areas was ∼ 1 km. All of them are inserted in the same river basin (left margin of the Paraguay River) to reduce the variation in species composition between sampled areas. Thus, differences in species composition between them should be primarily related to differences in the habitat amount and vegetation quality and not to differences in species distribution range between areas.
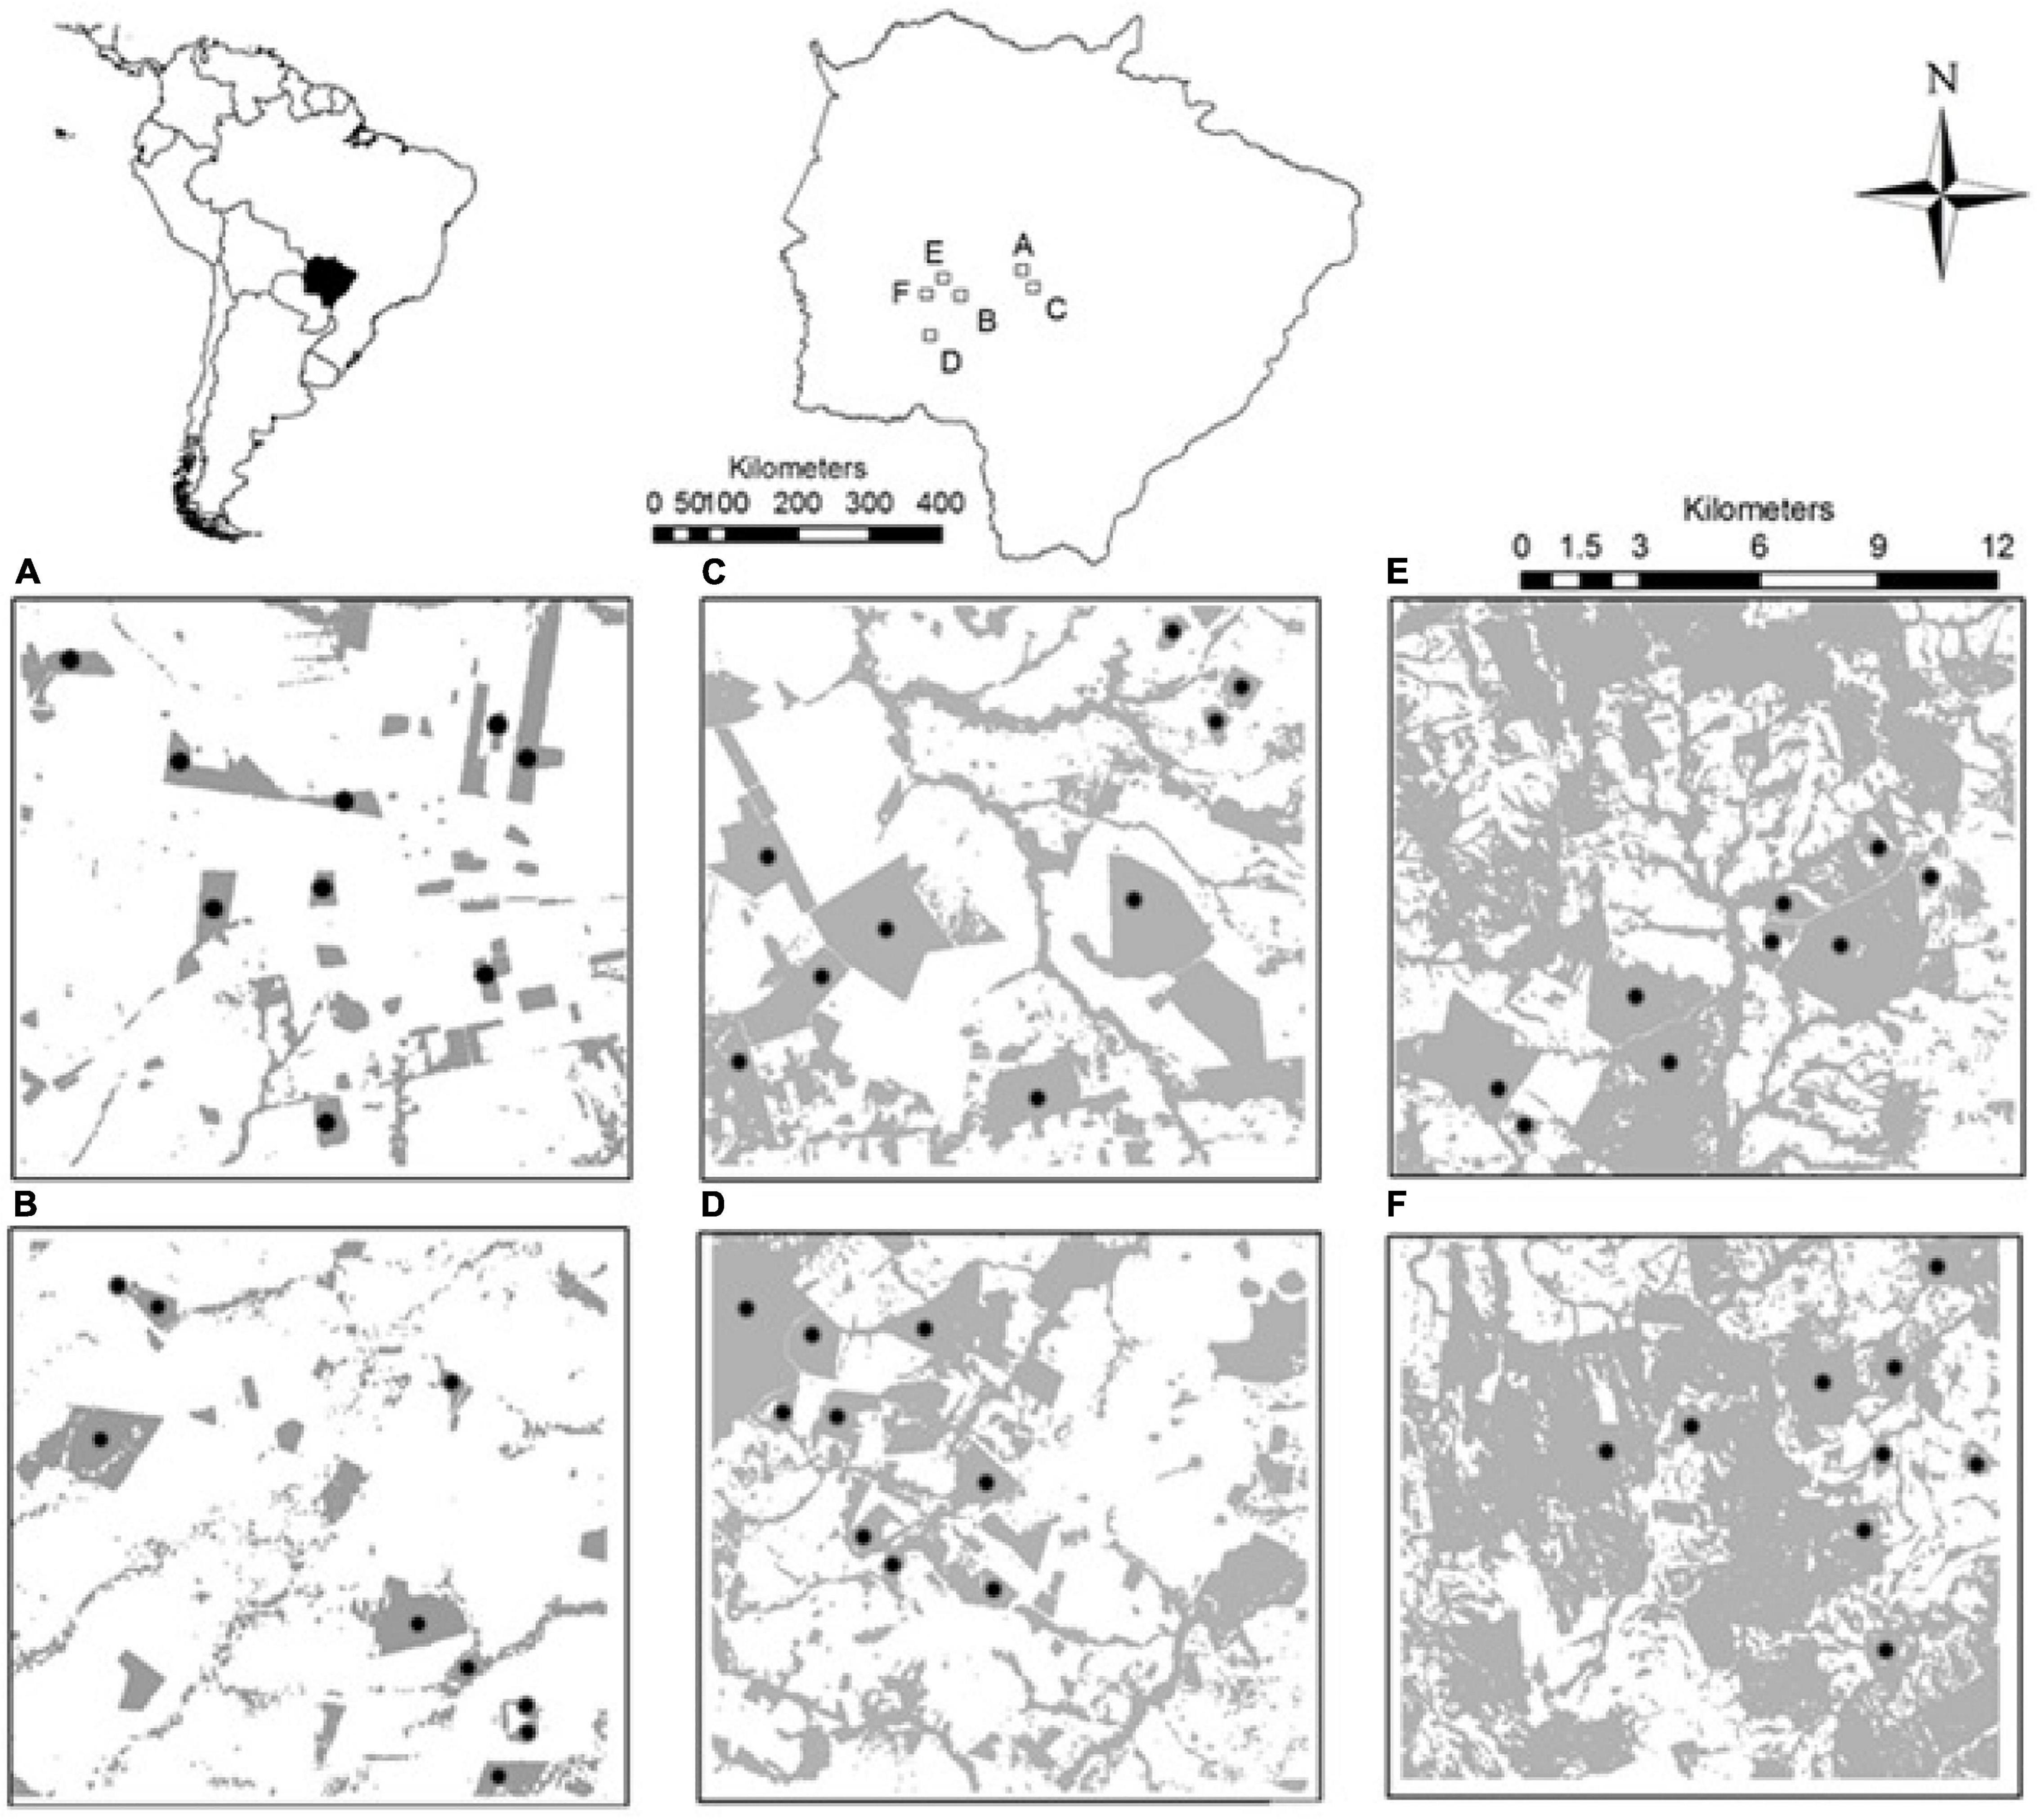
Figure 1. Regional landscapes with 10% (A,B), 30% (C,D) and 50% (E,F) of habitat amount indicating the distribution of sampled patches (dots). In gray, areas of natural remaining woodland savanna vegetation (“cerradão”). Empty white spaces indicate the matrix around woodland savanna patches which are mainly composed by pastures. The maps on the top situate the study area in South America (left) and the Mato Grosso do Sul state (right).
In each regional landscape, we chose nine patches to sample small mammals. Each patch received 20 live traps distributed along two transect lines 300 m apart from each other and at 50 m from the patch edge. In each transect, ten live traps were placed alternately on the ground (wire: 33 cm × 12 cm × 12 cm) and in the understory (Sherman: 30 cm × 9 cm × 7 cm) at 1.5 m height. The transect lines were inserted only in woodland areas since the gallery or riparian forest can have a particular fauna and were not present in all patches.
Four field surveys of five or six consecutive nights were conducted, two in the rainy season (February/March 2012 and November/December 2012) and two in the dry season (July/August 2012 and June/July 2013). We believe that our effort (mean of 408 trap-night per patch) was enough to sample the local community structure of small mammals by sampling rather common species (and possibly some rare ones) living in each patch (see Regolin et al., 2020 for a similar approach).
We marked the small-mammal individuals captured with numbered ear-tags (Tag style 1005-1, National Band and Tag, Newport, KY, United States) and released them at the same point of capture. When identification in the field was not possible, we euthanized the individual for identification in the laboratory. The collected individuals were deposited in UFSM and UFMT mammal collections as vouchers. Sampling technique and specimen collection were approved by the Instituto Chico Mendes de Conservação da Biodiversidade (ICMBio) (protocol 30808-2) and comply with guidelines published by the American Society of Mammalogists for the use of wild mammals in research (Sikes and Gannon, 2011).
To infer ecological processes operating in fragmented landscapes, we quantified species composition and richness for each sampling site. Species richness was calculated by counting the number of small mammal species observed in each sampled site. Therefore, we considered the two transect lines of a patch together as a sampling unit (referred as “site” hereafter). To verify whether our results were biased by incomplete sampling, we extrapolated species richness in each sampled site with Chao (1984) non-parametric method, using the estimateR function in the vegan package (Chiu et al., 2014; Oksanen et al., 2020). Because the observed and extrapolated species richness models were highly associated (Supplementary Figure 2), we used the extrapolated results, placing the observed ones as supplementary. Based on species-accumulation curves from the specaccum function in the vegan package (Oksanen et al., 2020), we concluded that our sampling events were appropriate to detect most of the species present (Supplementary Figure 3).
The changes in species composition between all pairs of sites were detected using classical scaling (Principal Coordinates Analysis—PCoA) based on a Jaccard dissimilarity matrix. The Jaccard dissimilarity captures the degree to which communities differ in their observed composition (see Baselga, 2012, for further discussion on the topic). We used the scores of the first PCoA component to summarize the species composition among sampled sites. Jaccard dissimilarity was computed using the vegdist function from the vegan package (Oksanen et al., 2020) and the PCoA using the pcoa function from the ape package (Paradis and Schliep, 2019).
Determination of species habit regarding habitat selection was performed according to the classification in Melo et al. (2017). Small-mammal species were classified as specialist or generalist according to the following criteria: (1) publications indicating the species is sensitive to woodland savanna loss and/or (2) studies showing occurrence is restricted to woodland areas in the case of specialist species, i.e., generalist species are not sensitive to woodland loss and occur in different habitat types (e.g., grasslands and riparian forests). This a priori habitat-use classification was compared with a species gradient of woodland occurrence generated in this study, ordering species occurrence according to the degree of species affinity to sites with more habitat amount or vegetation density (see the PCoA analysis below).
We classified recent TM/Landsat-7 images of the south region of Cerrado using the GIS SPRING program (Camara et al., 1996). Using a supervised classification, we classified the study region following a two-step process. First, we classified the landscape as woodland/not woodland, and then we quantified the cover (habitat amount) by wooded habitat as a metric of “habitat” (Table 1).
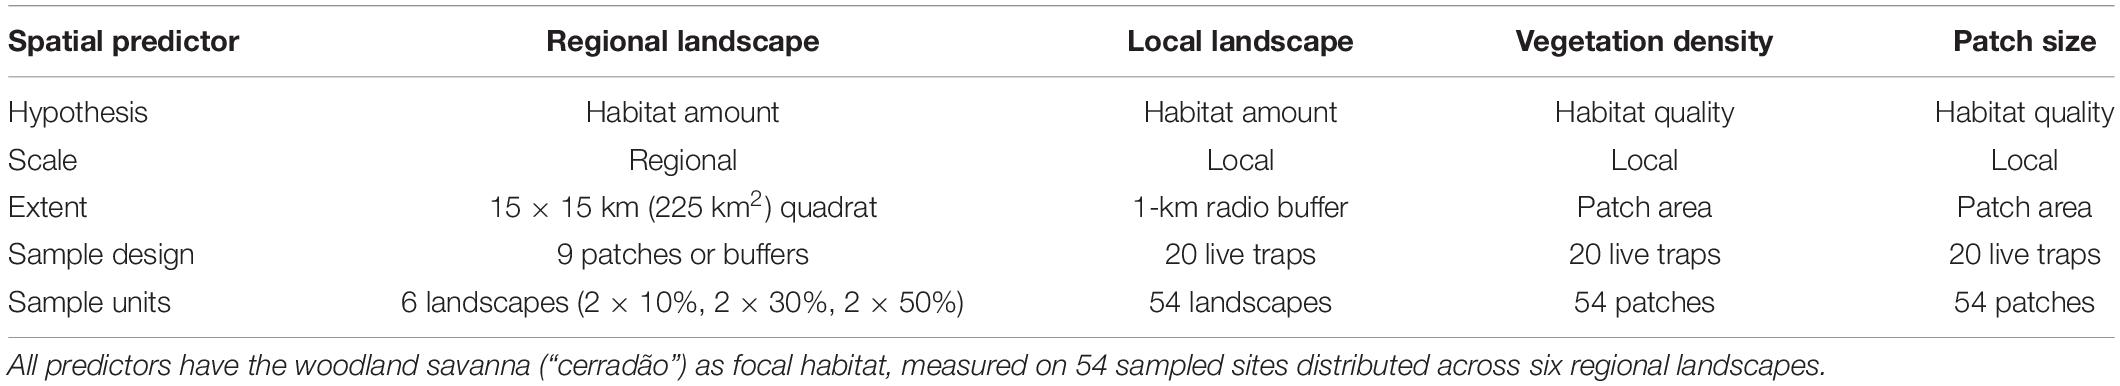
Table 1. The three level spatial extents measured in this study, which were used as predictors for small-mammal composition and richness.
Our study comprised three different hierarchical spatial scales: (i) six regional 225 km2 square landscapes with 10, 30, or 50% of habitat amount; (ii) 54 local landscapes (nine local landscapes inserted in each regional landscape), which consists of a 1 km-radius buffer around the sampled patch; and (iii) the 54 sampled patches (one patch inside each local landscape), which received two transect lines that were grouped as a unique sampled site (Figure 1 and Table 1). As the predictive power was very congruent when considering alternative buffers of 0.5, 0.75, 2, 3 km radius (Supplementary Table 1), we used the scale of 1 km-radius buffer to represent local landscape characteristics.
Our predictor variables in each scale were: (i) the regional habitat amount (corresponding to 10, 30, or 50% of habitat amount); (ii) local landscape habitat amount (continuous variable corresponding to the habitat amount at 1 km-radius local landscape); (iii) vegetation density, and (iv) patch size (both continuous) (Table 1). For vegetation density, we used the normalized difference vegetation index (NDVI) to quantify the average density of vegetation in each patch, whereby higher values indicate patches with denser, more complex vegetation. This index is based on the contrasting behavior of the spectral reflectance measurements acquired in the visible (red) and near-infrared regions. The NDVI provides an estimation of vegetation density in each patch because it is highly correlated with vegetation parameters such as green-leaf biomass, green-leaf area, and absorbed photosynthetically active radiation (Curran, 1982; Goward et al., 1985; Colombo et al., 2003; Wood et al., 2012). We quantified NDVI during the dry season of 2013 when the sky is free of clouds, which usually interferes in this estimation, by taking the images related to the time of field survey and processing them at the Instituto Nacional de Pesquisas Espaciais (INPE, Santa Maria).
We implemented a Structural Equation Modeling (SEM) to assess the magnitude and direction of habitat loss and vegetation density on species diversity (i.e., species composition and richness). SEM is a powerful tool for exploring multivariate causal relationships and has been routinely used for several ecological applications (Grace et al., 2010; Fan et al., 2016). Our framework hypothesizes that differences in species composition and richness among sampled sites can be predicted by direct and indirect effects of variables measured at the patch (patch size and averaged patch NDVI = vegetation density, hereafter) and landscape levels (habitat amount at a local landscape within 1 km-radius, and habitat amount at a regional landscape within a ∼7.5 km-radius). Specifically, the direct paths on the species composition and richness included the effects of patch size, vegetation density, habitat amount at 1 km-radius buffer (local landscape cover, hereafter), and habitat amount inside a 225 km2 area (regional landscape cover, hereafter).
Additionally, we modeled three indirect paths in which the effects at the landscape level can be mediated through variables at the patch level. For example, the regional landscape cover was predicted to indirectly affect species richness through local landscape cover and vegetation density. Also, local landscape cover was predicted to affect species diversity (composition and richness) indirectly through vegetation density. Lastly, patch size was also adjusted to indirectly affect species diversity through vegetation density (via edge effect, for example). The total effect of a predictor on species composition and richness is defined as the sum of direct and indirect paths.
We considered linear fits for all paths in the SEM and ran separate models for extrapolated species composition and richness (PCoA axis 1). We used the standardized regression coefficients (β) to evaluate the relative contribution of each hypothesized effect. Unstandardized coefficients, which provide measures of the expected change in response variables in absolute units, are shown in the Supplementary Material. We also previously checked that the included variables in the SEM do not exhibit high collinearities (Supplementary Figure 4). SEM was conducted using the sem function from the R lavaan package (Rosseel, 2012). All procedures were performed in the R software (R Development Core Team, 2021).
Surveys resulted in 22,032 trap-nights considering all sampled woodland patches. We identified 20 small mammal species (eight marsupials and 12 rodent species) (Supplementary Table 2). The structural equation model (SEM) explained 23.5% of the variance in small mammal species richness (Figure 2A). Still, roughly similar results were recorded when using observed species richness instead of extrapolated richness (Supplementary Figures 5, 6).
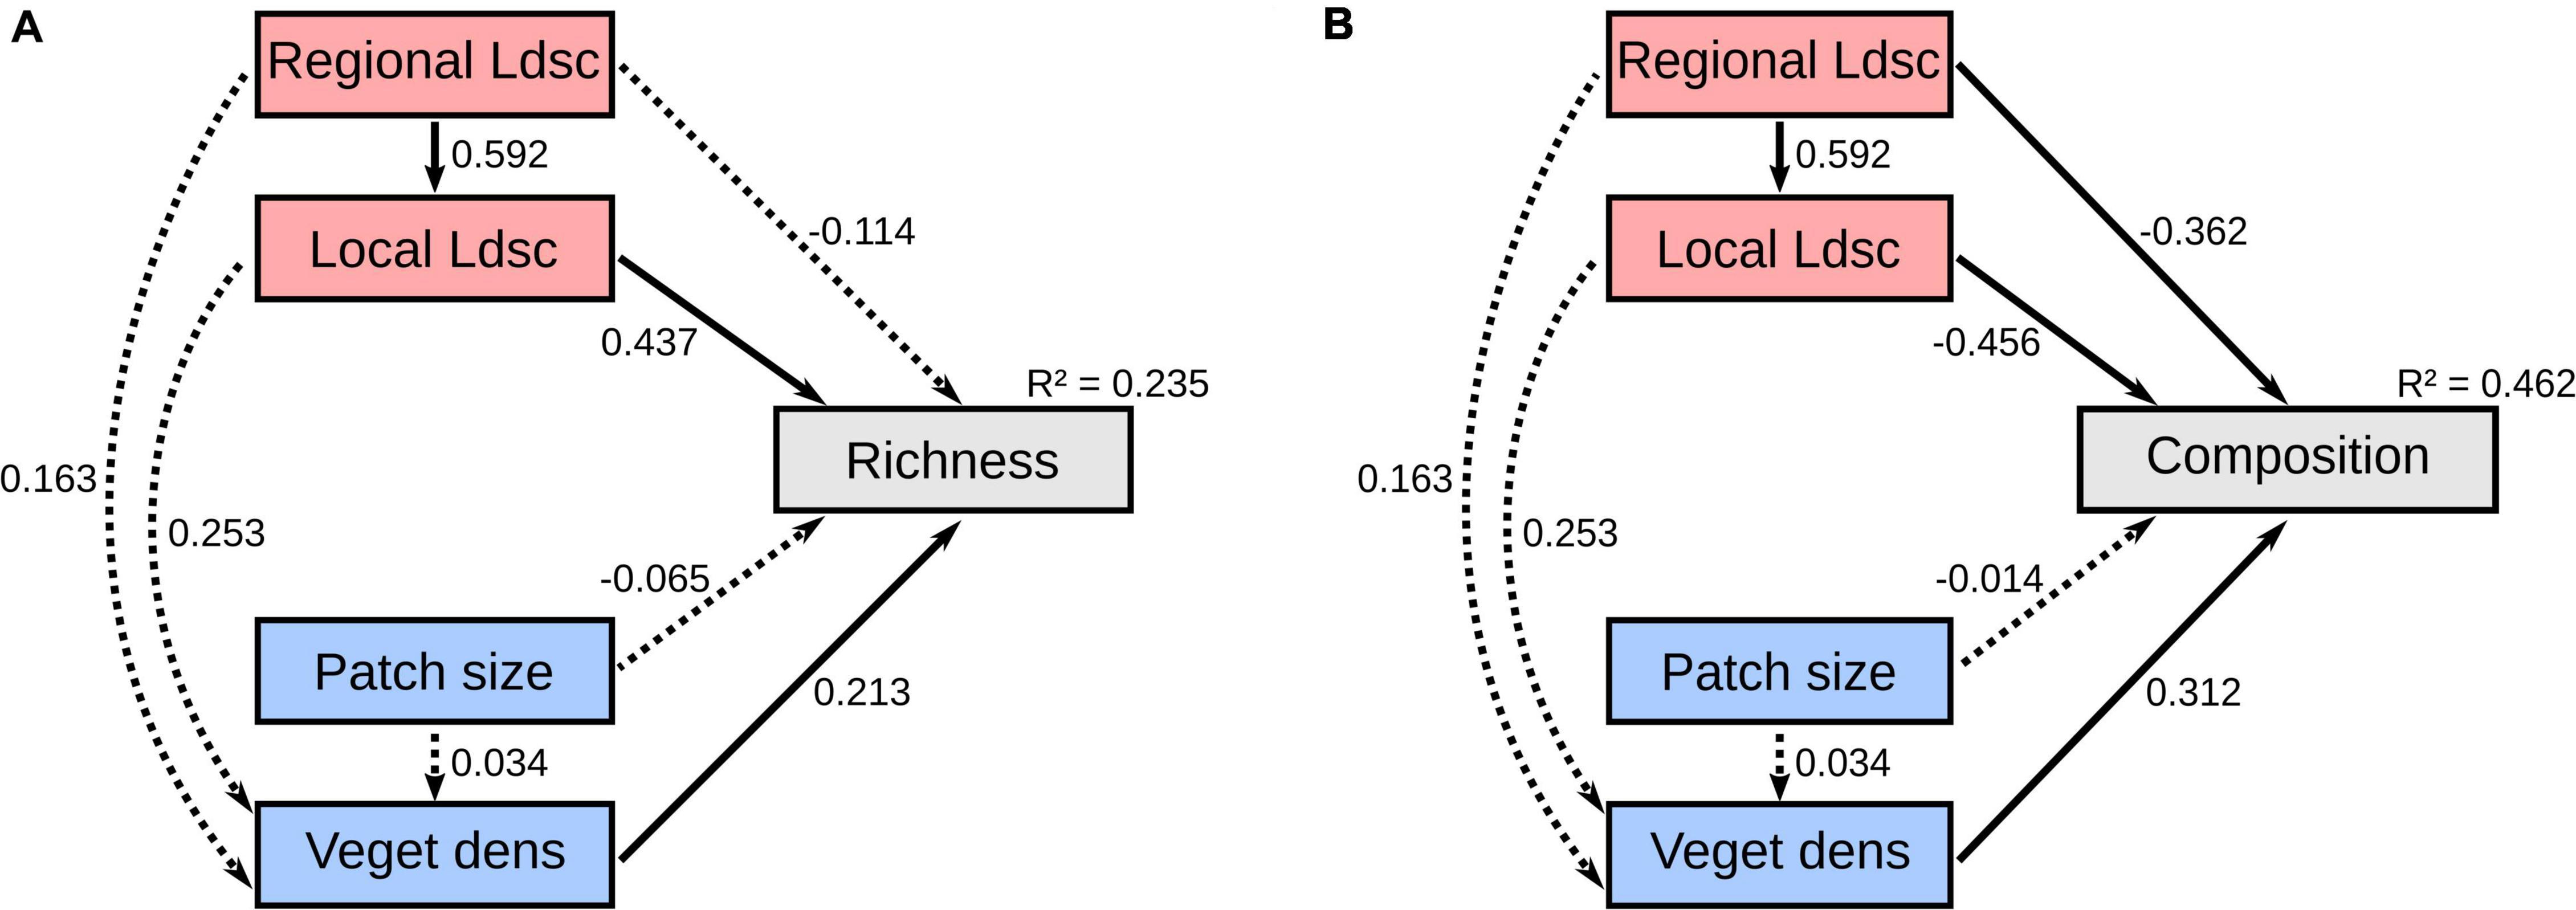
Figure 2. Structural equation models examining the direct and indirect effects of landscape-level (red) and patch-level (blue) variables on small mammal diversity of a woodland savanna region of South America. (A) Extrapolated species richness and (B) species composition (PCoA axis 1). Species richness was extrapolated for each site using the Chao index. Significant paths (p < 0.05) are shown in solid black arrows and non-significant paths are shown in dashed arrows. The values underlying the lines indicate standardized path coefficients. extrapolated species richness (Richness), species composition (Composition), regional landscape cover (Regional Ldsc), local landscape cover (Local Ldsc), and vegetation density (Veget dens).
Overall, we found that landscape-level metrics appear to be more important in explaining species richness among sites (Figure 2A). The direct effect of local landscape cover was the main determinant of species richness (β = 0.437, Z = 2.192, p = 0.028), whereby local-landscape habitat amount is often translated into greater species richness (Figure 3A). We found strong positive associations between the regional and local landscape cover (β = 0.592, Z = 7.253, p < 0.001), which was translated into the effects of the regional landscape cover indirectly mediated by the local landscape cover as relevant for explaining species richness variation [β = 0.259 (0.592 × 0.437), Z = 2.014, p = 0.007]. We also found no direct association between the regional landscape cover and species richness (β = −0.114, Z = −0.733, p = 0.464).
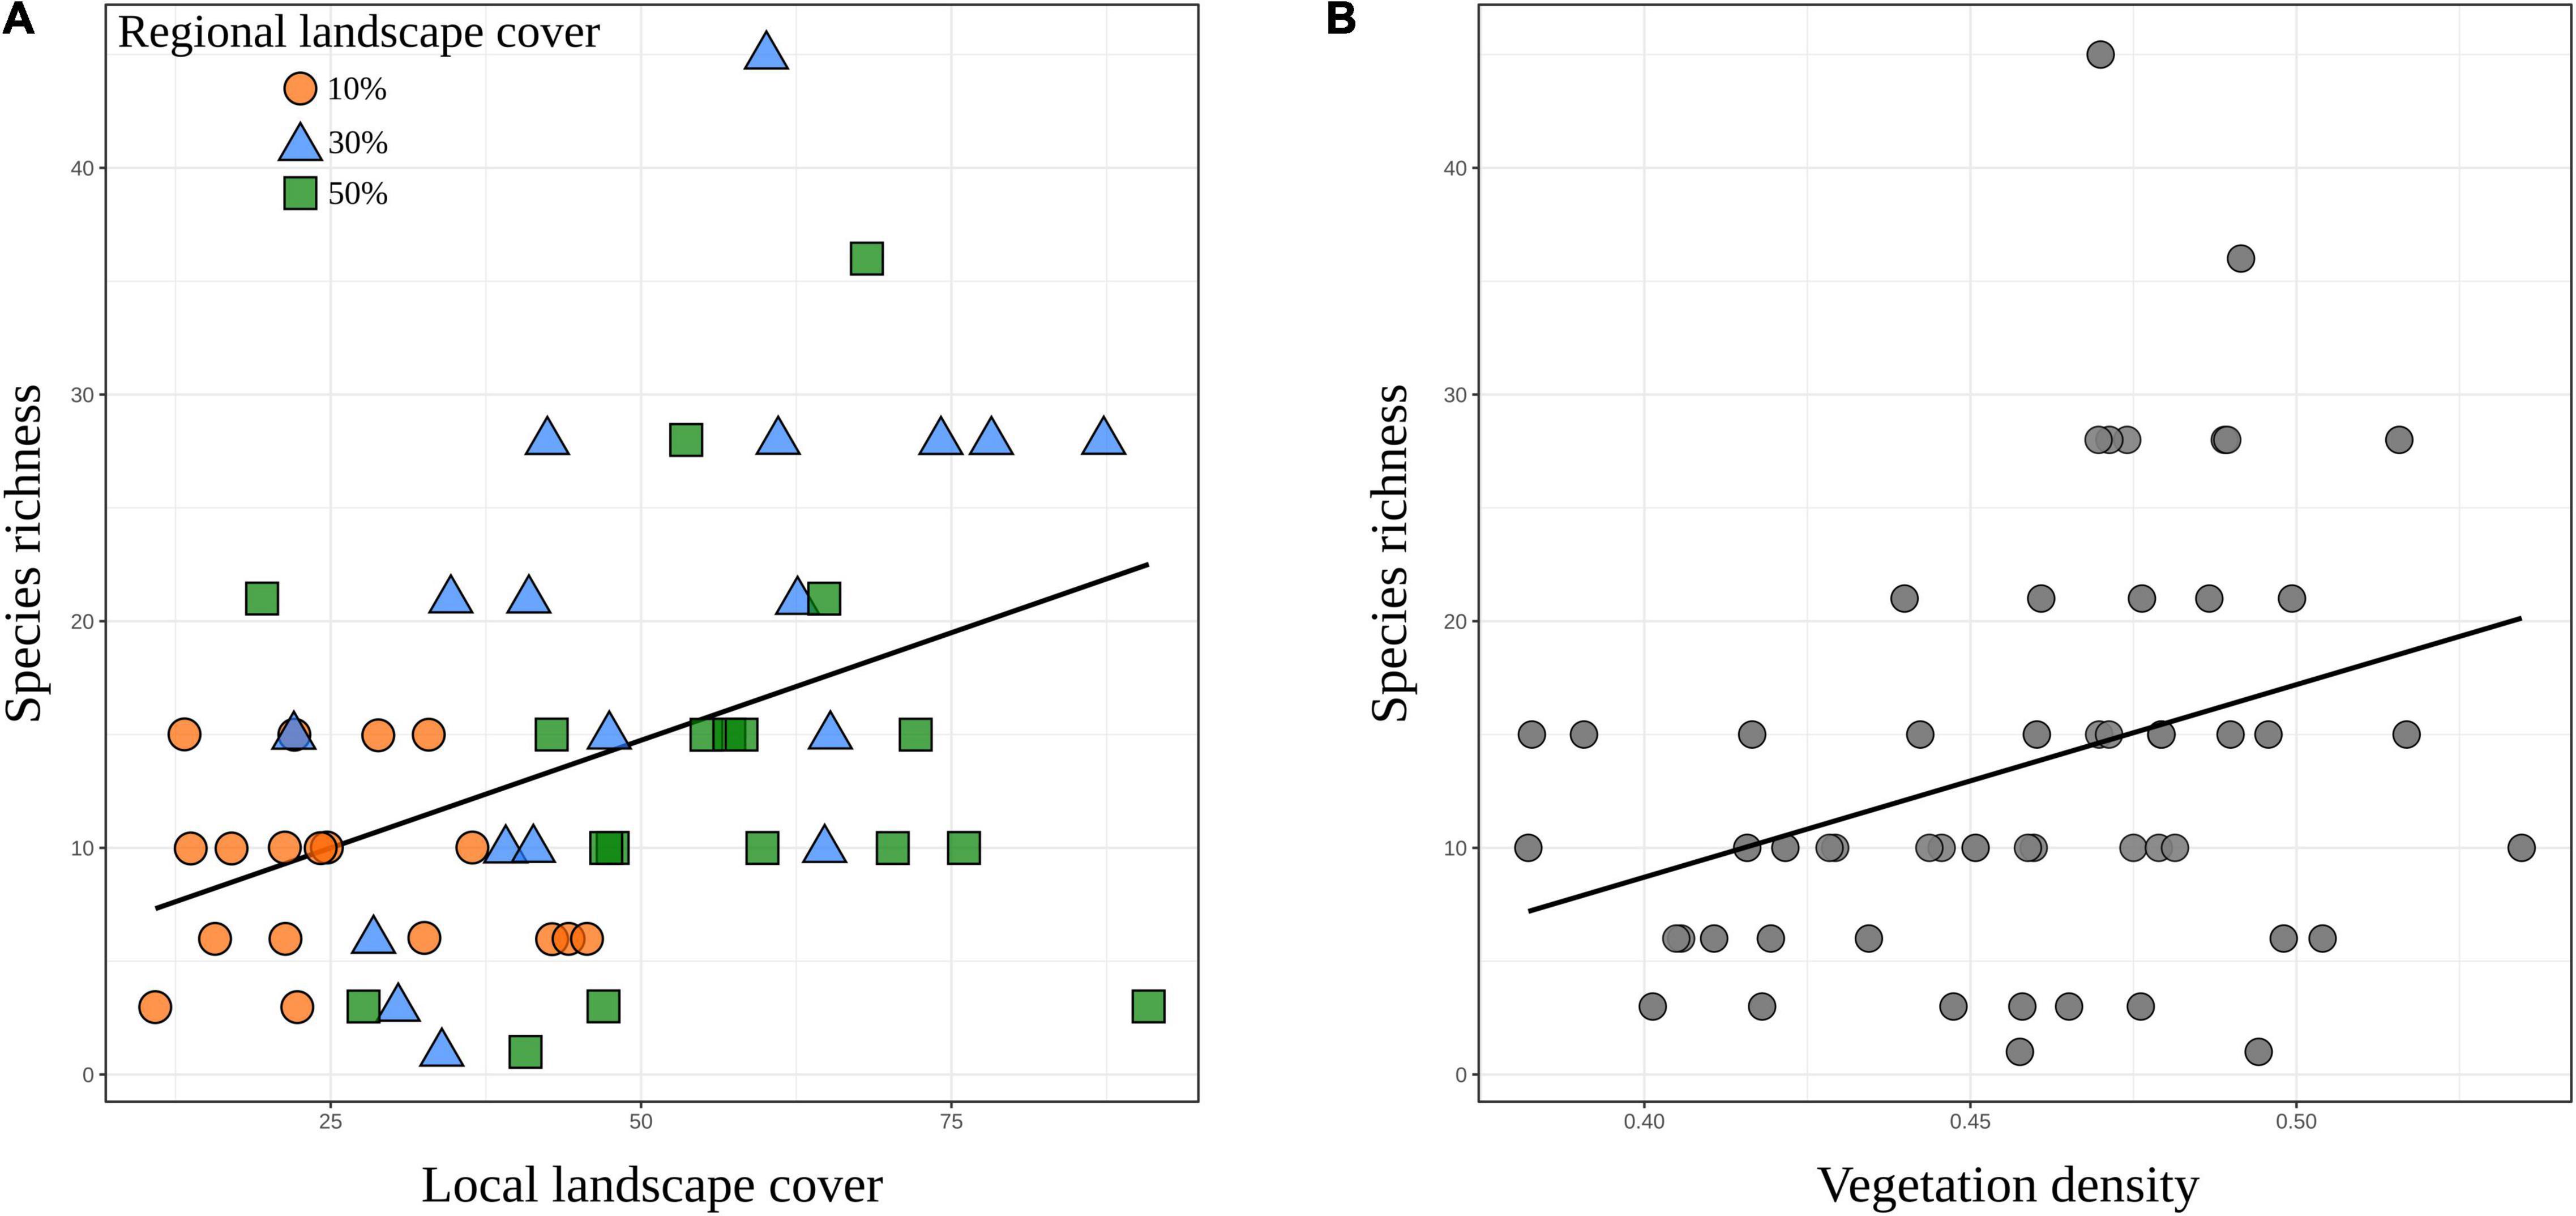
Figure 3. Relationship between extrapolated species richness and (A) local landscape cover or (B) vegetation density in a woodland savanna region of South America. Points in panel (A) are color-coded according to regional landscape cover, which include 10% (orange), 30% (blue), and 50% (green) forest cover.
Among patch-level variables, we only recorded significant direct effects of vegetation density on species richness (β = 0.213, Z = 2.049, p = 0.040), indicating that species richness and vegetation density are positively related (Figure 3B). We found no significant evidence for a direct effect of patch size (β = −0.065, Z = −0.259, p = 0.796) nor for remaining indirect paths influencing species richness, which included the effects of regional landscape cover on vegetation density [β = 0.035 (0.163 × 0.213), Z = 0.858, p = 0.391], local landscape cover on vegetation density [β = 0.054 (0.253 × 0.213), Z = 1.379, p = 0.168], and patch size on vegetation density [β = 0.007 (0.034 × 0.213), Z = 0.237, p = 0.813] (Figure 2A). Unstandardized (raw) parameter estimates, errors, and p-values are shown in Supplementary Table 3.
The SEM considering the hypothesized direct and indirect paths explained 46.2% of the changes in species composition (Figure 2B). In contrast to species richness, we recorded that both landscape-level and patch-level metrics are important to determine the species composition of small mammals (Figure 2B). On the species gradient measured by the PCoA analysis, the first two axes captured ∼44% of variation in the local communities, with the first axis responding for 24.1% (eigenvalue: 2.78) and the second one for 19.6% (eigenvalue: 2.26). The first five PCs summed 77% of explained variance, but having 54 axes generated (Supplementary Figure 7). The contribution of each species to the first two ordination axes can be found in Supplementary Table 5.
More specifically, local landscape cover was the main determinant of species composition (β = −0.456, Z = −3.271, p = 0.001), whereby some species were clearly associated with local landscapes with higher habitat amount (Figure 4). Similarly, the regional landscape cover had strong effects on species composition directly (β = −0.362, Z = −2.322, p = 0.020) and indirectly mediated through the local landscape cover [β = −0.269 (0.592 × −0.456), Z = −2.720, p = 0.007]. In fact, sites with low regional percentage of forest cover (10%) tended to harbor more similar sets of species that are remarkably different from those sites with higher regional percentage of forest cover (50%) (Figure 5). That reveals the existence of savanna-habitat specialist and generalist species of small mammals (see generalist-specialist species gradient in Figure 4). The a priori classification (Melo et al., 2017) mostly matches with our findings (70% for the 10 most specialist species) such as the woodland specialist species (e.g., Hylaeamys megacepahlus, Marmosa rapposa, Thrichomys fosteri, and Monodelphis domestica). However, despite the classification as generalist species, we have found Thylamys macrurus as a rather habitat specialist species and two species of Cerradomys (Figure 4).
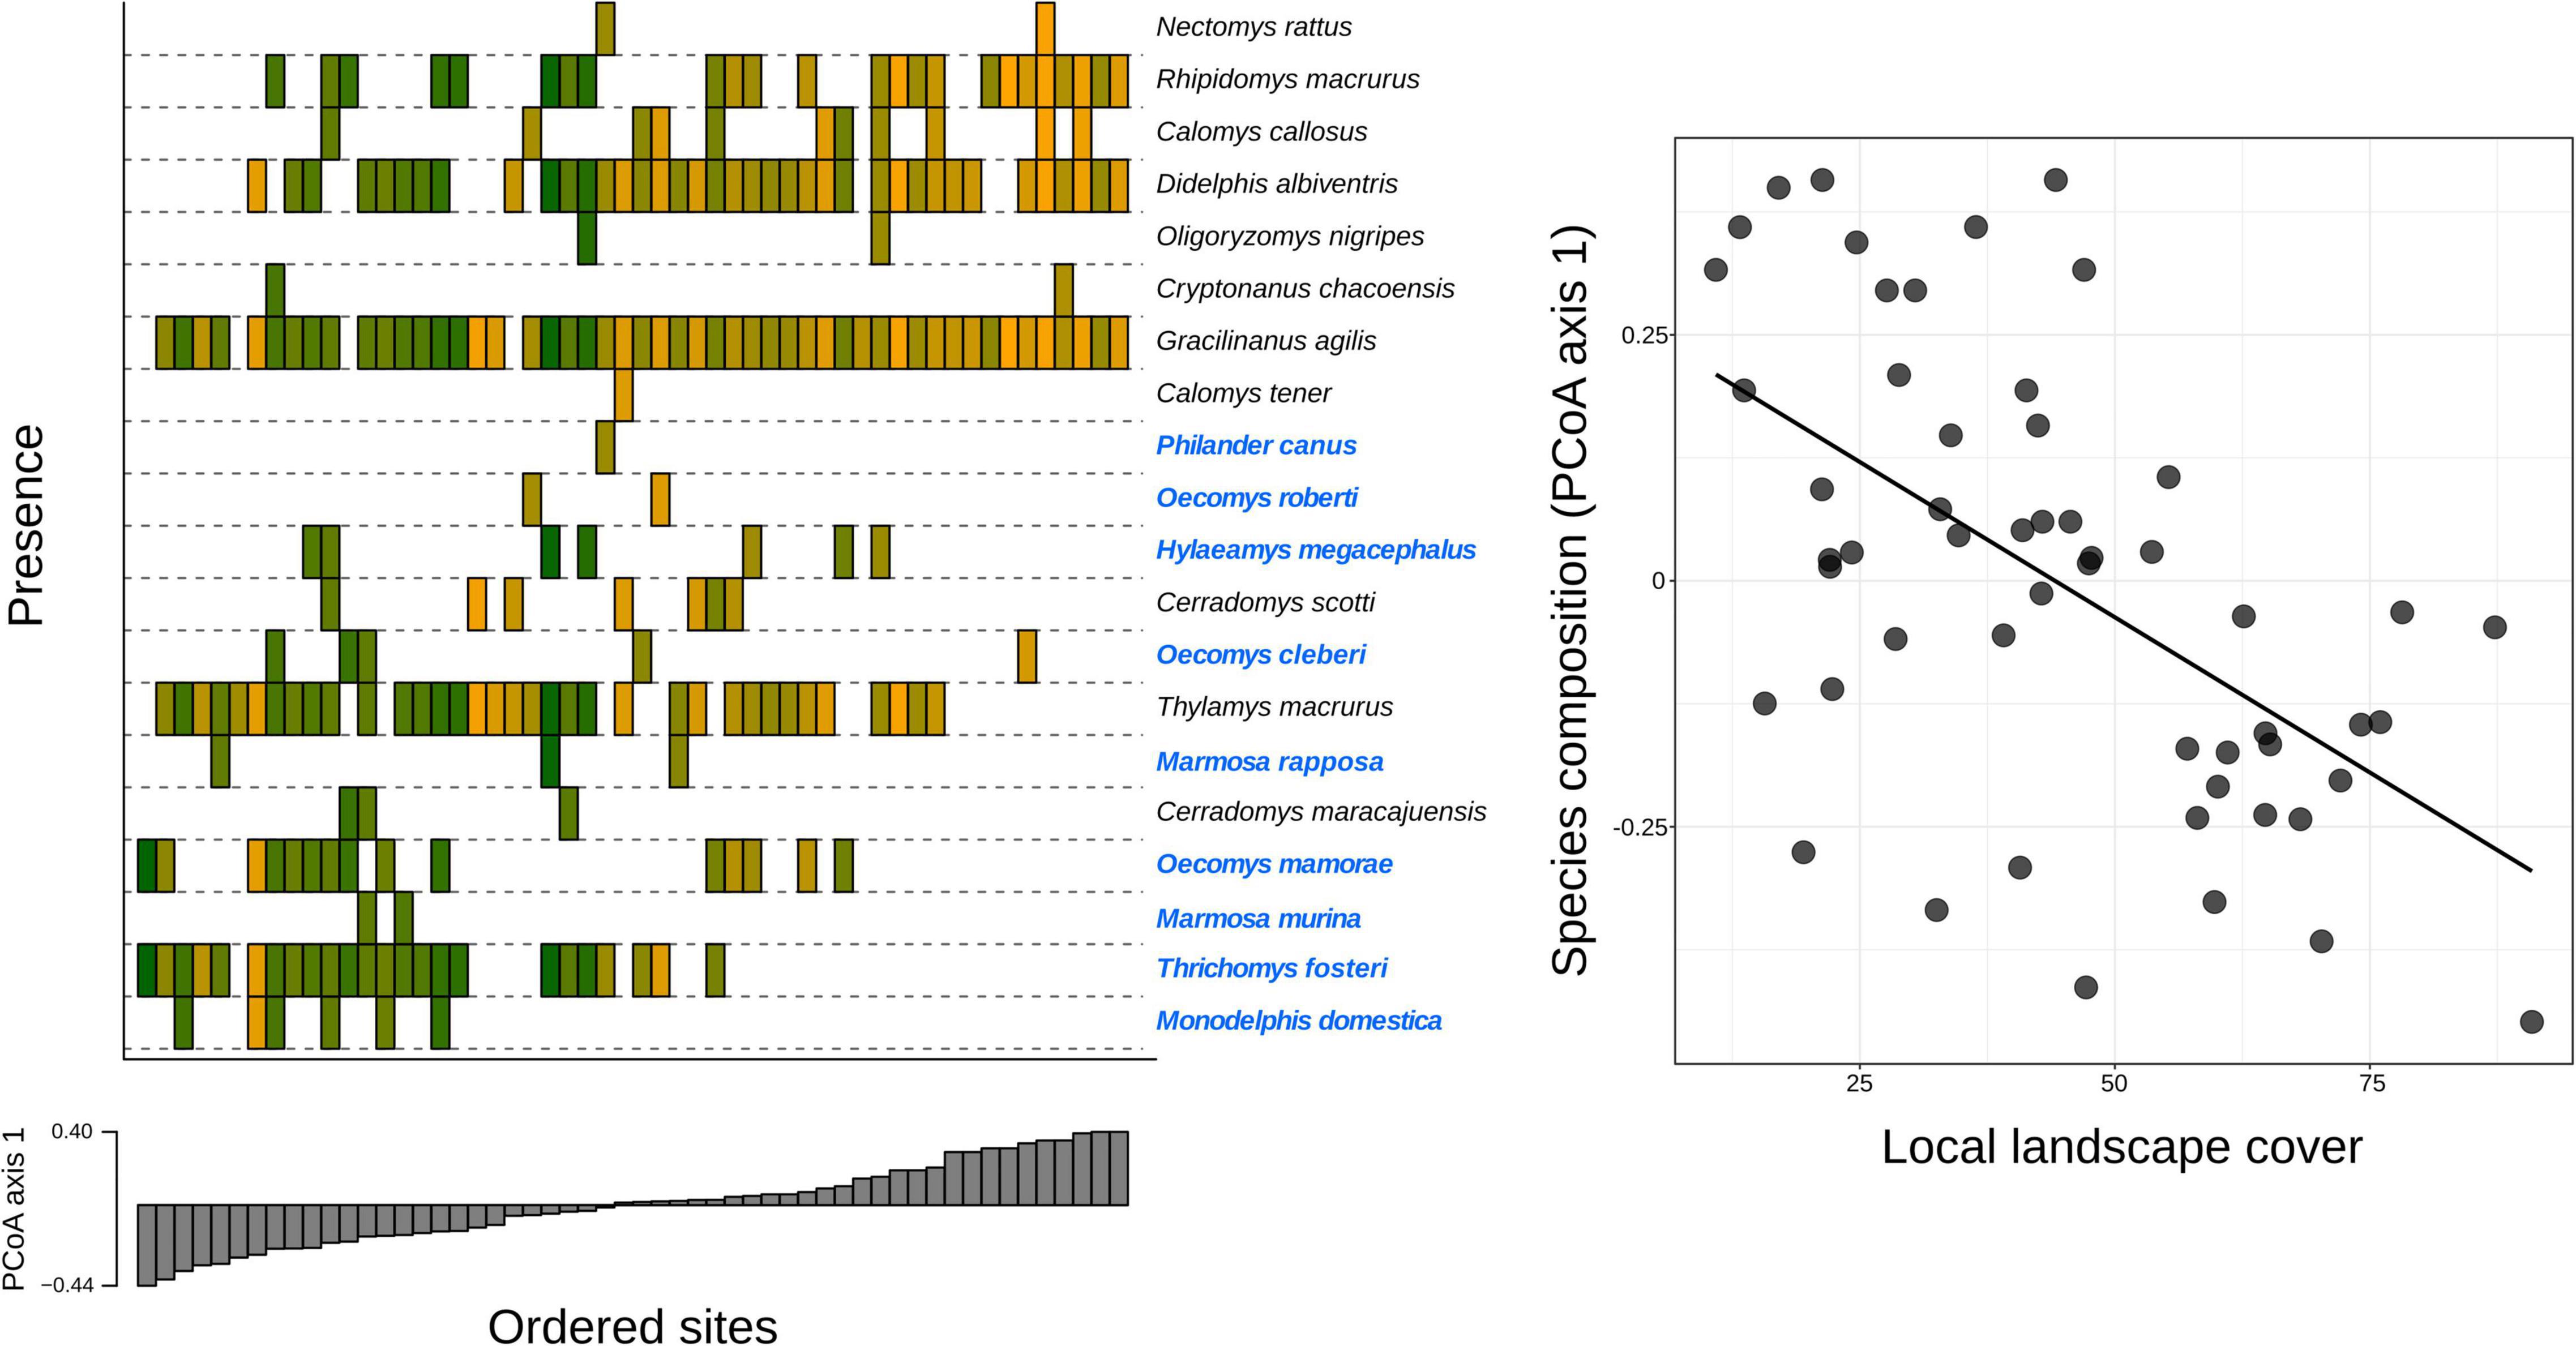
Figure 4. Relationship of species composition and local landscape cover in a woodland savanna region of South America. Ordination histograms show species presence and composition among the sampled sites. Sites are ordered according to the first axis of a Principal Coordinates Analysis (PCoA axis 1) based on the Jaccard dissimilarity index. Adjacent columns (in gray; PCoA loadings) indicate sites with a more similar species composition. Colors represent the amount of local landscape cover, which ranged from least (orange) to most coverage in the local landscape (green). Note that sites located on the negative portion of axis 1 are more often associated with local landscapes that have greater vegetation cover and habitat-specialist species (species names colored in blue, according to Melo et al., 2017).
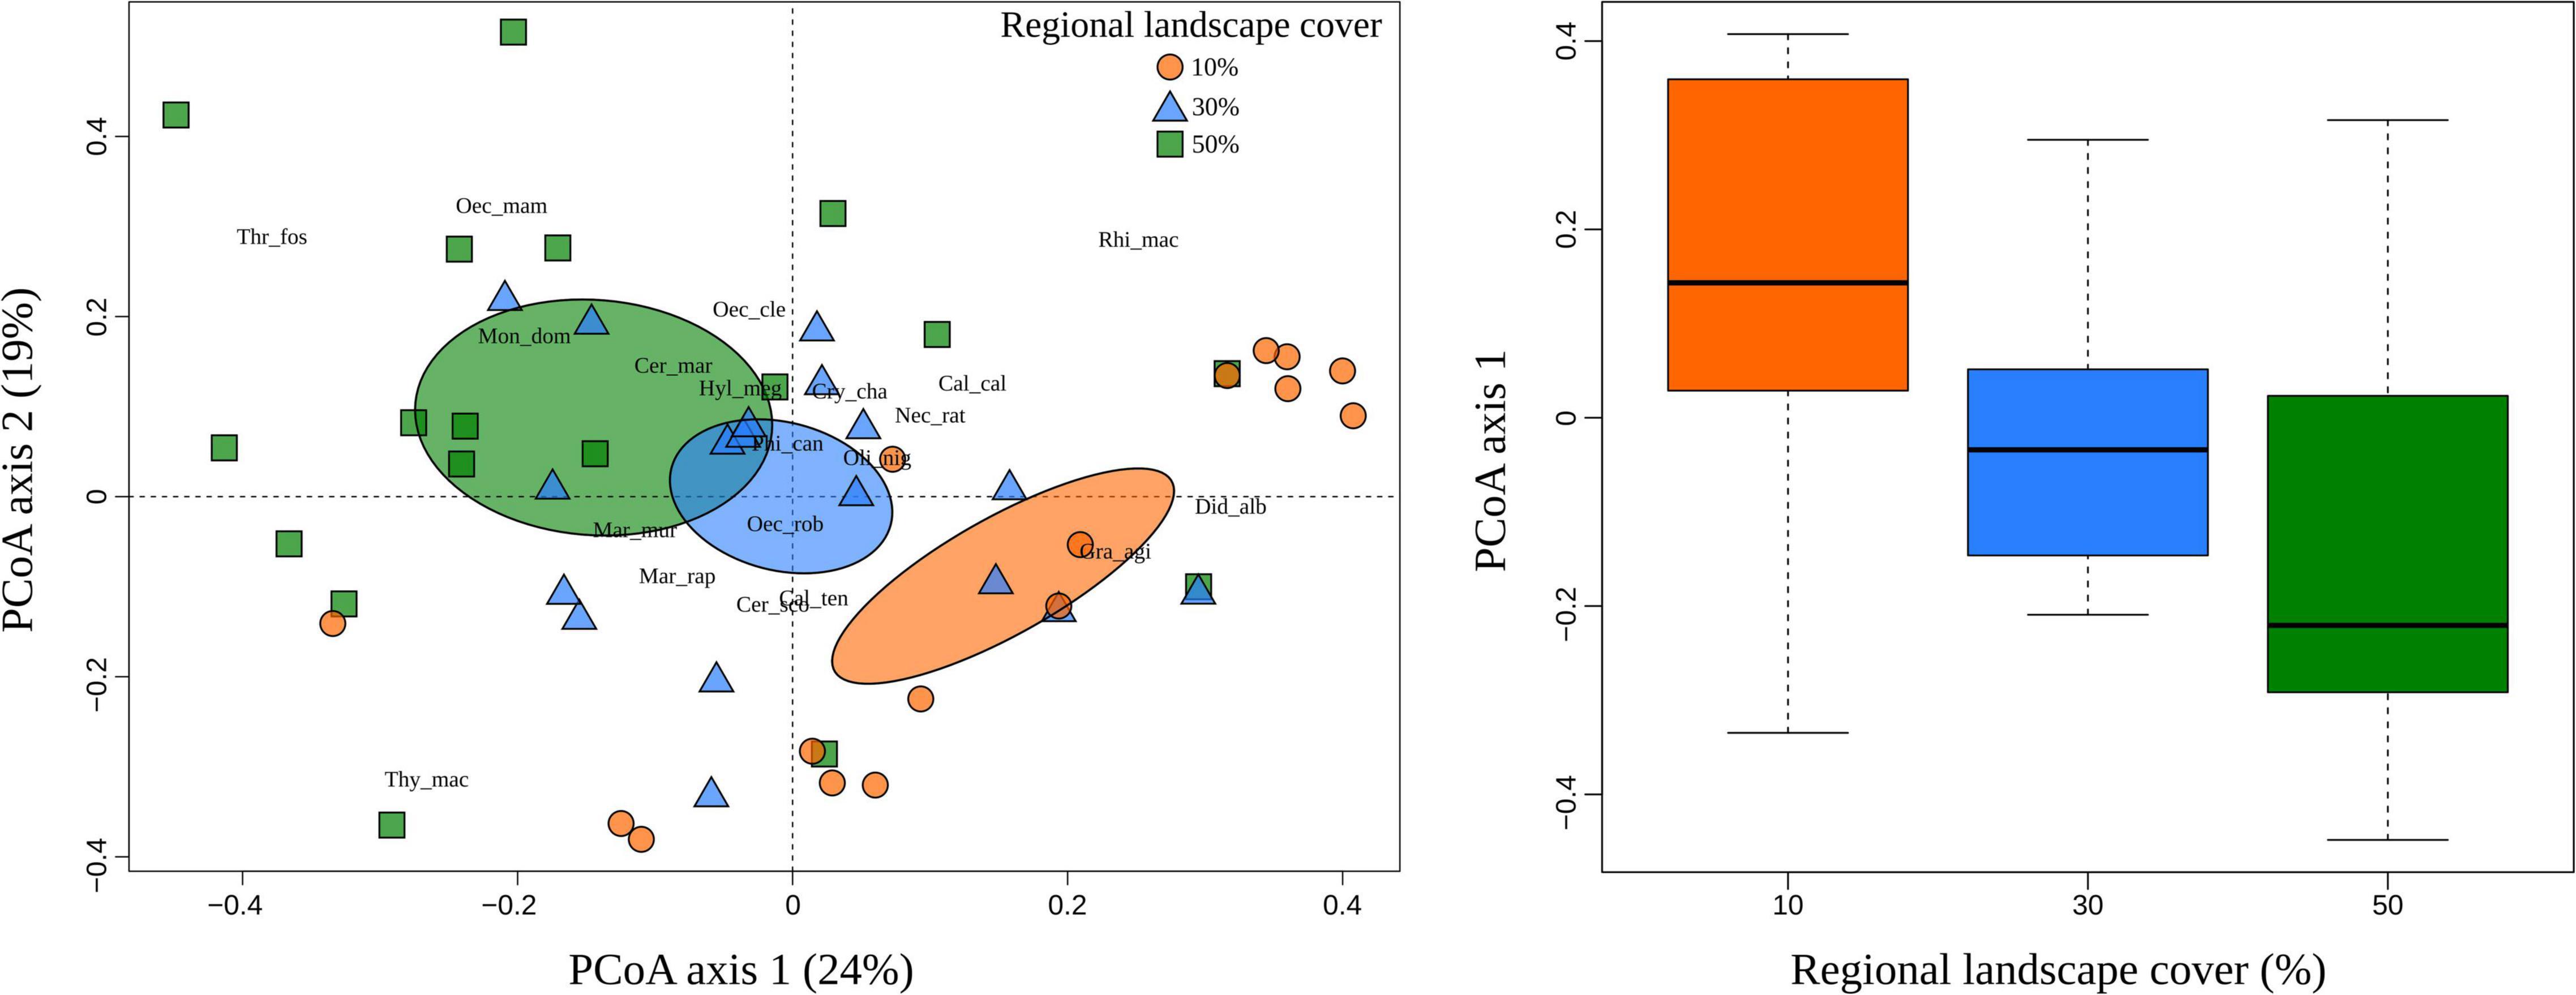
Figure 5. First two ordination axes and boxplot showing the relationship of species composition and regional landscape cover in a woodland savanna region of South America. Principal Coordinates Analysis (PCoA) ordinations of sites within regional landscapes that have different amounts of the forest: 10% (orange circle), 30% (blue triangle), and 50% (green rectangle). Colored ellipses indicate the 95% confidence interval. For the sake of simplicity, we present abbreviated species names (see Supplementary Table 2 for full names). The box-plot at right shows the median position and the inter-quartile range (lower and upper quartile) of species pool according to each regional scale.
At the patch level, we found significant and direct effects of vegetation density on species composition (β = 0.312, Z = 3.231, p = 0.001), implying that species composition is different according to places with more, or less, vegetation density (Supplementary Figure 8). These effects of vegetation density on species composition were even more evident when considering the second axis of the PCoA (Supplementary Figures 9, 10). We also recorded that the effects of patch size were non-significant and weak (β = −0.014, Z = −0.106, p = 0.916). The remaining indirect paths were also not significant (Figure 2B), which included the effects of regional landscape cover on vegetation density [β = 0.050 (0.163 × 0.312), Z = 0.958, p = 0.338], local landscape cover on vegetation density [β = 0.078 (0.253 × 0.312), Z = 1.339, p = 0.181], and patch size on vegetation density [β = 0.010 (0.034 × 0.312), Z = 0.232, p = 0.817]. Unstandardized (raw) parameter estimates, errors, and p-values are shown in Supplementary Table 4.
Our main findings suggest that mainly habitat amount but also vegetation density are important factors to determine the diversity of small mammal species (species richness and composition) across woodland patches of South American savannas. Furthermore, direct and indirect effects of the predictors analyzed are stronger on predicted species composition gradient (46%) than on species richness gradient (23%). However, all these results collectively also indicate the prominent effects of habitat amount over vegetation density in determining species diversity patterns (see Gardiner et al., 2018 for similar findings in Midlands region of Tasmania). Our predictions were partially anchored in Melo et al. (2017), who found habitat amount having a stronger effect on species richness than other predictors such as patch size and isolation. Another relevant result is the preponderance of vegetation density over patch size (but see Lindenmayer et al., 2000 for an important effect of patch size on Australasian mammals) in explaining small-mammal diversity, which we associate with the overall characteristic of the South American savanna, i.e., harboring a variety of different habitat types (forests, shrublands, and grasslands; Eiten, 1982) and favoring ecological filter, related to a somewhat variable small mammal composition. We discuss these findings in more detail in the following paragraphs.
The habitat amount was the best predictor for both compositional and richness variation, overcoming patch size and vegetation density. This finding has also been reported by Melo et al. (2017) based on a 2-km radius buffer. According to Melo et al. (2017) and Vieira et al. (2018), they demonstrate the extent of 2 km radius is the best buffer extant when considering the average small mammal dispersal capacity. However, our estimate using 1 km for buffer extent fit our expectations regarding habitat amount effect on small mammals. Studies on Landscape Ecology have shown that increasing spatial extent leads to the increasing importance of niche selection and the strength of these scaling effects depends on environment configuration, dispersal capacity, and niche breadth (Viana and Chase, 2019). Furthermore, a review study that included spatial scale studies in their estimates of biodiversity variation found frequent and strong scale-dependence in these estimates (Chase et al., 2018). The habitat amount theory to explain biodiversity variation is based on the quantity of remaining habitat in a standardized area (buffer), and the landscape connectance is key for maintaining biodiversity (Horváth et al., 2019) such as that of small mammals (Pardini et al., 2010). In fact, we found a strong effect of the habitat amount on species richness and identity of small mammals, reflecting that this fauna is significantly affected by the quantity of habitat within the landscape. Surely connectance between patches is fundamental to connect populations and avoid local extinction, maintaining higher species richness in landscapes with more preserved habitat. Species composition is also driven by habitat amount in which places with more habitat amount has different species composition, i.e., habitat-specialist species which have specific attributes (e.g., small body mass and more cursorial habit) important for their persistence in the landscape (Püttker et al., 2013; Melo, 2023).
An interesting finding is the indirect (but also the direct) effect of the regional landscape, through the local landscape, on small-mammal species composition and richness. This suggests that regional processes (at ∼7.5 km radio extent in our study) more than local ones (at 1 km-radio extent) are driven the small-mammal species diversity, i.e., regional landscapes with more habitat amount will influence local landscapes (see Pardini et al., 2010) that also have more habitat amount to keep a higher species richness and population structure, maybe with a stronger effect as a whole (Henein et al., 1998). That is the same as saying certain local landscapes with less habitat amount will be compensated by surrounding local landscapes with more habitat amount within a given regional landscape. That is in accordance with the connectance hypothesis (Horváth et al., 2019), which helps connect semi-isolated populations, leading to the persistence of species over time (see e.g., Henein et al., 1998). However, when habitat loss extrapolates a species extinction threshold at a regional scale, a moderate local habitat amount is not enough to compensate and support viable populations in the long-term. This regime shift was already observed for the Atlantic forest (Pardini et al., 2010), the Amazon forest (Palmeirim et al., 2020), and elsewhere in temperate woodlands (e.g., Gardiner et al., 2018), and our results indicate a similar pattern for the savanna (see Figure 3). That is the same as saying that such ecosystems (composed by woodland savanna or dense forest) are similar in the case of having species that are capable of crossing the open matrix and others that cannot: the South American savanna has woodland specialist species that, when isolated in landscapes with low woodland cover will be extinct locally or regionally. However, in our study, the non-significant effects at the regional scale (e.g., via habitat quality variables) should be viewed with care due to our small number of replicates at this large scale.
Vegetation density was important to explain the variation in small-mammal species composition, as was habitat amount. It is noteworthy that vegetation density is independent of habitat amount while affecting species composition (Figure 2). Thus, places with more vegetation density harbor different species composition, such as the species Monodelphis domestica, Thrichomys fosteri, and Marmosa murina (Figure 4; see Cáceres et al., 2010), which are found in complex sites exhibiting, e.g., more foliage diversity (Wood et al., 2012). In the case mentioned above, these species are habitat specialists (Lacher and Alho, 2001; Melo et al., 2017), which we now confirm for the Neotropical savanna, as in forest biomes (Pardini et al., 2010; Palmeirim et al., 2020). According to our findings, three species previously classified as generalist species (based on Melo et al., 2017) could be woodland specialist species: T. macrurus and two Cerradomys species (C. maracajuensis and C. scotti). In the case of C. scotti, it is possible that adjacent, more open savanna habitats (e.g., “cerrado” stricto sensu; Melo et al., 2017) favor its occurrence in savanna woodlands, but in fact this species did not occur in areas with low habitat amount (Figure 5), indicating at least an intermediate sensitivity to habitat loss in the southern Cerrado. Thus, these species disappear from patches inserted within landscapes with severe habitat loss (such as those with only 10% forest cover; Figure 5; see simulations in Henein et al., 1998). As expected, these specialist species are mainly terrestrial (Paglia et al., 2012) as found in the Atlantic Forest ecosystem (Püttker et al., 2013; Melo, 2023). On the other hand, there are those habitat-generalist species of savanna that occur in less foliage-density patches (such as in grasslands, shrublands, and small and medium-sized patches with major edge effect and disturbance), such as Didelphis albiventris, Gracilinanus agilis, Calomys callosus, and Rhipidomys macrurus (Mares et al., 1986; Cáceres et al., 2010; Santos-Filho et al., 2012; but see Lacher and Alho, 2001, for R. macrurus).
In conclusion, the small mammals from South American savanna exhibit clear ecological gradients on their species composition and richness, driven by habitat specialist and generalist species responses, as seen in forested Neotropical biomes. We detected a clear pattern of species loss with decreasing habitat amount under both local and regional scales, besides an interaction between them. We also detected vegetation density as having a secondary role, but not less important, particularly on species-composition variation. Overall, patch size does not affect small-mammal diversity variation. Next, investigating how fragmentation per se acts within different regional landscapes (e.g., 10% or 30% habitat remaining) could be a path for new research in the savanna biome. It is also necessary to assess whether patch size is important in the context of a specific habitat-amount threshold for small mammals (or other taxa) of the savanna biome, as found for the forest biome (Pardini et al., 2010).
The original contributions presented in this study are included in the article/Supplementary Material, further inquiries can be directed to the corresponding author.
Sampling techniques were approved by the Instituto Chico Mendes de Conservação da Biodiversidade (ICMBio) (protocol number 30808-2). Ethics animal procedures followed ASM guidelines (Sikes and Gannon, 2011).
GM and NC conceived the study aim and hypotheses. GM and JS designed the data collection and carried out fieldwork. FC statistically analyzed the data with input of NC and GM. All authors reviewed the manuscript and approved the submitted version.
This project was funded by the Brazilian Agency for Development of Science and Technology (CNPq), process number 470324/2011-2. This study was financed in part by the Coordenação de Aperfeiçoamento de Pessoa de Nível Superior —Brasil (CAPES)—Finance Code 001 for FC. NC is CNPq-Research Fellow in Brazil, process number 313191/2018-2.
The authors declare that the research was conducted in the absence of any commercial or financial relationships that could be construed as a potential conflict of interest.
All claims expressed in this article are solely those of the authors and do not necessarily represent those of their affiliated organizations, or those of the publisher, the editors and the reviewers. Any product that may be evaluated in this article, or claim that may be made by its manufacturer, is not guaranteed or endorsed by the publisher.
We would like to thank Cristian S. Dambros for the codes created to generate Figure 4 of the manuscript (codes available at https://github.com/csdambros/R-functions/blob/master/poncho.R). We would also like to thank Tatiana Kuplick from the National Institute for Spatial Research (INPE), at Santa Maria, for supervising the classification work on images for calculating NDVI.
The Supplementary Material for this article can be found online at: https://www.frontiersin.org/articles/10.3389/fevo.2022.740371/full#supplementary-material
August, P. V. (1983). The role of habitat complexity and heterogeneity in structuring tropical mammal communities. Ecology 64, 1495–1507. doi: 10.1371/journal.pone.0240623
Banks-Leite, C., Pardini, R., Tambosi, L. R., Pearse, W. D., Bueno, A. A., Bruscagin, R. T., et al. (2014). Using ecological thresholds to evaluate the costs and benefits of set-asides in a biodiversity hotspot. Science 345, 1041–1045. doi: 10.1126/science.1255768
Baselga, A. (2012). The relationship between species replacement, dissimilarity derived from nestedness, and nestedness. Glob. Ecol. and Biogeogr. 21, 1223–1232. doi: 10.1111/j.1466-8238.2011.00756.x
Bubadué, J. M., Hendges, C. D., Cherem, J. J., Cerezer, F. O., Falconí, T. P., Graipel, M. E., et al. (2019). Marsupial versus placental: assessing the evolutionary changes in the scapula of didelphids and sigmodontines. Biol. J. Linn. Soc. 128, 994–1007. doi: 10.1093/biolinnean/blz134
Cáceres, N. C., Napoli, R. P., Casella, J., and Hannibal, W. (2010). Mammals in a fragmented savannah landscape in south-western Brazil. J. Nat. Hist. 44, 491–512. doi: 10.1080/00222930903477768
Camara, G., Souza, R. C. M., Freitas, U. M., and Garrido, J. (1996). Spring: integrating remote sensing and GIS by object-oriented data modelling. Comput. Graph. 20, 395–403. doi: 10.1016/0097-8493(96)00008-8
Chao, A. (1984). Nonparametric estimation of the number of classes in a population. Scand. J. Stat. 11, 265–270.
Chase, J. M., McGill, B. J., McGlinn, D. J., May, F., Blowes, S. A., Xiao, X., et al. (2018). Embracing scale-dependence to achieve a deeper understanding of biodiversity and its change across communities. Ecol. Lett. 21, 1737–1751. doi: 10.1111/ele.13151
Chiu, C. H., Wang, Y. T., Walther, B. A., and Chao, A. (2014). Improved nonparametric lower bound of species richness via a modified Good-Turing frequency formula. Biometrics 70, 671–682. doi: 10.1111/biom.12200
Chown, S. L., Gremmen, N. J. M., and Gaston, K. J. (1998). Ecological biogeography of Southern Ocean Islands: species-area relationships, human impacts, and conservation. Am. Nat. 152, 562–575. doi: 10.1086/286190
Colombo, R., Bellingeri, D., Fasolini, D., and Marino, C. M. (2003). Retrieval of leaf area index in different vegetation types using high resolution satellite data. Remote Sens. Environ. 86, 120–131. doi: 10.1016/S0034-4257(03)00094-4
Curran, P. J. (1982). Multispectral photographic remote sensing of green vegetation biomass and productivity. Photogramm. Eng. Rem. S. 48, 243–250.
De Vivo, M., and Carmignotto, A. P. (2004). Holocene vegetation change and the mammal faunas of South America and Africa. J. Biogeogr. 31, 943–957. doi: 10.1111/j.1365-2699.2004.01068.x
Devictor, V., Julliard, R., and Jiguet, F. (2008). Distribution of specialist and generalist species along spatial gradients of habitat disturbance and fragmentation. Oikos 117, 507–514. doi: 10.1111/j.0030-1299.2008.16215.x
Dirzo, R., and Raven, P. H. (2003). Global state of biodiversity and loss. Annu. Rev. Environ. Resourc. 28, 137–167. doi: 10.1146/annurev.energy.28.050302.105532
Eiten, G. (1982). Brazilian “Savannas,” in Ecology of Tropical Savannas. Berlin: Springer, 25–47. doi: 10.1007/978-3-642-68786-0_3
Fahrig, L. (2013). Rethinking patch size and isolation effects: the habitat amount hypothesis. J. Biogeogr. 40, 1649–1663. doi: 10.1111/jbi.12130
Fan, Y., Chen, J., Shirkey, G., John, R., Wu, S. R., Park, H., et al. (2016). Applications of structural equation modeling (SEM) in ecological studies: an updated review. Ecol. Processes 5, 1–12. doi: 10.1186/s13717-016-0063-3
Fischer, J., and Lindenmayer, D. B. (2007). Landscape modification and habitat fragmentation: a synthesis. Glob. Ecol. and Biogeogr. 16, 265–280.
Françoso, R. D., Brandão, R., Nogueira, C. C., Salmona, Y. B., Machado, R. B., and Colli, G. R. (2015). Habitat loss and the effectiveness of protected areas in the Cerrado Biodiversity Hotspot. Natureza & Conservação 13, 35–40.
Gardiner, R., Bain, G., Hamer, R., Jones, M. E., and Johnson, C. N. (2018). Habitat amount and quality, not patch size, determine persistence of a woodland-dependent mammal in an agricultural landscape. Landsc. Ecol. 33, 1837–1849.
Goward, S. N., Tucker, C. J., and Dye, D. G. (1985). North American vegetation patterns observed with the NOAA-7 advanced very high resolution radiometer. Vegetatio 64, 3–14.
Grace, J. B., Anderson, T. M., Olff, H., and Scheiner, S. M. (2010). On the specification of structural equation models for ecological systems. Ecol. Monogr. 80, 67–87.
Haddad, N. M., Brudvig, L. A., Clobert, J., Davies, K. F., Gonzalez, A., Holt, R. D., et al. (2015). Habitat fragmentation and its lasting impact on Earth’s ecosystems. Sci. Adv. 1:e1500052. doi: 10.1126/sciadv.1500052
Henein, K., Wegner, J., and Merriam, G. (1998). Population effects of landscape model manipulation on two behaviourally different woodland small mammals. Oikos 81, 168–186.
Horváth, Z., Ptacnik, R., Vad, C. F., and Chase, J. M. (2019). Habitat loss over six decades accelerates regional and local biodiversity loss via changing landscape connectance. Ecol. Lett. 22, 1019–1027. doi: 10.1111/ele.13260
Klink, C. A., and Machado, R. B. (2005). Conservation of the Brazilian cerrado. Conserv. Biol. 19, 707–713.
Lacher, T. E. Jr., and Alho, C. J. R. (2001). Terrestrial small mammal richness and habitat associations in an Amazon-Cerrado contact zone. Biotropica 33, 171–181.
Lindenmayer, D. B., McCarthy, M. A., Parris, K. M., and Pope, M. L. (2000). Habitat fragmentation, landscape context, and mammalian assemblages in Southeastern Australia. J. Mammal. 81, 787–797.
Machado, R. B., Ramos Neto, M. B., Pereira, P. G. P., Caldas, E. F., Gonçalves, D. A., Santos, N. S., et al. (2004). Estimativas de perda da área do Cerrado brasileiro. Brasília: Conservação Internacional do Brasil.
Maracahipes, L., Carlucci, M. B., Lenza, E., Marimon, B. S., Marimon, B. H. Jr., Guimaraes, F. A., et al. (2018). How to live in contrasting habitats? Acquisitive and conservative strategies emerge at inter-and intraspecific levels in savanna and forest woody plants. Perspect. Plant Ecol. Evol. Syst. 34, 17–25.
Mares, M. A., Ernest, K. A., and Gettinger, D. D. (1986). Small mammal community structure and composition in the Cerrado Province of central Brazil. J. Trop. Ecol. 2, 289–300.
Melo, G. L. (2023). Impact of habitat loss and fragmentation in didelphid marsupials of the Atlantic Forest, in American and Australasian Marsupials: An Evolutionary, Biogeographical, and Ecological Approach, eds. N. C. Cáceres and C. R. Dickman (Cham: Springer).
Melo, G. L., Sponchiado, J., Cáceres, N. C., and Fahrig, L. (2017). Testing the habitat amount hypothesis for South American small mammals. Biol. Conserv. 209, 304–314.
Mittermeier, R. A., Myers, N., Mittermeier, C. G., and Robles Gil, P. (1999). Hotspots: Earth’s Biologically Richest and Most Endangered Terrestrial Ecoregions. CEMEX, SA: Agrupación Sierra Madre, SC.
Murcia, C. (1995). Edge effects in fragmented forests: implications for conservation. Trend. Ecol. Evol. 10, 58–62. doi: 10.1016/S0169-5347(00)88977-6
Oksanen, J., Blanchet, F. G., Friendly, M., Kindt, R., Legendre, P., McGlinn, D., et al. (2020). vegan: Community Ecology Package. R package version 2.5-6. 2019. Available online at http://CRAN.Rproject.org/package=vegan (accessed May 7, 2021).
Olson, D. M., Dinerstein, E., Wikramanayake, E. D., Burgess, N. D., Powell, G. V., Underwood, E. C., et al. (2001). Terrestrial ecoregions of the world: a new map of life on Earth: A new global map of terrestrial ecoregions provides an innovative tool for conserving biodiversity. BioScience. 51, 933–938. doi: 10.1641/0006-3568(2001)051[0933:TEOTWA]2.0.CO;2
Paglia, A. P., Da Fonseca, G. A., Rylands, A. B., Herrmann, G., Aguiar, L. M., Chiarello, A. G., et al. (2012). Annotated Checklist of Brazilian Mammals. Occas. Papers Conserv. Biol. 6, 1–82. doi: 10.1590/0001-3765202020191004
Palmeirim, A. F., Santos-Filho, M., and Peres, C. A. (2020). Marked decline in forest-dependent small mammals following habitat loss and fragmentation in an Amazonian deforestation frontier. PLoS One 15:e02300209. doi: 10.1371/journal.pone.0230209
Paradis, E., and Schliep, K. (2019). ape 5.0: an environment for modern phylogenetics and evolutionary analyses in R. Bioinformatics 35, 526–528. doi: 10.1093/bioinformatics/bty633
Pardini, R., Bueno, A. A., Gardner, T. A., Prado, P. I., and Metzger, J. P. (2010). Beyond the fragmentation threshold hypothesis: regime shifts in biodiversity across fragmented landscape. PLoS One 5:e13666. doi: 10.1371/journal.pone.0013666
Pardini, R., Souza, S. M., Braga-Neto, R., and Metzger, J. P. (2005). The role of forest structure, fragment size and corridors in maintaining small mammal abundance and diversity in an Atlantic Forest landscape. Biol. Conserv. 124, 253–266. doi: 10.1016/j.biocon.2005.01.033
Pennington, R. T., Lehmann, C. E., and Rowland, L. M. (2018). Tropical savannas and dry forests. Curr. Biol. 28, R541–R545. doi: 10.1016/j.cub.2018.03.014
Püttker, T., Martins, T. K., Bueno, A. A., Rossi, N. F., and Pardini, R. (2013). “Respostas de marsupiais da Mata Atlântica à perda e fragmentação do habitat – um índice de vulnerabilidade baseado em padrões de ocupação,” in Os Marsupiais do Brasil: Biologia, Ecologia, e Conservação, ed. N. C. Cáceres (Campo Grande, MS: Ed-UFMS), 455–470.
R Development Core Team (2021). R: A Language and Environment for Statistical Computing. Vienna: R Foundation for Statistical Computing. Available online at: http://www.R-project.org
Regolin, A. L., Ribeiro, M. C., Martello, F., Melo, G. L., Sponchiado, J., Campanha, L. F. D. C., et al. (2020). Spatial heterogeneity and habitat configuration overcome habitat composition influences on alpha and beta mammal diversity. Biotropica 52, 969–980. doi: 10.1111/btp.12800
Rosseel, Y. (2012). Lavaan: an R package for structural equation modeling and more. Version 0.5–12 (BETA). J. stat. softw. 48, 1–36. doi: 10.18637/jss.v048.i02
Santos-Filho, M. D., Frieiro-Costa, F., Ignácio, ÁR. A., and Silva, M. N. F. (2012). Use of habitats by non-volant small mammals in Cerrado of Central Brazil. Braz. J. Biol. 72, 893–902. doi: 10.1590/s1519-69842012000500016
Saura, S. (2020). The Habitat Amount Hypothesis implies negative effects of habitat fragmentation on species richness. J. Biogeogr. 48, 11–22. doi: 10.1111/jbi.13958
Sikes, R. S., and Gannon, W. L. (2011). Guidelines of the American Society of Mammalogists for the use of wild mammals in research. J. Mammal. 92, 235–253. doi: 10.1093/jmammal/gyw078
Silva, J. F., Fariñas, M. R., Felfili, J. M., and Klink, C. A. (2006). Spatial heterogeneity, land use and conservation in the cerrado region of Brazil. J. Biogeogr. 33, 536–548. doi: 10.1111/j.1365-2699.2005.01422.x
Viana, D. S., and Chase, J. M. (2019). Spatial scale modulates the inference of metacommunity assembly processes. Ecology 100:e02576. doi: 10.1002/ecy.2576
Vieira, M. V., Almeida-Gomes, M., Delciellos, A. C., Cerqueira, R., and Crouzeilles, R. (2018). Fair tests of the habitat amount hypothesis require appropriate metrics of patch isolation: an example with small mammals in the Brazilian Atlantic Forest. Biol.Cons. 226, 264–270. doi: 10.1016/j.biocon.2018.08.008
Keywords: indirect effect, patch size, regional landscape, small mammal composition, species loss, habitat quality, local scale, structural equation model (SEM)
Citation: Melo GL, Cerezer FO, Sponchiado J and Cáceres NC (2022) The Role of Habitat Amount and Vegetation Density for Explaining Loss of Small-Mammal Diversity in a South American Woodland Savanna. Front. Ecol. Evol. 10:740371. doi: 10.3389/fevo.2022.740371
Received: 13 July 2021; Accepted: 20 May 2022;
Published: 22 August 2022.
Edited by:
Christopher Richard Dickman, The University of Sydney, AustraliaReviewed by:
Alexandre R. T. Palma, Federal University of Paraíba, BrazilCopyright © 2022 Melo, Cerezer, Sponchiado and Cáceres. This is an open-access article distributed under the terms of the Creative Commons Attribution License (CC BY). The use, distribution or reproduction in other forums is permitted, provided the original author(s) and the copyright owner(s) are credited and that the original publication in this journal is cited, in accordance with accepted academic practice. No use, distribution or reproduction is permitted which does not comply with these terms.
*Correspondence: Nilton C. Cáceres, bmlsdG9uY2FjZXJlc0BnbWFpbC5jb20=
†These authors have contributed equally to this work and share senior authorship
Disclaimer: All claims expressed in this article are solely those of the authors and do not necessarily represent those of their affiliated organizations, or those of the publisher, the editors and the reviewers. Any product that may be evaluated in this article or claim that may be made by its manufacturer is not guaranteed or endorsed by the publisher.
Research integrity at Frontiers
Learn more about the work of our research integrity team to safeguard the quality of each article we publish.