 Sandra Baksay
 Christophe Andalo
 Didier Galop3
 Monique Burrus
 Nathalie Escaravage
 André Pornon
- 1Laboratoire Évolution et Diversité Biologique, UMR 5174, CNRS, Université Toulouse III - Paul Sabatier, Toulouse, France
- 2Marepolis, Université de Perpignan Via Domitia, Perpignan, France
- 3Laboratoire Géographie de l’Environnement, UMR 5602, CNRS, Université de Toulouse-Jean Jaurès, Toulouse, France
The ongoing decline in pollinators and increasing concerns about pollination services require a better understanding of complex pollination networks, particularly their response to global climate change. While metabarcoding is increasingly used for the identification of taxa in DNA mixtures, its reliability in providing quantitative information on plant-pollinator interactions is still the subject of debate. Combining metabarcoding and microscopy, we investigated the relationships between the number and composition of sequences and the abundance and composition of pollen in insect pollen loads (IPL) and how the two are linked to insect visits. Our findings confirm that metabarcoding is more effective than microscopy in identifying plant species in IPL. For a given species, we found a strong positive relationship between the amount of pollen in IPL and the number of sequences. The relationship was stable across species even if the abundance of co-occurring species in IPL (hereafter “co-occurring pollen”) tended to reduce the sequence yield (number of sequences obtained from one pollen grain) of a given species. We also found a positive relationship between the sequence count and the frequency of visits, and between the frequency and the amounts of pollen in IPL. Our results demonstrate the reliability of metabarcoding in assessing the strength of plant-pollinator interactions and in providing a broader perspective for the analyses of plant-pollinator interactions and pollination networks.
Introduction
The ongoing decline in pollinators is increasing concerns about pollination services to wild plants and crops, ecosystem sustainability (Ollerton et al., 2011), agricultural production, food security (Garibaldi et al., 2013), balanced human diets (Smith et al., 2015), and human well-being (Potts et al., 2016). Sustaining or restoring pollination services in both natural and managed habitats requires a better understanding of the structural and functional features of complex pollination networks (i.e., the network of interactions between plants and their pollinators), particularly their robustness and their response to global climate change.
So far, pollination networks have mainly been studied by surveying insect visits, which is time consuming and difficult at a large scale. What is more, as pollinator visits can only be observed in small plots whereas pollinators forage far beyond the area surveyed, the size and connectance of the networks may be greatly underestimated due to undetected links (Pornon et al., 2017). On the other hand, because insects do not always pick up pollen from all the plants they visit (Bartomeus et al., 2008; Bosch et al., 2009; Popic et al., 2012), the size and the connectance of networks may be overestimated because visits are recorded that are not involved in pollination service. Additionally, surveying visits does not allow us to investigate if and how differences in individual behavior (Tur et al., 2014; Pornon et al., 2019) influence network characteristics. Indeed, visit networks are built at species level, where the linkage strength (width of the pollinator links), corresponds simply to the sum of individuals observed visiting a plant species and is not weighted by the foraging activity of individuals. Consequently, certain important parameters assessing the network (network specialization index; Interaction evenness), species or individual specialization (estimated by the Kullback-Leibler distance d’; Vázquez et al., 2009) may be seriously inaccurate.
Identifying and quantifying the plant species in insect pollen loads (IPL) can solve most of the above problems, particularly if, for a given plant species, the amount of pollen carried by an insect is closely linked to the number of visits and if the resulting sequence count reflect the abundance of pollen in the IPL. In this case, the strength of the link will not only include the number of individuals that have visited a plant species, but also, to some extent, the frequency of visits to that particular plant species by each individual (Tur et al., 2014), thus providing a more realistic picture of pollination networks than surveying pollinator visits. However, morphological identification of pollen requires considerable skill, experience and time (Bosch et al., 2009; Galimberti et al., 2014) and is therefore difficult to apply routinely at a large scale. Moreover, the assumption that the amount of pollen collected by an insect is, to some extent, proportional to the visits, has rarely been tested (but see Stanley and Stout, 2013).
Recently, DNA metabarcoding techniques have increasingly been used to study plant-pollinator interactions and pollination networks (Pornon et al., 2016, 2017, 2019; Bell et al., 2017b; Macgregor et al., 2019; Richardson et al., 2019; Piko et al., 2021). DNA metabarcoding has successfully identified plant taxa at a higher taxonomic resolution than microscopy (Vamosi et al., 2017) in honey (Bruni et al., 2015; Hawkins et al., 2015; de Vere et al., 2017), IPL (Bell et al., 2017a; Galliot et al., 2017; Lucas et al., 2018), and in insect nests (McFrederick and Rehan, 2016). It even succeeded in detecting rare taxa in complex pollen mixtures containing large quantities of pollen originating from other plant species (Bell et al., 2018). Nevertheless, the reliability of metabarcoding in estimating the abundance of different types of pollen in mixtures is still the subject of debate. Moreover, whether it may provide a valuable insight into pollinator visits to plant species has not yet been investigated.
Some authors found significant positive relationships between pollen abundance (estimated using light microscopy) or pollen DNA amounts and sequence count in experimental samples (Hawkins et al., 2015; Pornon et al., 2016; Bell et al., 2017a; Baksay et al., 2020), in airborne samples (Kraaijeveld et al., 2015; Mohanty et al., 2017) and in bee pellets (Galimberti et al., 2014; Keller et al., 2015; Richardson et al., 2015a; Smart et al., 2017), whereas others found limited, non-significant or pollen type-specific relationships between pollen and sequence counts (Richardson et al., 2015a,b; Bell et al., 2017a; Bänsch et al., 2020). However, only weak relationships or no relationships at all were often found in mock mixtures and in bee pellets that contained huge amounts of pollen (often around 1,000,000 pollen grains; Richardson et al., 2015a,b, 2019; Bell et al., 2017b,2018), whereas more reliable results have been obtained using smaller amounts of pollen (around 10,000 pollen grains; Kraaijeveld et al., 2015; Pornon et al., 2016; Baksay et al., 2020). The different biological and technical biases that may affect the relationship between sequence count and pollen abundance have been thoroughly discussed in Pornon et al. (2016), Bell et al. (2018), and Baksay et al. (2020). Baksay et al. (2020) suggest that large amounts of pollen (and of DNA) may lead polymerase inhibitors to accumulate in solutions, with negative consequences for polymerase chain reaction (PCR) amplification and for the pollen-sequence count relationships. Variable amounts of pollen in mixtures may exacerbate DNA interference between species (Bell et al., 2018; Richardson et al., 2019) and affect the accuracy of the quantification of each type of pollen. Additionally, experimental mixtures may be irrelevant unless they reflect the composition, amount and proportion of pollen types found in natural pollen assemblages. Investigating pollen pellets provides very interesting insights into the plant species exploited by bees (Richardson et al., 2015b), but is of limited value in characterizing pollination networks as the pollen in bee corbicula is not involved in pollination, and as far as we know, there is no evidence that the composition of the pellet reflects that of pollen involved in pollination.
In this study, we tested – to our knowledge for the first time – the relationships between IPL involved in pollination, insect visits, and the sequences of each plant species present in the IPL in a semi-natural grassland. We aimed to answer the following questions: (1) Is there a positive relationship between pollen grain abundance in IPL and the frequency of visits to grassland plant species? (2) Is there a positive relationship between the number of DNA sequences (hereafter referred to as “sequences”) and pollen grain abundance in IPL? (3) Is there a positive relationship between the number of DNA sequences and the frequency of visits to grassland plant species? (4) Are the relationships similar among plant species? (5) Do the above relationships change with the relative abundance of co-occurring species in IPL?
If, during a foraging bout, some pollen accumulates on insect bodies at each visit, then we would expect a positive relationship between the frequency of visits and pollen abundance in IPL. If, for a given plant species, the number of sequence count reflects the number of pollen grains, we would expect a positive relationship between sequence and pollen counts (Hawkins et al., 2015; Pornon et al., 2016; Bell et al., 2017a; Baksay et al., 2020), and further, between sequence counts and the frequency of visits. However, since the visit-sequence relationship might include both visit-pollen and pollen-sequence discrepancies, we expected sequence count to be significantly more closely linked to pollen abundance than to visit frequency. Moreover, interspecific DNA interference during PCR or biases inherent to molecular processes could impair DNA sequence yields (i.e., the quantity of sequences yielded from a pollen grain), the sequence-pollen count relationship, and finally, the reliability of metabarcoding in providing quantitative information on plant-pollinator interactions.
Materials and Methods
Study Site and Field Experiment
The study was conducted in a semi-natural grassland on the campus of the University of Toulouse (southern France). In early May, which corresponds to the period of full bloom of entomophilous species, two cages (L × W × H: 3 m × 3 m × 2 m) were placed in the grassland about 3 m apart. The cages were made of polyester mosquito netting. A total of 29 plant species were identified in the cages. We visually estimated the relative proportions of the main entomophilous species Trifolium repens (3% cover), T. pratense (23%), Ranunculus bulbosus (20%), Sherardia arvensis (23%), Salvia verbenaca (3%), and Geranium dissectum (31%) in the two cages. We simultaneously released two bumblebees (Bombus terrestris) into each cage and observed (one observer per insect) all plant-bumblebee interactions between 10 am and 6 pm on two consecutive sunny days. We recorded the foraging activity of an insect, i.e., the number of flowers or inflorescences (Trifolium sp.) of each plant species it visited for a period of 20 min. The bumblebees were naive Bombus terrestris raised in hives and sold by Biobest Group NV (Belgium). Each individual was then captured with a clean net (giving a total of 75 specimens) and individually placed in sterile scintillation tubes, stored at 4°C in the field and then at −20°C in the lab. To reduce the presence of exogenous pollen on the insect’s body, the bumblebees were fed only glucose for 72 h before the experiment. Despite these precautions, pollen from unvisited plants may have been present on insect bodies because the brood was nourished with an unknown pollen mixture. To assess this potential contamination, we removed 15 individuals (negative controls) from the hive immediately after its arrival in Toulouse. The bees were kept in the hive until they were released into the cages. However, as the hive was not airtight some airborne pollen may have entered it. To assess the possible contamination of individuals by airborne pollen entering the hive before their release, at the end of the 2-day experiment we used 15 other individuals that had never left the hive as environmental controls. These 30 specimens were managed like the individuals in the experiment except that the “negative control” specimens were stored at −20°C immediately after being captured.
Barcoding of Plant Species
To identify pollen in the IPL, we designed our own barcodes and built our own reference library for the 29 plant species present in the cages. We considered all plant species to check for the potential contamination of insects moving in vegetation dominated by anemophilous plants. We extracted total DNA from fresh leaves using the DNeasy Plant Mini Kit (Qiagen) following the manufacturer’s instructions. We then amplified two genomic regions, the trnL (UAA) intron of the chloroplastic DNA (primer c: CGAAATCGGTAGACGCTACG; primer d: GGGGATAGAGGGACTTGAAC) and the internal transcribed spacer region 1 (ITS1) of the nuclear ribosomal region (ITS1-F: GATATCCGTTGCCGAGAGTC; ITS1-R: GGAAGTAAAAGTCGTAACAAGG). All the steps and PCR conditions are described in detail in Pornon et al. (2016; and here in Supplementary Material). After visualization on 1% agarose gel, the PCR products were sequenced by Sanger sequencing.
DNA Extraction, Polymerase Chain Reaction Amplification and Sequencing
Pollen packed in the bee corbiculae (pollen baskets) not involved in the pollination process (Horskins and Turner, 1999; Popic et al., 2012) was discarded. Pollen grains were removed from the bumblebees (n = 105) by shaking each insect for 10 min in 3 ml lysis buffer (part of the Macherey-Nagel Food DNA Extraction Kit). The pollen load solutions were transferred into 15 ml Falcon tubes and placed in a microbiological safety cabinet (MSC) to avoid contamination, and pollen DNA was extracted according to the manufacturer’s instructions (Macherey-Nagel). Blank controls were performed to assess potential contamination during DNA extraction and revealed negligible contaminations. After DNA isolation, residual pellets were stored in 50 μl phenol glycerol in sealed Eppendorf tubes for counting and identification of the pollen by microscopy. Combined pollen counting and identification were possible because the pollen walls do not require to be ruptured to extract DNA (Pornon et al., 2016). Pollen DNA was amplified using tagged trnL and ITS1 markers (Pornon et al., 2016). In both trnL [primer g GGGCAATCCTGAGCCAA and primer h CCATTGAGTCTCTGCACCTATC of the trnL (UAA) P6 loop] and ITS1 amplification, PCR reactions were performed in a 25 μl reaction volume containing 5 μl 5x Herculase II Reaction Buffer, 25 mM of each dNTP, 0.4 μM of each tagged PCR primer, 0.25 μl Herculase II Fusion DNA Polymerase, and distilled water. The PCR program was 95°C for 2 min, followed by 35 cycles [20 s denaturation at 95°C, 20 s hybridization at 55°C (50°C for ITS), 30 s elongation at 72°C] and a final elongation at 72°C for 3 min. For ITS1, 3% DMSO was added. PCRs were performed in the Thermal Cycler GeneAmp PCR System 9700 (Applied Biosystems). Blank PCR controls performed to assess potential contamination during amplification revealed negligible contaminations. Each PCR product was visualized on 1% agarose in TAE 0.5X buffer and quantified using the QuantStudio 6 Flex Real-Time PCR System (Applied Biosystems). Two libraries (one for each marker) were generated using 2 μl of PCR products (libraries were not pooled equimolarly) following the manufacturer’s guidelines for the Illumina TruSeq Nano kit, except that sonication was not performed. The libraries were sequenced using the MiSeq Illumina technology, 2 × 250 paired-end runs for ITS1 and 2 × 75 paired-end runs for trnL, using the NGS core facility at the Génopole Toulouse Midi-Pyrénées1.
Microscopy Pollen Identification and Counting
After acetolysis of pollen in extracted pellets (Erdtman, 1960), 20 μl of homogenized suspension were placed on a microscope slide for pollen identification and counting. Identification was performed to the most precise taxonomic level using pollen keys (Faegri and Iversen, 1989; Moore et al., 1991; Reille, 1992) and the GEODE laboratory’s pollen collection, which contains more than 2,000 species. All pollen of each slide was counted under an Olympus microscope (x500).
Sequence Analysis and Identification of Plant Taxa in Insect Pollen Loads
Pollen taxa were assigned using our own barcode reference library according to the procedure of Baksay et al. (2020). Sequence treatment followed the analytical procedure of the OBITools protocol (see Boyer et al., 2016 and git.metabarcoding.org/obitools). Based on these two files, the assembly of the forward and reverse reads was done with the Illumina paired end utility that aligns the two reads and returns the reconstructed sequence. Sequences of low alignment quality (<40%) were discarded. Each sequence was affiliated with its corresponding sample using the ngsfilter command and dereplicated into unique sequences using the obiuniq command. As some of these sequences may contain PCR and/or sequencing errors, as well as chimeras, they should be discarded using the obigrep command, and only sequences longer than 20 bp and with a count equal to or greater than 10 sequences kept. As a final denoising step, to clean the sequences for PCR and sequencing errors, we kept the head sequences that are sequences with no variants with a count greater than 5% of their own count (command obiclean). Finally, a single taxon was assigned to each sequence using the ecoTag program, which compared the sequences obtained with those in our taxonomic reference library, and including all plant species present in the study site. First, the longer ITS1 sequences were assigned allowing a best match score >97%. Completing our reference library for the short chloroplastic marker with the taxa previously identified by ITS1, we applied stricter identification for the P6-loop of trnL (>99%). The remaining unassigned sequences were blasted to ITS1 and trnL sequences in GenBank (NCBI) with a best match score >99%.
Insect Pollen Loads
We tested the relationships between pollen grain abundance, visit frequency and sequence count in plant species that were visited by at least 15 bumblebees, namely: Trifolium repens, T. pratense, Ranunculus bulbosus, Sherardia arvensis, Salvia verbenaca, and Geranium dissectum. Five other species were visited by fewer than seven bumblebees (Potentilla reptans, Valerianella locusta, Myosotis sp., Medicago lupulina, and Cerastium fontanum) and were consequently not analyzed. We observed that 60% of “negative control” individuals (captured in the hive before the experiment) carried pollen (as well as sequences) of the above species, indicating that the brood had been fed with pollen mixtures containing our focal species. Moreover, pollen and sequences of 34 other unvisited taxa some of them being typical Mediterranean species (Cistus ladanifer, Quercus ilex, and Quercus suber), were detected in the IPL. These unvisited species had an average of 11,164 (±8,118 SD) sequences (i.e., 83.4 ± 15% of all sequences) in IPL of “negative control” bumblebees and only 5,127 (±8,052 SD) sequences (i.e., 12.8 ± 17% of all sequences) in IPL of experimental bumblebees, of which 93.8% belonged to only two taxa (Pinus sp. and Quercus ilex) while the other taxa were very rare (Supplementary Figure 1). This observation suggests that contamination by unvisited plant materials was low in our study.
Data Analyses
Species–molecular marker interaction is often observed during PCR, meaning that a species may be efficiently amplified by one marker but not by another (Pornon et al., 2016). Such amplification biases can seriously affect network properties (Bell et al., 2018). To reduce this risk, we constructed a unique synthetic sequence matrix from the results of two markers. Specifically, for each plant species in each IPL, we kept the result of the marker whose amplification was the most successful, i.e., that had the highest sequence score (Pornon et al., 2016). The data set analyzed contained 450 records, each corresponding to an interaction between a particular experimental individual bumblebee (total: 75 individuals) and one particular plant species among the six species studied (see above).
Because (i) three species (Trifolium repens, Sherardia arvensis, and Geranium dissectum) were visited by few insects, were rare in IPL, and yielded very few sequences, and (ii) the three other species (T. pratense, Ranunculus bulbosus, and Salvia verbenaca) were visited by a large proportion of insects, had a lot of pollen in IPL, and yielded many sequences, it was, for statistical purposes (see below), impossible to analyze the six species together. For the frequently visited species (T. pratense, Ranunculus bulbosus, and Salvia verbenaca), as data met linear mixed model (LMM) requirements (residuals had a normal distribution) we used LMM with the HLfit function of the spaMM package, R (v.3.4.3) (Rousset and Ferdy, 2014) to test (i) how pollen abundance in each IPL was predicted (fixed effects) by the frequency of pollinator visits, plant species and their interaction; how the number of sequences obtained from each IPL was predicted (fixed effects) by either (ii) the frequency of pollinator visits, plant species and their interaction or (iii) pollen abundance, plant species and their interaction. Because data from rarely visited (Trifolium repens, Sherardia arvensis, and Geranium dissectum) did not meet LMM requirements (residuals did not have a normal distribution), all the above relationships were tested separately in each of the three plant species using a non-parametric Kendall rank correlation.
The relative abundance of co-occurring plant species in IPL may alter the DNA yield of a focal species (i.e., the number of sequences obtained from a given pollen unit) and hence the sequence-pollen abundance relationships in that species. We tested potential interspecific interference using LMM for rarely visited species (as data met LMM requirements) and non-parametric Kendall rank correlation tests for very frequently visited species (as data failed to meet LMM requirements). With LMM, we tested the fixed effects of the pollen abundance of co-occurring species (sum of the pollen of all the other species found in each insect load), plant species and their interaction on the ratio of the number of sequences to the number of pollen grains in each focal species.
In all LMM, when the interactions between the fixed predictive variables were not significant, they were removed from the models. To control for the fact that the same individual frequently visited several plant species and that around half the visits were observed in the same cage, we included “individual” and “cage” random effects in the models. Response variables were log10-transformed prior to analysis such that residuals had a normal distribution. Furthermore, for each LMM we calculated a marginal R2 (Nakagawa and Schielzeth, 2013) which quantifies the proportion of variance explained by the fixed factors only.
Results
Frequency of Visits
We observed a total of 3,429 visits by the 75 “experimental” bumblebees, i.e., an average of 45.72 (±29.93 SD) visits per bumblebee. Among the 11 plant species visited, the most frequently visited were S. verbenaca (1,668 visits), R. bulbosus (923), and T. pratense (475). S. arvensis (87), G. dissectum (56), and Trifolium repens (46) were much less frequently visited, and counted together, Potentilla reptans, Valerianella locusta, Myosotis sp., Medicago lupulina, and Cerastium fontanum received a total of only 16 visits (0.46%; Supplementary Table 1).
On average, a bumblebee visited 29.3 (±24.4 SD; n = 57 specimens), 13.8 (±8.7; n = 67), 4.8 (±4.5; n = 18), and 2.5 (±1.7; n = 22) flowers of S. verbenaca, R. bulbosus, S. arvensis, and G. dissectum, respectively, and 7.1 (±6.5; n = 67) and 3.1 (±2.7; n = 15) inflorescences of T. pratense and T. repens. It should be noted that individuals often foraged on several flowers on each Trifolium inflorescence during the course of one visit.
Insect Pollen Loads
From the 298,889 pollen grains analyzed by microscopy, we identified 55 plant taxa including 17 families, 34 genera, and four species (7% of total taxa). Salvia verbenaca (42%; 124,979 pollen grains) and R. bulbosus (39%; 117,405) accounted for 81% of total pollen amounts. The values were 9.4 and 6.6% for T. pratense (28,273) and T. repens (19,680), respectively. S. arvensis (0.1%; 303 pollen grains), G. dissectum (0.02%; 66) and the pollen of unvisited species (<3% of total pollen amounts) contributed very little to the total pollen pool. Together, the five other species visited counted 59 pollen grains (0.019%). Combining the number of pollen grains and the frequency of visits, we estimated that, at each visit, the plant species delivered about 1.2 (S. arvensis), 3.5 (G. dissectum), 60 (T. pratense), 75 (S. verbenaca), 127 (R. bulbosus), and 428 (T. repens) pollen grains (Supplementary Table 2).
Each IPL contained an average of 4,270 pollen grains (±7,392 SD; n = 75) with a maximum of 38,383 pollen grains. On average, individual bumblebees carried, respectively, 2,118 (±6,335 SD; n = 59), 1,752 (±4,282 SD; n = 67), and 554 (±823 SD; n = 51) pollen grains of S. verbenaca, R. bulbosus, and T. pratense and only 15.2 (±14.3 SD; n = 20) and 9.4 (±10.6 SD; n = 7) pollen grains of S. arvensis and G. dissectum. Thus, in contrast to the former species, the two latter species received few visits, deposited little pollen at each visit and, consequently, were very rare on insect bodies. The pattern of Trifolium repens was between the two, bumblebees carried a mean of 1,093 pollen grains (±1813 SD; n = 18) although half of them carried fewer than 24 grains.
Sequence Scores of trnL and ITS1
We obtained 2,673,399 ITS1 and 1,080,101 trnL sequences from the “experimental” bumblebees, of which 82% ITS1 sequences were assigned at species level, 14% at genus level and 4% at family level and only 1% could not be assigned to any taxon. A total of 73% of trnL sequences were assigned at species level, 3.4% at genus level and 5.9% at family levels, and 17.6% of the sequences could not be assigned. Both markers enable identification of 60 taxa of which 46 (77%), 12 (20%), and 2 (3%) were identified to species, genus, and family levels. Therefore, metabarcoding made it possible to identify 9% more taxa than microscopy (60 vs. 55 taxa) and much more taxa to species level (77 vs. 7%). Metabarcoding correctly identified all eleven species visited by bumblebees whereas only the two Trifolium species were recognized using microscopy. Seventeen genera and six families detected by microscopy in the pollen loads were not detected by sequences, most being shrub and tree taxa (17). Eleven taxa (three genera and eight species) detected by the metabarcoding were not detected by microscopy.
The six most frequently visited species accounted for 90% of all sequences (trnL + ITS1) whereas the five other species visited only accounted for 1.7% of sequences and the remaining unvisited taxa accounted for only 8.3% of sequences (Supplementary Table 3). Therefore, as expected, species receiving few visits which were rare in the IPL yielded far fewer sequences than the four other species.
Relationships Between the Frequency of Visits and Pollen Grain Abundance in Insect Pollen Loads
In the three most frequently visited plant species (R. bulbosus, S. verbenaca, and T. pratense), the pollen abundance in the IPL was positively correlated with the frequency of visits (linear mixed models; R2 = 0.43; p < 0.001) with a limited significant plant species effect (p = 0.03) due to the fact that R. bulbosus delivered more pollen during insect visits than the two other species (Supplementary Table 4 and Figure 1A). No interaction between plant species and the frequency of visits (p = 0.08) was observed, indicating that the slope of the response lines, ranging from 1.26 to 2.08, did not differ significantly between species. Kendall rank tests identified no significant correlation between pollen and visits in G. dissectum (τ = 0.08; p = 0.51) and S. arvensis (τ = 0.17; p = 0.13), which were both rarely visited and were rare in the IPL. A highly positive relationship (τ = 0.53, p < 0.001) was observed in T. repens, a species which was rarely visited but delivered a lot of pollen during each visit (Figure 1B). It is worth noting that some visitors carried no pollen from the plants they visited and that others carried pollen from plants that they had not visited (Supplementary Figure 1).
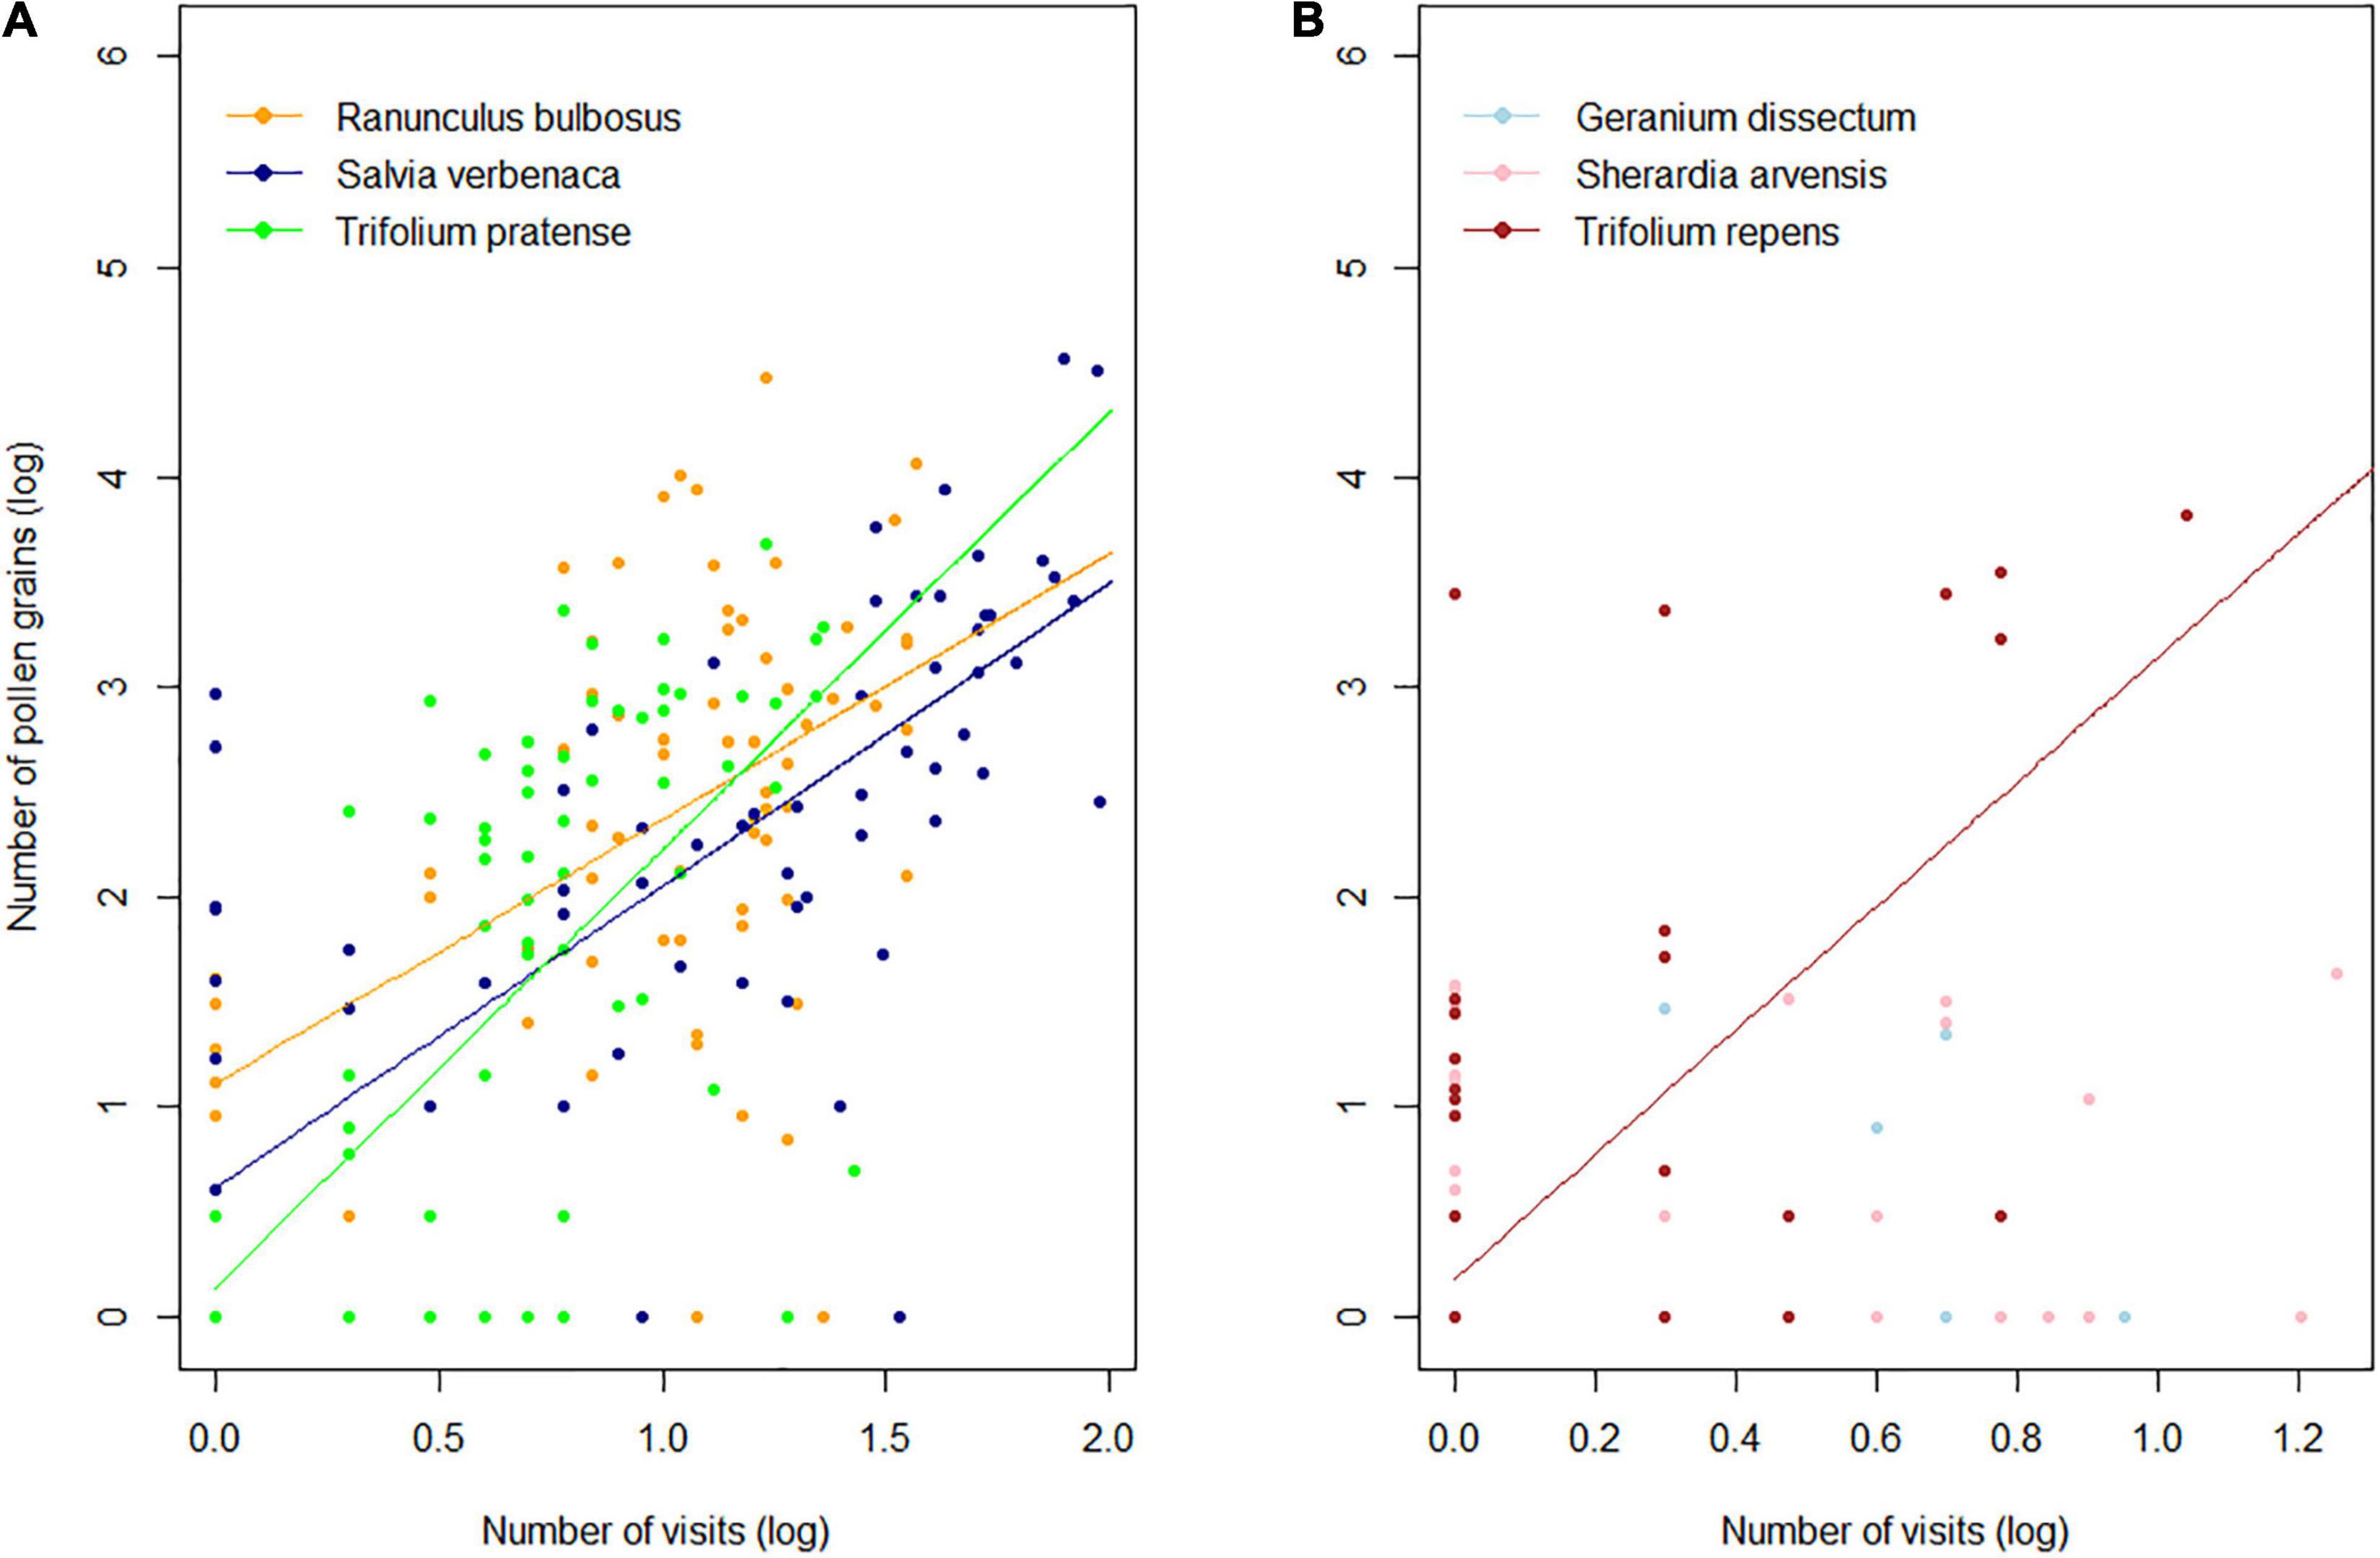
Figure 1. Relationship between pollen abundance in Bombus terrestris pollen loads and the frequency of visits in (A) the frequently visited (linear mixed model; see Supplementary Table 5 for model parameters) and (B) rarely visited plant species (non-parametric Kendall’s correlation). All values were log10 transformed.
Relationships Between the Frequency of Visits and Sequence Count
The number of sequences was positively correlated with the frequency of visits in the most frequently visited plant species (R. bulbosus, S. verbenaca, T. pratense; linear mixed model; R2 = 0.41; p < 0.001) (Supplementary Table 5 and Figure 2A). The significant plant species effect (p < 0.001) was mainly due to the relatively higher sequence production in T. pratense whereas the low but significant interaction between the frequency of visits and the plant species (p = 0.04) explained the difference in T. pratense and R. bulbosus’s line slopes (1.61 and 0.79, respectively). Kendall rank tests revealed a significant positive correlation between the frequency of visits and sequence count in G. dissectum (τ = 0.29; p < 0.01), S. arvensis (τ = 0.36; p < 0.001), and T. repens (τ = 0.33; p < 0.001) (Figure 2B).
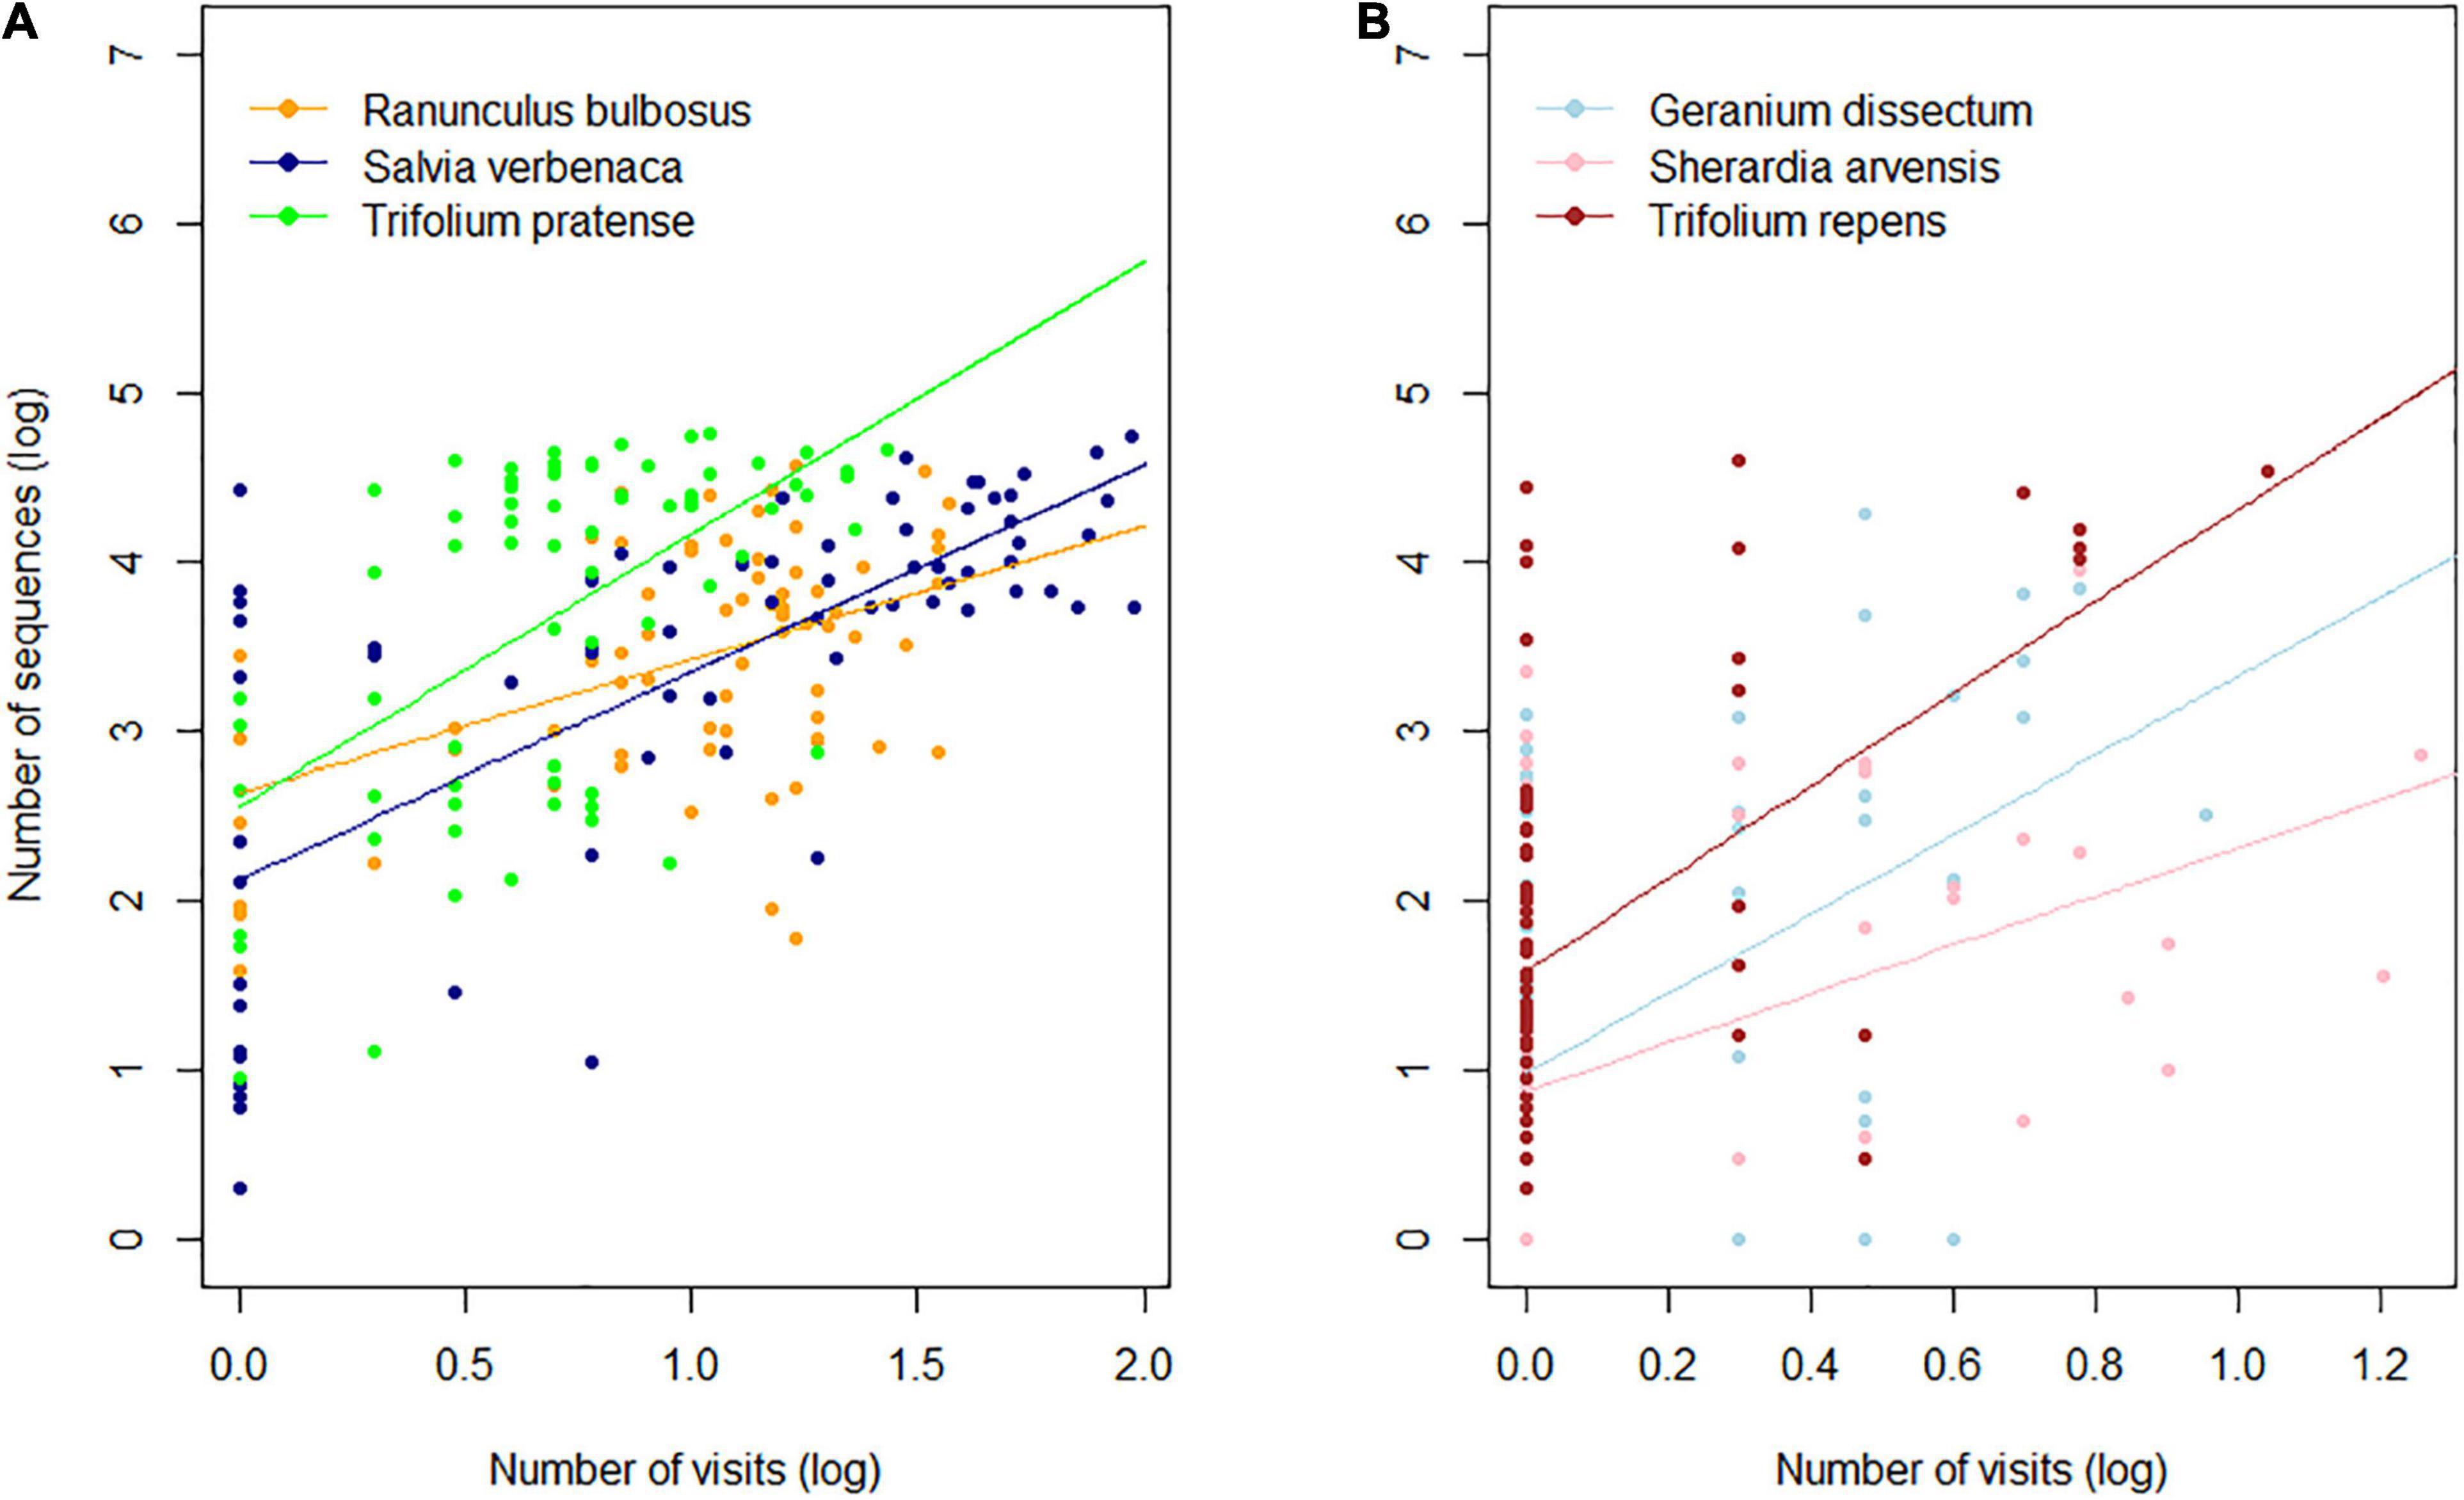
Figure 2. Relationship between visitation frequency and sequence count in (A) frequently visited (linear mixed model; see Supplementary Table 6 for model parameters) and (B) rarely visited plant species (non-parametric Kendall’s correlation). All values were log10 transformed.
Relationships Between Pollen Amount and Sequence Count
In the three most frequently visited species S. verbenaca, R. bulbosus, T. pratense, we found a highly significant positive effect of the pollen amounts in the IPL on sequence count (linear mixed models; R2 = 0.63; p < 0.001). There was a significant species effect (p < 0.001) revealing that T. pratense had relatively more sequences than the two other species (Supplementary Table 6). Although R. bulbosus was the species that delivered the most pollen, it did not have more sequences than the two other species. Interestingly, we found a marginal interaction between the pollen amount and the plant species (p = 0.07), meaning that the slope of the relationship, which ranged from 0.55 (R. bulbosus) to 0.75 (S. verbenaca), was similar across species (Figure 3A). Kendall rank correlation tests also revealed a significant positive correlation in T. repens (τ = 0.33, p < 0.001) and G. dissectum (τ = 0.20; p < 0.05) but no significant correlation in S. arvensis (τ = 0.12; p = 0.23) (Figure 3B).
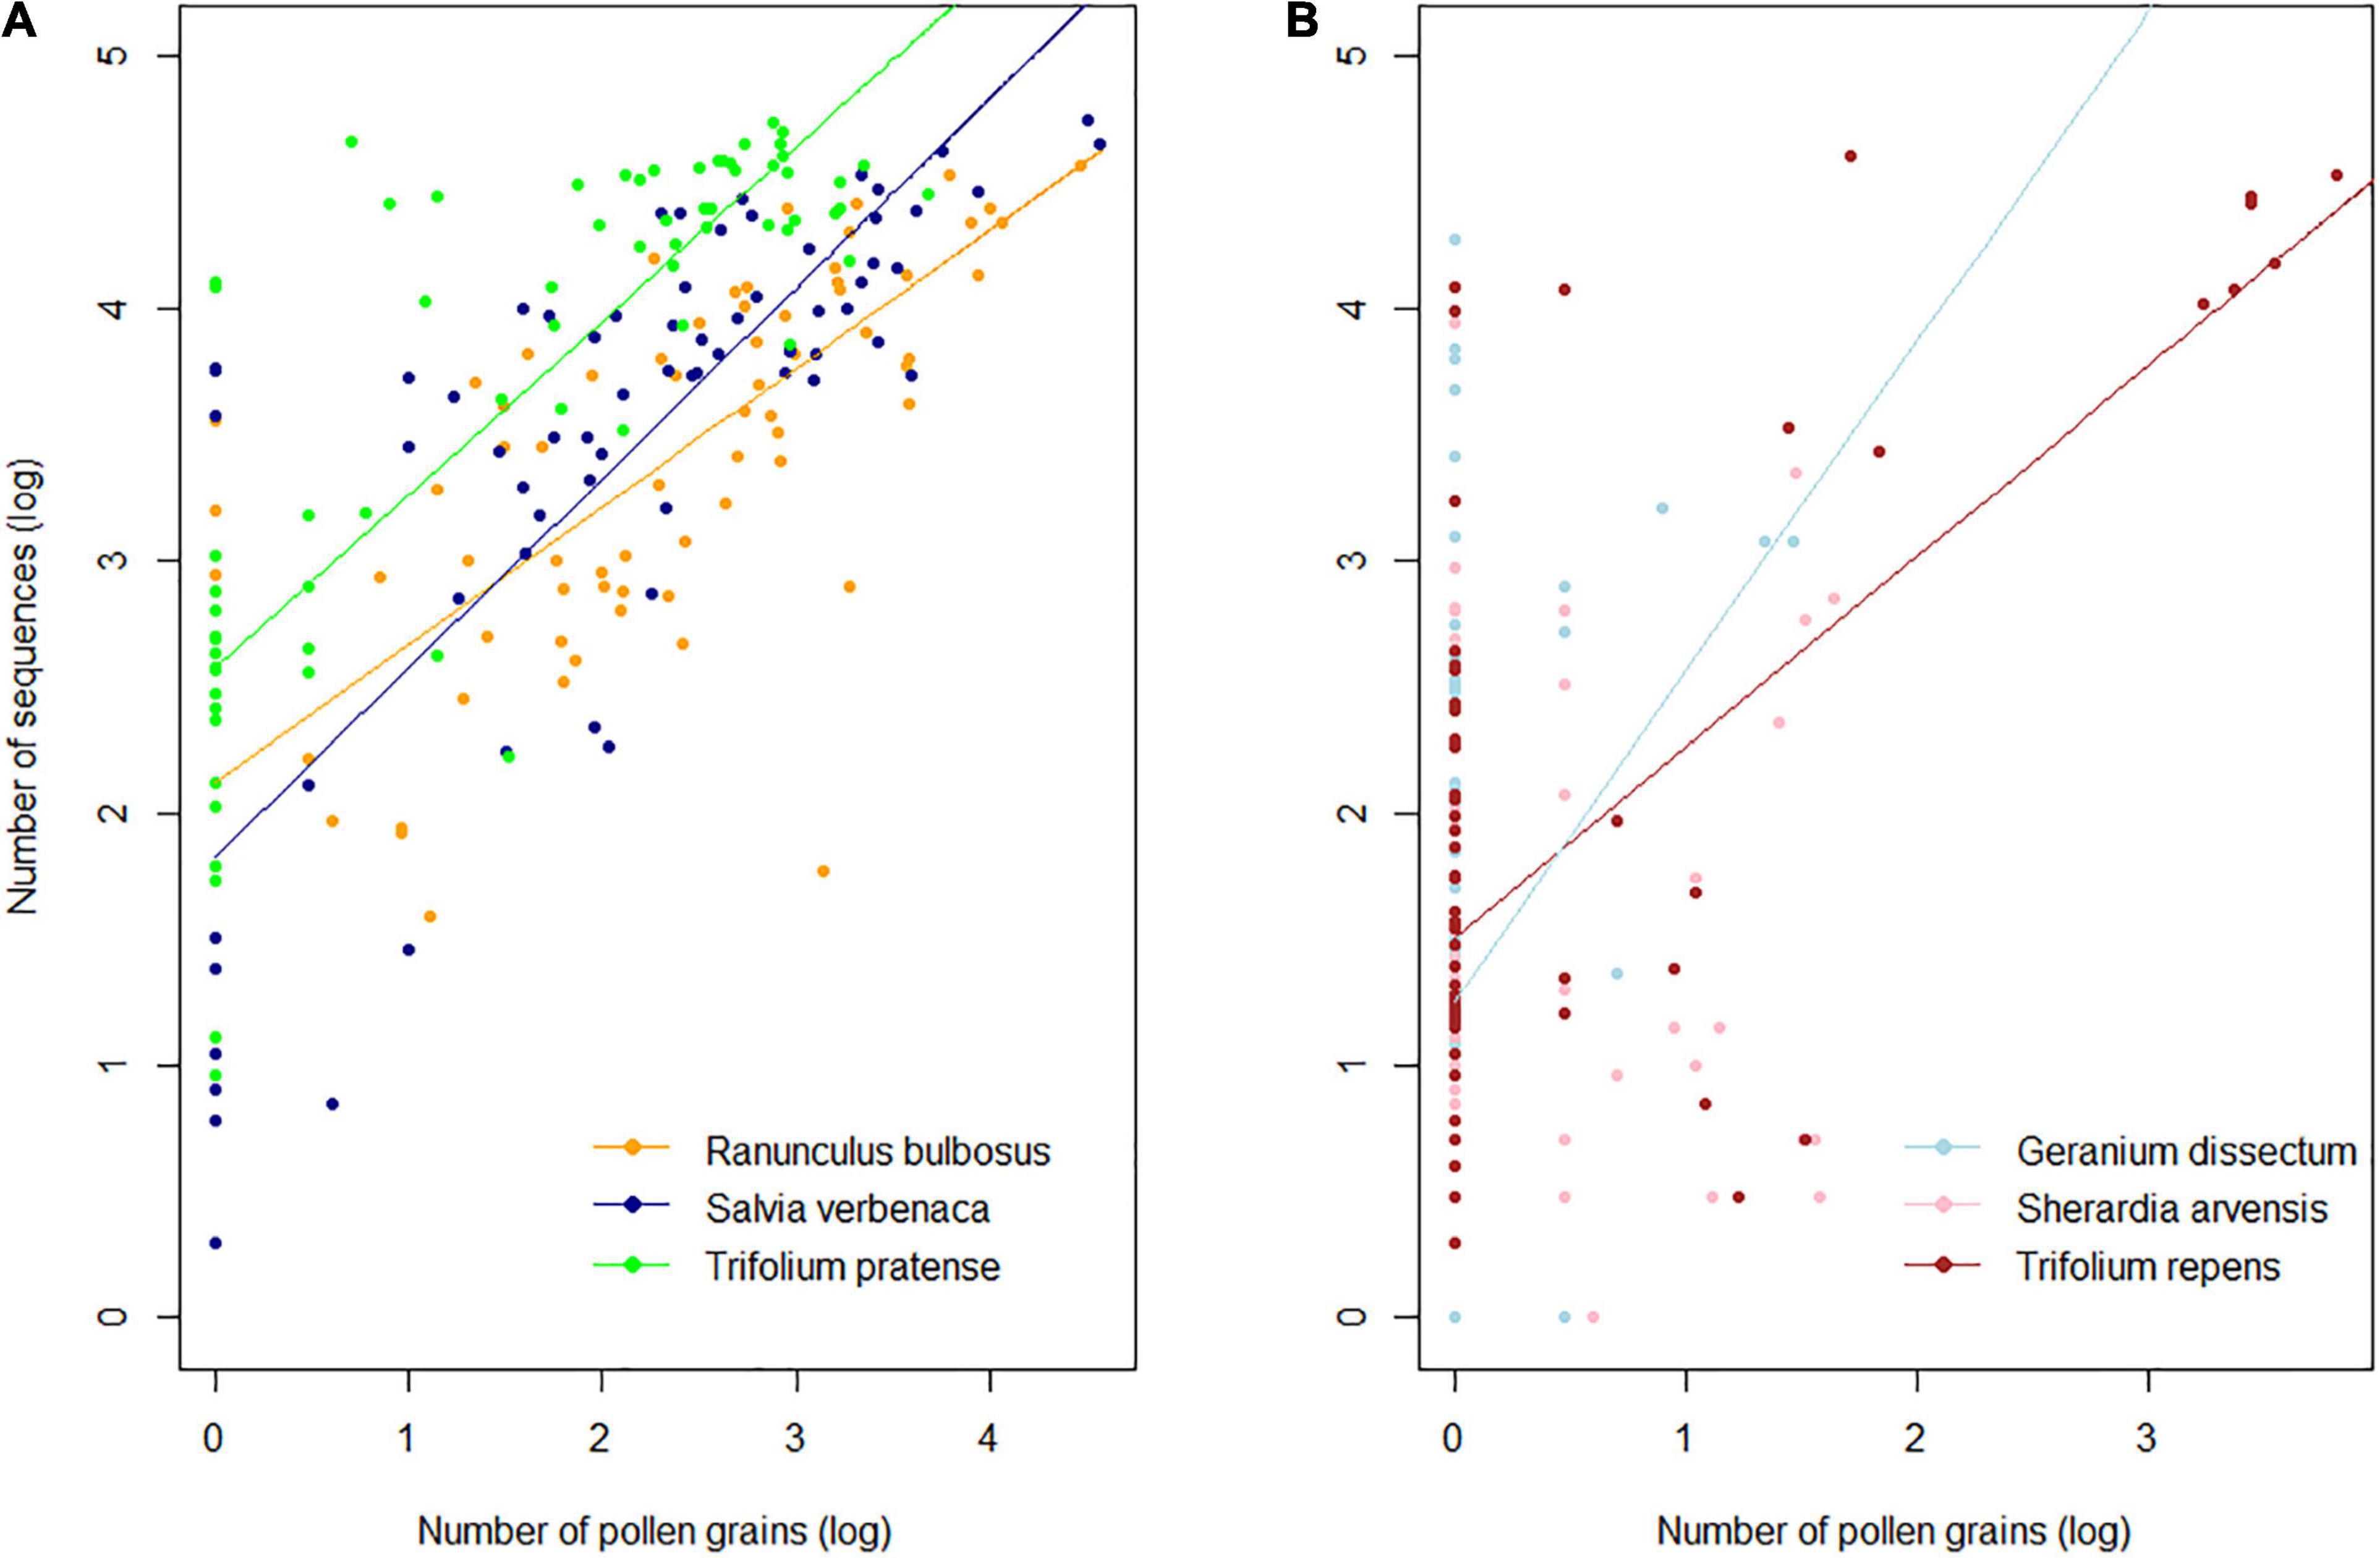
Figure 3. Relationship between pollen abundance and sequence counts in (A) frequently visited (linear mixed model; see Supplementary Table 7 for model parameters) and (B) rarely visited plant species (non-parametric Kendall’s correlations). All values were log10 transformed.
Effect of Co-occurring Plant Species in Insect Pollen Loads on Yields of Focal Species
A non-parametric Kendall rank correlation test revealed a significant negative correlation between the pollen of co-occurring species and the sequence yields in R. bulbosus (τ = −0.25, p < 0.01) and S. verbenaca (τ = −0.31, p < 0.001) and a non-significant correlation in T. pratense (τ = −0.15, p < 0.07) (Figure 4B). The linear mixed model also revealed a significant co-occurring pollen effect in rarely visited species (R2 = 0.24; p = 0.02) with low positive (G. dissectum: 0.31) and negative slopes (S. arvensis: −0.44; T. repens: −0.62). The relationship was stable across these species as no species effects (p = 0.08) and no interactions were observed between co-occurring pollen abundance and plant species (p = 0.45) (Supplementary Table 7 and Figure 4A).
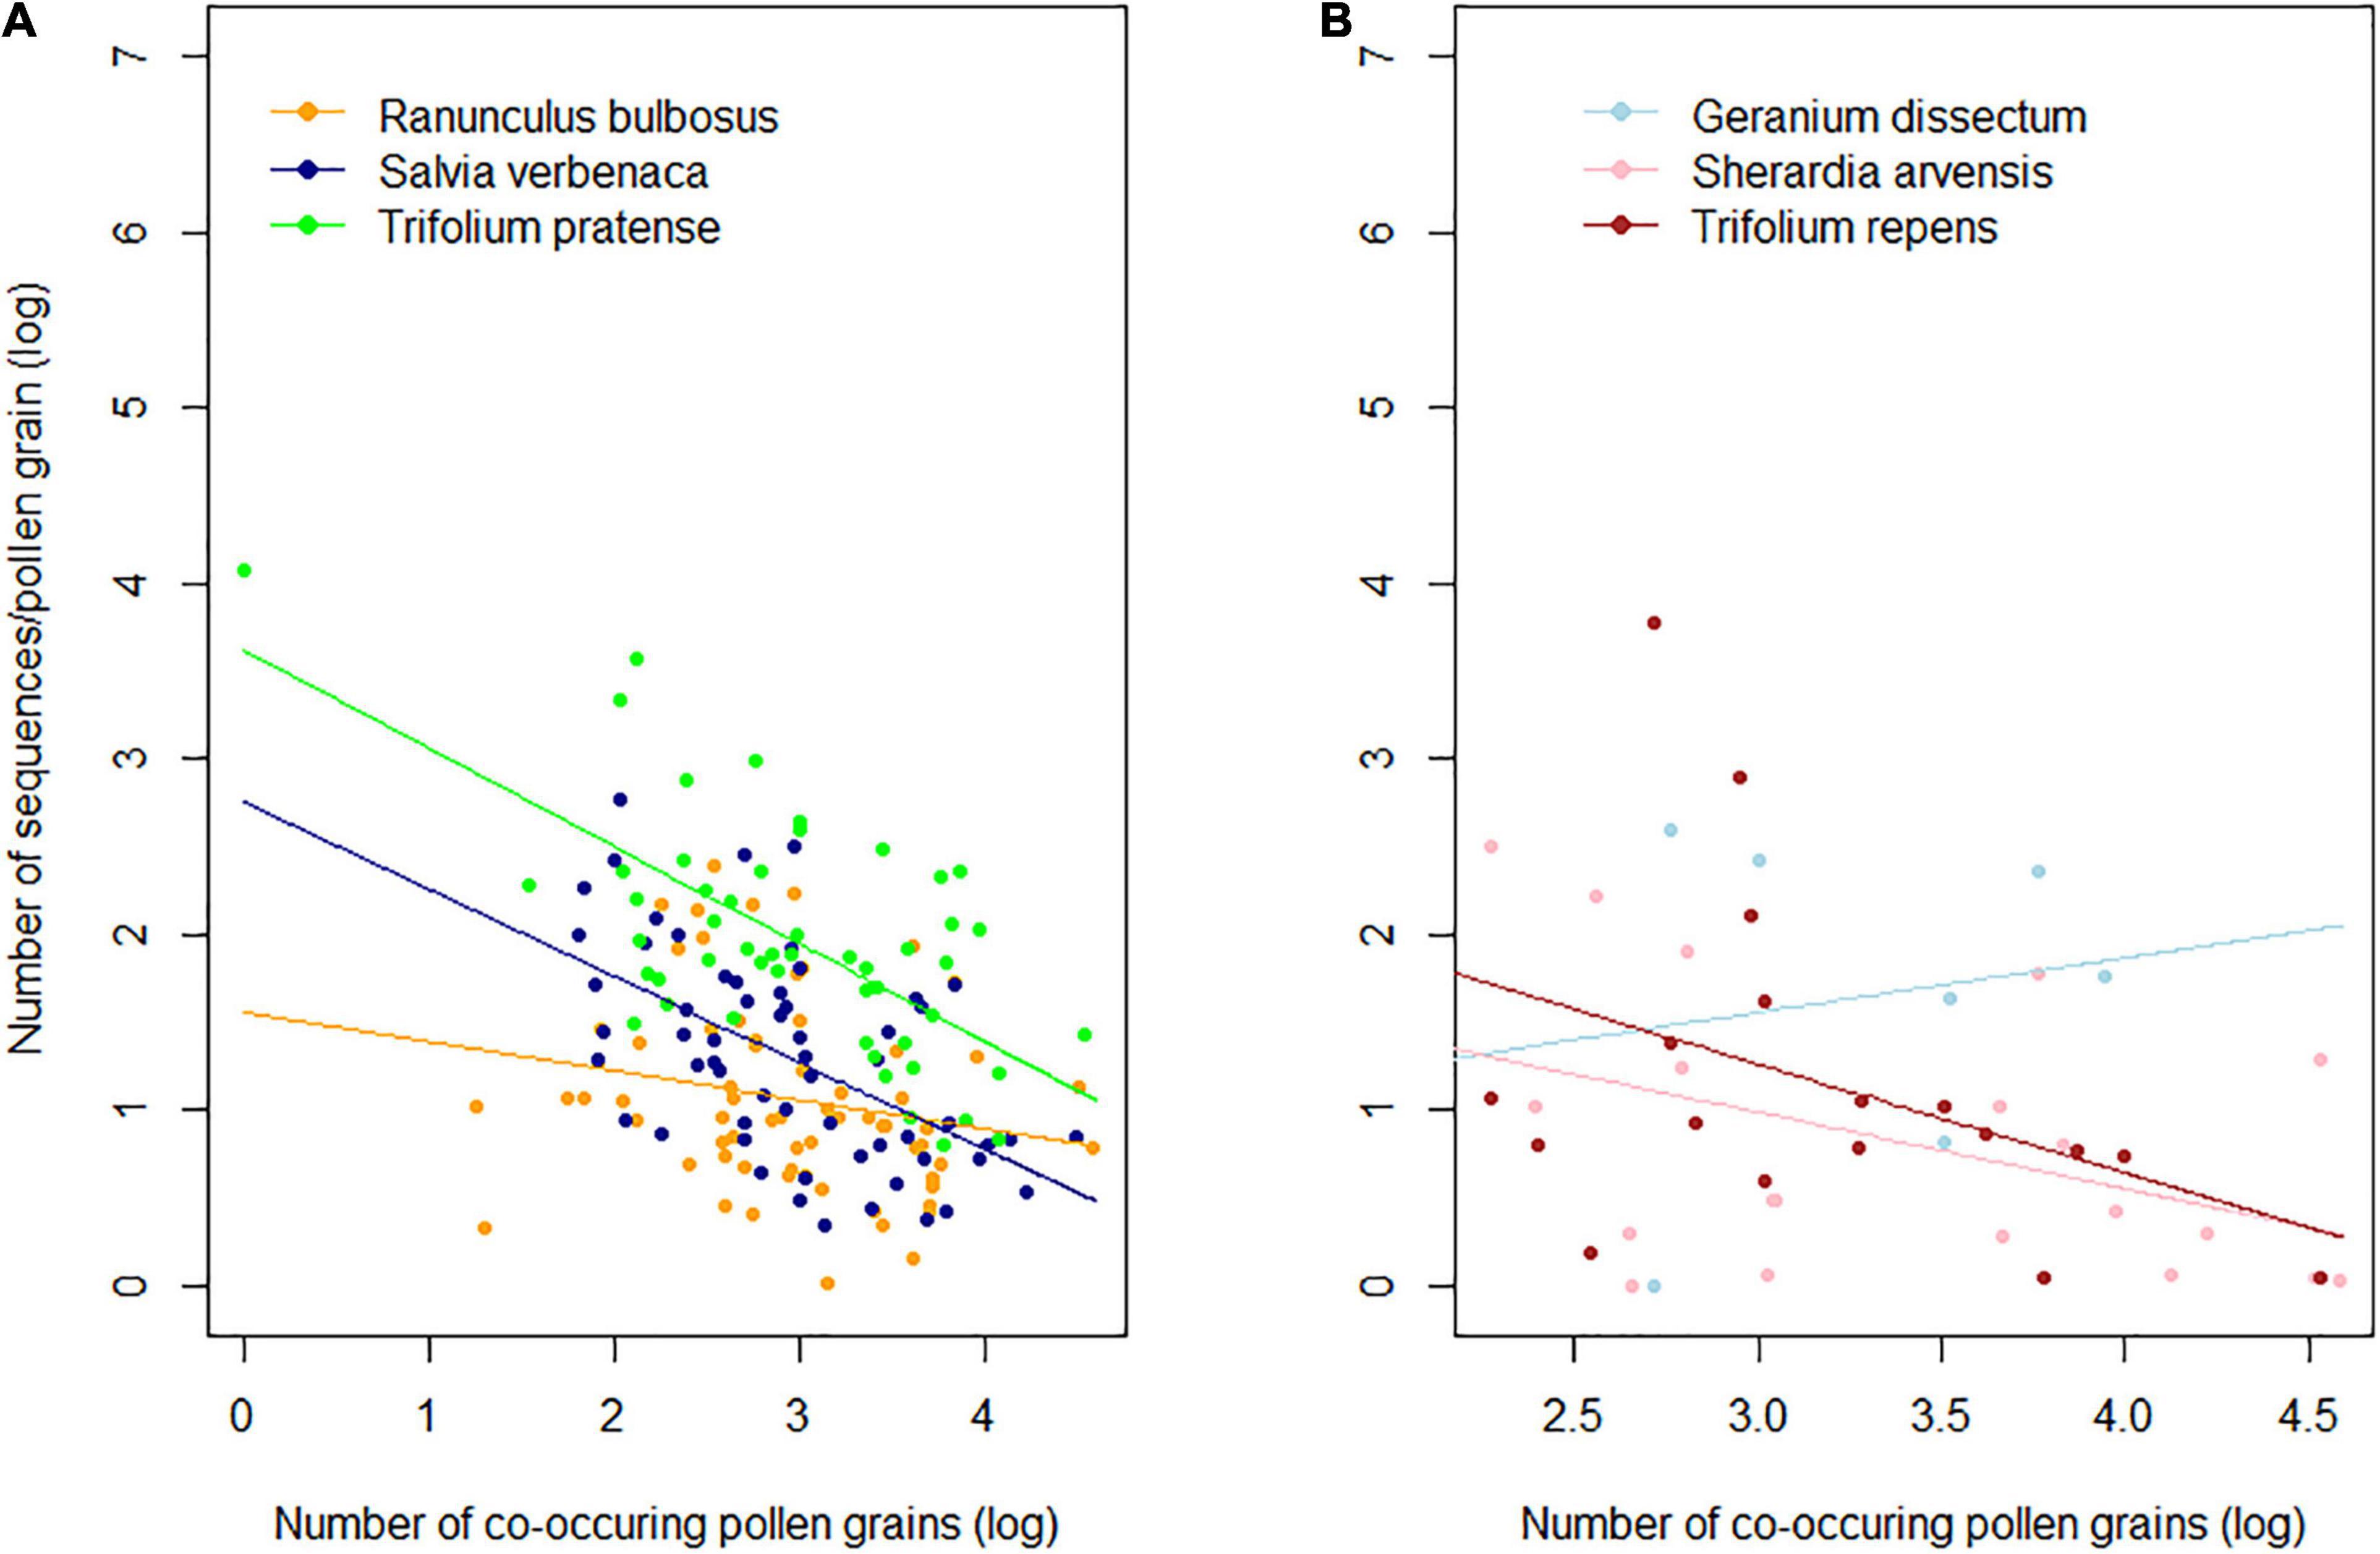
Figure 4. Relationship between pollen abundance of co-occurring species in Bombus terrestris pollen loads and the sequence yield of (A) frequently visited (non-parametric Kendall’s correlations) and (B) rarely visited plant species (linear mixed model; see Supplementary Table 8 for model parameters). All values are log10 transformed.
Discussion
To our knowledge, this is the first study to investigate in the same experiment, the relationships between the number of sequences, the frequency of visits and pollen amount in semi-natural vegetation with data obtained by monitoring visits and by identifying and counting pollen grains in the pollen load of each individual insect. The advantage of using metabarcoding to identify species compared to microscopy was confirmed and its reliability in assessing the strength of plant-pollinator interactions was demonstrated.
Identification Plant Taxa by DNA Metabarcoding vs. Microscopy
Metabarcoding not only made it possible to identify more taxa than microscopy (+9%). Furthermore, 77% of the taxa were identified to species level by metabarcoding versus only 7% by microscopy. This confirms the effectiveness of metabarcoding in describing pollination networks (Pornon et al., 2016; Vamosi et al., 2017) both at species and individual levels. Although bumblebees were only seen to visit 11 species, 5 (microscopy) to 5.5 (metabarcoding) times more taxa were found in their IPL due to the pollen mixture used to feed the brood. However, this unvisited pollen accounted for less than 3% of total pollen and 11.8% of sequences on “experimental” bumblebees. We therefore considered this unvisited pollen to be negligible in our quantitative analysis. The majority of visits, pollen grains and sequences were accounted for the six plant species visited (R. bulbosus, S. verbenaca, T. pratense, T. repens, G. dissectum, and S. arvensis) whereas five other species visited for only an extremely small number of visits, pollen and sequence scores.
Relationships Between the Frequency of Visits and Pollen Abundance in Insect Pollen Loads
Ninety-seven percent of total pollen belonged to the six species that received 99.5% of insect visits, whereas the five other species, which were very rarely visited (<1% of visits), represented <1% of the total pollen. In four out of six species visited (R. bulbosus, S. verbenaca, T. pratense, and T. repens) pollen amounts in the IPL were highly positively correlated with frequency of visits and the response slope did not vary across species despite the different floral morphologies and hence different reward accessibilities, i.e., zygomorphic flowers with floral rewards hidden in the tubular corolla (S. verbenaca, T. pratense, and T. repens) and actinomorphic open flowers with easily accessible floral rewards (R. bulbosus). Except for T. repens, these species received many visits and delivered large quantities of pollen to the IPL at each visit and were therefore deeply involved in plant-pollinator interactions. T. repens inflorescences were rarer in grassland than the flowers or the inflorescences (T. pratense) belonging to the other above-mentioned species, and were consequently frequently less visited, even though this clover is known to be a good resource for Bombus terrestris (Teper, 2004). Nevertheless, its pollen was abundant on some visitors, probably because they commonly visited several flowers on each inflorescence (field observations). Although G. dissectum and S. arvensis were relatively abundant in the grassland and had actinomorphic open flowers, they were much less frequently visited than the other species (except T. repens), delivered very few pollen grains at each visit (<4 grains/visit), were rare in the IPL, and finally, no correlation was found between visits and pollen amounts in the IPL.
In fact, the visitors appeared to be insufficiently constant and picked up too small amounts of pollen at each visit for this pollen to accumulate on the bumblebee bodies. It is well known that Apidae interact preferentially with zygomorphic-shaped flowers (Willmer, 2011; Pornon et al., 2016). While G. dissectum have small flowers (corolla width ≤8 mm) and S. arvensis have tiny flowers (corolla width ≤2 mm) and as bumblebees were not constant visitors and carried little pollen, it is extremely doubtful that these plants were their preferred resources or that B. terrestris was their natural pollinator. They possibly visited these plants (Lihoreau, personal communication, June 2020) because naive individuals usually test a variety of resources before foraging preferred ones. In the present study, we monitored only one pollinator species. Because other pollinators such as diptera and wild bee species usually have lower IPL than bumblebees (Gyan and Woodell, 1987; Charrier, 2014), including these species in our study would have probably (i) reduced the mean IPL but not changed the pollen amount-visit frequency relationships as our results show that the response slope of the relationship was independent on the abundance of pollen in IPL and (ii) increased the visits to G. dissectum and S. arvensis and the abundance of their pollen in IPL as many diptera prefer actinomorphic-shaped flowers (Geslin et al., 2013; Pornon et al., 2017).
To our knowledge, the relatively close pollen abundance-visit frequency relationships in species with contrasted floral morphologies is rarely documented in the literature (but see Stanley and Stout, 2013). On the hand, we observed that several visitors carried no pollen from the plants they visited whereas others carried the pollen of plants that they had not visited. It is known that visits to flowers do not always result in pollen being transferred to the insect (Bartomeus et al., 2008; Bosch et al., 2009; Popic et al., 2012). Further, in some specimens, pollen pellets are stored in the corbicula, a common behavior in bees (Michener et al., 1978). The choice we made to only consider pollen involved in pollination, and consequently, to discard corbicula, could mean that some of the pollen collected by the bumblebees was not detected in our analysis. Pollen mixture used to feed the hive explained the presence of pollen in some IPL belonging to taxa the pollinators had not visited during the course of our experiment. What is more, when visiting a plant species, an individual could have picked up heterospecific pollen left behind by previous visitors, i.e., pollen from plant species not visited by the individual we analyzed (Bosch et al., 2009).
Effects of Pollen Abundance and the Frequency of Visits on Sequence Count in Pollen Mixtures
In accordance with pollen and visit results, 90% of sequences (trnL and ITS1) were assigned to the six visited species. G. dissectum and S. arvensis that received few visits and accounted for only a little pollen in the IPL accounted for only 2.5% of the total sequences.
In all the species we analyzed, with the exception of the rarely visited S. arvensis, we found a strong positive relationship between the sequence count and the pollen amounts, in agreement with the findings of previous studies (Galimberti et al., 2014; Hawkins et al., 2015; Keller et al., 2015; Kraaijeveld et al., 2015; Pornon et al., 2016; Mohanty et al., 2017; Smart et al., 2017; Baksay et al., 2020). However, contrary to the results found by Bänsch et al. (2020) with ITS2, the relationship was not pollen-type specific, even if the sequence yield for a given amount of pollen varied across species. Interspecific differences in pollen wall structure (Pacini and Hesse, 2005), pollen and genome size, the number of marker copies (Bennett and Leitch, 2011) and in the efficiency of DNA extraction from protoplasts could explain why sequence yield varied across species. Note that the most frequently visited plant species differed both in the structure and in the size of their pollen grains (20 to >50 μm), with G. dissectum having the biggest pollen grains (Shehata, 2008; Özler et al., 2011; PalDat Palynological Database).
On the other hand, we observed in all species substantial intraspecific variation in the sequences-pollen relationships. Possible causes of this variation are, first, pollen fragmentation; even though we did not crush the pollen (Pornon et al., 2016), many grains were fragmented during DNA extraction and could consequently not be counted. The taxa most affected by pollen fragmentation belonged to the Asteraceae, Lamiaceae, and Geraniaceae families. Second, the detection and the count by microscopy of rare pollens in populated IPL may not be reliable. The above limitations could explain why the relationships were lower in both G. dissectum and S. arvensis. Third, as shown in a previous experimental study (Pornon et al., 2016), we found that the higher the abundance of co-occurring pollen in the IPL, the lower the sequence yield of the focal species. In contrast, Bell et al. (2018) did not observe such a significant negative effect, which could have originated from DNA competition during PCR amplification or from the depletion of reaction regents by abundant co-occurring pollen. Fourth, the presence of non-pollen material (plant debris, plant DNA in the pollinators’ saliva) could also lead to overestimation of pollen sequences (Bell et al., 2018). Finally, possible biases occurring at each step of the metabarcoding process (extraction and amplification of DNA, sequencing, sequence assignment; Pornon et al., 2016; Bell et al., 2019; Nilsson et al., 2019; Baksay et al., 2020) could also have generated intraspecific variation not only in sequence yield but also in the pollen-sequence relationship.
The relatively small amounts of pollen in the IPL (close to 4,300 pollen grains on average, maximum: 38,000 pollen grains), very similar to the amounts recorded for other Bombus species in natural subalpine vegetation (Delmas et al., 2016; 4,800 pollen grains) could explain why our R2 values are among the highest obtained to date. Indeed, authors who obtained strong sequence-to-pollen relationships used small quantities of pollen (<1000 grains; Kraaijeveld et al., 2015) while other authors who used larger quantities (tens of thousands to millions of pollen grains; Bell et al., 2017a,b, 2018) or the content of several corbiculae (i.e., several million pollen grains; Hawkins et al., 2015; Keller et al., 2015; Richardson et al., 2015a,b) obtained poorer relationships. A possible explanation is that such large amounts of pollen may increase the concentrations of endogenous inhibitors during PCR, and consequently affect the number of sequences yielded (Baksay et al., 2020).
As far as we know, the present study is the first to assess the relationships between sequences and visitation frequency in semi-natural vegetation at plant species level. In a multispecies approach, our team (Pornon et al., 2016) already found that the most frequently visited species also had more sequences than less visited species. Here, we demonstrate that this finding also holds true within species. Indeed, we found a significant relationship between the visitation frequency of an insect to a given plant species and the sequence count of that plant in the IPL. However, as expected, and due to the accumulation of biases linked to pollen and to DNA handling as well as to pollen-to-visit discrepancies (see above), the relationships was generally weaker than that between pollen and sequence count, but did not vary greatly across species.
The Reliability of Metabarcoding to Assess the Plant-Pollinator Interactions
On the one hand, our findings confirm the effectiveness of metabarcoding in providing quantitative information on pollen types in mixtures, as already shown in previous studies, and, although with less reliability, on pollinator visitation frequency. The sequence-to-pollen response slopes was similar across species; however, supplementary studies are required to determine whether our findings can be extrapolated to other systems including other plant species. Our results also suggest that, in our system, insect species that visit a plant species less than five times and carry less than 1,000 sequences of the visited plant in its IPL, should not be considered a significant pollinator of the plant species concerned. Thus, the method appears to be highly appropriate to assess if an insect species is a primary, secondary, negligible or not an interactor at all with a given plant species.
On the other hand, our results highlight non-negligible intraspecific variation in the pollen-sequence relationship. This means that metabarcoding cannot be used to accurately determine the number of specific pollen grains carried by each individual pollinator and that the reliability of the results will depend on the number of specimens investigated. The interspecific variation in sequence yields may also be a problem when comparing plant species in pollination networks. However, in a previous study, we demonstrated that the sequence yield of each plant species can be accurately determined (Baksay et al., 2020) and can then be used to weight the sequence count across species. Furthermore, our decision to keep the highest scores of either ITS1 or trnL in analyses was justified as some species were amplified with only one of the markers. However, while ITS1 amplification often produced more sequences than trnL, the difference could have increased interspecific variability in the number of yielded sequences, it seems without altering the slope of pollen-sequence relationship.
Despite the above-described weaknesses, we agree with Deagle et al. (2019), that sequence counts provide a more reliable description of species diet (interaction) in many scenarios than link occurrence alone. This assumption is particularly true when changing patterns of communities involving the same interacting species are investigated (Pornon et al., 2019). Furthermore, metabarcoding is better than alternative methods in several ways: it is less time-consuming, better than microscopy at identifying plant taxa in polyfloral pollen samples, it considerably extends both the spatial observation window (as it detects interactions that occur outside the observation area) and the time window (as pollen may remain on insect bodies for several hours and perhaps several days) for observation of plant-pollinator interactions and accounts for individual behaviors. Indeed, in classic networks, the link width only accounts for the number of pollinators with which a plant species interacts. Considering sequence counts includes de facto the extent to which individuals interact with a specific plant species, which can significantly modify the network structure (Pornon et al., 2017) as well as our perception of specialization/complementarity vs. generalization/redundancy of species in the networks. In the near future, the parallel quantification of pollen in IPL and on plant stigma will certainly improve our understanding of indirect interactions between plant species through pollinators, or between pollinators through plant species.
Data Availability Statement
The data that support the findings of this study are deposited in a public repository. Accession numbers for ITS1: GenBank MZ901216-MZ901245 and trnL: GenBank MZ965249-MZ965293.
Author Contributions
AP supervised the study. AP and SB designed the study and wrote the manuscript. SB, AP, NE, and MB collected the samples. SB prepared the samples, performed DNA laboratory work, and treated genetic raw data. DG performed microscopy analyses. SB and CA analyzed the data. All authors revised and approved the final version of the manuscript.
Funding
This work was supported by the French Laboratory of Excellence project “TULIP,” by the Centre National de la Recherche Scientifique-INEE, the region Occitanie–Midi-Pyrénées and Université Fédérale Toulouse Midi-Pyrénées.
Conflict of Interest
The authors declare that the research was conducted in the absence of any commercial or financial relationships that could be construed as a potential conflict of interest.
Publisher’s Note
All claims expressed in this article are solely those of the authors and do not necessarily represent those of their affiliated organizations, or those of the publisher, the editors and the reviewers. Any product that may be evaluated in this article, or claim that may be made by its manufacturer, is not guaranteed or endorsed by the publisher.
Supplementary Material
The Supplementary Material for this article can be found online at: https://www.frontiersin.org/articles/10.3389/fevo.2022.735588/full#supplementary-material
Footnotes
References
Baksay, S., Pornon, A., Burrus, M., Mariette, J., Andalo, C., and Escaravage, N. (2020). Experimental quantification of pollen with DNA metabarcoding using ITS1 and trnL. Sci. Rep. 10:4202. doi: 10.1038/s41598-020-61198-6
Bänsch, S., Tscharntke, T., Wünschiers, R., Netter, L., Brenig, B., Gabriel, D., et al. (2020). Using ITS2 metabarcoding and microscopy to analyse shifts in pollen diets of honey bees and bumble bees along a mass-flowering crop gradient. Mol. Ecol. 29, 5003–5018. doi: 10.1111/mec.15675
Bartomeus, I., Vilà, M., and Santamaría, L. (2008). Contrasting effects of invasive plants in plant–pollinator networks. Oecologia 155, 761–770. doi: 10.1007/s00442-007-0946-1
Bell, K. L., Burgess, K. S., Botsch, J. C., Dobbs, E. K., Read, T. D., and Brosi, B. J. (2018). Quantitative and qualitative assessment of pollen DNA metabarcoding using constructed species mixtures. Mol. Ecol. 28, 431–455. doi: 10.1111/mec.14840
Bell, K. L., Burgess, K. S., Botsch, J. C., Dobbs, E. K., Read, T. D., and Brosi, B. J. (2019). Quantitative and qualitative assessment of pollen DNA metabarcoding using constructed species mixtures. Mol. Ecol. 28, 431–455.
Bell, K. L., Fowler, J., Burgess, K. S., Dobbs, E. K., Gruenewald, D., Lawley, B., et al. (2017b). Applying pollen DNA metabarcoding to the study of plant–pollinator interactions1. Appl. Plant Sci. 5:1600124. doi: 10.3732/apps.1600124
Bell, K. L., Loeffler, V. M., and Brosi, B. J. (2017a). An rbcL reference library to aid in the identification of plant species mixtures by DNA metabarcoding. Appl. Plant Sci. 5:1600110. doi: 10.3732/apps.1600110
Bennett, M. D., and Leitch, I. J. (2011). Nuclear DNA amounts in angiosperms: targets, trends and tomorrow. Ann. Bot. 107, 467–590. doi: 10.1093/aob/mcq258
Bosch, J., González, A. M. M., Rodrigo, A., and Navarro, D. (2009). Plant–pollinator networks: Adding the pollinator’s perspective. Ecol. Lett. 12, 409–419. doi: 10.1111/j.1461-0248.2009.01296.x
Boyer, F., Mercier, C., Bonin, A., Bras, Y. L., Taberlet, P., and Coissac, E. (2016). obitools: A unix-inspired software package for DNA metabarcoding. Mol. Ecol. Res. 16, 176–182. doi: 10.1111/1755-0998.12428
Bruni, I., Galimberti, A., Caridi, L., Scaccabarozzi, D., De Mattia, F., Casiraghi, M., et al. (2015). A DNA barcoding approach to identify plant species in multiflower honey. Food Chem. 170, 308–315. doi: 10.1016/j.foodchem.2014.08.060
Charrier, O. (2014). Histoire Biogéographique et Système de Reproduction de Rhododendron Ferrugineum dans les pyrénées. [PhD thesis].France: Université Toulouse 3 Paul Sabatier.
de Vere, N., Jones, L. E., Gilmore, T., Moscrop, J., Lowe, A., Smith, D., et al. (2017). Using DNA metabarcoding to investigate honey bee foraging reveals limited flower use despite high floral availability. Sci. Rep. 7:42838. doi: 10.1038/srep42838
Deagle, B. E., Thomas, A. C., McInnes, J. C., Clarke, L. J., Vesterinen, E. J., Clare, E. L., et al. (2019). Counting with DNA in metabarcoding studies: how should we convert sequence reads to dietary data? Mol. Ecol. 28, 391–406. doi: 10.1111/mec.14734
Delmas, C. E. L., Fort, T. L. C., Escaravage, N., and Pornon, A. (2016). Pollen transfer in fragmented plant populations: Insight from the pollen loads of pollinators and stigmas in a mass-flowering species. Ecol. Evol. 6, 5663–5673. doi: 10.1002/ece3.2280
Faegri, K., Iversen, J. (1989). Textbook of Pollen Analysis, 4th Edn. eds Faegri, K., Kaland, P. E., and Krzywinski, K. (Chichester: John Wiley and Sons).
Galimberti, A., Mattia, F. D., Bruni, I., Scaccabarozzi, D., Sandionigi, A., Barbuto, M., et al. (2014). A DNA barcoding approach to characterize pollen collected by honeybees.. PLoS One 9:e109363. doi: 10.1371/journal.pone.0109363
Galliot, J.-N., Brunel, D., Bérard, A., Chauveau, A., Blanchetête, A., Lanore, L., et al. (2017). Investigating a flower-insect forager network in a mountain grassland community using pollen DNA barcoding. J. Insect Conserv. 21, 827–837. doi: 10.1007/s10841-017-0022-z
Garibaldi, L. A., Steffan-Dewenter, I., Winfree, R., Aizen, M. A., Bommarco, R., Cunningham, S. A., et al. (2013). Wild Pollinators Enhance Fruit Set of Crops Regardless of Honey Bee Abundance. Science 339, 1608–1611. doi: 10.1126/science.1230200
Geslin, B., Gauzens, B., Thébault, E., Dajoz, I., et al. (2013). Plant pollinator networks along a gradient of urbanisation. PLoS One 8:e63421. doi: 10.1371/journal.pone.0063421
Gyan, K. Y., and Woodell, S. R. J. (1987). Analysis of Insect Pollen Loads and Pollination Efficiency of Some Common Insect Visitors of Four Species of Woody Rosaceae. Funct. Ecol. 1:269. doi: 10.2307/2389430
Hawkins, J., Vere, N., Griffith, A., Ford, C. R., Allainguillaume, J., Hegarty, M. J., et al. (2015). Using DNA Metabarcoding to Identify the Floral Composition of Honey: A New Tool for Investigating Honey Bee Foraging Preferences. PLoS One 10:e0134735. doi: 10.1371/journal.pone.0134735
Horskins, K., and Turner, V. B. (1999). Resource use and foraging patterns of honeybees, Apis mellifera, and native insects on flowers of Eucalyptus costata. Aust. J. Ecol. 24, 221–227. doi: 10.1046/j.1442-9993.1999.00965.x
Keller, A., Danner, N., Grimmer, G., Ankenbrand, M., von der Ohe, K., von der Ohe, W., et al. (2015). Evaluating multiplexed next-generation sequencing as a method in palynology for mixed pollen samples. Plant Biol. 17, 558–566. doi: 10.1111/plb.12251
Kraaijeveld, K., de Weger, L. A., Ventayol García, M., Buermans, H., Frank, J., Hiemstra, P. S., et al. (2015). Efficient and sensitive identification and quantification of airborne pollen using next-generation DNA sequencing. Mol. Ecol. Res. 15, 8–16. doi: 10.1111/1755-0998.12288
Lucas, A., Bodger, O., Brosi, B. J., Ford, C. R., Forman, D. W., Greig, C., et al. (2018). Generalisation and specialisation in hoverfly (Syrphidae) grassland pollen transport networks revealed by DNA metabarcoding. J. Anim. Ecol. 87, 1008–1021. doi: 10.1111/1365-2656.12828
Macgregor, C. J., Kitson, J. J. N., Fox, R., Hahn, C., Lunt, D. H., Pocock, M. J. O., et al. (2019). Construction, validation, and application of nocturnal pollen transport networks in an agro-ecosystem: A comparison using light microscopy and DNA metabarcoding. Ecol. Entomol. 44, 17–29. doi: 10.1111/een.12674
McFrederick, Q. S., and Rehan, S. M. (2016). Characterization of pollen and bacterial community composition in brood provisions of a small carpenter bee. Mol. Ecol. 25, 2302–2311. doi: 10.1111/mec.13608
Michener, C. D., Winston, M. L., and Jander, R. (1978). Pollen manipulation and related activities and structures in bees of the family Apidae. Univ. Kansas Sci. Bull. 51, 575–601. doi: 10.5962/bhl.part.17249
Mohanty, R. P., Buchheim, M. A., Anderson, J., and Levetin, E. (2017). Molecular analysis confirms the long-distance transport of Juniperus ashei pollen. PLoS One 12:e0173465. doi: 10.1371/journal.pone.0173465
Moore, P. D., Webb, J. W., and Collinson, M. E. (1991). Pollen Analysis. London: BlackWell Scientific Publications.
Nakagawa, S., and Schielzeth, H. (2013). A general and simple method for obtaining R2 from generalized linear mixed-effects models. Methods Ecol. Evol. 4, 133–142. doi: 10.1111/j.2041-210x.2012.00261.x
Nilsson, R. H., Anslan, S., Bahram, M., Wurzbacher, C., Baldrian, P., and Tedersoo, L. (2019). Mycobiome diversity: high-throughput sequencing and identification of fungi. Nat. Rev. Microbiol. 17, 95–109. doi: 10.1038/s41579-018-0116-y
Ollerton, J., Winfree, R., and Tarrant, S. (2011). How many flowering plants are pollinated by animals? Oikos 120, 321–326. doi: 10.1111/j.1600-0706.2010.18644.x
Özler, H., Pehlivan, S., Kahraman, A., Doğan, M., Celep, F., Başer, B., et al. (2011). Pollen morphology of the genus Salvia L. (Lamiaceae) in Turkey. Flora Morphology, Distribution, Funct. Ecol. Plants 206, 316–327. doi: 10.1016/j.flora.2010.07.005
Pacini, E., and Hesse, M. (2005). Pollenkitt – its composition, forms and functions. Flora 200, 399–415. doi: 10.1016/j.flora.2005.02.006
Piko, J., Keller, A., Geppert, C., Batary, P., Tscharntke, T., Westphal, C., et al. (2021). Effects of three flower field types on bumblebees and their pollen diets. Basic Appl. Ecol. 52, 95–108. doi: 10.1016/j.baae.2021.02.005
Popic, T. J., Wardle, G. M., and Davila, Y. C. (2012). Flower-visitor networks only partially predict the function of pollen transport by bees. Austral Ecol. 38, 76–86. doi: 10.1111/j.1442-9993.2012.02377.x
Pornon, A., Andalo, C., Burrus, M., and Escaravage, N. (2017). DNA metabarcoding data unveils invisible pollination networks. Sci. Rep. 7:16828. doi: 10.1038/s41598-017-16785-5
Pornon, A., Baksay, S., Escaravage, N., Burrus, M., and Andalo, C. (2019). Pollinator specialization increases with a decrease in a mass-flowering plant in networks inferred from DNA metabarcoding. Ecol. Evol. 9, 13650–13662. doi: 10.1002/ece3.5531
Pornon, A., Escaravage, N., Burrus, M., Holota, H., Khimoun, A., Mariette, J., et al. (2016). Using metabarcoding to reveal and quantify plant-pollinator interactions. Sci. Rep. 6:27282. doi: 10.1038/srep27282
Potts, S. G., Imperatriz-Fonseca, V., Ngo, H. T., Aizen, M. A., Biesmeijer, J. C., Breeze, T. D., et al. (2016). Safeguarding pollinators and their values to human well-being. Nature 540, 220–229. doi: 10.1038/nature20588
Reille, M. (1992). Pollen et Spores D’europe et D’afrique du nord (Pollen and Spores of Europe and North Africa). Marseille: Laboratoire de Botanique historique et Palynologie.
Richardson, R. T., Curtis, H. R., Matcham, E. G., Lin, C.-H., Suresh, S., Sponsler, D. B., et al. (2019). Quantitative multi-locus metabarcoding and waggle dance interpretation reveal honey bee spring foraging patterns in Midwest agroecosystems. Mol. Ecol. 28, 686–697. doi: 10.1111/mec.14975
Richardson, R. T., Lin, C.-H., Quijia, J. O., Riusech, N. S., Goodell, K., and Johnson, R. M. (2015a). Rank-based characterization of pollen assemblages collected by honey bees using a multi-locus metabarcoding approach. Appl. Plant Sci. 3:1500043. doi: 10.3732/apps.1500043
Richardson, R. T., Lin, C.-H., Sponsler, D. B., Quijia, J. O., Goodell, K., and Johnson, R. M. (2015b). Application of ITS2 metabarcoding to determine the provenance of pollen collected by honey bees in an agroecosystem. Appl. Plant Sci. 3:1400066. doi: 10.3732/apps.1400066
Rousset, F., and Ferdy, J.-B. (2014). Testing environmental and genetic effects in the presence of spatial autocorrelation. Ecography 37, 781–790. doi: 10.1111/ecog.00566
Shehata, A. A. (2008). pollen morphology of egyptian geraniaceae: an assessment of taxonomic value.Int. J. Bot. 4, 67–76.
Smart, M. D., Cornman, R. S., Iwanowicz, D. D., McDermott-Kubeczko, M., Pettis, J. S., Spivak, M. S., et al. (2017). A Comparison of Honey Bee-Collected Pollen From Working Agricultural Lands Using Light Microscopy and ITS Metabarcoding. Environ. Entomol. 46, 38–49. doi: 10.1093/ee/nvw159
Smith, M. R., Singh, G. M., Mozaffarian, D., and Myers, S. S. (2015). Effects of decreases of animal pollinators on human nutrition and global health: A modelling analysis. Lancet 386, 1964–1972. doi: 10.1016/S0140-6736(15)61085-6
Stanley, D. A., and Stout, J. C. (2013). Quantifying the impacts of bioenergy crops on pollinating insect abundance and diversity: A field-scale evaluation reveals taxon-specific responses. J. Appl. Ecol. 50, 335–344. doi: 10.1111/1365-2664.12060
Teper, D. (2004). Food plants of bombus terrestris L. determined by palynological analysis of pollen loads. J. Apic. Sci. 48, 75–81.
Tur, C., Vigalondo, B., Trøjelsgaard, K., Olesen, J. M., and Traveset, A. (2014). Downscaling pollen–transport networks to the level of individuals. J. Anim. Ecol. 83, 306–317. doi: 10.1111/1365-2656.12130
Vamosi, J. C., Gong, Y.-B., Adamowicz, S. J., and Packer, L. (2017). Forecasting pollination declines through DNA barcoding: The potential contributions of macroecological and macroevolutionary scales of inquiry. New Phytol. 214, 11–18. doi: 10.1111/nph.14356
Vázquez, D. P., Blüthgen, N., Cagnolo, L., and Chacoff, N. P. (2009). Uniting pattern and process in plant–animal mutualistic networks: A review. Ann. Bot. 103, 1445–1457. doi: 10.1093/aob/mcp057
Keywords: DNA metabarcoding, ITS1, trnL, visit survey, pollen mixture, sequence counts, pollen counts, pollination
Citation: Baksay S, Andalo C, Galop D, Burrus M, Escaravage N and Pornon A (2022) Using Metabarcoding to Investigate the Strength of Plant-Pollinator Interactions From Surveys of Visits to DNA Sequences. Front. Ecol. Evol. 10:735588. doi: 10.3389/fevo.2022.735588
Received: 02 July 2021; Accepted: 25 February 2022;
Published: 29 March 2022.
Edited by:
György Barabás, Linköping University, SwedenReviewed by:
Xin Zhou, China Agricultural University, ChinaColin Fontaine, UMR 7204 Centre d’Écologie et des Sciences de la Conservation (CESCO), France
Copyright © 2022 Baksay, Andalo, Galop, Burrus, Escaravage and Pornon. This is an open-access article distributed under the terms of the Creative Commons Attribution License (CC BY). The use, distribution or reproduction in other forums is permitted, provided the original author(s) and the copyright owner(s) are credited and that the original publication in this journal is cited, in accordance with accepted academic practice. No use, distribution or reproduction is permitted which does not comply with these terms.
*Correspondence: Sandra Baksay, c2FuZHJhLmJha3NheUBnbWFpbC5jb20=, orcid.org/0000-0003-0873-0246