 Huai Yang
 Ting Huang3†
 Qiu Yang
95% of researchers rate our articles as excellent or good
Learn more about the work of our research integrity team to safeguard the quality of each article we publish.
Find out more
ORIGINAL RESEARCH article
Front. Ecol. Evol. , 09 January 2023
Sec. Conservation and Restoration Ecology
Volume 10 - 2022 | https://doi.org/10.3389/fevo.2022.1107421
This article is part of the Research Topic Key Determinants of Biodiversity, Ecosystem Functioning and Restoration in Climate Change Sensitive Ecosystems View all 24 articles
Introduction: Although numerous studies have investigated ecosystem-scale soil respiration (SR) at different ecosystem, our understanding of spatial heterogeneity of SR at plot scale is still incomplete, especially in tropical rainforests with complex topography. Further, the ecological factors that drive the variability of SR in tropical rainforests is also poorly understood.
Methods: Here, we investigated the spatial variations and control mechanisms of SR in a 60-ha plot of old-growth tropical rainforest with complex topography. Specifically, we sampled a 60-ha plot in intervals of 20 m to measure SR with LI-8100, used semi-variogram of geostatistical tools to examine spatial heterogeneity of SR.
Results: The mean SR rate in this plot was 4.312 ± 0.0410 (SE) μmol m−2 s−1. Geostatistical analysis indicated that the SR rate at this plot had a moderate spatial dependence, with a nugget-to-sill ratio of 68.1%. The coefficients variance of SR was 36.2% and the patch size was approximately 112 m. Stepwise linear regression analysis (involving a multiple regression tree) revealed that the independent factors regulated different types of SR’s. Liner mix-effect models showed that SR was significantly positively related to soil phosphorus and negatively to the slope in the 60-ha plot. Spatial disturbance of SR along multidimensional habitats that an increase in elevation of the multidimensional habitat, which was accompanied by enhanced SOC and soil phosphorous, also increased its SR in the 60-ha plot.
Discussion: This study would be helpful in designing future field experiments for a better understanding of SR at plot scale.
Soil organic carbon (SOC) is the largest pool of carbon (C) in terrestrial ecosystems on a global scale, and soil respiration (SR) is a crucial pathway for the transferring of C to the atmosphere. Even small changes in SR may strongly affect atmospheric CO2 (Haaf et al., 2021; Watts et al., 2021), and then affect climate change in future. The SR is an important component of the carbon cycle and a sensitive indicator for the overall belowground biogeochemical processes in terrestrial ecosystems (Lei et al., 2021). However, the amount and regulation factors of SR show great uncertainties. Therefore, accurately monitoring and evaluation of SR could meaningfully contribute to predict climate change.
Accurate quantification of SR was extremely difficult largely due to its high variability at different spatial scales (Stell et al., 2021). In fact, spatial heterogeneity of SR was influenced by various soil factors, such as soil nutrient availability (Liang et al., 2021; Xiao et al., 2021), soil C/nitrogen (N)ratio (Cui et al., 2021), soil moisture and temperature (Numa et al., 2021). Moreover, soil topography was regarded as the main factor that was involved the induction of spatial variation of SR (Zhang et al., 2021). Topography, generated a local microclimate, led to variations in soil drainage and SOC distribution, and a change in the soil moisture and temperature, which directly influenced SR (Kang et al., 2003). However, investigation of the influence of complex topography on SR is limited (Chambers et al., 2004).
The magnitude of spatial variation in soil CO2 could be larger in a tropical forest as compared to other forest ecosystems (Boonriam et al., 2021; Cai et al., 2021). A few studies conducted in undisturbed forest have focused on temporal variation in SR (Hashimoto et al., 2004; Lei et al., 2021). Our knowledge on spatial variations of SR in tropical forests, especially in Asia, is still very poor (Feng and Zhu, 2019).
Environmental perturbations affected abiotic factors could alter SR. For example slope aspect might determine SR rates by modifying the microclimatic conditions (Martínez-García et al., 2017). SR was higher in the upper part of the slope and lower in the lower part (Ohashi and Gyokusen, 2007). However, SR was 6.0% higher in the lower than upper slope over the 2 growing seasons (Xu and Wan, 2008). In the natural forests slope position had a significant effect on SR (Zhao et al., 2018). Most of these studies have indicated that the difference in soil water content between different positions along a slope was the main factor contributing to spatial variation of SR (Takahashi et al., 2011; Hereș et al., 2021). Although the altitude was a variable including various environmental factors, it might be used as a surrogate parameter of SOC (Moriyama et al., 2013). SR was mainly depended on soil temperature (Karhu et al., 2014). Other abiotic factors such as soil texture, SOC, soil nitrogen (SN), C/N ratio and soil phosphorus (SP) could also influence SR (Su et al., 2016; Yazdanpanah et al., 2016). N addition could significantly promote SR (Li et al., 2022). The responses of SR to N addition were also mediated by topography (Duan et al., 2023). Phosphorus (P) addition significantly increased SR by 17.4% in tropical forest, changes of C pools might drive the responses of SR to P addition (Feng and Zhu, 2019). SR was positively related with SOC and P (Tao et al., 2016).
In this study, a series of measurements of SR were conducted in a 60-ha old-growth tropical rainforest with complex topography. Related abiotic factors, such as altitude, convexity, slope, SN, SOC and SP, were also measured to explain the spatial pattern of SR. The specific objectives of this study were to: (i) assess the spatial heterogeneity of SR at the subplot scale (20 m × 20 m) in a tropical rainforest, and (ii) explore the key factors that drive these spatial patterns of SR.
The study was conducted in the Jianfengling National Nature Reserve (JFR), which is located in Ledong county in the southwestern region of Hainan Island, China (latitude and longitude ranges: 18°23′N-18°50′N and 108°36′E-109°05′E, altitude range: 0–1,412 m above sea level). The region comprises mostly of an old-growth tropical montane rainforest (163 km2) at the northern edge of tropical Asia (Jiang et al., 2002; Wang et al., 2014). It has a tropical monsoon climate that is characterized with distinct wet (May to November) and dry (December to April of the second year) seasons. The mean annual air temperature is 24.5°C, and varies between 19.4°C (January) to 27.3°C (June), whereas there has a yearly mean relative humidity is 88%. The annual rainfall in the region ranges from 1,000 to 3,600 mm, with an average precipitation of 2,449 mm, of which 80–90% occurs from May to October (Zhou et al., 2013; Liu et al., 2021). This region has an irregular topography with granite as the predominant soil parent material. The most common soil type is the montane lateritic red or yellow earth (Xu et al., 2013).
A 60-ha plot was established in the tropical montane rainforest of JFR (Figure 1). It had 1,500 basic plots (20 m × 20 m) with a width of 600 m (East–West) and a length of 1,000 m (South–North; Figure 2). The plot establishment, included topographic mapping (using electronic whole-station theodolites), corner-post setting, and an initial tree census (adapting the techniques developed by the Center for Tropical Forest Science; Condit, 1998), was started in March 2009 and completed in December 2012. The altitude of the plot ranged from 866.3 m to 1016.7 m (Xu et al., 2015).
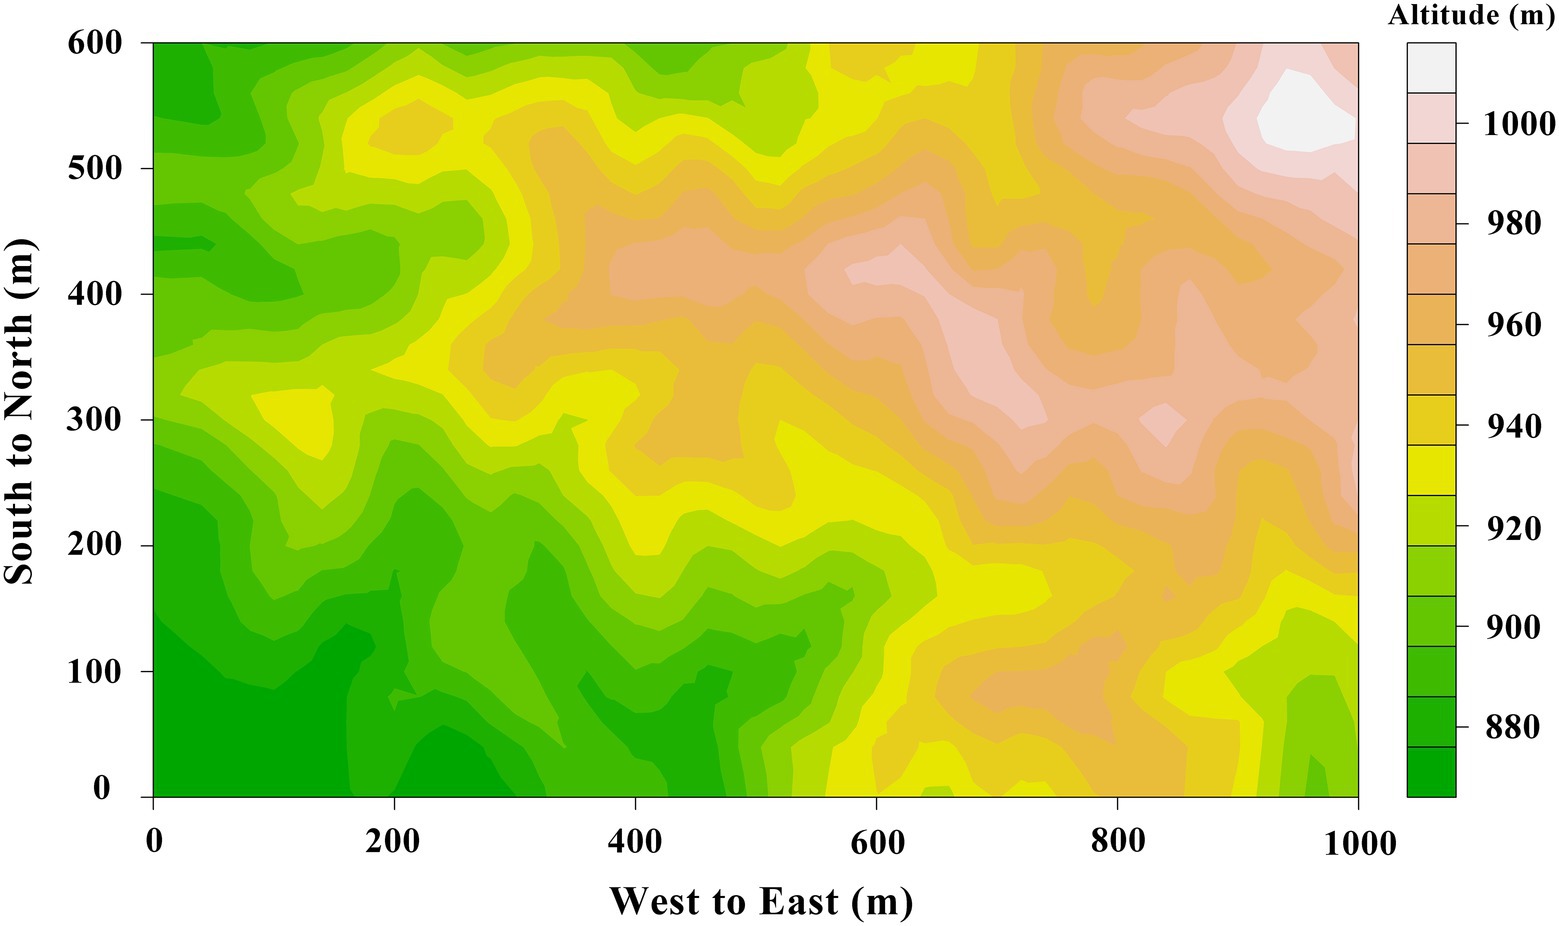
Figure 1. The topographic map of 60-ha tropical rainforest plot in Jianfengling, China, color gradient represents the range of altitude (866.3 m to 1016.7 m).
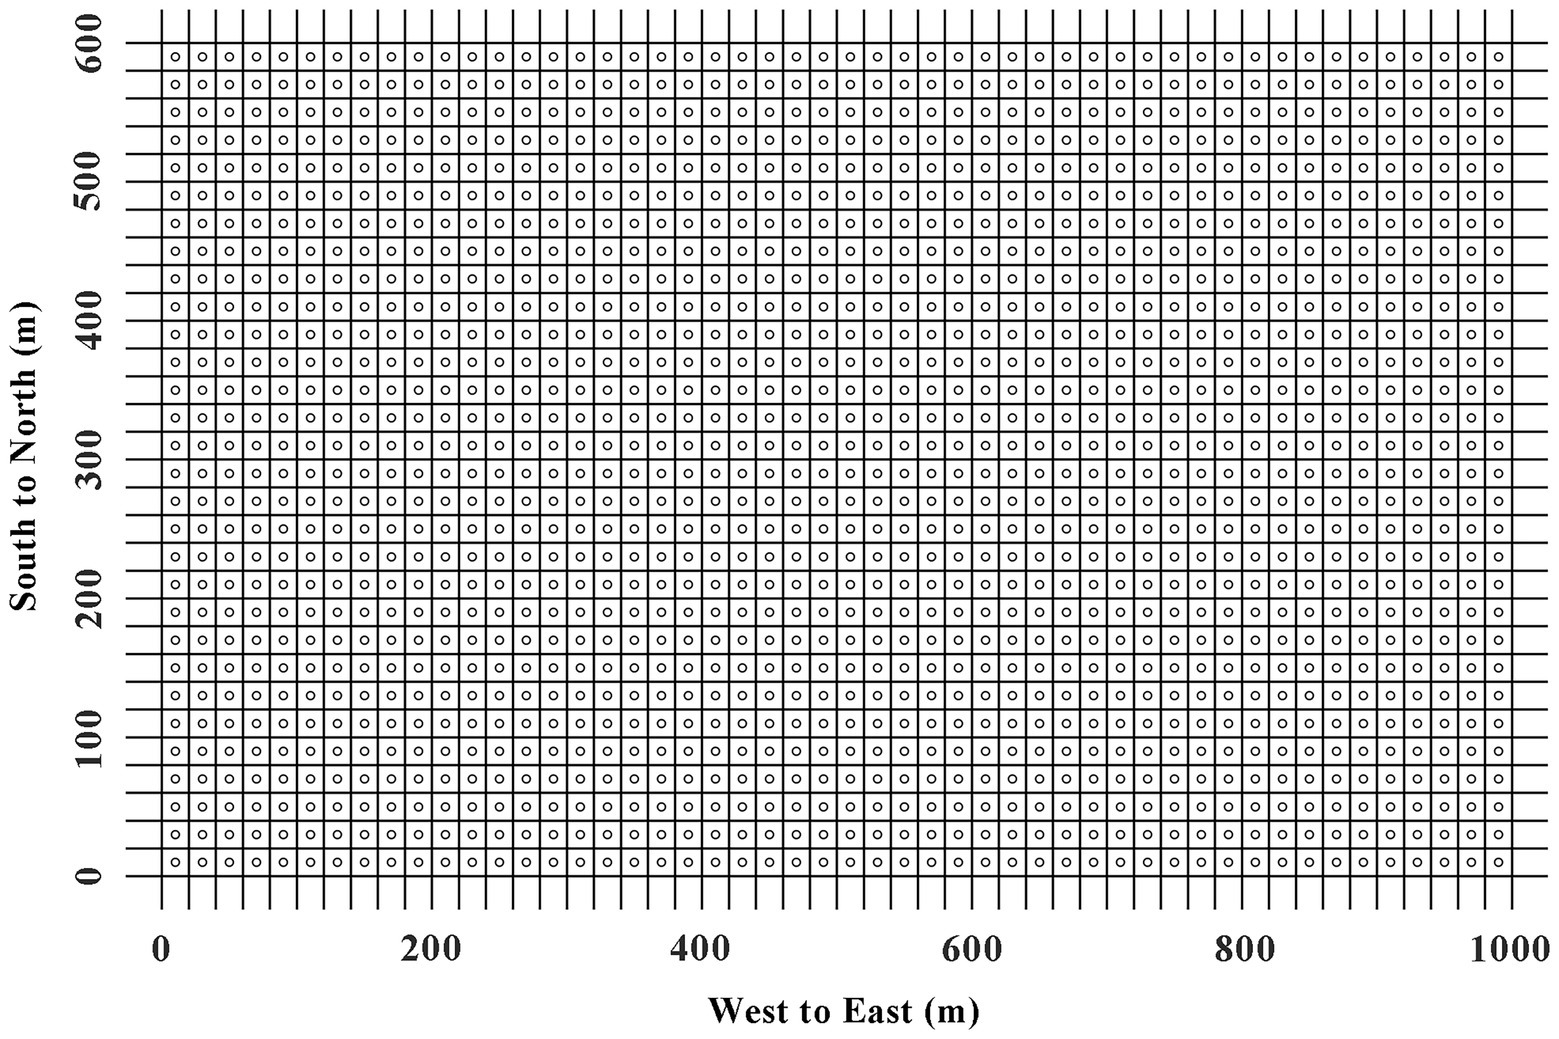
Figure 2. The 1,500 measurement points for SR in 60-ha tropical rainforest plot in Jianfengling, China. The blank circles represent the points where SR is tested.
The primary vegetation of this 60-ha plot is dominated by Lauraceae, Fagaceae, Rubiaceae and Palmaceae families, along with the presence of Hopea hainanensis from Dipterocarpaceae, which is a symbol of a typical tropical flora in Southeast Asia. Here, the mean canopy is 23.7 m height, and the mean total basal area per ha is 56 m2 (Jiang and Lu, 1991).
SR was measured by LI-8100 (LI-COR, Inc., Lincoln, Nebraska United States) from 20th October to 23th November in 2015. In the measurement mode, the LI-8100 system monitors the changes in CO2 concentration inside the chamber by using an infrared gas analyzer (IRGA). The soil chamber had an internal volume of 4,824 cm3 with a circular contact area to soil of 317.8 cm2. Polyvinyl chloride collars were placed in the center of each basic plot (Figure 2). A collar, 19.6 cm in internal diameter and 5 cm high, was buried in the soil at a depth of 2–3 cm at each point to minimize soil disturbance at least 1 week before the measurement. Plant was not present inside the collars, but small litter and branches were left in the collar. The measurements were replicated three times at each sampling point and the data was collected from 09:00 to 14:00 (Beijing standard time), which represented SR in that day (Sha et al., 2005). This time-frame was regarded as the most suitable period of the day for such types of studies because soil moisture, temperature and SOC were relatively stationary and did not influence the measurements (Yao et al., 2011).
No rainfall occurred during 9-14 h on all days from 20th October to 23th November in 2015 through the experimental plot. At the same time, soil temperature was measured at a depth of 5 cm using a hand-held digital thermometer (SP-E-17 thermometer, Jinzhengmao Instruments China Inc., Beijing), while the chamber temperature at a depth of 5 cm was measured by a conventional thermometer.
The temperature sensitivity of SR was usually described by Q10, which was determined by the following formula:
where b was the soil temperature response coefficient and e was the natural logarithm.
A 60-ha (600 m × 1,000 m) plot was systematically divided into grids of 40 × 40 m, which generated 416 nodes that were considered as base points. Together with each base point, two additional sampling points were located at random combinations of 2 and 5 m, 2 and 15 m, and 5 and 15 m, along a random compass bearing away from the associated base point. A total of 1,248 topsoil (0–10 cm) samples were collected. Soil samples were air dried, sieved through a 2 mm mesh to remove coarse fragments. SOC was measured with the help of H2SO4-K2Cr2O7 oxidation method (Schumacher, 2002). SN was measured by the Micro-Kjeldahl method (Bremner, 1960), and the available nitrogen was estimated with the help of a micro-diffusion method (Mulvaney and Khan, 2001). SP were measured by using an inductively coupled plasma atomic-emission spectrometer (Thermo Jarrell Ash Co., Franklin, United States) and HNO3-HClO4 soil solution (McDowell and Sharpley, 2001). The level of available phosphorus was estimated colorimetrically based on measurements from a 0.03 mol l−1 NH4F and 0.025 mol l−1 HCl soil solution (Allen et al., 1974).
Statistical outliers were eliminated with the help of Grubbs outlier test (the numbers of valid data points were 1,454). Normality of the datasets was assessed with the one-sample Kolmogorov–Smirnov (K-S) test before data analyzes, the datasets would be logarithmically converted if datasets was not a normal distribution. All the analyzes were done in R 3.3.0. Principal component analysis (PCA) was used to reduce the number of parameters when several parameters reflected the same underlying process.
Spatial heterogeneity of the SR data was examined with the help of geostatistical tools, which were beneficial for understanding spatially structured phenomena. The theoretical basis of geostatistics used in the current study reflects theories described in several studies (Vieublé Gonod et al., 2006; Liu et al., 2011). Our geostatistics approach consisted of two parts: (i) the calculation of an experimental variogram from the data and model fitting; and (ii) using the knowledge about strength and scale of this variogram to interpolate values of variates at the locations that were not sampled (Burgos et al., 2006).
The calculation of semivariances from the field data and fitting of the models to a semi-variogram was performed using the R 3.3.0 (package gstat; R Foundation for Statistical Computing, Vienna, Austria). Semi-variogram computation was also performed, as following, to ascertain the strength and scale of the spatial dependence of SR.
where γ(h) was the semivariance for the lag interval h, Z(xi) and Z(xi + h) were the variables at locations xi and xi + h, and N(h) was the number of lag pairs separated by a distance interval h (Stoyan et al., 2000; Mitra et al., 2014). Semivariogram modeling and kriging estimations were performed on the basis of residuals. The final semivariogram model was chosen by minimizing the root mean squared error (RMSE). A spherical model, an exponential model, and a gaussian model were selected to further investigate the spatial structure.
Only isotropic semivariograms were considered for further analysis and the semivariance data was fit to a spherical function. In this analysis, the default active lag distance was set as 60% of the maximum. A typical semivariogram had a nugget variance (C0), where the nugget represents either a random error or a spatial dependence at a scale smaller than the minimum distance examined (Robertson, 1987). With an increasing lag distance, the variance also increased up to a point of a sill variance (C0 + C), which was spatially independent. The distance at which the sill was reached was called the range. The measurement points estimated within this range were spatially autocorrelated, whereas points outside this range were considered independent (Robertson et al., 1988). The values of the semivariance, and thus C0 and C0 + C, were scaled to sample variance (Hirobe et al., 2001; Mori and Takeda, 2003). The nugget (C0) to sill (C0 + C) ratio (NSR) was used to define distinct classes of spatial dependence. If the ratio was ≤25%, the variable was considered as strongly spatially dependent, a ratio between 25 and 75% indicated the variable to be moderately spatially dependent, and if the ratio was >75%, the variable was considered to be weakly spatially dependent (Liu et al., 2011). The kriging interpolation was hypothesized to be the most accurate when the RMSE was at a minimum and was stable. The accuracy of the kriging method was calculated in the form of RMSE by using the following formula:
where Y(x1) was the measured value, Y*(xi) was the predicted value, and n was the sampling number.
Linear mixed-effects models, computed with the lmer function in the lme4 package of R (Bates et al., 2015), were used to determine the contributions of different factors (e.g., altitude, convexity, slope, and the four soil properties) to the spatial differences in SR. Random effects were groups of topography that could be categorized on the basis of connectivity models (Hierarchical clustering method) and centroid models (partition clustering method, k-means), respectively (Kusiak et al., 1985; Senin et al., 2007). The intercept and slope of altitude, convexity, slope, altitude and convexity, altitude and slope, and convexity and slope were influenced throughout the random effects. Based on the Akaike information criterion (AIC) of these models, the best optimal model was chosen when AIC was the minimum.
The distribution of SR, soil temperature, altitude, SOC and SP along an environmental gradient were estimated by the methods of Xu et al. (2015). The environmental space was defined as the first and second ordination axes (PC1and PC2) of the PCA of altitude, convexity, slope, and the four soil properties.
The spatial mean SR of the entire 60-ha plot was 4.327 ± 0.0411 (standard error) μmol m−2 s−1, and the coefficient of variation (CV) of SR was 36.2%. These findings were confirmed by semivariogram analysis (Figure 3), and the best-fit semivariogram models and important parameters were provided in Table 1. The range of SR autocorrelation was 112.7 m, and the NSR was 68.1% indicated that there was a moderate spatial dependency of SR (Table 1). The contour maps, obtained by ordinary kriging for SR (Figure 4), showed a patchy distribution pattern.
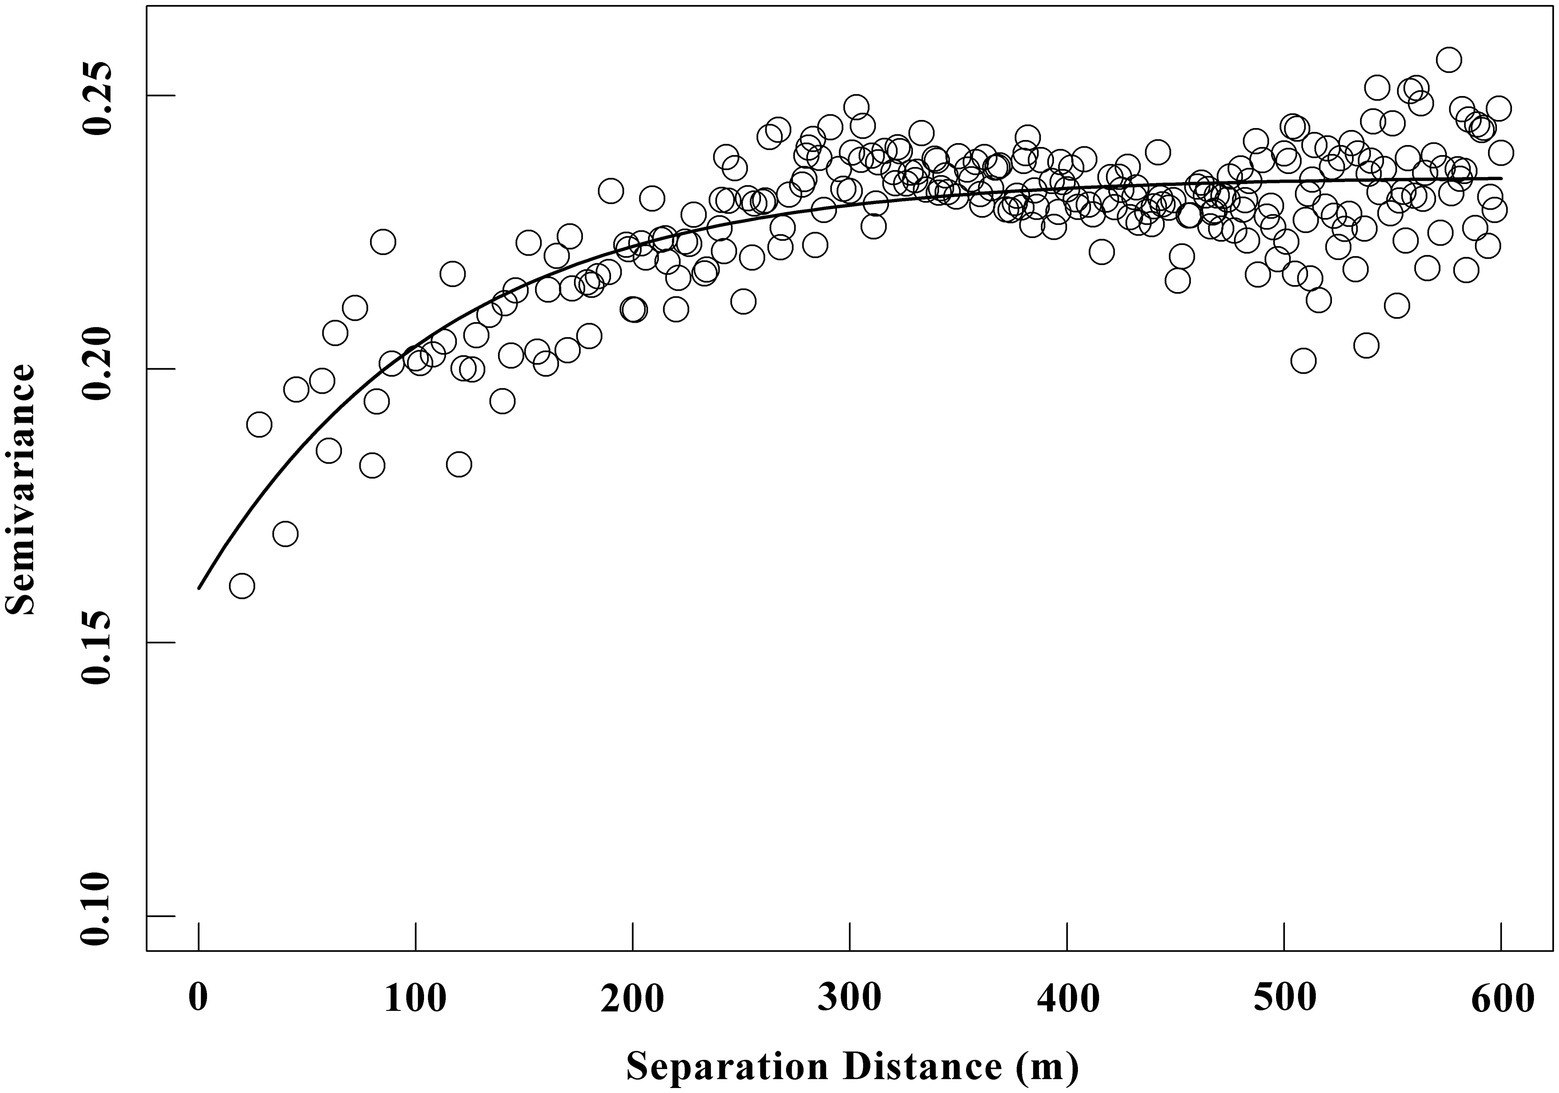
Figure 3. Semivariance (γ) of SR versus lag distance within an old-growth tropical rainforest (unit: μmol m−2 s−1). The solid line represents fitted spherical model (details of the fitted parameters are shown in Table 1), blank circles represent the empirical semivariograms.
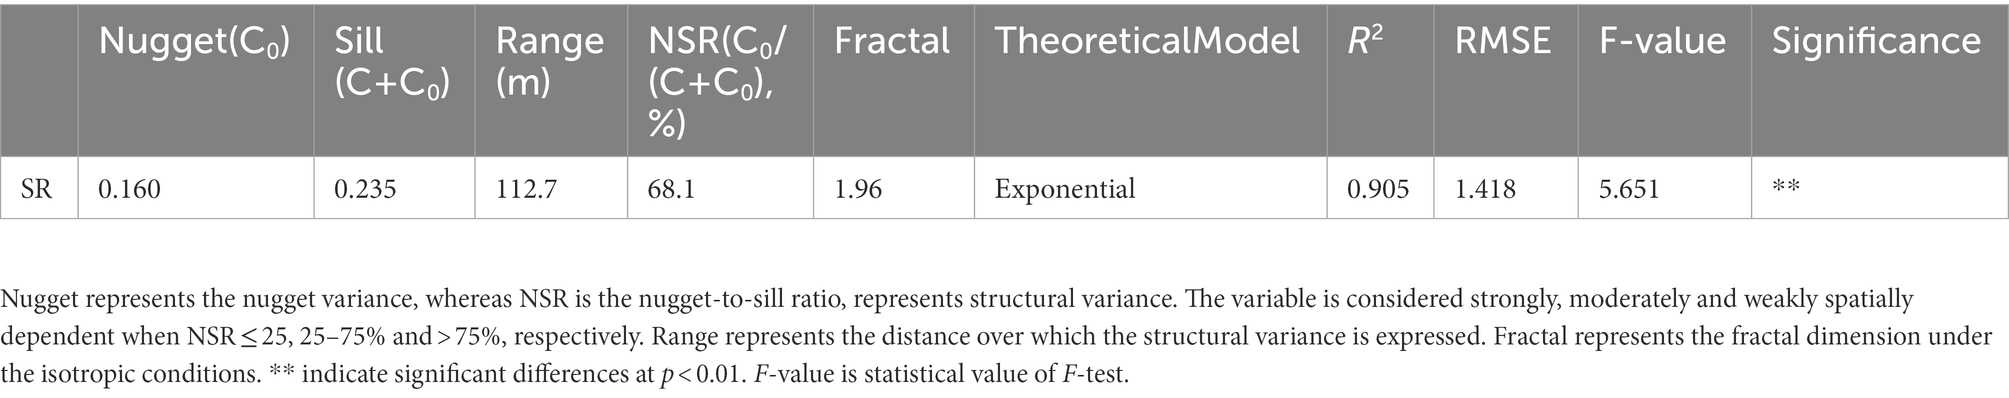
Table 1. The parameters of semivariogram spherical models for SR.
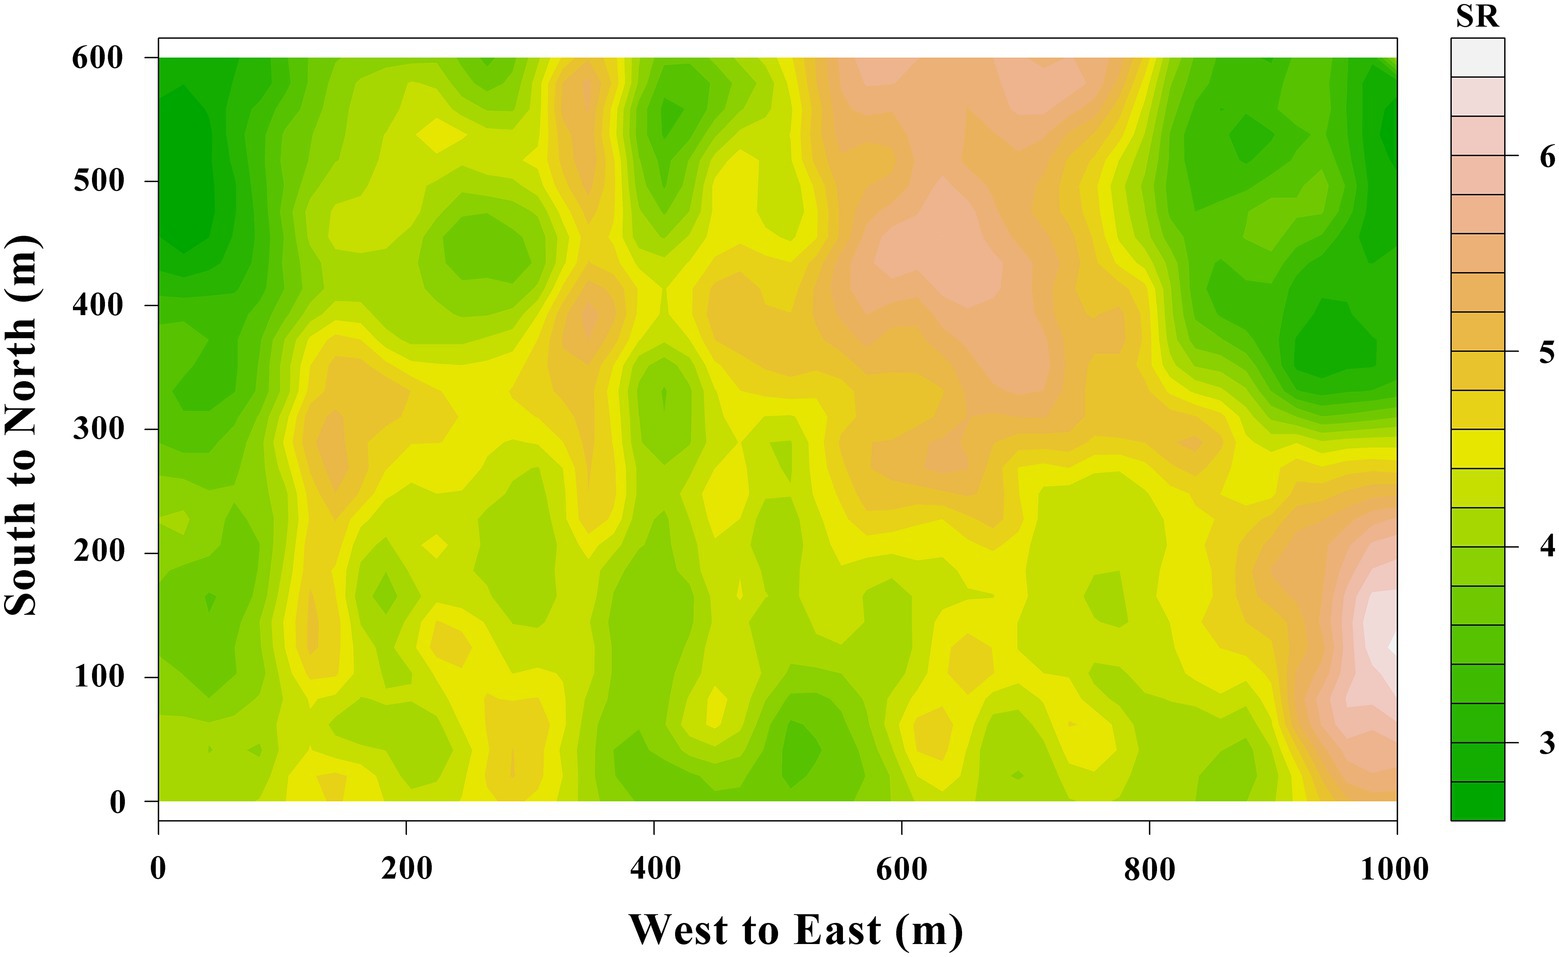
Figure 4. The spatial distribution of SR with intervals of 20 m from a 60-ha tropical rainforest plot in Jianfengling, China.
On the basis of a multiple regression tree, 1,454 sampling plots were divided into six types of low altitude (altitude < 914.4, type 1), high altitude(altitude > 991.5, type 2), low convexity and low slope (altitude; 963.5–991.5, convexity < 2.5, slope < 23.6, type 3), low convexity and high slope (altitude; 963.5–991.5, convexity < 2.5, slope ≥ 23.6, type 4), low convexity (altitude; 914.4–963.5, convexity < 2.5, type 5), and high convexity (altitude; 914.4–991.5, convexity ≥ 2.5, type 6; Figure 5). Stepwise linear regression analysis results showed that the SP was a major influencer for types 1, 2, and 5, whereas the SOC and soil available nitrogen were major influencer for types 3 and 4, respectively (Table 2).
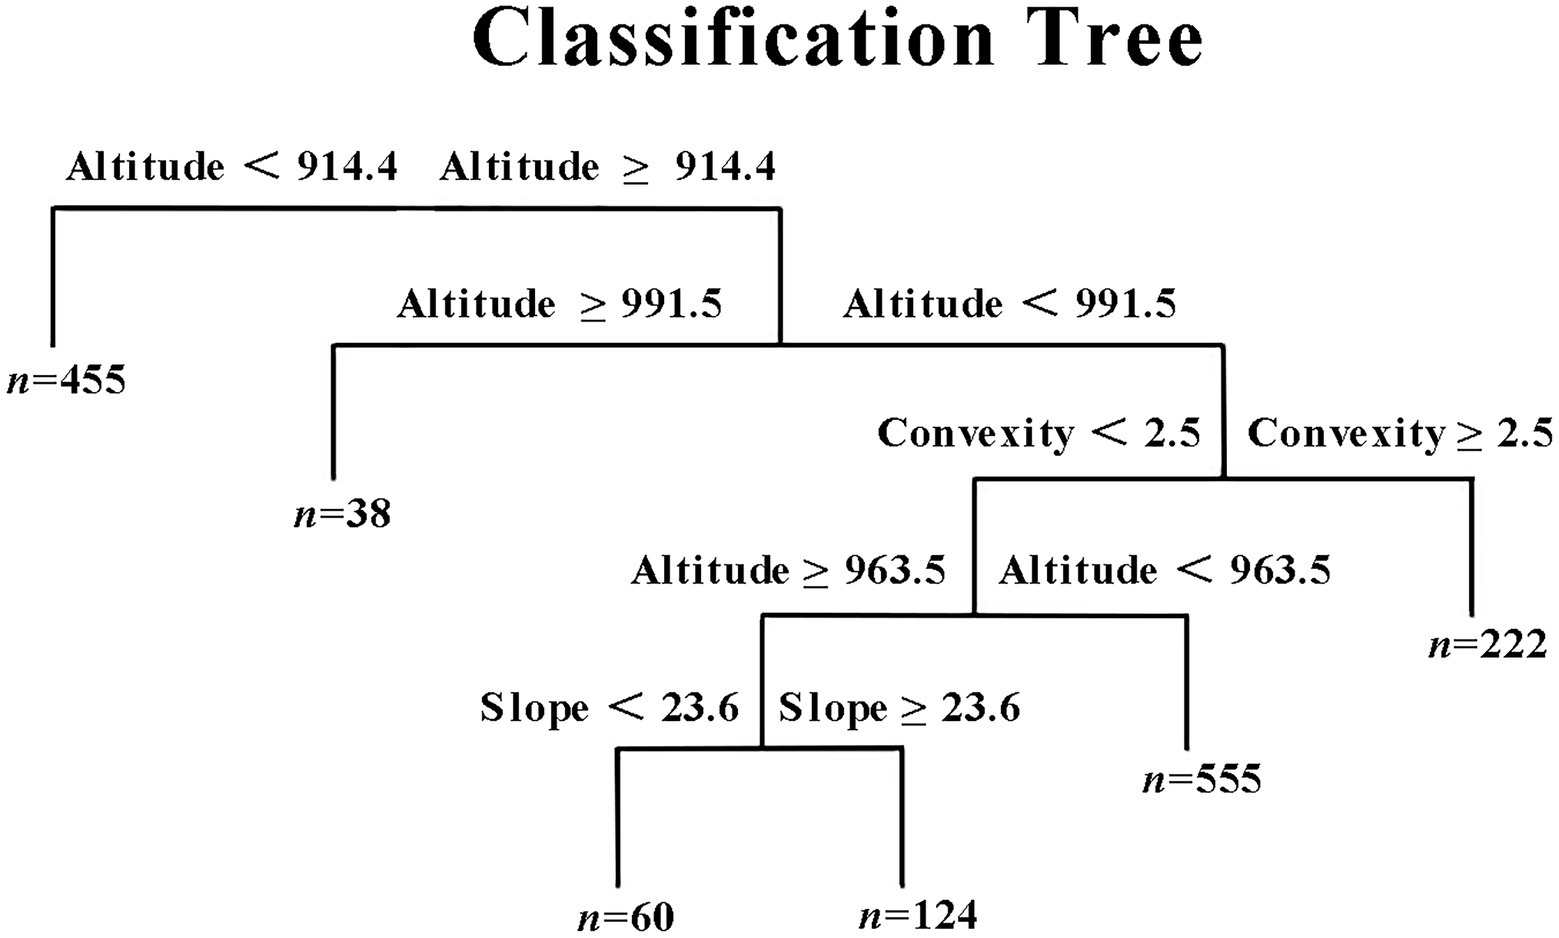
Figure 5. A multiple regression tree for SR. SR is the dependent variable, while altitude, convexity and slope are the independent variables. Tree construction is completed by the comprehensive gradient of the elevation, convexity and slope. “n” represents the numbers of subplots.
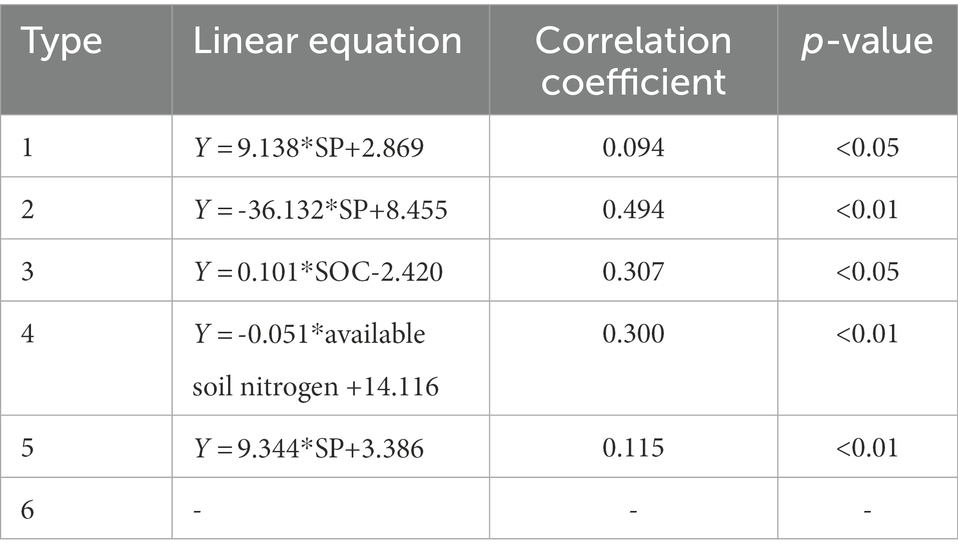
Table 2. Stepwise linear regression analysis results between SR and topography, soil properties (n = 1,454).
The linear mix-effect model analysis showed that SR was significantly positive correlated to SP, and negatively to the slope in all subplots (Figure 6; Table 3). The low-nitrogen and high-nitrogen plots were distinguished by k-means clustering method; the soil average nitrogen was 1.930 ± 0.00379 g kg−1 (n = 831), 2.245 ± 0.00538 g kg−1 (n = 623), respectively. In low-nitrogen plots, SR was significantly positive related to SP, and negatively related to the slope (Figure 7; Table 4). In high-nitrogen subplots, SR was significantly positively related to SOC (Figure 8; Table 5). Also, there was a significant index relationship between SR and soil temperature (Q10 of 1.92; Figure 9).
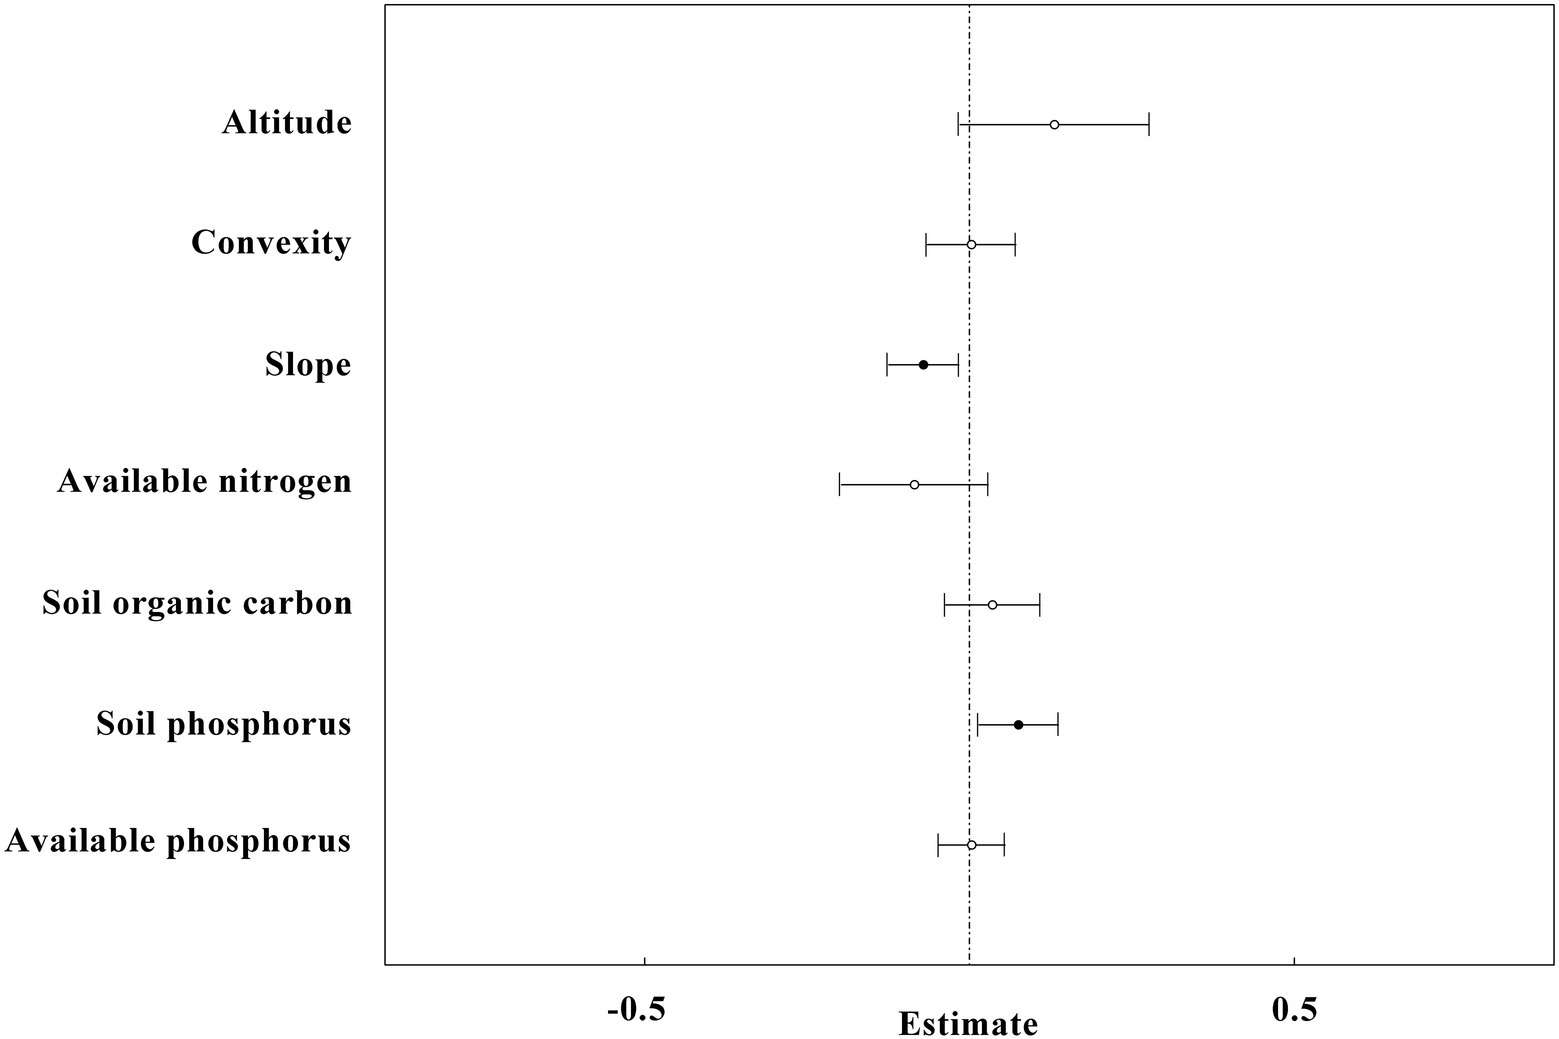
Figure 6. The overall result of linear mixed-effects models with all plots (n = 1,454) in the study site. SR is the dependent variable, whereas altitude, convexity, slope, SN, available nitrogen, SOC, SP and available phosphorus are independent variables. The black circles and horizontal short lines left to vertical dotted line represent significant level, while the white circles and horizontal short lines intersect to vertical dotted line represent non-significant level.
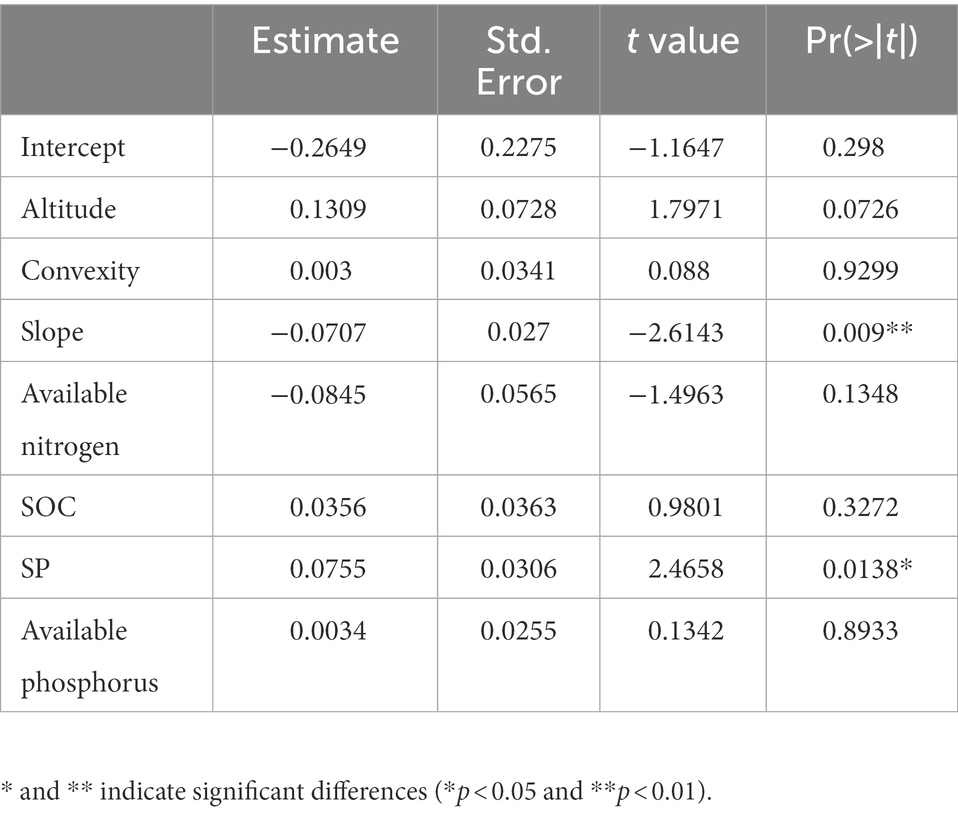
Table 3. The estimate of parameters for the optimal liner mixed-effect model in all plots of 60-ha (n = 1,454).
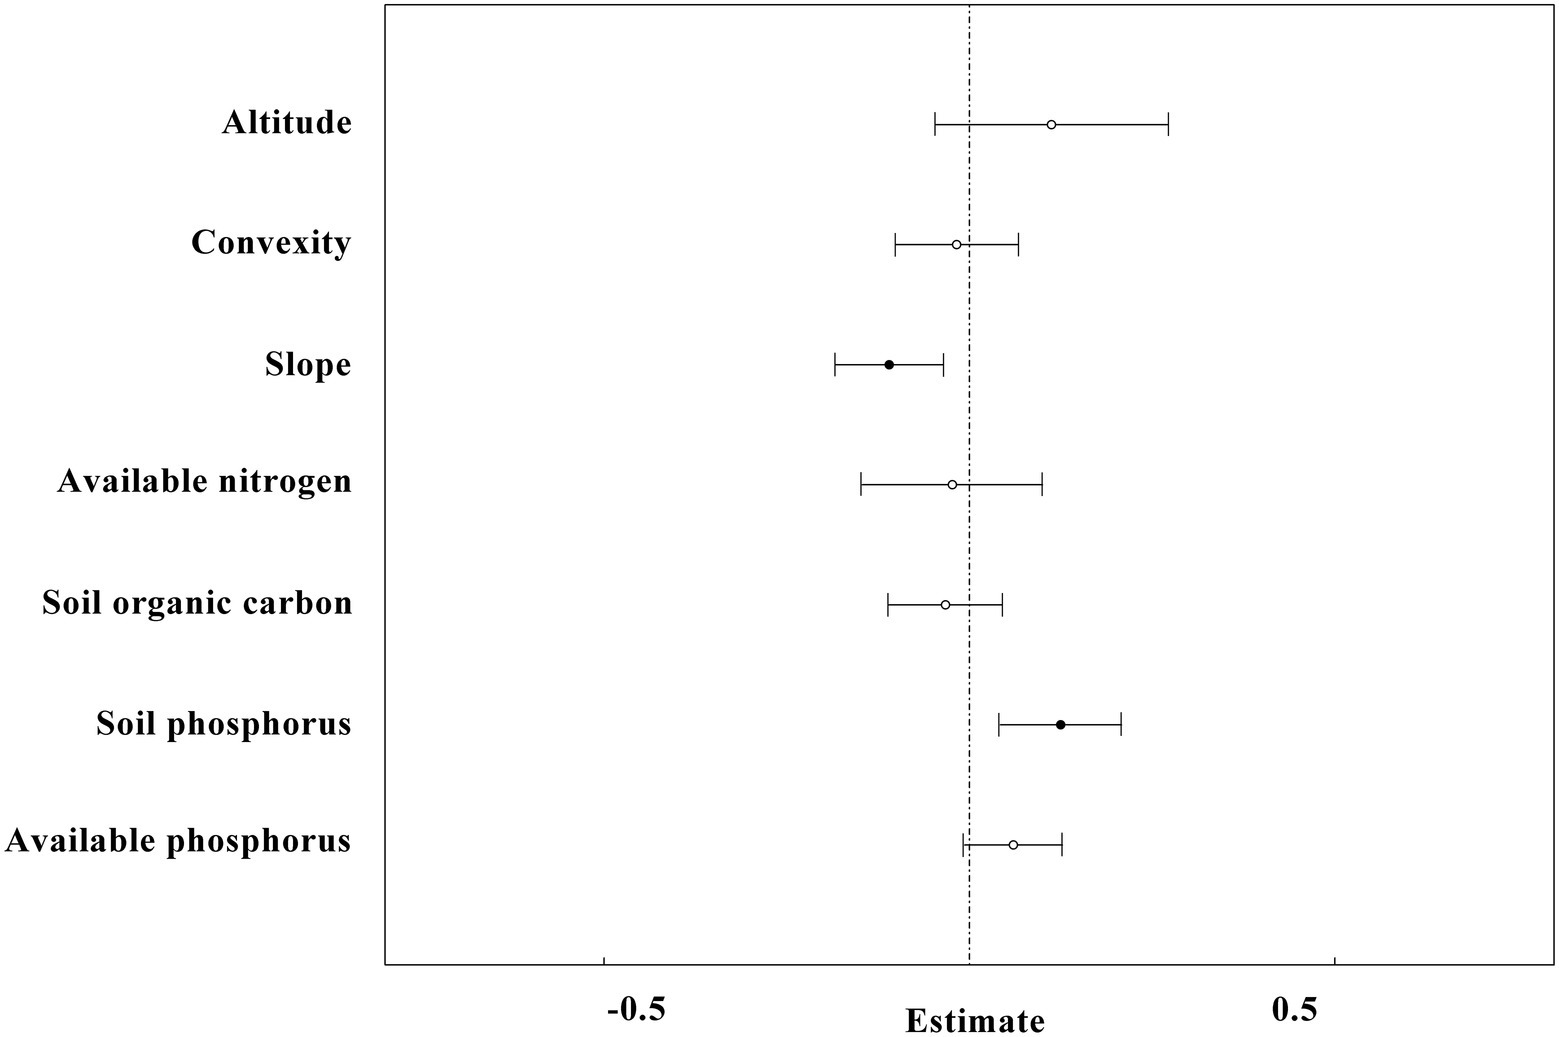
Figure 7. The results of linear mixed-effects models for low-nitrogen plots (n = 831) in the study site. The black circles and horizontal short lines left to vertical dotted line represent significant levels, while the white circles and horizontal short lines intersect to vertical dotted line represent non-significant levels.
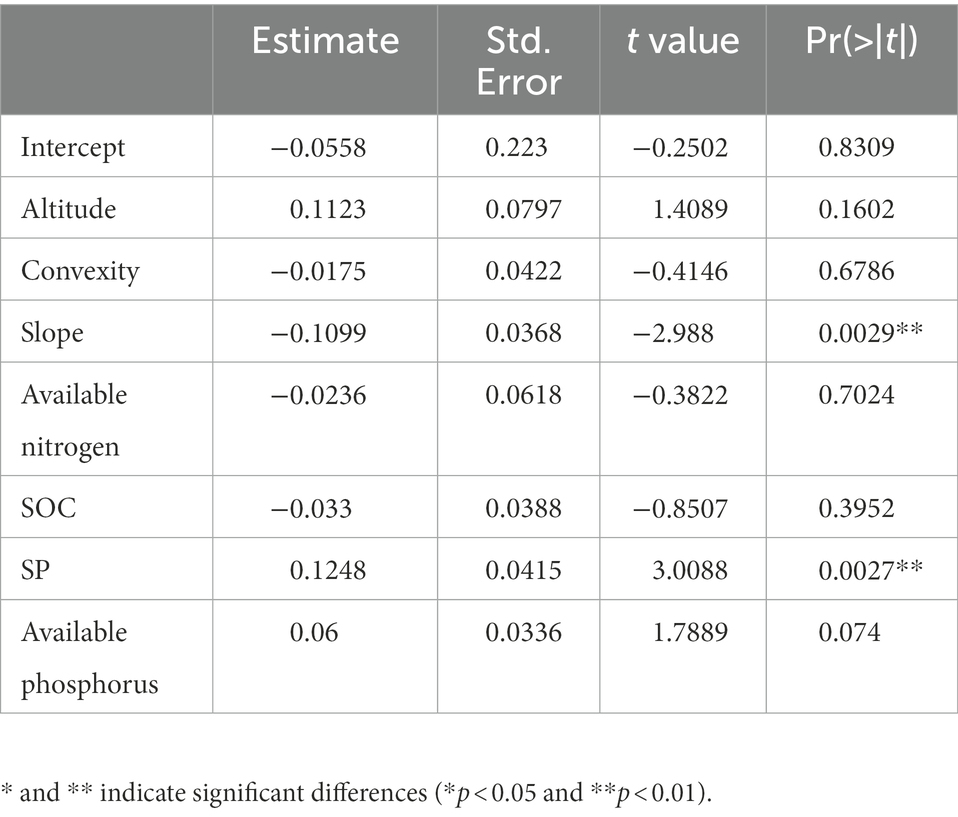
Table 4. The estimate of parameters for the optimal liner mixed-effect model in low-nitrogen plots of 60-ha (n = 831).
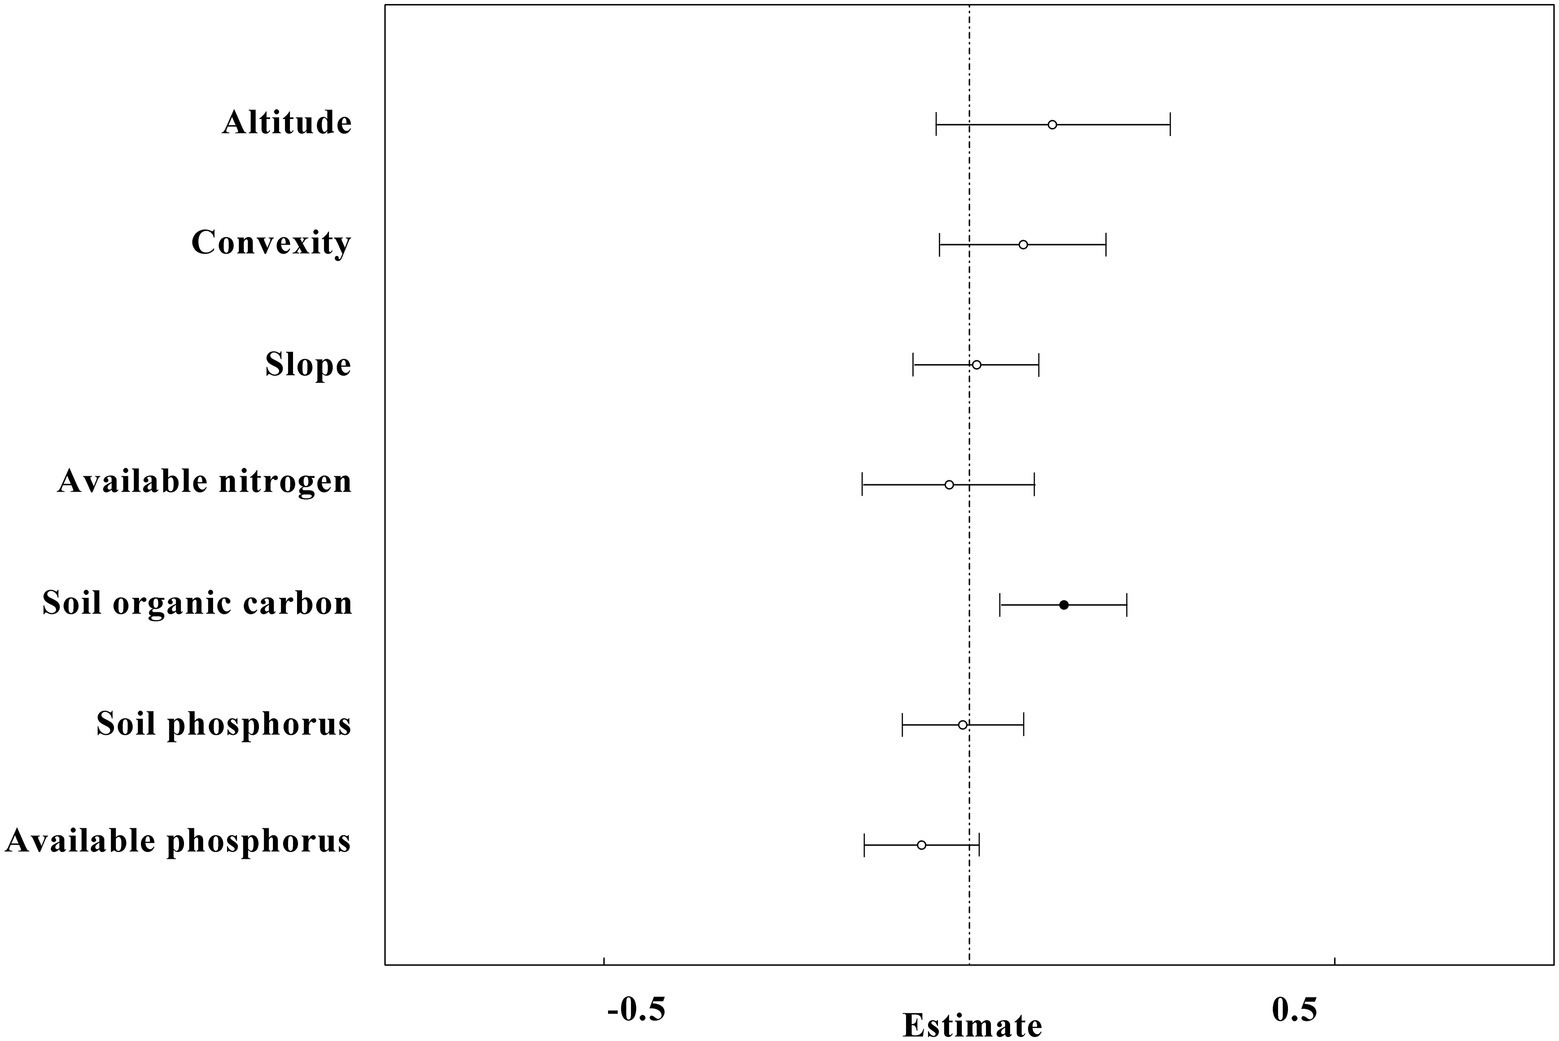
Figure 8. The results of linear mixed-effects models for high-nitrogen plots (n = 623) in the study site. The black circles and horizontal short lines left to vertical dotted line represent significant levels, while the white circles and horizontal short lines intersect to vertical dotted line represent non-significant level.
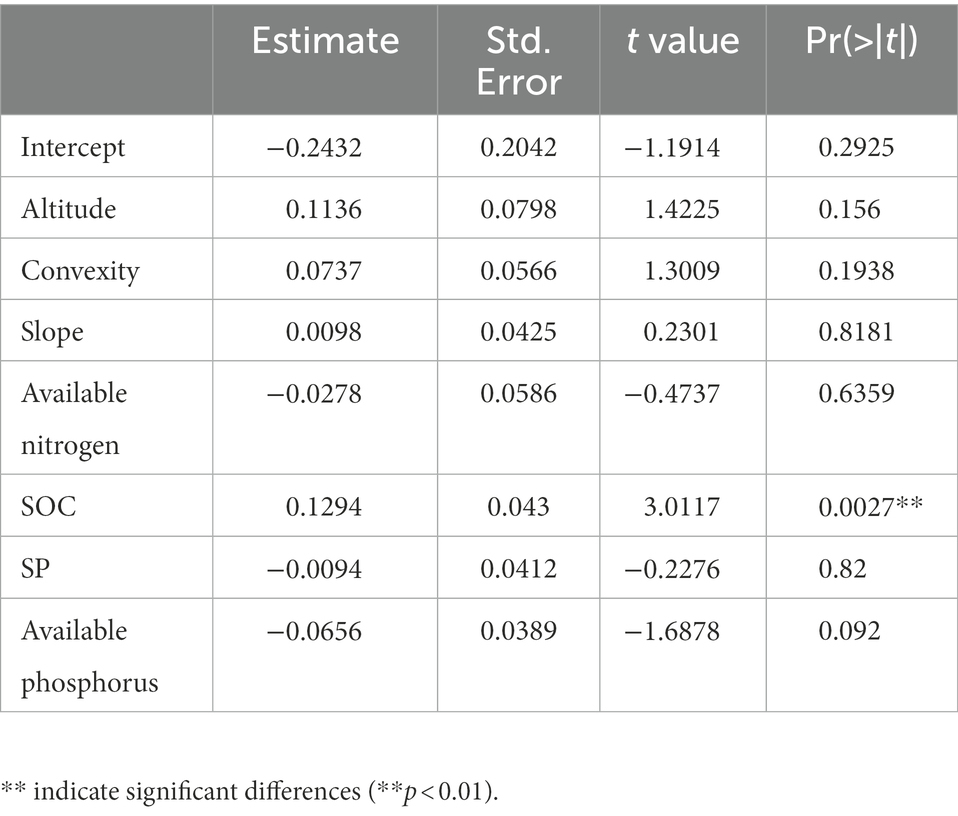
Table 5. The estimate of parameters for the optimal liner mixed-effect model in high-nitrogen plots of 60-ha (n = 623).
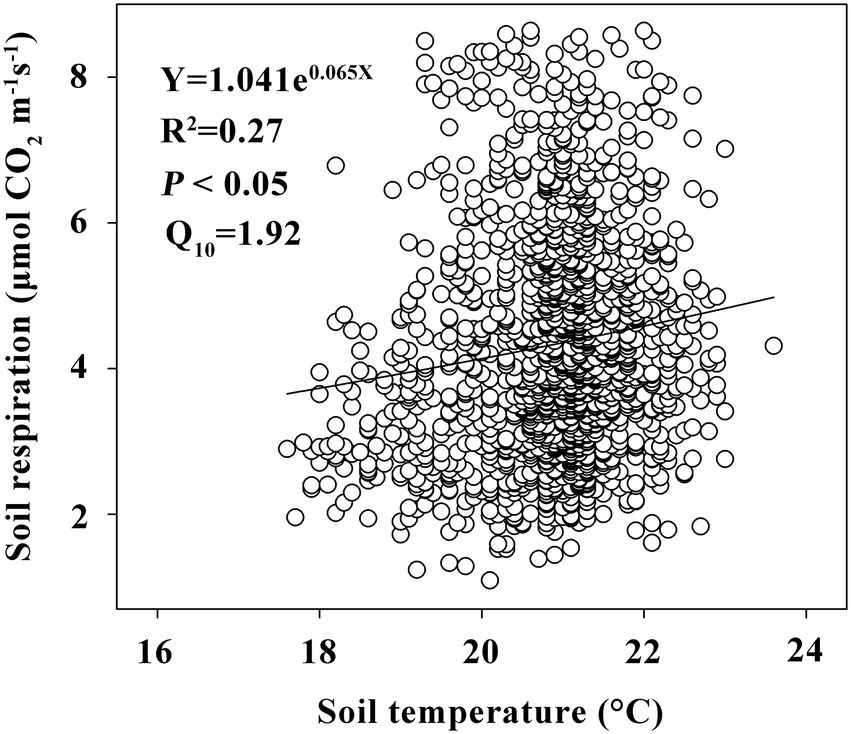
Figure 9. The relationships between SR and soil temperature. Y, R2, P, Q10 represents SR, coefficient of determination for this regression equation, probability for rejecting the original assumed, temperature sensitivity of SR, respectively. The circles and line represent SR of each sample point, regression equation, respectively.
The cumulative proportion of altitude, convexity, slope, and the four soil properties, explained by PC1 and PC2, was 57.1% of the total variance. This showed the distribution of topography and soil properties on the PC1-PC2 axis, indicated a high SR occurs in the habitats of high altitude, high SOC and high SP (Table 6; Figure 10).
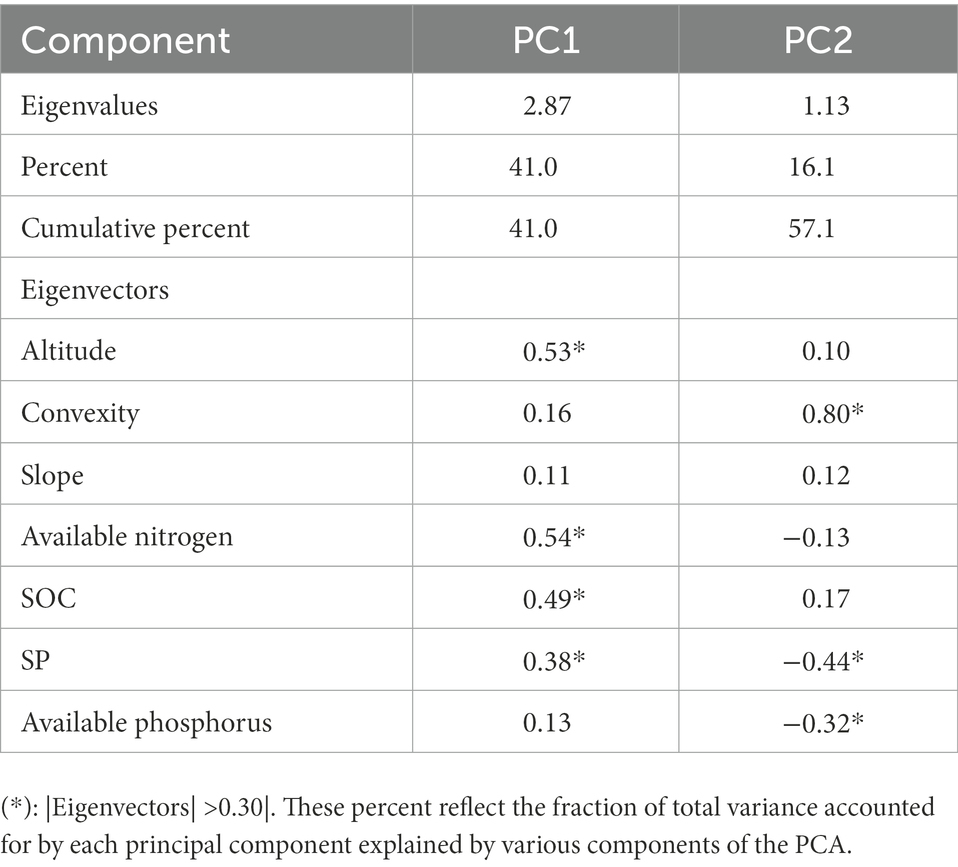
Table 6. Results of the principal components analysis.
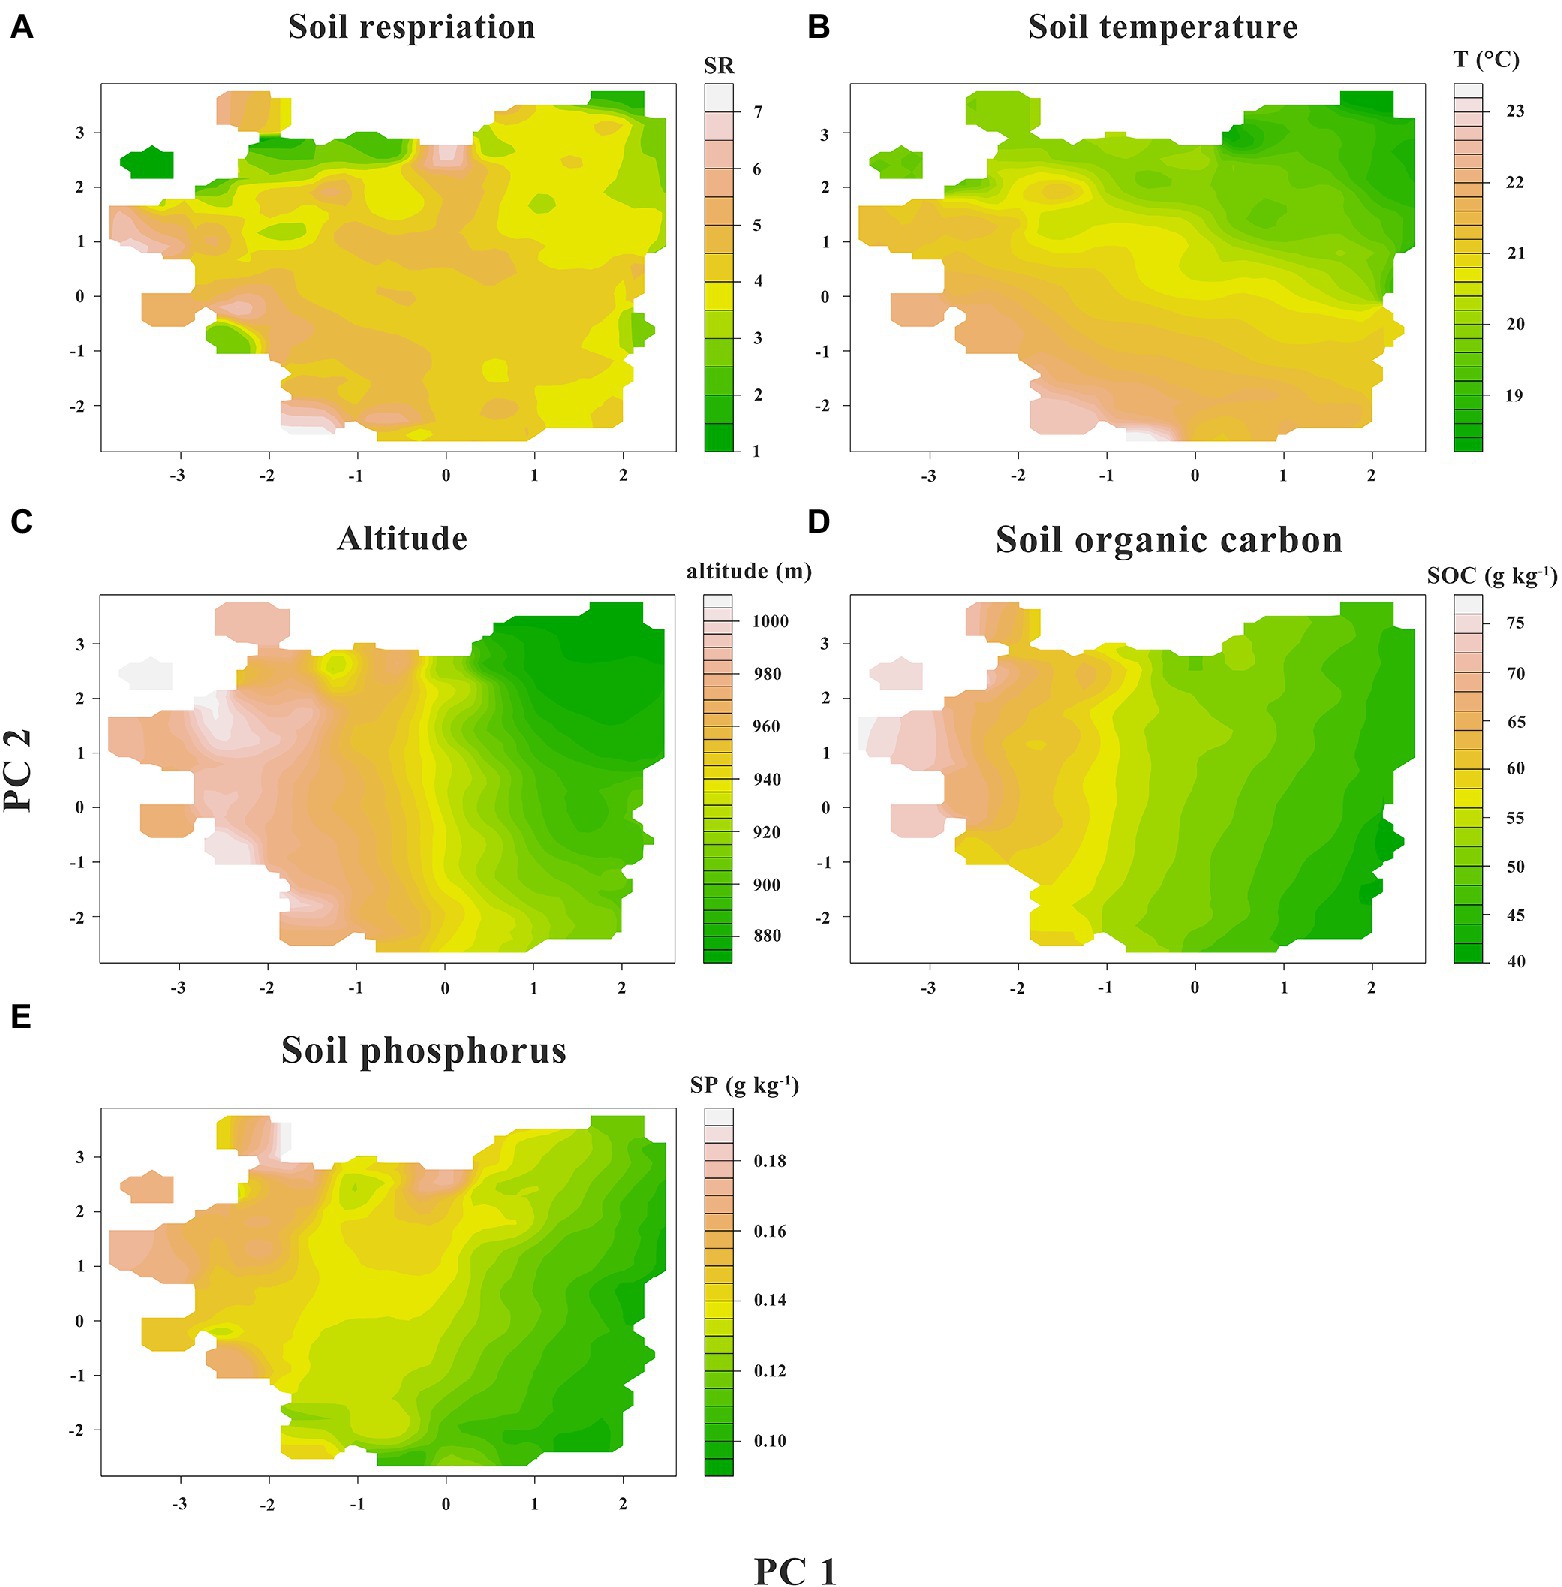
Figure 10. Distribution of SR and significantly relevant factors along the first two principal components. Soil temperature, Altitude, Soil organic carbon, Soil phosphorus represent the distribution of Soil temperature, Altitude, Soil organic carbon, Soil phosphorus along the first two principal components, respectively.
Quantifying the spatial heterogeneity of SR was a challenging matter, which we accomplished with the help of estimating CV. Here, we found that the CV of tropical montane rainforests in Jianfengling was 36.2%. It was consisted with previous study results of CV for SR of tropical forests in Malaysia (33%) (Katayama et al., 2009) and in Indonesia (36%) (Ishizuka et al., 2005). These were reported over 1,600 m2 (10 × 10 m) and 567 m2 (8 × 10 m) grids, respectively. In another Malaysian forest, Kosugi et al. (2007) observed that the CV of SR increased with subplot size, from 29 to 39%, for plot size ranging from 25 to 2,500 m2, respectively. Further, the CV for SR was 42.7% for 50 lattice positions within a 100 m × 200 m plot (Adachi et al., 2005). Moreover, the spatial variability of SR in perhumid Amazonian and Malaysian rainforests were characterized by CV ranging from 24 to 45% (Schwendenmann et al., 2003; Sotta et al., 2004), and from 26 to 62% (Kosugi et al., 2007; Katayama et al., 2009), respectively. The CV of SR for rainforests in Xishuangbanna was 42% in the rainy seasons and 38% in the dry seasons (Song et al., 2013). Overall, these results showed that the CV of SR in tropical forests generally varied from 20% to 50%.
In this study, SR of 60-ha plot had a moderate spatial dependence. Some scholars found SR had a strong spatial dependence in a Southeast Asian tropical rainforest (Kosugi et al., 2007). Investigation of a 20-ha plot, in a seasonal tropical rainforest in Xishuangbanna, also revealed a strong spatial heterogeneity (Song et al., 2013). In this study, the spatial heterogeneity of SR, at small scales (below 20 m) was caused by random factors, accounting for 68.1%, while it was caused by spatially autocorrelated factors at relatively large scales (20 to 112.7 m). There was little information about the spatial structure of SR in tropical forests, and additional studies were needed.
In our study, SR exhibited spatial autocorrelation at the larger scales, across the subplots, with semivariogram ranges of 112.7 m, which have been caused by the influence of large-scale edaphic or topographic gradients, as previously reported by La Scala et al. (2000). They have measured spatial autocorrelation in CO2 emissions as a result of a heterotrophic activity (bare soil) at scales from 29 to 58 m (La Scala et al., 2000). Kosugi et al. (2007) determined the ranges between 4.4 and 24.7 m on a 50-by 50-m plot for a tropical rainforest. The average range of the spatial autocorrelation for SR was 40 m in rainforests in Xishuangbanna (Song et al., 2013). Furthermore, Pringle and Lark (2006) detected a range of 174 m by using 156 sampling points on a 1,024-m transect, for which incubated bare soil samples were used to measure SR. Since the scales of spatial autocorrelation of SR appear to be ecosystem-and species-specific, nested sampling designs (i.e., two or more sampling intervals) in situations such as ours were recommended (Fox et al., 2015). The scale of measurement of spatial autocorrelation (less than 20 m) from this study might be used as a guide to stratify future sampling schemes in tropical montane rainforests or similar ecosystems. Since the range values were always greater than the chosen grid size, the sampling design was inferred to be adequate for the study site. In addition, column by one column mechanical point sampling was applied in our experiment in order to eliminate the effect of temporal variables. The style was to first do odd columns, followed by even columns. Random factors for mechanical point sampling were not considered; therefore, 1,500 pairs of parameters about distance and angle were randomly generated from 1,500 sub-sample centers as the center; then 1,500 sites were filtered to measure SR for further research.
The relationships illustrated in this study advances our understanding of the ecological variables that affected spatial patterns of SR within a forest. This was necessary for enhancing the understanding of mechanistic basis of SR models (Chen et al., 2011; Martin et al., 2012). Spatial relationships were found between SR, soil environment, and topography, but models were not identical across all the plots of 60-ha of sampled area. This suggested that SR might have responded to ecological covariates at varying spatial and temporal scales, created a complex pattern of SR that was not easily modeled. Spatial variations of SR in the forests have been ascribed to differences in soil C (Soe and Buchmann, 2005; Saiz et al., 2006). Many measurements suggested that SOC could be one of the main determinants of SR, particularly at large spatial and temporal scales (Giardina et al., 2003; Davidson and Janssens, 2006). Since it involved the conversion of organic to inorganic C, SR was ultimately controlled by the supply of C (Wan et al., 2007). And significantly positive relationships between SR and SOC had been reported (Chen et al., 2010). Further, SR was reported to be strongly related to SOC in a tropical rain forest in French Guiana (Epron et al., 2006). It was important to know the factors and mechanisms that controlled the spatial pattern of SR for scaling up and predicted patterns of soil C emissions. These results suggested that several soil topography and chemical factors, such as altitude, SOC, and SP, controlled the spatial distribution of SR at this site. Physical and chemical conditions of soil were also related directly and indirectly to SR, increased the complexity of SR. The next step in the process of investigation would be to independently confirm the inferences drawn in our study by generating more datasets.
We observed that the effect of convexity on SR was complex: in the lower N range, the relationship between SR and convexity was negative (Figure 7). However, in the higher N range, the relationship was positive (Figure 8). These effects could offset each other when the data was generalized over the whole of the 60-ha plot, and there was no significant relationship observed initially between convexity and SR (Figure 6). Similarly, the effect of available phosphorus on SR was also two-fold: when N was in the lower range, the relationship between SR and available phosphorus was positive (Figure 7). However, in the higher N range, this relationship became negative (Figure 8). These effects were offset when data of the complete 60 ha-plot was not parsed and no significant relationship between available phosphorus and SR was observed (Figure 6). Tropical ecosystems that were typically developed on old and nutrient-impoverished soils were considered to be rather P limited (Vitousek et al., 2010).
Although soil temperature played a leading role in controlling the temporal patterns of SR, this factor rarely explained the spatial variation of SR (Sotta et al., 2004). Here, we found a weak correlation between the soil temperature and SR (R2 < 0.3; Figure 9). Furthermore, topographically induced microclimates and variations in soil temperature and soil water content could also cause spatial heterogeneity by affecting soil’s ability to retain C, water, and nutrients (Kang et al., 2000).
Yang et al. (2018) found that the average emission rate of soil CO2 during daytime was very close to those for the time from 9:00 to 12:00. Therefore, it was crucial to measure soil CO2 at this time points as these were the best representatives of the daily flux means. In our study, the measurements of the 1,500 sampling points were carried out during 09:00 to 12:00, and were basically the representatives of the average SR in that day. In our study, the spatial heterogeneity was surveyed only in the dry season. Therefore, more work will be needed to conduct in wet season to fully understand the temporal variation of SR in the tropical rainforest.
Investigation involving geostatistical analyzes of a 60-ha permanent plot in an old-growth tropical montane rainforest in the northwest of Hainan Island (China) revealed a moderate spatial heterogeneity. The variability of 36.2% in SR of this plot was recorded. The patch size of the SR was approximately 112 m. The spatial variation of SR in a tropical rain forest in Jianfengling was closely related to soil’s temperature, topography, and other properties. The current study provided some insights in identifing the underlying determinants of spatial variations of SR. This has contributed to develop more mechanistic models of SR. The effect of the community structure of microbes and soil’s other properties on SR would be examined in future studies.
The datasets used or analyzed during the current study are available from the corresponding author on reasonable request.
HY: conceptualization, methodology, software, investigation, formal analysis, and writing–original draft. TH: conceptualization, methodology, software, investigation, formal analysis, and writing–original draft. YL: data curation and writing–original draft. WL: investigation and writing–review and editing. JF: resources. BH: software and validation. QY: conceptualization, funding acquisition, resources, supervision, and writing–review and editing. All authors contributed to the article and approved the submitted version.
This work was jointly supported by the Fundamental Research Funds of Sanya Research Base, ICBR (1630032022006) and the China Postdoctoral Science Foundation (2018M631414 and 2019T120073).
The authors declare that the research was conducted in the absence of any commercial or financial relationships that could be construed as a potential conflict of interest.The reviewer YD declared a shared parent affiliation with the author YL to the handling editor at the time of review.
All claims expressed in this article are solely those of the authors and do not necessarily represent those of their affiliated organizations, or those of the publisher, the editors and the reviewers. Any product that may be evaluated in this article, or claim that may be made by its manufacturer, is not guaranteed or endorsed by the publisher.
Adachi, M., Bekku, Y. S., Konuma, A., Kadir, W. R., Okuda, T., and Koizumi, H. (2005). Required sample size for estimating soil respiration rates in large areas of two tropical forests and of two types of plantation in Malaysia. For. Ecol. Manag. 210, 455–459. doi: 10.1016/j.foreco.2005.02.011
Allen, S. E., Grimshaw, H. M., Parkinson, J. A., and Quarmby, C. (1974). Chemical Analysis of Ecological Materials. Oxford: Blackwell Scientific Publications.
Bates, D., Mächler, M., Bolker, B., and Walker, S. (2015). Fitting linear mixed-effects models using lme4. J. Stat. Softw. 67, 1–48. doi: 10.18637/jss.v067.i01
Boonriam, W., Suwanwaree, P., Hasin, S., Archawakom, T., Chanonmuang, P., and Yamada, A. (2021). Seasonal changes in spatial variation of soil respiration in dry evergreen forest, Sakaerat biosphere reserve, Thailand. Sci. Asia 47S:112. doi: 10.2306/scienceasia1513-1874.2021.s009
Bremner, J. M. (1960). Determination of nitrogen in soil by the Kjeldahl method. J. Agric. Sci. 55, 11–33. doi: 10.1017/s0021859600021572
Burgos, P., Madejón, E., Pérez-de-Mora, A., and Cabrera, F. (2006). Spatial variability of the chemical characteristics of a trace-element-contaminated soil before and after remediation. Geoderma 130, 157–175. doi: 10.1016/j.geoderma.2005.01.016
Cai, Y., Nishimura, T., Ida, H., and Hirota, M. (2021). Spatial variation in soil respiration is determined by forest canopy structure through soil water content in a mature beech forest. For. Ecol. Manag. 501:119673. doi: 10.1016/j.foreco.2021.119673
Chambers, J. Q., Tribuzy, E. S., Toledo, L. C., Crispim, B. F., Higuchi, N., Santos, J. D., et al. (2004). Respiration from a tropical forest ecosystem: partitioning of sources and low carbon use efficiency. Ecol. Appl. 14, 72–88. doi: 10.1890/01-6012
Chen, X., Post, W. M., Norby, R. J., and Classen, A. T. (2011). Modeling soil respiration and variations in source components using a multi-factor global climate change experiment. Clim. Chang. 107, 459–480. doi: 10.1007/s10584-010-9942-2
Chen, Q., Wang, Q., Han, X., Wan, S., and Li, L. (2010). Temporal and spatial variability and controls of soil respiration in a temperate steppe in northern China. Glob. Biogeochem. Cycles 24, 1–11. doi: 10.1029/2009gb003538
Condit, R. (1998). Tropical Forest Census Plots: Methods and results from Barro Colorado Island, Panama and a Comparison with Other Plots, Berlin: Springer.
Cui, H., Bai, J., Du, S., Wang, J., Keculah, G. N., Wang, W., et al. (2021). Interactive effects of groundwater level and salinity on soil respiration in coastal wetlands of a Chinese delta. Environ. Pollut. 286:117400. doi: 10.1016/j.envpol.2021.117400
Davidson, E. A., and Janssens, I. A. (2006). Temperature sensitivity of soil carbon decomposition and feedbacks to climate change. Nature 440, 165–173. doi: 10.1038/nature04514
Duan, P., Xiao, K., Wang, K., and Li, D. (2023). Responses of soil respiration to nitrogen addition are mediated by topography in a subtropical karst forest. Catena 221:106759. doi: 10.1016/j.catena.2022.106759
Epron, D., Bosc, A., Bonal, D., and Freycon, V. (2006). Spatial variation of soil respiration across a topographic gradient in a tropical rain forest in French Guiana. J. Trop. Ecol. 22, 565–574. doi: 10.1017/s0266467406003415
Feng, J., and Zhu, B. (2019). A global meta-analysis of soil respiration and its components in response to phosphorus addition. Soil Biol. Biochem. 135, 38–47. doi: 10.1016/j.soilbio.2019.04.008
Fox, G. A., Negrete-Yankelevich, S., and Sosa, V. J. (2015). Ecological Statistics: Contemporary Theory and Application, Oxford: Oxford University Press.
Giardina, C. P., Ryan, M. G., Binkley, D., and Fownes, J. H. (2003). Primary production and carbon allocation in relation to nutrient supply in a tropical experimental forest. Glob. Chang. Biol. 9, 1438–1450. doi: 10.1046/j.1365-2486.2003.00558.x
Haaf, D., Six, J., and Doetterl, S. (2021). Global patterns of geo-ecological controls on the response of soil respiration to warming. Nat. Clim. Chang. 11, 623–627. doi: 10.1038/s41558-021-01068-9
Hashimoto, S., Tanaka, N., Suzuki, M., Inoue, A., Takizawa, H., Kosaka, I., et al. (2004). Soil respiration and soil CO2concentration in a tropical forest, Thailand. J. For. Res. 9, 75–79. doi: 10.1007/s10310-003-0046-y
Hereș, A. M., Bragă, C., Petritan, A. M., Petritan, I. C., and Curiel Yuste, J. (2021). Spatial variability of soil respiration and its controls are subjected to strong seasonality in an even-aged European beech (Fagus sylvatica L.) stand. Eur. J. Soil Sci. 72, 1988–2005. doi: 10.1111/ejss.13116
Hirobe, M., Ohte, N., Karasawa, N., Zhang, G.-S., Wang, L.-H., and Yoshikawa, K. (2001). Plant species effect on the spatial patterns of soil properties in the mu-us desert ecosystem, Inner Mongolia. China Plant Soil. 234, 195–205. doi: 10.1023/a:1017943030924
Ishizuka, S., Iswandi, A., Nakajima, Y., Yonemura, S., Sudo, S., Tsuruta, H., et al. (2005). Spatial patterns of greenhouse gas emission in a tropical rainforest in Indonesia. Nutr. Cycl. Agroecosyst. 71, 55–62. doi: 10.1007/s10705-004-5284-7
Jiang, Y. Y., and Lu, J. P. (1991). Tropical Forest Ecosystems in Jianfengling, Hainan Island, China: Science Press, Beijing.
Jiang, Y., Wang, B., Zang, R., Jin, J., and Liao, W. (2002). The Biodiversity and its Formation Mechanism of the Tropical Forests in Hainan Island, Science Press, Beijing, China.
Kang, S., Doh, S., Lee, D., Lee, D., Jin, V. L., and Kimball, J. S. (2003). Topographic and climatic controls on soil respiration in six temperate mixed-hardwood forest slopes, Korea. Glob. Chang. Biol. 9, 1427–1437. doi: 10.1046/j.1365-2486.2003.00668.x
Kang, S., Kim, S., Oh, S., and Lee, D. (2000). Predicting spatial and temporal patterns of soil temperature based on topography, surface cover and air temperature. For. Ecol. Manag. 136, 173–184. doi: 10.1016/s0378-1127(99)00290-x
Karhu, K., Auffret, M. D., Dungait, J. A. J., Hopkins, D. W., Prosser, J. I., Singh, B. K., et al. (2014). Temperature sensitivity of soil respiration rates enhanced by microbial community response. Nature 513, 81–84. doi: 10.1038/nature13604
Katayama, A., Kume, T., Komatsu, H., Ohashi, M., Nakagawa, M., Yamashita, M., et al. (2009). Effect of forest structure on the spatial variation in soil respiration in a Bornean tropical rainforest. Agric. For. Meteorol. 149, 1666–1673. doi: 10.1016/j.agrformet.2009.05.007
Kosugi, Y., Mitani, T., Itoh, M., Noguchi, S., Tani, M., Matsuo, N., et al. (2007). Spatial and temporal variation in soil respiration in a Southeast Asian tropical rainforest. Agric. For. Meteorol. 147, 35–47. doi: 10.1016/j.agrformet.2007.06.005
Kusiak, A., Vannelli, A., and Kumar, K. R. (1985). Clustering Analysis: Models and Algorithms, Champaign: College of Commerce and Business Administration, University of Illinois at Urbana-Champaign.
La Scala, N., Marques, J., Pereira, G. T., and Cora, J. E. (2000). Short-term temporal changes in the spatial variability model of CO2 emissions from a Brazilian bare soil. Soil Biol. Biochem. 32, 1459–1462. doi: 10.1016/s0038-0717(00)00051-1
Lei, J., Guo, X., Zeng, Y., Zhou, J., Gao, Q., and Yang, Y. (2021). Temporal changes in global soil respiration since 1987. Nat. Commun. 12:403. doi: 10.1038/s41467-020-20616-z
Li, Q., Ma, Q., Gao, J., Zhang, J., Li, Y., Shi, M., et al. (2022). Stumps increased soil respiration in a subtropical Moso bamboo (Phyllostachys edulis) plantation under nitrogen addition. Agric. For. Meteorol. 323:109047. doi: 10.1016/j.agrformet.2022.109047
Liang, G., Wu, X., Cai, A., Dai, H., Zhou, L., Cai, D., et al. (2021). Correlations among soil biochemical parameters, crop yield, and soil respiration vary with growth stage and soil depth under fertilization. Agron. J. 113, 2450–2462. doi: 10.1002/agj2.20699
Liu, W., Jiang, Y., Yang, Q., Yang, H., Li, Y., Li, Z., et al. (2021). Spatial distribution and stability mechanisms of soil organic carbon in a tropical montane rainforest. Ecol. Indic. 129:107965. doi: 10.1016/j.ecolind.2021.107965
Liu, W., Su, Y., Yang, R., Yang, Q., and Fan, G. (2011). Temporal and spatial variability of soil organic matter and total nitrogen in a typical oasis cropland ecosystem in arid region of Northwest China. Environ. Earth Sci. 64, 2247–2257. doi: 10.1007/s12665-011-1053-5
Martin, J. G., Phillips, C. L., Schmidt, A., Irvine, J., and Law, B. E. (2012). High-frequency analysis of the complex linkage between soil CO2 fluxes, photosynthesis and environmental variables. Tree Physiol. 32, 49–64. doi: 10.1093/treephys/tpr134
Martínez-García, E., López-Serrano, F. R., Dadi, T., García-Morote, F. A., Andrés-Abellán, M., Pumpanen, J., et al. (2017). Medium-term dynamics of soil respiration in a Mediterranean mountain ecosystem: the effects of burn severity, post-fire burnt-wood management, and slope-aspect. Agric. For. Meteorol. 233, 195–208. doi: 10.1016/j.agrformet.2016.11.192
McDowell, R. W., and Sharpley, A. N. (2001). Soil phosphorus fractions in solution: influence of fertiliser and manure, filtration and method of determination. Chemosphere 45, 737–748. doi: 10.1016/s0045-6535(01)00117-5
Mitra, B., Mackay, D. S., Pendall, E., Ewers, B. E., and Cleary, M. B. (2014). Does vegetation structure regulate the spatial structure of soil respiration within a sagebrush steppe ecosystem? J. Arid Environ. 103, 1–10. doi: 10.1016/j.jaridenv.2013.12.006
Mori, A., and Takeda, H. (2003). Light-related competitive effects of overstory trees on the understory conifer saplings in a subalpine forest. J. For. Res. 8, 163–168. doi: 10.1007/s10310-002-0022-y
Moriyama, A., Yonemura, S., Kawashima, S., Du, M., and Tang, Y. (2013). Environmental indicators for estimating the potential soil respiration rate in alpine zone. Ecol. Indic. 32, 245–252. doi: 10.1016/j.ecolind.2013.03.032
Mulvaney, R. L., and Khan, S. A. (2001). Diffusion methods to determine different forms of nitrogen in soil hydrolysates. Soil Sci. Soc. Am. J. 65, 1284–1292. doi: 10.2136/sssaj2001.6541284x
Numa, K. B., Robinson, J. M., Arcus, V. L., and Schipper, L. A. (2021). Separating the temperature response of soil respiration derived from soil organic matter and added labile carbon compounds. Geoderma 400:115128. doi: 10.1016/j.geoderma.2021.115128
Ohashi, M., and Gyokusen, K. (2007). Temporal change in spatial variability of soil respiration on a slope of Japanese cedar (Cryptomeria japonica D. Don) forest. Soil Biol. Biochem. 39, 1130–1138. doi: 10.1016/j.soilbio.2006.12.021
Pringle, M. J., and Lark, R. M. (2006). Spatial analysis of model error, illustrated by soil carbon dioxide emissions. Vadose Zone J. 5, 168–183. doi: 10.2136/vzj2005.0015
Robertson, G. P. (1987). Geostatistics in ecology: interpolating with known variance. Ecology 68, 744–748. doi: 10.2307/1938482
Robertson, G. P., Hutson, M. A., Evans, F. C., and Tiedje, J. M. (1988). Spatial variability in a successional plant community: patterns of nitrogen availability. Ecology 69, 1517–1524. doi: 10.2307/1941649
Saiz, G., Green, C., Butterbach-Bahl, K., Kiese, R., Avitabile, V., and Farrell, E. P. (2006). Seasonal and spatial variability of soil respiration in four Sitka spruce stands. Plant Soil 287, 161–176. doi: 10.1007/s11104-006-9052-0
Schumacher, B. A. (2002). Methods for the Determination of Total Organic Carbon (TOC) in Soils and Sediments. Washington, DC: Ecological Risk Assessment Support Center, 1–23.
Schwendenmann, L., Veldkamp, E., Brenes, T., O’Brien, J. J., and Mackensen, J. (2003). Spatial and temporal variation in soil CO2 efflux in an old-growth neotropical rain forest, La Selva, Costa Rica. Biogeochemistry 64, 111–128. doi: 10.1023/a:1024941614919
Senin, N., Ziliotti, M., and Groppetti, R. (2007). Three-dimensional surface topography segmentation through clustering. Wear 262, 395–410. doi: 10.1016/j.wear.2006.06.013
Sha, L., Zheng, Z., Tang, J., Yinghong, W., Yiping, Z., Min, C., et al. (2005). Soil respiration in tropical seasonal rain forest in Xishuangbanna, SW China. Sci. China Earth Sci. 48, 189–197. doi: 10.1360/05zd0019
Soe, A. R. B., and Buchmann, N. (2005). Spatial and temporal variations in soil respiration in relation to stand structure and soil parameters in an unmanaged beech forest. Tree Physiol. 25, 1427–1436. doi: 10.1093/treephys/25.11.1427
Song, Q. H., Tan, Z. H., Zhang, Y. P., Cao, M., Sha, L. Q., Tang, Y., et al. (2013). Spatial heterogeneity of soil respiration in a seasonal rainforest with complex terrain. iForest 6, 65–72. doi: 10.3832/ifor0681-006
Sotta, E. D., Meir, P., Malhi, Y., Nobre, A. D., Hodnett, M., and Grace, J. (2004). Soil CO2 efflux in a tropical forest in the Central Amazon. Glob. Chang. Biol. 10, 601–617. doi: 10.1111/j.1529-8817.2003.00761.x
Stell, E., Warner, D., Jian, J., Bond-Lamberty, B., and Vargas, R. (2021). Spatial biases of information influence global estimates of soil respiration: how can we improve global predictions? Glob. Chang. Biol. 27, 3923–3938. doi: 10.1111/gcb.15666
Stoyan, H., De-Polli, H., Böhm, S., Robertson, G. P., and Paul, E. A. (2000). Spatial heterogeneity of soil respiration and related properties at the plant scale. Plant Soil 222, 203–214. doi: 10.1023/a:1004757405147
Su, Y. G., Huang, G., Lin, Y. J., and Zhang, Y. M. (2016). No synergistic effects of water and nitrogen addition on soil microbial communities and soil respiration in a temperate desert. Catena 142, 126–133. doi: 10.1016/j.catena.2016.03.002
Takahashi, M., Hirai, K., Limtong, P., Leaungvutivirog, C., Panuthai, S., Suksawang, S., et al. (2011). Topographic variation in heterotrophic and autotrophic soil respiration in a tropical seasonal forest in Thailand. Soil Sci. Plant Nutr. 57, 452–465. doi: 10.1080/00380768.2011.589363
Tao, X., Cui, J., Dai, Y., Wang, Z., and Xu, X. (2016). Soil respiration responses to soil physiochemical properties in urban different green-lands: a case study in Hefei, China. Int. Soil Water Conserv. Res. 4, 224–229. doi: 10.1016/j.iswcr.2016.08.001
Vieublé Gonod, L., Chadoeuf, J., and Chenu, C. (2006). Spatial distribution of microbial 2,4-Dichlorophenoxy acetic acid mineralization from field to microhabitat scales. Soil Sci. Soc. Am. J. 70, 64–71. doi: 10.2136/sssaj2004.0034
Vitousek, P. M., Porder, S., Houlton, B. Z., and Chadwick, O. A. (2010). Terrestrial phosphorus limitation: mechanisms, implications, and nitrogen–phosphorus interactions. Ecol. Appl. 20, 5–15. doi: 10.1890/08-0127.1
Wan, S., Norby, R. J., Ledford, J., and Weltzin, J. F. (2007). Responses of soil respiration to elevated CO2, air warming, and changing soil water availability in a model old-field grassland. Glob. Chang. Biol. 13, 2411–2424. doi: 10.1111/j.1365-2486.2007.01433.x
Wang, A., Fang, Y. T., Chen, D. X., Koba, K., Makabe, A., Li, Y. D., et al. (2014). Variations in nitrogen-15 natural abundance of plant and soil systems in four remote tropical rainforests, southern China. Oecologia 174, 567–580. doi: 10.1007/s00442-013-2778-5
Watts, J. D., Natali, S. M., Minions, C., Risk, D., Arndt, K., Zona, D., et al. (2021). Soil respiration strongly offsets carbon uptake in Alaska and Northwest Canada. Environ. Res. Lett. 16:084051. doi: 10.1088/1748-9326/ac1222
Xiao, H. B., Shi, Z. H., Li, Z. W., Chen, J., Huang, B., Yue, Z. J., et al. (2021). The regulatory effects of biotic and abiotic factors on soil respiration under different land-use types. Ecol. Indic. 127:107787. doi: 10.1016/j.ecolind.2021.107787
Xu, H., Detto, M., Fang, S., Li, Y., Zang, R., and Liu, S. (2015). Habitat hotspots of common and rare tropical species along climatic and edaphic gradients. J. Ecol. 103, 1325–1333. doi: 10.1111/1365-2745.12442
Xu, H., Li, Y. D., Luo, T. S., Chen, D. X., and Lin, M. X. (2013). Environmental factors correlated with species diversity in different tropical rain forest types in Jianfengling, Hainan Island, China. Chin. J. Plant Ecol. 37, 26–36. doi: 10.3724/sp.j.1258.2013.00003
Xu, W., and Wan, S. (2008). Water-and plant-mediated responses of soil respiration to topography, fire, and nitrogen fertilization in a semiarid grassland in northern China. Soil Biol. Biochem. 40, 679–687. doi: 10.1016/j.soilbio.2007.10.003
Yang, H., Liu, S., Li, Y., and Xu, H. (2018). Diurnal variations and gap effects of soil CO2, N2O and CH4 fluxes in a typical tropical montane rainforest in Hainan Island, China. Ecol. Res. 33, 379–392. doi: 10.1007/s11284-017-1550-4
Yao, Y., Zhang, Y., Yu, G., Sha, L., Deng, Y., and Tan, Z. (2011). Representative time selection analysis on daily average value of soil respiration in a tropical rain forest. J. Nanjing For. Univ. 35, 74–78.
Yazdanpanah, N., Mahmoodabadi, M., and Cerdà, A. (2016). The impact of organic amendments on soil hydrology, structure and microbial respiration in semiarid lands. Geoderma 266, 58–65. doi: 10.1016/j.geoderma.2015.11.032
Zhang, Y., Zou, J., Dang, S., Osborne, B., Ren, Y., and Ju, X. (2021). Topography modifies the effect of land-use change on soil respiration: a meta-analysis. Ecosphere 12:e03845. doi: 10.1002/ecs2.3845
Zhao, Y. L., Goldberg, S. D., Xu, J. C., and Harrison, R. D. (2018). Spatial and seasonal variation in soil respiration along a slope in a rubber plantation and a natural forest in Xishuangbanna, Southwest China. J. Mt. Sci. 15, 695–707. doi: 10.1007/s11629-017-4478-9
Keywords: spatial heterogeneity, soil respiration, soil topography, soil properties, geostatistical analysis
Citation: Yang H, Huang T, Li Y, Liu W, Fu J, Huang B and Yang Q (2023) Spatial heterogeneity and influence mechanisms on soil respiration in an old-growth tropical montane rainforest with complex terrain. Front. Ecol. Evol. 10:1107421. doi: 10.3389/fevo.2022.1107421
Edited by:
Xiang Liu, Lanzhou University, ChinaReviewed by:
Wensheng Bu, Jiangxi Agricultural University, ChinaCopyright © 2023 Yang, Huang, Li, Liu, Fu, Huang and Yang. This is an open-access article distributed under the terms of the Creative Commons Attribution License (CC BY). The use, distribution or reproduction in other forums is permitted, provided the original author(s) and the copyright owner(s) are credited and that the original publication in this journal is cited, in accordance with accepted academic practice. No use, distribution or reproduction is permitted which does not comply with these terms.
*Correspondence: Qiu Yang, ✉ eWFuZ3FpdTA5MDNAMTYzLmNvbQ==
†These authors have contributed equally to this work
Disclaimer: All claims expressed in this article are solely those of the authors and do not necessarily represent those of their affiliated organizations, or those of the publisher, the editors and the reviewers. Any product that may be evaluated in this article or claim that may be made by its manufacturer is not guaranteed or endorsed by the publisher.
Research integrity at Frontiers
Learn more about the work of our research integrity team to safeguard the quality of each article we publish.