 Baoqi Chen
 Xiaotong Xu*
- School of Economics, Shandong University of Finance and Economy, Jinan, China
Taking the Qinling-Huaihe River as the boundary, this paper divides the Chinese service industry into north and south regions. The current study calculates the green total factor productivity of the Chinese service industry from 2003 to 2019 by using the DEA-Malmquist productivity index method. The influencing factors of the service industry in the north and south of China are tested by the Moran index and the spatial Durbin model. The results show that the green total factor productivity of the Chinese service industry shows great regional heterogeneity. The average green total factor productivity of northern China is 1.4 percentage points lower than that of southern China. The leading factor for the growth of green total factor productivity in southern China is technological progress, while TFP in northern China mainly depends on technical efficiency improvement. The results of spatial econometric regression show that the intensive level of producer services plays a significant role in promoting the green development of the service industry. The transportation infrastructure can significantly promote the green development level of the service industry. Finally, some suggestions are provided to narrow the gap between the north and south of the Chinese service industry.
1. Introduction
The report of the 17th National Congress of the Communist Party of China pointed out that China should accelerate the transformation of the economic development model, and promote the optimization and upgrading of the economic structure. China should promote economic growth by relying on the second industry to the third industry to coordinate the development, and vigorously develop the service industry; The national “12th Five Year Plan” points out that promoting the development of the service industry is the strategic focus of the optimization and upgrading of the industrial structure; According to the national 13th Five Year Plan, the proportion of the added value of Chinese tertiary industry during the 13th Five Year Plan period increased from 50.5% in 2015 to 56% in 2020, with an average annual increase of 1.1 percentage points. During the 14th Five-Year Plan period, a structural adjustment will be combined with industrial upgrading to promote the prosperity and development of the service industry. With the proposal of high-quality economic development, the high-quality development of the service industry has attracted much attention. Statistics on service industry development show that the proportion of the added value of the Chinese service industry in GDP and the proportion of employment in the service industry rose from 23.9 and 12.2% in 1978 to 54 and 46.3% in 2019. The Chinese service industry has become the most important industry. However, compared with developed economies, the Chinese service industry still has a low proportion of added value, employment, and per capita added value. Chinese economy develops rapidly while the service industry has lagged. This is mainly due to the zero growth rate of total factor productivity in the service industry of senior producers. The growth of total factor productivity in the service industry shows great regional and industrial heterogeneity. The productive service industry shows a trend of spatial agglomeration from the northeast, central and western regions of China to the eastern coastal areas.
Transforming the pattern of economic development and pursuing high-quality growth has become a priority. The service industry has gradually increased its contribution to economic development. In addition to relying on capital, labor, and other traditional production factors, its development is inseparable from efficiency improvement and technological progress. The existing literature mainly focuses on the regional heterogeneity of the service industry in the east, west, and east. In recent years, with the increase of the north–south economic gap, some scholars began to study the north–south gap in economic development. Based on the existing research results, this paper increases the analysis of the north–south gap in the green development of the service industry, which has important practical significance for promoting the high-quality development of China’s service industry (Chen et al., 2022). Taking the Qinling Mountains Huaihe River as the dividing line, this paper divides the Chinese Mainland into the north and the south (Wu, 2001). The rapid development of the manufacturing industry in the North had led to the rise of the agglomeration level of producer services, so the green development level of the service industry in the north was higher than that in the south. However, in recent years, due to the lagging transformation and upgrading of the manufacturing industry in the northern region, the gap between the north and the south in the service industry is narrowing. Benefiting from reform and opening up, the economy of the southern region has risen rapidly and surpassed that of the northern region. The green development of the service industry in the south is gradually surpassing that in the north.
With the narrowing of the east–west gap and the widening of the north–south gap in economic development, it is necessary to discuss the heterogeneity of the service industry development from the perspective of the north–south region. Therefore, this paper takes the Qinling-Huaihe Line as the boundary to divide China into the north–south region and analyzes the north–south differences in the service industry development. With the development of the economy, the relevance of regional economic development is gradually strengthened. If only the changes in the service industry within the region are considered and the relevance between regions is ignored, the research results will be biased. It is necessary to discuss the north–south differences in the service industry from the perspective of spatial relevance and bring the spatial factors into the research framework.
The rest of this paper is arranged as follows: The second part summarizes the relevant literature. The third part is about the research method and variables description; The fourth part is about the measurement of the green development level of the service industry; The fifth part shows the analysis of empirical results and robustness test. The sixth part is the conclusion and enlightenment.
2. Literature review
The existing research related to this paper is mainly reflected in two aspects: the research on the regional heterogeneity of the service industry and the research on the influencing factors of the service industry.
The existing literature on regional differences in the service industry mainly focuses on the development gap between the east, the west, and the central. There are relatively few studies on the north–south differences in service industries. The total factor productivity of the Chinese service industry is lower than that of agriculture and manufacturing, and the capital-output ratio growth rate is the main driver of Chinese service sector growth (Cheng, 2003). Some scholars believe that the differences in the marketization process and labor quality (Wei, 2006), and technological progress are the main reasons for the improvement of total factor productivity in the service industry (Zhang and Yu, 2012), and also the main reasons for the differences in total factor growth rates in the eastern, central, and western regions. The eastern region has a relatively high TFP growth rate in the service industry (Zhong et al., 2020), while the western region lags. The internal structure of the service industry is also heterogeneous (Tan and Zheng, 2012). The total factor productivity of producer services is declining, but the decline rate is slowing year by year. The decline rate of total factor productivity in the central and western regions is much higher than that in the eastern regions. The Chinese economy is growing at a high speed (Chen and Sheng, 2009; Wang et al., 2015), but the upgrading of the service industry structure is lagging. When considering environmental factors, the total factor productivity of Chinese service industry provinces and sub-industries has a large regional and industrial heterogeneity. The carbon productivity of the Chinese service industry is growing year by year as a whole and is decreasing from east to west (Sheng and Lu, 2013).
In terms of research on influencing factors of service industry development, some scholars believe that the output of service products (Guo, 1992; Gu and Li, 2006; Zhang and Chen, 2018), population density (Yang and Xu, 2006), the relative intensity of the service industry (Cui and Zhao, 2018), foreign direct investment (Yuan et al., 2009), education level of employed people (Yu and Pan, 2019), degree of opening to the outside world (Wang and Hu, 2012; Wang et al., 2020) and birth rate (Li, 1994) have a significant impact on the development of the service industry. With the development of the economy, different service sectors do not develop in parallel in the structural evolution (Jiang and Li, 2004). The optimization of the internal structure of the service industry is an important part of its development of the service industry (Yin and Chen, 2009). The technological progress of producer services contributes a lot to the output value, and its technical efficiency is higher than that of living services. There is obvious heterogeneity in the evolution of the internal structure of the service industry (Cheng and Chen, 2005). Productive services can improve the overall total factor productivity of the macroeconomy (Yin, 2006), thereby promoting the sustainable and high-quality growth of the Chinese economy (Yuan and Guo, 2018; Zhang and Zheng, 2020). The industrial structure shows obvious gradient distribution characteristics (Gu, 2008), with the eastern coastal provinces being the highest and decreasing gradually from east to west. Some scholars consider the regional heterogeneity of the service industry from the perspective of spatial economics and think that the level of transportation and communication (Camilla, 2002), knowledge intensity, and manufacturing agglomeration are the main factors that affect the spatial differences in the development of the Chinese service industry (Chen et al., 2009).
Pollution emissions have a significant spatial spillover effect (Su et al., 2009). The environmental effects brought by economic agglomeration are not limited to the agglomeration areas (Zhong et al., 2022), but also have significant spillover effects on the environment of surrounding areas (Drucker et al., 2012; Liu et al., 2018). The internal structure development of the provincial service industry does not match the local resources, resulting in the demand for service industry elements being realized through the surrounding areas (Lee and Hong, 2012). The green development of the service industry in the surrounding areas is affected, so the green development of the service industry is spatially related. In recent years, due to the lagging transformation and upgrading of the manufacturing industry in the northern region, the green development in service in the northern region is slower than that in South region. The southern region has benefited from technological progress, industrial structure optimization, economic transformation, and other reasons. The service industry development level in the southern region is gradually higher than that in the northern region. If the northern region does not actively carry out industrial optimization and upgrading, the gap will expand (Chen et al., 2022).
It can be concluded that the green development of the service industry in China has regional differences and spatial spillover effects. The green development of the service industry in the Southern reason is higher than that in the northern region, and the gap will continue to widen with the economic development of the South. Qinling Huaihe Line is short for Qinling Mountains Huaihe River Line. Qinling Mountains Huaihe River Line is the geographic boundary between northern and southern China. This paper takes the Qinling Huaihe Line as the north–south boundary of China. The northern region includes 15 provinces and cities, including Beijing, Tianjin, Hebei, Shandong, Henan, Shanxi, Inner Mongolia, Heilongjiang, Jilin, Liaoning, Shaanxi, Gansu, Qinghai, Ningxia, and Xinjiang. The southern region includes 16 provinces and cities, including Shanghai, Jiangsu, Zhejiang, Anhui, Fujian, Jiangxi, Hubei, Hunan, Guangdong, Guangxi, Hainan, Chongqing, Sichuan, Guizhou, Yunnan Tibet (excluding Hong Kong, Macao, and Taiwan; Chen et al., 2022).
It can be seen from the literature that the existing research can be expanded from the following three levels: First, in the context of the increasingly prominent regional heterogeneity of the service industry, the existing literature mainly focuses on the regional differences between the east, west, and center of the service industry, but the existing literature rarely involves the regional differences between the north and south of the service industry. Second, the evolution of the internal structure of the service industry shows obvious heterogeneity (Harberger, 1978). The agglomeration of producer services can significantly promote technological innovation (Xia et al., 2019). Compared with developed countries, China has huge space and potential for upgrading the internal structure of the service industry. The service industry can promote structural allocation effect, industrial development, and economic growth through continuous structural optimization. Third, regional economic activities are not independent of each other. The cross-regional flow of production factors will have an impact on the development of regional service industries (Li and Wang, 2007). There is an obvious spatial correlation between regional economies. Therefore, the potential marginal contribution of this paper is as follows: First, Based on the difference between east and west, this paper introduces the north–south gap analysis of green development of the service industry. Second, this paper introduces spatial factors into the traditional regression model to investigate the influencing factors of regional differences in the service industry under the spatial effect, and to provide countermeasures for promoting the coordinated development of the service industry.
3. Research methods and variable descriptions
3.1. Research methods
3.1.1. DEA Malmquist index method
This paper uses the DEA Malmquist index method to measure the green total factor productivity of the service industry. The Malmquist index method does not need to set the production function, to avoid the influence on the accuracy of the results due to the wrong setting of the function form. The empirical analysis is based on the Malmquist index method of DEA, which defines the Malmquist productivity index based on the distance function and uses the linear optimization method to estimate the marginal production function of the decision-making unit, to measure the efficiency change and technological progress. The change value of the Malmquist productivity index is the change value of the green total factor productivity.
Suppose that in the period t (t = 1, 2 … T), the k (k = 1, 2 … K) province uses n (n = 1, 2 …, N) input , get m (m = 1, 2 … M) output , where d. represents the distance function and dt. represents the distance function under the technical conditions of time t, then DEA Malmquist index method is as follows:
Where, M represents the Malmquist productivity index, which is the geometric average of the productivity indexes in t period and t + 1 period. When the index is greater than 1, it indicates that the total factor productivity of the province has increased from t period to t + 1 period. EC is the relative efficiency change index under the condition of constant returns to scale, which depicts the catching-up effect of provinces and cities on the best frontier from t to t + 1. When EC > 1, it indicates that the production of the province is closer to the production frontier. TC index measures technological progress and depicts the growth effect of the technological frontier from t period to t + 1 period. When TC > 1, it indicates that the technology has made progress or innovation, and the technology frontier moves upward. Technical efficiency index can be decomposed into pure technical efficiency index (PEC) and scale efficiency index (SEC).
Service industry output. This paper uses the tertiary industry-added value of each province to measure the actual output of the service industry of each province (Deng, 2009). Taking 2003 as the base period, the data comes from the China Statistical Yearbook and the statistical yearbooks of each province and city. In theory, labor input should include labor number, labor time, labor efficiency, and other factors, but considering the availability of data, this paper uses the number of tertiary industry employees at the end of each province as the proxy variable of labor input indicators in each province. The data comes from the statistical yearbooks of provinces and cities and the CSMAR database. The capital input is measured by the capital stock of each province’s service industry. This paper uses the perpetual inventory method to estimate, and the estimation formula is:
Where represents the actual capital stock of province i in year t and year t − 1 respectively, represents the capital stock of province i in the base year, represents the total fixed asset investment in the service industry of province i in year t, is the depreciation rate of fixed assets of province i in year t. This paper follows the existing literature and sets the capital depreciation rate of China’s service industry at 4% (Cui and Wei, 2015). The capital stock in the base year is based on the steady-state method (Li et al., 2017), that is, the capital-output ratio is unchanged or the growth rate of physical capital is equal to the growth rate of total output in the steady-state. The capital stock in the base year of province i is estimated as follows:
Among them, is the stock of fixed capital in the service industry of province i in 2003, the amount of fixed asset investment in the service industry of province i in 2004, and the growth rate of fixed asset investment in the service industry of province i in period t. To control the impact of the economic cycle and output fluctuation, this paper uses the average annual growth rate of added value in the service industry of each province from 2003–2017 to replace. The data are from China Statistical Yearbook and CSMAR database Database.
3.1.2. Spatial Moran index
The Moran index is used to measure the spatial correlation between variables. This paper uses the Moran index to judge the spatial correlation of green total factor productivity in the service industry. The formula for calculating the Moran index is:
Where, = represents the green total factor productivity of the service industry in region i. n = 31. W is the spatial weight matrix, and the value range of I is - 1 ≤ I ≤ 1. When I approach 1, it means that there is a positive spatial correlation between regions, when I approach - 1, it means that there is a negative spatial correlation between regions, and when I value is 0, it means that there is no spatial correlation between regions.
3.1.3. Spatial metrological model
Compared with traditional econometric models, spatial econometric models consider the spatial dependence of variables, which is reflected in the lag term of dependent variables and error terms in spatial econometric models. Therefore, spatial econometric models can be divided into Spatial Autoregressive Models (SAR), spatial error models (SEM), and Spatial Durbin Models (SDM). The spatial autoregressive model mainly studies the influence of variables in adjacent regions on variables in other regions of the whole system (spillover effect), its spatial dependence is reflected in the lag term of the dependent variable; The spatial error model mainly studies the interrelation between regions, and its spatial dependence is reflected in the lag term of the error term; The spatial Durbin model studies the influence of the explanatory variables in adjacent areas on the explanatory variables in this area. Its spatial dependence is reflected in the lag term between the explanatory variables in adjacent areas and the explanatory variables.
Where subscript i represents province and t represents year; is the explained variable, that is, the green total factor productivity of the tertiary industry in each province, is the set of explanatory variables, including the location entropy, population density, government expenditure level, openness, and the proportion of the secondary industry of producer services; is the time effect, is the regional effect, is a random perturbation term. β It is a spatial lag regression coefficient, reflecting the inherent spatial dependence in the observations. When γ is zero, the spatial Durbin model can degenerate into a spatial autoregressive model. When is zero, the spatial Durbin model can degenerate into a spatial error model. represents the spatial weight matrix, which is standardized so that the sum of elements in each row is 1. To avoid the limitation of the single weight matrix, this paper selects the spatial adjacency matrix, spatial distance matrix, and spatial economy matrix for analysis. The spatial adjacency matrix refers to 31 provinces. If two provinces are geographically adjacent, the corresponding weight is 1, and if they are not adjacent, it is 0. The spatial distance matrix uses the large arc distance between provincial capitals to replace the distance between regions, that is, the shortest distance between cities calculated by latitude and longitude on the sphere. The interaction of service industries between different provinces is proportional to the geographical distance of provinces. The economic weight matrix is set according to the per capita GDP and provincial distance from 2003 to 2017, and the data is from the National Geographic Basic Information Center.
3.2. Variable descriptions
This paper takes the Qinling Huaihe Line as the north–south boundary of China. The northern region includes 15 provinces and cities, including Beijing, Tianjin, Hebei, Shandong, Henan, Shanxi, Inner Mongolia, Heilongjiang, Jilin, Liaoning, Shaanxi, Gansu, Qinghai, Ningxia, and Xinjiang. The southern region includes Shanghai, Jiangsu, Zhejiang, Anhui, Fujian, Jiangxi, Hubei, Hunan, Guangdong, Guangxi, Hainan, Chongqing, Sichuan, Guizhou, and Yunnan Tibet has 16 provinces and cities (excluding Hong Kong, Macao, and Taiwan). Considering the availability of data, this paper selects the annual data from 2003 to 2017 as the research sample. The data comes from the CSMAR database, statistical yearbooks of provinces, and the National Statistical Yearbook.
The existing literature studies the development level of the service industry around the urbanization level, system, transportation infrastructure, fiscal expenditure, and other factors. On this basis, this paper introduces the level of productive service industry aggregation as the proxy variable of the internal structure of the service industry to measure the impact of the service industry structure difference between the north and the south of China on the service industry. According to the above analysis, the explained variable of this paper is the green total factor productivity of the service industry. In the robustness test, this paper selects the per capita GDP of the tertiary industry in each province to measure.
Variables are divided into core explanatory variables and control variables. The core explanatory variables mainly reflect the differences in the internal structure of the service industry. This paper chooses the location entropy of producer services to replace the aggregation level of producer services. Based on the existing research assumptions, the control variables are measured by transportation infrastructure, openness, population density, industrialization level, and government expenditure level.
3.2.1. Interpreted variable
This paper selects the green total factor productivity of the service industry to measure the service industry development level of the province. The higher the provincial service industry development level, the greater the green total factor productivity in the service industry (Mahadevan, 2000). In the robustness test, this paper selects the per capita GDP of provinces to measure the development level of the service industry (Gao et al., 2022a).
3.2.2. Core explanatory variables
This paper uses location entropy (PS) to measure the relative intensity of producer services in each province. Location entropy measures the relative concentration level of the service industry (Sun et al., 2017), can eliminate the factors of regional spatial scale difference, and can truly reflect the spatial distribution of geographical elements (O’Donoghue and Gleave, 2004; Shen et al., 2007; Chen et al., 2009).
Location entropy refers to the relatively intensive level of producer services in province i during the period t, refers to the number of productive services employed in province i during the period t, refers to the total employment number of province i in the period t, refers to the number of productive services employed in the country during t period, represents the total number of employed people in the country during the period t. Productive services include transportation, warehousing, postal services, information transmission, computer services, and software, finance, real estate, leasing, and commercial services, scientific research, technical services, geological exploration, wholesale and retail, water conservancy, environment, and public facilities management.
Calculate the number of employees in an industry at the end of the year is taken as the number of employees in that industry, and the number of employees in productive services is the sum of the number of employees in each industry at the end of the year (Yang, 2013; Liang, 2018). The number of employees in a certain industry in the country in period t is equal to the total number of employees in that industry in each province.
3.2.3. Control variables
Transportation infrastructure can accelerate the green development of the service industry, reduce transaction costs, and help deepen the division of labor. Convenient transportation conditions have a significant role in promoting the green development of the regional service industry. Transportation infrastructure includes railways and highways. This paper uses the sum of the mileage of highways and railways above the grade per square kilometer in each province and city to measure the infrastructure construction in each region. The higher the population density, the greater the demand for living services. The green development level of the living service industry is low, so the higher population density will inhibit the green development of the service industry. Population density has a significant impact on the green development of the service industry. This paper selects the ratio of the population at the end of the year to the area of i province to measure the population concentration of i province. The greater the openness of provinces, the higher the green development level of their service industries (Gao et al., 2021). This paper uses the proportion of foreign direct investment in the province’s GDP to measure the province’s openness. The development of the secondary industry is conducive to the development of the service industry. When the development level of the secondary industry is low, economies of scale have not been formed and the promotion of the service industry is weak. When the scale of the regional secondary industry is relatively high, economies of scale will be formed to promote the green development of the service industry. The level of regional industrialization will significantly affect the green development of the regional service industry. In this paper, the industrial-added value of the province accounted for the GDP of the province to measure the level of regional industrialization development. The level of government expenditure will crowd out private investment, thus affecting the green development level of the service industry. This paper uses the proportion of provincial government general expenditure in the provincial GDP to measure the provincial government expenditure level.
In terms of data sources, the data of each indicator is mainly taken from the China Statistical Yearbook and the statistical yearbooks of provinces and cities over the years. See Table 1 for the explanation and statistical description of all variables (Yang et al., 2021).

Table 1. Variable definition description and statistical description.
Table 1 shows the overall data distribution in China, while Table 2 shows the statistics of the north and south regions.
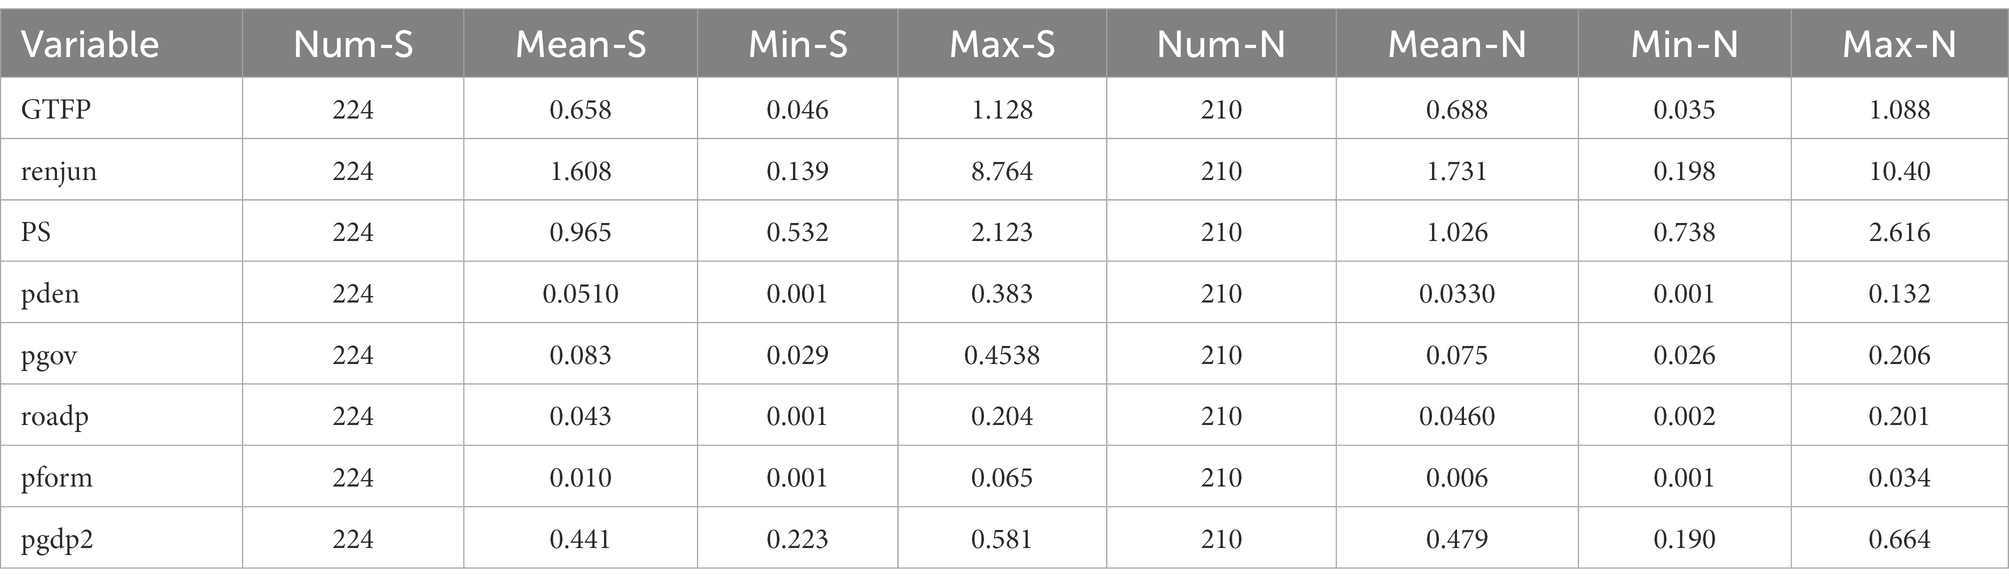
Table 2. Variable definition description and statistical description in south and north region.
N represents the north region. S represents the south region. The population density, the proportion of government expenditure, and the level of openness in the northern region are lower than those in the south, while the proportion of the secondary industry, transportation convenience, and the concentration level of producer services in the south are higher than those in the south region.
4. Measurement of the green development level of the service industry
4.1. Analysis of green total factor productivity of service industry
This paper uses the DEA Malmquist index method to measure the green total factor productivity, efficiency change, and technological progress of the service industry in 31 provinces and cities of China from 2003 to 2017. Using DEAP2.1 software, the output parameter is the added value of the tertiary industry and sulfur dioxide in each province, and the input parameter is capital and labor (Gao et al., 2022b). The green total factor productivity index and its decomposition of China’s service industry as a whole and the north and south regions are calculated, and the changing trend of total factor productivity in the whole and the north and south regions is further analyzed.
Table 3 lists the green total factor productivity index of China’s service industry and its breakdown. From 2003 to 2017, the green total factor growth rate of China’s overall service industry increased by 4.6% annually, mainly due to the improvement of technological progress. From the time dimension, the total factor productivity of China’s service industry and its decomposition are mainly reflected in the following characteristics:
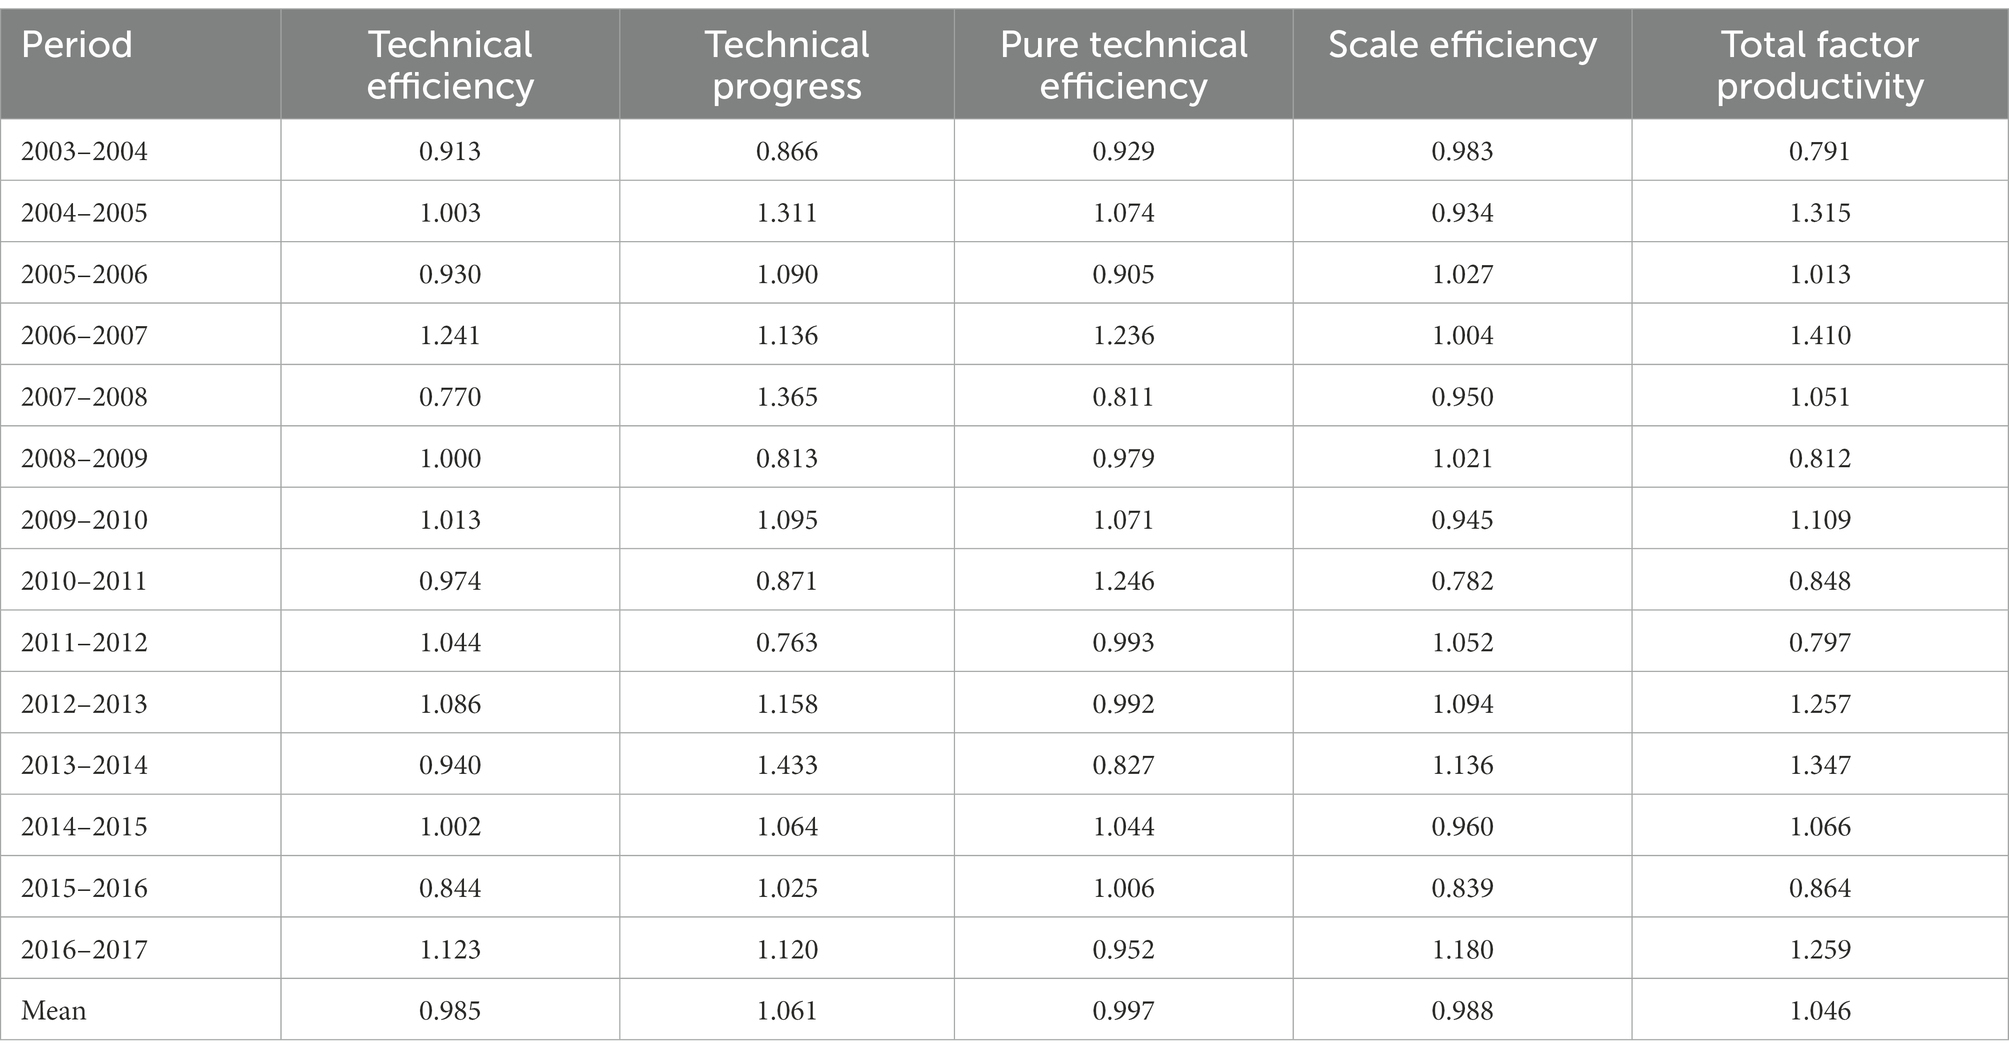
Table 3. The green total factor productivity of China’s service industry and its decomposition.
From the perspective of GTFP growth, the growth between 2003 and 2017 was positive and negative. With the rapid economic growth in 2003–2007, domestic confidence in the reform, opening up and development of the service industry gradually improved, and the green total factor productivity of the service industry also continued to increase. The highest value appeared in 2007. However, the outbreak of the pension crisis in 2008 led to the decline of GTFP in the service industry. To stimulate rapid economic growth, the country implemented a 4 trillion fiscal stimulus plan in November 2008, The stimulus effect gradually appeared, making the green total factor productivity of the service industry reach a high value again in 2014.
The overall growth rate of technical efficiency shows a downward trend, while the overall technological progress shows an upward trend. From the average value, it can be seen that the growth rate of technical efficiency from 2003 to 2017 was - 1.5%, while the average annual growth rate of technological progress was 6.1%. Technical efficiency represents the ratio of actual output to output on the production front under a given input level, and technological progress represents that under a given input level. The geometric average of the movement of the production front in the output direction. It can be seen that from 2003 to 2017, the total factor productivity of the tertiary industry in all provinces was mainly improved by technological progress, while technical efficiency showed a downward trend. This shows that with the increase of capital investment, the technological progress of each province has been significantly improved, but the existing resources and technological potential have not been fully exploited, leading to the decline of technical efficiency, deterioration of technical efficiency, and technological progress.
Among the decomposition indicators of technical efficiency, from 2003 to 2017, the average annual growth rates of pure technical efficiency and scale efficiency were - 0.3% and - 1.2% respectively, indicating that China’s service industry has not yet formed the characteristics of scale economy. Because the service industry cannot be quantified, the statistical results of service industry input and output levels are biased.
4.2. Heterogeneity of service industry GTFP in north and south China
Table 4 lists the service industry green total factor productivity index and its decomposition of provinces and cities in China from 2003 to 2017. At the same time, the growth rate of the North and South regions is also calculated. The variation range of each index in the North and South regions shows that there is a large regional heterogeneity in service industry green total factor productivity, technological progress, and technological efficiency. From 2003 to 2017, the average annual growth rate of the green total factor growth rate was 4.6%, while the average annual growth rate of the southern region was 5, 0.4% higher than the national average. The average annual growth rate of the northern region was 3.6, 1% lower than the national average. Guangxi, Guangdong, Zhejiang, Hainan, and Jiangsu have the highest annual growth rate of the service industry in 31 provinces and cities in China, while Guizhou has the lowest growth rate. It can be seen from this that the growth of the service industry in the south is different, while the growth rate of the service industry in the north is relatively concentrated. From the analysis of the average growth rate of GTFP and its decomposition in the North and South, it can be seen that the average annual growth rate of GTFP in the service industry in the North is 1.4% lower than that in the South, mainly because the technological progress in the North is 2.9% lower than that in the South.
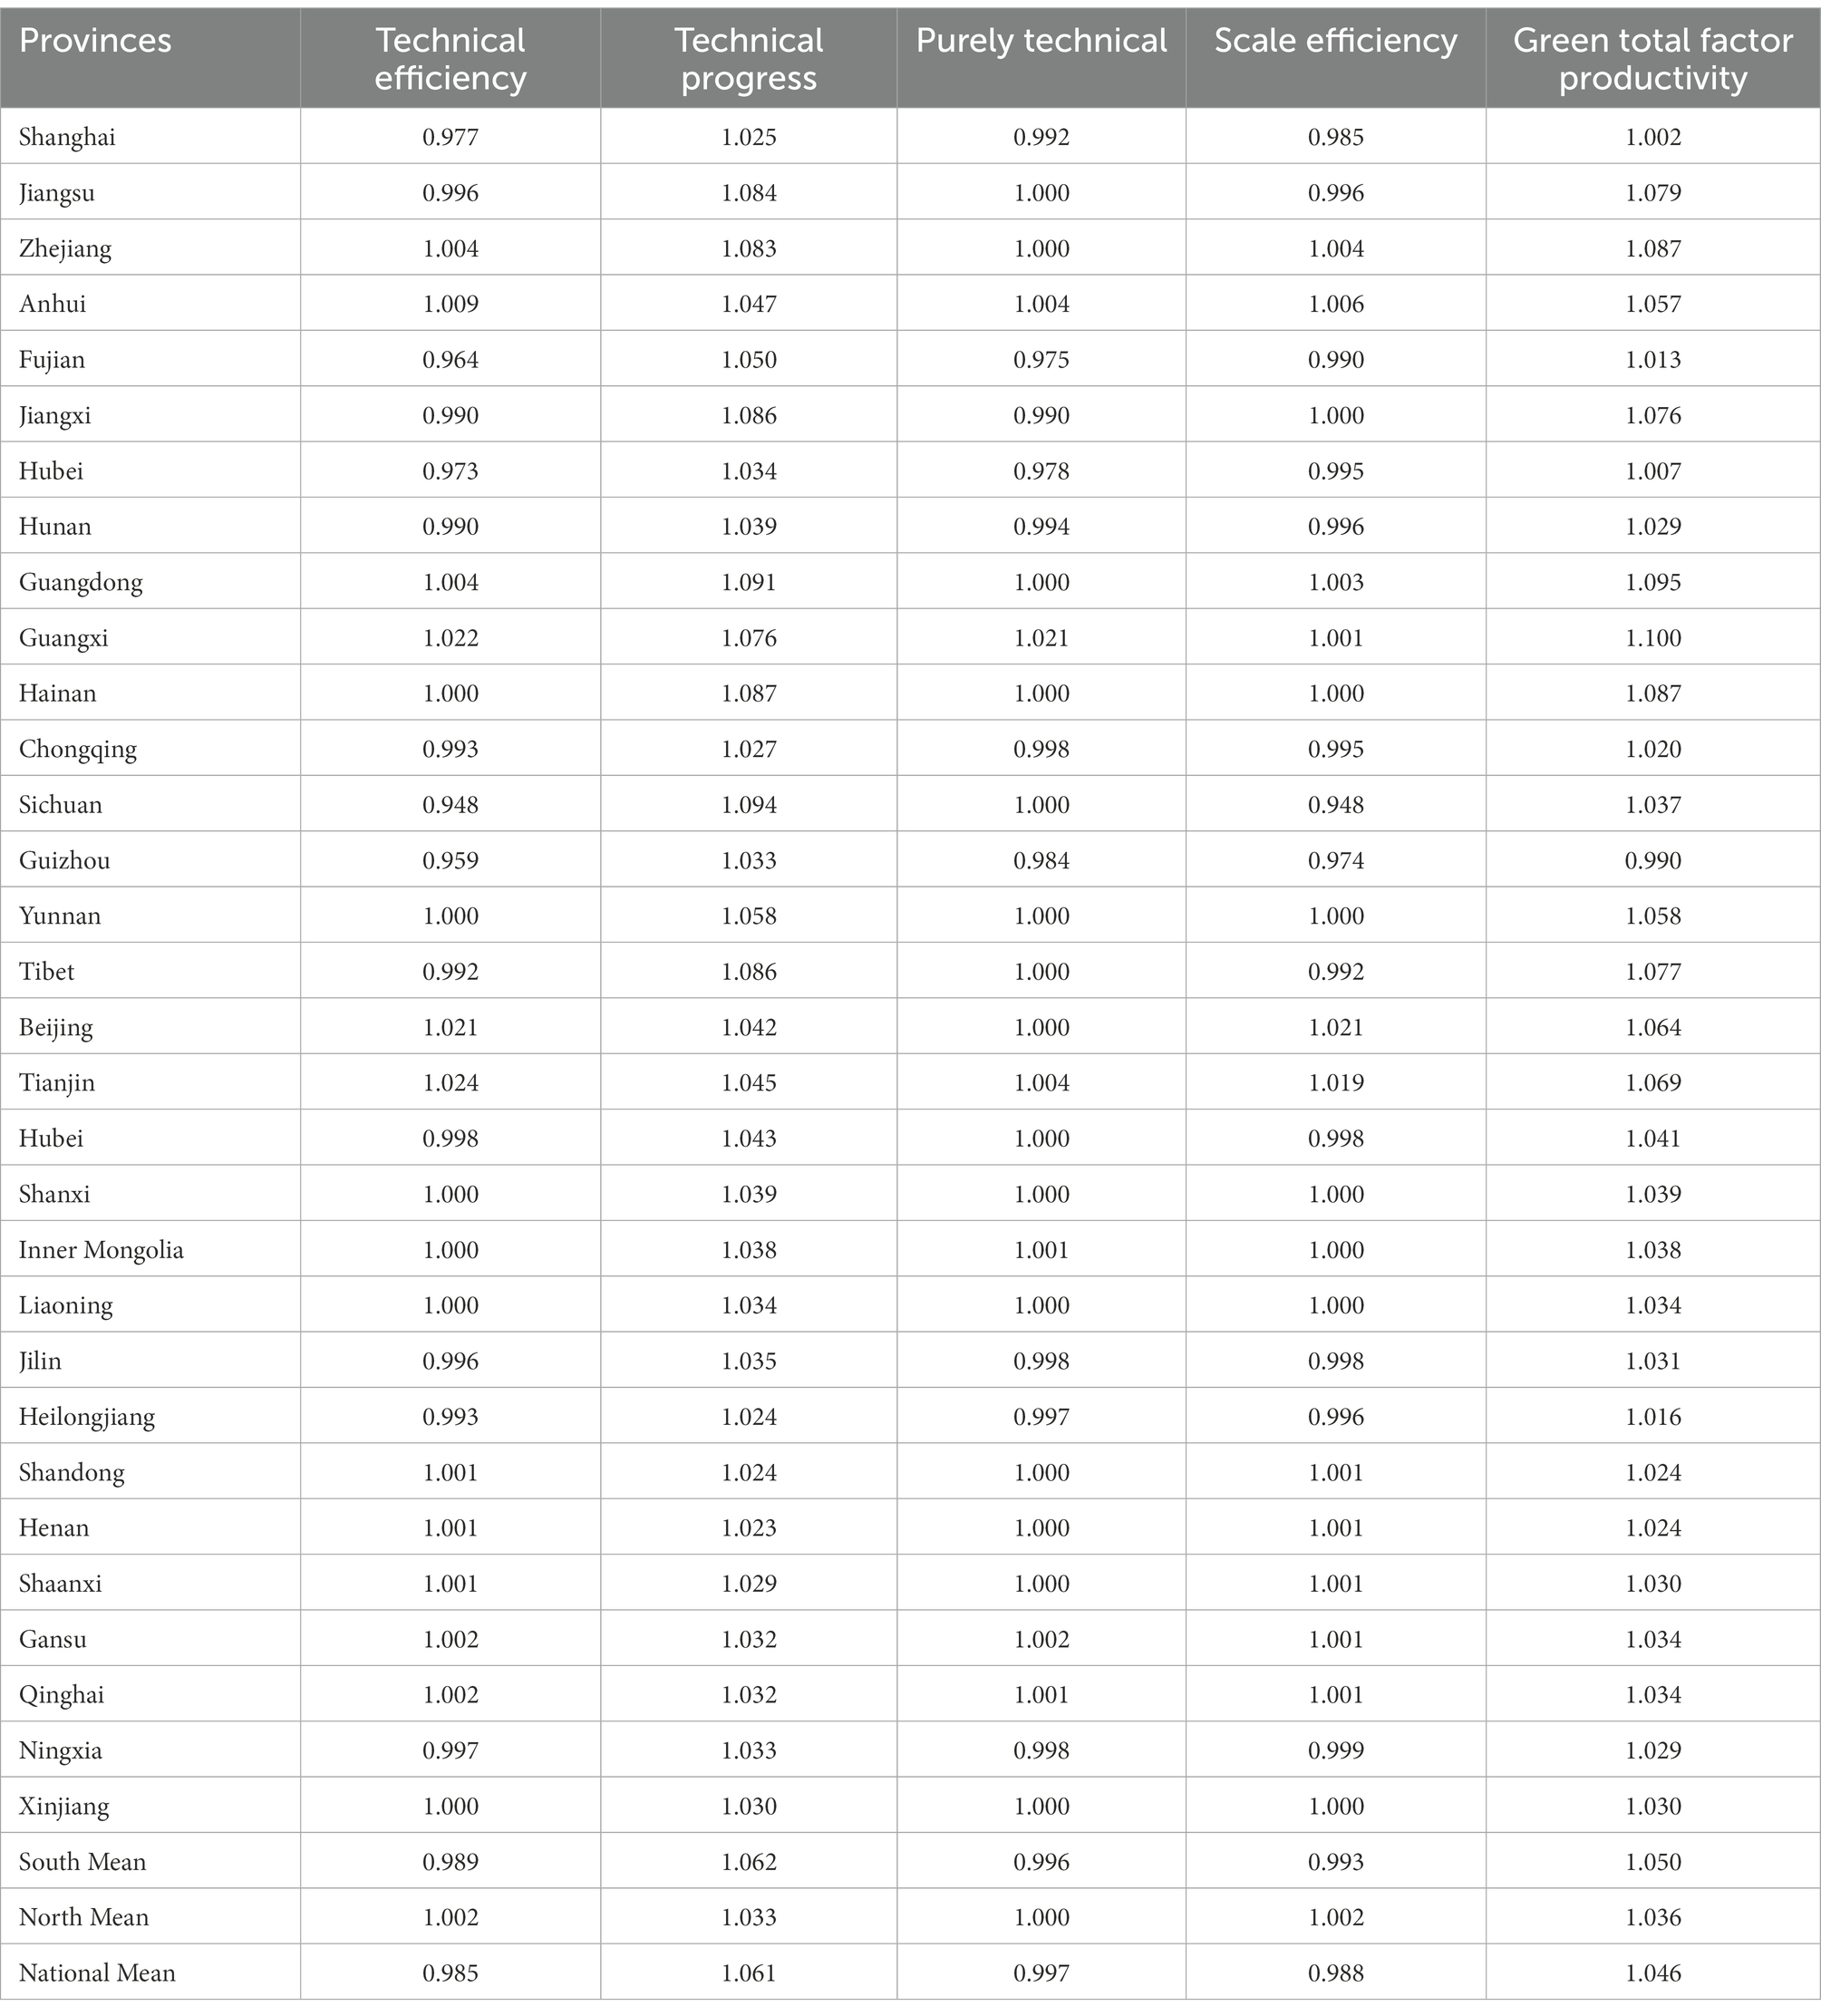
Table 4. GTFP of province and its decomposition.
From the GTFP decomposition index, it can be seen that the technical efficiency of the service industry in the North is higher than that in the South, and the pure technical efficiency and scale efficiency are both higher than those in the South, indicating that from 2003 to 2017.
Figure 1 shows the north–south gap in technological progress in the green development of China’s service industry. The technological progress in the southern region is higher than in the northern region. The service industry in the north has begun to take shape, and the use efficiency of input factors is high, but the level of technological progress is low. However, the use efficiency of service industry input factors in the south is low and does not have a scale effect. Due to the impact of reform and opening up and the introduction of technology, the service industry’s total factor productivity in the south mainly depends on technological progress. The contribution of technological progress in the south is large, resulting in the service industry green total factor productivity in the south being higher than that in the north.
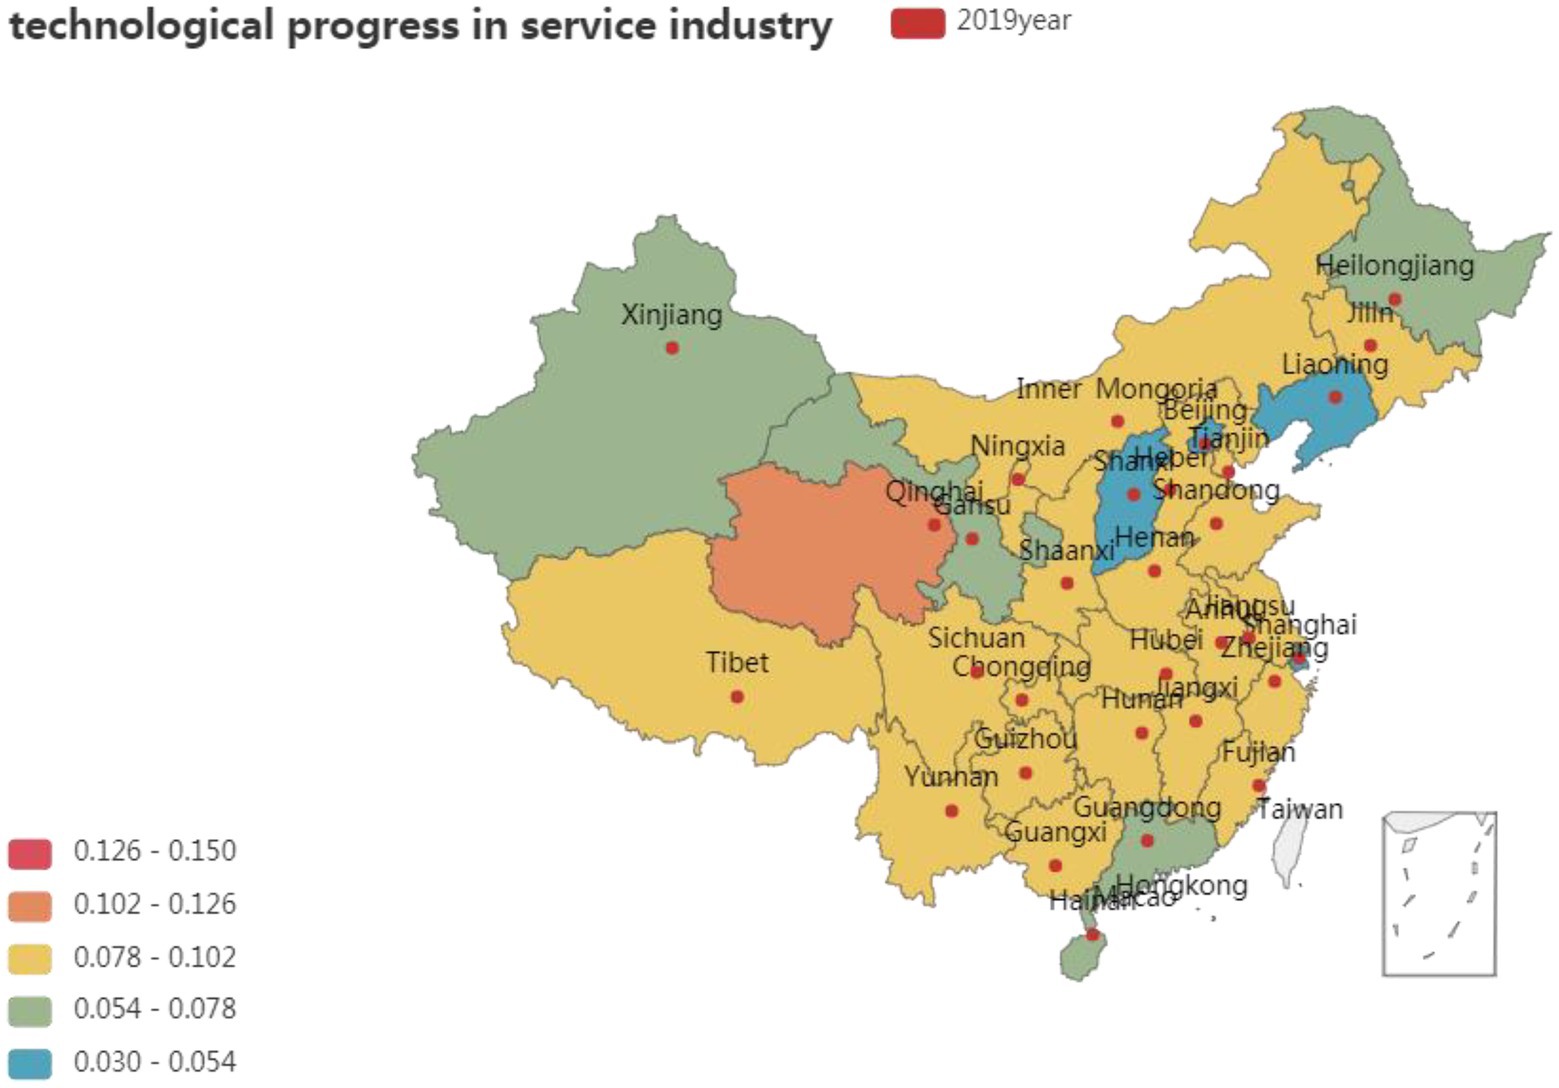
Figure 1. North–south gap of technological progress in green development of China’s service industry.
5. An empirical analysis of green development of the service industry
5.1. Spatial autocorrelation analysis
The spatial autocorrelation Moran index describes the spatial distribution and aggregation of observations from a spatial perspective. Figure 2 shows the trend chart of the Moran index of spatial autocorrelation of service industry GTFP nationwide and by regions. With the economic matrix as the weight matrix, it can be seen from the results that the spatial correlation in China is significantly positive. The spatial agglomeration characteristics of the Chinese service industry are obvious, regions with high service industry development levels are surrounded by more regions with high service industry development levels. At the same time, regions with low service industry development levels are surrounded by regions with the same low service industry development level. It can be seen that the Moran index of the green development level of the national service industry has been increasing, indicating that the spatial autocorrelation of the service industry has increased significantly.
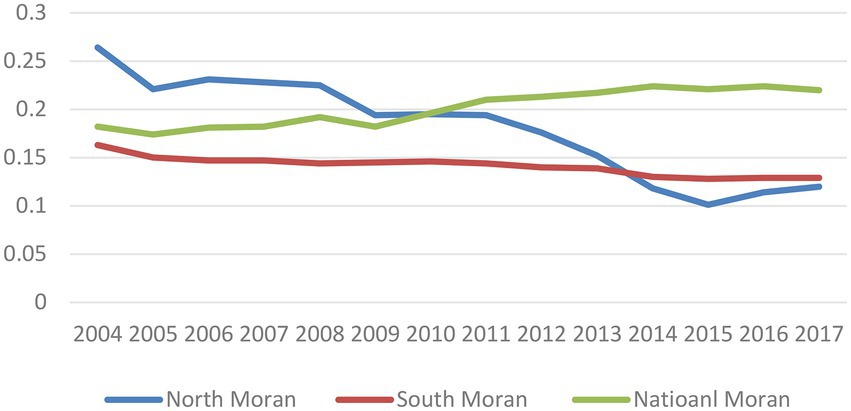
Figure 2. Line chart of Moran index from 2004 to 2017.
From the perspective of the changing trend of the north and south regions, the Moran index of the service industry is decreasing. The Moran index of the north region was significantly higher than that of the south region from 2003 to 2013, indicating that the spatial positive correlation of the north region was significantly higher than that of the south region. After 2013, the Moran index of the south region was higher than that of the north region, but still in a downward trend. Due to the rapid development of information technology, transportation, and logistics, the service industry development level of each province and city has a significant cross-impact effect. The service industry green development level of a southern province will be affected not only by other regions in the south but also by northern regions.
It can be seen from Figure 2 that the national Moran index keeps rising, while the Moran index in the south and north regions shows a downward trend. With the flow of production factors, the association of the provincial service industry is not limited to the adjacent regions, and the association with nonadjacent regions is also gradually strengthened.
Figure 3 shows the Moran Scatter Map of 31 provinces and cities in China in 2019. It can be seen from the national Moran Scatter Map that Beijing, Shanghai, Tianjin, Zhejiang, and Shandong are located in HH District, while Shanxi, Shaanxi, Hubei, and Henan are located in LL District. This shows that these provinces are surrounded by regions with the same level of service industry development. There is obvious regional heterogeneity in the development of China’s service industry.
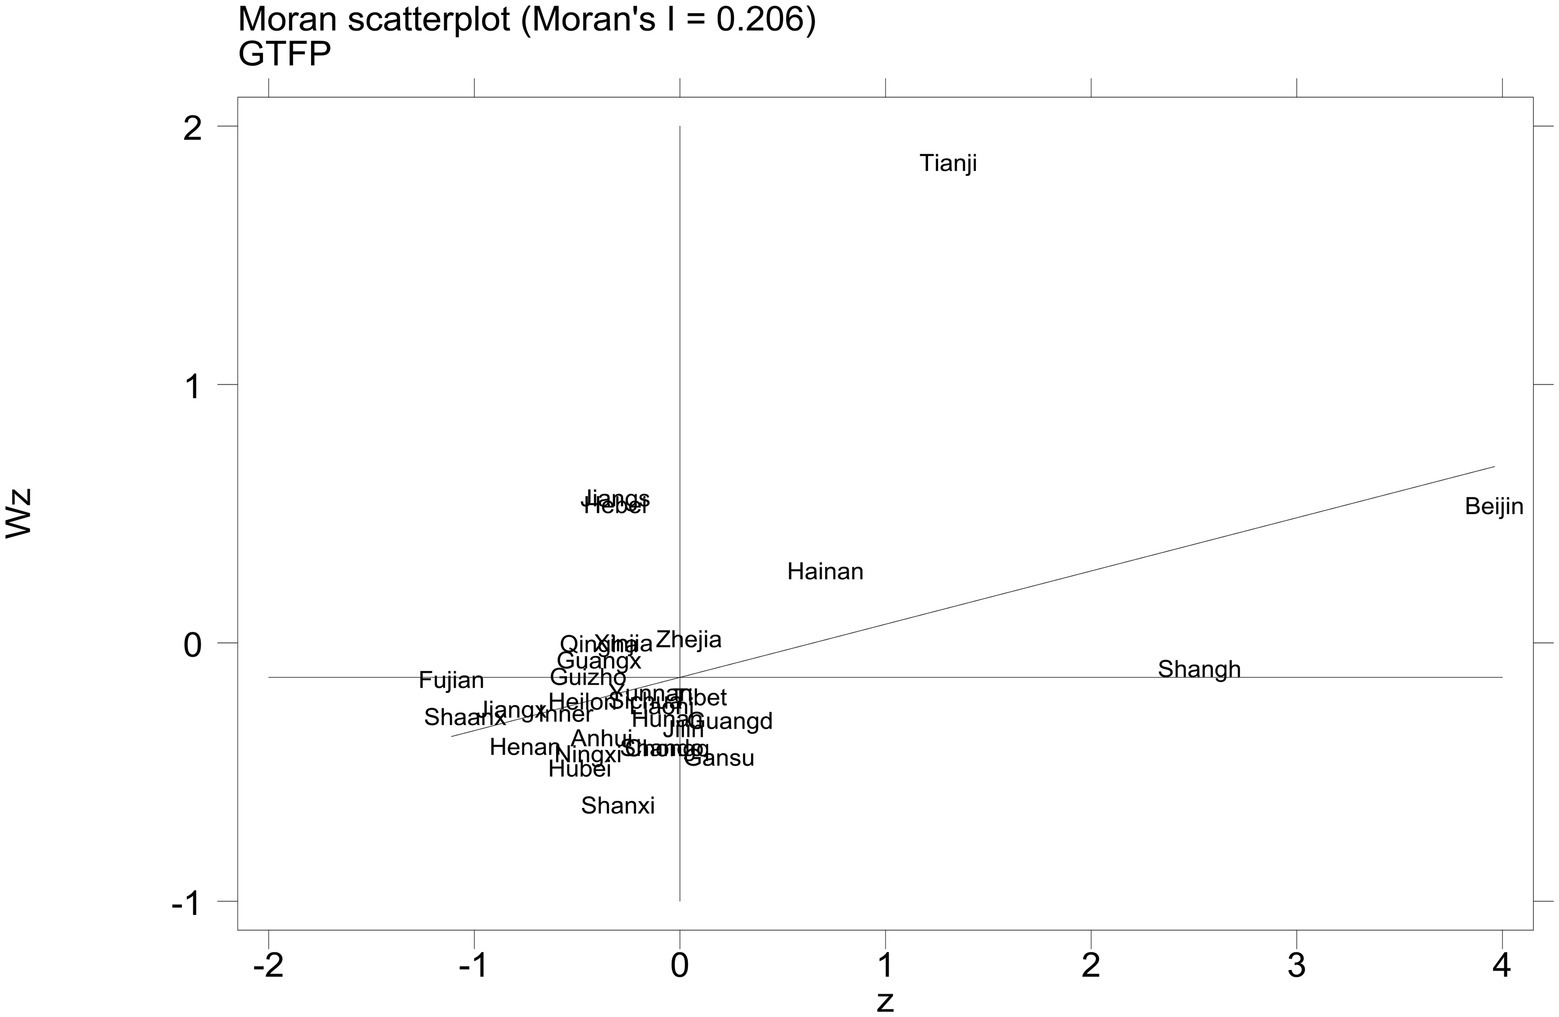
Figure 3. Distribution of Moran index in 31 provinces and cities.
Figure 4 is the Moran Scatter of the GTFP of the service industry in the northern region in 2019. It can be seen from the figure that Beijing, and Tianjin in the northern region were in the HH region with a high level of service industry development in 2017. These provinces have a high level of service industry development and are surrounded by regions with a high level of service industry development; However, Shaanxi, Gansu, Xinjiang, Qinghai, and other regions are located in the LL area, which means that the development level of their service industry is low, and the development level of the surrounding regions is also low. It can be seen from the 2019 Moran Scatter Map that many provinces in the northern region are located in LL District.
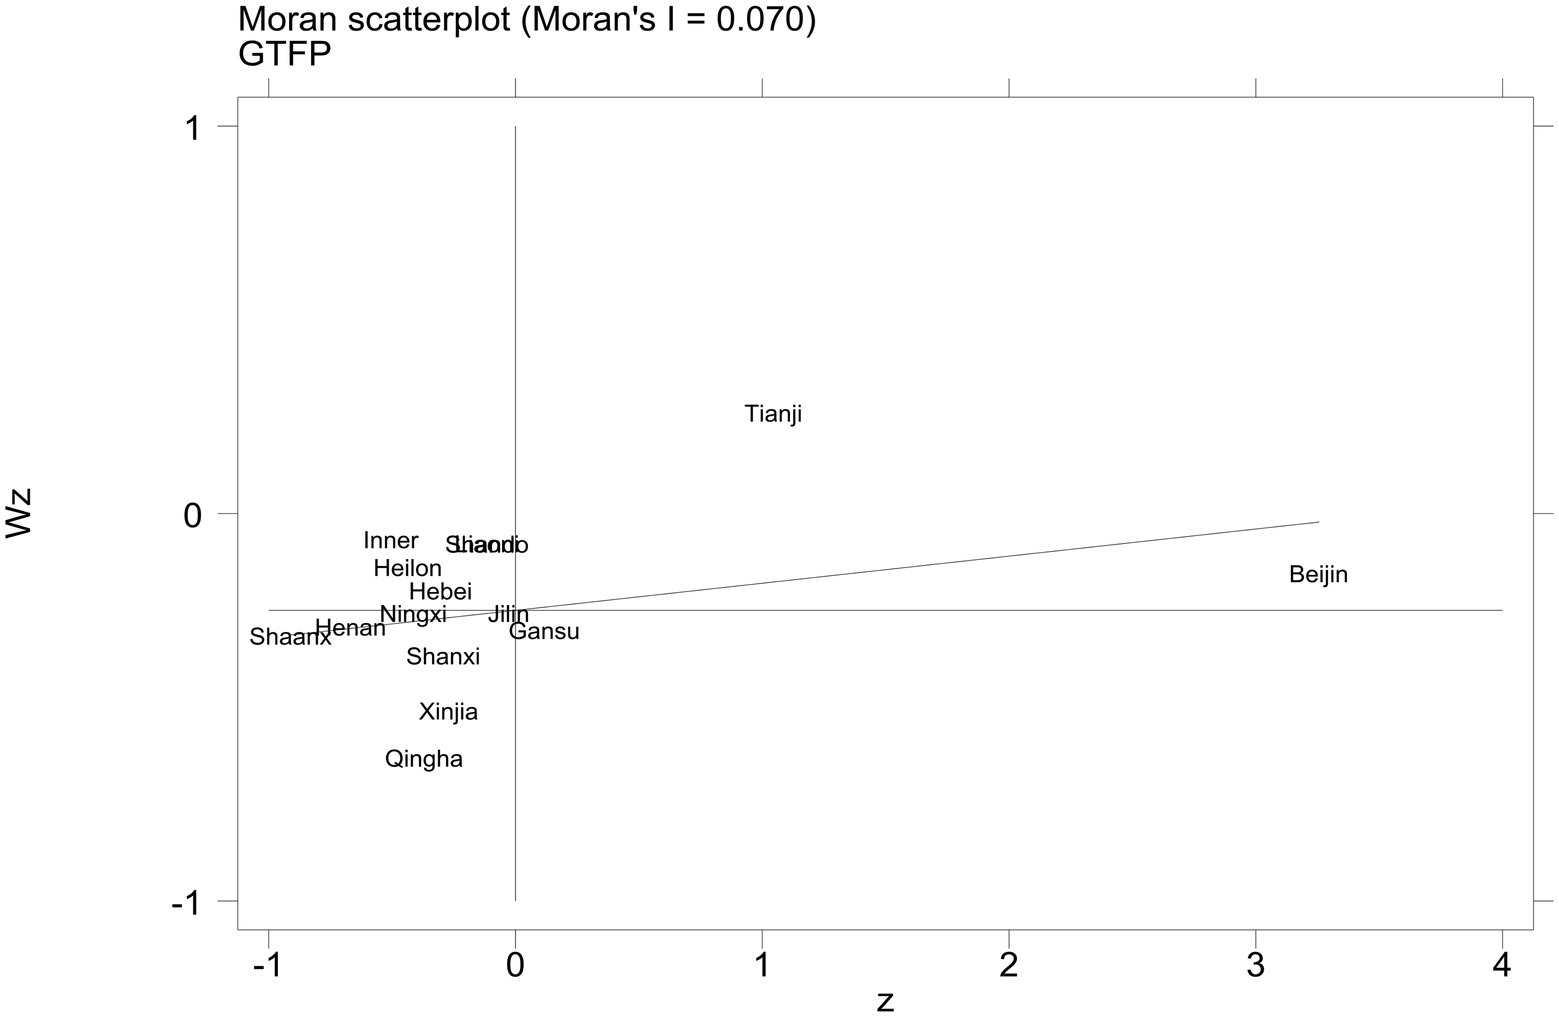
Figure 4. Distribution of the Moran index in northern China.
While Figure 5 is the Moran Scatter of the GTFP of the service industry in the southern region in 2019. It can be seen that Anhui, Chongqing, Jiangxi, Hainan, and Hubei are located in HH District in the southern region. These provinces in the southern region are located in areas with high service industry development levels and were surrounded by high levels. Zhejiang, Shanghai, Fujian, and Guangdong are located in the LL district. The green development in these provinces is at a low level, and these provinces are surrounded by low green development areas.
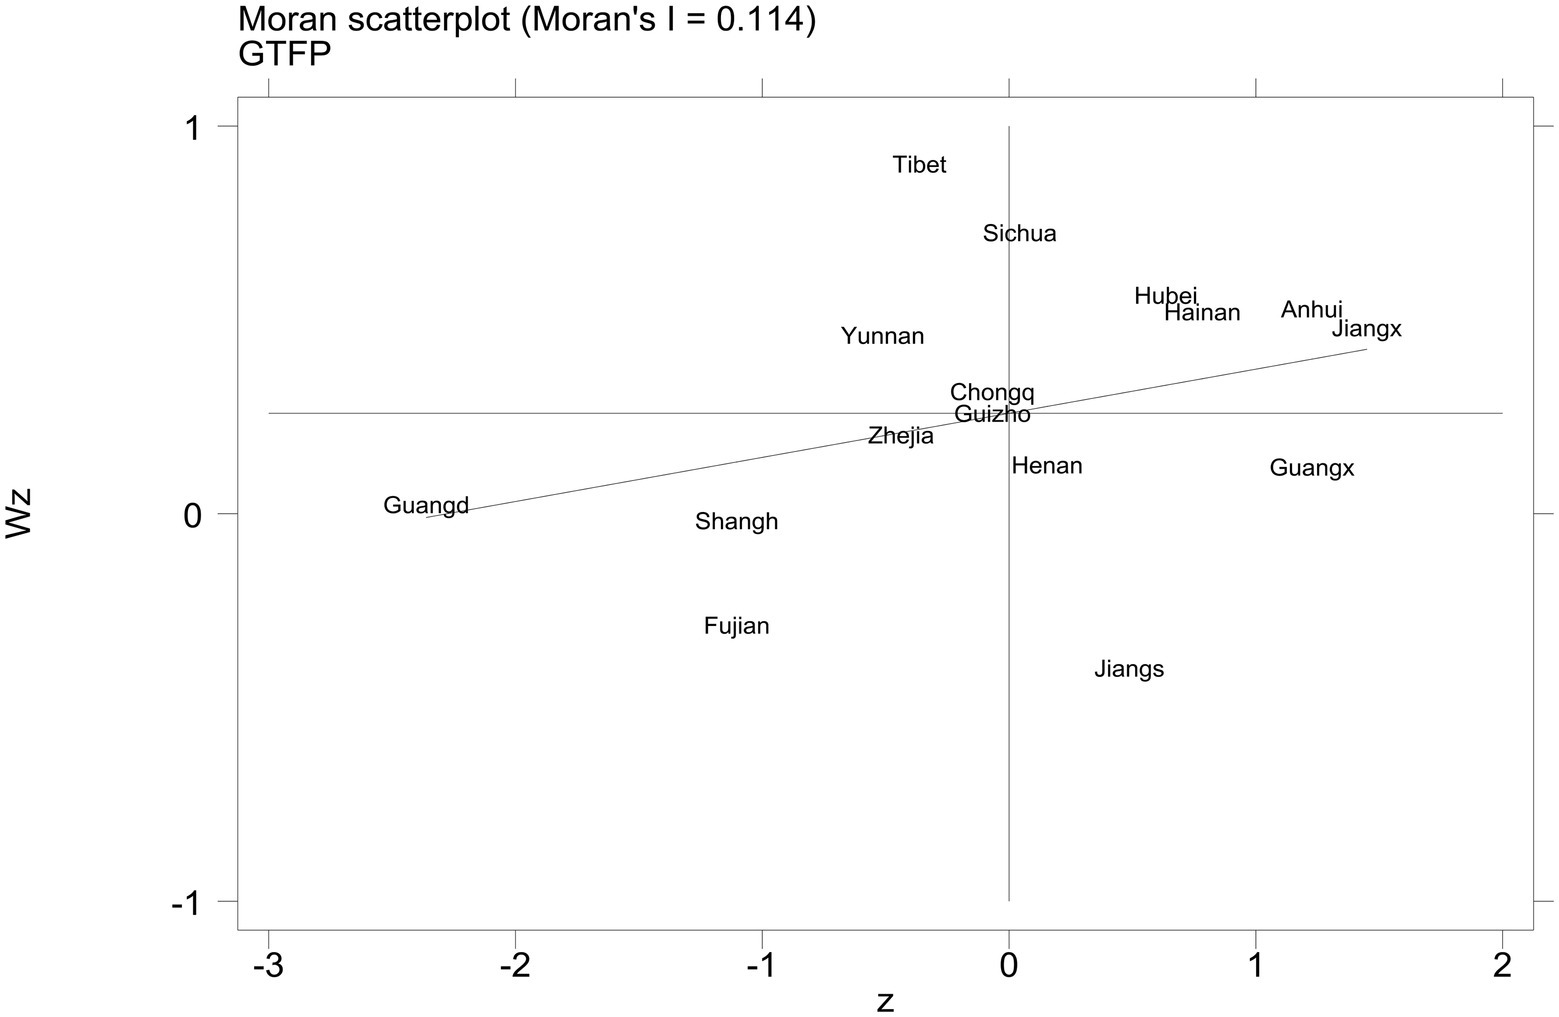
Figure 5. Distribution of Moran index in southern China.
It can be seen from the above results that there is a significant spatial correlation between service industry green development levels in different regions of China. The geographic spatial effect of service industry development plays an important role in regional service industry development, and how big is the spatial impact? Further empirical testing through econometric analysis is required.
5.2. Spatial econometric regression analysis of the green development of the service industry
According to the spatial autocorrelation test, the Moran value of the green total factor productivity of the tertiary industry in each province is significantly positive at the level of 10%, indicating that there is a significant spatial autocorrelation in the green development level of the service industry, and the spatial econometric model should be used. In the economic matrix, the model passes the likelihood ratio test and Wald test. The results show that the LM error values are 44.32 and 59.65, respectively, and the wald test values are 40.92 and 38.15, which are significant at the 1% level. Therefore, it is more appropriate to use the spatial Durbin model (SDM) to reject the spatial autoregressive model SAR and the spatial error model sem. In the distance matrix and adjacency matrix tests, the original hypothesis is also significantly rejected, indicating that the spatial Durbin model (SDM) should be selected for analysis. Therefore, this paper will analyze the influencing factors of the service industry’s green development level based on the spatial Durbin model. In all models, this paper controls the space effect and time effect to control the influence of two types of unobservable factors that change with time but not with provinces and that change with provinces but not with time. In Table 5, columns (2)–(3) show the estimation results of the spatial Durbin model with the adjacency matrix as the spatial matrix, and columns (4)–(5) show the regression results of the spatial Durbin model with the distance matrix as the spatial matrix. (6)–(7) List the estimation results of the spatial Durbin model with the economic matrix as the spatial matrix.
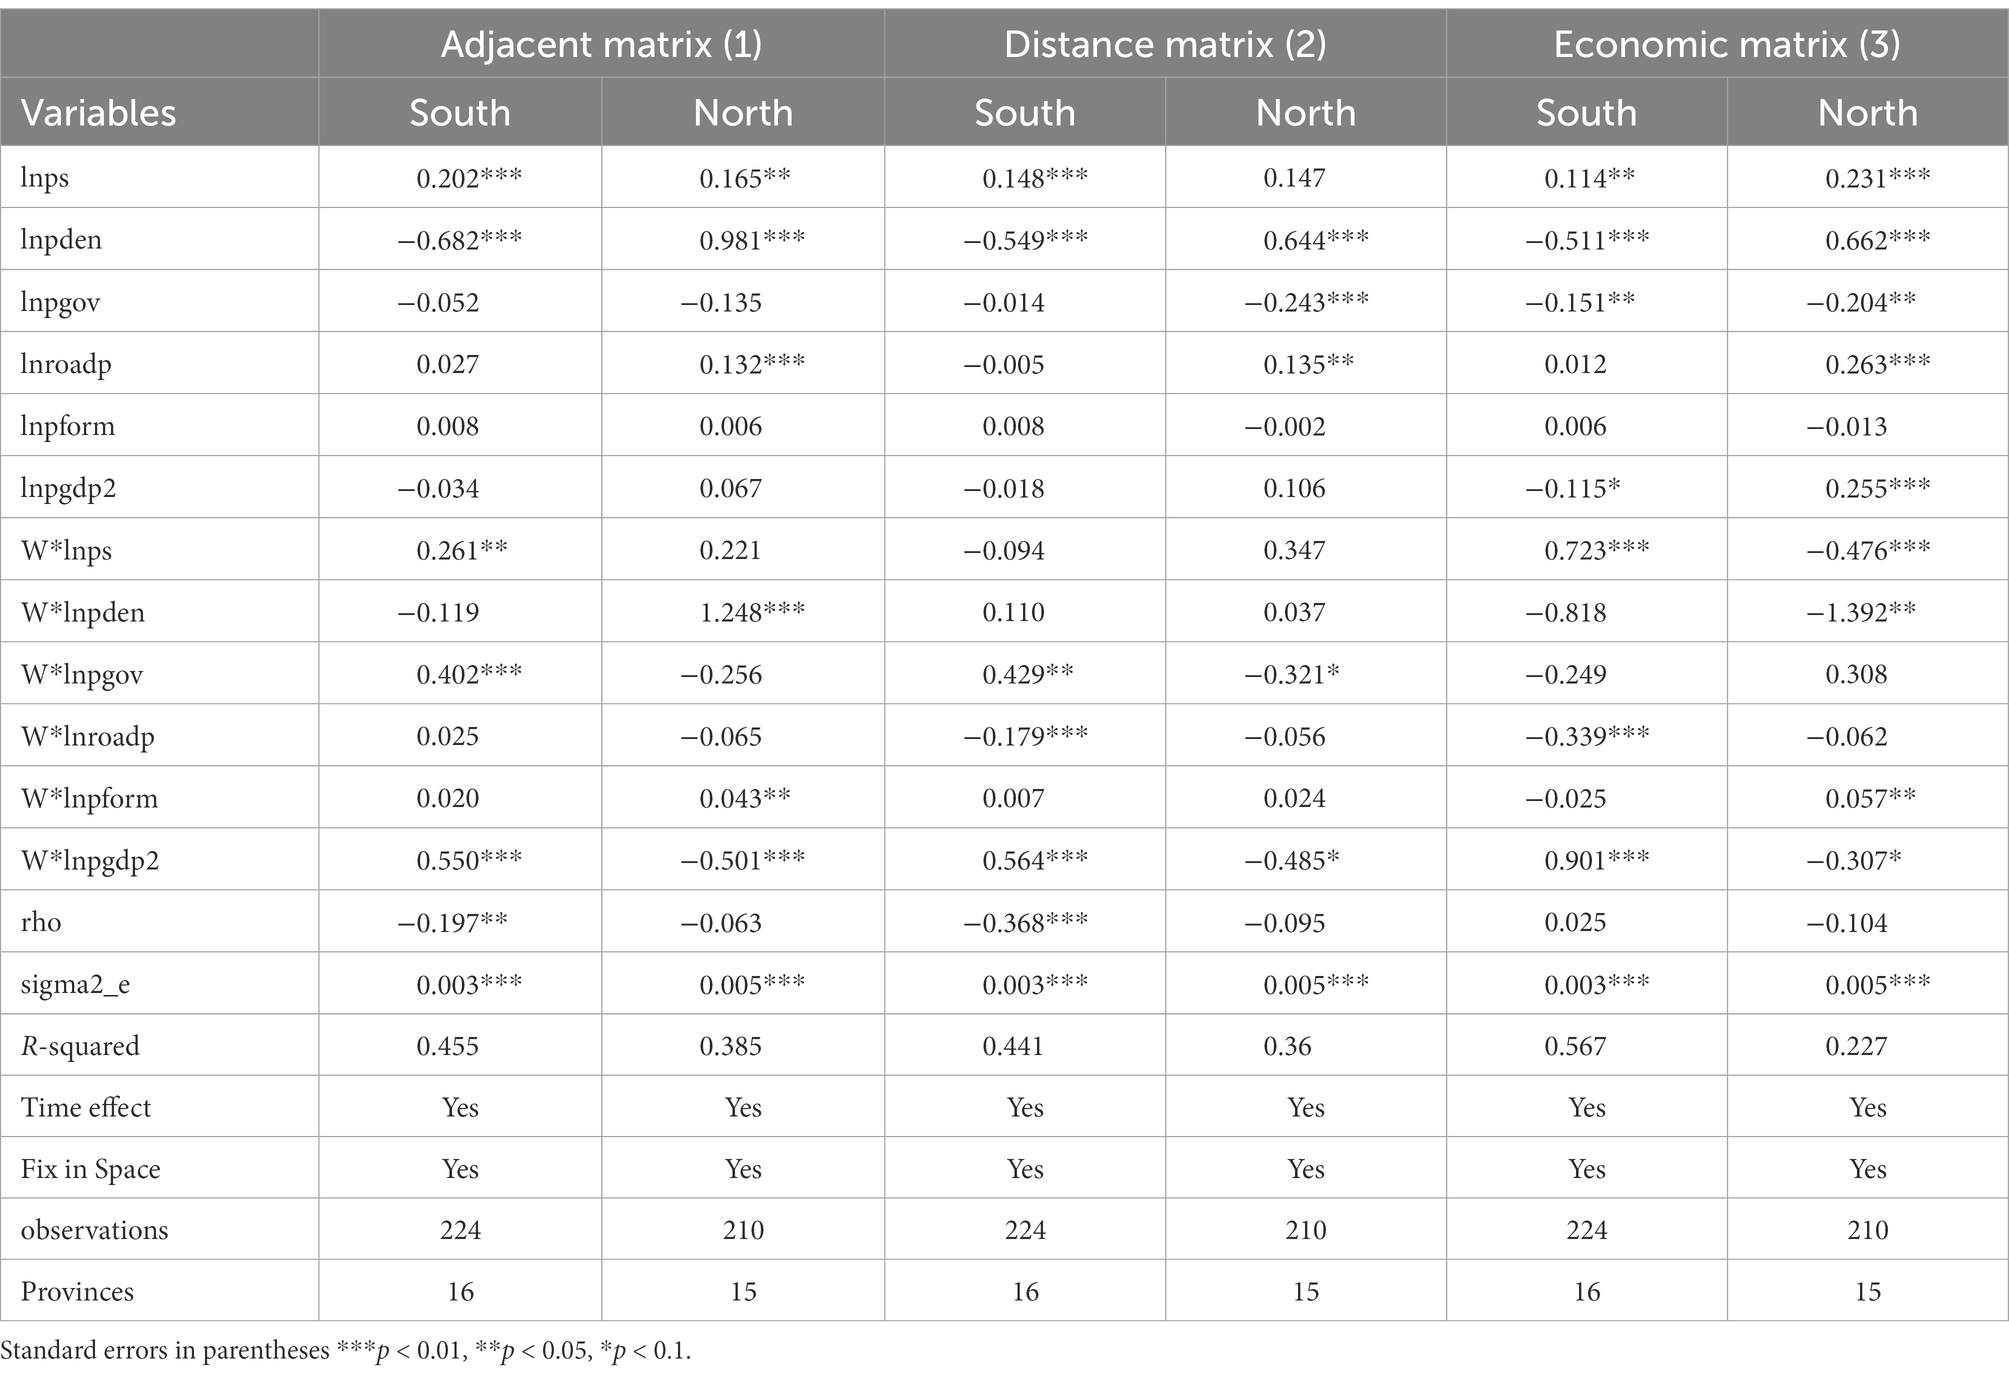
Table 5. Spatial econometric regression results.
The results in Table 5 show the contribution of various factors to the green total factor productivity of the tertiary industry. As mentioned above, the variables lnps, lnpden, lnpgov, lnroadp, lnpform, and lnpgdp2 represent the relative density of producer services, population density, the proportion of financial expenditure, infrastructure, openness, and the proportion of the added value of the secondary industry; W stands for spatial weight matrix. The estimation results of the spatial Durbin model show that when the adjacency matrix, economic matrix, and distance matrix are used as the weight matrix, the elasticity coefficient of the location entropy of producer services is significantly positive, which indicates that the impact of the concentration level of producer services on the green total factor productivity of the tertiary industry is significantly positive. Therefore, it is of great significance to improve the proportion of producer services and promote the upgrading of the internal structure of the service industry to promote the high-quality development of China’s service industry. From the perspective of the southern region, the elastic regression coefficient of population density is significantly negative, indicating that the impact of population density on the development of the service industry in the south is significantly negative. This is due to the relatively low demand for human capital in the service industry in the south, which is mainly driven by technological progress. This corresponds to the decomposition of the green total factor productivity of the service industry.
The technological progress of the service industry in the south is far higher than that in the north, so the demand for human capital is low. The population density has a significant role in promoting the green development of the service industry in the northern region, indicating that the service industry in the northern region is mainly labor-intensive, with a high demand for human capital and a low level of technology, which is consistent with the decomposition of total factor productivity. The higher the proportion of fiscal expenditure, the more restrained the development of the service industry. This shows that the increase in fiscal expenditure will crowd out the level of private investment, thereby reducing the green development level of the service industry. Transportation infrastructure plays a positive role in promoting the green development of the service industry in the north and south regions, indicating that the more convenient transportation is, the more conducive to the flow of personnel and technical elements, and thus can improve the development level of the service industry. The regression coefficient of the proportion of the added value of the secondary industry in the southern region is negative, while in the northern region it is positive. Only the economic matrix is used as the weight matrix and is significant at the 10% confidence level, indicating that the development of the secondary industry has a restraining effect on the development of the service industry in the south, but a promoting effect on the development of the service industry in the north. This corresponds to reality. The proportion of secondary industry in the north is relatively high, and the green service development level is relatively low. The proportion of the secondary industry in the south is low, and the service industry development level is high. From the perspective of the spatial spillover effect, when the adjacency matrix and economic matrix are used as weights, the intensity of producer services in neighboring provinces in the south has a significant role in promoting the green development of the tertiary industry. The higher the proportion of the secondary industry in the GDP of neighboring provinces, the more positive role in promoting the service industry of the province. This shows that the higher the density of producer services in neighboring provinces, the higher the proportion of the development of the secondary industry, The closer the connection between the province and the surrounding provinces is, the more technology spillovers, knowledge exchanges and human capital flows between the provinces are generated, thus driving the green development of the service industry of the province. For the northern region, when the secondary industry development level of neighboring provinces is high, it will significantly inhibit the service industry development level of the province, because the service industry in the northern region is significantly affected by the population density. When the secondary industry in the surrounding provinces develops well, it will cause the outflow of human capital itself, thereby reducing the population density of the province, and inhibiting the service industry development of the province.
5.3. Robustness test
The per capita GDP of the tertiary industry of the province is taken as a measure of the development level of the province’s service industry for spatial econometric analysis. The regression results are shown in Table 6. From the regression results, it can be seen that under the three spatial matrices, the elasticity coefficient of the relative density of producer services is significantly positive, indicating that the development level of producer services can significantly improve the per capita GDP of the tertiary industry and promote the development of regional services. The elasticity coefficient of population density is significantly negative, indicating that the higher the population density, the lower the per capita GDP of the tertiary industry. The elasticity coefficient of fiscal expenditure is negative, which indicates that fiscal expenditure plays a role in crowding out private investment, leading to the reduction of per capita GDP in the tertiary industry. The level of infrastructure development and opening up has a positive role in promoting per capita GDP. The proportion of secondary industry in the southern region has a restraining effect and a promoting effect on the northern region. From the perspective of the spatial spillover effect, the regression results are consistent with the above. The proportion of secondary industry in surrounding provinces has a significant role in promoting the development of the service industry in the south, while it still has a significant role in inhibiting the development of the service industry in the north. The intensity of producer services in neighboring provinces still plays a significant role in promoting the development of the tertiary industry in southern China.
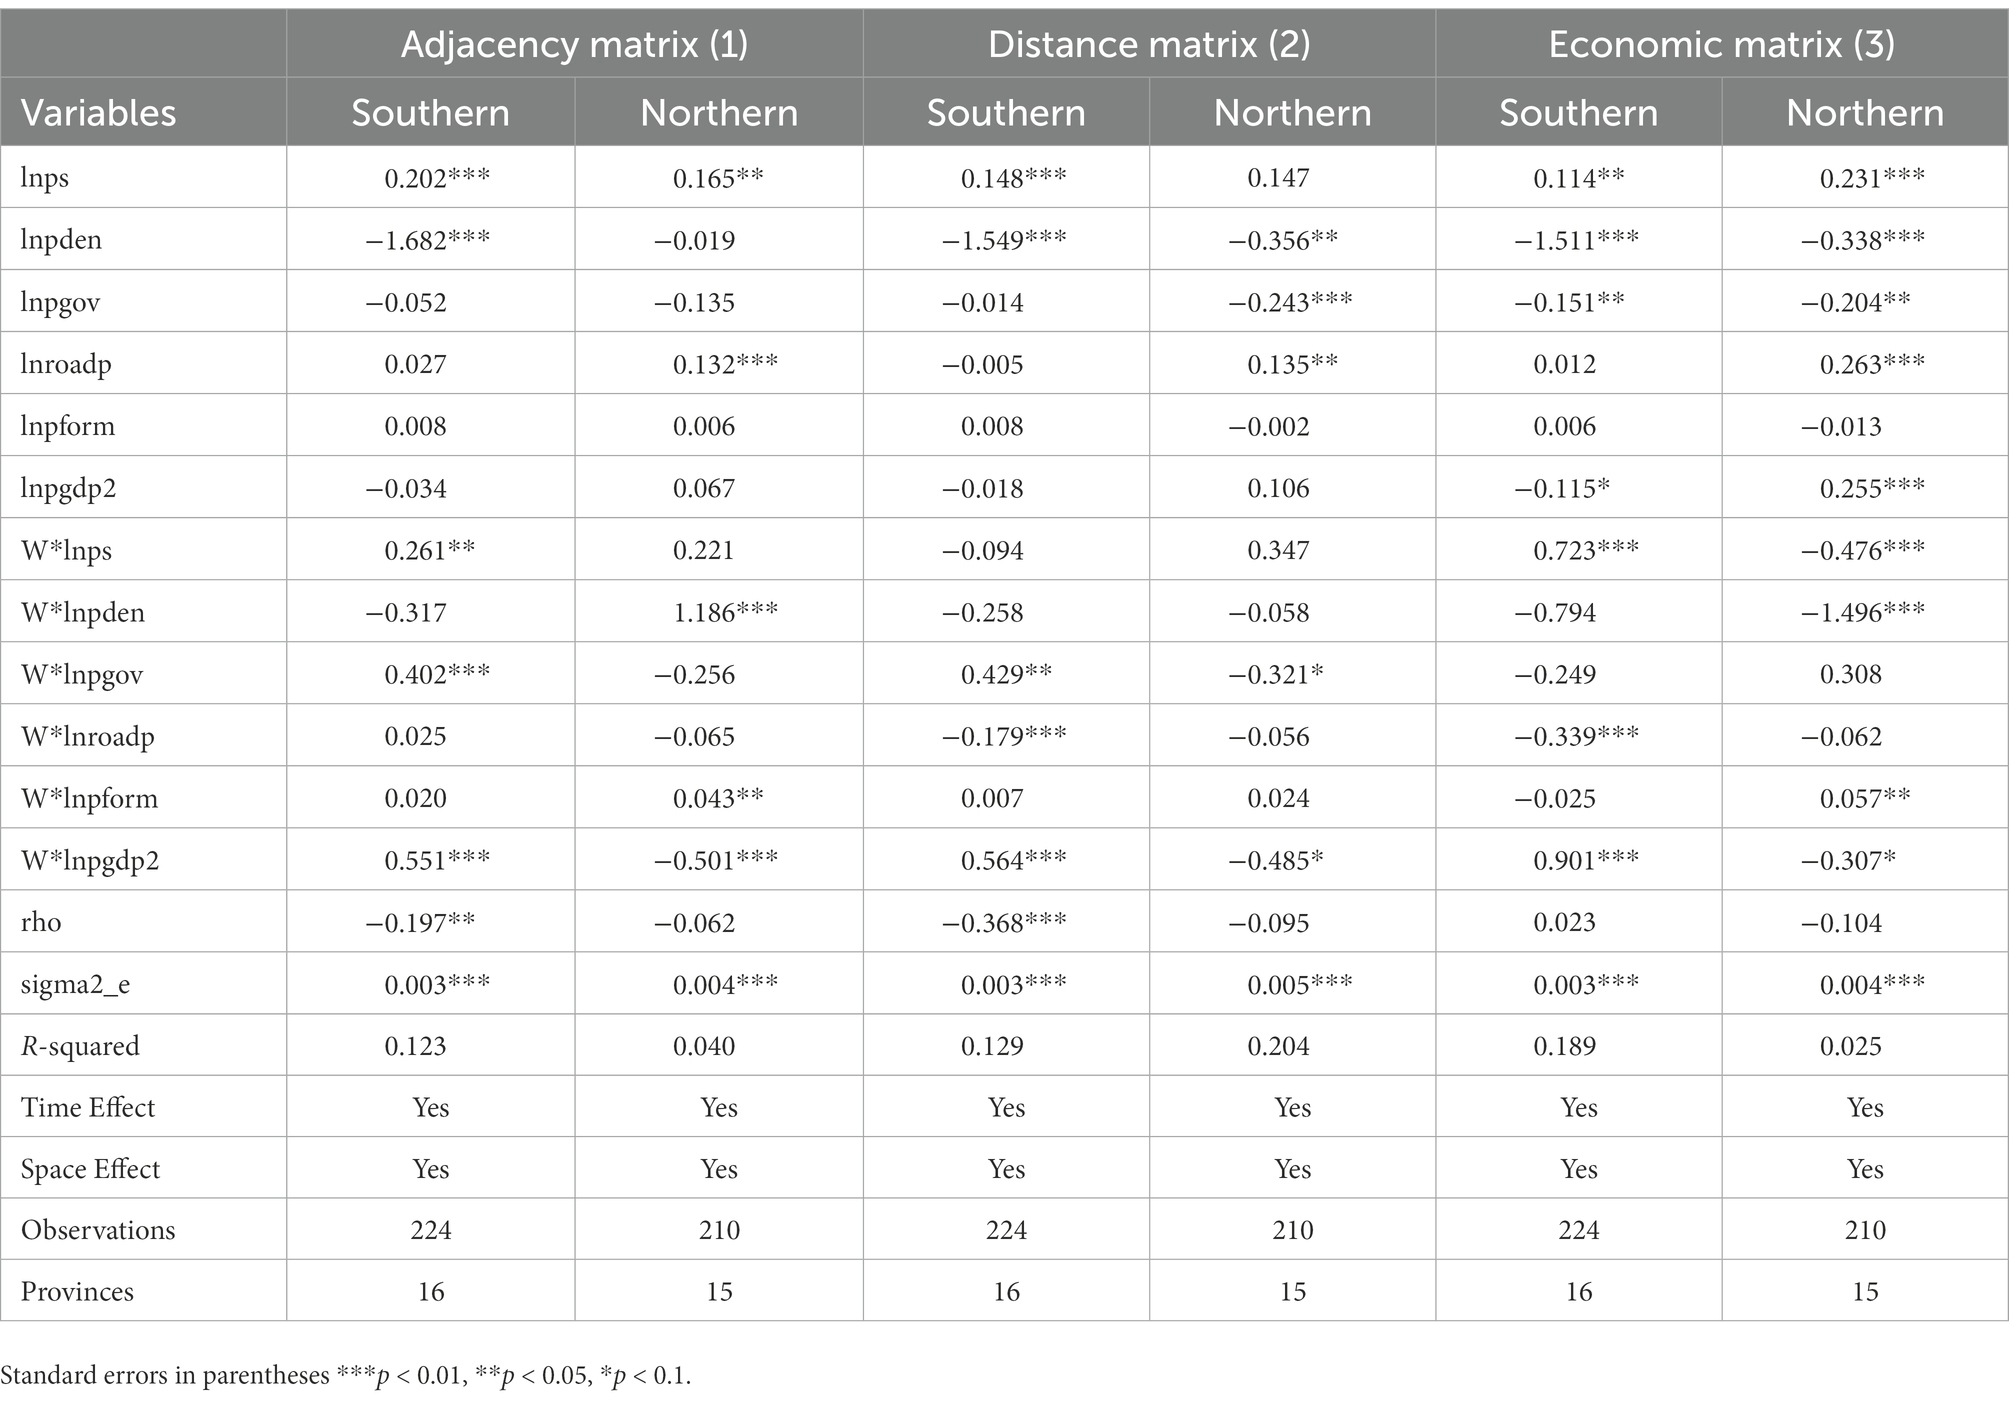
Table 6. Spatial regression results of per capita GDP of the tertiary industry in north and south China.
6. Conclusion and enlightenment
In recent years, the difference in economic development between the North and the South has become the focus of scholars’ research, and the proportion of the service industry in the economy has been rising, so it is particularly important to study the green development of service industry in the North and the South. Taking the Huaihe River Line of the Qinling Mountains as the dividing line, this paper divides 31 provinces and cities in China into two parts: the north and the south. With the increase of the opening up of each province, the free mobility of products and factors in different regions has increased. The development of the service industry in each province depends not only on the growth of capital, labor, and technology input in the province but also on the economic development of its neighboring regions to a large extent. Therefore, the north–south differences in service industry development and their influencing factors must be analyzed from the perspective of space to be more comprehensive and in-depth.
First of all, this paper uses the DEA Malmquist index method to measure the green total factor productivity of the service industry in 31 provinces and cities of China and the north and south regions from 2003 to 2019. The results show that the green total factor productivity in the south is higher than that in the north, the technical efficiency of the service industry in the north is higher than that in the south, and the pure technical efficiency and scale efficiency are both higher than those in the south. This shows that the service industry in the north has begun to take shape, but the level of technological progress is low, which leads to lower productivity of the service industry in the north than that in the south. Therefore, the northern region should improve the technical level, while the southern region should focus on forming the scale effect and output effect of the service industry. Secondly, this paper uses the Moran index method to measure the spatial distribution pattern and characteristics of the GTFP of the service industry in 31 provinces and cities of China and the northern and southern regions from 2003 to 2019. The results show that there is a significant positive correlation between the tertiary industry in the northern and southern regions, indicating that regions with high service industry development levels are surrounded by high-level regions. Low areas were surrounded by low areas. Finally, this paper uses the spatial Durbin model to measure the green total factor productivity of the tertiary industry and GDP per capita in 31 provinces, to reveal the influencing factors of the service industry in the north and south regions. The results show that the concentration level of producer services will significantly promote the green development of service industries in the North and South regions; Population density will significantly promote the development of the service industry in the north, while it will inhibit the green development of the service industry in the south. Infrastructure construction and opening up can significantly improve the development level of the service industry.
The green development of the service industry in Southern China is higher than that in Northern China. The main reason for the low level of green development of the service industry in the northern region is the low technical level of the service industry, so the north should improve the technical level of the service industry and constantly catch up with the service industry in the south. The impact of the producer service industry concentration level on the green development of the service industry not only has a “local” effect but also has a significant spatial spillover effect. It will significantly promote the green development of the service industry in and around the region. The gathering of producer services brings economies of scale, promotes the exchange of production resources and talents, drives service enterprises to obtain resources, and reduces transaction costs. The higher the concentration level of producer services, the higher the proportion of high value-added and low energy consumption sub-sectors. Increasing the agglomeration level of producer services will reduce the energy consumption of the service industry and promote the green development of the service industry.
The green total factor productivity in the southern region is significantly higher than in the northern region. The proportion of the service industry in the north has surpassed that in the south since 2015, and is close to 55%, which is still far lower than the proportion of 70% in developed countries. This shows that the proportion of the service industry in China is low, and the service industry still has great room for growth. It can be seen from the green total factor productivity of the service industry and its decomposition indicators that the service industry in the north has higher technical efficiency, higher pure technical efficiency, and scale efficiency than that in the south, but lower technological progress; From the influencing factors of the service industry, we can see that the north and south regions should increase the opening up and increase infrastructure construction to promote the green development of the service industry. The northern region should carry out technological innovation in the service industry, increase the proportion of productive services, and give full play to technological advantages. The southern region should fully improve the technical efficiency of the service industry, and form the scale economy of the service industry. At the same time, it should give full play to the spatial spillover effect, improve the efficiency of resource allocation, and jointly promote the high-quality development of the service industry.
Data availability statement
The original contributions presented in the study are included in the article/supplementary material, further inquiries can be directed to the corresponding author/s.
Author contributions
BC was responsible for the designing of the paper and responsible for the modification of the paper. XX was responsible for the writing and submission of the paper and responsible for the data collection of the paper. All authors contributed to the article and approved the submitted version.
Funding
The National Social Science Foundation’s Major Program” Research on the Design and Path Selection of New and Old Kinetic Energy Conversion Mechanism” (approval no. 18ZDA077). Shandong Social Science Planning and Research Project “Research on Enabling Effect and Improvement of Industrial Internet Platform” (approval no. 21CGJ17). Scientific Research Planning for Higher Education “Research on the path and Countermeasures of green development of ‘the Belt and Road’ under the goal of ‘double carbon’” (approval no. 22DL0301). High-level scientific research project cultivation fund project” Research on the high-quality economic development of Shandong province under the background of the digital economy” (approval no. 2022GSPSJ07).
Conflict of interest
The authors declare that the research was conducted in the absence of any commercial or financial relationships that could be construed as a potential conflict of interest.
Publisher’s note
All claims expressed in this article are solely those of the authors and do not necessarily represent those of their affiliated organizations, or those of the publisher, the editors and the reviewers. Any product that may be evaluated in this article, or claim that may be made by its manufacturer, is not guaranteed or endorsed by the publisher.
References
Camilla, J. (2002). Foreign direct investment, industrial restructuring, and the upgrading of polish exports. Appl. Econ. 34, 207–217. doi: 10.1080/00036840010025641
Chen, J., Chen, G., and Huang, J. (2009). Research on the cluster of productive services and its influencing factors from the perspective of new economic geography - empirical evidence from 222 Chinese cities. Manage. World 4, 83–95. doi: 10.19744/j.cnki.11-1235/f.2009.04.010
Chen, J., and Sheng, Y. (2009). Empirical research on FDI and China’s industrial restructuring - based on the perspective of capital supply and knowledge spillover. Int. Trade Issues. 1, 94–100.
Chen, B., Xu, X., Zhang, Y., and Wang, J. (2022). The temporal and spatial patterns and contributing factors of green development in the Chinese service industry. Front. Environ. Sci. 10:1049827. doi: 10.3389/fenvs.2022.1049827
Cheng, D. (2003). Growth and technological Progress of China’s service industry. World Econ. 7, 35–42.
Cheng, D., and Chen, F. (2005). Relative intensity of China’s service industry and its impact on labor productivity. Manage. World 2, 77–84. doi: 10.19744/j.cnki.11-1235/f.2005.02.009
Cui, M., and Wei, X. (2015). Productivity change and heterogeneity of internal structure in service industries. Res. Quant. Econ. Techn. Econ. 32, 3–21. doi: 10.13653/j.cnki.jqte.2015.04.001
Cui, M., and Zhao, Z. (2018). Research on TFP heterogeneity and its effect on regional service industry development gap. Quant. Econ. Tech. Econ. Res. 35, 59–78. doi: 10.13653/j.cnki.jqte.2018.07.004
Deng, Y. (2009). Evolution, mechanism and enlightenment of the internal structure of the service industry in the post industrialization period in developed countries. Acad. Res. 9, 62–71.
Drucker, J., and Feser, E. (2012). Regional industrial structure and agglomeration economies: an analysis of productivity in three manufacturing industries. Reg. Sci. Urban Econ. 42, 1–14. doi: 10.1016/j.regsciurbeco.2011.04.006
Gao, D., Li, Y., and Li, G. (2022b). Boosting the green total factor energy efficiency in urban China: does low-carbon city policy matter? Environ. Sci. Pollut. Res. 29, 56341–56356. doi: 10.1007/s11356-022-19553-9
Gao, D., Li, G., Li, Y., and Gao, K. (2021). Does FDI improve green total factor energy efficiency under heterogeneous environmental regulation? Evidence from China. Environ. Sci. Pollut. Res. 29, 25665–25678. doi: 10.1007/s11356-021-17771-1
Gao, D., Li, G., Yu, J., Lund, H., and Kaiser, M. J. (2022a). Does digitization improve green total factor energy efficiency? Evidence from Chinese 213 cities. Energy 247:123395. doi: 10.1016/j.energy.2022.123395
Gu, N. (2008). Efficiency characteristics and influencing factors of China’s service industry development - empirical research based on DEA method. Finance Trade Econ. 4, 60–67. doi: 10.19337/j.cnki.34-1093/f.2008.04.010
Gu, N., and Li, J. (2006). Empirical analysis of regional differences in technical efficiency of China’s service industry. Econ. Res. 1, 46–56.
Guo, K. (1992). Analysis of the growth factors and changing characteristics of the three industries. Econ. Res. 2, 51–61.
Harberger, A. (1978). Perspectives on capital and technology in less developed countries. Contemp. Econ. Anal. 69–151.
Jiang, X., and Li, H. (2004). Service industry and China’s economy: relevance and the potential to accelerate growth. Econ. Res. 1, 4–15.
Lee, J. W., and Hong, K. (2012). Economic growth in Asia: determinants and prospects. Japan World Econ. 24, 101–113.
Li, J. (1994). Industrial nature, assessment basis and measurement indicators of the tertiary industry. J. South China Normal Univ. (Soc. Sci. Ed.) 3:1-9+13-124.
Li, P., Fu, Y., and Zhang, Y. (2017). Can productive services become a new driving force for high-quality growth of China’s economy? China Ind. Econ. 12, 5–21. doi: 10.19581/j.cnki.ciejournal.20171214.005
Li, H., and Wang, H. (2007). Structural evolution, spatial layout and service industry development - empirical research from the Yangtze River Delta. Fudan J. (Soc. Sc. Ed.) 5, 59–66.
Liang, H. (2018). Distribution dynamics, differential decomposition and convergence of productive Services in China’s urban agglomerations. Res. Quant. Econ. Tech. Econ. 35, 40–60. doi: 10.13653/j.cnki.jqte.2018.12.003
Liu, Y. B., Yang, L. G., and Feng, Y. D. (2018). Spatial sillover and threshold caracteristics of production cluster emission reduction effect. Math. Stat. Mgmt. 2, 224–234. doi: 10.13860/j.cnki.sltj.20171131-003
Mahadevan, R. (2000). Sources of output growth in Singapore’s service sector. Empir. Econ. 25, 495–506. doi: 10.1007/s001810000029
O’Donoghue, D., and Gleave, B. (2004). A note on methods for measuring industrial agglomeration. Reg. Stud. 38, 419–427. doi: 10.1080/03434002000213932
Shen, Y., Qiu, L., Ren, W., and Shang, Y. (2007). Influencing factors and spatial differentiation characteristics of spatial differences in China’s service industry. Geogr. Res. 6, 1255–1264.
Sheng, L., and Lu, G. (2013). Research on China’s producer services agglomeration and its influencing factors - based on industry and regional level analysis. Nankai Econ. Res. 5, 115–129. doi: 10.14116/j.nkes.2013.05.009
Su, Z. F., Hu, R. D., and Lin, S. Q. (2009). Spatial econometric analysis of the Kuznets relationship between environmental quality and economic growth. Geogr. Res. 2, 303–310.
Sun, X., Liu, X., and Zhai, Y. (2017). Measurement and application of regional industrial structure excellence. Stat. Res. 34, 48–62. doi: 10.19343/j.cnki.11-1302/c.2017.12.005
Tan, H., and Zheng, J. (2012). The mystery of the coexistence of high economic growth and lagging service industry in China -- a study based on sector Total factor productivity. China Ind. Econ. 2012, 5–17. doi: 10.19581/j.cnki.ciejournal.2012.09.001
Wang, S., and Hu, Z. (2012). A survey of productivity changes and heterogeneity in China’s service industries. Econ. Res. 47, 15–27.
Wang, S., Teng, Z. W., and Liu, J. (2015). Analysis of the difference of productivity changes in China’s service industry -- based on regional and industrial perspectives. Econ. Res. 50, 73–84.
Wang, X., Wang, S., and Teng, Z. (2020). Research on spatial convergence of carbon productivity in China’s service industry. China Popul. Resour. Environ. 30, 70–79.
Wei, Z. (2006). The impact of FDI on the evolution of China’s three industrial structures -- also on the low proportion of added value in China’s service industry. De Economist 3, 61–67.
Xia, J., Xiao, Y., and Li, S. (2019). Re measurement of Total factor productivity in China’s service industry and analysis of influencing factors. Acad. Mon. 51:34-43+56. doi: 10.19862/j.cnki.xsyk.2019.02.003
Yang, R. (2013). Industrial agglomeration and regional wage gap - empirical research based on 269 cities in China. Manage. World 8, 41–52. doi: 10.19744/j.cnki.11-1235/f.2013.08.005
Yang, Q., Gao, D., and Li, Y. (2021). Environmental regulation, pollution reduction and green innovation: the case of the Chinese water ecological civilization City pilot policy. Econ. Syst. 45:100911. doi: 10.1016/j.ecosys.2021.100911
Yang, X., and Xu, X. (2006). Empirical analysis of Total factor productivity growth in China’s service industry. Econ. Res. 3, 68–76.
Yin, F. (2006). China’s service industry utilizes foreign direct investment: analysis of current situation. Problems and influencing factors. World Econ. Res. 1, 4–10.
Yin, F., and Chen, X. (2009). Research on the influencing factors of international service trade and the international competitiveness of China’s service trade. Int. Trade Issues. 2, 61–69.
Yu, Y., and Pan, Y. (2019). The mystery of the coexistence of China’s high economic growth and the lagging upgrading of the Ser-vice industry structure - an interpretation based on the constraint of local economic growth goals. Econ. Res. 54, 150–165.
Yuan, Y., and Guo, R. (2018). Productive service industry agglomeration, manufacturing industry agglomeration, and technological innovation empirical research based on provincial panel data. De Economist 5, 23–31. doi: 10.16158/j.cnki.51-1312/f.2018.05.005
Yuan, Y., Liu, H., and Bai, N. (2009). Measurement of Total factor productivity in China’s productive services industry -- research based on the method of nonparametric Malmquist index. China Soft Sci. 1, 159–167.
Zhang, Y., and Chen, B. (2018). Industrial structure, spatial spillover and urban-rural income gap - decomposition of partial differential effect based on spatial Durbin model. Econ. Issues Explor. 9, 62–71.
Zhang, P., and Yu, Y. (2012). Does export trade affect the proportion of China’s service industry. Res. Quant. Econ. Technol. Econ. 29, 64–79. doi: 10.13653/j.cnki.jqte.2012.04.008
Zhang, J., and Zheng, F. (2020). Can the structural upgrading of the service industry promote industrial development? - empirical analysis based on the effective structural change index (ESC). Reformation 1, 59–75.
Zhong, Y., Lu, M., and Xi, X. (2020). Agglomeration and service industry development: a perspective based on the spatial distribution of population. Manage. World 36, 35–49. doi: 10.19744/j.cnki.11-1235/f.2020.0167
Keywords: north–south economic gap, green total factor productivity, location entropy, spillover effect, Moran index
Citation: Chen B and Xu X (2023) The north–south gap and spillover effect of Chinese service industry green development. Front. Ecol. Evol. 10:1094646. doi: 10.3389/fevo.2022.1094646
Edited by:
Huwei Wen, Nanchang University, ChinaReviewed by:
Qiming Zhong, Zhongnan University of Economics and Law, ChinaDa Gao, Wuhan Institute of Technology, China
Changyong Wen, Nanchang University, China
Copyright © 2023 Chen and Xu. This is an open-access article distributed under the terms of the Creative Commons Attribution License (CC BY). The use, distribution or reproduction in other forums is permitted, provided the original author(s) and the copyright owner(s) are credited and that the original publication in this journal is cited, in accordance with accepted academic practice. No use, distribution or reproduction is permitted which does not comply with these terms.
*Correspondence: Xiaotong Xu, ✉ eHV4aWFvdG9uZzg4QDEyNi5jb20=