 Angelina G. Perrotti
 Tanjona Ramiadantsoa3,4
 Jennifer O’Keefe
 Noelia Nuñez Otaño
- 1Department of Earth, Environmental, and Planetary Sciences, Brown University, Providence, RI, United States
- 2Department of Geography, University of Wisconsin-Madison, Madison, WI, United States
- 3Department of Integrative Biology, University of Wisconsin-Madison, Madison, WI, United States
- 4Madagascar Biodiversity Center, Antananarivo, Madagascar
- 5Department of Physics, Earth Science, and Space Systems Engineering, Morehead State–University, Morehead, KY, United States
- 6Laboratorio de Geología de Llanuras (FCyT-CICyTTP), Facultad de Ciencia y Tecnología, Universidad Autónoma de Entre Ríos, Diamante, Argentina
The abundance of coprophilous (dung-inhabiting) fungal spores (CFS) in sedimentary records is an increasingly popular proxy for past megaherbivore abundance that is used to study megaherbivore-vegetation interactions, timing of megaherbivore population declines and extinctions, and the introduction of domesticated herbivores. This method often relies on counting CFS alongside pollen and tracers of known concentration such as exotic pollen or synthetic microspherules. Prior work has encouraged reporting CFS abundances as accumulation rates (spores/unit2/year) or concentration (spores/unit3) instead of percentages relative to the total pollen abundance, because CFS percentages can be sensitive to fluctuations in pollen influx. In this work, we quantify the uncertainty associated with estimating concentration values at different total counts and find that high uncertainty is associated with concentration estimates using low to moderate total counts (n = 20 to 200) of individual fungal spore types and tracers. We also demonstrate the effect of varying tracer proportions, and find that larger tracer proportions result in narrower confidence intervals. Finally, the probability of encountering a CFS spore from a specific taxon occurring in moderate concentrations (1,000 spores/unit2) dramatically decreases after a low tracer count (∼50). The uncertainties in concentration estimates caused by calculating tracer proportion are a likely cause of the high observed variance in many CFS time series, especially when CFS or tracer concentrations are low. Thus, we recommend future CFS studies increase counts and report the uncertainty surrounding concentration values. For some records, reporting spore data as presence/absence rather than concentrations or counts is preferable, such as when performing high counts is not feasible.
1 Introduction
Paleoecological studies incorporating spores of coprophilous fungi (hereafter coprophilous fungal spores, or CFS) in interpretations of herbivore abundance and activity have drastically increased within the last decade (van Asperen et al., 2021). Commonly used CFS prefer dung as a substrate to varying degrees (Angelina G. Perrotti and van Asperen, 2019), but the decline of CFS in Pleistocene sediments are widely accepted to reflect megaherbivore decline and extinction (e.g., Davis, 1987; Gill et al., 2009, 2012; Rozas-Davila et al., 2016; Raczka et al., 2019), while CFS emergence in mid-to-late Holocene sediments implicates pastoralism (e.g., Graf and Chmura, 2006; Mighall et al., 2006; Gauthier et al., 2010; Currás et al., 2012). However, uncertainties still surround the proxy, including CFS life cycle and taphonomy (Raper and Bush, 2009; Parker and Williams, 2012; Wood and Wilmshurst, 2012; Perrotti and van Asperen, 2019; van Asperen et al., 2021), the relationship between CFS and megaherbivore biomass (Gill et al., 2013; Baker et al., 2016; van Asperen et al., 2020; Davies et al., 2022), and laboratory extraction techniques (van Asperen et al., 2016),
Recent attention has been given to a lack of standard CFS quantification methods (e.g., Wood and Wilmshurst, 2013). Many early studies using CFS to indicate North American Pleistocene megaherbivore abundance and decline reported spores as a proportion of the pollen assemblage (Davis, 1987; Robinson et al., 2005; Gill et al., 2009, 2012), and supported by modern analog studies (Gill et al., 2013), suggest that CFS taxon in the Sporormiella-Preussia complex in abundances over 2% of the terrestrial pollen assemblage indicates notable megaherbivory pressure. Though sensitive to fluctuations in pollen accumulation rates, this method can be useful when sedimentation is variable and age-depth models are poorly constrained. Recent papers encourage also reporting CFS concentration (spores/cm3) or accumulation (spores/cm2/year), as these metrics are independent of fluctuations in total pollen abundance (Wood and Wilmshurst, 2013; Perrotti and van Asperen, 2019).
Currently, no single standard for counting CFS exists, though CFS are often counted alongside a standard pollen count which ranges from 200 to 500 terrestrial pollen grains (Jones and Bryant, 1998; Comtois et al., 1999), which allows for expedient calculation of CFS to pollen assemblage proportion, as well as concentration and accumulation rates. However, this method is sensitive to fluctuations in pollen accumulation, and high pollen concentration may overwhelm the CFS signal, as CFS often occur at much lower concentrations than pollen. Indexing CFS independently from pollen protects against biases that could arise from differential pollen concentration among samples, such as CFS underrepresentation in samples with high pollen concentration (Perrotti et al., 2022).
Because CFS are often found in lower concentrations than pollen, this analysis is time intensive, and thus it is appealing to establish a counting threshold to reliably estimate spore concentration values. Etienne and Jouffroy-Bapicot (2014) suggest counting a minimum of 300 to 350 tracers to achieve a precise spore concentration estimate within each sample. However, this threshold depends on several factors including the total number of tracers added, as well as the ratio of tracers to CFS within a sample. In this paper, we explore the random nature of the counting process and the implications of varying the total number of objects counted (tracers and spores from individual CFS taxa, henceforth “total count”) in estimating CFS concentration.
Rather than counting CFS and other fungal taxa, several recent works have used presence-absence data. These studies document all fossil fungal species present in a sample and then use the trait-based approach and nearest living relative methods to apply modern fungal species assemblages’ ecology and habitat requirements to past assemblages. This approach can facilitate the recording of rare but important fungal taxa that would be missed using typical counting thresholds (Musotto et al., 2017; Nuñez Otaño et al., 2021; Romero et al., 2021; Pound et al., 2022). This approach can not only to capture the diversity of fungal assemblages, but also accounts for the uncertainty of how many fungal spores are produced by a single fungal organism or reproductive structure. Biotic and abiotic factors affect fungal spore production, release of those spores, and continuance or non-continuance of their life cycles. These include microhabitat differences within the substrates, such as surface types and crevices in dung, competitive hierarchies with other CFS species, deposition rate in suitable habitats, and distance traveled by CFS, which in turn depends upon how they are released from the fungus (e.g., as single spores or a mass of spores) (Krug et al., 2004; Newcombe et al., 2016; Calhim et al., 2018; Nuñez Otaño et al., 2021).
Thus, in this paper, we examine how counting thresholds affect concentration estimates and the probability of encountering specific CFS taxa. We first explore how the true ratio of tracers to CFS affects estimates of the tracer to CFS ratio at different total counts. Second, we model the uncertainty of CFS concentration estimates as a function of tracer to CFS ratio and total count. Third, we apply our model to three established North American CFS (belonging to the Preussia-Sporormiella complex) records. Fourth, we use existing CFS records to demonstrate concentration uncertainty for samples with varying tracer and CFS abundances and total counts. Last, we explore the probability of encountering a specific CFS taxon at different counts to provide recommendations for counting thresholds or performing presence/absence analysis.
2 Materials and methods
To provide an estimate of CFS concentration (S), and associated confidence interval (CI), we use three parameters: the total number of tracers added (T), the number of objects counted (n), and the number of tracers in that count (nT). The total number of objects in the sample including the tracers is denoted by N. The proportion of tracers in the sample is denoted p = nT/n. S can represent the concentration of one taxon or the total concentration of all CFS.
The probability of obtaining n_T tracers in a total count of n for N objects with T tracers is given by the hypergeometric probability distribution HG(nT,n,T,N). We use this as our underlying model because model it reflects the probability of getting k success out of n draws without replacement. The likelihood function for the estimate of CFS concentration is thus,
We scale the likelihood function with a maximum value of one. We then use Monte Carlo rejection sampling to obtain the posterior distribution and to compute the CI. We use a rectangle envelop where S is from 0 to T(1/p−1)/[p(1−p)]. The latter is for computational efficiency that accounts for wider parameter values when p is close to 0 or 1.
We investigate how the shape of the hypergeometric distribution and the likelihood function change if we vary the total count from n = 20, 100, 500 and the proportion of tracers within the total count p = 0.1, 0.5, and 0.9. Next, we explore how the 95% CI changes for a fixed proportion of spores but ranging from 10 to 500.
As a concrete example, we applied our method to three established CFS (specifically Sporormiella-Preussia complex) records from Appleman Lake, IN Gill et al. (2009), Page-Ladson, FL (Halligan et al., 2016), and Cupola Pond, MO (Perrotti et al., 2022). All data was accessed from the Neotoma Paleoecological Database (Williams et al., 2018), and sites were chosen based on data availability and the confirmed presence of Sporormiella-Preussia complex spores. Because the number of tracers added is variable due to the manufacturing process, we assume that the number of tracers T is random and follows a normal distribution with a known mean and standard deviation. For simplicity, the maximum likelihood estimate is based on T = mean of the normal distribution. For Appleman Lake, Page-Ladson, and Cupola Pond the mean number tracers added is 18,583, 18,584, and 12,542, respectively, with variations in number of tracers resulting from different batches from the manufacturer. For the CI, we first drew M samples from the normal distribution, and then computed the likelihood and the posterior distribution for each T1,T2…,TM. Last, our 95% CI (i.e., uncertainty in T) is the 95% CI of the pooled M posterior distributions. We set M = 20 and the standard deviation of the normal distribution = 500.
To model the probability of encountering the first CFS of interest, we use a special case of the negative hypergeometric distribution where the number of success is set to one, i.e., finding the first CFS. Our main interest is to assess how the probability changes as the ratio of tracers to CFS changes and as more tracers are counted. We set T = 10,000, vary the number of CFS from 1 to 1,000, and count objects from 1 to 2,000.
3 Results
3.1 Estimating spore concentration
Coprophilous (dung-inhabiting) fungal spores (CFS) concentration estimates are calculated by extrapolating the tracer proportion to the entire processed sample by using the known quantity of added tracers. This process assumes that the counted tracer proportion accurately reflects the true tracer proportion throughout the entire sample (Maher, 1981). However, because counting is a random process and is unlikely to replicate the true tracer proportion, smaller total counts result in wider distributions (Figure 1). This result holds regardless of the true proportion (low, equal, or high).
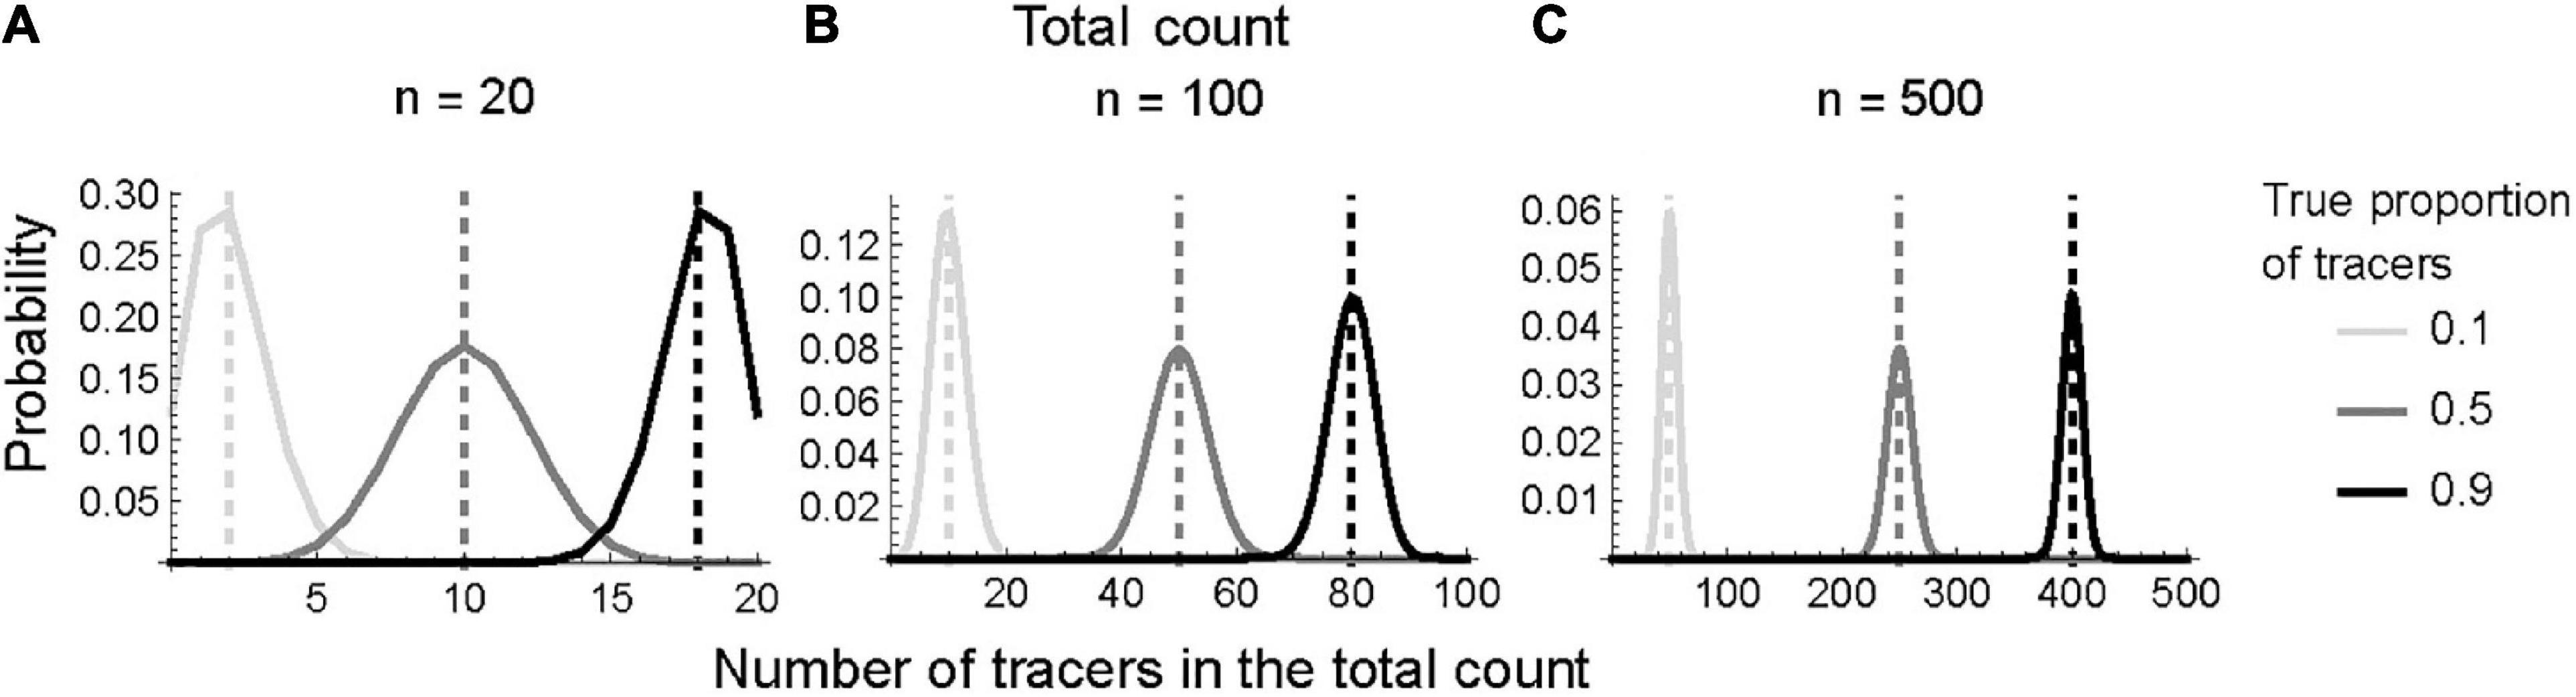
Figure 1. Hypergeometric distribution as a function of tracer frequency and total count. Panels show the probability (Y–axis) of obtaining a number of tracers in the sample (X-axis) at (A) low, n = 20; (B) moderate, n = 100; and (C) high, n = 500, total counts in panels (A–C). The dashed vertical line denotes the true proportion of spore in the sample. For each case, 10,000 tracers were added. Note the different Y axis scales.
A low total count (n = 20) results in a wide distribution of estimated CFS, while the distribution narrows with moderate (n = 100) and high (n = 500) counts. The most symmetrical distributions occur when tracers comprise 50% of the total sample (i.e., tracer proportion = 0.5). Higher proportions of tracers (0.5 to 0.9) provide narrower distributions, especially at low to moderate total counts (Figure 2). Regardless, the likelihood narrows as the total count increases, resulting in a more precise CFS concentration estimate (Figure 3). Additionally, the asymmetrical confidence intervals at all tracer proportions suggest that CFS concentration estimates may be overestimated rather than than underestimated.
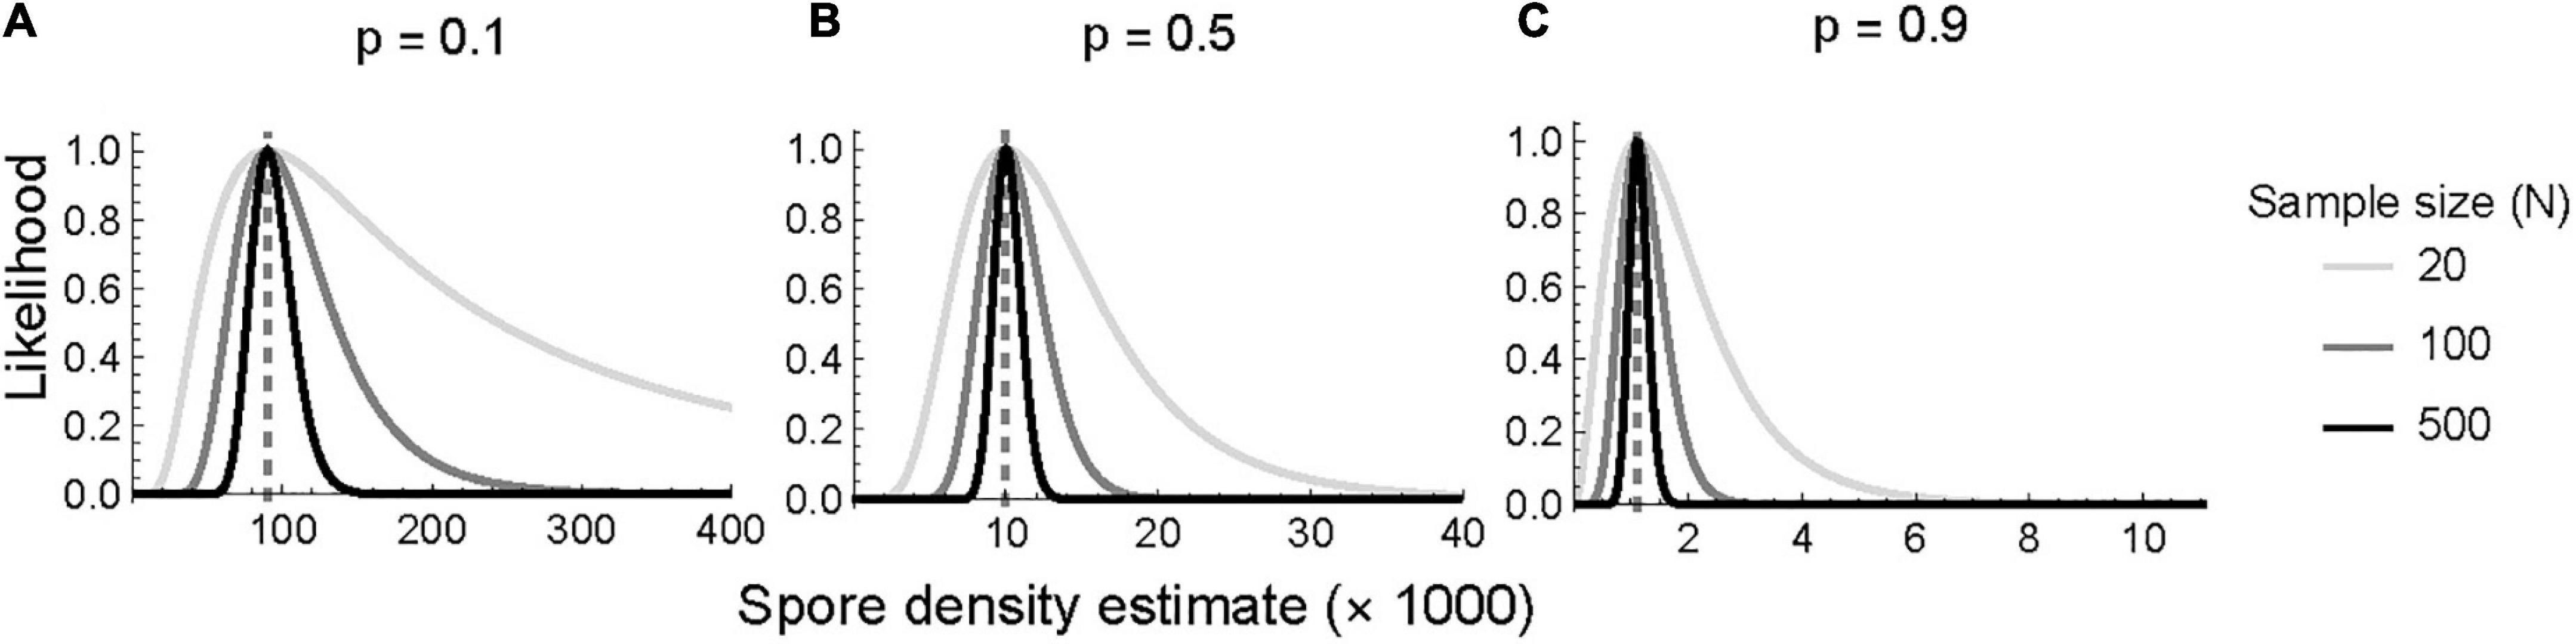
Figure 2. Likelihood function of spore concentration if the proportion of tracers in the total sample are (A) rare 0.1, (B) equally frequent 0.5, and (C) abundant 0.9 in panels (A–C). The vertical dashed line denotes the maximum-likelihood estimate of the concentration of spore in the sample. Light gray, gray, and black represent total count of 20, 100, and 500. Ten thousand tracers were added in each case.
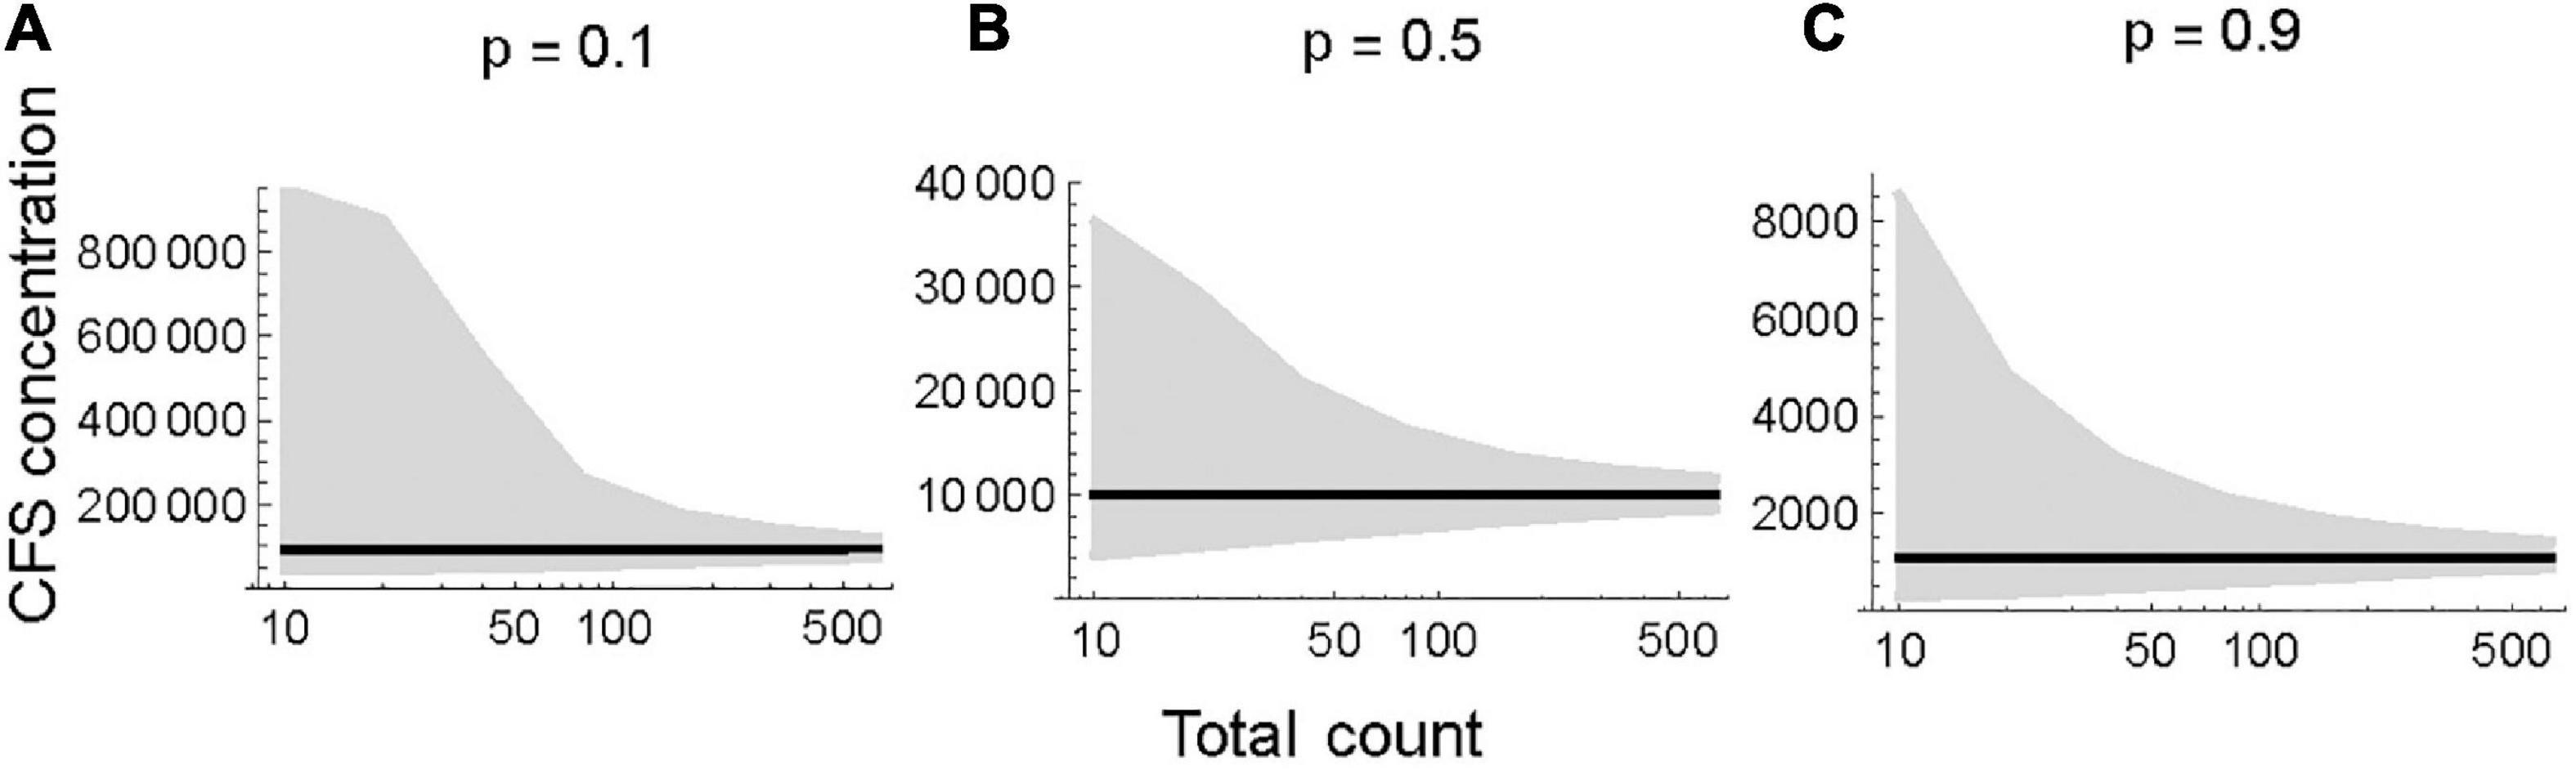
Figure 3. Maximum likelihood estimate (black) and 95% CI (gray shading) of spore concentration as a function of total count. Tracers are (A) rare 0.1, (B) equally frequent 0.5, and (C) abundant 0.9. Note the different Y axis scales.
3.2 Probability of encountering specific spore taxon
Given the large uncertainty surrounding CFS concentration estimates at small to moderate total counts, it can be more efficient to produce a presence/absence record rather than obtain counts (Nuñez Otaño et al., 2021; Romero et al., 2021). Our model shows that the probability of finding the first CFS increases as the total count increases (Figure 4), but peaks when the total count is equal to the number of tracers divided by the true number CFS in the sample. For instance, when there are 1,000 CFS and 10,000 tracers, one is most likely to encounter a CFS after counting ten tracers. In that scenario, the probability of finding the first CFS after counting a hundred objects is less than 0.0006.
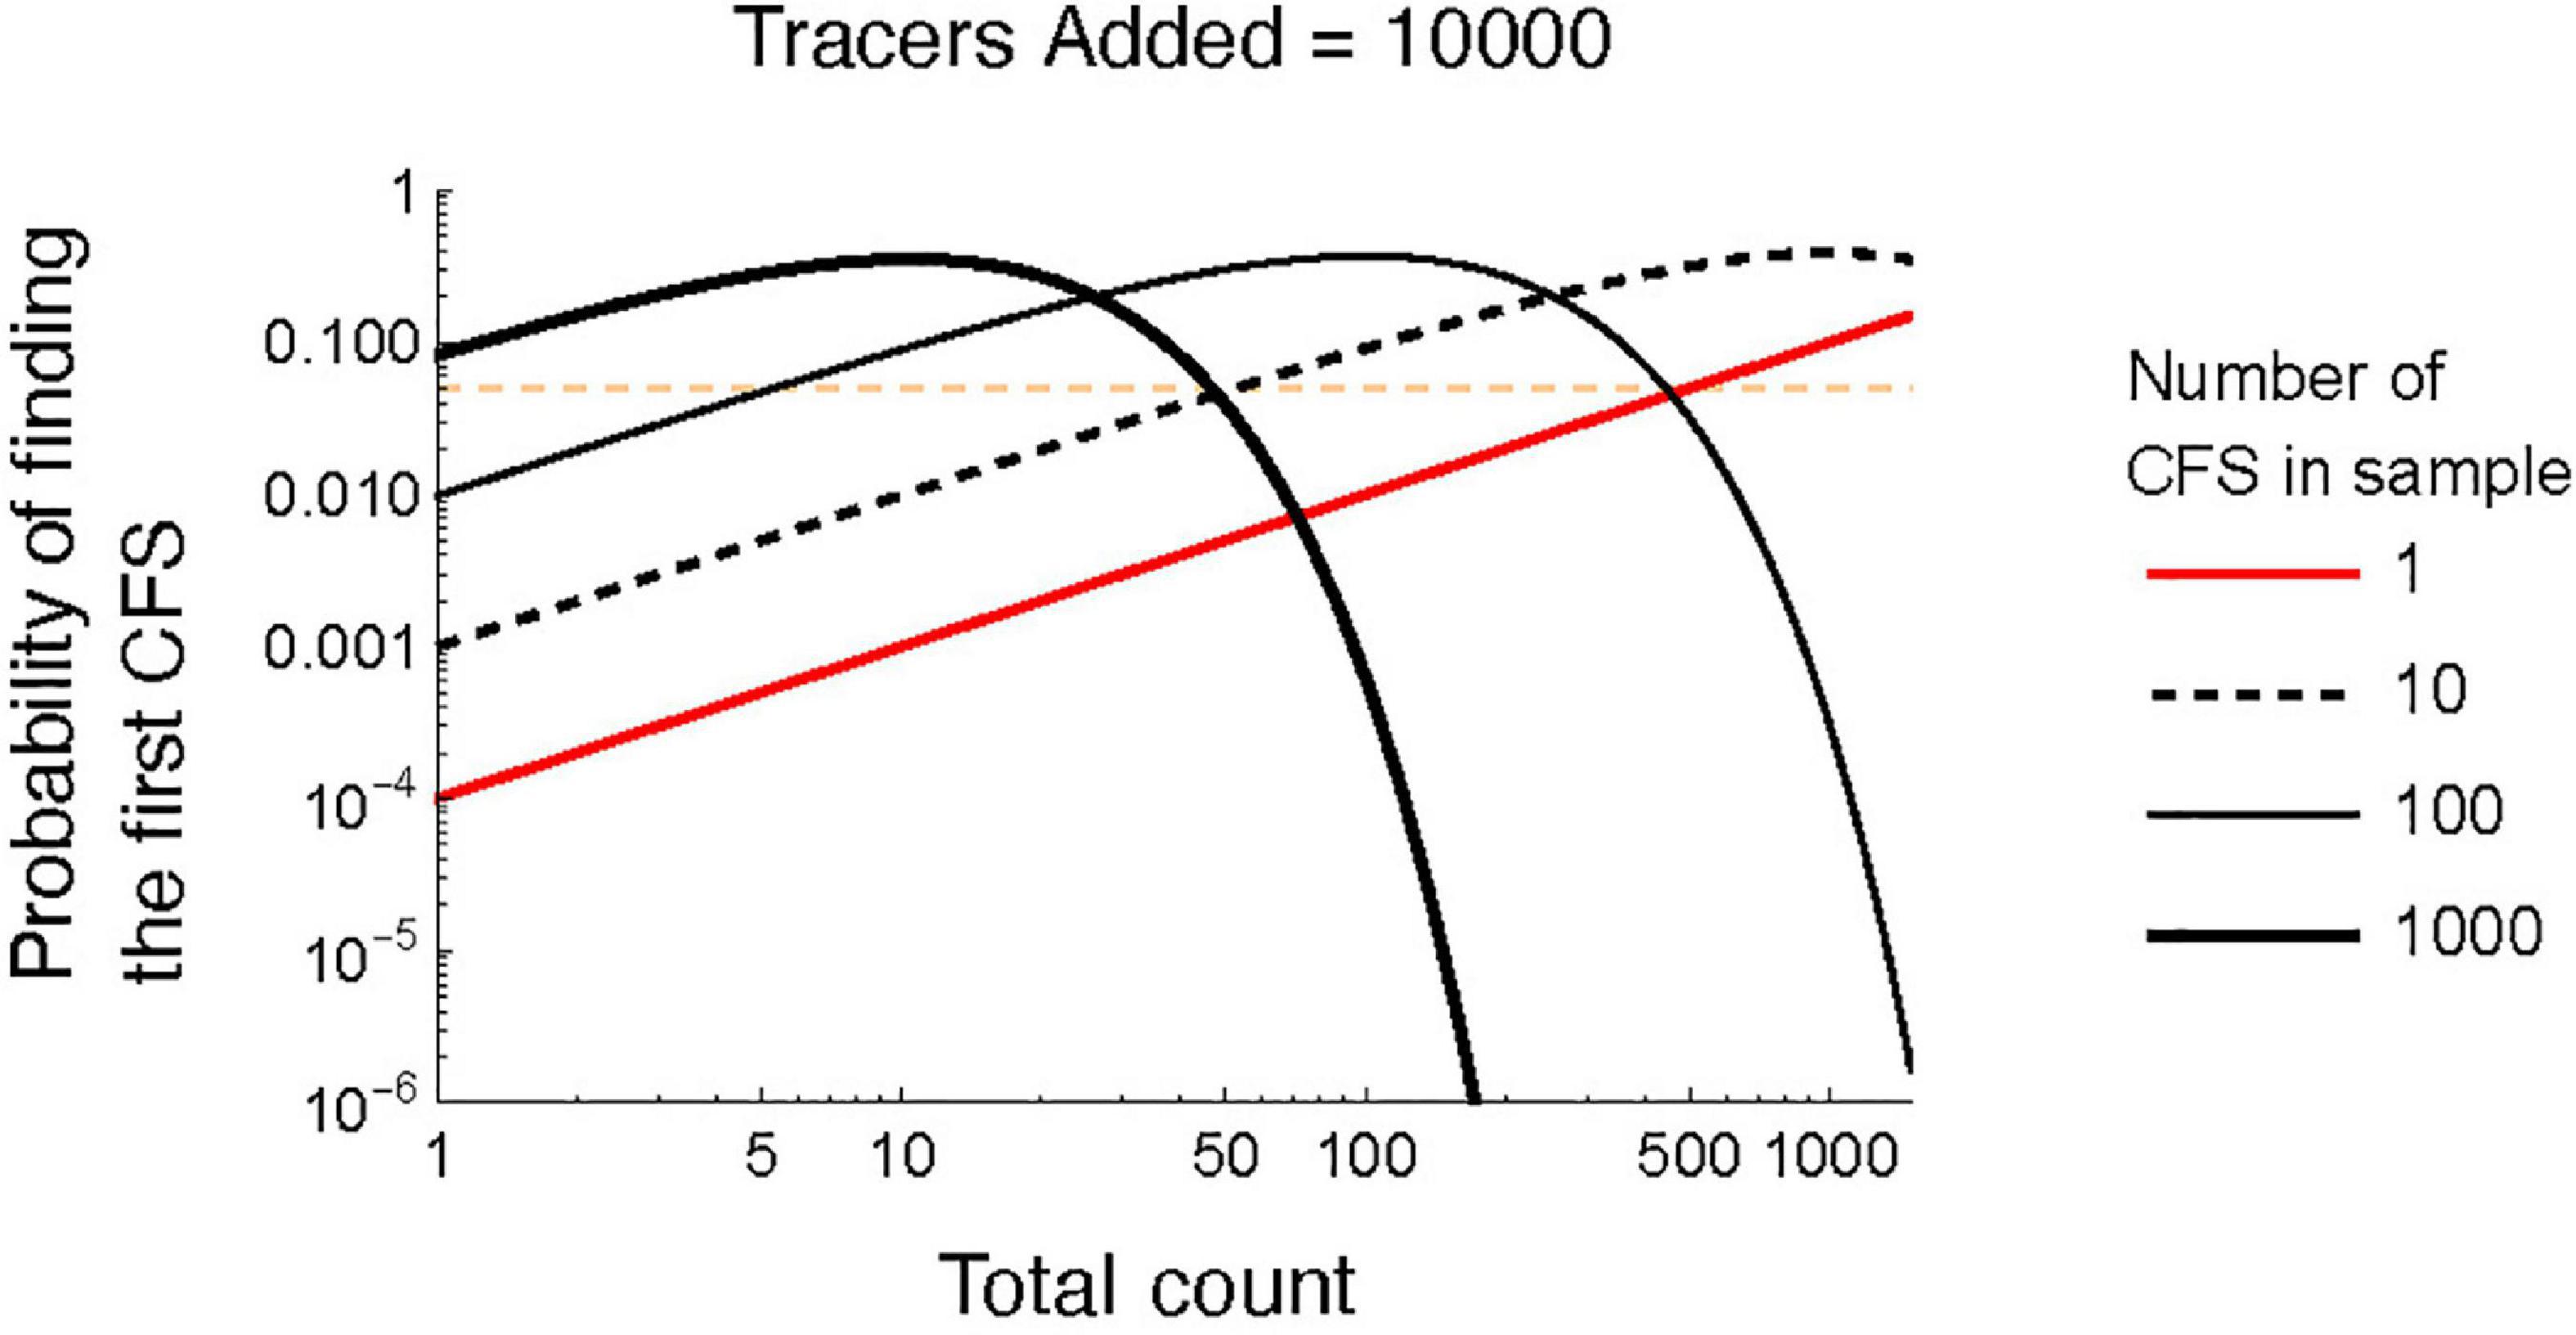
Figure 4. Probability of finding the first coprophilous (dung-inhabiting) fungal spore (CFS) as total count increases. Each line denotes an increasing ratio of CFS to tracers. The horizontal red line shows a probability of 0.05.
4 Discussion
4.1 CFS concentration estimates have high uncertainty
Though Etienne and Jouffroy-Bapicot (2014) sought to establish a minimum tracer count, our models suggest that it is preferable to use an aggregate of CFS and tracers as a total sum, due to the variable tracer proportion among different samples. CFS concentration estimates rely on obtaining a total count that reflects the true proportion of tracers (Maher, 1981). The uncertainty surrounding the proportion of tracers is large at small total counts (n = 20) and decreases as counts increase (Figure 1). Despite the uncertainty, our research indicates that 0.5 tracer proportion produces the most symmetrical uncertainty estimate, and that uncertainty narrows as tracer proportion increases. It is difficult to estimate spore concentration prior to adding tracers, so we recommend reducing uncertainty when possible, by adding additional tracers (0.9 tracer proportion has less uncertainty than 0.1) and increasing counts. Even at low tracer proportions (0.1), a high total count (n = 500) considerably reduces the uncertainty of concentration estimates as compared to a low total count (n = 20) (Figure 2). Figure 3 further demonstrates how uncertainty narrows at various tracer proportions with increased total counts. Due to the asymmetrical uncertainty, we suggest that it is more likely CFS are over-reported than under-reported in studies with low total counts.
Given the high range of uncertainty when reporting estimated CFS concentrations at low to moderate counts, fluctuations within a CFS record should be interpreted with caution and may not reflect a true change in CFS concentration. This is demonstrated in simulated linear and abrupt CFS declines (Supplementary Figure 1) and by including 95% CIs surrounding concentration estimates of three established CFS records (Figure 5). Though the variation in CFS concentration estimates may result from changes in sediment deposition rate or preservation, the uncertainty in concentration estimates is an artifact of the counting process. Our findings align with Maher’s (1972) work on uncertainty in pollen abundance estimates, and we similarly conclude that the counting threshold and 95% CI should be included when reporting palynological data.
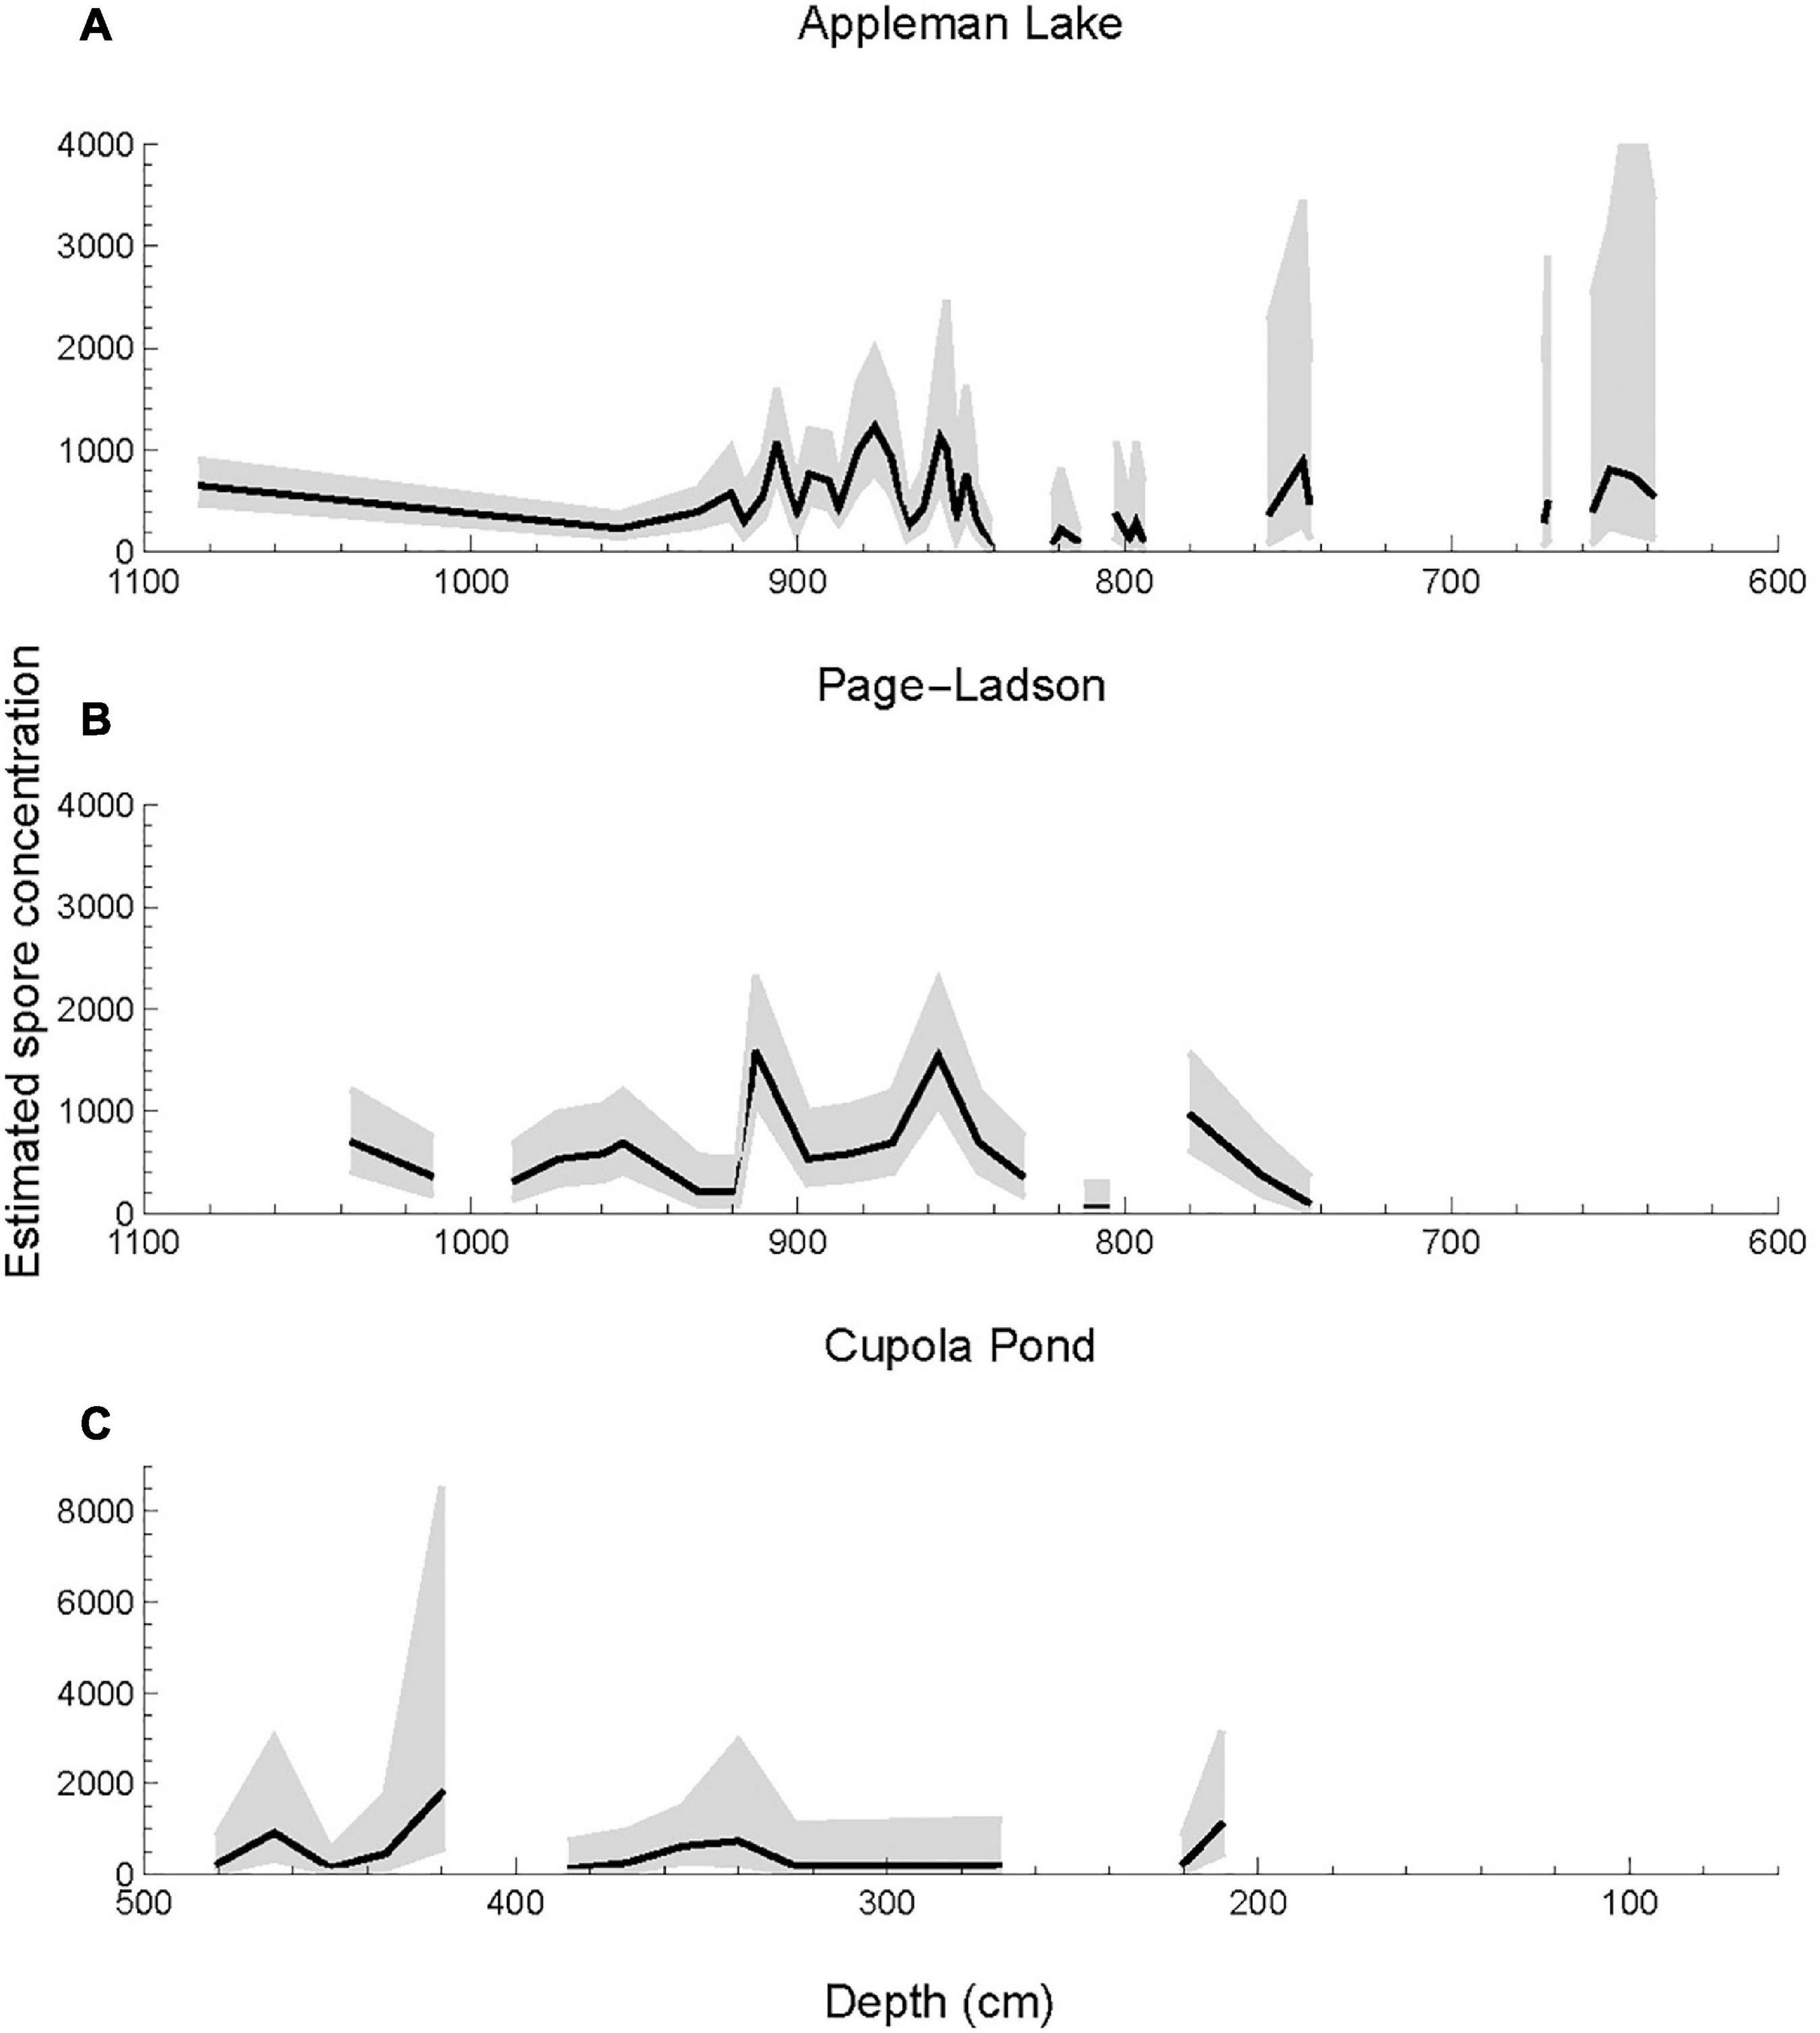
Figure 5. Estimated spore concentration (black) and 95% confidence interval (gray shading) for a single coprophilous (dung-inhabiting) fungal spores (CFS) taxon (Sporormiella-Preussia complex) data from (A) Appleman Lake, Indiana (Gill et al., 2009), (B) Page-Ladson, FL (Halligan et al., 2016), and (C) Cupola Pond, MO (Perrotti et al., 2022).
4.2 Presence/Absence analysis
Given the high levels of uncertainty we note at low to moderate counts, a presence/absence approach may be useful in some circumstances. This method involves scanning microscope slides with a predetermined sample volume and relies on analyzing enough material to have a high likelihood of encountering a specific CSF taxon. We demonstrate that the probability of encountering a CFS spore occurring at moderate to high concentrations (1,000 CFS/sample) drops dramatically at relatively low counts (50 tracers). However, the probability encountering a specific CSF taxon at very low concentrations (n = 1 or 10) in the sample continues to increase at high counts (> 750 tracers). Thus, collecting a tally of tracers while scanning can facilitate the assessment of the probability of encountering a CFS and strengthen interpretations of fungal taxon absence.
5 Conclusion
In conclusion, accurate CFS concentration estimates rely heavily on counts that reflect the true proportion of tracers within a sample. Our models indicate that a higher tracer proportion (0.9) results in the narrowest 95% CI on concentration estimates, and that higher total counts further narrow the 95% CI. For most samples, a threshold of 200 to 500 total counts produces a relatively narrow CI, which supports Etienne and Jouffroy-Bapicot’s (2014) suggested threshold of 300 to 350 tracers. Future studies may plot the 95% CI on alongside mean concentration estimate curves. Additionally, a presence/absence approach is sometimes preferable.
Furthermore, we emphasize that variability in spore concentration estimates at various counting thresholds is one of many sources of uncertainty in CFS records including reproduction, interspecific CFS competition, ecology geographic distribution, and taphonomy (e.g., Nuñez Otaño et al., 2021). Future work should incorporate other sources of uncertainty into interpretations of CFS records. Though we have illustrated that uncertainties in concentration estimates caused by calculating tracer proportions may be responsible for the observed variance in many CFS time series (especially when CFS or tracer concentrations are low) we suggest that future studies may mitigate this variance by increasing counts and considering the 95% CI of their estimates.
Data availability statement
The datasets presented in this study can be found in online repositories. The names of the repository/repositories and accession number(s) can be found below: https://github.com/ramiadantsoa/SporeCount.
Author contributions
AP conceptualized and led the research. TR developed the methods. All authors interpreted results, wrote, and revised the manuscript.
Funding
This work was funded by the National Science Foundation (EAR-1855154 and DEB-1353896).
Acknowledgments
Mathias Trachsel assisted with methodology and model development. We thank two reviewers for their helpful suggestions.
Conflict of interest
The authors declare that the research was conducted in the absence of any commercial or financial relationships that could be construed as a potential conflict of interest.
Publisher’s note
All claims expressed in this article are solely those of the authors and do not necessarily represent those of their affiliated organizations, or those of the publisher, the editors and the reviewers. Any product that may be evaluated in this article, or claim that may be made by its manufacturer, is not guaranteed or endorsed by the publisher.
Supplementary material
The Supplementary Material for this article can be found online at: https://www.frontiersin.org/articles/10.3389/fevo.2022.1086109/full#supplementary-material
References
Baker, A. G., Cornelissen, P., Bhagwat, S. A., Vera, F. W. M., and Willis, K. J. (2016). Quantification of population sizes of large herbivores and their long-term functional role in ecosystems using dung fungal spores. Methods Ecol. Evol. 7, 1273–1281. doi: 10.1111/2041-210X.12580
Calhim, S., Halme, P., Petersen, J. H., Læssøe, T., Bässler, C., and Heilmann-Clausen, J. (2018). Fungal spore diversity reflects substrate-specific deposition challenges. Sci. Rep. 8:5356. doi: 10.1038/s41598-018-23292-8
Comtois, P., Alcaza, P., and Néron, D. (1999). Pollen counts statistics and its relevance to precision. Aerobiologia 15, 19–29. doi: 10.1023/A:1007501017470
Currás, A., Zamora, L., Reed, J. M., García-Soto, E., Ferrero, S., Armengol, X., et al. (2012). Climate change and human impact in central Spain during Roman times: High-resolution multi-proxy analysis of a tufa lake record (Somolinos, 1280m asl). Catena 89, 31–53. doi: 10.1016/j.catena.2011.09.009
Davies, A. L., Harrault, L., Milek, K., McClymont, E. L., Dallimer, M., Hamilton, A., et al. (2022). A multiproxy approach to long-term herbivore grazing dynamics in peatlands based on pollen, coprophilous fungi and faecal biomarkers. Palaeogeogr. Palaeoclimatol. Palaeoecol. 598:111032. doi: 10.1016/j.palaeo.2022.111032
Davis, O. K. (1987). Spores of the dung fungus Sporormiella: Increased abundance in historic sediments and before pleistocene megafaunal extinction. Quat. Res. 28, 290–294. doi: 10.1016/0033-5894(87)90067-6
Etienne, D., and Jouffroy-Bapicot, I. (2014). Optimal counting limit for fungal spore abundance estimation using Sporormiella as a case study. Veg. Hist. Archaeobot. 23, 743–749. doi: 10.1007/s00334-014-0439-1
Gauthier, E., Bichet, V., Massa, C., Petit, C., Vannière, B., and Richard, H. (2010). Pollen and non-pollen palynomorph evidence of medieval farming activities in southwestern Greenland. Veg. Hist. Archaeobot. 19, 427–438. doi: 10.1007/s00334-010-0251-5
Gill, J. L., McLauchlan, K. K., Skibbe, A. M., Goring, S., Zirbel, C. R., and Williams, J. W. (2013). Linking abundances of the dung fungus Sporormiella to the density of bison: Implications for assessing grazing by megaherbivores in palaeorecords. J. Ecol. 101, 1125–1136. doi: 10.1111/1365-2745.12130
Gill, J. L., Williams, J. W., Jackson, S. T., Donnelly, J. P., and Schellinger, G. C. (2012). Climatic and megaherbivory controls on late-glacial vegetation dynamics: A new, high-resolution, multi-proxy record from Silver Lake, Ohio. Quat. Sci. Rev. 34, 66–80. doi: 10.1016/j.quascirev.2011.12.008
Gill, J. L., Williams, J. W., Jackson, S. T., Lininger, K. B., and Robinson, G. S. (2009). Pleistocene megafaunal collapse, novel plant communities, and enhanced fire regimes in North America. Science 326, 1100–1103. doi: 10.1126/science.1179504
Graf, M.-T., and Chmura, G. L. (2006). Development of modern analogues for natural, mowed and grazed grasslands using pollen assemblages and coprophilous fungi. Rev. Palaeobot. Palynol. 141, 139–149. doi: 10.1016/j.revpalbo.2006.03.018
Halligan, J. J., Waters, M. R., Perrotti, A., Owens, I. J., Feinberg, J. M., Bourne, M. D., et al. (2016). Pre-Clovis occupation 14,550 years ago at the Page-Ladson site, Florida, and the peopling of the Americas. Sci. Adv. 2:e1600375. doi: 10.1126/sciadv.1600375
Jones, G. D., and Bryant, V. M. (1998). “Are all counts created equal?,” in New developments in palynomorph sampling, extraction, and analysis, eds V. Bryant and J. Wrenn (Houston, TX: American Association of Stratigraphic Palynologists Foundation), 115–120.
Krug, J. C., Benny, G. L., and Keller, H. W. (2004). “Coprophilous fungi,” in Biodiversity of fungi, eds G. M. Mueller, G. F. Bills, and M. S. Foster (Amsterdam: Elsevier), 467–499. doi: 10.1016/B978-012509551-8/50024-6
Maher, L. J. (1972). Nomograms for computing 0.95 confidence limits of pollen data. Rev. Palaeobot. Palynol. 13, 85–93. doi: 10.1016/0034-6667(72)90038-3
Maher, L. J. (1981). Statistics for microfossil concentration measurements employing samples spiked with marker grains. Rev. Palaeobot. Palynol. 32, 153–191. doi: 10.1016/0034-6667(81)90002-6
Mighall, T., Cortizas, A. M., Biester, H., and Turner, S. (2006). Proxy climate and vegetation changes during the last five millennia in NW Iberia: Pollen and non-pollen palynomorph data from two ombrotrophic peat bogs in the North Western Iberian Peninsula. Rev. Palaeobot. Palynol. 141, 203–223. doi: 10.1016/j.revpalbo.2006.03.013
Musotto, L. L., Borromei, A. M., Bianchinotti, M. V., and Coronato, A. (2017). Late quaternary palaeoenvironmental reconstruction of central Tierra del Fuego (Argentina) based on pollen and fungi. Quat. Int. 442, 13–25. doi: 10.1016/j.quaint.2016.01.071
Newcombe, G., Campbell, J., Griffith, D., Baynes, M., Launchbaugh, K., and Pendleton, R. (2016). Revisiting the life cycle of dung fungi, including Sordaria fimicola. PLoS One 11:e0147425. doi: 10.1371/journal.pone.0147425
Nuñez Otaño, N. B., Bianchinotti, M. V., and Saparrat, M. C. N. (2021). Palaeomycology: A modern mycological view of fungal palynomorphs. Geol. Soc. 511, 91–120. doi: 10.1144/SP511-2020-47
Parker, N. E., and Williams, J. W. (2012). Influences of climate, cattle density, and lake morphology on Sporormiella abundances in modern lake sediments in the US Great Plains. Holocene 22, 475–483. doi: 10.1177/0959683611425550
Perrotti, A. G., and van Asperen, E. (2019). Dung fungi as a proxy for megaherbivores: Opportunities and limitations for archaeological applications. Veg. Hist. Archaeobot. 28, 93–104. doi: 10.1007/s00334-018-0686-7
Perrotti, A. G., Kiahtipes, C. A., Russell, J. M., Jackson, S. T., Gill, J. L., Robinson, G. S., et al. (2022). Diverse responses of vegetation and fire after pleistocene megaherbivore extinction across the eastern US. Quat. Sci. Reviews 294:107696. doi: 10.1016/j.quascirev.2022.107696
Pound, M. J., Nuñez Otaño, N. B., Romero, I. C., Lim, M., Riding, J. B., and O’Keefe, J. M. K. (2022). The fungal ecology of the Brassington Formation (Middle Miocene) of Derbyshire, United Kingdom, and a new method for palaeoclimate reconstruction. Front. Ecol. Evol. 10:947623. doi: 10.3389/fevo.2022.947623
Raczka, M. F., Mosblech, N. A., Giosan, L., Valencia, B. G., Folcik, A. M., Kingston, M., et al. (2019). A human role in Andean megafaunal extinction? Quat. Sci. Rev. 205, 154–165. doi: 10.1016/j.quascirev.2018.12.005
Raper, D., and Bush, M. (2009). A test of Sporormiella representation as a predictor of megaherbivore presence and abundance. Quat. Res. 71, 490–496. doi: 10.1016/j.yqres.2009.01.010
Robinson, G. S., Pigott Burney, L., and Burney, D. A. (2005). Landscape paleoecology and megafaunal extinction in Southeastern New York State. Ecol. Monogr. 75, 295–315. doi: 10.1890/03-4064
Romero, I. C., Nuñez Otaño, N. B., Gibson, M. E., Spears, T. M., Fairchild, C. J., Tarlton, L., et al. (2021). First record of fungal diversity in the tropical and warm-temperate middle miocene climate optimum forests of Eurasia. Front. For. Glob. Change 4:768405. doi: 10.3389/ffgc.2021.768405
Rozas-Davila, A., Valencia, B. G., and Bush, M. B. (2016). The functional extinction of Andean megafauna. Ecology 97, 2533–2539. doi: 10.1002/ecy.1531
van Asperen, E. N., Kirby, J. R., and Hunt, C. O. (2016). The effect of preparation methods on dung fungal spores: Implications for recognition of megafaunal populations. Rev. Palaeobot. Palynol. 229, 1–8. doi: 10.1016/j.revpalbo.2016.02.004
van Asperen, E. N., Kirby, J. R., and Shaw, H. E. (2020). Relating dung fungal spore influx rates to animal density in a temperate environment: Implications for palaeoecological studies. Holocene 30, 218–232. doi: 10.1177/0959683619875804
van Asperen, E. N., Perrotti, A., and Baker, A. (2021). Coprophilous fungal spores: Non-pollen palynomorphs for the study of past megaherbivores. Geol. Soc. 511, 245–267. doi: 10.1144/SP511-2020-41
Williams, J. W., Grimm, E. C., Blois, J. L., Charles, D. F., Davis, E. B., Goring, S. J., et al. (2018). The Neotoma paleoecology database, a multiproxy, international, community-curated data resource. Quat. Res. 89, 156–177. doi: 10.1017/qua.2017.105
Wood, J. R., and Wilmshurst, J. M. (2012). Wetland soil moisture complicates the use of Sporormiella to trace past herbivore populations. J. Quat. Sci. 27, 254–259. doi: 10.1002/jqs.1539
Keywords: coprophilous fungal spores, palynology, quantification methods, presence/absence analysis, megaherbivore decline
Citation: Perrotti AG, Ramiadantsoa T, O’Keefe J and Nuñez Otaño N (2022) Uncertainty in coprophilous fungal spore concentration estimates. Front. Ecol. Evol. 10:1086109. doi: 10.3389/fevo.2022.1086109
Received: 01 November 2022; Accepted: 01 December 2022;
Published: 22 December 2022.
Edited by:
Anne Elisabeth Bjune, University of Bergen, NorwayReviewed by:
Anna Maria Mercuri, University of Modena and Reggio Emilia, ItalyNormunds Stivrins, University of Latvia, Latvia
Copyright © 2022 Perrotti, Ramiadantsoa, O’Keefe and Nuñez Otaño. This is an open-access article distributed under the terms of the Creative Commons Attribution License (CC BY). The use, distribution or reproduction in other forums is permitted, provided the original author(s) and the copyright owner(s) are credited and that the original publication in this journal is cited, in accordance with accepted academic practice. No use, distribution or reproduction is permitted which does not comply with these terms.
*Correspondence: Angelina G. Perrotti, ✉ YXBlcnJvdHRpQHdpc2MuZWR1