 Xiangrui Wei1†
 Chunrong Zhao
 Xiao Liu
94% of researchers rate our articles as excellent or good
Learn more about the work of our research integrity team to safeguard the quality of each article we publish.
Find out more
ORIGINAL RESEARCH article
Front. Ecol. Evol., 13 December 2022
Sec. Urban Ecology
Volume 10 - 2022 | https://doi.org/10.3389/fevo.2022.1083563
This article is part of the Research TopicThe Physical Environment and Health: Implications for the Planning and Management of Healthy CitiesView all 68 articles
The spatial accessibility of urban park green space (UPGS) plays a crucial role in promoting the healthy development of cities and their residents. However, previous studies have overestimated the accessibility of UPGS and failed to adequately consider the impact of variegated parks on residents’ needs. To fill this gap in the research, we first propose an improved two-step floating catchment area (Huff-2SFCA) method that takes into consideration the trade-offs between supply, demand, and walking time to calculate the UPGS accessibility index for the built-up area of Mianyang, China. Next, we assess the spatial characteristics of UPGS accessibility from both partial and overall points of view and further explore the relationship between accessibility and population size. Our results show that (1) every street area has a different form of UPGS construction, and most of these spaces are of poor quality; (2) municipal-level parks are significantly more accessible than district-level parks, community-level parks, or neighborhood-level parks; (3) the overall distribution of accessibility is generally characterized by a decreasing trend along both sides of the river, with poor overall accessibility; and (4) 243 residential districts are located in high-demand–low-supply areas that need improving. This study can be employed to identify areas that are underserved by UPGS and can provide a basis for improving the accessibility of UPGS and promoting its health benefits.
The novel coronavirus (COVID-19) pandemic has affected individuals’ mental health, leaving them with increased physical and emotional wellness needs (Ifdil et al., 2020). As the only natural or semi-natural land-use form within the city, urban park green space (UPGS) plays a prominent role in maintaining biodiversity, improving the urban microclimate, and absorbing pollutants (Yang et al., 2015). Moreover, UPGS provides urban residents with opportunities to interact with nature, encourages outdoor activities, and promotes physical and mental health (Shaohua and Wanmin, 2007). Research has shown that the health-promotion benefits of UPGS are directly linked to public health recovery and urban sustainability in the post-pandemic era (Lopez et al., 2021).
However, due to rapid urbanization, an increasing number of people are living in complex environments with many high-rise buildings, high population densities, and low levels of green space (Li et al., 2015; Zhang and He, 2021). In addition, the pandemic forced cities to face the challenge of meeting the growing demand for a limited quantity of green space (Venter et al., 2021). Therefore, improving the quality of existing urban parks in cities has become a goal to be addressed by planners and policy makers to restore residents’ physical and mental health in the post-pandemic era (Reid et al., 2022).
Urban park green space provides health-promotion benefits by attracting visitors (King et al., 2015). Studies have explored the planning and construction of UPGS by exploring eco-cultural services, ecological regulation services, ecological support services, and other factors affecting UPGS visits (Gibson, 2018; Xie et al., 2018; Tu et al., 2020; Zheng et al., 2020). Of these factors, accessibility substantially affects visits to and the health benefits of UPGS (Gidlow et al., 2012). For example, residents’ mobility was influenced by UPGS accessibility while the COVID-19 controls were in place to reduce the probability of disease transmission (Liu, 2015). Accessibility indicates the ability of residents to obtain park services and then receive the health benefits of UPGS (Hegetschweiler et al., 2017). Therefore, accurate assessments of UPGS accessibility to identify underserved areas can guide the planning and construction of urban parks and provide a basis for improving and optimizing the health-promotion benefits of urban parks in the post-pandemic era.
Most studies have evaluated the accessibility of public service facilities in terms of spatial accessibility (Fan et al., 2017). The spatial accessibility model is affected by three parameters: supply, demand, and connection (Xing et al., 2020; Zhang et al., 2021). Supply refers to the ability of the destination to fulfill demand, demand refers to the differentiated characteristics of the population, and connection refers to the distance or time between supply and demand (Giles-Corti et al., 2005; Wolch et al., 2014; Rigolon, 2016). Accessibility analysis methods mainly include buffer analysis, kernel density estimation, network analysis, the Voronoi diagram, the gravity model, and the two-step floating catchment area method (2SFCA). Buffer analysis, kernel density estimation, and network analysis can be used to identify a population within a specified distance as an alternative coverage method, which is considered somewhat random due to the difficulty of determining a predefined distance (Nicholls, 2001; Moore et al., 2008; Miyake et al., 2010). The Voronoi diagram method assumes that citizens choose the park closest to their residence and is used to evaluate the carrying capacity of UPGS in a certain area (Sister et al., 2010). The gravity model combines the attraction and distance-decay effect of the park and solves the problem of the assumed service range to a certain extent (Chang and Liao, 2011). These models consider only a single factor as affecting accessibility. In contrast, the 2SFCA method, based on the principle of the gravity model, which comprehensively considers the three factors, is now used and has been improved as a way of determining which areas have insufficient services (Wei, 2017; Xing et al., 2020). There are four main aspects in which UPGS accessibility can be improved: the distance-decay effect (Dai, 2011), service radius (Dony et al., 2015; Lin et al., 2021), competition between demand and supply (Zhang et al., 2021), and travel mode (Li et al., 2021). These improvements enhance the practicability and reliability of the 2SFCA model that is used to evaluate UPGS accessibility. However, scholars have paid more attention to improving demand and connection than to the impact of differences in UPGS regarding residents’ demand (Xing et al., 2020).
Competition among heterogeneous forms of UPGS affects the visits of individuals, who tend to wish to enter a UPGS of high quality within an acceptable time threshold (Ekkel and de Vries, 2017). Parks can increase the number of visits by providing rich landscapes, healthy environments, diverse recreational places, and a complete infrastructure (Yu et al., 2018). For example, Schipperijn et al. found that residents’ outdoor physical activity is positively related to the size of nearby UPGS, walking or riding paths, water body characteristics, lighting, pleasant scenery, and so forth (Cohen et al., 2010; Branas et al., 2011; Veitch et al., 2012; Schipperijn et al., 2013). However, Edwards et al. found that owing to the differences among parks, only 27% of teenagers use nearby UPGS (Edwards et al., 2015). Research has shown that a high greening level in UPGS can prolong users’ outdoor activity time and improve visit frequency, encouraging residents to engage in physical activities and form a healthy lifestyle (Grigsby-Toussaint et al., 2011; Fong et al., 2018). When individuals are in a natural environment, their state is relaxed, which can unconsciously eliminate fatigue, reduce levels of directed attention, and facilitate the recovery of mental and physical strength (Chang et al., 2008). In addition, the natural environment directly or indirectly counteracts the acute and chronic negative health effects caused by air pollution, thereby promoting human health (Hirabayashi and Nowak, 2016). Influenced by the pandemic, urban residents preferred to visit UPGS with a high degree of greening, a quiet nature, and epidemic prevention and control interventions (Cheng et al., 2021; Marconi et al., 2022). Therefore, in the construction of UPGS, there needs to be a good match with public health needs. Assessments of the accessibility of urban parks should consider the impact of park heterogeneity on residents’ needs.
To address this issue, we calculated the accessibility of UPGS by incorporating its public health-promoting environmental characteristics. First, we employed the entropy value method to construct a UPGS quality evaluation model based on questionnaire data, which evaluated park quality by aggregating variables that attract residents’ visits. The quality evaluation results were then integrated with the improved Huff-2SFCA model for accessibility assessment. Finally, we determined the supply and demand for UPGS in the study area by overlaying the urban population and the accessibility index. The objectives of this study were to (1) quantify the spatial pattern of different quality levels of UPGS, (2) identify residential districts that are underserved in terms of UPGS, and (3) identify residential districts that are in dire need of improvement. In this study, the impact of scale and quality factors on supply capacity was taken into account to accurately evaluate accessibility, which guided the planning and construction of UPGSs and provided a basis for improving and optimizing the health-promotion benefits of UPGSs in the post-pandemic era.
First, a quality evaluation system was constructed by analyzing the characteristics of UPGS that attract public visits and promote visitors’ physical and mental health levels. Second, we used the entropy value method to construct a quality evaluation model based on the questionnaire data. Next, based on the traditional 2SFCA model, improvements were made to both the supply and demand aspects. On the supply side, supply capacity was first enhanced in combination with quality because supply is crucial to promoting residents’ visits; on the demand side, we used the Huff model to capture the likelihood of individuals visiting UPGS to avoid overestimating the accessibility index. Finally, we incorporated the aforementioned parameters into the Huff-2SFCA model to calculate the accessibility index of UPGS in urban areas.
Visits are the main factor that improves the physical and mental health of UPGS visitors (Veitch et al., 2012). First, a UPGS’s infrastructure and leisure facilities are the basic indicators that reflect their ability to attract residents. The infrastructure includes, for example, walking paths, streetlights, and public toilets; the leisure facilities include, for example, fitness facilities and sports fields (Biernacka et al., 2020). Outdoor thermal comfort (OTC) is another crucial attribute of UPGS that affects visits, increasing visits up to 2-fold (Cheung and Jim, 2018; Li et al., 2018). OTC is mainly affected by temperature, humidity, sunlight, and ventilation (Javadi and Nasrollahi, 2021). In addition, natural and human landscapes provide visitors with rich visual sensory experiences, such as mountain/water landscapes and historical sites, which can significantly enhance the attractiveness of UPGS (Francis et al., 2012; Ahn et al., 2020). Finally, management and safety significantly affect the frequency of residents’ UPGS visits (Haque et al., 2013). During epidemics, setting up detection chokepoints, controlling the number of visitors, and implementing sanitation and disinfection practices can effectively guarantee the safety of a UPGS.
According to the aforementioned characteristics that attract public visits and promote visitors’ health levels, we quantified a UPGS quality index (QI) based on 18 variables grouped under five key themes: thermal comfort, infrastructure, recreational facilities, visual sensory experience, and management and safety of parks. Second, we inputted the results of 1,520 questionnaires into SPSS 25 to obtain statistics; 20 random interviews were conducted for each UPGS, and invalid questionnaires were randomly re-interviewed by finding others who were not interviewed. Next, the QI was evaluated by employing the entropy evaluation method (EEM); its calculation formula was derived from the literature (Jiang et al., 2022). The EEM determines the variables’ weights according to each variable’s degree of dispersion. The variables, questionnaire assignments (Zhang et al., 2017; Chen et al., 2019; Ta et al., 2021), and weighting results are shown in Table 1.
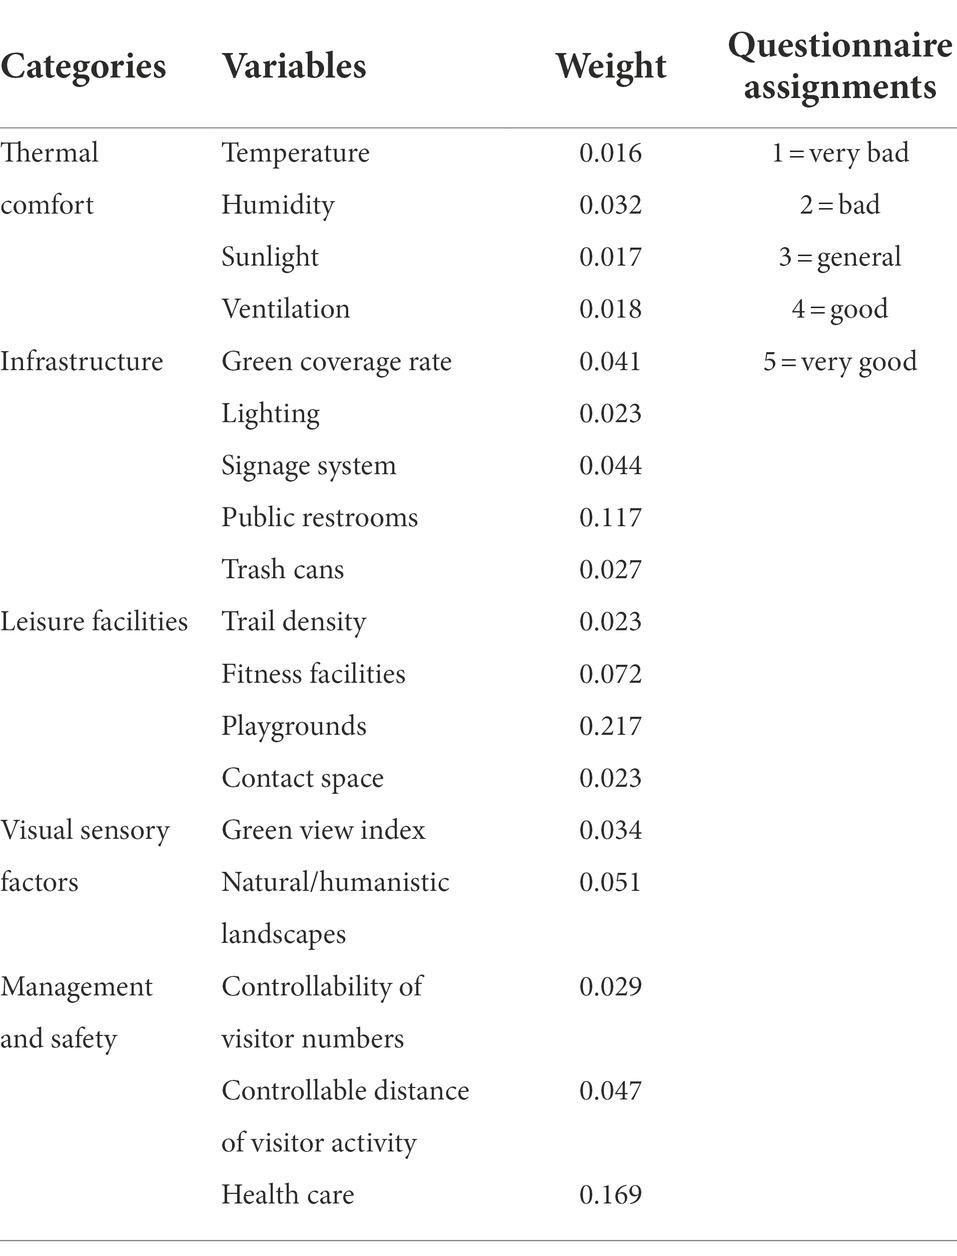
Table 1. Variables and their weight by the QI.
The 2SFCA model was successively proposed and named by Radke and Luo et al. (Radke and Mu, 2000; Luo and Wang, 2003). To solve the distance-decay problems in accessibility evaluation, Dai used a Gaussian function to modify the 2SFCA model (Dai, 2011); subsequently, it has been widely used in research. This method performs two searches based on supply and demand points, respectively. The first step is to search for the demand points i within the threshold d0 for each park j, and then calculate the supply–demand ratio Rj:
where Pk is the population of residential area k within the spatial scope of park j(dij ≤ d0); dij is the space’s distance from the center of residential area k to the center of park j; SA j is the capacity of park j, which generally includes the park area; and G(dij, d0) is the Gaussian function considering distance decay as follows:
The second step is to use the demand point as the center, search for the supply points within the threshold d0, and sum the supply–demand ratio Rj of all supply points to obtain the accessibility Ai.
where j is all parks within the catchment d0. Ai represents the supply–demand ratio of a park in the catchment (dij ≤ d0) of demand point i.
Size is sometimes used to express the service capacity of a UPGS. Size is essential because a large UPGS may provide more services than a small UPGS. However, having a large area does not guarantee improved service quality. Therefore, scholars have sought to quantify the service capacity of UPGS by improving the supply parameters. Zhang et al. assessed the attractiveness of peri-urban parks in terms of five aspects—infrastructure, activity facilities, leisure and entertainment facilities, landscape quality, and safety—and included them in a method for accessibility assessment of peri-urban parks (Zhang et al., 2021). Xing et al. improved the assessment of the service capacity of the park by taking into account sports facilities and the natural environment in terms of teenagers’ willingness to engage in activity (Xing et al., 2020). These studies showed that to improve the supply quality of a UPGS, it is necessary to combine indicators of size and quality. Therefore, following these frameworks, we comprehensively describe supply capacity by combining size with UPGS QI. First, we calculate the relative quality index, that is, the ratio of each UPGS QI to the maximum index. Next, we obtain the comprehensive supply coefficient S′ j of the park based on the weighting of the relative QI. The formula is as follows:
where S′ j is the comprehensive supply coefficient of comprehensive size and quality indicators, and SA j is the park supply capacity considering only the UPGS size; (Max) QI is the maximum QI score.
The traditional 2SFCA model failed to account for competition between destinations and used the same visit probability for all residents in the threshold range, thus potentially leading to significant overestimation (Zhang et al., 2021). To solve this problem, Luo combined the Huff model and the 2SFCA model to quantify competition among destinations (Luo, 2014). Huff-2SFCA is more effective and reliable than the traditional 2SFCA model. The quality of UPGS significantly affects the probability of citizens choosing a specific UPGS because urban residents are more likely to enter a higher-quality UPGS than a lower-quality one. Therefore, the Huff model is integrated into the traditional 2SFCA model to enhance the calculation of population demand. The model calculates the population selection probability, taking into consideration residents’ travel costs and the UPGS’s supply capacity.
The Huff model is commonly used to quantify the probability of an individual choosing a service site over other nearby available sites (Ma et al., 2018). Its construction is influenced by two parameters: (Ifdil et al., 2020) the time or distance between supply and demand, and (Yang et al., 2015) the quality of all destinations in the threshold range. The Huff model is as follows:
where Probi is the selection probability of residents i visiting UPGS j based on the Huff model, tij is the travel time between i and j, G (tij,t’0) is expressed as the distance time impedance coefficient based on the Gaussian function, S’j is the supply capacity of the UPGS, and t’0 is the travel time threshold.
We combine QI with traditional supply capacity. Population demand is obtained by weighting the selection probability based on the Huff model. The improved Huff-2SFCA model can be modified as follows:
where A’ i is considered a comprehensive accessibility index to identify areas underserved by UPGS. The index takes time decay, size, and quality into consideration.
Mianyang is a prefecture-level city in Sichuan Province, China, located in the northwest of the Sichuan Basin and in the middle and upper reaches of the Fujiang River (30°42′–33°03′N and 103°45′–105°43′E). It holds the titles of National Civilized City, National Health City, National Forest City, and National Garden City. This study selected the central urban area, which is approximately 140 km2 and includes 17 street areas, such as Chengxiang Street, Gongqu Street, and Chaoyang Street (Figure 1), as the study area. Its geographical location, with its “three mountains and two rivers,” makes the area rich in natural resources, creating a clustered urban development model and an irregular urban form. Meanwhile, it has also led to the relatively backward development of transportation facilities between clusters and to poor sharing of UPGSs. Mianyang selected “Modern Park City” as the basic concept for guiding its urban planning and construction in 2021 and was chosen to form part of the national pilot list of urban convenient living circles in 2022.1 For these reasons, Mianyang was selected as the study area.
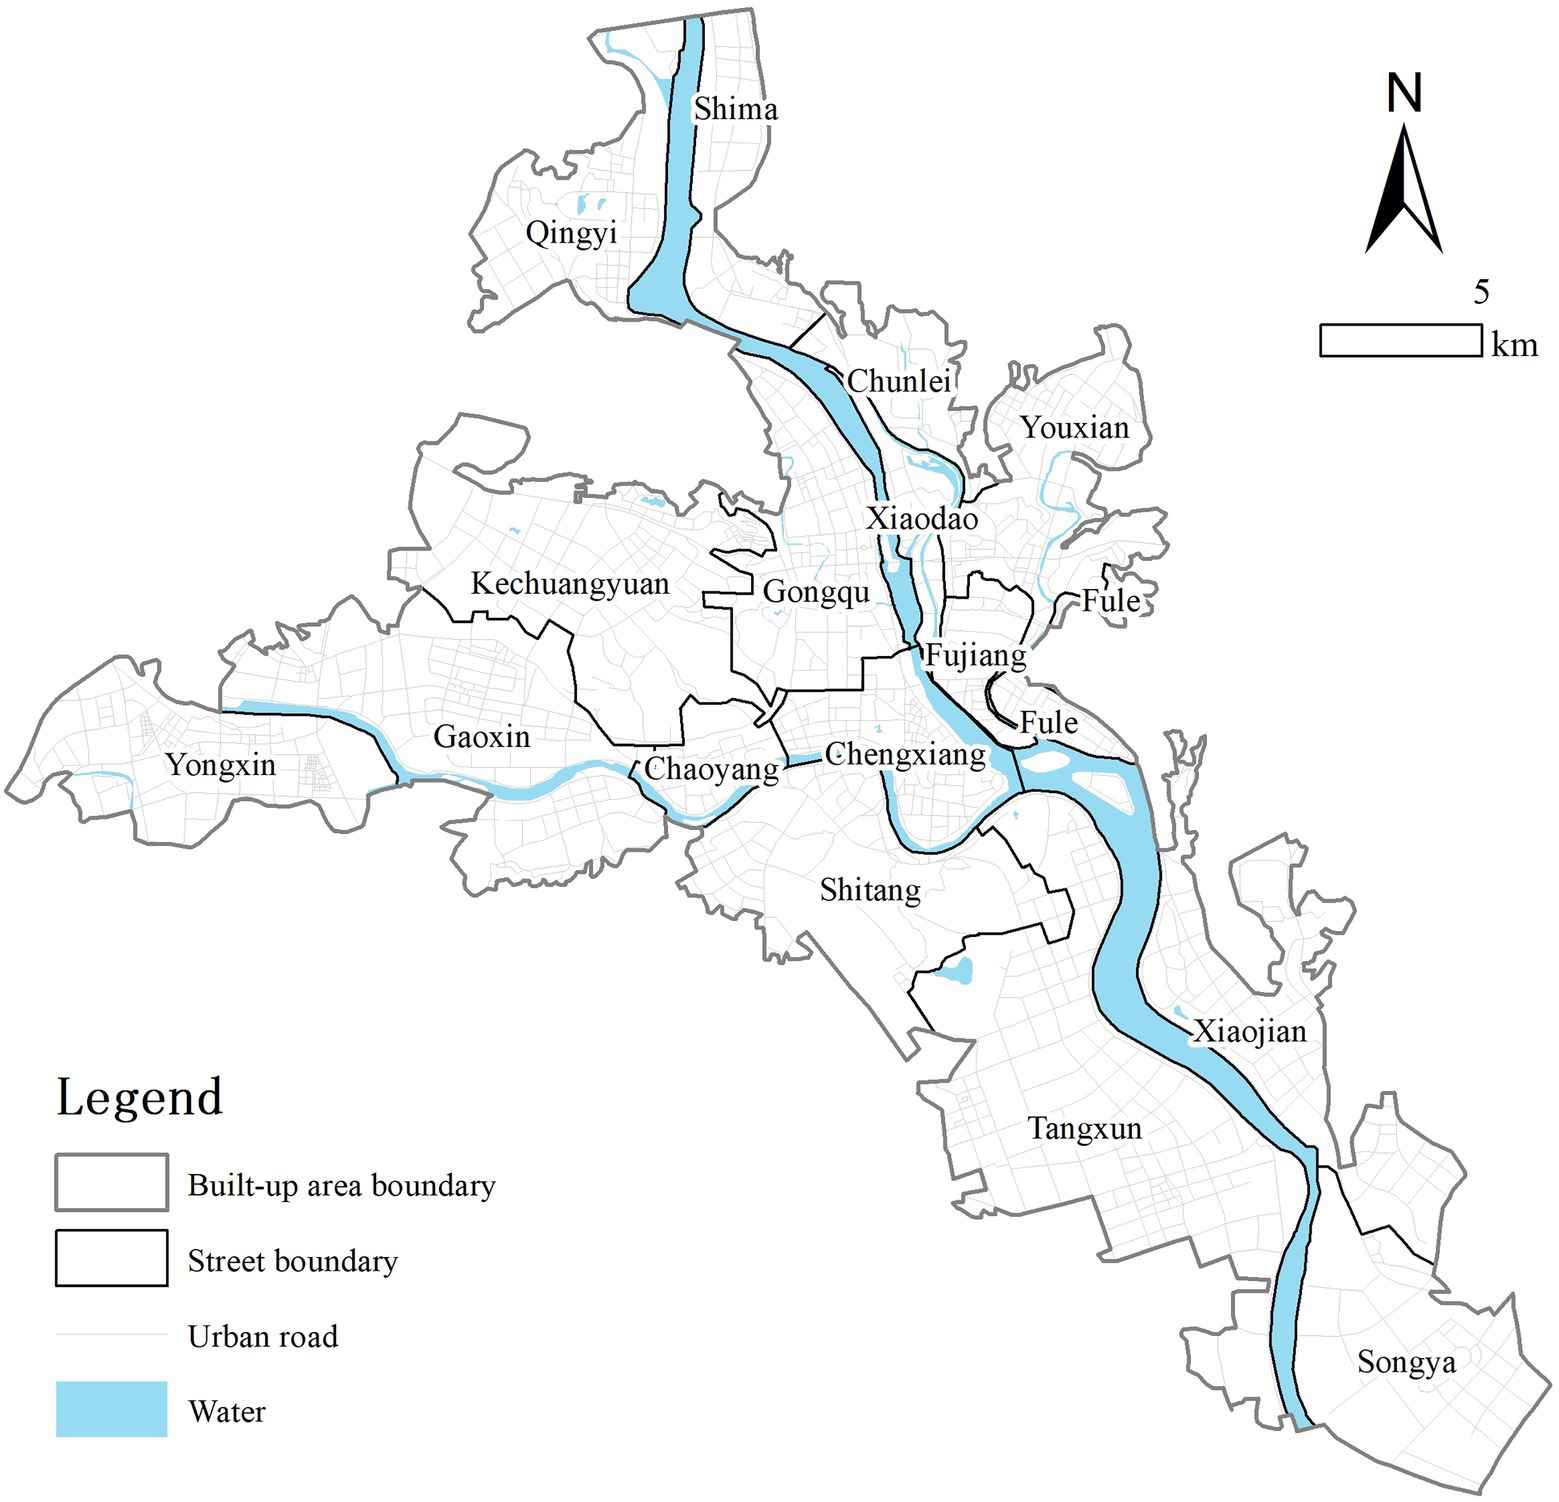
Figure 1. Overview of the study area.
Figure 2A shows the spatial distribution of the demand points and population sizes. We used points of interest in residential districts, obtained from Baidu electronic maps2 in January 2022, to represent the demand points. The population size data were derived from 100 m × 100 m population grid data published on the WorldPop platform3 in 2020. First, we corrected for population size using data from the seventh census. Second, a Voronoi diagram was constructed based on the demand points. Finally, we used a spatial linking tool to connect the population sizes of the demand points. There were 1,125 residential districts with a total population of approximately 916,300.
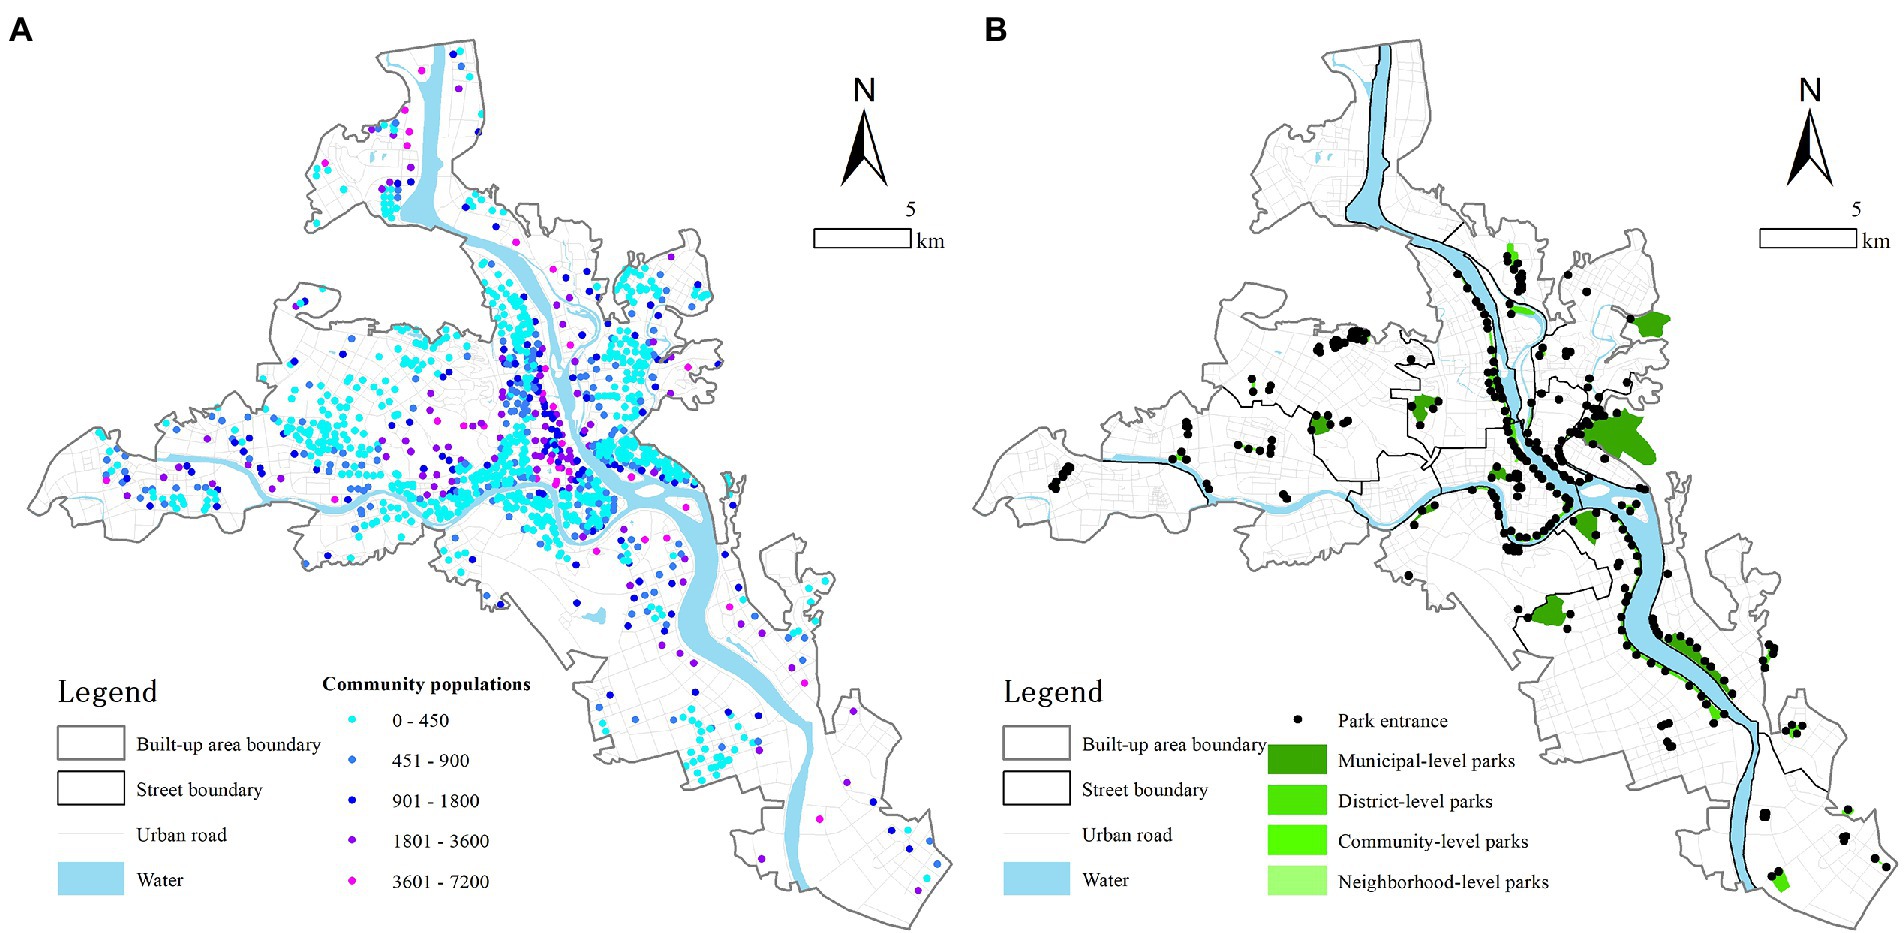
Figure 2. (A) Spatial distribution of residential district populations. (B) Locations of parks of various levels.
Figure 2B shows the spatial distribution of all UPGS levels and entrances, which represent the supply points. UPGS data were obtained from Mianyang Urban Green Space System Planning (MUGSSP; 2010–2020). Additionally, we referred to the MUGSSP and Standard for Urban Residential Area Planning and Design (GB50180-2018) to classify UPGS into four levels: municipal parks, district parks, community parks, and neighborhood parks. First, the location, scale, and entrances of the UPGSs were supplemented or deleted by reference to internet maps and by field research. Next, because of the importance of walking to health, we determined the walking time thresholds for the different levels of UPGS as 30, 15, 10, or 5 min by referring to the Standard for Urban Residential Area Planning and Design (GB50180-2018; Yang et al., 2021). Third, UPGSs not included in the plans were determined according to their scale and classified as neighborhood-level parks (area < 1 hm2), community-level parks (1 hm2 ≤ area < 5 hm2), or municipal-level parks (area ≥ 5 hm2). To make the accessibility calculation more accurate near the boundary areas, we included Yufucun Forest Park and Fuleshan Park near the boundary. Table 2 shows the number, area, and area ratio at all UPGS levels. Seventy-six instances of UPGS were observed, with an area of 698.91 hm2 and 277 entrances.
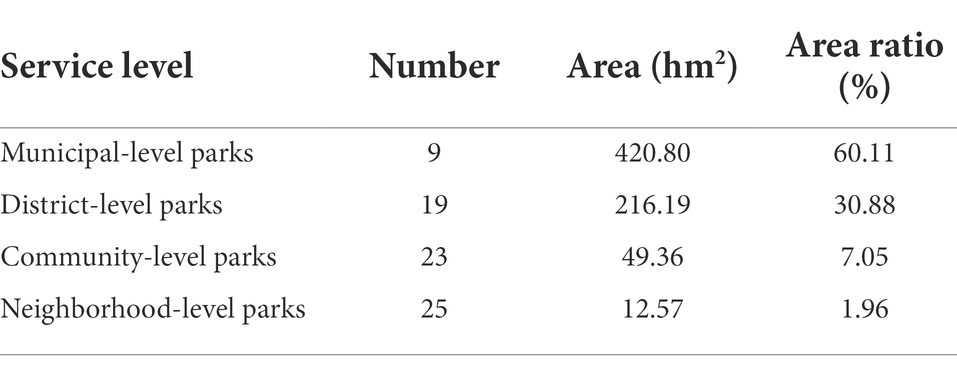
Table 2. Overview of park statistics in the study area.
The actual walking time was used to express the connection between the supply points and the demand points. The road network models provided by internet map service providers are more accurate than self-constructed models. First, we initiated the path-planning request with the coordinates of the supply points as the parameter through the path-planning interfaces of Baidu E-Map and Gaode E-Map. Next, the walking time data between each supply and demand point were obtained using a Python program. Finally, the shortest time between the demand and supply points was collected as the actual walking time.
In this study exploring variability in park quality, higher evaluation score values indicate higher quality in the UPGS quality model. Seventy-six urban parks were evaluated for their attractiveness and classified into four levels: low (0.178–0.693), second lowest (0.694–1.251), second highest (1.252–2.177), and high (2.178–3.344) quality by Natural Breaks (Figure 3), which is a statistical method for grading and classifying classes according to the distribution of numerical statistics and can maximize the difference between classes.
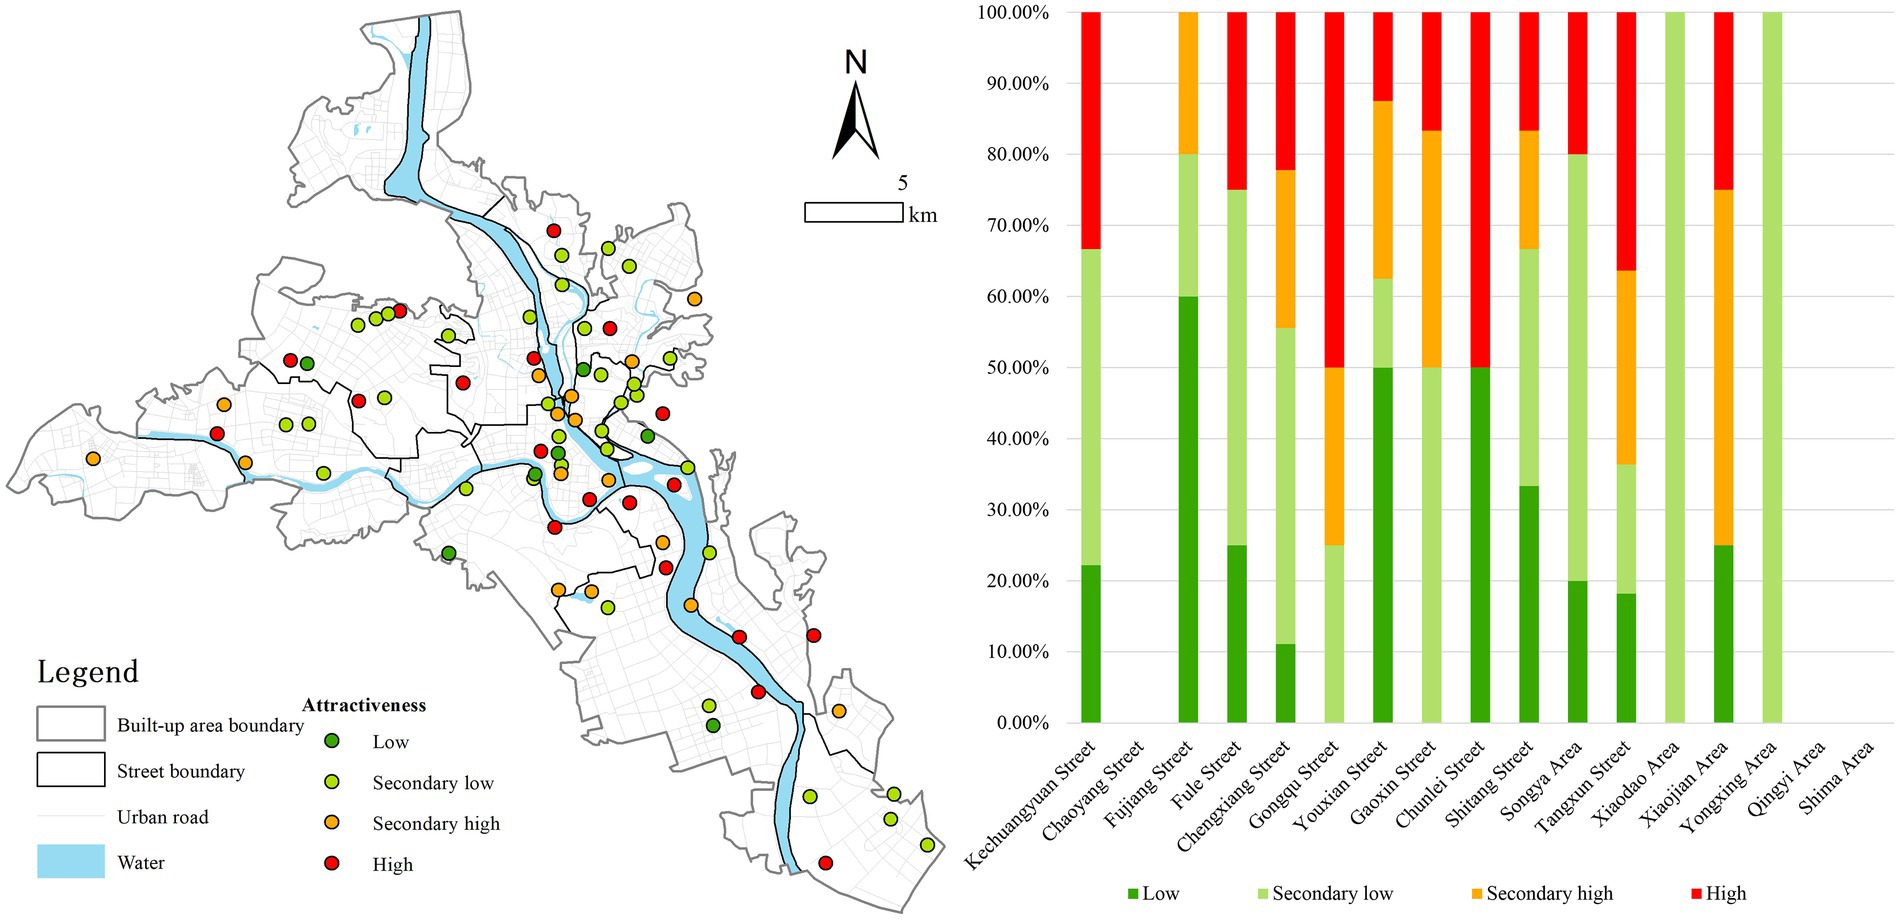
Figure 3. Spatial distribution of various parks with different levels of attractiveness.
Significant differences were observed in the spatial distribution of UPGS of different qualities: (1) Low-quality UPGS were mainly at the eastern edges of urban areas. Most of them were small in size and had infrastructure that provided places for the surrounding residents to interact with each other. However, insufficient leisure facilities, a poor activity environment and visual sensory experience, and insufficient safety controls decreased residents’ attraction to these UPGSs. (2) The north of the Anchang River contained most of the second-lowest quality UPGSs. They had a better OTC and visual sensory experience than the low-quality UPGS. (3) Both sides of the Fujiang and Furong Rivers contained most of the high-quality UPGS. Compared with the less attractive parks, they can provide certain leisure and entertainment venues and facilities for residents. (4) Finally, the distribution of high-quality UPGS was more balanced than that of other UPGSs, with an overall “7’’ distribution matching the study areas’ urban form. UPGSs of all qualities had an appropriate green space environment, complete infrastructure, good leisure and entertainment activities, good visual and sensory experiences, and effective safety controls.
Next, we counted the quantity ratio of each level of UPGS in each street district. The results showed large differences in the quality of construction in each street area: (1) Gongqu Street, Tangxun Street, and the Xiaojian Area had the largest proportion (75.00%, 63.64%, and 75.00%, respectively) of second-highest-quality UPGSs and above, indicating that UPGS construction in these three locations is better than in other areas, followed by Gaoxin Street and Chunlei Street, both with 50.00%; and (2) the number ratio of the second-lowest-quality UPGSs and below in all other streets was larger, with an average value of 76.26%, indicating that UPGS quality is poor in most street districts.
The current park area per capita is approximately 7.62 m2 in the study area, and the MUGSSP determined that the park area per capita would be 9.02 m2 at the end of the planning period and 11 m2 in the long term. Referring to a related study (Zhao et al., 2022), the accessibility results were classified into six levels: extremely poor (= 0), poor (>0–3.8), slightly poor (≥3.8–7.62), average (≥7.62–9.0), good (≥9.0–11), and excellent (≥11).
We found that the accessibility of UPGS levels differs as follows: (1) the spatial distribution of accessibility at the neighborhood (Figure 4A), community (Figure 4B), and district levels (Figure 4C) is generally consistent with the spatial characteristics of UPGS, which indicates that accessibility is positively proportional to supply quality and inversely proportional to demand and travel time; (2) municipal-level UPGSs (Figure 4D) show a characteristic of “low in the west and high in the east,” which is not significantly related to the UPGSs’ layout. The extremely poorly accessible residential districts are at the edge of the urban area and are far away in time terms, as residents cannot walk to a municipal park within 30 min; (3) poorly accessible residential districts are mainly located in the urban center, such as on Gongqu, Chengxiang, and Kechuangyuan Streets. Although some residents can walk to a municipal park within 30 min in these areas, many residents have poor access due to the inadequate road network and large population size; and (4) highly accessible residential districts are mainly located on the eastern edges of Youxian, Chunlei Street, and Xiaojian District. These areas have easy access and high-quality UPGS, which covers most of the neighborhoods in the area.
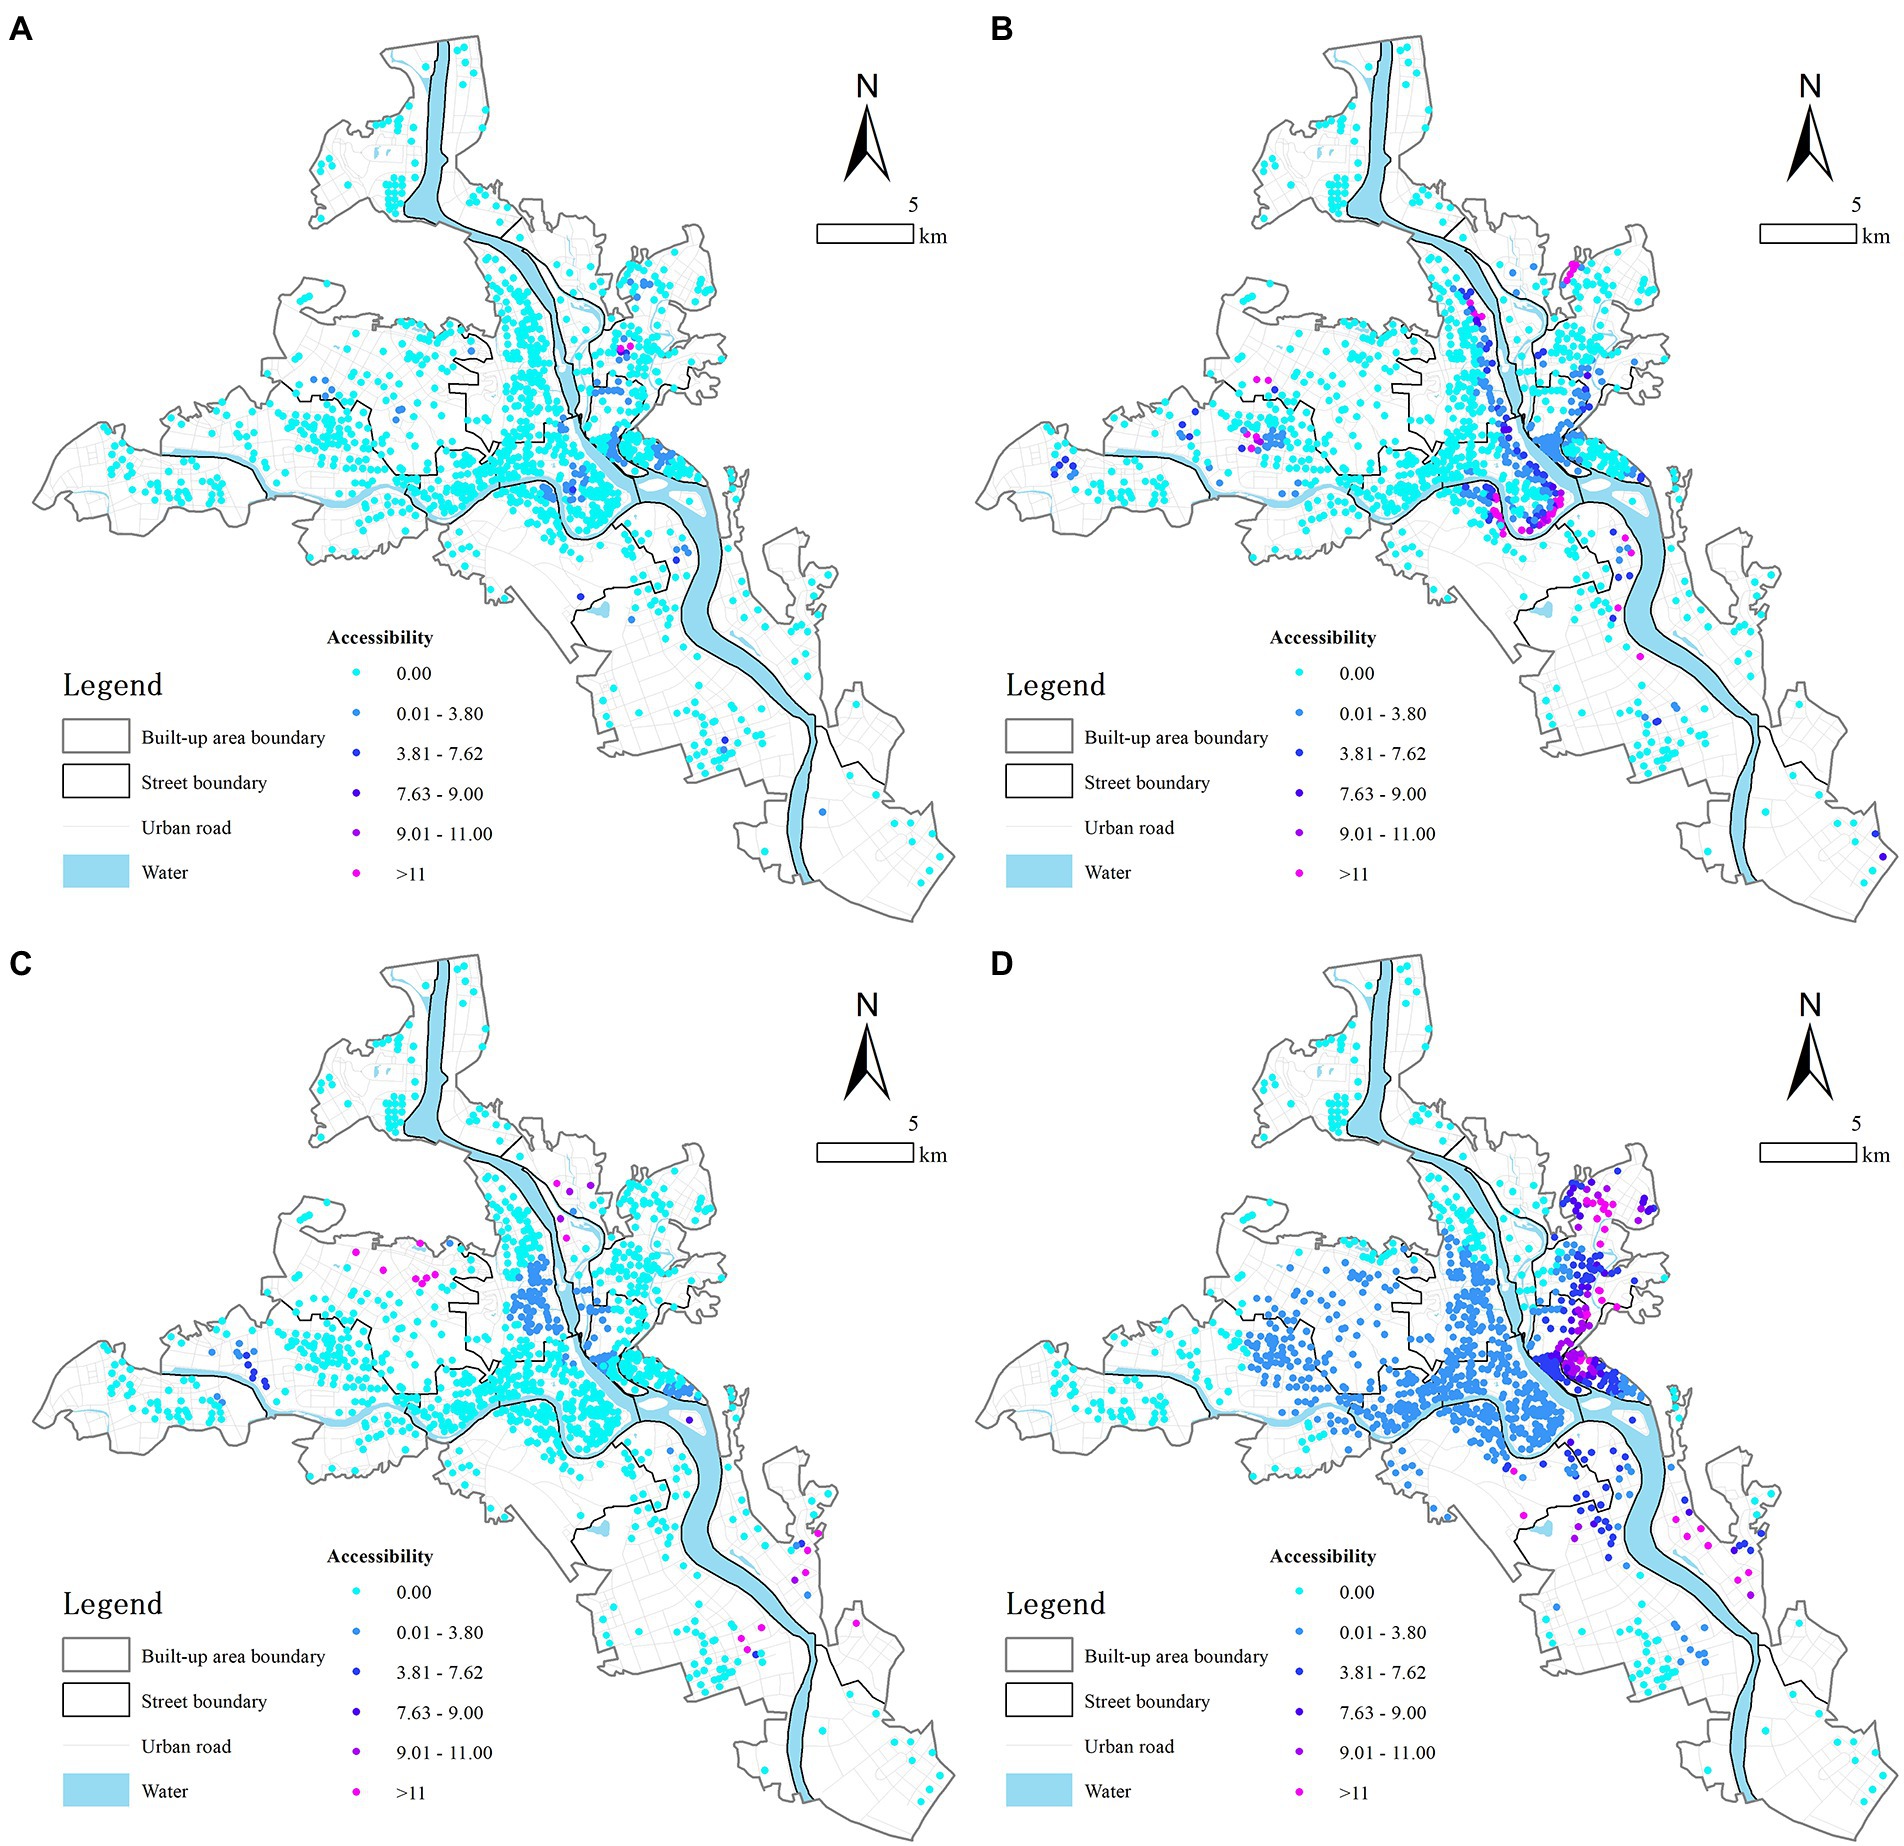
Figure 4. Spatial distribution of the accessibility of various level of parks. (A) Neighborhood-level parks. (B) Community-level parks. (C) District-level parks. (D) Municipal-level parks.
In addition, Table 3 shows the results for the accessibility of UPGS for different levels (i.e., the travel time threshold). Municipal-level UPGS was significantly better than UPGS at the district, community, and neighborhood levels: (1) municipal-level UPGS had a smaller standard deviation (3.864) and a more reasonable spatial layout than other types of UPGS; (2) 84.98%, 72.80%, and 91.11% of residential districts (accessibility index = 0) were unable to access a district, community, or neighborhood-level UPGS within the required walking time; and (3) 75.56% of residential districts had access to municipal-level UPGS, which was 5.03, 2.78, and 8.50 times more than that of the other types of UPGS.
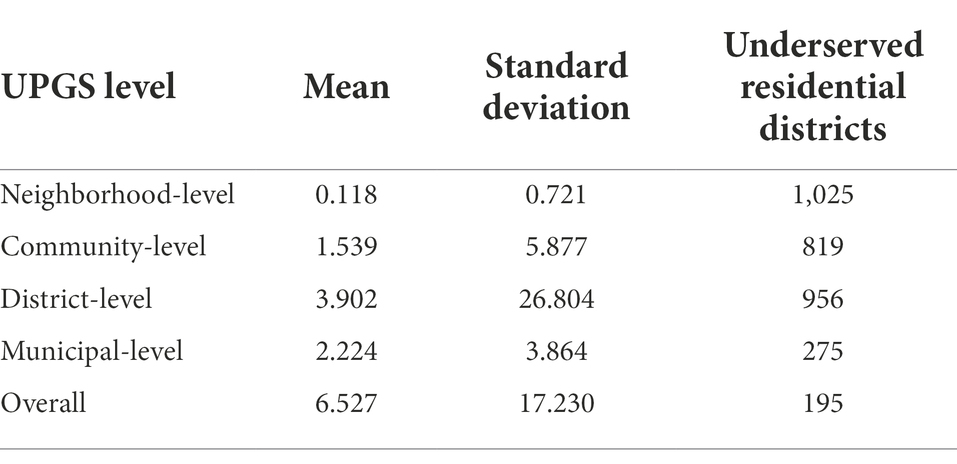
Table 3. Statistical description of UPGS accessibility values under different UPGS levels.
We obtained overall accessibility by summing the accessibility index of the four levels of UPGS. Next, overall accessibility was graded using the method discussed in the section “Data Source and Pre-processing” (Figure 5). Accessibility distribution was generally characterized by a “decreasing trend along the riverbanks and inwards, with poor accessibility overall,” and was similar to the spatial characteristics of UPGS that had a positive correlation between accessibility index and the size and number of UPGS areas.
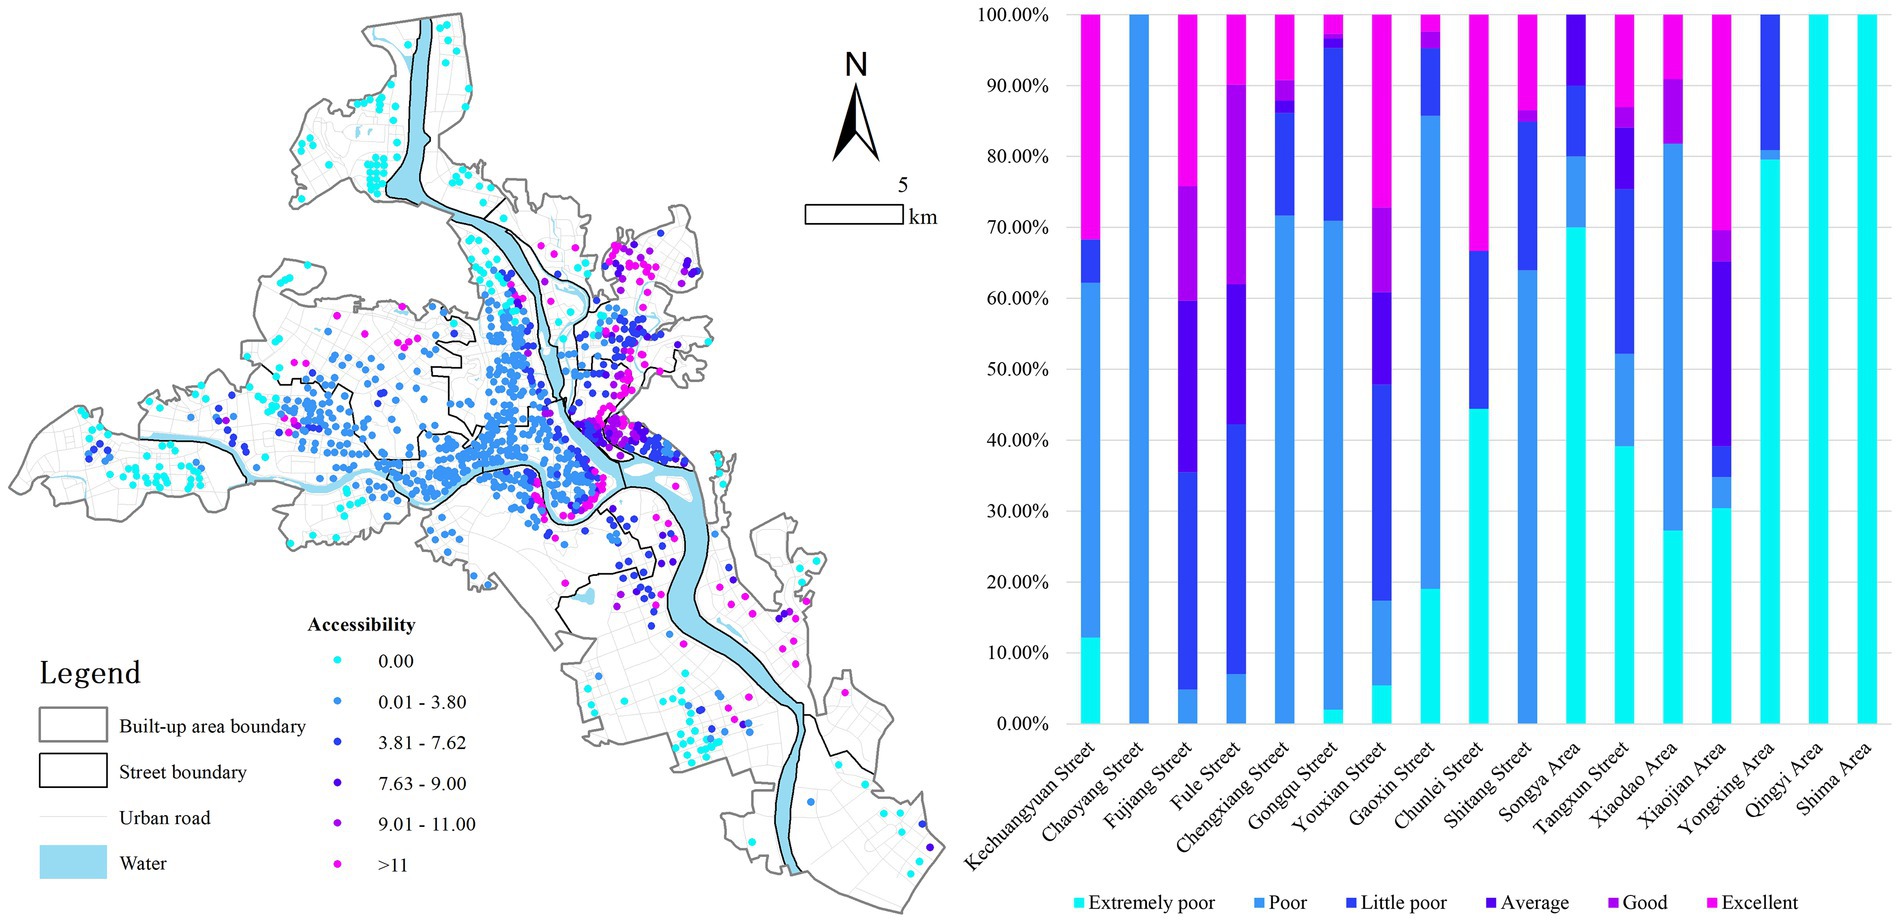
Figure 5. Spatial distribution of overall park accessibility in the study area.
Next, the number ratio of residential districts with different accessibility on each street district was counted: (1) the number ratios of residential districts with good and excellent accessibility were largest in Fuliang, Youxian, and Fule Streets (40.33%, 39.14%, and 38.08%, respectively), meaning that overall, accessibility in these three streets was relatively good; (2) the number ratios of residential districts with extremely poor accessibility were largest in Shima, Qingyi, and Yongxing districts (100%, 100%, and 79.55%, respectively); and (3) 93.27, 86.13, and 84.89% of the residential districts on Gongqu, Chengxiang, and Shitang Streets, respectively, had poor or slightly poor accessibility, indicating that accessibility is relatively poor in these three areas.
The reasons for conducting this analysis were that (1) after years of building a landscape and ecological garden city, UPGSs in these areas have been effectively strung together to form a landscape corridor that benefits the surrounding residents; (2) district- and community-level UPGS had not been effectively implemented under the MUGSSP; and (3) the overall quantity, scale, and quality of UPGS are low and cannot fulfill residents’ demand for a high-quality outdoor environment.
Based on the same dataset, we compared the overall accessibility index calculated using the traditional 2SFCA model and the Huff-2SFCA model. We obtained accessibility difference by using the results of conventional 2SFCA minus Huff-2SFCA. Larger difference values indicate larger model gaps and negative values indicate underestimated accessibility. Differences were calculated for the accessibility of 1,125 residential districts and graded into five classes: underestimated (−17.115–0.000), second smallest (0.001–13.494), small (13.495–27.082), second largest (27.083–53.777), and large (53.778–122.969) by Natural Breaks in 4.1 (Figure 6).
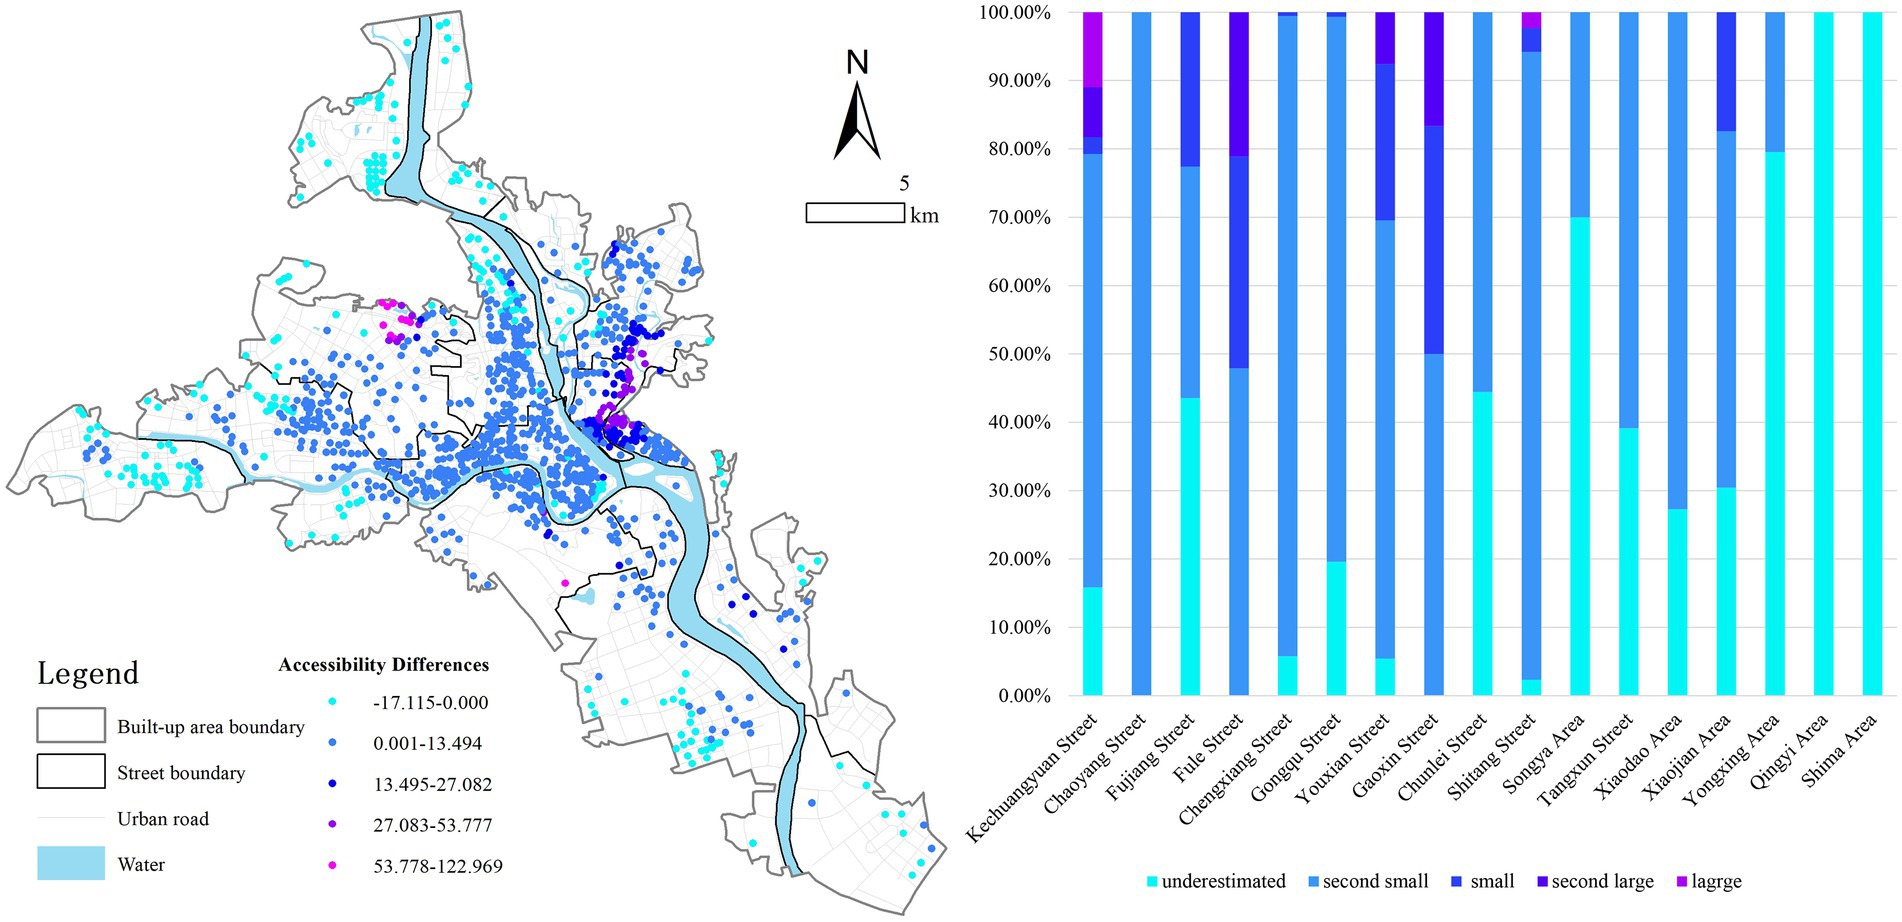
Figure 6. Spatial distribution of accessibility differences in the study area.
The accessibility difference distribution was generally characterized by a “decreasing trend along large UPGSs and outwards, with overestimated accessibility,” and was similar to the spatial characteristics of the overall accessibility of UPGS. The findings are as follows: (1) the 221 underestimated residential districts were mainly located at the edge of the study area, with a quantity ratio of 19.64%, which is similar to the spatial characteristics of underserved areas; (2) 775 residential districts with small differences were mainly located in the central part, with a quantity ratio of 68.89%. Compared to other areas, they have more accessible parks of higher quality; (3) other residential districts mainly located near Fule Park and Kexuecheng Park. These areas are close to larger parks, but the QI difference between accessible UPGSs is large.
Next, we counted the quantity ratio of each level of difference value class in each street district. The results show that (1) except for Qingyi and Shima Areas, Songya and Yongxing Areas had the largest proportion (70.00 and 79.55%, respectively) of underestimated residential districts; (2) Chaoyang, Chengxiang and Shitang Streets had the largest proportion (100.00%, 94.22% and 95.35%, respectively) of small residential districts and below, indicating that the two models do not differ significantly in these areas; (3) Kechuangyuan, Fule, and Gaoxin Streets had the largest proportion (18.30%, 21.13% and 16.67%, respectively) of second-largest residential districts and above, indicating that the two models in these areas differ significantly.
To improve the allocation of green space resources, it is necessary to understand the relationship between UPGS supply and citizen demand. First, we performed a Z-score normalized calculation of population size. Next, we defined high-supply residential districts (accessibility index ≥7.62) and low-supply residential districts (accessibility index <7.62). Finally, accessibility and population sizes were superimposed. The results were divided into four categories: high demand–high supply; high demand–low supply; low demand–high supply; and low demand–low supply (Figure 7).
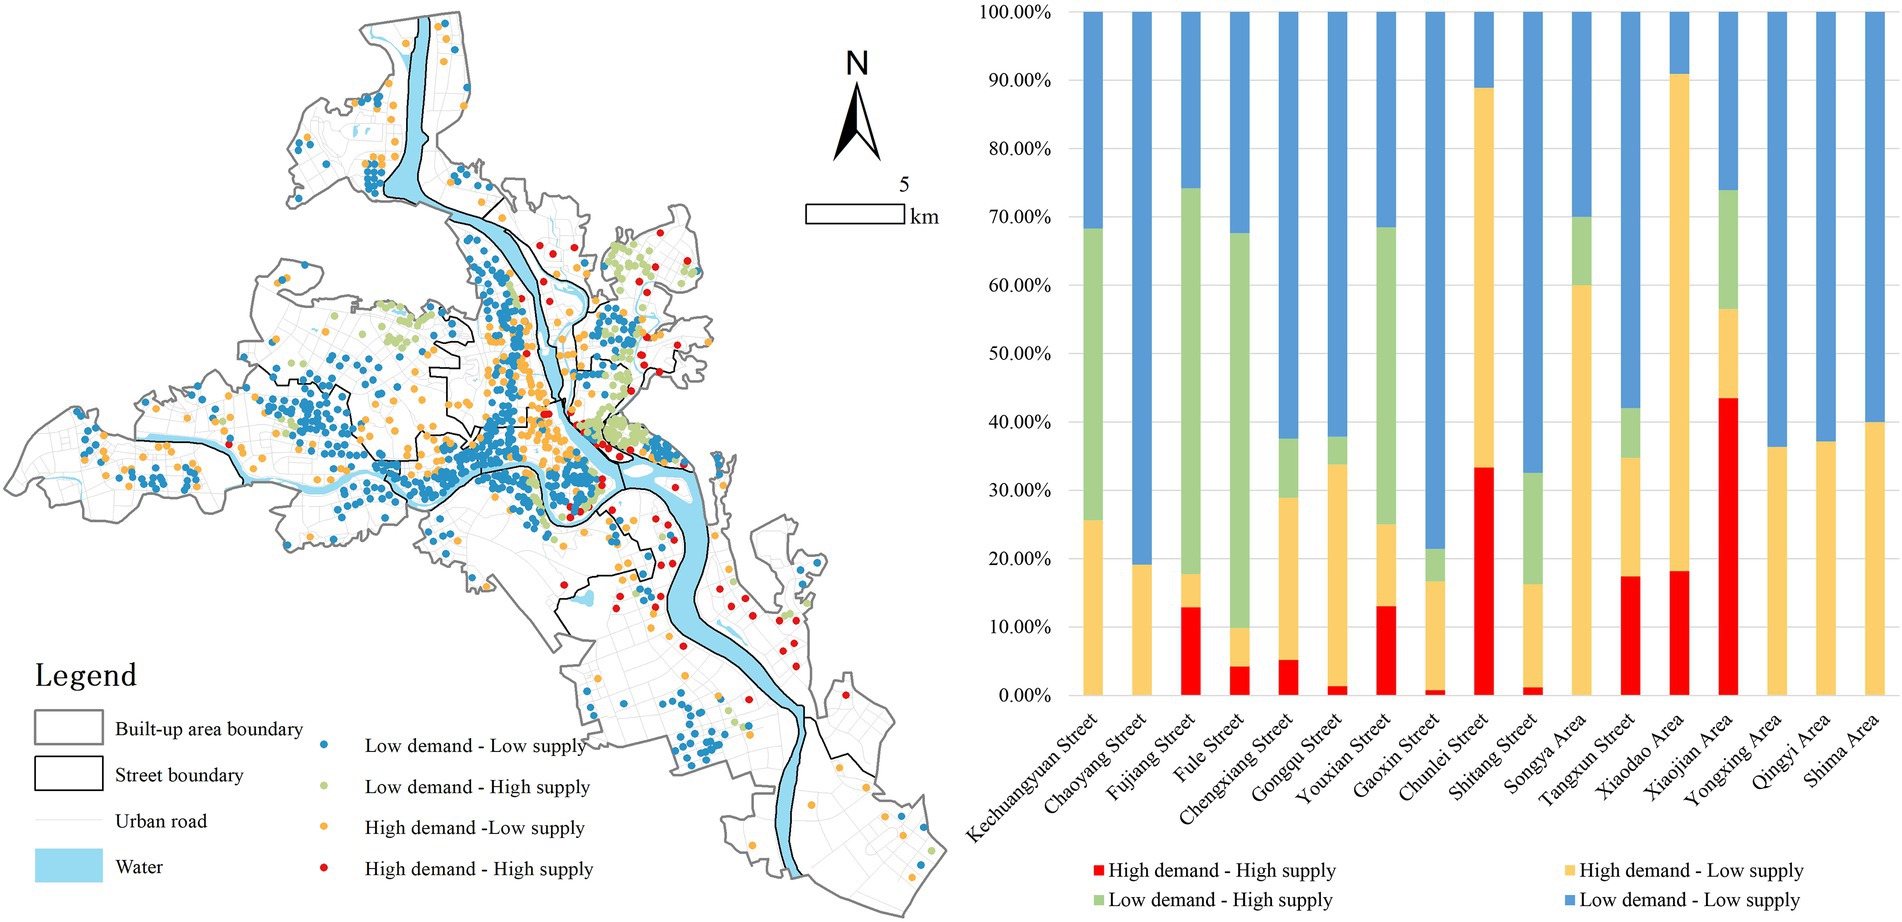
Figure 7. Spatial distribution of supply and demand relationships in the study area.
The findings are as follows: (1) the 64 high-demand–high-supply residential districts were mainly located close to the banks of the Fujiang and Furong Rivers, where there was higher demand than in other areas, with an average population of 1,760. These residential districts were closer in time than the other districts to the landscape corridor; thus, the residential plots mostly showed high-demand–high-supply characteristics; (2) the 243 high-demand–low-supply residential districts were scattered across various street districts, indicating that the high-demand residential districts had poor UPGS accessibility; and (3) there were 193 low-demand–high-supply residential districts with a quantity ratio of 17.16%. The distribution characteristics were similar to the distribution of high UPGS accessibility, indicating a certain “population–green space mismatch”; and (4) the 625 low-demand–low-supply residential districts, the largest in number, were mainly located on the streets on both sides of the Anchang River and relatively far from the Fujiang and Furong Rivers.
Our statistics showed the number ratio of the different types of residential districts in each street area: (1) Xiaojian district had the largest proportion of high-demand–high-supply residential districts (43.48%), indicating the best supply–demand match; (2) Chunlei street, Songya district, and Xiaodao district had the largest proportion of high-demand–low-supply plots, at 55.56%, 60.00%, and 72.73%, respectively; (3) the number of low-demand–high-supply residential districts was largest on Kechuangyuan Street, Fujiang River Street, Fule Street, and Youxian Street, at 42.68%, 56.45%, 57.75%, and 43.48% respectively, indicating a “population–green space mismatch” problem in these seven streets and districts; and (4) other street areas all had a larger number ratio of low-demand–low-supply communities than others, with an average of 66.22%, indicating that these areas have development potential. Thus, plans for and construction of UPGS should consider residents’ needs.
Walking time, supply quality, and public demand are the main factors that affect the accessibility and health-promotion benefits of UPGS. Walking time significantly affects public participation in park activities. The literature has seldom considered the impact of scale and quality factors on supply capacity, resulting in differences in accessibility assessment. Due to the lack of sufficient land in urban areas to provide a natural environment, upgrading the quality of existing UPGS is an effective measure for fulfilling the public’s physical and mental health needs in the post-pandemic era. In addition, as discussed above, high-quality parks enable the public to push the limits of minimum travel times in destination selection. Therefore, when determining whether and where individuals will be able to avail of activities in UPGSs, a comprehensive consideration of these three factors is necessary. In this study, the three parameters of time, supply, and demand were integrated into the 2SFCA model. First, quality indicators including OTC, infrastructure, leisure facilities, visual sensory factors, management, and safety were integrated to improve the supply parameters with the health-promotion characteristics of UPGS as the quality evaluation component. Second, a variable service range threshold was adopted for the pedestrian mode to ensure that high-level UPGS corresponded to a larger service range. Third, the competitive effect between heterogeneous UPGSs avoids overestimating accessibility. These improvements ensure that the accessibility assessment method proposed in this paper is more accurate than the existing methods in the literature in identifying underserved areas.
The empirical research in this paper has policy implications for the planning, conservation, and management of parks in urban areas. First, this study proposes an index of relative park quality based on OTC, infrastructure, recreational facilities, visual sensory factors, and management and safety. Thus, urban planners and policymakers can use the evaluation framework to identify low-quality UPGS around cities and determine how to improve their quality. Second, this accessibility assessment allows for the accurate monitoring of vulnerable residential districts without access to nature. In terms of access to park health services, residents of underserved residential districts are unable to enjoy services or access UPGS within acceptable walking times. Residents of high-demand–low-supply residential districts can access UPGS within acceptable walking times, but they are less likely to visit those UPGSs, which may be due to long walking times, small size, or poor quality. For underserved residential districts, UPGSs within acceptable walking times should be built to improve services. For high-demand–low-supply residential districts, urban planners should consider optimizing the pedestrian transportation network and enhancing the quality of UPGS. In the post-pandemic era, urban residents are experiencing a public health crisis, and improving the accessibility of UPGS can help promote the recovery of urban residents’ physical and mental health and maintain sustainable urban development. These improvements are important for fulfilling public needs and promoting a quality, healthy urban development.
However, the weights of park quality characteristics in this study were determined based on the questionnaire data by constructing an entropy method model, which is somewhat subjective. In further research, more accurate results may be obtained based on using objective data combined with an analytic hierarchy process. Because population size data is difficult to obtain, in this study, we used a reprocessing of the population distribution raster, which has some errors when compared with the real population size. In the future, more accurate data can be obtained through collection from property websites, remote sensing inverse calculation, cell phone signaling data derivation, and government consultation. In addition, accessibility studies could be conducted for specific groups because of differences in park activity preferences. Fourth, we only studied park accessibility with respect to walking mode. In the future, accessibility can be calculated based on residents’ different travel patterns. Fifth, we considered only the environmental characteristics of UPGS, and certain external environmental characteristics can also seriously affect UPGS quality. Further research should integrate key external environmental features and further revise the Huff-2SFCA model (Guo et al., 2022; Zhao et al., 2022).
In cities, the only provision of natural or semi-natural environments for urban residents is UPGS. We highlighted the fact that urban park green space (UPGS) fulfills the physical and mental health needs of the public and that its accessibility affects its health-promotion benefits. However, studies have not considered the impact of heterogeneous UPGS on residents’ needs. In this study, we introduced the characteristics of UPGSs’ health-promotion benefits into the quality evaluation and used an improved Huff-2SFCA model to calculate accessibility. The model takes into consideration not only the time factor but also the size and quality of the UPGS. This study successfully identified 195 residential districts that are underserved by UPGS and 243 high-demand–low-supply residential districts that are in urgent need of improvement, possibly because of the long walking time between UPGSs and residential districts, poor UPGS quality, and small size.
The original contributions presented in the study are included in the article/Supplementary material, further inquiries can be directed to the corresponding author.
Ethical review and approval was not required for the study on human participants in accordance with the local legislation and institutional requirements. The patients/participants provided their written informed consent to participate in this study.
XW and CZ: conceptualization, funding acquisition, investigation, methodology, software, validation, visualization, and writing—original draft. LY and JF: data curation, funding acquisition, methodology, supervision, and writing—review and editing. YB and XL: conceptualization, methodology, resources, funding acquisition, and writing—review and editing. All authors contributed to the article and approved the submitted version.
This research was supported by the 2022 Guangdong Philosophy and Social Science Foundation (Grant No. GD22XGL02), the Sichuan Landscape and Recreation Research Center (Grant No. JGYQ2021036), Department of Education of Guangdong Province (Grant No. 2021KTSCX004), Department of Housing and Urban–Rural Development of Guangdong Province (Grant No. 2021-K2-305243), the Identification and the Optimization of Healthy Places in Urban Public Space (Grant No. 21zx7147), the Fundamental Research Funds for the Central Universities (Grant No. QNMS202211), Guangzhou Philosophy and Social Science Planning 2022 Annual Project (Grant No. 2022GZQN14), Science and Technology Program of Guangzhou, China (Grant No. 202102020302), State Key Laboratory of Subtropical Building Science, South China University of Technology (Grant No. 2021ZB16), and China Postdoctoral Science Foundation (Grant No. 2021 M701249).
The authors would like to thank the respondents for their participation in the survey.
During the study, YB and XL were employed by the Architectural Design & Research Institute Co., Ltd.
The remaining authors declare that the research was conducted in the absence of any commercial or financial relationships that could be construed as a potential conflict of interest.
The reviewer YO declared a shared affiliation with the author XL (The University of Hong Kong—different departments).
All claims expressed in this article are solely those of the authors and do not necessarily represent those of their affiliated organizations, or those of the publisher, the editors and the reviewers. Any product that may be evaluated in this article, or claim that may be made by its manufacturer, is not guaranteed or endorsed by the publisher.
The Supplementary material for this article can be found online at: https://www.frontiersin.org/articles/10.3389/fevo.2022.1083563/full#supplementary-material
Ahn, J. J., Kim, Y., Lucio, J., Corley, E. A., and Bentley, M. (2020). Green spaces and heterogeneous social groups in the US. Urban For. Urban Green. 49:126637. doi: 10.1016/j.ufug.2020.126637
Biernacka, M., Kronenberg, J., and Łaszkiewicz, E. (2020). An integrated system of monitoring the availability, accessibility and attractiveness of urban parks and green squares. Appl. Geogr. 116:102152. doi: 10.1016/j.apgeog.2020.102152
Branas, C. C., Cheney, R. A., MacDonald, J. M., Tam, V. W., Jackson, T. D., and Ten Have, T. R. (2011). A difference-in-differences analysis of health, safety, and greening vacant urban space. Am. J. Epidemiol. 174, 1296–1306. doi: 10.1093/aje/kwr273
Chang, C. Y., Hammitt, W. E., Chen, P. K., Machnik, L., and Su, W. C. (2008). Psychophysiological responses and restorative values of natural environments in Taiwan. Landsc. Urban Plan. 85, 79–84. doi: 10.1016/j.landurbplan.2007.09.010
Chang, H. S., and Liao, C. H. (2011). Exploring an integrated method for measuring the relative spatial equity in public facilities in the context of urban parks. Cities 28, 361–371. doi: 10.1016/j.cities.2011.04.002
Chen, Y., Stephens, M., and Jones, C. A. (2019). Does Residents’ satisfaction with the neighbourhood environment relate to Residents’ self-rated health? Evidence from Beijing. Int. J. Environ. Res. Public Health 16:5051. doi: 10.3390/ijerph16245051
Cheng, Y. Y., Zhang, J. G., Wei, W., and Zhao, B. (2021). Effects of urban parks on residents’ expressed happiness before and during the COVID-19 pandemic. Landsc. Urban Plan. 212:104118. doi: 10.1016/j.landurbplan.2021.104118
Cheung, P. K., and Jim, C. Y. (2018). Subjective outdoor thermal comfort and urban green space usage in humid-subtropical Hong Kong. Energ. Buildings 173, 150–162. doi: 10.1016/j.enbuild.2018.05.029
Cohen, D. A., Marsh, T., Williamson, S., Derose, K. P., Martinez, H., Setodji, C., et al. (2010). Parks and physical activity: why are some parks used more than others? Prev. Med. 50, S9–S12. doi: 10.1016/j.ypmed.2009.08.020
Dai, D. (2011). Racial/ethnic and socioeconomic disparities in urban green space accessibility: where to intervene? Landsc. Urban Plan. 102, 234–244. doi: 10.1016/j.landurbplan.2011.05.002
Dony, C. C., Delmelle, E. M., and Delmelle, E. C. (2015). Re-conceptualizing accessibility to parks in multi-modal cities: a variable-width floating catchment area (VFCA) method. Landsc. Urban Plan. 143, 90–99. doi: 10.1016/j.landurbplan.2015.06.011
Edwards, N., Hooper, P., Knuiman, M., Foster, S., and Giles-Corti, B. (2015). Associations between park features and adolescent park use for physical activity. Int. J. Behav. Nutr. Phys. Act. 12:21. doi: 10.1186/s12966-015-0178-4
Ekkel, E. D., and de Vries, S. (2017). Nearby green space and human health: evaluating accessibility metrics. Landsc. Urban Plan. 157, 214–220. doi: 10.1016/j.landurbplan.2016.06.008
Fan, P., Xu, L., Yue, W., and Chen, J. (2017). Accessibility of public urban green space in an urban periphery: the case of Shanghai. Landsc. Urban Plan. 165, 177–192. doi: 10.1016/j.landurbplan.2016.11.007
Fong, K. C., Hart, J. E., and James, P. (2018). A review of epidemiologic studies on greenness and health: updated literature through 2017. Curr. Environ. Health Rep. 5, 77–87. doi: 10.1007/s40572-018-0179-y
Francis, J., Giles-Corti, B., Wood, L., and Knuiman, M. (2012). Creating sense of community: the role of public space. J. Environ. Psychol. 32, 401–409. doi: 10.1016/j.jenvp.2012.07.002
Gibson, S. C. (2018). “Let’s go to the park.” An investigation of older adults in Australia and their motivations for park visitation. Landsc. Urban Plan. 180, 234–246. doi: 10.1016/j.landurbplan.2018.08.019
Gidlow, C. J., Ellis, N. J., and Bostock, S. (2012). Development of the neighbourhood green space tool (NGST). Landsc. Urban Plan. 106, 347–358. doi: 10.1016/j.landurbplan.2012.04.007
Giles-Corti, B., Broomhall, M. H., Knuiman, M., Collins, C., Douglas, K., Ng, K., et al. (2005). Increasing walking: how important is distance to, attractiveness, and size of public open space? Am. J. Prev. Med. 28, 169–176. doi: 10.1016/j.amepre.2004.10.018
Grigsby-Toussaint, D. S., Chi, S.-H., Fiese, B. H., and Group, S. K. P. W. (2011). Where they live, how they play: neighborhood greenness and outdoor physical activity among preschoolers. Int. J. Health Geogr. 10:66. doi: 10.1186/1476-072X-10-66
Guo, W., Ding, Y., Yang, G., and Liu, X. (2022). Research on the indicators of sustainable campus renewal and reconstruction in pursuit of continuous historical and regional context. Buildings 12:1508. doi: 10.3390/buildings12101508
Haque, A. M., Hossain, M. R., Farhan, M. H. M., and Neema, M. N. (2013). “An innovative approach to assess the quality of major parks in environmentally degraded Mega-City Dhaka,” in Proceedings of the computational science and its applications (ICCSA 2013) PT III. 2013, 394–407.
Hegetschweiler, K. T., de Vries, S., Arnberger, A., Bell, S., Brennan, M., Siter, N., et al. (2017). Linking demand and supply factors in identifying cultural ecosystem services of urban green infrastructures: a review of European studies. Urban For. Urban Green. 21, 48–59. doi: 10.1016/j.ufug.2016.11.002
Hirabayashi, S., and Nowak, D. J. (2016). Comprehensive national database of tree effects on air quality and human health in the United States. Environ. Pollut. 215, 48–57. doi: 10.1016/j.envpol.2016.04.068
Ifdil, I., Fadli, R. P., Suranata, K., Zola, N., and Ardi, Z. (2020). Online mental health services in Indonesia during the COVID-19 outbreak. Asian J. Psychiatr. 51:102153. doi: 10.1016/j.ajp.2020.102153
Javadi, R., and Nasrollahi, N. (2021). Urban green space and health: the role of thermal comfort on the health benefits from the urban green space; a review study. Build. Environ. 202:108039. doi: 10.1016/j.buildenv.2021.108039
Jiang, L. L., Wang, H., Wang, S. W., Hu, Z. F., Tong, A. H., and Wang, Y. F. (2022). The spatial correlation between green high-quality development and technology finance. Front. Environ. Sci. 10:888547. doi: 10.3389/fenvs.2022.888547
King, D. K., Litt, J., Hale, J., Burniece, K. M., and Ross, C. (2015). ‘The park a tree built’: evaluating how a park development project impacted where people play. Urban For. Urban Green. 14, 293–299. doi: 10.1016/j.ufug.2015.02.011
Li, Z. G., Chen, D., Cai, S. Z., and Che, S. Q. (2018). The ecological services of plant communities in parks for climate control and recreation-a case study in Shanghai, China. PLoS One 13:e196445. doi: 10.1371/journal.pone.0196445
Li, H., Chen, W., and He, W. (2015). Planning of green space ecological network in urban areas: An example of Nanchang, China. Int. J. Environ. Res. Public Health 12, 12889–12904. doi: 10.3390/ijerph121012889
Li, Z., Fan, Z., Song, Y., and Chai, Y. (2021). Assessing equity in park accessibility using a travel behavior-based G2SFCA method in Nanjing, China. J. Transp. Geogr. :96. doi: 10.1016/j.jtrangeo.2021.103179
Lin, Y. Y., Zhou, Y. H., Lin, M. S., Wu, S. D., and Li, B. Y. (2021). Exploring the disparities in park accessibility through mobile phone data: evidence from Fuzhou of China. J. Environ. Manag. 281:10. doi: 10.1016/j.jenvman.2020.111849
Liu, S. L. (2015). “Urban Park planning on spatial disparity between demand and supply of park service,” in Proceedings of the 3rd International Conference On Advances In Energy And Environmental Science 2015. pp. 1167–1171.
Lopez, B., Kennedy, C., Field, C., and McPhearson, T. (2021). Who benefits from urban green spaces during times of crisis? Perception and use of urban green spaces in new York City during the COVID-19 pandemic. Urban For. Urban Green. 65:127354. doi: 10.1016/j.ufug.2021.127354
Luo, J. (2014). Integrating the huff model and floating catchment area methods to analyze spatial access to healthcare services. Trans. GIS 18, 436–448. doi: 10.1111/tgis.12096
Luo, W., and Wang, F. (2003). Measures of spatial accessibility to health care in a GIS environment: synthesis and a case study in the Chicago region. Environ. Plan. B Plan. Design 30, 865–884. doi: 10.1068/b29120
Ma, L., Luo, N., Wan, T., Hu, C., and Peng, M. (2018). An improved healthcare accessibility measure considering the temporal dimension and population demand of different ages. Int. J. Environ. Res. Public Health 15:2421. doi: 10.3390/ijerph15112421
Marconi, P. L., Perelman, P. E., and Salgado, V. G. (2022). Green in times of COVID-19: urban green space relevance during the COVID-19 pandemic in Buenos Aires City. Urban Ecosyst. doi: 10.1007/s11252-022-01204-z [Epub ahead of print].
Miyake, K. K., Maroko, A. R., Grady, K. L., Maantay, J. A., and Arno, P. S. (2010). Not just a walk in the park: methodological improvements for determining environmental justice implications of park access in new York City for the promotion of physical activity. Cities Environ. 3, 1–17. doi: 10.15365/cate.3182010
Moore, L. V., Roux, A. V. D., Evenson, K. R., McGinn, A. P., and Brines, S. J. (2008). Availability of recreational resources in minority and low socioeconomic status areas. Am. J. Prev. Med. 34, 16–22. doi: 10.1016/j.amepre.2007.09.021
Nicholls, S. (2001). Measuring the accessibility and equity of public parks: a case study using GIS. Manag. Leis. 6, 201–219. doi: 10.1080/13606710110084651
Radke, J., and Mu, L. (2000). Spatial decompositions, Modeling and mapping service regions to predict access to social programs. Geograp. Info. Sci. 6, 105–112.
Reid, C. E., Rieves, E. S., and Carlson, K. (2022). Perceptions of green space usage, abundance, and quality of green space were associated with better mental health during the COVID-19 pandemic among residents of Denver. PLoS One 17:e263779. doi: 10.1371/journal.pone.0263779
Rigolon, A. (2016). A complex landscape of inequity in access to urban parks: a literature review. Landsc. Urban Plan. 153, 160–169. doi: 10.1016/j.landurbplan.2016.05.017
Schipperijn, J., Bentsen, P., Troelsen, J., Toftager, M., and Stigsdotter, U. K. (2013). Associations between physical activity and characteristics of urban green space. Urban For. Urban Green. 12, 109–116. doi: 10.1016/j.ufug.2012.12.002
Shaohua, T. A. N., and Wanmin, Z. (2007). Social and psychological benefit of urban green space. J. Chongqing Jianzhu Univ. 29, 6–10.
Sister, C., Wolch, J., and Wilson, J. (2010). Got green? Addressing environmental justice in park provision. GeoJournal 75, 229–248. doi: 10.1007/s10708-009-9303-8
Ta, N., Li, H., Zhu, Q., and Wu, J. (2021). Contributions of the quantity and quality of neighborhood green space to residential satisfaction in suburban Shanghai. Urban For. Urban Green. :64. doi: 10.1016/j.ufug.2021.127293
Tu, X. Y., Huang, G. L., Wu, J. G., and Guo, X. (2020). How do travel distance and park size influence urban park visits? Urban For. Urban Green. 52:126689. doi: 10.1016/j.ufug.2020.126689
Veitch, J., Ball, K., Crawford, D., Abbott, G. R., and Salmon, J. (2012). Park improvements and park activity: a natural experiment. Am. J. Prev. Med. 42, 616–619. doi: 10.1016/j.amepre.2012.02.015
Venter, Z. S., Barton, D. N., Gundersen, V., Figari, H., and Nowell, M. S. (2021). Back to nature: Norwegians sustain increased recreational use of urban green space months after the COVID-19 outbreak. Landsc. Urban Plan. :214. doi: 10.1016/j.lurbplan.2021.104175
Wei, F. (2017). Greener urbanization? Changing accessibility to parks in China. Landsc. Urban Plan. 157, 542–552. doi: 10.1016/j.landurbplan.2016.09.004
Wolch, J. R., Byrne, J., and Newell, J. P. (2014). Urban green space, public health, and environmental justice: the challenge of making cities ‘just green enough’. Landsc. Urban Plan. 125, 234–244. doi: 10.1016/j.landurbplan.2014.01.017
Xie, B., An, Z. H., Zheng, Y. L., and Li, Z. G. (2018). Healthy aging with parks: association between park accessibility and the health status of older adults in urban China. Sustain. Cities Soc. 43, 476–486. doi: 10.1016/j.scs.2018.09.010
Xing, L., Liu, Y., Wang, B., Wang, Y., and Liu, H. (2020). An environmental justice study on spatial access to parks for youth by using an improved 2SFCA method in Wuhan, China. Cities :96. doi: 10.1016/j.cities.2019.102405
Yang, L., Liu, J., Liang, Y., Lu, Y., and Yang, H. (2021). Spatially varying effects of street greenery on walking time of older adults. ISPRS Int. Geo-Inf. 10:596. doi: 10.3390/ijgi10090596
Yang, Z., Zhang, H., Ding, Y., and Sun, Y. (2015). Progress and prospect on urban green space research. Prog. Geogr. 34, 18–29. doi: 10.11820/dlkxjz.2015.01.003
Yu, B. Q., Che, S. Q., Xie, C. K., and Tian, S. (2018). Understanding Shanghai Residents' perception of leisure impact and experience satisfaction of Urban Community parks: An integrated and IPA method. Sustain. For. 10:1067. doi: 10.3390/su10041067
Zhang, J., Cheng, Y., and Zhao, B. (2021). How to accurately identify the underserved areas of peri-urban parks? An integrated accessibility indicator. Ecol. Indic. 122:107263. doi: 10.1016/j.ecolind.2020.107263
Zhang, G., and He, B.-J. (2021). Towards green roof implementation: drivers, motivations, barriers and recommendations. Urban For. Urban Green. 58:126992. doi: 10.1016/j.ufug.2021.126992
Zhang, Y., Van den Berg, A. E., Van Dijk, T., and Weitkamp, G. (2017). Quality over quantity: contribution of urban green space to Neighborhood satisfaction. Int. J. Environ. Res. Public Health 14:535. doi: 10.3390/ijerph14050535
Zhao, M., Yao, Z., and Mao, D. (2022). Spatial accessibility analysis of urban green space under walking condition in Xinxiang main urban area based on i2SFCA. J. Nanjing Forest. Univ. 46, 227–232.
Keywords: health benefits, park quality, Huff-2SFCA model, spatial accessibility, urban park green space
Citation: Wei X, Zhao C, Yan L, Fu J, Bao Y and Liu X (2022) Spatial accessibility analysis of green space from a health-benefit perspective: Implications for healthy urban development. Front. Ecol. Evol. 10:1083563. doi: 10.3389/fevo.2022.1083563
Edited by:
Linchuan Yang, Southwest Jiaotong University, ChinaReviewed by:
Yifu Ou, The University of Hong Kong, Hong Kong SAR, ChinaCopyright © 2022 Wei, Zhao, Yan, Fu, Bao and Liu. This is an open-access article distributed under the terms of the Creative Commons Attribution License (CC BY). The use, distribution or reproduction in other forums is permitted, provided the original author(s) and the copyright owner(s) are credited and that the original publication in this journal is cited, in accordance with accepted academic practice. No use, distribution or reproduction is permitted which does not comply with these terms.
*Correspondence: Xiao Liu, eGlhb2xpdUBzY3V0LmVkdS5jbg==
†These authors have contributed equally to this work and share first authorship
Disclaimer: All claims expressed in this article are solely those of the authors and do not necessarily represent those of their affiliated organizations, or those of the publisher, the editors and the reviewers. Any product that may be evaluated in this article or claim that may be made by its manufacturer is not guaranteed or endorsed by the publisher.
Research integrity at Frontiers
Learn more about the work of our research integrity team to safeguard the quality of each article we publish.