- 1School of Architecture and Urban Planning, Chongqing University, Chongqing, China
- 2International College, Krirk University, Bangkok, Thailand
The quantitative evaluation of urban water health (UWH) is a crucial decision-making process in water management. Healthy water not only encompasses excellent water quality and a diverse ecology but also has other characteristics, such as the amount of water resources, supply-use-drainage problems, flooding, water cycle, and so on. This study proposes a theoretical framework and an indicator system for UWH that integrates ecosystem health and water cycle health. Subsequently, considering the time scale and regional characteristics, an objective evaluation model that combined the real coding accelerated genetic algorithm (RAGA) method and the projection pursuit (PP) method was applied to calculate indicator weights and thresholds for the urban water health index (UWHI). UWHI standard thresholds were calculated as (0.04, 0.87], (0.87, 1.80], (1.80, 2.73], (2.73, 3.50], and (3.50, 4.01] corresponding to the categories of Sick, Unhealthy, Subhealthy, Healthy, and Excellent, respectively. Using Chongqing as a case study, the results showed that the UWHI increased from 1.796 to 2.668 in 2011–2020, and the health level improved from Unhealthy to Subhealthy, approaching Healthy. For each subsystem, the results indicated that the health status of the water cycle was superior to that of the water ecosystem. Finally, a detailed analysis of the changes in the indicators identified important factors affecting water health. The results of this study revealed that the main weaknesses in Chongqing were severe soil erosion, large domestic water use, high water consumption rates, and unsatisfactory water functional areas and indicated key priorities on the path to future water management.
1. Introduction
The negative effects of climate change and large-scale urbanization on the water cycle and natural water bodies can cause frequent flood disasters, water pollution, ecological degradation, and limited water resources, all of which pose a real challenge to water management (Yu et al., 2018; Chapagain et al., 2022). Therefore, it is critical to understand the status of the water cycle and water resources to maintain a healthy and sustainable water system (Xia et al., 2017; Yang et al., 2021).
The concept of water health is not currently clearly defined, varying the objects and fields. The term ecosystem health (EH) was first proposed by Rapport (1998). A healthy ecosystem was defined as stable and sustainable, maintaining its organization and autonomy over time and being resilient to stress. Many health assessments of rivers (Singh and Saxena, 2018; Cox et al., 2019; Wang et al., 2019; Sadat et al., 2020), wetlands (Agboola et al., 2016; Sun et al., 2016; Liu et al., 2020; Wu and Chen, 2020; Sahana et al., 2022), and lakes (Zhang et al., 2021; Hu et al., 2022) have been published. Water ecosystem health (WEH) initially emphasizes the integrity of an ecosystem and focuses primarily on physical and chemical factors, such as hydrology, water quality, and habitat, and secondarily on aquatic animals, such as phytoplankton, zooplankton, periphyton, invertebrates, and fish (Canobbio et al., 2008; Wang et al., 2019; Tampo et al., 2020). Subsequently, from a viewpoint of the coordination of the human–water relationship, social services also become a pertinent factor vis-a-vis WEH, such as flood control, water supply, and landscape (Deng et al., 2015; Pan et al., 2021). Some countries establish adaptive assessment systems for the health of rivers/lakes, such as the United States' Biological Integrity Index (IBI) and Rapid Biological Assessment Draft (RBP), Australia's River Assessment Scheme (RAS) and Index of Stream Condition (ISC), Sweden's Riparian, Channel and Environmental Inventory (RCE), and China's Technical Guidelines for River and Lake Health Assessment (GRLHA) (Wu et al., 2022). Health assessment is an ideal goal and a means of managing a particular river/lake due to its comprehensiveness and multi-scalability (Costanza, 2012). However, the concept of ecosystem health has limitations. On the one hand, the entities evaluated are specific to water bodies or watersheds, which are not applicable to a comprehensive evaluation of urban water systems. On the other hand, the evaluation results not only reflect the status of an aquatic ecosystem but also ignore the factors considered and the water motion processes that led to that status.
The water cycle underpins the formation of water resources and is the main driving force for the evolution of water environments and ecosystems (Zhang et al., 2017; Yang et al., 2021). The critical component of the water cycle has gradually transformed from a natural cycle to a dual natural–social cycle as a result of the significant impact of increased human activity (Brown and Mitchell, 2010; Wang and Jia, 2016). The social water cycle emphasizes the supply, use, drainage, treatment, and reuse of water (Zhang and Xiong, 2006; Zhang et al., 2017).
Zhang and Xiong (2006) realized that the water cycle was vital to water sustainability and then proposed the concept of a healthy water cycle (HWC). This concept is defined as a social water cycle that does not negatively affect the objective laws of a natural water cycle and emphasizes the rational development of water resources, efficient utilization, wastewater treatment, and regeneration during the process of water use. An implicit assumption is that a natural, undisturbed water cycle is the perfect state of an HWC. The natural and social water cycles interact with each other, and the social water cycle relies on the natural water cycle and has a negative impact on the water environment (Lu et al., 2016). Therefore, it is important to ensure that the social water cycle is not detrimental to the natural water cycle to finally realize environmentally sustainable development of a water system (Uche et al., 2015; Lu et al., 2016; Zhang et al., 2017). The scientific evaluation of the health status of the water cycle is conducive to formulating effective measures. For example, Zhang et al. (2017, 2020) and Jia et al. (2021) constructed HWC evaluation systems from the four aspects: water ecology, water quality, water quantity, and water use and analyzed the main factors affecting the health status. According to Wang et al. (2021), water cycle health status in the Beijing–Tianjin–Hebei region was gradually improving, but it was still mainly affected by water scarcity. The results of the water cycle health assessment can provide guidance for solving water resources and environmental problems.
Emphasizing the water cycle is an important and remarkable aspect of promoting urban water health (UWH). To achieve a harmonious relationship between people and water, water management must take a holistic approach that integrates natural and socio-economic water processes (Zhou, 2019). In pursuit of this goal, this study attempts to establish a comprehensive theoretical framework as a means to support water management and emphasizes the following aspects: (1) a definition of the concept of UWH that combines EH and HWC, and the establishment of an adaptive evaluation system, (2) the calculation of the weights of each indicator and the threshold range for each health level, and (3) the use of Chongqing as an example to evaluate UWH and identify the key factors that affect it.
2. Methodology
2.1. Study area and data
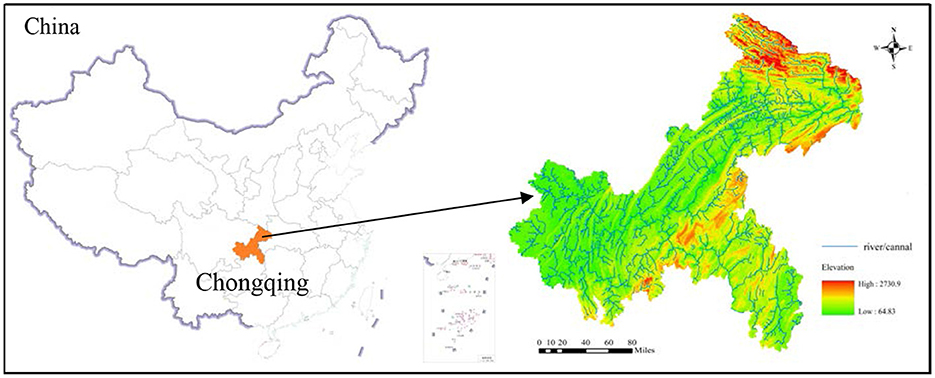
Chongqing is the only municipality in southwest China under the direct control of the central government (Figure 1). It covers an area of 82,400 km2 and has a population of 31.02 million with an urbanization rate of 65.5%. It is a mountain city; hills and mountains account for 76% of the city. The Yangtze River flows through Chongqing for 691 km and intersects with the Jialing River, the Wujiang River, and others. The mean annual temperature in the study area is 18°C, with the lowest in January and the highest in July and August (27–38°C). The amount of rainfall in Chongqing is 1,000–1,400 mm, and the average annual amount of rainfall is 1,183 mm, which is the most in the northeast and southeast and is the least in the west. The amount of rainfall from May to October accounts for more than 69% of the annual rainfall. Surface water resources are abundant in the study area. The annual average amount of surface water resources is ~56.78 billion cubic meters, and the annual average amount of transit water resources is ~383.7 billion cubic meters. However, water resources are abundant in the southeast and scarce in the northwest. At present, the proportion of exploitation of water resources is 10–15%.
As an important strategic fulcrum of western development, the connecting point of the “One Belt and One Road” and the Yangtze River economic belt, Chongqing plays a supportive and driving role in the pattern of national and regional development and an exemplary role in promoting green development in the Yangtze River economic belt. Striving for a balance between economic development and water protection, it is of great significance to evaluate its UWH.
All of the original data employed in this study are available from the Statistical Yearbook of Chongqing, Chongqing Environmental Quality Bulletin, Chongqing Water Resources Bulletin, Soil and Water Conservation Bulletin, and State Statistics Bureau.
2.2. The definition of UWH
Ecosystem health and HWC are distinct entities and have close connections. The former emphasizes the integrity of organizations and functions, focusing on the status of water bodies. The latter underlines the dual natural–social characteristics, but the social cycle does not affect the natural cycle, which concerns water motion processes. Therefore, from a viewpoint of the entirety of water management, it is meaningful to organically integrate HWC and EH into a single entity.
The water cycle is the link between the socioeconomic system and the water ecosystem. In the process of socio-economic development, the exploitation of water resources and the discharge of pollutants are important factors affecting water pollution and ecological degradation. Additionally, due to rapid urbanization, a large number of natural underlying surfaces have been transformed into impervious surfaces, resulting in surface runoff pollution and greater runoff, which increases the probability of flooding and water pollution. The water cycle has a profound impact on the health of a water ecosystem. By controlling socioeconomic behavior and urban development, the impact of the water cycle on a water ecosystem can be mitigated. Conversely, the limited carrying capacity and environmental capacity of water resources could restrict population expansion and the industry scale. Damaged rivers/lakes might barely meet social demands, resulting in the loss of some ecosystem services. Therefore, the water cycle and the water ecosystem interact with each other and are equally important.
Water problems are complex and systemic. The symptoms of water problems manifest in the water itself, but the causes lie elsewhere. To understand and solve complex water problems, it is necessary to integrate the water cycle and the water ecosystem from a systematic perspective. In this study, based on the water cycle and WEH theories, a conceptual framework for UWH has been proposed (Figure 2). The water cycle process includes the natural water cycle composed of “evaporation-precipitation-runoff-infiltration-exchange” and the social water cycle composed of “intake-delivery-use-discharge” (Zhang et al., 2017; Yang et al., 2021). On the one hand, an HWC implies that the social water cycle is not detrimental to the natural water cycle. In other words, to satisfy social demands, a model featuring low consumption and low emission of pollutants should be adopted as much as possible. On the other hand, as a result of the water cycle, the health status of the water ecosystem is characterized by abundant water resources, good water quality, healthy water ecology, and excellent water security. In summary, the connotation of UWH has the following characteristics: (1) water bodies or water resources sufficient to meet the needs of socioeconomic development; (2) a minimal impact of the social water cycle on the water ecosystem, with low consumption of resources and low discharge of pollutants; (3) minimal interference from urban construction in the natural water cycle; (4) ensuring that the organization and functions of water bodies are integral and sustainable; and (5) the absence of health hazards, threats to life, or property loss due to water pollution or water disasters.
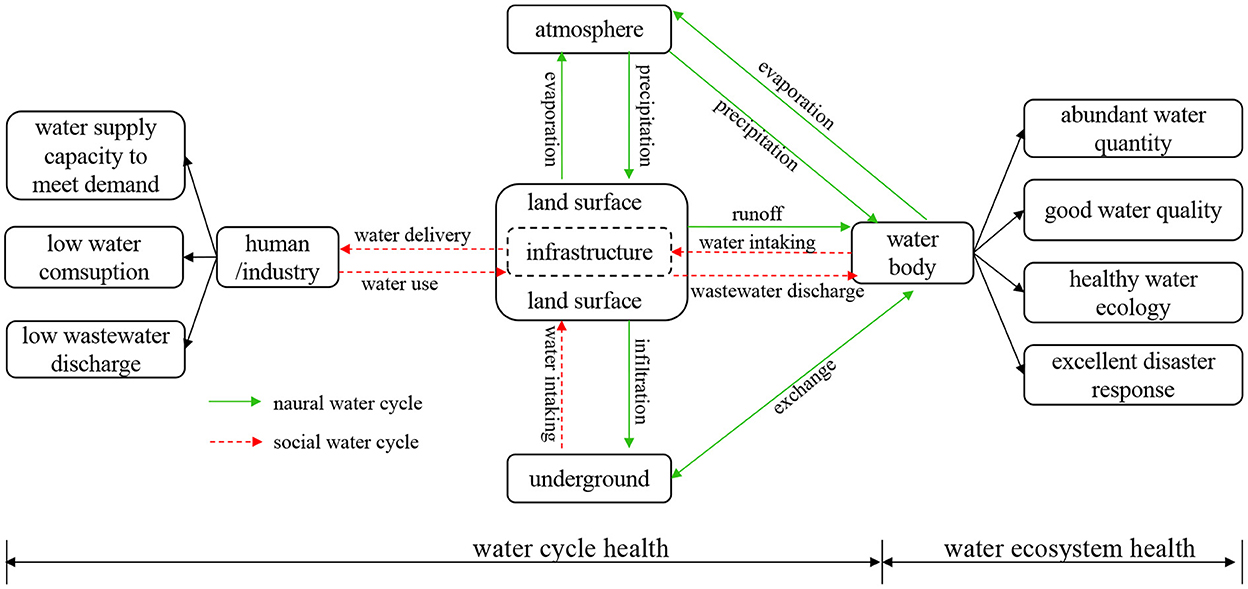
Figure 2. A conceptual framework of urban water health (UWH; Zhang and Xiong, 2006; Yang et al., 2021).
2.3. Construction of an indicator system
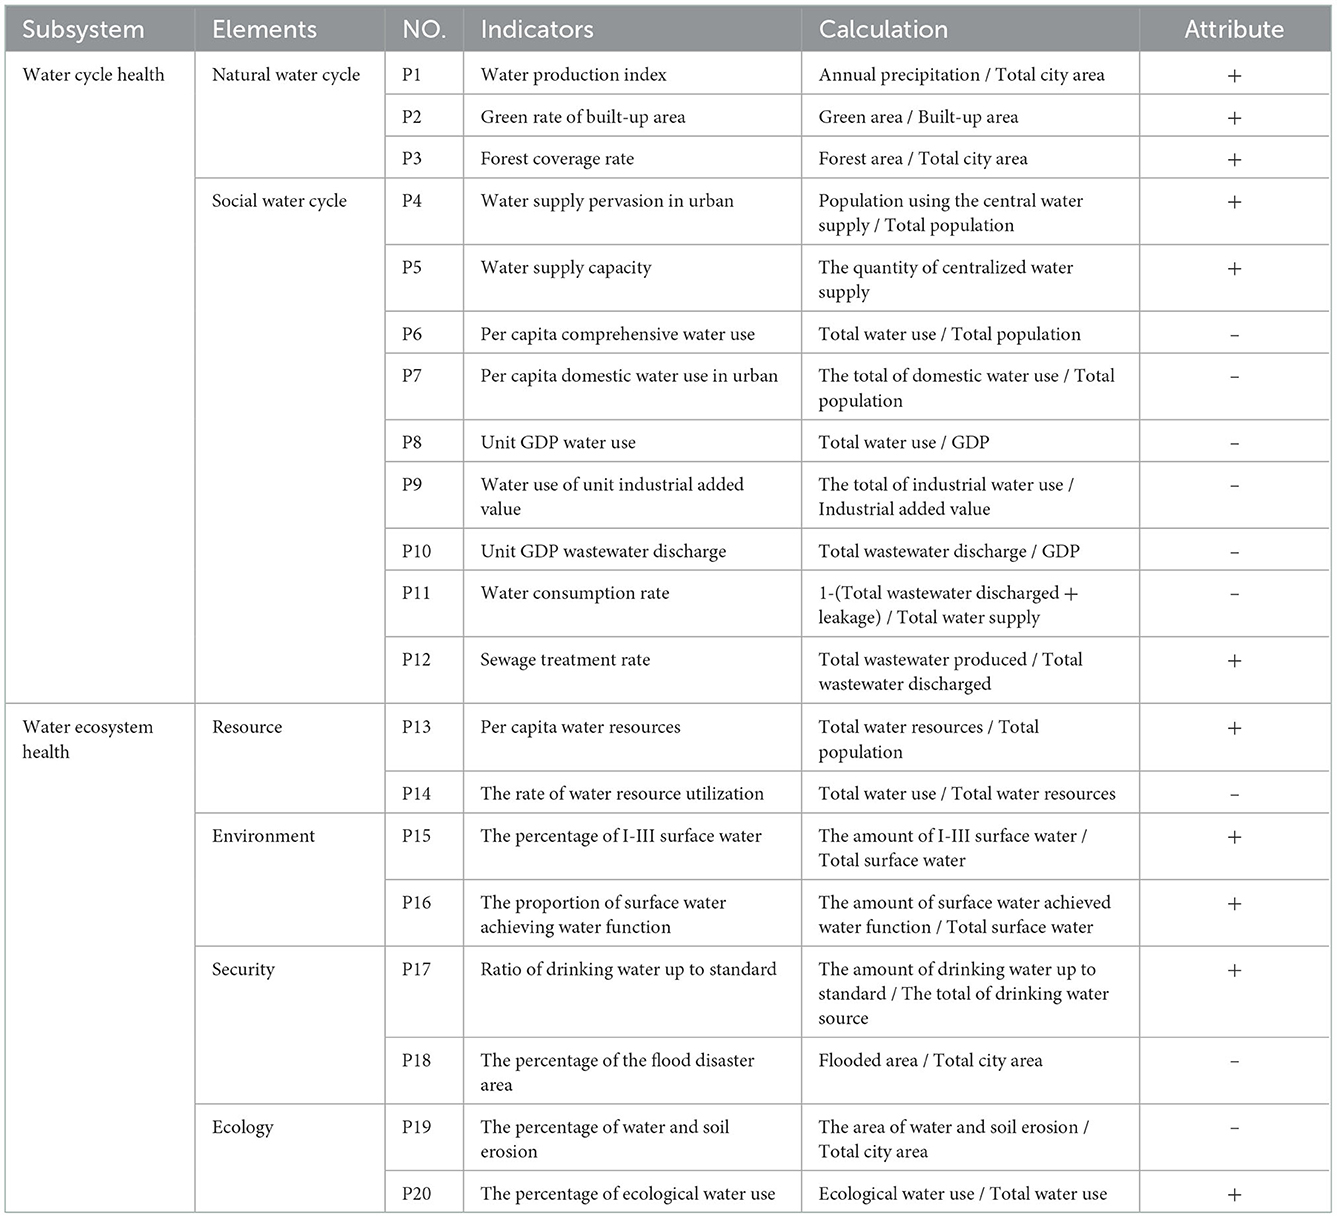
The selection of indicators should be reflected comprehensively according to a conceptual framework and the connotation of UWH and involved all links of the natural and social water cycles, as well as the elements of water resources, the environment, ecology, and security. As mentioned above, a UWH index (UWHI) is proposed.
Precipitation is not only one of the primary components that affect water resources but also a principal process of the natural water cycle. A water production index (P1) has been defined to represent precipitation (Yin et al., 2020). Urban construction greatly disturbs the natural underlying surfaces, significantly affecting the runoff and infiltration processes of the natural water cycle. Green space is an effective factor in reducing and mitigating flood disasters and the urban microclimate. The green rate of the built-up area (P2) and the forest coverage rate (P3) have been defined (Zhang et al., 2017; Chapagain et al., 2022). The supply of standard drinking water is the basis of the social water cycle, which can be indicated by the water supply pervasion in urban (P4) and the water supply capacity (P5) (Zhang et al., 2017; Yin et al., 2020; Chapagain et al., 2022). Water use and drainage in production and life are important links in the social water cycle. The utilization efficiency of water resources has a profound impact on the health of a water ecosystem. Per capita comprehensive water use (P6), per capita domestic water use in urban (P7), unit gross domestic product (GDP) water use (P8), and water use of unit industrial added value (P9) all reflect the efficiency of water use (Zhang et al., 2017; Chapagain et al., 2022). The unit GDP wastewater discharge (P10) represents the level of wastewater discharge (Yin et al., 2020). The water consumption rate (P11) reflects the loss in the process of supply-use drainage. Sewage treatment is a key process that mitigates the impact of social water on the natural water and is represented by the sewage treatment rate (P12) (Zhang et al., 2017; Yin et al., 2020).
Water ecosystem health takes into account water quantity, water quality, water ecology, and water security. The term water resource mainly considers the endowment of resources and the status of development, so the per capita water resource (P13) and the utilization rate of water resources (P14) were defined (Zhang et al., 2017; Yin et al., 2020). The water environment mainly evaluates water quality and water function, which are usually reflected by the percentage of I–III surface water (P15) and the ratio of areas that meet the function of water (P16) (Yin et al., 2020). The ratio of drinking water to standards (P17) and the percentage of flood disaster area (P18) represent the security of water quality and quantity, respectively (Chapagain et al., 2022). The ecological indicators of water mainly consider ecological problems and management. Due to the lack of ecological data, the percentage of soil and water loss area (P19) and the percentage of ecological water use (P20) indirectly reflect water ecology (Yin et al., 2020).
To be clear, due to the large size of Chongqing, it is difficult to directly monitor indicators related to water ecology, groundwater, runoff, and infiltration, so indirect indicators must be employed. Secondly, Chongqing has abundant surface water resources, and the amount of groundwater use is very small, so groundwater is rarely involved. Finally, a hierarchical indicator system has been established, comprising one target, two subsystems, and 20 indicators. The calculation and attributes of these indicators are shown in Table 1.
2.4. Determination of thresholds for indicators
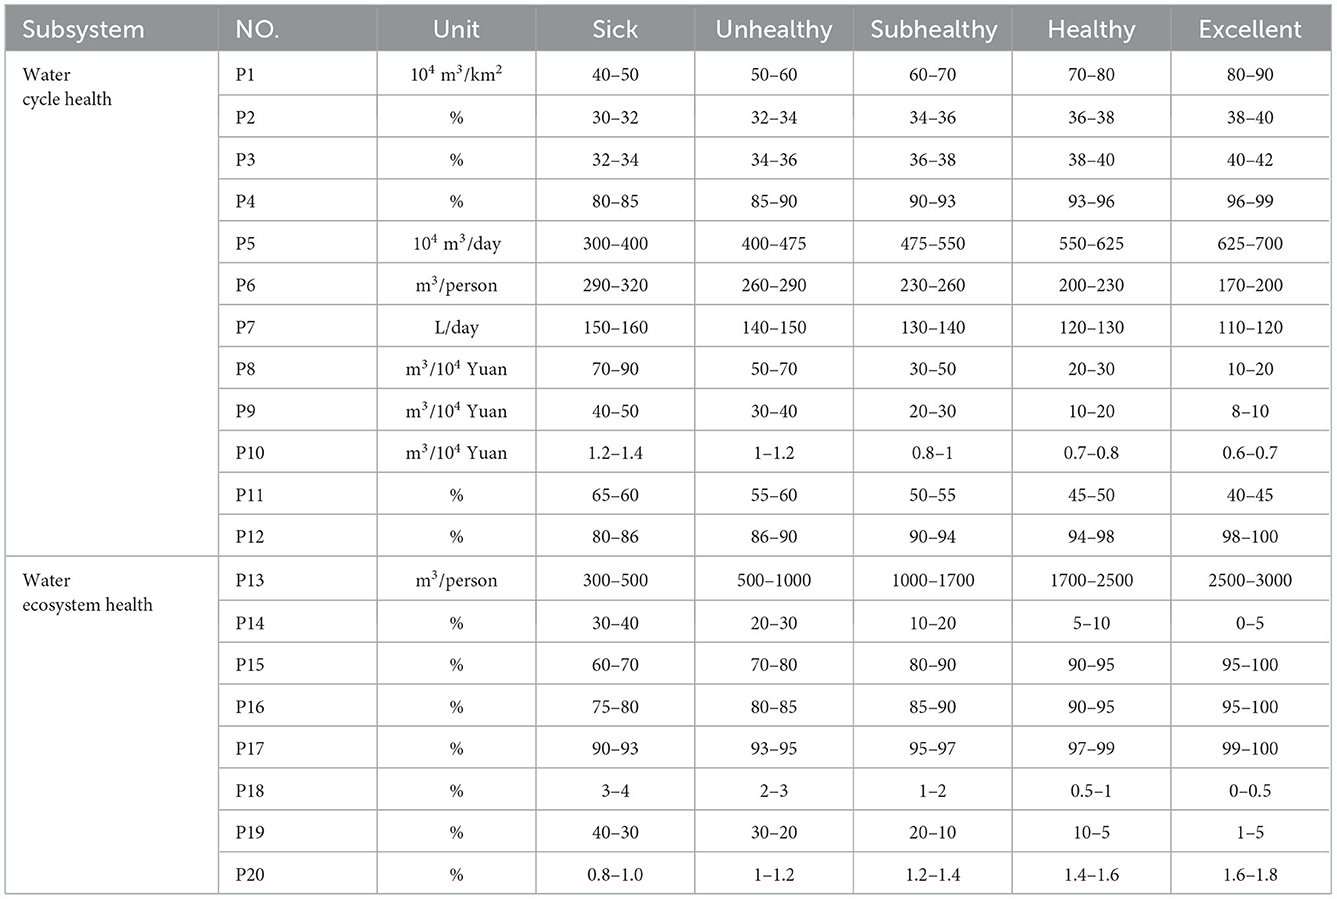
Next, it is necessary to determine health standards for the indicators. The health standard for the indicators has been categorized into five levels: Sick, Unhealthy, Subhealthy, Healthy, and Excellent. Typical methods used to determine assessment criteria include statistical analysis, field surveys, expert judgment, comparative analysis, public investigation, reference to national standards, planning goals, and relevant studies. The methods to arrive at the standard for this study were as follows: (1) Given the regional characteristics, standards for P1, P4, P5, P11, P18, P19, and P20 were set based on the statistical data of the study area. The minimum of the positive (negative) indicators is Sick (Excellent), the average is Subhealthy, the maximum is Excellent (Sick), and the others were calculated by interpolation. (2) Standards for P3, P12, and P17 were determined through statistical analysis and planning targets. (3) Some indicators were set based on national statistical data, including P8, P9, and P10. (4) Some indicators were set according to the relevant standards, such as P6 and P7. (5) The standards for P15 and P16 referred to national standards and planning targets. (6) The standard for P2 was based on planning standards and statistical data. (7) P13 and P14 referred to the relevant standards of the Food and Agriculture Organization (FAO of the United Nations) and the Commission on Sustainable Development (CSD of the United Nations). The specific values are presented in Table 2.
2.5. Real coding accelerated genetic algorithm projection pursuit evaluation model
The ecological environment, social habits, industrial structure, and types show remarkable regional characteristics. For example, the upper reaches of the Yangtze River are rich in water resources but face severe soil erosion and flood disasters. In contrast, the arid regions of northern China face water scarcity and groundwater extraction. The UWH assessment should be based on the characteristics of the region. Second, the UWH assessment should be performed from various spatial and temporal scales. This study attempts to explore changes in UWH status and related indicators from 2011 to 2020.
For the two reasons mentioned above, this study adopted an objective projection pursuit (PP) method for health assessment. PP is a linear mapping model that can project high-dimensional multivariate data into a low-dimensional space via a projection vector (Barcaru, 2019; Liu et al., 2019; Wei et al., 2019; Wang and Yang, 2020). The advantages of the PP method are that it not only filters out interference from irrelevant variables but also overcomes the problem of unreasonable empowerment for high-dimensional data (Wang and Yang, 2020). However, due to the complex non-linear structures of high-dimensional data, it is difficult to determine the optimal projection vector (Barcaru, 2019; Wei et al., 2019). Therefore, the real coding accelerated genetic algorithm (RAGA) method was used to optimize the PP model.
The RAGA-PP method can be used to calculate the weight of indicators and the health index. One of the characteristics of the PP method is that it is not necessary to set an evaluation standard. Why should we still do it? Compared to a comprehensive index, it is easier to set an ideal standard for indicators with the observed values. The same thresholds for all indicator levels are taken as the standard sample to calculate UWHI threshold, so there are six samples. The health indices of the standard samples could be used as the basis for the health classification. Even if the evaluation criteria are unreasonable, the index value of the actual sample will not be affected.
2.5.1. PP model
The sample set for PP was set as: {X(i, j)|i = 1, 2, ..., m; j = 1, 2, ..., n}, where m is the number of samples and n is the number of indicators. The steps to establish the PP model are as follows:
Step 1: The normalization of the original data.
Because the indicators have different units and effects, they cannot be directly compared. In this study, the extremum method was used for data standardization. The positive and negative indicators are calculated, respectively, as shown in Equations (1) and (2), where Xmin(j) are the initial minimum and maximum values (including grade value) of the jth indicator. X(i, j) is the jth indicator of the ith sample, and X′(i, j) is the normalized value of the jth indicator of the ith sample.
Step 2: The projected characteristic value Z(i) is defined as:
where Z(i) could be defined as a composite index of the ith sample, that is, UWHI. Z(i, j) is the component value of the projected characteristic value for the jth indicator of the ith sample, a(j) is the jth component of the optimal projection vector , and the weight W(j) of the jth indicator could be calculated from a(j). Therefore, it is crucial to find the optimal projection vector , which reflects the feature structure of the high-dimensional data and determines the projected characteristic value Z(i).
Step 3: Constructing the projection objective function G(a).
To calculate G(a), the concepts of between-class distance and inner-class density must be introduced. In the process of projection and optimization, the distribution of the projection values should meet the characteristics of partial density and overall dispersion. That means that the larger the between-class distance S(a), the more fragmented the sample is, and the larger the inner-class density D(a), the more significant the sample classification. Consequently, a projection objective function G(a) was constructed to optimize the projection vector . When the projection objective function G(a) reaches the maximum value, the optimal projection vector is obtained (Barcaru, 2019; Liu et al., 2019; Wei et al., 2019; Wang and Yang, 2020).
The between-class distance is calculated as:
The inner-class density is calculated as:
The projection objective function G(a) is defined as:
where is the projection vector, is the average value of Z(i) (i = 1, 2, ..., m), and rik is the distance between the projected characteristic values Zi and Zk. The expression is given as follows: rik = ||Z(i)−Z(k)|| (i, k = 1, 2, ..., m), R is the window width parameter determined by the data characteristics. The expression of R is R = 0.1 × Sa. The sign function I(R–rik) is a unit step function, and its value decreases as rik increases. The expression of I (R–rik) is
2.5.2. Optimization of the PP model using RAGA
Real coding accelerated genetic algorithm is an improved genetic algorithm. Compared with other optimization methods, such as simulated annealing algorithm, particle swarm algorithm, colony algorithm, or artificial fish swarm algorithm, RAGA can overcome the problems of complex binary coding, slow global optimization, and easy premature convergence. As a heuristic algorithm is based on real coding, the RAGA algorithm has been applied to many fields and can be used to solve complex non-linear optimization problems and reduce computational complexity (Wang and Yang, 2020).
3. Results and discussion
3.1. The optimal projected vector and the weights
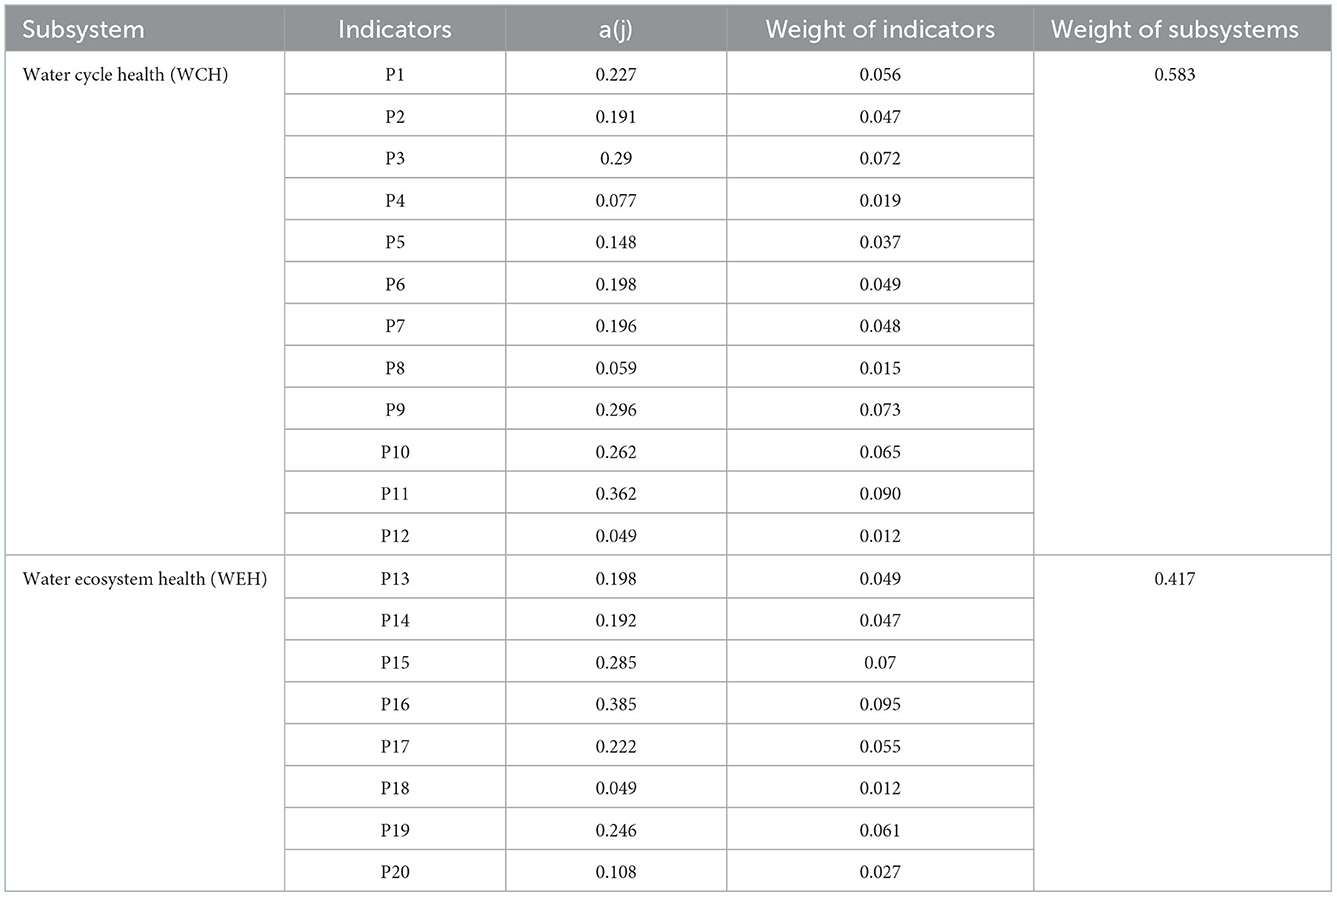
The normalized values of the original data and the optimal projection vector were calculated using the RAGA-PP model, and the weights of the indicators were obtained in Equation (5). The results are presented in Table 3. In the RAGA-PP model, the significance of each indicator can essentially be reflected as the component value of the optimal projection vector . The larger the component value, the more important the indicator.
The results show that the weight of the top five indicators is the proportion of surface water that achieves the water function (P16), the water consumption rate (P11), the water use of unit industrial added value (P9), the forest coverage rate (P3), and the percentage of I–III surface water (P15). The three indicators with the least impact are the sewage treatment rate (P12), the percentage of flood disaster area (P18), and the unit GDP water use (P8). As shown in Table 3, the weights of water cycle health and WEH are 0.583 and 0.417, respectively. The figures illustrate that, compared to the state of water ecosystem, the water cycle has a greater contribution to UWH.
3.2. Health level thresholds
Health level thresholds were obtained via the RAGA-PP model. Specifically, as the same level threshold for all indicators was taken as a standard sample, there were six standard samples, as shown in Table 2. A total of 16 samples were derived from the six standard samples and the 10 experimental samples in Chongqing. The RAGA-PP model was used to calculate the protected values Z(i) of the samples. Consequently, the projected values of the six standard samples became the thresholds for each level (Table 4). Thresholds for Sick, Unhealthy, Subhealthy, Healthy, and Excellent are 0.04–0.87, 0.87–1.80, 1.80–2.73, 2.73–3.50, and 3.50–4.01, respectively. Similarly, Thresholds for the subsystems are the sum of Z(i, j) relevant indicators for each level, as shown in Table 4.
3.3. UWH evaluation
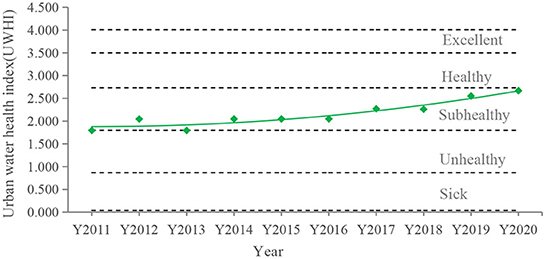
The UWHI was calculated using the RAGA-PP model, and the calculated results are shown in Figure 3. The UWHI for Chongqing increased from 1.796 in 2011 to 2.668 in 2020, and the health level improved from Unhealthy in 2011–2013 to Subhealthy in 2014–2020, approaching Healthy. In terms of an overall trend, there was a gradual increase of 48.5% in the UWHI values in the last decade, indicating that the water system in Chongqing has been effectively improved. In the last decade, Chongqing has emphasized the coordinated management of various factors to comprehensively improve UWH. First, water plants and sewage treatment plants are built and upgraded to further improve the infrastructure. Second, the areas of green space and low-impact facilities are expanded to reduce the disturbance of urban development to the natural water cycle. Third, clean production is enforced to promote water conservation and emission reduction. Fourth, water ecological restoration is implemented.
The projected characteristic values for the subsystems are the sum of Z(i,j) relevant indicators. Changing trends of the water cycle and status in 2011–2020 are shown in Figure 4. WCH in Chongqing ranged from 1.082 to 1.460 in the last decade, from Subhealthy to near Healthy. Overall health status of the water cycle showed a slight fluctuation as it increased. WEH fluctuated in a range of 0.714–1.209, gradually improving from Unhealthy to Subhealthy in 2015. This result indicates that the health status of the water cycle is superior to that of the water ecosystem in Chongqing.
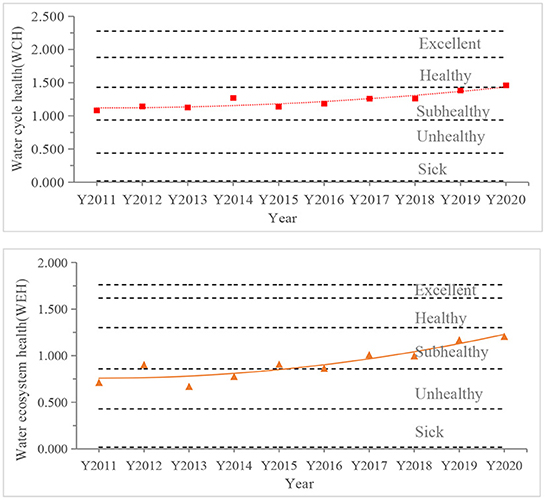
Figure 4. Water cycle health (up) and water ecosystem health (WEH) (down) of Chongqing in 2011–2020.
3.4. Identification of important factors
To clearly identify the important factors, a statistical analysis of the indicators was conducted and the results are shown in Figure 5. In terms of the health level, the top five indicators are the ratio of drinking water up to the standard (P17), the water supply pervasion in urban (P4), the green rate of built-up areas (P2), sewage treatment rate (P12), and the water use of unit industrial added value (P9), with mean values of 0.96, 0.88, 0.80, 0.74, and 0.72, respectively. The results show that Chongqing has safe drinking water resources and adequate water supply and sewage treatment facilities. Nevertheless, the emphasis continues to be placed on the protection of water sources. Industrial water use is relatively efficient in Chongqing. Furthermore, the high green rate in the built-up area could effectively alleviate the disturbance to the natural water cycle and promote the health of the water ecology.
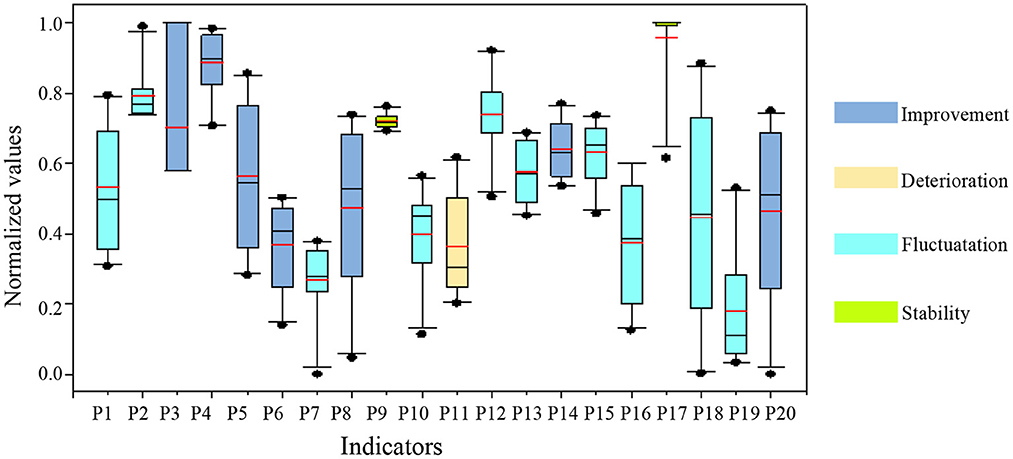
Figure 5. The quartiles map and trend of indicators (red line represents the mean of the indicators, and colors indicate the type of an indicator changing over time).
The bottom five indicators are the percentage of water and soil erosion (P19), the per capita domestic water use in urban (P7), the water consumption rate (P11), the proportion of surface water that achieves water function (P16), and the per capita comprehensive water use (P6), with mean values of 0.18, 0.27, 0.36, 0.37, and 0.37, respectively. Chongqing is located in an area where water and soil erosion are severe in the upper reaches of the Yangtze River. The construction of the Three Gorges Reservoir has brought more severe challenges to a fragile ecology, meaning that soil and water conservation are important long-term projects in the future. Second, the quantity of domestic water use is large and the aging of the infrastructure will lead to serious water consumption problems. Therefore, important priorities for water management are formulating water-saving strategies and upgrading infrastructure.
The changing trends of the indicators fall into four categories: improvement, deterioration, stability, and fluctuations. First, the improvement indicators, which increase yearly, include the forest coverage rate (P3), the water supply pervasion in urban (P4), the water supply capacity (P5), the per capita comprehensive water use (P6), the unit GDP water use (P8), the rate of water resource utilization (P14), and the percentage of ecological water use (P20). These indicators indicated that the construction of a sponge city proposed in 2015 had significantly improved the gray–green infrastructure. Second, only the water consumption rate (P11) worsens annually, indicating that less water is returning to the natural system, which is detrimental to water cycle health. The reason for this phenomenon may be due to a leakage caused by an aging pipe network. Third, the water use of unit industrial added value (P9) and the ratio of drinking water up to standard (P17) remains nearly stable. The average score of water use of unit industrial added value (P9) is 0.72, indicating that the industry still has potential to save water. Finally, most of the indicators are unstable, including the water production index (P1), the green rate of built-up areas (P2), the per capita domestic water use in urban (P7), the unit GDP waste water discharge (P10), the sewage treatment rate (P12), the per capita water resources (P13), the percentage of I–III surface water (P15), the proportion of surface water that achieved water function (P16), the percentage of the flood disaster area (P18), and the percentage of water and soil erosion (P19). Natural conditions and socioeconomic factors affect these indicators, so it is not surprising that an obvious trend is not apparent. Regarding surface water quality, ~15% are below class III (GB 3838-2002) and 10% do not meet the standards for water function. Despite a gradual improvement in water quality, some small-to-medium rivers with small carrying capacity still face pollution problems.
4. Conclusions
To address the ultimate goal of water management, a comprehensive UWH concept based on the integration of EH and HWC has been proposed. In this evaluation system, 20 indicators were selected from the aspects of the natural–social water cycle, water resources, water security, and water ecology. The RAGA-PP model was applied to calculate the weight of the indicators and the UWHI. The quantitative expression of UWH in Chongqing was realized. The results revealed that the UWHI of Chongqing increased from 1.796 in 2011 to 2.668 in 2020, and the health level improved from Unhealthy to Subhealthy and was approaching Healthy. The identification of important influencing factors denotes that the main weaknesses of Chongqing are severe soil erosion, large domestic water use, high water consumption rates, and unsatisfactory water functional areas.
Based on the evaluation results and analysis mentioned earlier, it can be seen that infrastructure upgradation, soil and water conservation, water quality improvement, and water saving are the important future priorities. From a systematic perspective, Chongqing should strengthen its overall water management of “resources, environment, ecology, security, and circulation.” In addition to conventional pollution control, water saving and resource management, the following should be strengthened: (1) A refined management system for the water ecosystem is established. According to the current situation of resource endowment and development, the water function zone should be optimized and adjusted. Additionally, a protection plan for the shoreline should be formulated to define the protection range and explore restoration technologies, which are suitable for a riparian zone in the mountainous area. (2) A water-based carbon sink system is explored. An estuarine wetland, a tail water wetland, and a water conserved forest are constructed at appropriate locations. (3) Water system connectivity is optimized and ecological flow is ensured. Considering the integrity of the water ecosystem, the connectivity of rivers/lakes should be optimized from multiple dimensions, such as horizontal, vertical, and different water bodies. (4) Ecological flow management measures should be established to promote the restoration of the water ecological environment.
In general, the definition and assessment of UWH are not only a unified management goal, but also serve to identify vulnerable spots for implementing effective measures. Furthermore, it is helpful to strike a balance between water development and protection.
Data availability statement
The original contributions presented in the study are included in the article/supplementary material, further inquiries can be directed to the corresponding author.
Author contributions
JH: conceptualization, methodology, software, data curation, writing—original draft preparation, and writing—reviewing and editing. YL: methodology, review and editing, supervision, and funding acquisition. JS: conceptualization and supervision. BL: methodology and supervision. All authors contributed to the article and approved the submitted version.
Funding
This work was supported by the General Project of Chongqing Natural Science Foundation (Grant No.: cstc2021jcyj-msxmX0293).
Acknowledgments
The authors are grateful to the research group members for their support and contribution to data collection.
Conflict of interest
The authors declare that the research was conducted in the absence of any commercial or financial relationships that could be construed as a potential conflict of interest.
Publisher's note
All claims expressed in this article are solely those of the authors and do not necessarily represent those of their affiliated organizations, or those of the publisher, the editors and the reviewers. Any product that may be evaluated in this article, or claim that may be made by its manufacturer, is not guaranteed or endorsed by the publisher.
References
Agboola, J. I., Ndimele, P. E., Odunuga, S., Akanni, A., Kosemani, B., and Ahove, M. A. (2016). Ecological health status of the Lagos wetland ecosystems: Implications for coastal risk reduction. Estuar. Coast. Shelf Sci. 183, 73–81. doi: 10.1016/j.ecss.2016.10.019
Barcaru, A. (2019). Supervised projection pursuit-A dimensionality reduction technique optimized for probabilistic classification. Chemom. Intell. Lab. Syst. 194, 103867. doi: 10.1016/j.chemolab.2019.103867
Brown, L. E., and Mitchell, G. J. (2010). Priority water research questions as determined by UK practitioners and policy makers. Sci. Tot. Environ. 2, 256–266. doi: 10.1016/j.scitotenv.2010.09.040
Canobbio, S., Mezzanotte, V., Ballabio, D., and Pavan, M. (2008). Chapter 8 multi-criteria decision-making methods: A tool for assessing river ecosystem health using functional macroinvertebrate traits. Data Handl. Sci. Technol. 27, 169–191. doi: 10.1016/S0922-3487(08)10008-9
Chapagain, K., Aboelnga, H. T., Babel, M. S., Ribbe, L., Shinde, V. R., Sharma, D., et al. (2022). Urban water security: A comparative assessment and policy analysis of five cities in diverse developing countries of Asia. Environ. Dev. 43, 100713. doi: 10.1016/j.envdev.2022.100713
Costanza, R. (2012). Ecosystem health and ecological engineering. Ecol. Eng. 45, 24–29. doi: 10.1016/j.ecoleng.2012.03.023
Cox, B., Oeding, S., and Taffs, K. (2019). A comparison of macroinvertebrate-based indices for biological assessment of river health: A case example from the sub-tropical Richmond River Catchment in northeast New South Wales, Australia. Ecol. Indic. 106, 105479. doi: 10.1016/j.ecolind.2019.105479
Deng, X. J., Xu, Y. P., Han, L. F., Yu, Z. H., Yang, M. N., Pan, G. B., et al. (2015). Assessment of river health based on an improved entropy-based fuzzy matter-element model in the Taihu Plain, China. Ecol. Indic. 57, 85–95. doi: 10.1016/j.ecolind.2015.04.020
Hu, X. Y., Hu, M., Zhu, Y., Wang, G. Q., Xue, B. L., Shrestha, S., et al. (2022). Phytoplankton community variation and ecological health assessment for impounded lakes along the eastern route of China's South-to-North Water Diversion Project. J. Environ. Manage. 318, 115561. doi: 10.1016/j.jenvman.2022.115561
Jia, Y. Z., Tian, Y. Z., and Tang, L. (2021). Analysis of water cycle health status in Ningxia Hui Autonomous Region and its five subordinate cities. J. Water Resour. Water Eng. (Chinese) 32, 109–115. doi: 10.11705/j.issn.1672-643X.2021.06.15
Liu, D., Zhang, G. D., Li, H., Fu, Q., Li, M., Faiz, M. A., et al. (2019). Projection pursuit evaluation model of a regional surface water environment based on an Ameliorative Moth-Flame Optimization algorithm. Ecol. Indic. 107, 105674. doi: 10.1016/j.ecolind.2019.105674
Liu, W. W., Guo, Z. L., Jiang, B., Lu, F., Wang, H. N., Wang, D. A., et al. (2020). Improving wetland ecosystem health in China. Ecol. Indic. 113, 106184. doi: 10.1016/j.ecolind.2020.106184
Lu, S. B., Zhang, X. L., Bao, H. J., and Skitmore, M. (2016). Review of social water cycle research in a changing environment. Renew. Sustain. Energy Rev. 63, 132–140. doi: 10.1016/j.rser.2016.04.071
Pan, Z., He, J., Liu, D., Wang, J., and Guo, X. (2021). Ecosystem health assessment based on ecological integrity and ecosystem services demand in the Middle Reaches of the Yangtze River Economic Belt, China. Sci. Total Environ. 774, 144837. doi: 10.1016/j.scitotenv.2020.144837
Rapport, D. J. (1998). Symptoms of pathology in the Gulf of Bothnia (Baltic Sea): Ecosystem response to stress from human activity. Biol. J. Linnean Soc. 37, 33–49. doi: 10.1111/j.1095-8312.1989.tb02004.x
Sadat, M. A., Guan, Y. Q., Zhang, D. R., Shao, G. W., Cheng, X. M., Yang, Y. J., et al. (2020). The associations between river health and water resources management lead to the assessment of river state. Ecol. Indic. 109, 105814. doi: 10.1016/j.ecolind.2019.105814
Sahana, M., Saini, M., Areendran, G., Imdad, K., Sarma, K., Sajjad, H., et al. (2022). Assessing wetland ecosystem health in Sundarban Biosphere Reserve using pressure-state-response model and geospatial techniques. Remote Sens. Appl.: Soc. Environ. 26, 100754. doi: 10.1016/j.rsase.2022.100754
Singh, P. K., and Saxena, S. (2018). Towards developing a river health index. Ecol. Indic. 85, 999–1011. doi: 10.1016/j.ecolind.2017.11.059
Sun, T., Lin, W., Chen, G., Guo, P., and Zeng, Y. (2016). Wetland ecosystem health assessment through integrating remote sensing and inventory data with an assessment model for the Hangzhou Bay, China. Sci. Tot. Environ. 567, 627–640. doi: 10.1016/j.scitotenv.2016.05.028
Tampo, L., Lazar, I. M., Kaboré, I., Oueda, A., Akpataku, K. V., Djaneye-Boundjou, G., et al. (2020). A Multimetric index for assessment of aquatic ecosystem health based on macroinvertebrates for the Zio river basin in Togo. Limnologica 83, 125783. doi: 10.1016/j.limno.2020.125783
Uche, J., Martínez-Gracia, A., Círez, F., and Carmona, U. (2015). Environmental impact of water supply and water use in a Mediterranean water stressed region. J. Clean. Prod. 88, 196–204. doi: 10.1016/j.jclepro.2014.04.076
Wang, F. Q., Ma, S. J., Zhao, H., and Liu, P. H. (2021). A fuzzy comprehensive evaluation of water cycle health in Beijing-Tianjing-Hebei region based on combined the weights of AHP and entrop method. South-to-North Water Transf. Water Sci. Technol. (Chinese) 19, 67–74. doi: 10.13476/j.cnki.nsbdqk.2021.0006
Wang, H., and Jia, Y. W. (2016). Theory and study methodology of dualistic water cycle in river basins under changing conditions. J. Hydraul. Eng. 47, 1219–1226. doi: 10.13243/j.cnki.slxb.20151297
Wang, Q., and Yang, X. (2020). Investigating the sustainability of renewable energy: An empirical analysis of European Union countries using a hybrid of projection pursuit fuzzy clustering model and accelerated genetic algorithm based on real coding. J. Clean. Prod. 268, 121940. doi: 10.1016/j.jclepro.2020.121940
Wang, S., Zhang, Q., Yang, T., Zhang, L., Li, X., and Chen, J. (2019). River health assessment: Proposing a comprehensive model based on physical habitat, chemical condition and biotic structure. Ecol. Indic. 103, 446–460. doi: 10.1016/j.ecolind.2019.04.013
Wei, X. M., Wang, J. Y., Wu, S. G., Xin, X., Wang, Z. L., Liu, W., et al. (2019). Comprehensive evaluation model for water environment carrying capacity based on VPOSRM framework: A case study in Wuhan, China. Sustain. Cities Soc. 50, 101640. doi: 10.1016/j.scs.2019.101640
Wu, C. Y., and Chen, W. (2020). Indicator system construction and health assessment of wetland ecosystem-Taking Hongze Lake Wetland, China as an example. Ecol. Indic. 112, 106164. doi: 10.1016/j.ecolind.2020.106164
Wu, S. G., Tian, C. H., Li, B. L., Wang, J. Y., and Wang, Z. (2022). Ecological environment health assessment of lake water ecosystem system based on simulated annealing-projection pursuit: A case study of plateau lake. Sustain. Cities Soc. 86, 104131. doi: 10.1016/j.scs.2022.104131
Xia, J., Zhang, Y., Xiong, L., He, S., Wang, L., and Yu, Z. (2017). Opportunities and challenges of the Sponge City construction related to urban water issues in China. Sci. China Earth Sci. 60, 652–658. doi: 10.1007/s11430-016-0111-8
Yang, D. W., Yang, Y. T., and Xia, J. (2021). Hydrological cycle and water resources in a changing world: A review. Geogr. Sustain. 2, 115–122. doi: 10.1016/j.geosus.2021.05.003
Yin, B. L., Guan, D. J., Zhou, L. L., Zhou, J., and He, X. J. (2020). Sensitivity assessment and simulation of water resource security in karst areas within the context of hydroclimate change. J. Clean. Prod. 258, 120994. doi: 10.1016/j.jclepro.2020.120994
Yu, H. B., Song, Y. H., Chang, X., Gao, H., and Peng, J. (2018). A scheme for a sustainable urban water environmental system during the urbanization process in China. Engineering 4, 190–193. doi: 10.1016/j.eng.2018.03.009
Zhang, J., and Xiong, B. Y. (2006). Towards a healthy water cycle in China. Water Sci. Technol. 53, 9–15. doi: 10.2166/wst.2006.274
Zhang, S. H., Fan, W. W., Yi, Y. J., Zhao, Y., and Liu, J. H. (2017). Evaluation method for regional water cycle health based on nature-society water cycle theory. J. Hydrol. 551, 352–364. doi: 10.1016/j.jhydrol.2017.06.013
Zhang, S. H., Xiang, M. S., Xu, Z., Wang, L., and Zhang, C. (2020). Evaluation of water cycle health status based on a cloud model. J. Clean. Prod. 245, 118850. doi: 10.1016/j.jclepro.2019.118850
Zhang, Z. X., Liu, Y., Li, Y., Wang, X. G., Li, H. Z., Yang, H., et al. (2021). Lake ecosystem health assessment using a novel hybrid decision-making framework in the Nam Co, Qinghai-Tibet Plateau. Sci. Tot. Environ. 808, 152087. doi: 10.1016/j.scitotenv.2021.152087
Keywords: ecosystem health, water cycle health, urban water health assessment, RAGA-PP, conceptual framework
Citation: He J, Li Y, Su J and Liao B (2023) Urban water health: A conceptual framework and assessment system. Front. Ecol. Evol. 10:1081555. doi: 10.3389/fevo.2022.1081555
Received: 27 October 2022; Accepted: 05 December 2022;
Published: 06 January 2023.
Edited by:
Celso Santos, Federal University of Paraíba, BrazilReviewed by:
Zengchuan Dong, Hohai University, ChinaPeiyue Li, Chang'an University, China
Dandong Cheng, Northwest University, China
Aysegul Tanik, Istanbul Technical University, Turkey
Copyright © 2023 He, Li, Su and Liao. This is an open-access article distributed under the terms of the Creative Commons Attribution License (CC BY). The use, distribution or reproduction in other forums is permitted, provided the original author(s) and the copyright owner(s) are credited and that the original publication in this journal is cited, in accordance with accepted academic practice. No use, distribution or reproduction is permitted which does not comply with these terms.
*Correspondence: Yunyan Li,  bGl5dW55YW5AY3F1LmVkdS5jbg==; Jiafu Su,
  amlhZnUuc3VAaG90bWFpbC5jb20=
 Jing He1
 Jiafu Su