 Xianhui Feng
 Zhilin Zeng
 Mu He
Mu He
95% of researchers rate our articles as excellent or good
Learn more about the work of our research integrity team to safeguard the quality of each article we publish.
Find out more
ORIGINAL RESEARCH article
Front. Ecol. Evol. , 09 January 2023
Sec. Interdisciplinary Climate Studies
Volume 10 - 2022 | https://doi.org/10.3389/fevo.2022.1080734
This article is part of the Research Topic Climate Change and Adaptive Capacity Building View all 15 articles
Introduction: The Guangdong-Hong Kong-Macao Greater Bay Area (GBA) is located in the south subtropical area along the southeast coast of China, which is one of the world-class urban agglomerations and an important part for economic development. In order to investigate the change of vegetation indexes and its response to climate factors in such circumstance of climate change, this study is an important component in the protection and establishment of the ecological environment in the GBA.
Methods: The Moderate Resolution Imaging Spectroradiometer-Enhanced Vegetation Index (MODIS-EVI) and climate data were recorded from National Aeronautics and Space Administration (NASA) and Resource and Environment Science Data Center of the Chinese Academy of Sciences. Trend analysis, Mann-Kendall (MK) Test and rescaled range analysis (R/S Analysis) offer an effective way of analyzing the correlation between the vegetation cover change and climate factors.
Results: The results provide important insights into the following aspects: (1) The changes of climate factors (temperature, precipitation, wind speed, humidity, and sunshine radiation) are fluctuated in GBA, with no obvious increasing or decreasing trend. It comprehensively exhibited an extremely slow development of humidify and warming. (2) It presents an increasing trend of EVI in GBA, with the rate of 0.0045/a. The range of increase is in the middle level (0.4 ≤ EVI<0.6) based on the EVI. The vegetation cover in GBA is improved comprehensively, the area of vegetation improvement is larger than the area of vegetation degression, with the extremely improved vegetation cover area (66.98%) and the extremely degraded vegetation cover area (5.70%). There are obvious differences and agglomerations in the distribution of the EVI trends. (3) In future, the changing trends will be combinedly affected be various factors, and there is no obvious factor temporarily. The improved vegetation cover area (over 80%) are predicted. (4) There are significant spatiotemporal differences in the annual effects of EVI on various climate factors comprehensively. Wind speed and relative humidity have the strongest correlations with EVI; the area of significant correlation is more than 40% of the pixels. The correlation between temperature and EVI is second, with the area of significant correlation over 20% of the pixels. The precipitation and sunshine radiation weakly correlated with EVI, with the area of significant correlation is less than 5% of the pixels.
Discussion: The result of this study indicated that the EVI changing trend in the future by R/S analysis method is affected by climate and human factors together and there are no significant factors. The result indicated precipitation has no significant correlation with EVI trends in the Hot and humid area with mean precipitation of 1800mm. However, there is a significant positive correlation between the EVI trend and two climate factors (relative humidity and wind speed). In the terms of spatial distribution, the influence of temperature to EVI is complex in GBA, the spatial distribution of correlation is scattered.
Vegetation is the fundamental component of terrestrial ecosystems, which plays vital roles in material cycling and energy conversion. Furthermore, evidence suggests that vegetation cover is among the most irreplaceable factors for water and soil conservation, climate mitigation, and global carbon balance (Piao et al., 2011, 2020). Fractional vegetation cover (FVC) is an important indicator of vegetation cover, which comprehensively indicates the growth of vegetation communities, and is monitored as a vital indicator of ecosystem (Gitelson et al., 2002; Wang et al., 2003). The existing body of research on large-scale remote sensing suggests that it is difficult to investigate the change in vegetation cover through ground-based observations. Instead, the Vegetation Index (VI) is currently the most popular index for investigating vegetation cover by remote sensing. The Moderate Resolution Imaging Spectroradiometer was equipped on the Terra and Aqua satellites, with 36 bands, collected the normalized difference vegetation index (NDVI) and enhanced vegetation index (EVI), both of which indicate the change of vegetation cover accurately (Xiao and Moody, 2005; Cheng et al., 2008; Pei et al., 2015). EVI, an improved version of NDVI can elucidate the impact of saturation of vegetation growth (Wang et al., 2006; Li et al., 2007; Chen et al., 2014; Zhang et al., 2021).
The influence of climate change on vegetation cover has long been a question of great interest in a wide range of fields. The change of vegetation cover via impacting the characteristics of the vegetation growth, and further impact the structure and capability of ecosystem. Vegetation cover change, which enlarge the carbon pool of terrestrial ecosystems through the plant growth, influence the climate by change the bio-geophysical properties of organisms on the earth (Xia et al., 2013; Jiang et al., 2017; Liu et al., 2019).
A considerable amount of literature has been investigated that the most significant phenomenon of climate change is that changes in vegetation growth are impacted by the climate change in the long time series and large spatial scale. These studies revealed that vegetation cover represents the conditions of ecosystems objectively (Myneni et al., 1997; Tucker et al., 2001; Parmesan, 2006; Fensholt et al., 2012). Much of the literature since the last 20 years emphasizes the vegetation cover change and its influential factors in different climate zones by using VI. Because of the differences in various climate zones, there are obvious gaps among these results. Collectively, these studies outline a critical role for identifying the main factors of vegetation cover change that are human activities and climate factors. On the contrary, the relationship between vegetation cover change and its influential factors in different climate zone is extremely complex. There are linear correlations in some sites and non-linear in others. Additionally, the range of influence of different climate factors is distinct relatively (Gan et al., 2011; Mu et al., 2012; Liu et al., 2013, 2021; Li et al., 2017; de la Barrera and Henríquez, 2017; Zhang et al., 2019; He et al., 2020), while the utilization of different VI lead to dissimilar results (Li et al., 2007; Ye et al., 2012; Xie et al., 2022).
The Guangdong-Hong Kong-Macao Greater Bay Area (GBA) is the largest alluvial plain in subtropical zone of China. There is a long coastline and a dense river network around the GBA. In terms of climate characteristic, GBA is in the south subtropical humid monsoon climate zone, with hot summer and warm winter in the Hot and humid area. Furthermore, a major characteristic of the climate of GBA is that high temperature throughout the year, adequate sunshine radiation, and abundant precipitation. The existing literature on the vegetation cover change in GBA is extensive and focuses particularly on the NDVI and its influential mechanisms (He, 2019; Hu and Xia, 2019; Deng et al., 2021; Feng et al., 2022; Zhao et al., 2022). The GBA is in the climate of high temperature and relative humidity, with the growth of lush plants. Under such circumstance, the NDVI tends to be saturated, since it is unsensitive to the lush vegetation. Not only do the EVI elucidate the disruption of atmosphere and the saturation, but, in the same spatial resolution, also indicate the differences in spatial distribution of the high-saturated vegetation cover better.
Together, this study gathered and analyzed the EVI and climate data from 2001 to 2020 in GBA. We indicated the characteristics of vegetation cover via EVI and its changing trend by using Theil-Sen approach, Mann-Kendall (MK) test and Rescaled range analysis (R/S analysis). The characteristics of climate change for 20 years were analyzed. The correlation between the EVI changing trends and the change of climate factors was analyzed, which revealed the spatiotemporal characteristics of the EVI changes and its internal mechanism by the influence of climate change (Figure 1).

Figure 1. The framework of study.
The Greater Bay Area (GBA) is located in the central part of Guangdong Province (21。26′N-24。28′ N, 111。14′E-115。24′E), covers 5.6 × 10⁴ km2, including the nine municipalities: Guangzhou (GZ), Shenzhen (SZ), Zhuhai (ZH), Foshan (FS), Huizhou (HZ), Dongguan (DG), Zhongshan (ZS), Jiangmen (JM), Zhaoqing (ZQ) and the two Special Administrative Region: Hong Kong (HK) and Macao (MC; Figure 2). GBA is a world-class urban agglomeration, an important engine of economic growth, and a spatial carrier to participate in global competition. GBA in the south-subtropical monsoon climate zone, with an annual mean temperature of 21–23°C and an annual mean precipitation of 1,300–2,400 mm. It is surrounded by mountains and hills on three sides (east, west, and north), plains in the middle, and borders the South China Sea. The main types of land use in GBA are forest, agricultural, and residential and constructional. Forest area is mainly distributed in the mountainous areas in the east, west, and north, such as ZQ, JM, HZ, and northern GZ, while residential land and construction land is mainly distributed in the center of urban agglomeration, such as southern GZ, FS, DG, SZ, HK, ZS, ZH, and MC. The vegetation in the study area is dominated by evergreen broadleaf forests in south-subtropical zone, rainforest forests in the subtropics, and mangroves.
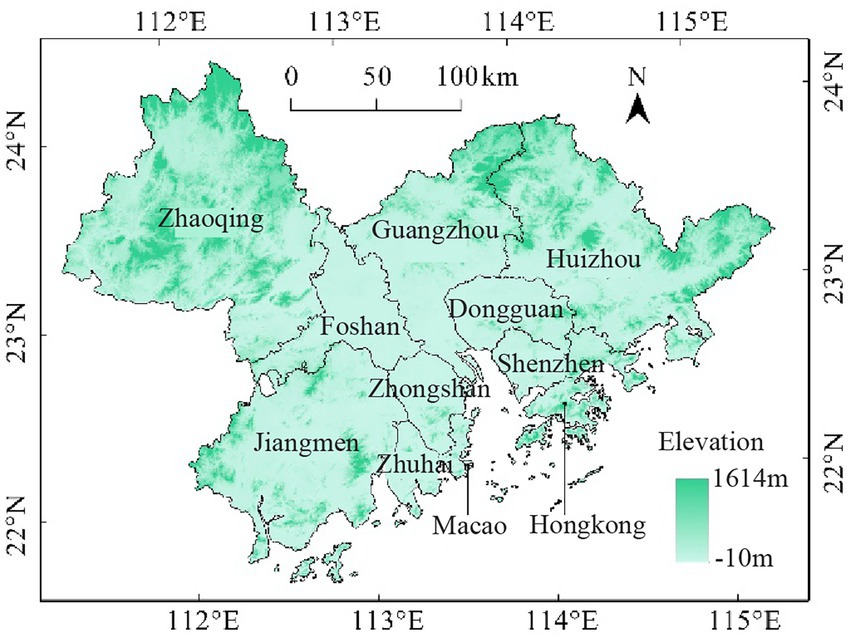
Figure 2. The study site of the Guangdong-Hong Kong-Macao Greater Bay Area.
The vegetation cover in the study area grew lushly, and to eradicate the influence of saturated VI. Therefore, Enhanced Vegetation Index (EVI) selected for analyzing the trend of vegetation changes.
The MODIS Land Cover Type Product (MOD13Q1) supplies global maps of land cover at annual time steps and 250-m spatial resolution from 2001 to 2020 (23 images per year). After downloaded the data, we used MODIS Reprojection Tools (MRT) to reproject the images, with the Projection coordinate system named Albers Equal Area, and regard the boundary as mask to clip the raster. The annual maximum of EVI in GBA is combined from annual images by the method of maximum value composite (MVC). Finally, we reconstruct the annual maximum of EVI in time series by the Savitzky–Golay filter (S-G filter).
The data of climate factors (temperature, precipitation, wind speed, relative humidity, and sunshine duration) was provided by Resource and Environment Science Data Center of the Chinese Academy of Sciences, with the time span from 2001 to 2020 (Table 1). Using linear interpolation, we were able to fill in missing data and combine the annual data per station. The climate data were interpolated using Thin-plate Splines and Kriging Interpolation, which recorded by 96 national climate stations around study area. According to the obvious influence of elevation on temperature and precipitation, utilizing thin-plate splines to interpolate the temperature and precipitation, with the elevation as covariate. While using Kriging Interpolation to interpolate other climate data, with the resolution of 250-m.
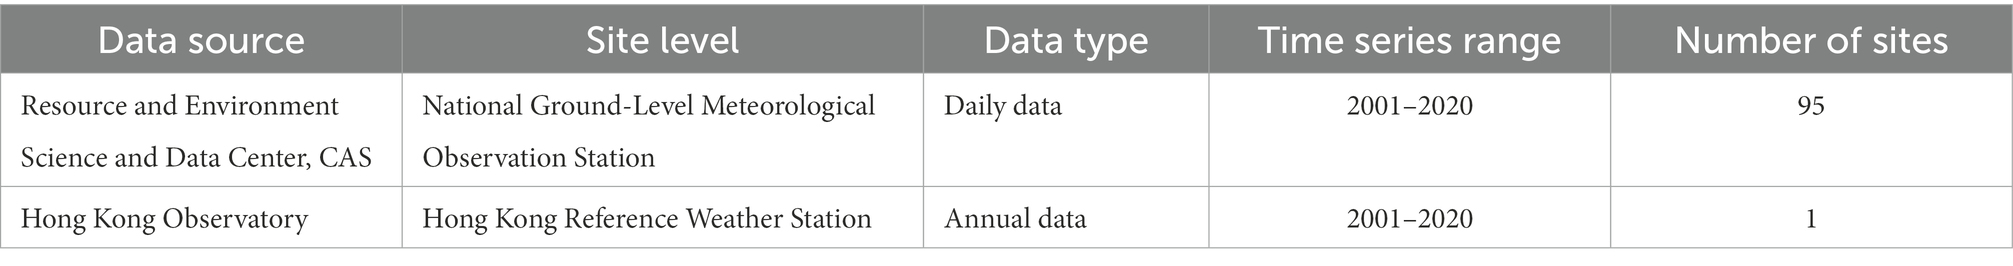
Table 1. Climate data source.
Theil-Sen median trend analysis and Mann-Kendall trend test are both non-parametric estimation methods, and do not assume a normal distribution, which also effectively avoid errors and is suitable for dealing with the long-time series climate data. To estimate every pixel of the EVI changing trends from 2001 to 2020, we used the nonparametric Theil-Sen estimator. This estimate, known as Theil-Sen Slope, which is not sensitive to potential outliers. Mann-Kendall (MK) test were performed for EVI time series and each of the climate-impacted EVI’s time series for the study period from 2001 to 2020.
The Sen slope’s formula is as follows.
Where is the slope of EVI interannual change, the and are represent annual EVI in years and . is the length of the time series. If , EVI indicates an increasing trend, and if , EVI indicate a decreasing trend.e.
In Mann-Kendall (MK) test, the cumulative score of all pairs is used to calculate S:
where is the Sign function.
When , the follow an approximately normal distribution, and its variance of the S stat ( as follows.
The standardized Z score is defined as follows.
When , it indicates that there is a significant change at the α level.
Since there no exist of the result that in the Theil-Sen slope, when is indicated as stable area; when is indicated as the vegetation improvement area, and when is indicated as the degradation vegetation area. The results of the Mann-Kendall test were classified as an obvious significant change (|Z| > 2.58), a significant change (1.96 < |Z| ≤ 2.58), and a insignificant change (|Z| ≤ 1.96) based on the confidence intervals of α = 0.01 and α = 0.05. The and values were combined for classification, thus classifying the EVI trend seven types (Table 2).
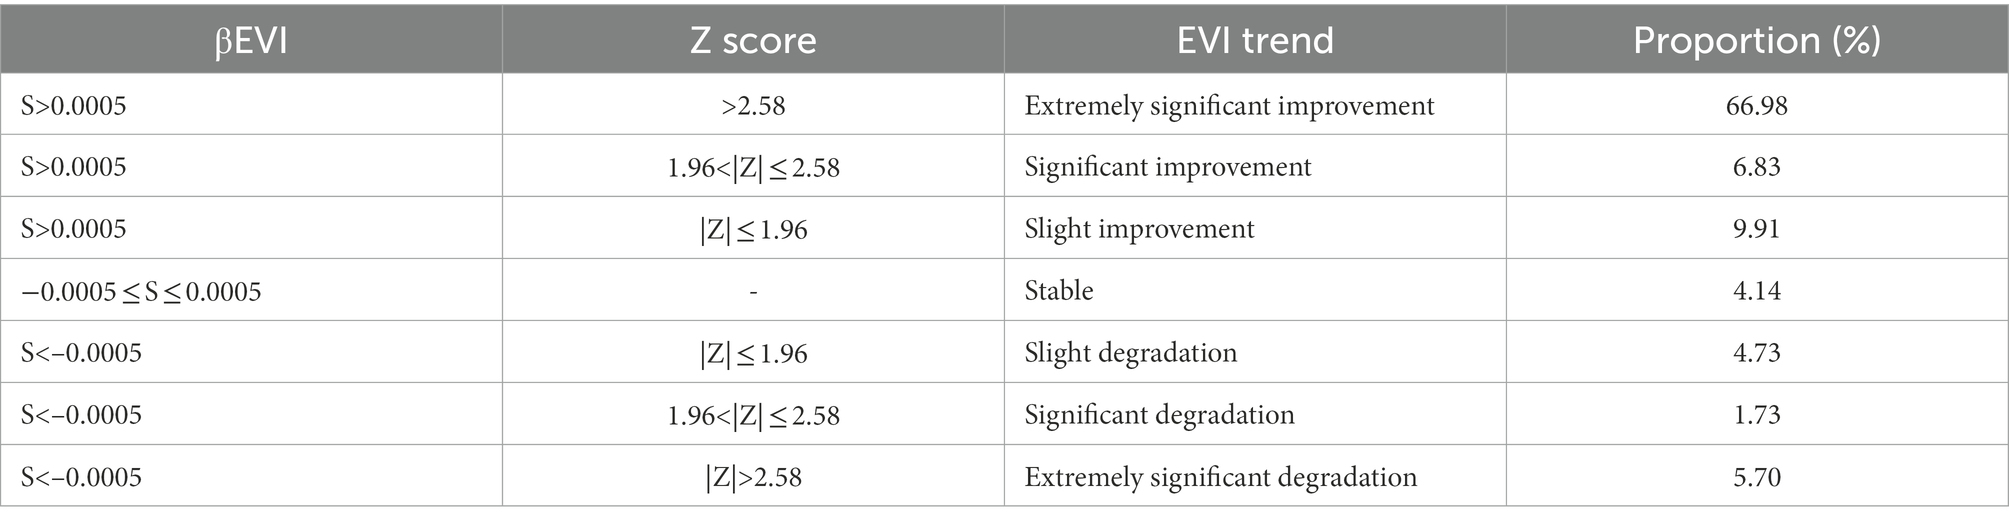
Table 2. The proportion of EVI trend classified as seven levels.
Rescaled range analysis (R/S Analysis) describe the autocorrelation of long-term change in time-series data. It has been widely applied in Economics, Meteorology, and Hydrology. The Hurst exponent is a quantitative method and indicated the reliance of long-time series by utilizing R/S Analysis (Hurst, 1951; Mandelbrot and Wallis, 1969). The R/S Analysis has advantages in investigating the trend of vegetation cover, which is affected by climate factors, in future. What we know about R/S Analysis is largely based upon empirical studies that investigate the trend of vegetation cover in long-time series in the center of Asia (Jiang et al., 2017), Qinghai–Tibet Plateau (Peng et al., 2012), Beijing-Tianjin-Hebei metropolitan regions (Li et al., 2017), the middle reaches of the Yangtze River (Yi et al., 2021, 2022) and the GBA (Zhao et al., 2022). The methods contain these following steps:
Define the long-time sequence { (t)}, t = 1,2,... for an integer Defining the time series mean :
Calculating the accumulated deviation of .
Calculating the rescaled range of RS.
c is a constant.
H is the Hurst exponent. In the R/S analysis of FVC (EVI) sequences, the significance of the Hurst exponent is as follows.
If H = 0.5, the changes in the FVC (EVI) time series are unrelated and random.
If 0<H<0.5, it indicates that the FVC (EVI) time series changes have non-persistence. The closer to 0 the Hurst is, the stronger the non-persistence is.
If 0.5<H<1, it indicates that the FVC (EVI) time series of FVC (EVI) have persistence. The closer to 1, the stronger the persistence is.
To study the correlations between the variables, Pearson correlation analyses were calculated. The calculation equation is as follows.
Where rXY is the correlation between variables X and Y, n is the sample size determination, is the mean of X, and is the mean of Y. The range of rXY is [−1,1]. When rXY>0, it means that the two variables are positively linearly correlated; when rXY<0, it means that the two variables are negatively linearly correlated.
Using MATLAB to calculate the Pearson correlation between the annual maximum FVC (EVI) and the annual temperature, precipitation, wind speed, relative humidity, and sunshine duration, respectively.
Then we test for significance using t test. The significance of correlation was divided into four grades by combining confidence: significant negative correlation (rXY < 0, p < 0.05), insignificant negative correlation (rXY < 0, p ≥ 0.05), insignificant positive correlation (rXY > 0, p ≥ 0.05) and significant positive correlation (rXY > 0, p < 0.05).
The interannual change of climate factors, such as temperature, precipitation, wind speed, humidity and sunshine radiation in the GBA during 2001–2020, generally indicated a fluctuation, with no obvious increase or decrease tendency. Differences in the variability of climate factors. The temperature decreased and then increased, with a mean of 22.17°C, the highest in 2019 (22.66°C), and the lowest in 2011 (21.56°C). The relative humidity has a trend of insignificant increasing trend, with the mean of 77.33%, the highest in 2016 (81.52%), and the lowest in 2011 (72.39%). GBA is predicted to severely slow the warming and humidify. The precipitation, sunshine radiation, and wind speed have interannual fluctuations; however, the 20-year time series change indicated a insignificant trend. Precipitation fluctuated between 1,500-2,500 mm in the last 20 years, with the mean of 1,913 mm, the highest in 2016 (2,466 mm) and the lowest in 2011 (1,426 mm). The wind speed fluctuated steadily with a mean of 2.07 m/s, with the highest in 2011 (2.16 m/s) and the lowest in 2001 (1.85 m/s). Sunshine duration fluctuated steadily, with the mean of 1,696 h, the highest in 2003 (1989 h), and the lowest in 2012 (1,494 h) (Figure 3).
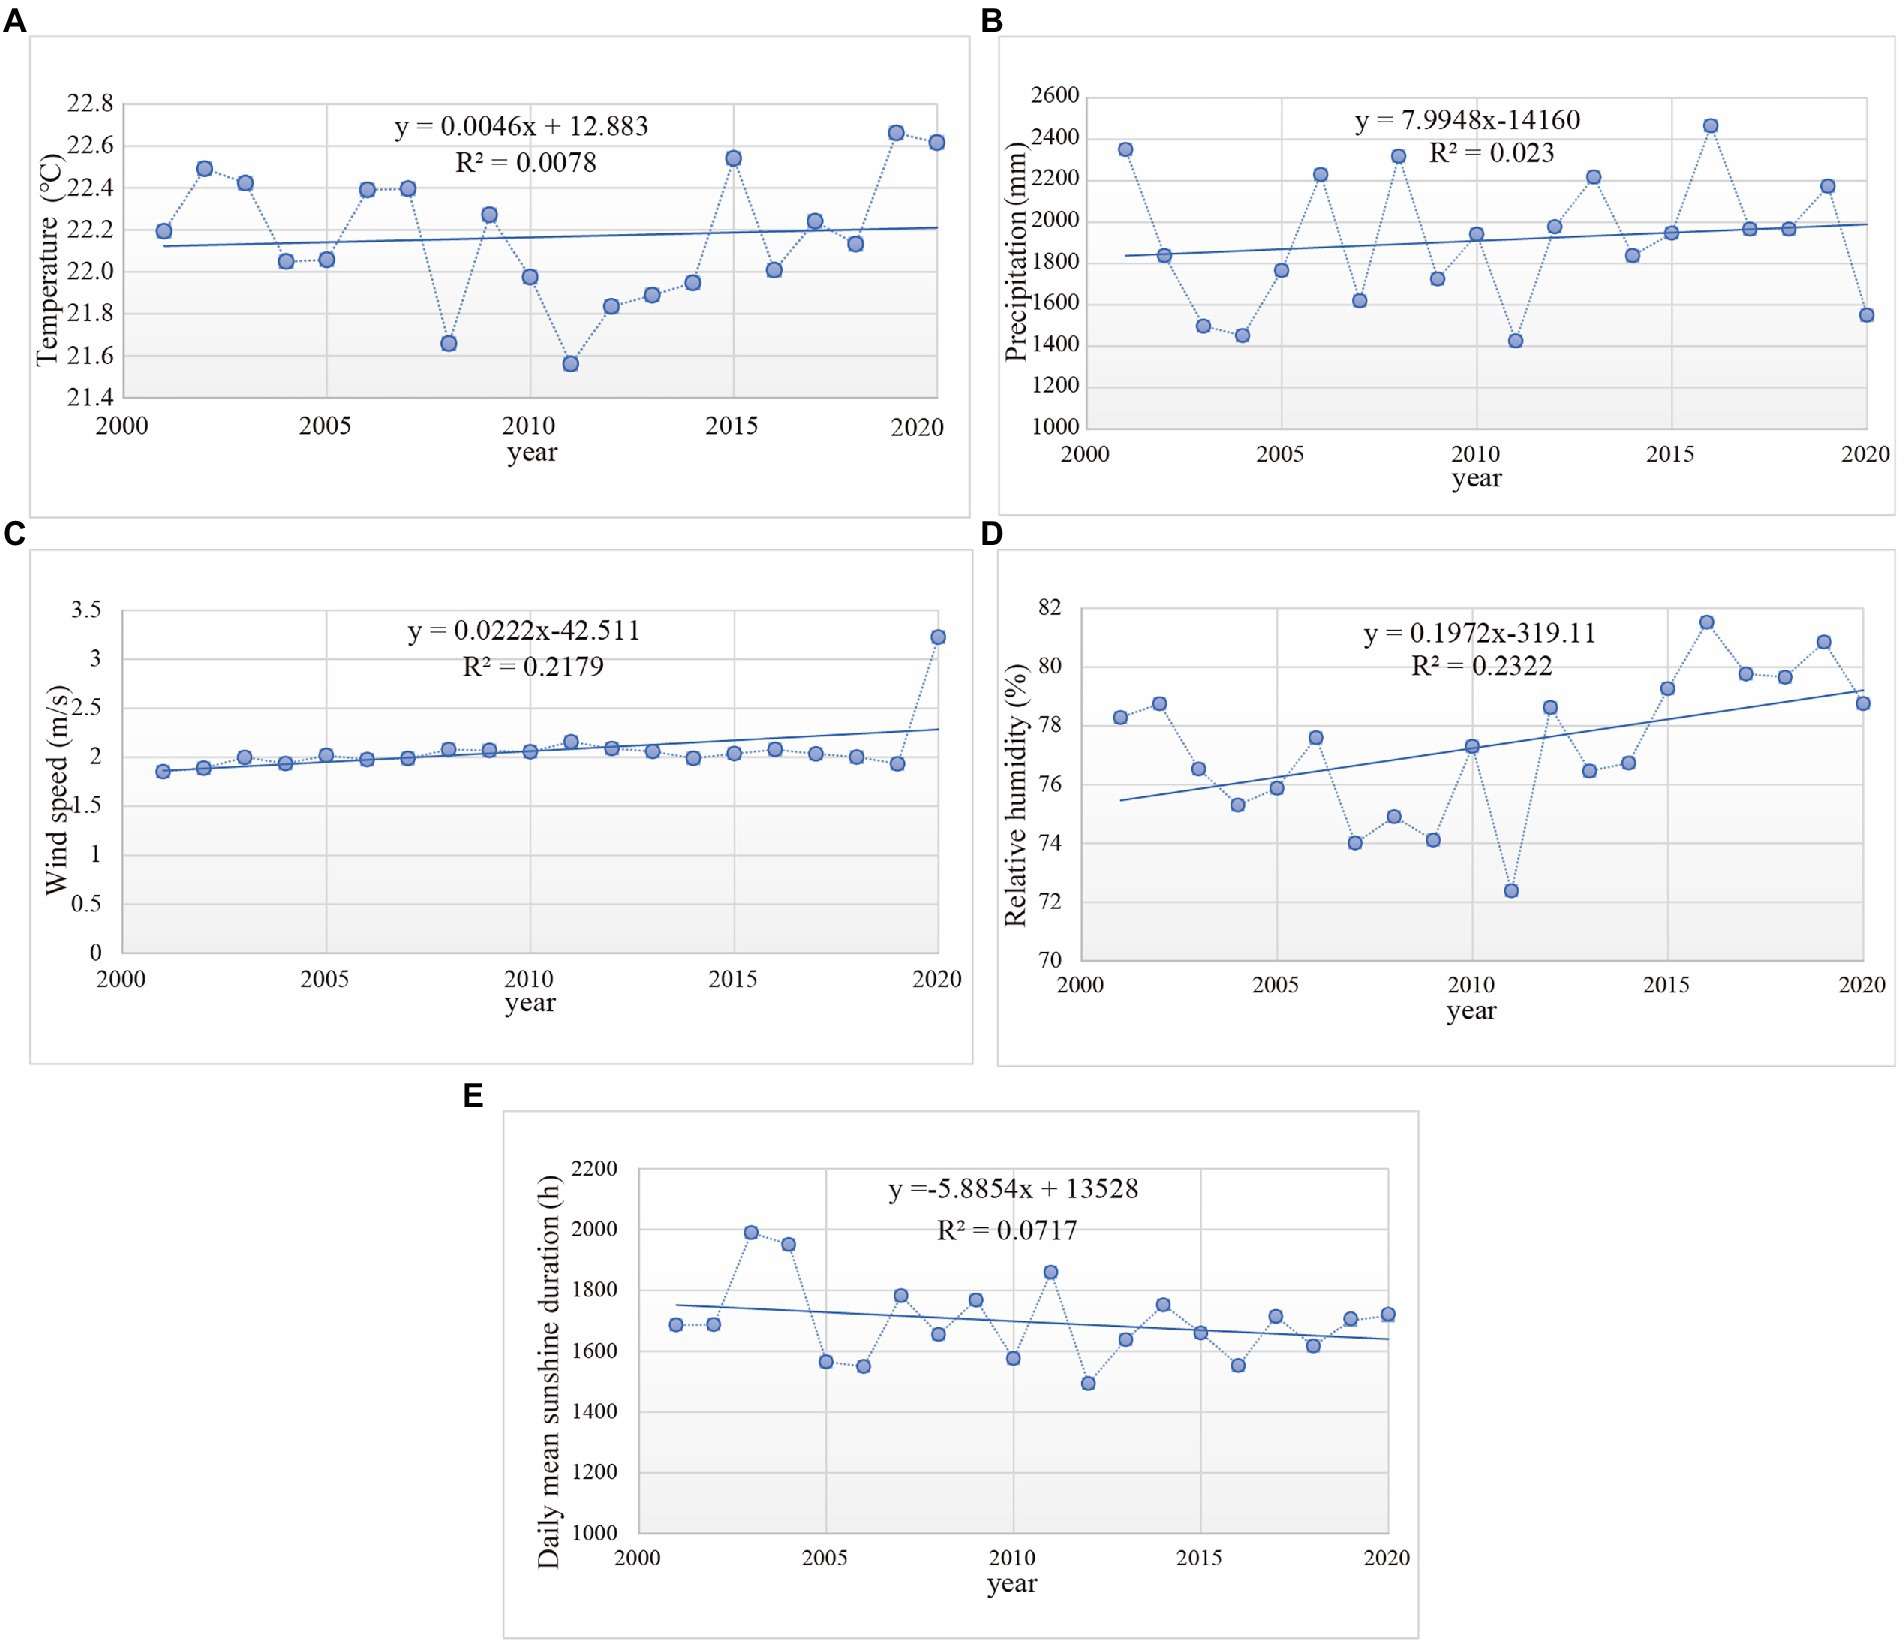
Figure 3. Interannual change of climate factors. (A) Temperature. (B) Precipitation. (C) Wind speed. (D) Relative humidity. (E) Daily mean sunshine duration.
The mean EVI were calculated based on the annual maximum EVI from 2001 to 2020 in GBA. We divided the mean EVI into the five grades according to the condition of vegetation cover by the equal intervals: low (EVI < 0.2), relatively low (0.2 < EVI < 0.4), medium (0.4 < EVI < 0.6), relatively high (0.6 < EVI < 0.8), and high (EVI ≥ 0.8) (Figure 4). There are obvious spatial differences in the distribution of EVI in GBA. The middle and relatively high EVI are distributed in the northern, western and eastern of GBA, with an area of 78.09%, while the minimum and relatively low EVI are mainly distributed in the center of GBA, with the area of 21.89%. Based on the maximum annual EVI, we analysis the characteristics of the annual time series change (Figure 5). The EVI exhibited an increasing trend (with growth rate of 0.0045/a) comprehensively in the time series. The range of EVI change is from 0.48 to 0.56 and the mean is 0.52. In summary, for the informants in this analysis, the vegetation is well-protected in GBA in past 20 years, along with improving the condition of plant growth.
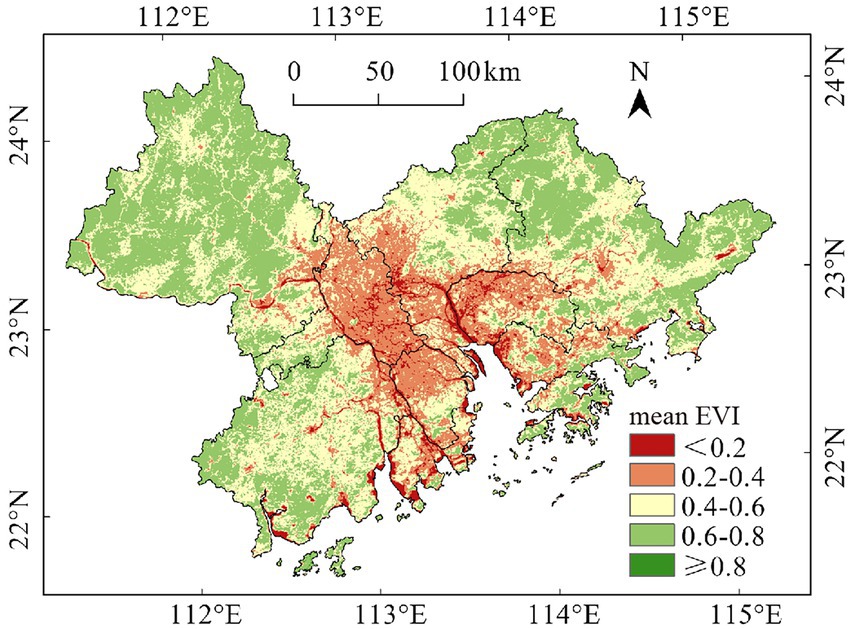
Figure 4. The spatial distribution of mean EVI.
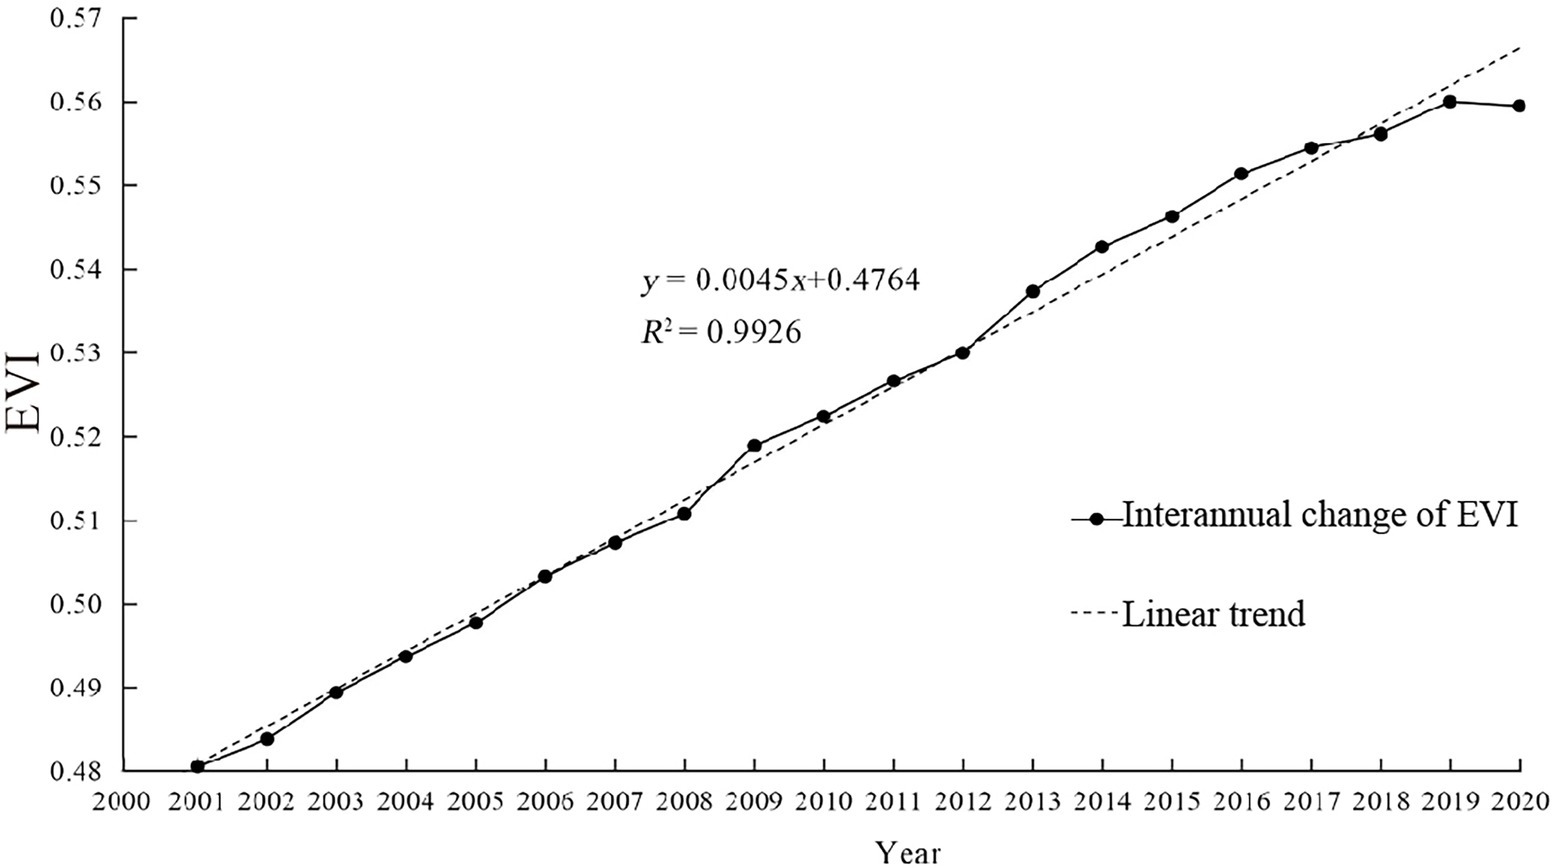
Figure 5. The interannual change of EVI in the Guangdong-Hong Kong-Macao Greater Bay Area.
According to the distribution of maximum annual EVI, the Theil-Sen trend analysis and Mann-Kendall (MK) test were carried out, to indicate the spatial distribution of the EVI changing trends in GBA during the past 20 years (Figure 6). In accordance with the present results, it has demonstrated that the vegetation cover has increased in a comprehensive trend in the past 20 years, the area of vegetation improvement is larger than the area of vegetation degradation, with the extremely significant vegetation improvement area of 66.98% and the extremely significant vegetation degradation area of 5.70% (Table 2).
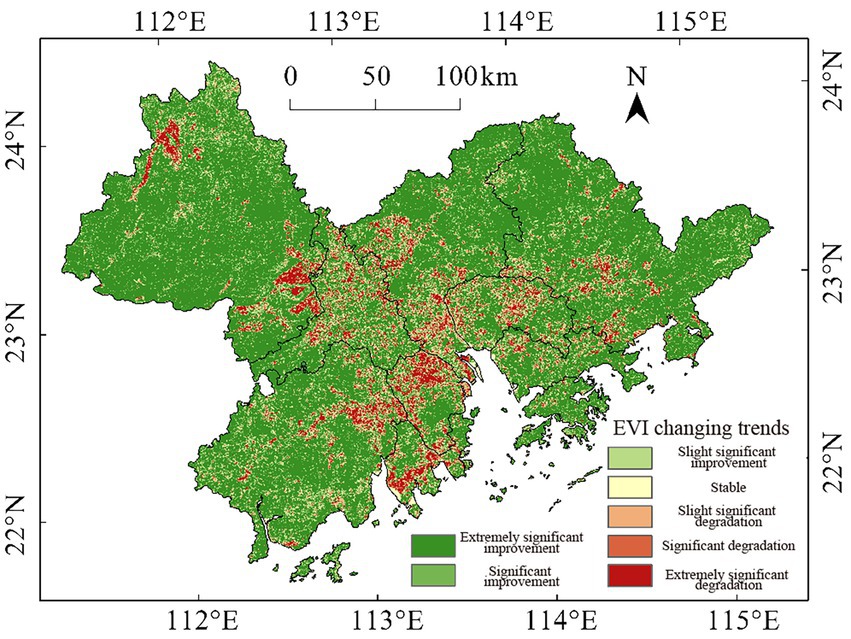
Figure 6. The EVI spatial changing trend.
There are obvious differences and agglomerations in the distribution of the EVI trends. The significant vegetation improvement area exhibited obvious agglomerated, and mainly distributed in northern, western, and eastern parts of GBA. The significant vegetation degradation area scattered and had obvious differences in the distribution, which mainly distributed in southern part of GZ, western part of FS, southern parts of ZH, northern part of ZS, and central part of DG. In summary, these results show that vegetation degradation areas are distributed around the peripheral area of urban agglomeration. The extremely significant vegetation improvement area mainly distrusted in eastern, western, and northern part of GBA, which has a relative distance away from the urban agglomeration, therefore, are less disrupted by human activities.
The R/S analysis predicted the EVI changing trend in the future, according to the persistence in long-term change of vegetation cover in GBA in the past 20 years. The analysis was based on the classification of the Hurst exponent proposed by Peng et al. (2012) and Li et al. (2017), which is showed in Figure 7 and Table 3. The pixels of the mean Hurst exponent area of 98.84%, which indicated persistence (H ≥ 0.50), while the anti-persistence (H < 0.50) pixels are account the area of 1.16%. Both persistence and anti-persistence area are distributed scattered. The evolution degradation of area is 14.77%, with insignificant agglomerations in spatial distribution. The evolution improvement area is of 85.23%.
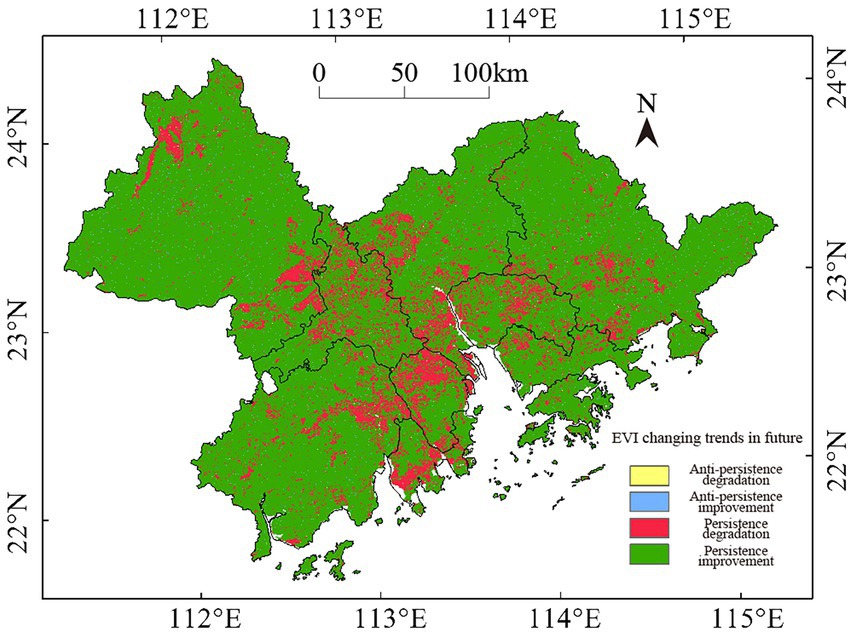
Figure 7. The EVI spatial changing trend based on Hurst exponent analysis in future.
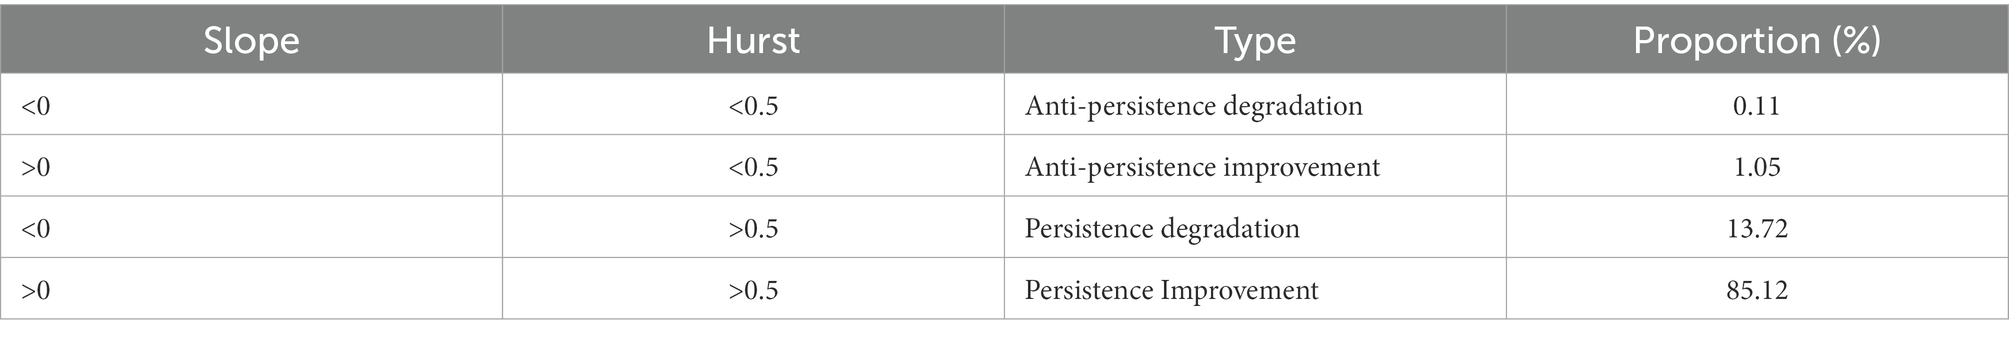
Table 3. The proportion of EVI changing trends classified as four levels.
There are several possible explanations for this result. The appearance of significant persistence is mainly impacted by natural factors or human activities, such as deforestation, afforestation, and auto-restoration after disasters. On the other hand, the weaken persistence indicated that the vegetation cover are influenced combinedly by natural factors and human activities, with insignificant differences in the influence degree. In this study, the combined influence of various factors in EVI trend were predicted by the considering the regular pattern of the past 20 years. Combining the result of Theil-Sen slope and Hurst exponent, the prediction of the EVI trends is exhibited as Figure 7. The EVI tends to improve in the future, since more than 80% of the area showed improvement, while 13.72% of the area showed degradation vegetation, mainly distributed in the central and northwestern part of the GBA. Additionally, we investigate little area of the non-persistence degradation and non-persistence improvement.
The Pearson correlation coefficient between maximum annual EVI and five climate factors (Temperature, precipitation, wind speed, relative humidity and sunshine duration) has been calculated, and the significances are tested by using t-test. The result indicated that there are significant spatiotemporal differences in the correlation between annual EVI changing trend and climate factors.
There are 49.16% of the area had positive correlation between the change of EVI trend and temperature. However, there are 7.15% of the area had significant positive correlation, and 21.55% of the area had significant correlation. In terms of the spatial distribution, the EVI, with significant correlation with temperature, distributed scattered and mainly indicated around the urban agglomeration, which is the southern coastal area of GBA (the center of HZ). The 14.40% of significant negative area mainly distributed in ZQ, the northern part of GZ, the northern and eastern part of HZ (Figure 8).
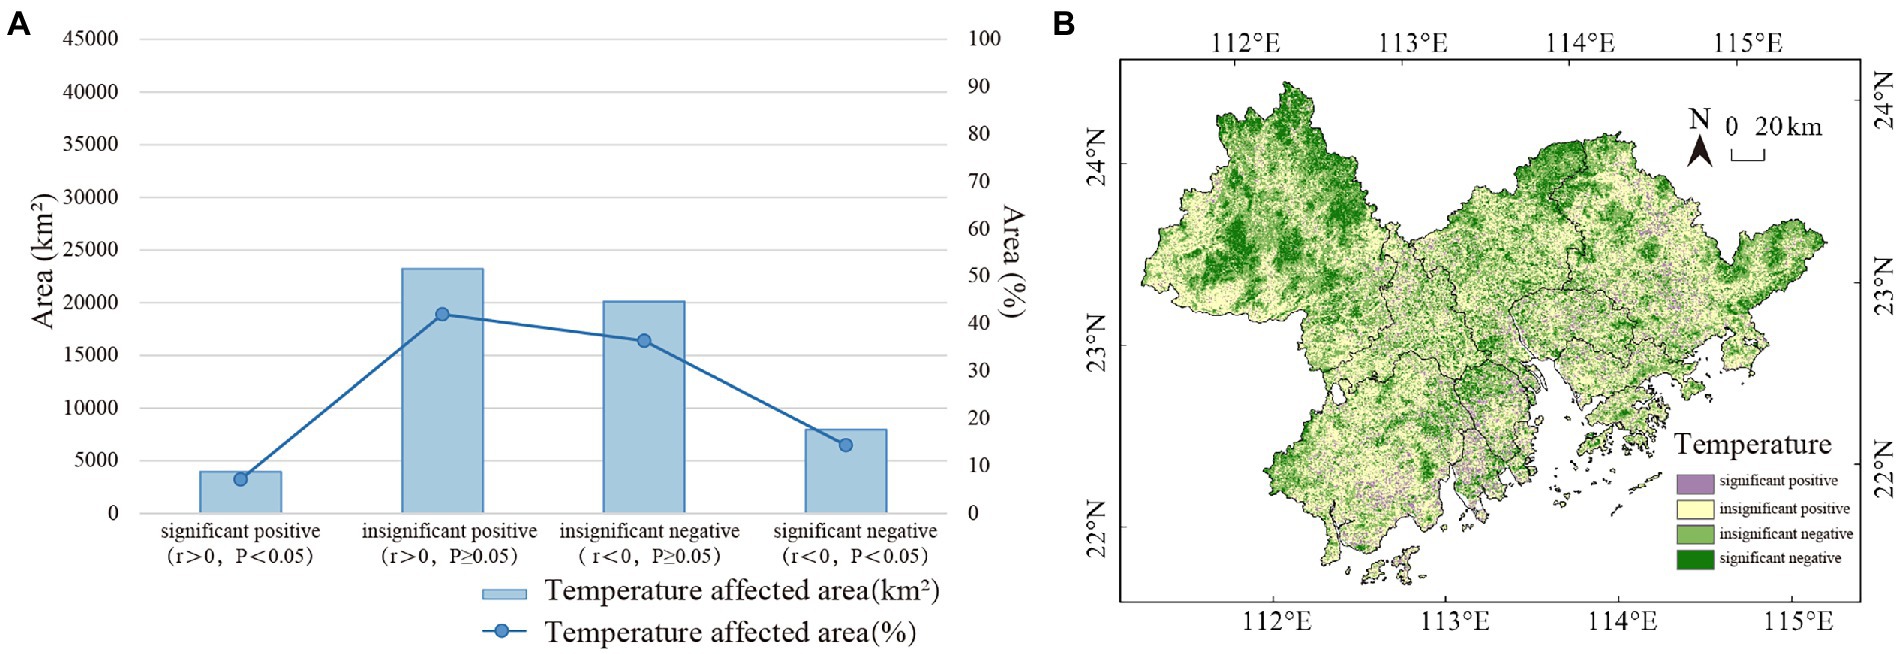
Figure 8. The coefficients between the changing trend of EVI and temperature in GBA. (A) Area (%) correlated with the temperature. (B) Correlation of changes in vegetation cover changes influenced by the temperature.
There are only 3.22% of the area had significant correlation between precipitation and EVI trends, and 2.51% of the area had significant positive correlation, with a scattered distribution. Additionally, 0.71% of the area had significant negative correlation. The observed correlation between precipitation and the EVI trends could be explained in this way: there are weaken correlation between precipitation and the EVI trend, and more than 90% of the area had insignificant correlation (Figure 9).
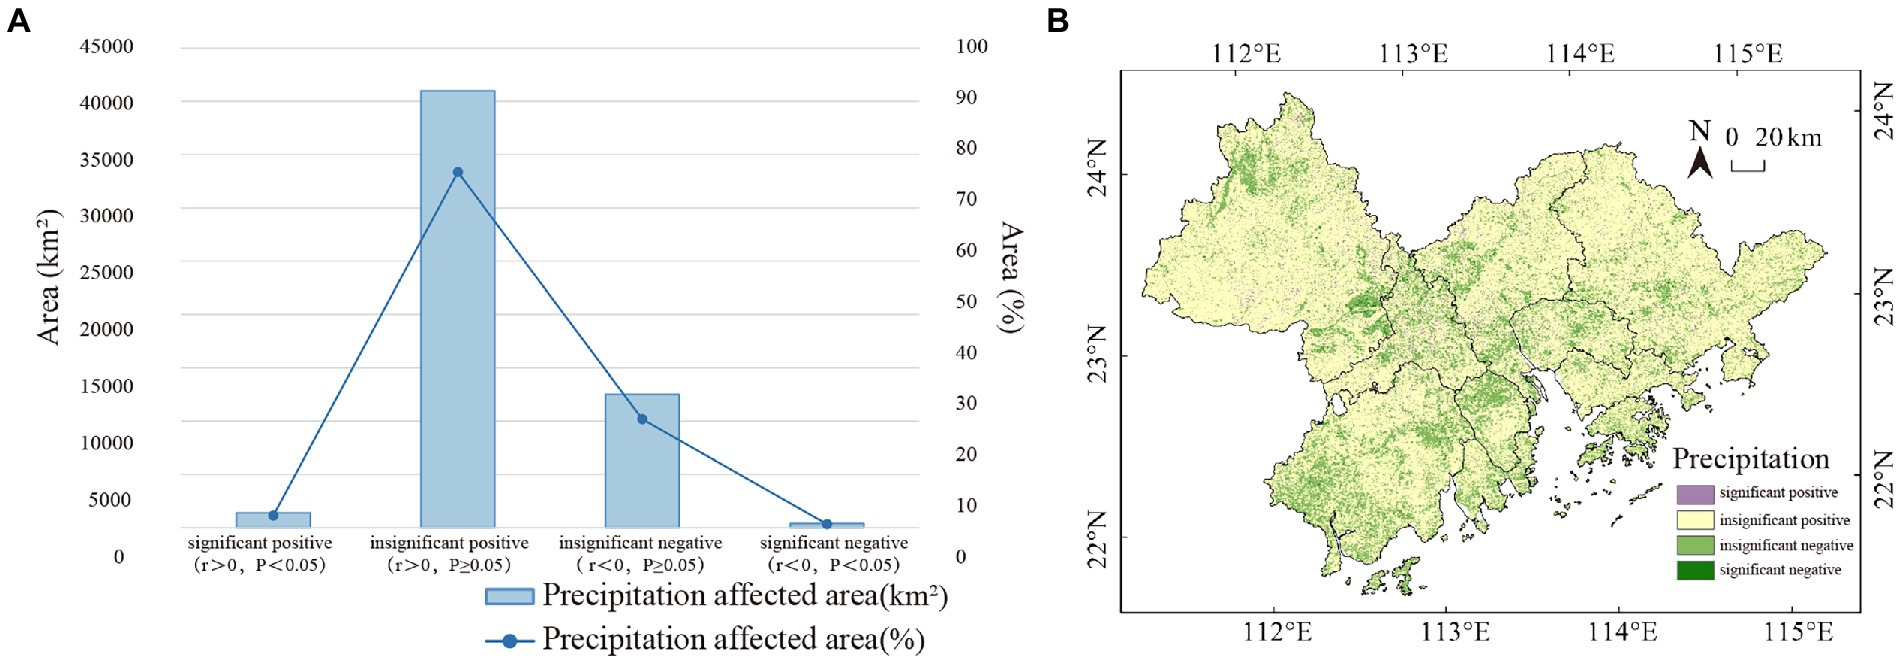
Figure 9. The coefficients between the changing trend of EVI and precipitation in GBA. (A) Area (%) correlated with precipitation. (B) Correlation of changes in vegetation cover changes influenced by precipitation.
There are 42.19% of the area had significant correlation between wind speed and EVI trends, with 32.99% of the significant positive correlated area. The distribution of the correlated area exhibited agglomerated in the northeastern and northwestern part of GBA, which mainly had forest land and far away from urban agglomeration. The significantly positive correlated area was mainly distributed in the most part of ZQ, the western part of FS, the northern part of JM and the northeastern part of HZ. The significantly negative correlated area (9.20%) mainly distributed in SZ, HK and the northern part of HZ (Figure 10).
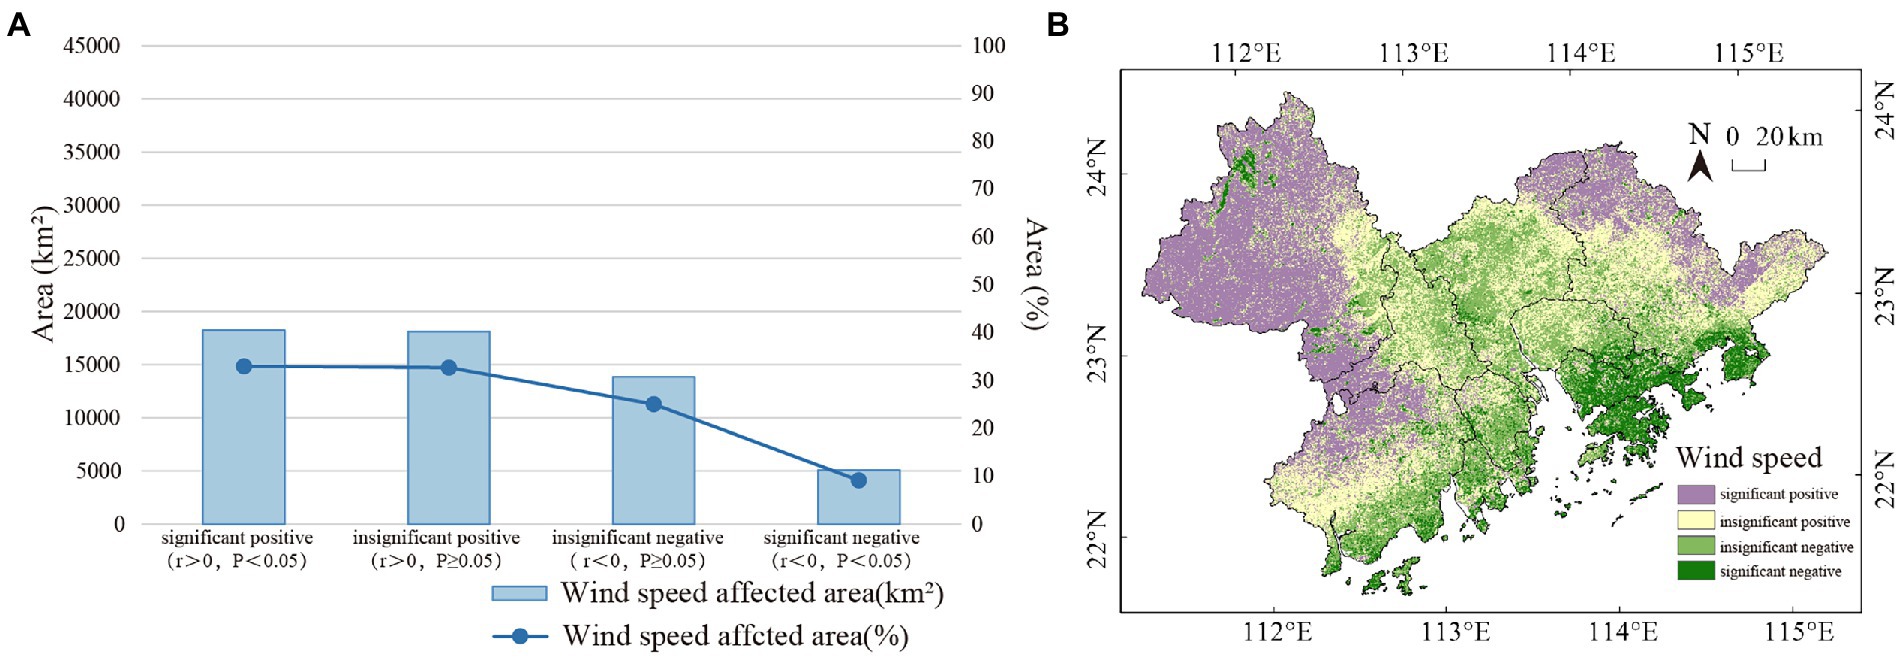
Figure 10. The coefficients between the changing trend of EVI and wind speed in GBA. (A) Area (%) correlated with wind speed. (B) Correlation of changes in vegetation cover changes influenced by wind speed.
Approximately 80.23% of the area had a significant positive correlation between relative humidity and the trends of EVI, 43.51% of the area had a significant correlation and 37.74% had a significant positive correlation (r > 0, p < 0.05). the correlated area distributed widely and agglomerated in the northern, western, and eastern part of the GBA (the western, central, and southern parts of ZQ, the northwestern part of FS, the center of GZ, the central and eastern part of HZ, DG, the northern part of HK and the western part of JM). The significant correlated area (5.77%) is distributed in the northern and southeastern part of ZQ, the northern part of ZS and the eastern part of JM (Figure 11).
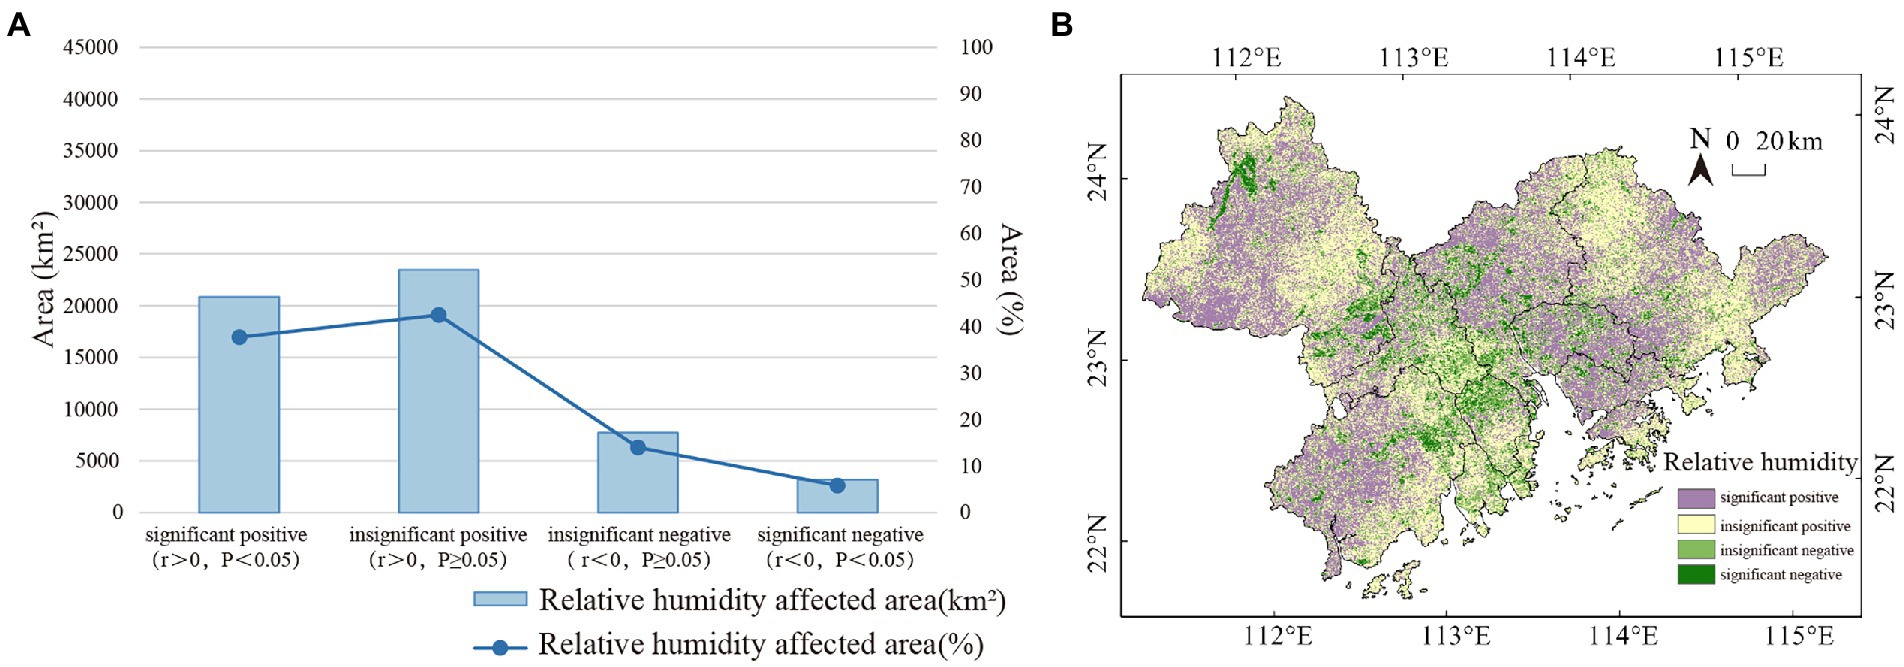
Figure 11. The coefficients between the changing trend of EVI and relative humidity in GBA. (A) Area (%) correlated with relative humidity. (B) Correlation of changes in vegetation cover changes influenced by relative humidity.
There is weak correlation between EVI trends and sunshine radiation and no significant correlation. There are 68.22% of the area insignificantly negative correlated (r > 0, p < 0.05) with sunshine radiation and 3.53% of the area significant correlated. There are 0.44% of the area had significant positive correlation between EVI trends and 3.09% of the area had significant negative correlation, which mainly distributed in the eastern part of ZQ (Figure 12).
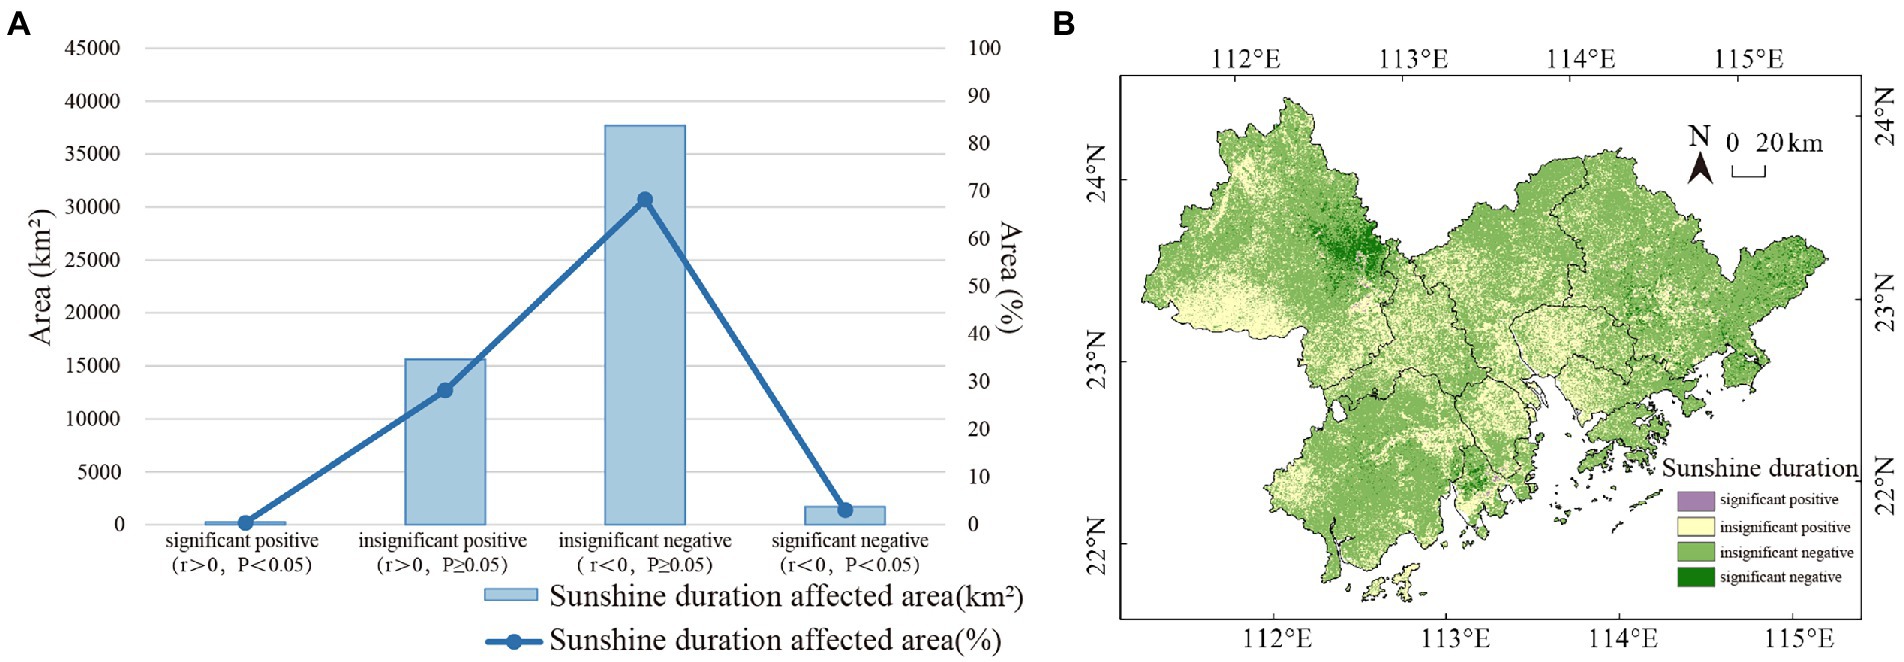
Figure 12. The coefficients between the changing trend of EVI and sunshine duration in GBA. (A) Area (%) correlated with sunshine duration. (B) Correlation of changes in vegetation cover changes influenced by sunshine duration.
During the past 20 years from 2001 to 2020, according to the mean of the EVI trends, the vegetation cover comprehensively exhibited a significant improvement in GBA. There are similarities between the result expressed by EVI trend in this study and the NDVI trends described by Deng et al. (2021) in Guangdong province. However, the rate of EVI trend is lower than the NDVI trends in Guangdong province. And from 2000 to 2020, the vegetation NPP increased trend about 0.001kgC/m2·a (Zhao et al., 2022). This study corroborates the conclusions of Chen et al. (2019) and Yuan et al. (2018), who suggested that the vegetation changing trend of China and the global vegetation changing trend are improved similarly. The vegetation improvements are shown in the eastern part of China (Zhejiang province) (He et al., 2020), the western part of China (Guizhou province) (Xu et al., 2020), the Beijing-Tianjin-Hebei metropolitan regions (Li et al., 2017), the Yellow River Basin (Xie et al., 2022) and the western part of the Jinsha River Basin (Zhang et al., 2021). The previous results are different in the trend of vegetation change. For example, the rate of EVI trends is 0.045/10a in the Hot and humid area, as the result indicated in the present study. While the rate of EVI trend is 0.038/10a in the arid and semi-arid area of China (Yellow River Basin) (Xie et al., 2022). Additionally, conclusion such as that conducted by Zhang et al. (2021) have shown that the rate of EVI trend (0.011/10a) is slower in the western part of the Jinsha River Basin.
In terms of the spatial distribution of EVI trend, there are comprehensive vegetation improvement in GBA, and the area of vegetation improvement is larger than the area of vegetation degradation. The spatial distribution of EVI trend exhibited obvious differences and agglomeration. According to spatial distribution, it is significant vegetation degradation around urban agglomerations, since a few studies considered that human activities are the main reason (Qi et al., 2019; Zhao et al., 2022). The result of this study indicated that the EVI changing trend in the future by R/S analysis method is affected by climate and human factors together and there are no significant factors. The improvement of vegetation is predicted in the future by comprehensive analysis of the Theil-Sen slope and Hurst exponent, with the vegetation improvement area of 80% and an extremely significant vegetation degradation area of 5.7%. Based on this analysis, we can infer that both ecological environment protection and economic development can be simultaneously achieved in GBA.
Much of the literature emphasizes the vegetation growth had obvious response to climate factors. To date, several studies have investigated the precipitation and temperature is the main factors of vegetation change in the arid and semi-arid area and the region in the climate zone that plants both have growth and deciduous seasons (Gan et al., 2011; Mu et al., 2012; He et al., 2020). While there are differences in the results by using various VI (Xie et al., 2022). However, it has been suggested that the influence of precipitation is more obvious (Xie et al., 2016; Liu et al., 2021; Zhang et al., 2021). This does not appear to be the case in other regions. This finding is different from other studies that have suggested that temperature had more obvious effects (Hua et al., 2017; Deng et al., 2021; Zhao et al., 2022). There is mainly south-subtropical ever-green broad leaf forest and in the GBA, with sufficient sunshine radiation and abundant rainfall. And the climate change in GBA is stable. However, in this study, precipitation and sunshine had no effect on EVI trend.
The correlation between EVI and five climate factors (Temperature, precipitation, wind speed, relative humidity and sunshine duration) has been calculated, and the significances are tested by using t-test. The result indicated precipitation has no significant correlation with EVI trends in the Hot and humid area with mean precipitation of 1,800 mm. In contrast to the findings in arid and semi-arid area, however, significant correlation between precipitation and vegetation change was detected. Our results corroborate the findings of the previous work in the insignificant correlation between precipitation and NDVI trends (Zhang et al., 2021). The previous studies demonstrated that the vegetation cover is significantly positively correlated with temperature both in humid area and GBA by using the NDVI. This study seems to be consistent with other research which found there are correlation between temperature and vegetation cover, but it’s insignificant. In the terms of spatial distribution, the influence of temperature to EVI is complex in GBA, the spatial distribution of correlation is scattered.
Although extensive research has been conducted on vegetation change and climate factors, few studies have identified the correlation between vegetation change and two climate factors (relative humidity and wind speed). In this study, not only the three factors (temperature, precipitation and sunshine duration) that have been analyzed, but also relative humidity and wind speed. There is a significant positive correlation between the EVI trend and two climate factors (relative humidity and wind speed). An issue that was not addressed in this study was what is the internal mechanisms of these influences. The relevance of EVI and climate factors analyzed by annual data is clearly supported by current findings. The wind speed and relative humidity correlated with EVI significantly. An additional uncontrolled factor is the possibility that there are differences in the climate factors of various seasons. These differences make these findings less generalizable to enhance the correlation of EVI and some climate factors in annual scale. More information on month or seasonal scale would help us establish a greater degree of accuracy in this matter and to analysis the hysteresis of the influences.
The MODIS-EVI and climate data were analyzed from the National Aeronautics and Space Administration (NASA) and the Resource and Environment Science Data Center of the Chinese Academy of Sciences. This paper elucidated the characteristics of spatiotemporal change of EVI and its trend in the future by using Theil-Sen trends analysis, Mann-Kendall Test and R/S Analysis, basing on the MODIS-EVI and climate data from 2001 to 2020. The paper indicated the correlation between EVI trend and the change of climate factors by using Pearson correlation analysis.
The study highlighted the change of climate factors (temperature, precipitation, wind speed, relative humidity, and sunshine duration) has relatively stable and slightly fluctuated in the past 20 years. Temperature, precipitation, and humidity exhibited an extremely slow and insignificant increasing trend, and the sunshine duration showed an insignificant decreasing trend. The temperature fluctuates from 22.1°C to 22.2°C and the mean precipitation are fluctuated from 1800 mm-2000 mm. Relative humidity increased from 75 to 79%. Taken together, the result identified an extremely slowly warming and humidify of GBA, and a relatively stable climate change.
In this condition of climate change, the result showed the mean EVI increased in GBA, and the rate of increase is 0.045/10a in the past 20 years. The area of extremely significant vegetation improvement is approximately 70% and the area of significant and extremely significant vegetation degradation is 7.43%, which mainly distributed in the central of GBA. In the prediction, more than 80% of the area showed an increasing trend of EVI. There are obvious differences in the spatial distribution of vegetation. The middle and relatively high EVI distributed in the northern, western, and eastern part of GBA, with an area of 80% approximately. The relatively low value mainly distributed in the central of GBA, with the area of 20% approximately. The EVI increasing from the 2001 to 2020, while the area of extremely vegetation improvement is larger than the area of vegetation degradation. The result indicated the positive improvement of vegetation in GBA. Therefore, the trends of EVI that we have identified assists in our understanding of the contribution of environmental protection in GBA during the past 20 years.
There are spatiotemporal differences in the influence of EVI trend to five climate factors (temperature, precipitation, wind speed, relative humidity, and sunshine duration). One of the more significant findings to emerge from this study is that wind speed, relative humidity relatively obviously significant correlated with EVI trend, the area of significant correlation is over than 40%. Temperature correlated with EVI weaker; the area of significant correlation is more than 20%. Precipitation and sunshine duration had the least correlation with EVI, and the area of significant correlation are less than 5%. Therefore, in the south-subtropical Hot and humid area, precipitation and sunshine duration have weak influence on the vegetation. On the contrary, relative humidity and wind speed have more significant influence on the vegetation.
Publicly available datasets were analyzed in this study. This data can be found here: National Aeronautics and Space Administration, National Ground-Level Meteorological Observation Station, and Hong Kong Reference Weather Station.
XF and ZZ completed the data collection and methodological construction of this study, and wrote the first draft of the manuscript. ZZ analyzed the feasibility of the study data, collected the data, and calculated the results. XF and MH wrote parts of the manuscript. All authors participated in the revision of the manuscript, read and approved the submitted version.
This study was supported by National Natural Science Foundation of China (NSFC) (No. 51978276), The interactive influence mechanism of urban green space, local wind climate, and residents’ health based on the multi-spatial scale in Guangdong-Hong Kong-Macao Greater Bay Area.
The authors declare that the research was conducted in the absence of any commercial or financial relationships that could be construed as a potential conflict of interest.
All claims expressed in this article are solely those of the authors and do not necessarily represent those of their affiliated organizations, or those of the publisher, the editors and the reviewers. Any product that may be evaluated in this article, or claim that may be made by its manufacturer, is not guaranteed or endorsed by the publisher.
Chen, Y. L., Luo, Y. M., Mo, W. H., Mo, J. F., Huang, Y. L., and Ding, M. H. (2014). Differences between MODIS NDVI and MODIS EVI in response to climatic factors. J. Nat. Resour. 29, 1802–1812. doi: 10.11849/zrzyxb.2014.10.015
Chen, C., Park, T., Wang, X., Piao, S., Xu, B., Chaturvedi, R. K., et al. (2019). China and India lead in greening of the world through land-use management. Nat. Sustain. 2, 122–129. doi: 10.1038/s41893-019-0220-7
Cheng, H. F., Zhang, W. B., and Chen, F. (2008). Advances in researches on application of remote sensing method to estimating vegetation coverage. Rem. Sens. Land Res. 20, 13–18.
De la Barrera, F., and Henríquez, C. (2017). Vegetation cover change in growing urban agglomerations in Chile. Ecol. Indic. 81, 265–273. doi: 10.1016/j.ecolind.2017.05.067
Deng, Y. J., Wang, J. C., Xu, J., Du, Y. D., Chen, J. Y., and Chen, D. C. (2021). Spatiotemporal variation of NDVI and its response to climatic factors in Guangdong Province. Ecol. Environ. Sci. 30, 37–43. doi: 10.16258/j.cnki.1674-5906.2022.09.001
Feng, X. H., Zeng, Z. L., and Zhang, D. S. (2022). Temporal-spatial evolution of vegetation coverage in the Guangdong-Hong Kong-Macao Greater Bay Area on MODIS NDVI data. J. Chin. Urban Forest. 20, 1–28. doi: 10.16258/j.cnki.1674-5906.2022.09.001
Fensholt, R., Langanke, T., Rasmussen, K., Reenberg, A., Prince, S. D., Tucker, C., et al. (2012). Greenness in semi-arid areas across the globe 1981–2007 — an earth observing satellite based analysis of trends and drivers. Remote Sens. Environ. 121, 144–158. doi: 10.1016/j.rse.2012.01.017
Gan, C. Y., Wang, X. Z., Li, B. S., Liang, Z. X., Li, Z. W., and Wen, X. H. (2011). Changes of vegetation coverage during recent 18 years in Lianjiang River watershed. Scientia Geographica Sinica/Dili Kexue. 31, 1019–1024. doi: 10.13249/j.cnki.sgs.2011.08.013
Gitelson, A. A., Kaufman, Y. J., Stark, R., and Rundquist, D. (2002). Novel algorithms for remote estimation of vegetation fraction. Remote Sens. Environ. 80, 76–87. doi: 10.1016/S0034-4257(01)00289-9
He, Q. J. (2019). Spatio-temporal variation of NDVI and its response to meteorological factors in Pearl River Delta based on MODIS data. Ecol. Environ. Sci. 28, 1722–1730. doi: 10.16258/j.cnki.1674-5906.2019.09.002
He, Z. H., Zhang, Y. H., He, Y., Zhang, X. W., Cai, J. Z., and Lei, L. P. (2020). Trends of vegetation change and driving factor analysis in recent 20 years over Zhejiang Province. Ecol. Environ. Sci. 29, 1530–1539. doi: 10.16258/j.cnki.1674-5906.2020.08.004
Hu, M., and Xia, B. (2019). A significant increase in the normalized difference vegetation index during the rapid economic development in the Pearl River Delta of China. Land Degrad. Dev. 30, 359–370. doi: 10.1002/ldr.3221
Hua, W., Chen, H., Zhou, L., Xie, Z., Qin, M., Li, X., et al. (2017). Observational quantification of climatic and human influences on vegetation greening in China. Remote Sens. 9:425. doi: 10.3390/rs9050425
Hurst, F. B. (1951). Climates prevailing in the yellow-gray earth and yellow-brown earth zone in New Zealand. Soil Sci. 72, 1–20. doi: 10.1097/00010694-195107000-00001
Jiang, L., Bao, A., Guo, H., and Ndayisaba, F. (2017). Vegetation dynamics and responses to climate change and human activities in Central Asia. Sci. Total Environ. 599-600, 967–980. doi: 10.1016/j.scitotenv.2017.05.012
Li, Z., Sun, R., Zhang, J. C., and Zhang, C. (2017). Temporal-spatial analysis of vegetation coverage dynamics in Beijing-Tianjin-Hebei metropolitan regions. Acta Ecol. Sin. 37, 7418–7426. doi: 10.5846/stxb201609231919
Li, H., Zheng, L., Lei, Y., Li, C. Q., and Zhou, K. (2007). Comparison of NDVI and EVI based on EOS/MODIS data. Prog. Geogr. 26, 26–32. doi: 10.3969/j.issn.1007-6301.2007.01.003
Liu, H., Liu, F., and Zhen, L. (2021). Effects of climate change and human activities on vegetation cover change in the Yellow River bash. J. Soil Water Conserv. 35, 143–151. doi: 10.13870/j.cnki.stbcxb.2021.04.020
Liu, Q., Piao, S., Fu, Y. H., Gao, M., Peñuelas, J., and Janssens, I. A. (2019). Climatic warming increases spatial synchrony in spring vegetation phenology across the northern hemisphere. Geophys. Res. Lett. 46, 1641–1650. doi: 10.1029/2018GL081370
Liu, X. F., Yang, Y., Ren, Z. Y., and Lin, Z. H. (2013). Changes of vegetation coverage in the loess plateau in 2000–2009. J. Desert Res. 33, 1244–1249. doi: 10.7522/j.issn.1000-694X.2013.00175
Mandelbrot, B. B., and Wallis, J. R. (1969). Some long-run properties of geophysical records. Water Resour. Res. 5, 321–340. doi: 10.1029/WR005i002p00321
Mu, S. J., Li, J. L., Chen, Y. Z., Gang, C., Zhou, W., and Ju, W. M. (2012). Spatial differences of variations of vegetation coverage in Inner Mongolia during 2001–2010. Acta Ecol. Sin. 67, 1255–1268.
Myneni, R. B., Keeling, C. D., Tucker, C. J., Asrar, G., and Nemani, R. R. (1997). Increased plant growth in the northern high latitudes from 1981 to 1991. Nature 386, 698–702. doi: 10.1038/386698a0
Parmesan, C. (2006). Ecological and evolutionary responses to recent climate change. Annual review of ecology. Evol. Syst. 37, 637–669. doi: 10.1146/annurev.ecolsys.37.091305.110100
Pei, F., Xia, L. I., Liu, X., and Xia, G. (2015). Dynamic simulation of urban expansion and their effects on net primary productivity: a scenario analysis of Guangdong province in China. J. Geo-Inf. Sci. 17, 469–477. doi: 10.3724/SP.J.1047.2015.00469
Peng, J., Liu, Z., Liu, Y., Wu, J., and Han, Y. (2012). Trend analysis of vegetation dynamics in Qinghai–Tibet plateau using Hurst exponent. Ecol. Indic. 14, 28–39. doi: 10.1016/j.ecolind.2011.08.011
Piao, S., Wang, X., Ciais, P., Zhu, B., Wang, T., and Liu, J. (2011). Changes in satellite-derived vegetation growth trend in temperate and boreal Eurasia from 1982 to 2006. Glob. Chang. Biol. 17, 3228–3239. doi: 10.1111/j.1365-2486.2011.02419.x
Piao, S., Wang, X., Park, T., Chen, C., Lian, X., He, Y., et al. (2020). Characteristics, drivers and feedbacks of global greening. Nat. Rev. Earth Environ. 1, 14–27. doi: 10.1038/s43017-019-0001-x
Qi, X., Jia, J., Liu, H., and Lin, Z. (2019). Relative importance of climate change and human activities for vegetation changes on China’s silk road economic belt over multiple timescales. Catena 180, 224–237. doi: 10.1016/j.catena.2019.04.027
Tucker, C. J., Slayback, D. A., Pinzon, J. E., Los, S. O., Myneni, R. B., and Taylor, M. G. (2001). Higher northern latitude normalized difference vegetation index and growing season trends from 1982 to 1999. Int. J. Biometeorol. 45, 184–190. doi: 10.1007/s00484-001-0109-8
Wang, Z. X., Liu, C., and Alfredo, H. (2003). From AVHRR-NDVI to MODIS-EVI: advances in vegetation index research. Acta Ecol. Sin. 05, 979–987. doi: 10.3321/j.issn:1000-0933.2003.05.020
Wang, Z., Liu, C., Chen, W., and Lin, X. V. (2006). Preliminary comparison of MODIS-NDVI and MODIS-EVI in eastern Asia. Geomat. Inform. Sci. Wuhan Univ. 31, 407–410. doi: 10.3969/j.issn.1671-8860.2006.05.008
Xia, C., Li, J., and Liu, Q. (2013). Review of advances in vegetation phenology monitoring by remote sensing Yaogan Xuebao. J. Rem. Sens. 17, 1–16.
Xiao, J., and Moody, A. (2005). A comparison of methods for estimating fractional green vegetation cover within a desert-to-upland transition zone in Central New Mexico, United States. Remote Sens. Environ. 98, 237–250. doi: 10.1016/j.rse.2005.07.011
Xie, B., Jia, X., Qin, Z., Shen, J., and Chang, Q. (2016). Vegetation dynamics and climate change on the loess plateau, China: 1982–2011. Reg. Environ. Chang. 16, 1583–1594. doi: 10.1007/s10113-015-0881-3
Xie, H., Tong, X. J., Li, J., Zhang, J. R., Liu, P. R., and Yu, P. Y. (2022). Changes of NDVI and EVI and their responses to climate variables in the Yellow River Basin during the growing season of 2000–2018. Acta Ecol. Sin. 42, 4536–4549. doi: 10.584/stxb202104271108
Xu, Y. F., Pan, W. S., and Zhang, Y. L. (2020). Vegetation NDVI change and its response to climate change in Guizhou plateau. Ecol. Environ. Sci. 29, 1507–1518. doi: 10.16258/j.cnki.1674-5906.2020.08.002
Ye, Q., Zhao, P., and Sun, J. (2012). Comparative analysis of vegetation coverage along the Yangtze River in Anhui Province based on MODIS/NDVI and EVI. Res. Environ. Yangtze Basin 21, 361–368.
Yi, Y., Hu, X. L., Shi, M. C., Kang, H. Z., Wang, B., Zhang, C., et al. (2021). Vegetation dynamics and its relationship with climate factors in the middle reaches of the Yangtze River based on MODIS NDVI. Acta Ecol. Sin. 41, 7796–7807. doi: 10.5846/stxb202007251953
Yi, Y., Shi, M., Yi, X., Liu, J., Shen, G., Yang, N., et al. (2022). Dynamic changes of plantations and natural forests in the middle reaches of the Yangtze River and their relationship with climatic factors. Forests 13:1224. doi: 10.3390/f13081224
Yuan, W., Piao, S., Qin, D., Dong, W., Xia, J., Lin, H., et al. (2018). Influence of vegetation growth on the enhanced seasonality of atmospheric CO2. Glob. Biogeochem. Cycles 32, 32–41. doi: 10.1002/2017GB005802
Zhang, G. P., Chen, G. M., Shao, H. Y., and Xian, W. (2021). Spatial-temporal characteristics of vegetation coverage and its response to climate from 2000 to 2015 in Jinsha River basin, China. Res. Environ. Yangtze Basin 30, 1638–1648.
Zhang, K. X., Fan, P. P., Wang, J. B., and Ye, H. (2019). Study on vegetation changes and climate factors in a karst region of Southwest China. Ecol. Environ. 28, 1080–1091. doi: 10.16258/j.cnki.1674-5906.2019.06.002
Keywords: EVI, spatiotemporal characteristics, climate factors, climate factors change, Guangdong-Hong Kong-Macao Greater Bay Area
Citation: Feng X, Zeng Z and He M (2023) A 20-year vegetation cover change and its response to climate factors in the Guangdong-Hong Kong-Macao Greater Bay Area under the background of climate change. Front. Ecol. Evol. 10:1080734. doi: 10.3389/fevo.2022.1080734
Edited by:
Shaoquan Liu, Institute of Mountain Hazards and Environment (CAS), ChinaReviewed by:
Suhong Zhou, Sun Yat-sen University, ChinaCopyright © 2023 Feng, Zeng and He. This is an open-access article distributed under the terms of the Creative Commons Attribution License (CC BY). The use, distribution or reproduction in other forums is permitted, provided the original author(s) and the copyright owner(s) are credited and that the original publication in this journal is cited, in accordance with accepted academic practice. No use, distribution or reproduction is permitted which does not comply with these terms.
*Correspondence: Xianhui Feng, ✉ eGhmZW5nQHNjdXQuZWR1LmNu
Disclaimer: All claims expressed in this article are solely those of the authors and do not necessarily represent those of their affiliated organizations, or those of the publisher, the editors and the reviewers. Any product that may be evaluated in this article or claim that may be made by its manufacturer is not guaranteed or endorsed by the publisher.
Research integrity at Frontiers
Learn more about the work of our research integrity team to safeguard the quality of each article we publish.