 Jin Li
 Saier Ma1
 Shiyong Chen
- 1College of Animal and Veterinary Sciences, Southwest Minzu University, Chengdu, China
- 2Sichuan Academy of Grassland Science, Chengdu, China
- 3Key Laboratory of Superior Forage Germplasm in the Qinghai-Tibetan Plateau, Qinghai Academy of Animal Science and Veterinary Medicine, Qinghai University, Xining, China
Elymus breviaristatus, a rare grass species with excellent resistance and ecological importance, is narrowly distributed on the Qinghai-Tibet plateau. Populations of E. breviaristatus are declining due to habitat fragmentation, and thus far, characteristics of genetic differentiation and adaptive responses to climate change remain poorly understood in this species. Here, we explored the genetic structure of 18 natural populations (269 individuals) in the transition zone between Tibet and the Hengduan Mountains using 15 expressed sequence tag (EST)-SSR primer pairs and identified possible barriers to gene flow that might have caused genetic discontinuities. Additional analyses were performed to identify the environmental factors affecting genetic diversity and to test whether the patterns of genetic variation among populations were more consistent with the isolation by distance (IBD) or isolation by environment (IBE) model. Multiple measures of genetic diversity revealed that intra-population genetic variation was low, while inter-population genetic variation was high. Clustering, structure, and principal coordinate analyses identified three genetic groups: (a) Eastern Qamdo, (b) Nagqu and Western Qamdo, and (c) Lhasa and Nyingchi. A clear physical barrier to gene flow was formed by the Yarlung Zangbo Grand Canyon and the Tanggula Mountains. We found that both IBD and IBE contributed to the observed patterns of genetic variation, and the IBE model played a leading role. In addition, precipitation-related variables, soil phosphorus content and soil K:P ratio significantly affected population genetic variation. Overall, our results emphasized the genetic fragility of E. breviaristatus populations and showed that this species requires attention, as future climate changes and human activities may further threaten its survival. In addition, the genetic differences among E. breviaristatus populations should be considered when formulating conservation measures for E. breviaristatus populations in the study area.
Introduction
Climate conditions are important determinants of plant genetics because past climate oscillations, especially during the Quaternary Period, have left complex imprints on the geographical distributions and genetic structures of most species in the Northern Hemisphere (Yang et al., 2018). Demographic expansion and contraction caused by climate oscillations have undoubtedly shaped geographic patterns of genetic variation within and among populations, and previous empirical investigations have shown that these patterns may have developed via a number of diverse mechanisms as well as the interactions among these mechanisms (Noguerales et al., 2016). For instance, in most species, genetic differentiation among populations increases with greater geographic separation, consistent with the “isolation by distance” (IBD) model (Wright, 1945). Although the original IBD model did not consider environmental effects, environmental features may also affect genetic differentiation, but the mechanisms underlying this possible association remain unclear.
A number of recent studies have shown that genetic differentiation is affected by environmental features and can occur without geographical restrictions (Zellmer et al., 2012; Shafer and Wolf, 2013; Wang et al., 2013). These studies have suggested that gene flow rates may be higher among similar environments compared to approximate locations, giving rise to the concept of isolation by environment (IBE; Wang and Bradburd, 2014). A recent meta-analysis indicated that the IBD and IBE patterns co-exist in a substantial number of species (Sexton et al., 2014). Within populations, genetic diversity is influenced by reproductive and mating systems and also reflects the selective effects that climate conditions have on species evolution; genetic diversity allows adaptation to environmental change and is the basis of long-term species survival (Booy et al., 2000). Thus, environmental conditions, such as precipitation, temperature and soil nutrients, may affect population genetic diversity.
For instance, Huang et al. (2014) showed that the annual temperature range strongly correlated with the Nei’s genetic diversity in Artemisia halodendron populations, while Trejo et al. (2016) reported that the expected heterozygosity (He) of Agave striata populations increased with temperature seasonality but decreased with annual precipitation. Here, we explored the possible associations between environmental conditions and the degree of genetic differentiation and diversity among populations of Elymus breviaristatus, an endangered grass species endemic to the Qinghai-Tibet plateau (QTP).
Known as the “third pole” of Earth, the QTP is the largest and highest plateau in the world (Zhang et al., 2016). The past geological and geomorphological changes not only affected atmospheric circulation in the Northern Hemisphere and China’s climatic and eco-environmental evolution (Zhang et al., 2000) but also led to the development of the peculiar climatic characteristics, unique geographical conditions, highly centralized biodiversity, and high numbers of endemic species in the Himalayas and Hengduan Mountains (Marchese, 2015). Additionally, Riddle (2016) identified the QTP as a hotspot in continental comparative phylogeographic studies. Indeed, as a focus of biodiversity research, the QTP has been identified as a core region of genetic differentiation for many species (Myers et al., 2000). With the release of the white paper on Biodiversity Conservation in China, the evolutionary history, genetic structure, and phylogeographic patterns of species populations on the QTP have garnered much attention. Species diversity in the QTP region is considered to be highly sensitive and vulnerable to external disturbances, such as global warming, habitat fragmentation, and spatial reduction (Xue et al., 2009; Li et al., 2019). Specifically, in the Hengduan Mountains, habitat destruction caused by overgrazing or other human activities has threatened the survival of local native plants (Liang et al., 2018; Yin et al., 2020). Thus, more attention should be paid to the protection of rare endemic plant resources in this area. In addition, an understanding of the spatial patterns of population genetic variation and genetic structure across natural populations is fundamental for the effective conservation of endangered species (Ghalambor et al., 2007; Franks et al., 2014).
In many terrestrial habitats, grasses determine community composition and function (Gibson, 2009). Grasses are particularly important in the QTP, where grasslands account for more than 60% of the total land area. As changes in the relative genetic diversity of grass taxa are thus likely to affect the entire ecosystem, it is particularly important to characterize the factors determining grass genetic diversity (Kahilainen et al., 2014). Previous studies have explored the impact of climatic factors on genetic diversity in various plant and animal taxa (Huang et al., 2014; Trejo et al., 2016). However, it remains unclear whether the identified mechanisms are equally applicable in the QTP.
Due to their short life cycles and high sensitivity to environmental changes, herbs are a good model taxon for studies on the relationship between genetic diversity and the complex and changeable climate of the QTP region. E. breviaristatus (Poaceae: Triticeae), a self-pollinated herb endemic to the QTP, is commonly used for the revegetation of deserts due to its strong stress tolerance (Gu et al., 2015). However, E. breviaristatus is gradually becoming extinct due to the fragmentation of its natural habitat and is considered vulnerable in the QTP (Fu and Jin, 1992). In 1999, this plant was listed as an important wild plant for conservation in China. Previous investigations have shown that E. breviaristatus has a moderate level of genetic diversity (Gu et al., 2015; Yu et al., 2019). Although genetic diversity determines the ability of species to adapt to the environment, it is challenging to understand the potential mechanisms that have resulted in species scarcity based on genetic diversity alone. Due to the rarity of E. breviaristatus, it is difficult to effectively investigate its genetic characteristics, and thus, the relationship between adaptive genetic variation and the environment in this plant remains unclear.
To prevent further decreases in populations of E. breviaristatus, we present herein an analysis of the spatial genetic structure of E. breviaristatus in the QTP, as well as the pattern of population genetic differentiation across these populations, using expressed sequence tag-simple sequence repeats (EST-SSRs) in combination with environmental characteristics. We extend a previous study of E. breviaristatus (Yu et al., 2019), which revealed no significant population-level IBD and ignored the environmental features of habitats, by testing for evidence of IBD and IBE in the patterns of genetic variation. We aimed to determine (a) the level, pattern, and structure of genetic variation among and within E. breviaristatus populations across the Tibet and Hengduan Mountains transition zone, (b) the possible environmental factors affecting population genetic diversity, and (c) whether the IBD or IBE model best explained the patterns of genetic differentiation among E. breviaristatus populations.
Materials and methods
Sampling and DNA extraction
A total of 269 individual seeds of E. breviaristatus were collected from 18 different populations in the transition zone between Tibet and the Hengduan Mountains. These populations were divided into four groups based on geographic position: group 1 (CD1 to CD10 from Qamdo), group 2 (LZ1 and LZ2 from Nyingchi), group 3 (LS1 and LS2 from Lhasa), and group 4 (NQ1 to NQ4 from Nagqu; Figure 1). We collected seeds from 15 individuals per population, except for population CD3, where only 14 individuals were available due to the small size of this population. In total, seeds from 269 individuals were obtained across the 18 populations sampled. Supplementary Table S1 shows the collection site, geographical coordinates, and elevation of each source population. Seeds were planted in the experimental field at Sichuan Academy of Grassland Sciences, China (latitude, 32.78 N; longitude, 102.54 E; altitude, 3,502 m).
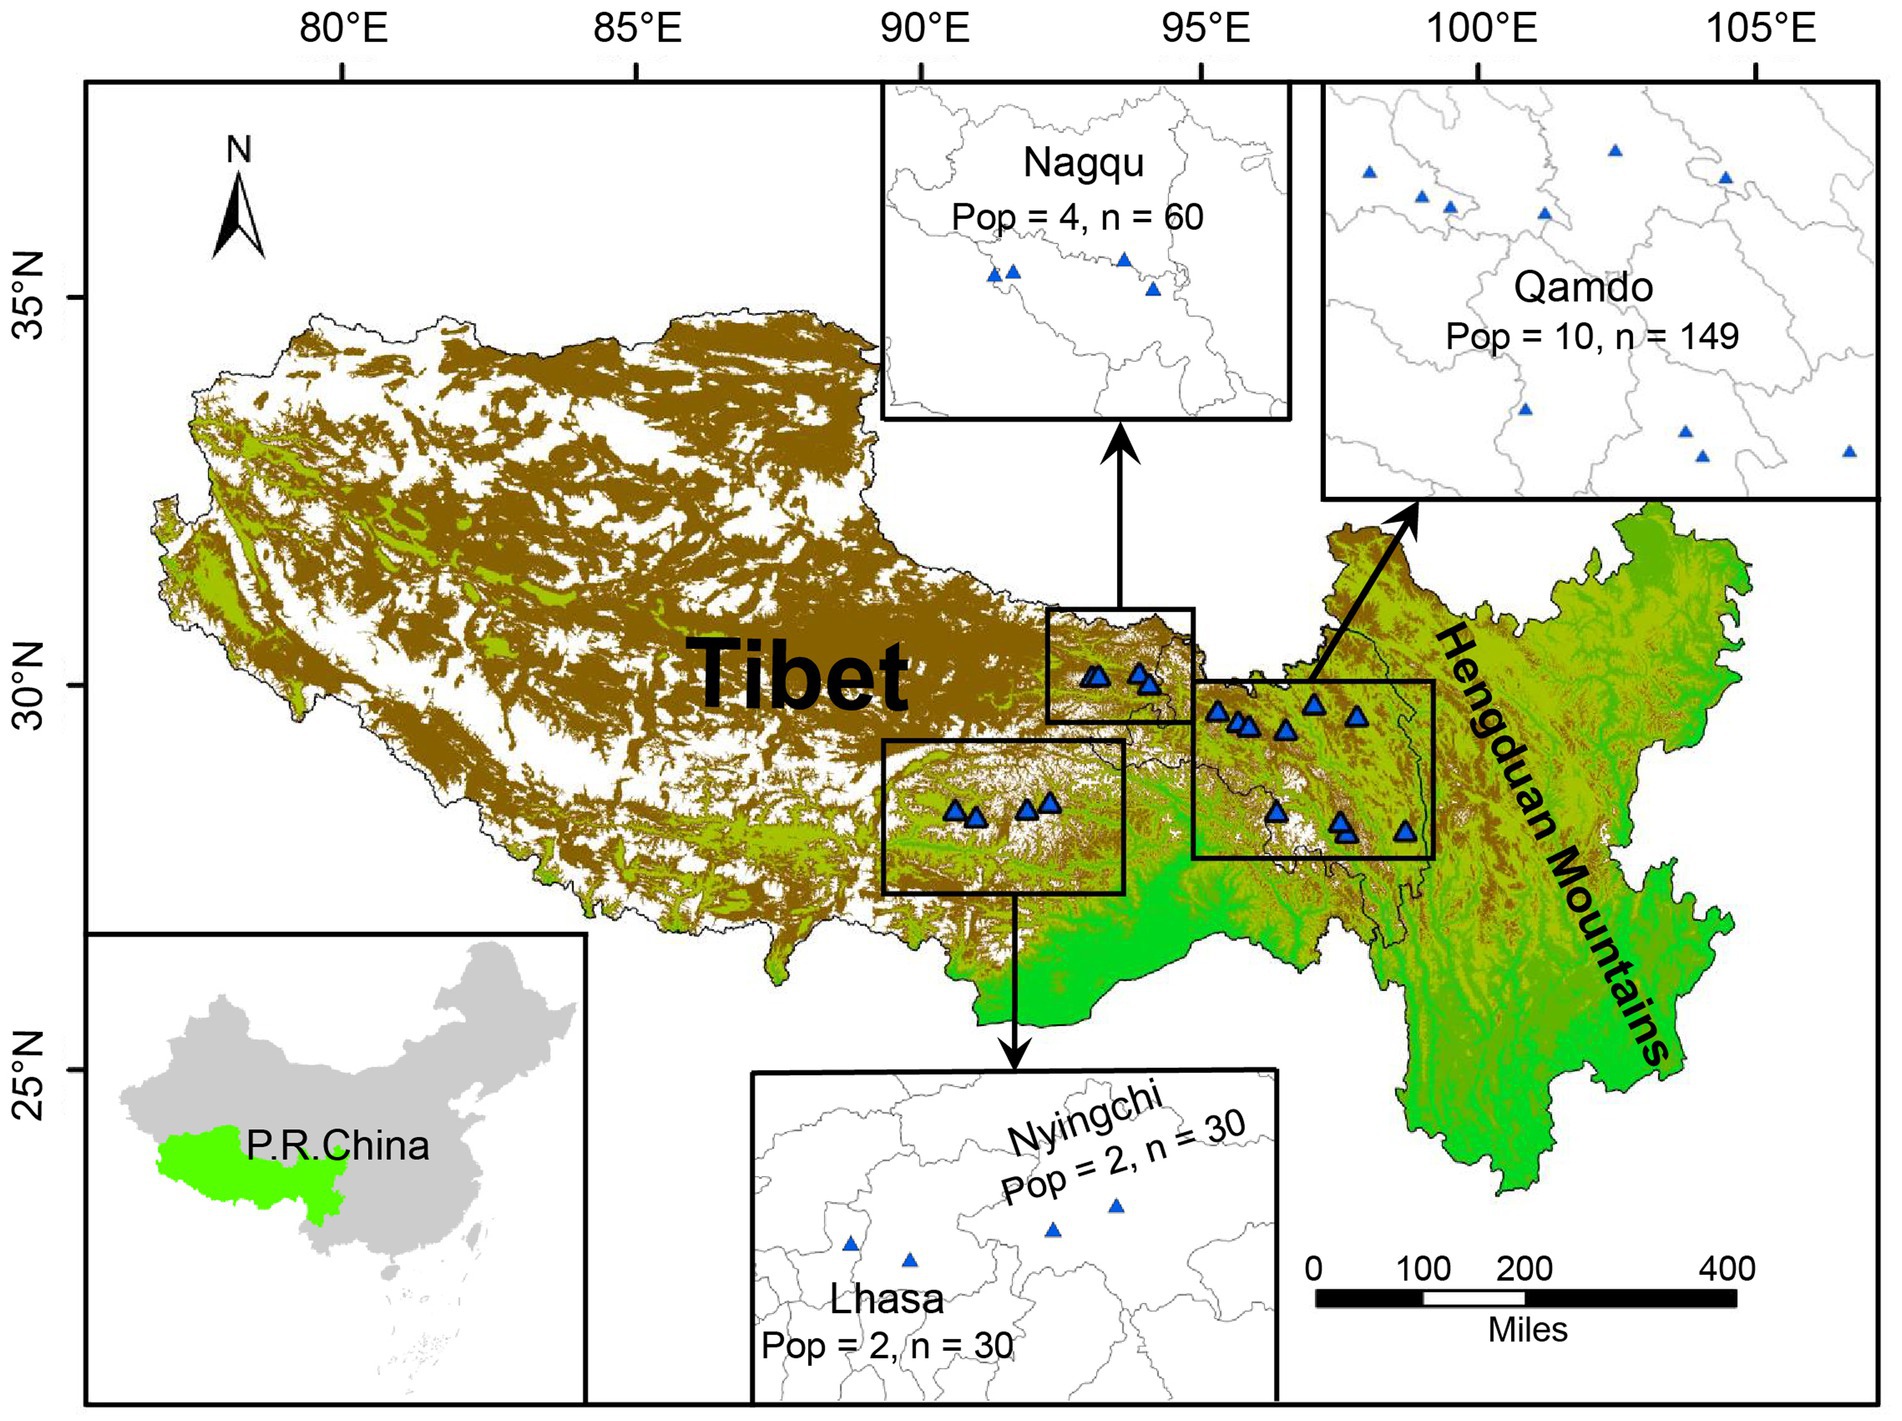
Figure 1. Geographical distribution of the Elymus breviaristatus populations in this study.
After germination, fresh young leaves were collected and dried in zip-lock plastic bags with silica gel. Total genomic DNA was extracted using the DP350 Plant DNA kit (Tiangen Biotech Co., Ltd., Beijing, China), following the manufacturer’s instructions. DNA quality and quantity were determined using a NanoDrop-Lite (Thermo Scientific, Waltham, MA, United States) and 1% agarose gels, respectively. The DNA samples were then diluted to 10 ng/μL and stored at −20°C.
PCR amplification
From the suite of EST-SSR primers previously developed by our research group, we selected 15 polymorphic primer pairs to explore the relationships among the 269 E. breviaristatus individuals (Supplementary Table S2). PCR amplifications were performed in a 20-μL reaction volume containing 20 ng of genomic DNA, 0.5 μM of each primer, and 10 μl of 2 × Es Taq MasterMix (Dye Plus) (CoWin Biosciences, Beijing, China). Touch-down PCRs were performed using a C1000 Touch Thermal Cycler (BIO-RAD, Foster City, CA, United States) with the following cycling conditions: 94°C for 4 min; 5 cycles of 94°C for 30 s, 65°C–60°C for 30 s, and 72°C for 60 s; 35 cycles of 94°C for 30 s, 60°C for 30 s, and 72°C for 60 s; 72°C for 10 min; and a final indefinite hold at 4°C. The PCR products were separated using 6% non-denaturing polyacrylamide gel electrophoresis (PAGE) in 1 × TBE buffer at 400 V, with a 100 bp molecular size ladder for comparison (Tiangen Biotech Co., Ltd., Beijing, China). Bands were visualized using silver staining. Only clearly amplified bands were scored as present; ambiguous or missing bands were scored as absent. A raw data matrix was constructed based on these values (where “1” was equivalent to presence and “0” was equivalent to absence).
Genetic diversity
To assess the levels of genetic diversity and the relatedness of the 18 populations, POPGENE v1.32 (Yeh and Boyle, 1997) was used with the raw data matrix to calculate parameters such as Nei’s genetic diversity (H), Shannon’s information index (I), observed number of alleles (NT), average allele number (Na), number of effective alleles (Ne), and Nei’s genetic distances (GD). In addition, a principal coordinate analysis (PCoA) was performed after examining genetic distances using the GenAlEx 6.5102 project (Peakall and Smouse, 2012). A population dendrogram was constructed using unweighted pair-group method with arithmetic mean (UPGMA) clustering in MEGA v6.0 (Tamura et al., 2013).
Population genetic structure and barriers to gene flow
The genetic structure of the 18 E. breviaristatus populations was predicted using the Bayesian clustering method in STRUCTURE v.2.3.4 (Falush et al., 2007). In total, 20 independent runs were performed for each value of K from 1 to 18 using Structure Harvester v0.6.94 (Earl and von Holdt, 2012). Each run was composed of 500,000 Monte Carlo Markov Chain (MCMC) replicates with an admixture model and a 10,000 replicate burn-in period; the optimum number of clusters was estimated using the ΔK method (Evanno et al., 2005). Finally, the 20 replicates were clustered and permuted with CLUMPP v1.1 (Jakobsson and Rosenberg, 2007) using the LargeK Greedy algorithm. The results were visualized using bar plots. An analysis of molecular variance (AMOVA) was performed in the GenAlEx 6.5102 project to estimate the total genetic diversity at the population and individual levels. In addition, the geographical locations of the major genetic barriers between populations were predicted using BARRIER v2.2 based on Monmonier’s maximum difference algorithm (Manni et al., 2004). The robustness of these barriers was assessed based on 1,000 bootstrap replicates of population pairwise difference matrices generated using AFLPsurv v1.0 (Vekemans et al., 2002).
Correlations between genetic diversity and environmental factors
To assess whether genetic diversity was affected by environmental factors, we download the bioclimatic variables from the WorldClim website,1 soil surface database of China for land surface modeling from Sun Yat-sen University (Shangguan et al., 2013), and extracted using ArcGIS10.2 (ESRI. Inc.), including five soil variables and their ratio and 19 climatic variables. Then, Pearson’s correlations were calculated pairwise between these environmental variables and genetic diversity parameters, such as Nei’s genetic diversity (H) and Shannon’s information index (I), to estimate the environmental factors limiting genetic diversity.
Geographic and environmental effects on genetic differentiation
To detect the possible modes of isolation among populations, we first calculated genetic differentiation (FST) among populations using AFLPsurv v1.0. Simultaneously, the environmental parameters associated with each population, as well as pairwise geographic distances between populations, were extracted based on the latitude and longitude data obtained in the field using ArcGIS, where the distance between each pair of populations was equivalent to the Euclidean distance. Finally, we used a two-tailed Student’s t-test with 999 permutations to estimate the correlations between these variables.
Results
PCR amplification and diversity analysis
The average allele number (Na) detected by each of the 15 polymorphic primer pairs was 1.389–3.778, with an average of 2.707. The effective number of alleles (Ne) identified by each primer was 1.228–2.875, with a mean of 2.283 (Supplementary Table S3). Across the 18 E. breviaristatus populations, all parameters of alpha diversity were the highest in population CD1 from Qamdo (Table 1). Additionally, the genetic landscape map showed an obvious trend of decreasing diversity from east to west across our study area (Figure 2).
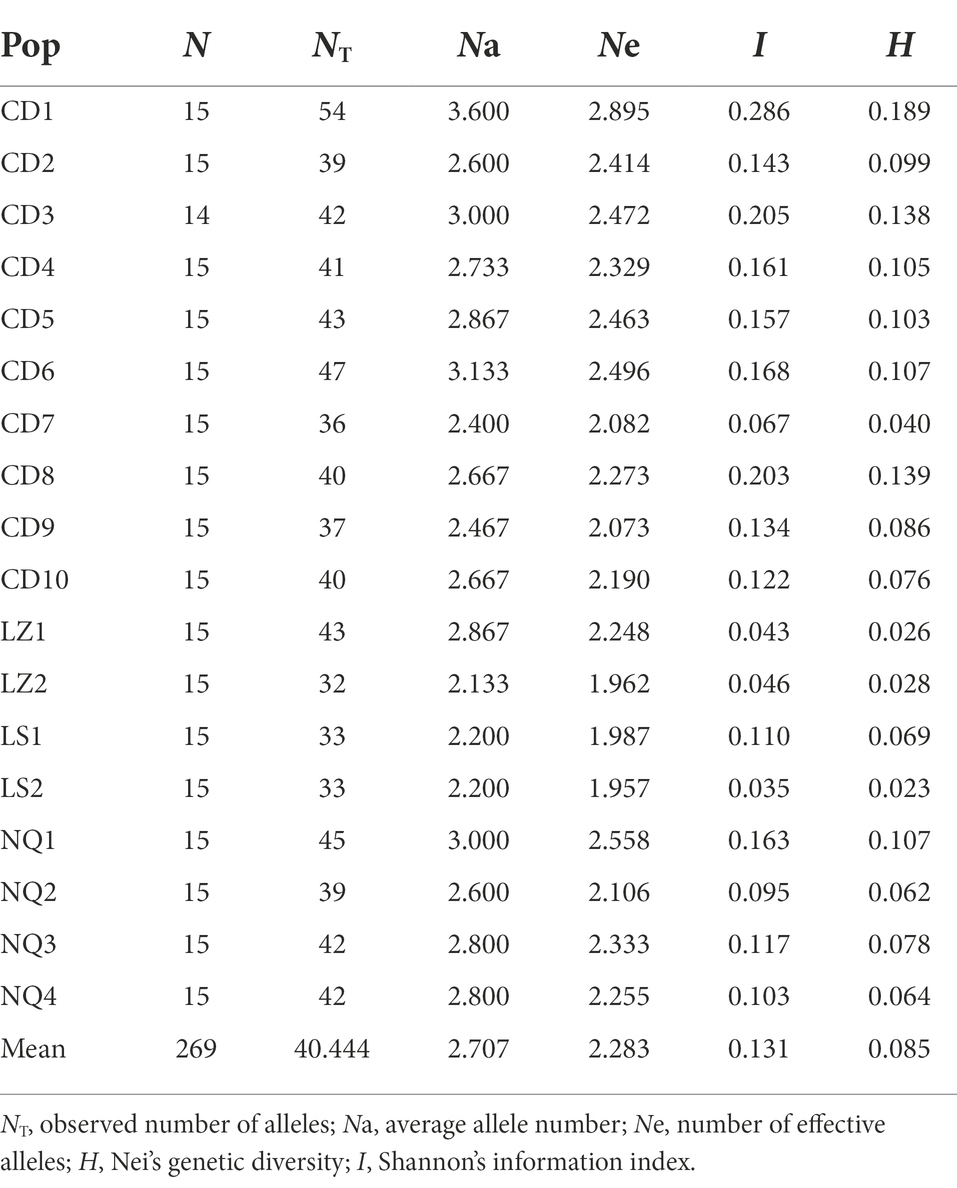
Table 1. Genetic diversity based on 15 EST-SSRs from 18 populations.
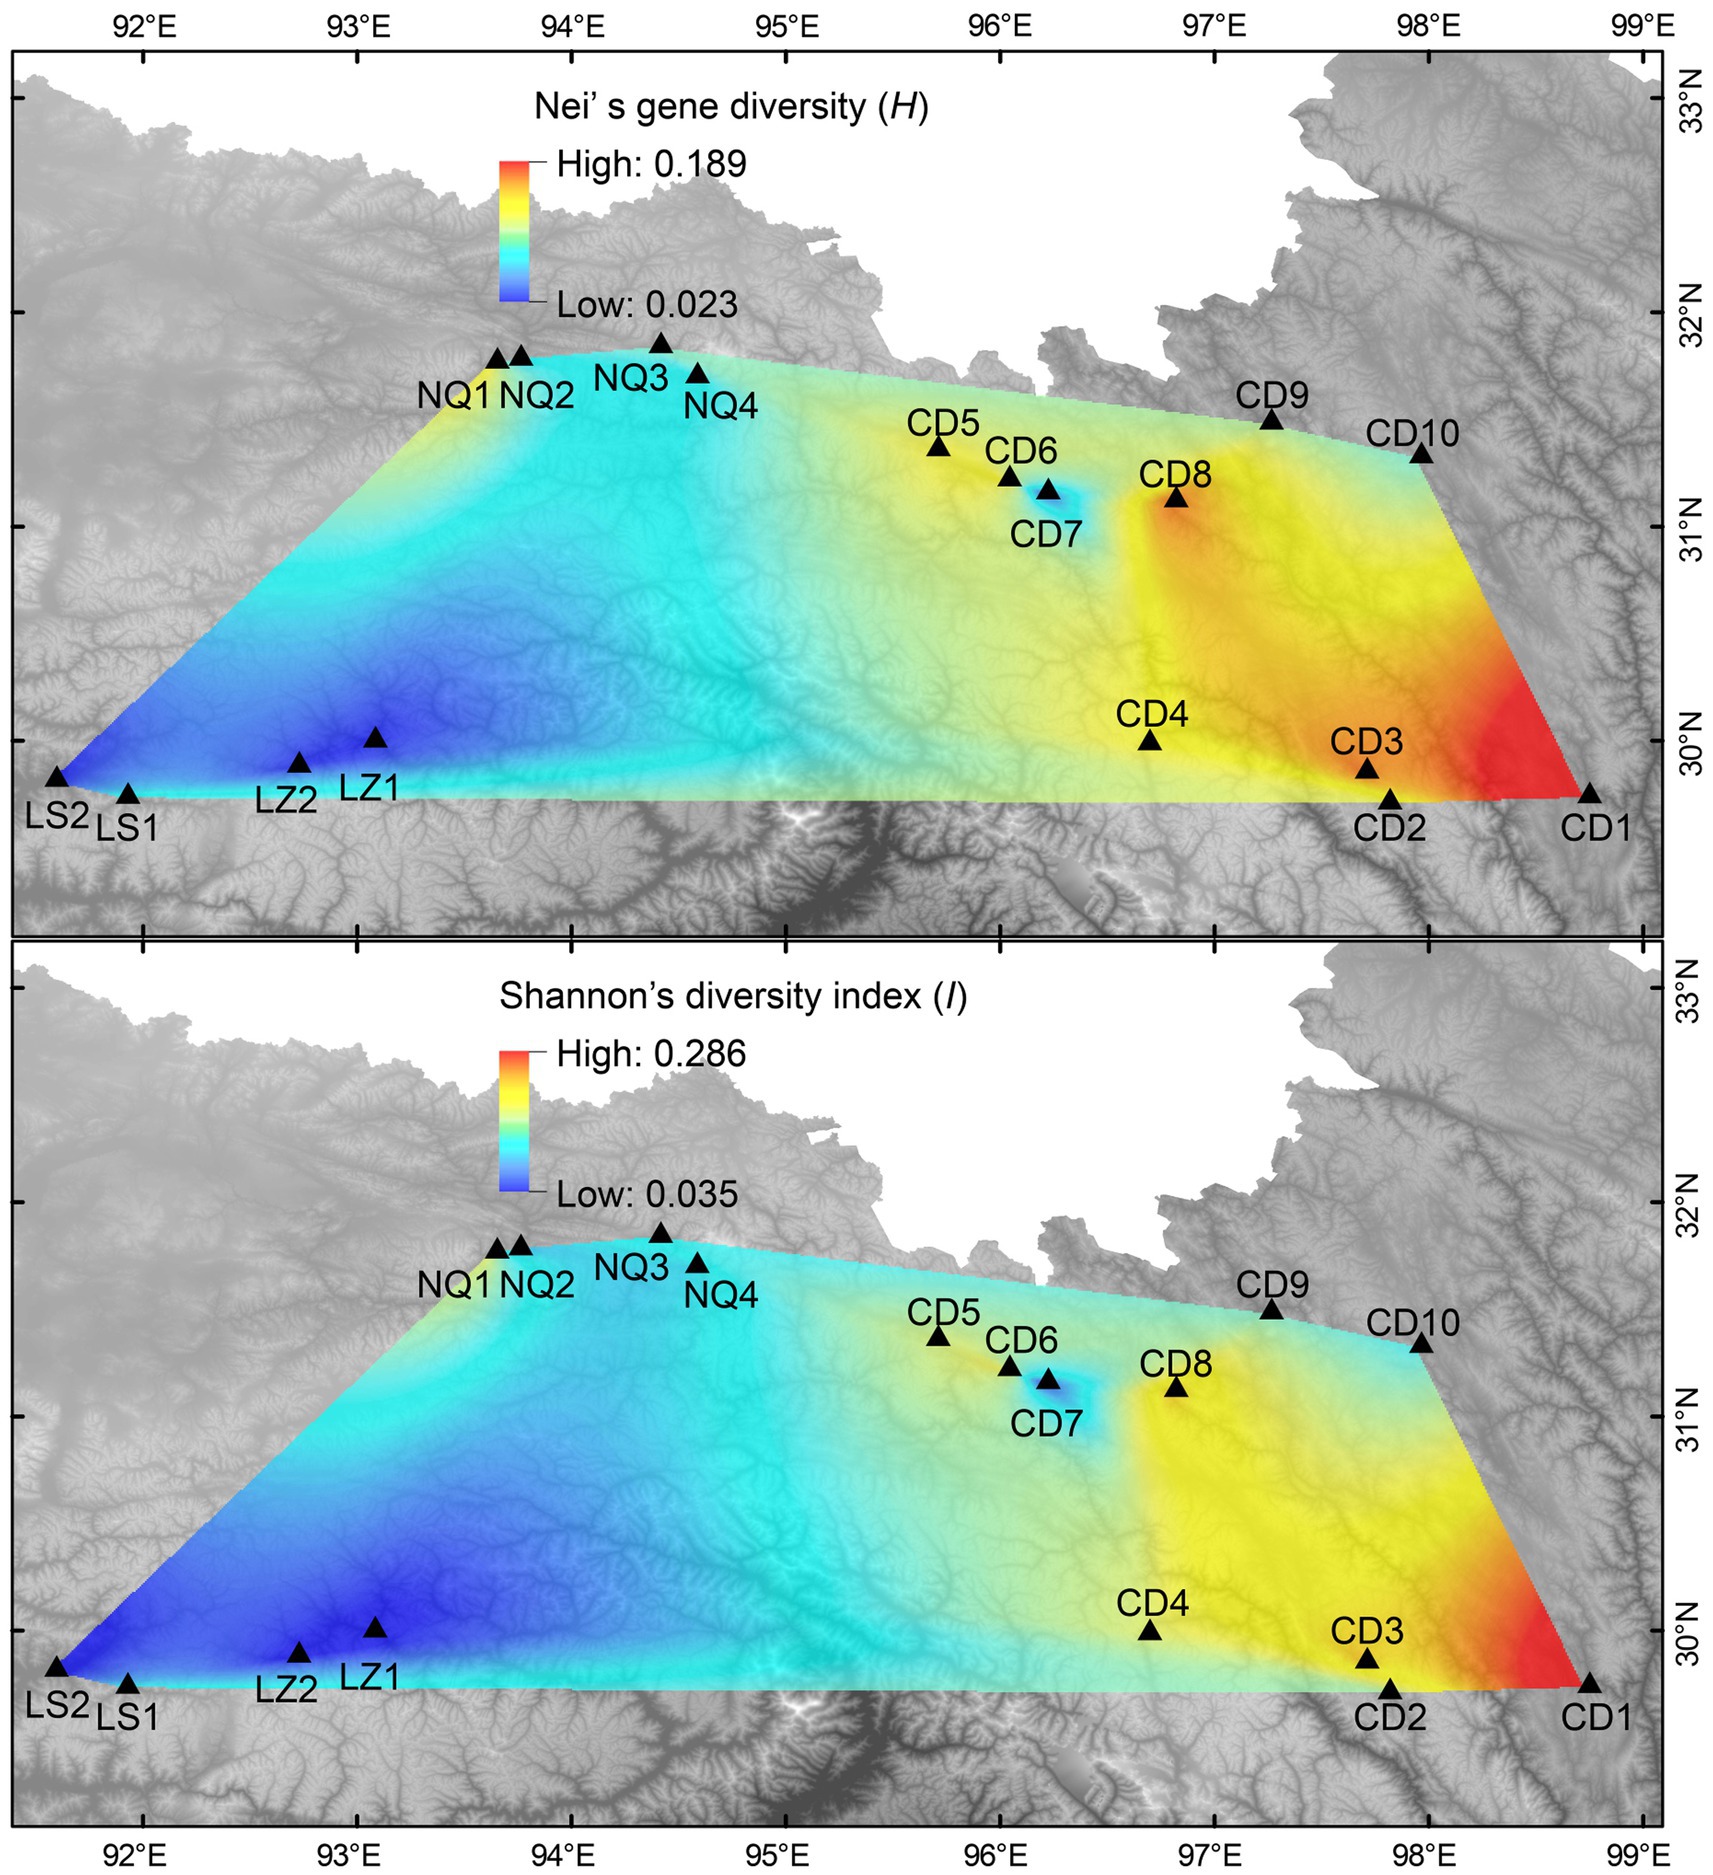
Figure 2. Genetic landscape for E. breviaristatus populations.
To visualize the genetic similarity among regions, we performed a PCoA of the EST-SSR data generated from the 269 individuals and grouped the samples by region (Figure 3). The first two principal coordinates explained 78.41% of the total genetic variance among individual genotypes (PC1, 74.42%; PC2, 3.99%). Although the region groups were mostly distinct, there was some overlap between regions CD and NQ and regions LZ and LS (Figure 3). The results of the UPGMA analysis were similar (Figure 4).
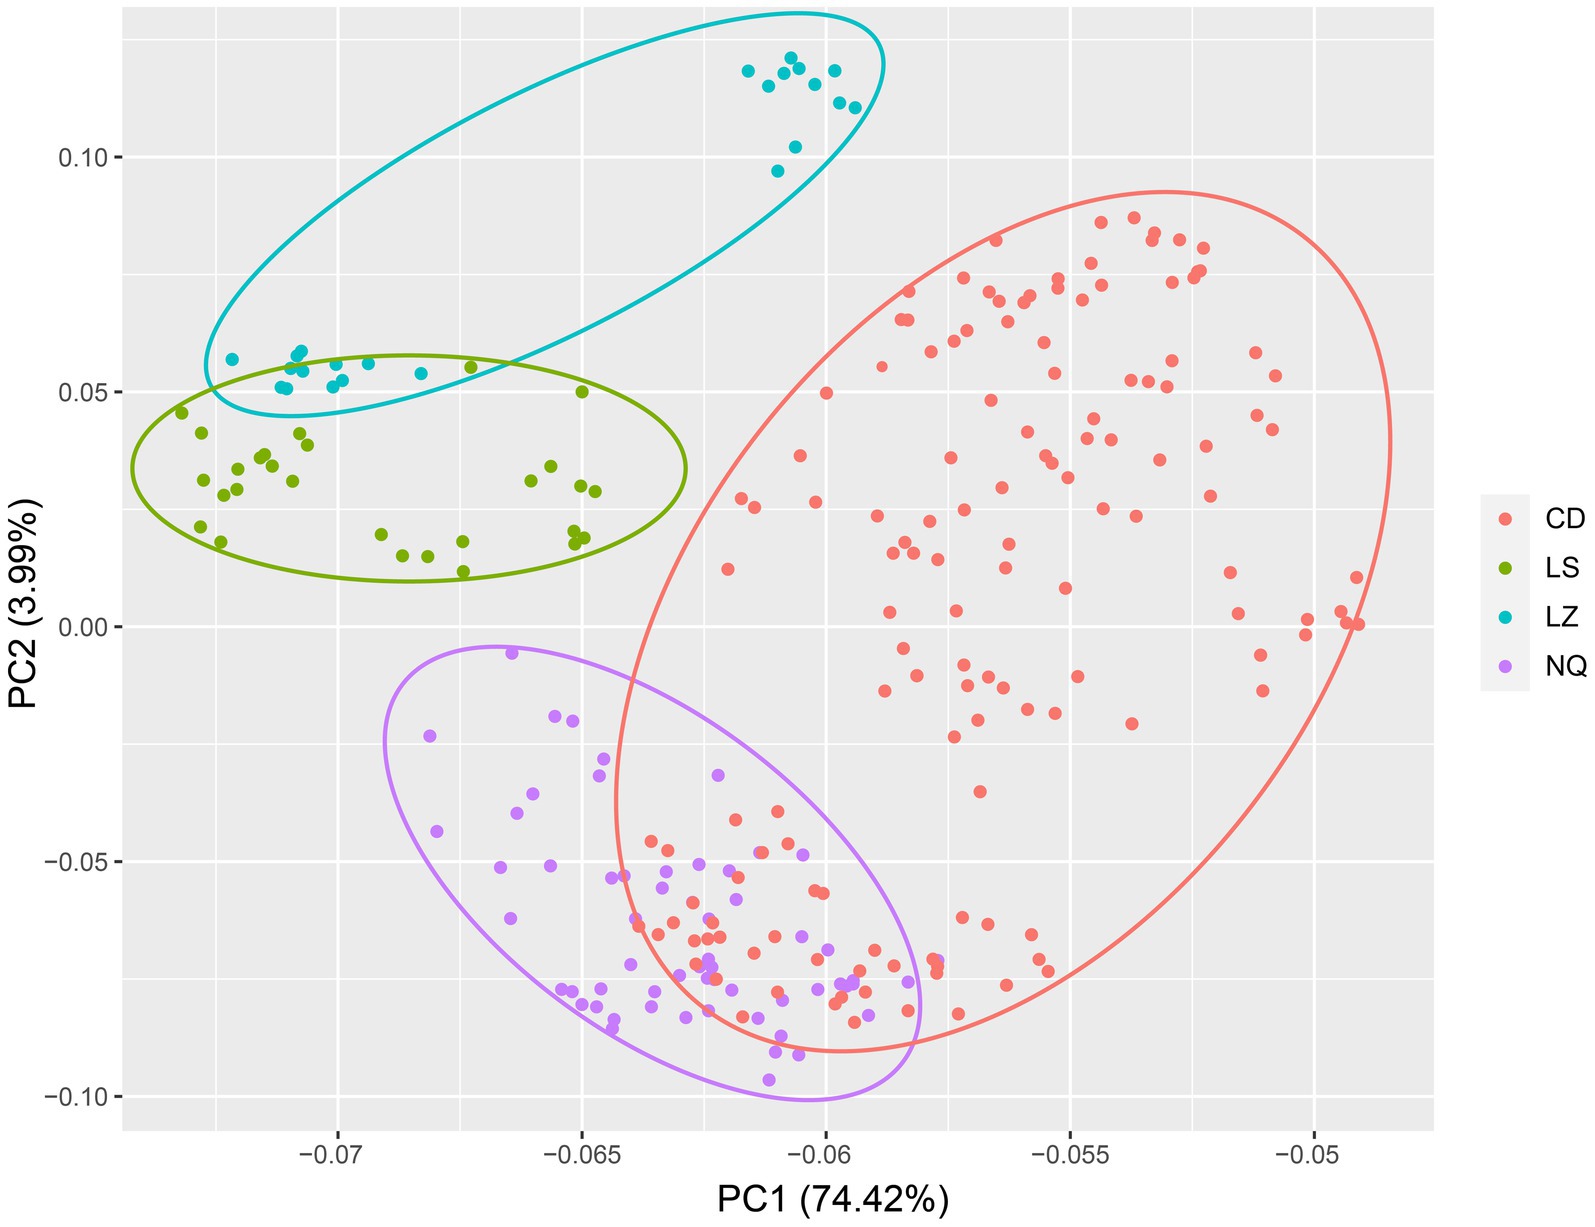
Figure 3. Principal coordinate analysis (PCoA) of the E. breviaristatus populations.
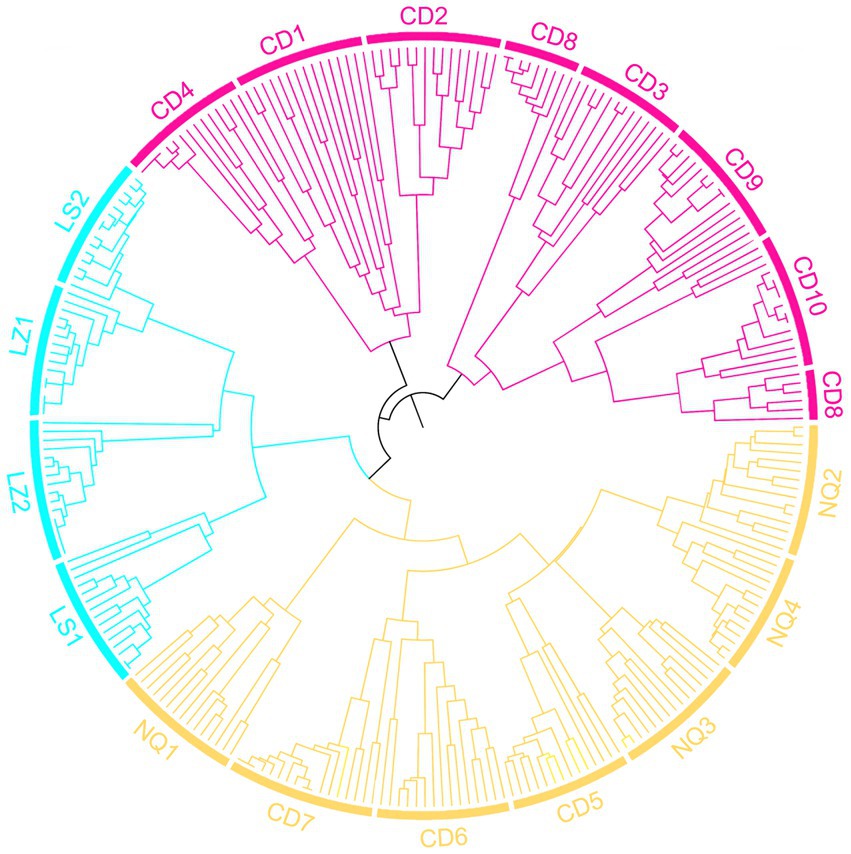
Figure 4. UPGMA dendrogram based on individual pairwise Nei’s genetic distances showing relationships among individuals of E. breviaristatus.
Population structure
A model-based Bayesian clustering approach in STRUCTURE was used to analyze population genetic structure. The Structure Harvester results indicated that ΔK was maximized at K = 3 (Figure 5A), which suggested that the 269 individuals analyzed most likely belonged to three principal genetic clusters. Using CLUMPP to identify the most optimal of the 20 replicates, we constructed a plot of the structure of the 18 populations (Figure 5C). In this plot, group 3 was composed of four populations from Nyingchi and Lhasa. The division of the 18 populations into three genetic groups was validated by the PCoA and the UPGMA analysis. The genetic barriers among the 18 populations were determined using BARRIER, and these are indicated by a red line in the plot (Figure 5B). This analysis revealed a clear separation between the four populations from Nyingchi and Lhasa and the remaining 14 populations. A second barrier separated three populations (CD8, CD9, and CD10) in the north of the study area from the remaining 11 populations. Interestingly, there was also a slight barrier between the northern and southern regions of the study area. Moreover, AMOVA showed that most of the genetic variation (67%) occurred among the 18 E. breviaristatus populations, with only 33% of the genetic variation found within populations (Table 2).
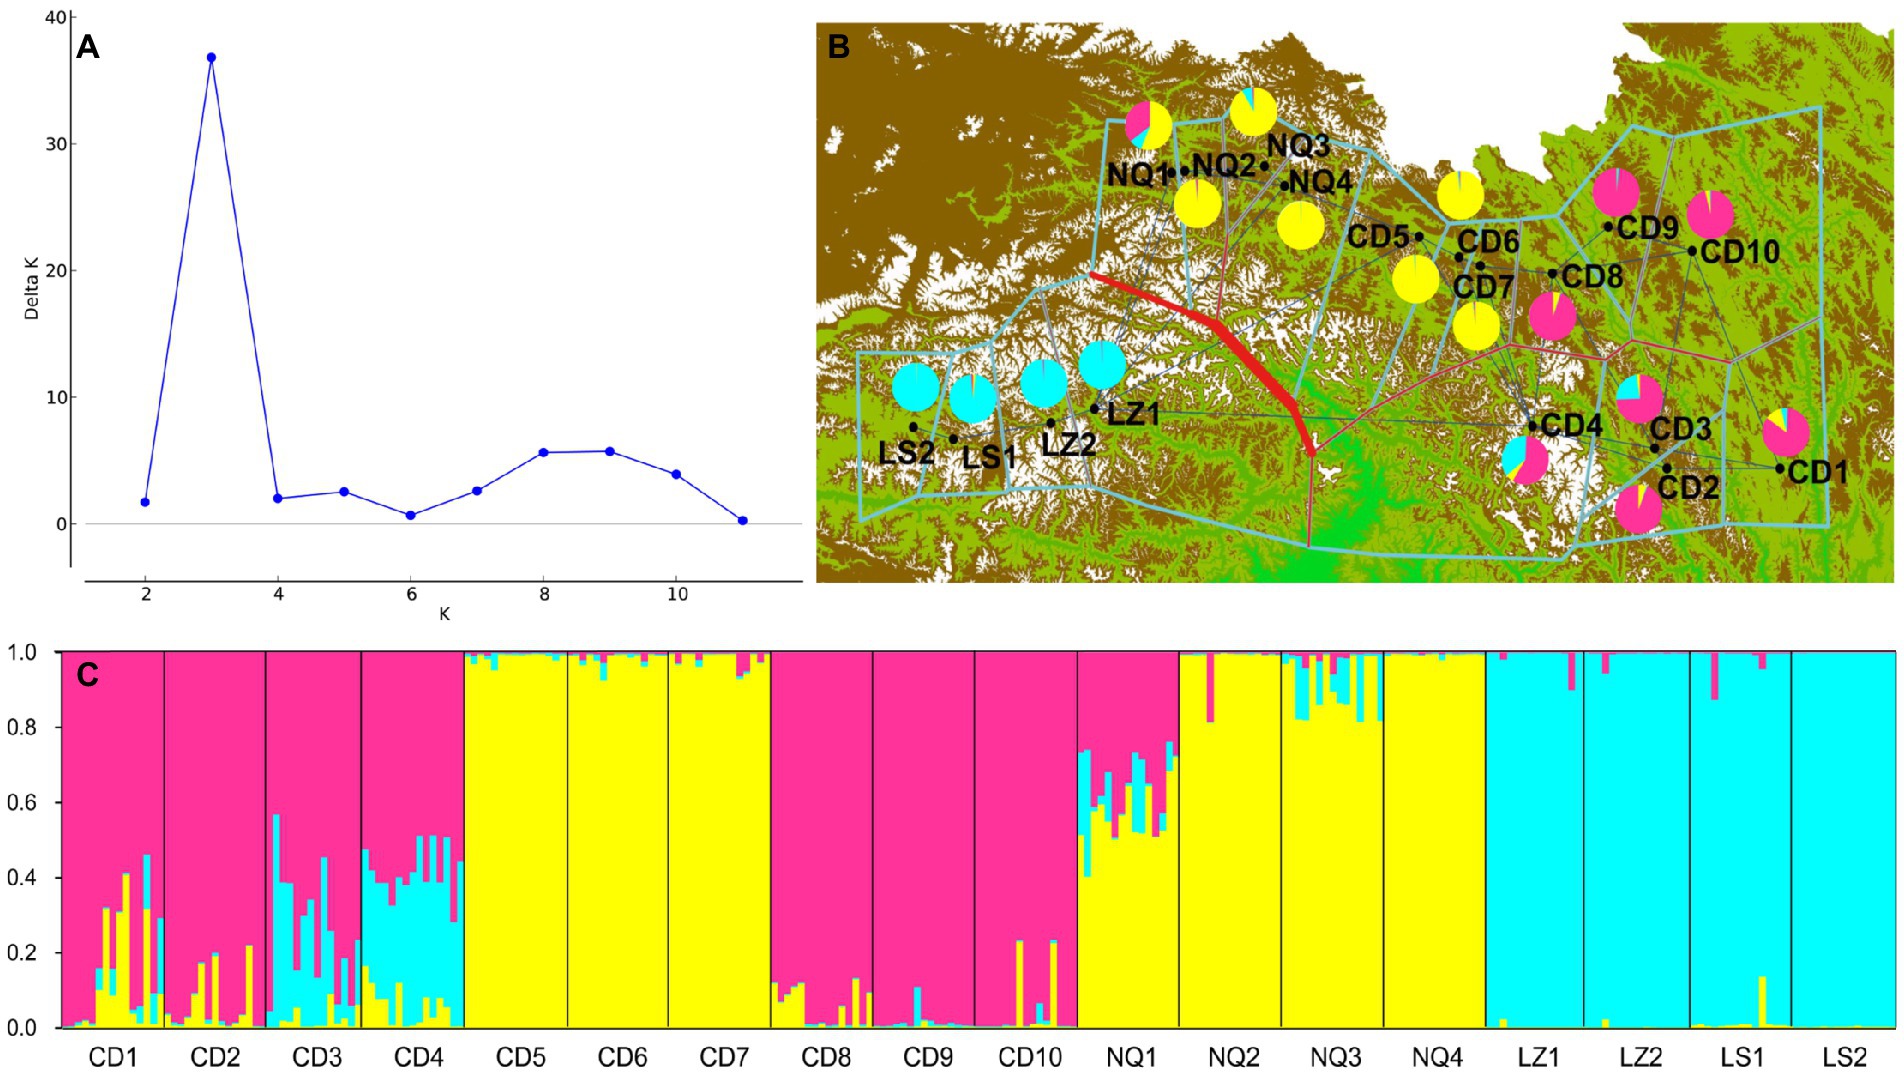
Figure 5. Results of STRUCTURE and BARRIER analysis among the E. breviaristatus populations based on EST-SSRs. (A) K model with an elevated ΔK values calculated for K varying from 2 to 18. (B) Bold red lines in the map represented the genetic’ barrier revealed by BARRIER, which divided 3 different gene pools. (C) Clustering patterns of the 269 individuals from the 18 E. breviaristatus populations using made by STRUCTURE for K = 3, each individual is represented by a vertical, colored line.
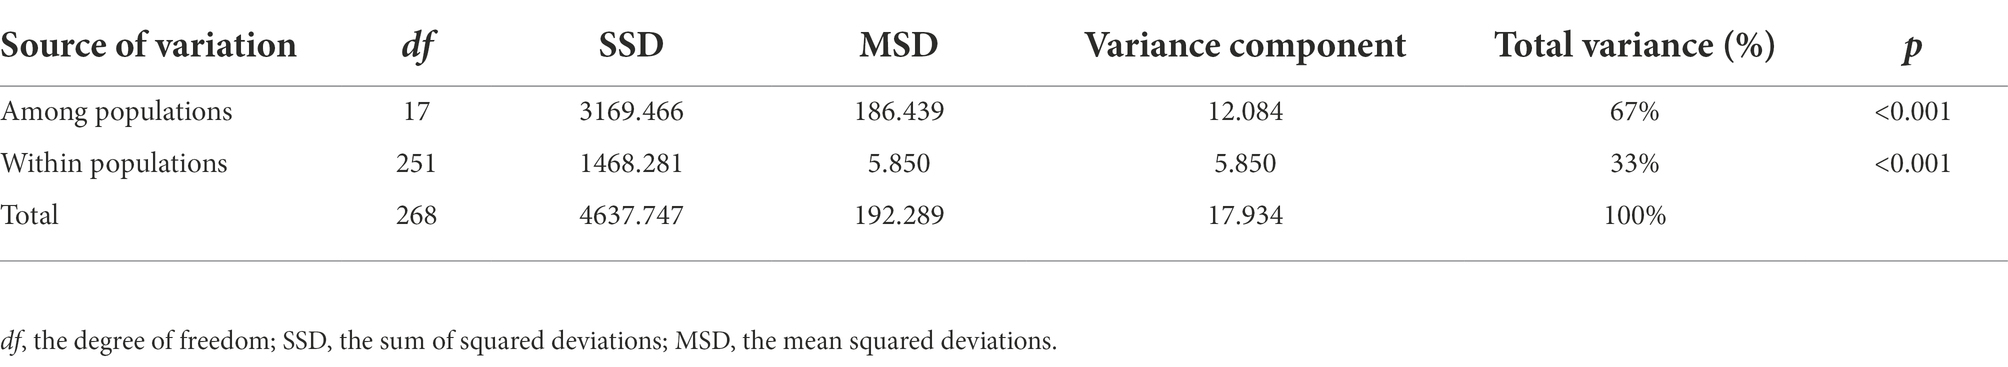
Table 2. Analysis of molecular variance (AMOVA) of E. breviaristatus based on EST-SSR.
Associations between genetic diversity and environmental variables
Based on Shannon’s information index (I) and Nei’s genetic diversity (H), we tested the correlation between genetic diversity and 25 environmental variables for E. breviaristatus (Supplementary Figure S1). Across the 19 climatic variables, population genetic diversity increased with annual precipitation (p < 0.05), precipitation of driest quarter (p < 0.05), and precipitation of coldest quarter (p < 0.05) but decreased with the coefficient of variation of precipitation seasonality (p < 0.01; Figure 6). By comparison, no significant correlations were found between any temperature-related factor and any genetic diversity parameter. In addition, in soil physical and chemical properties variables and their ratios, the genetic diversity was increased with the total phosphorus content (p < 0.01), but decreased with the K content/P content ratio (p < 0.05; Figure 6).
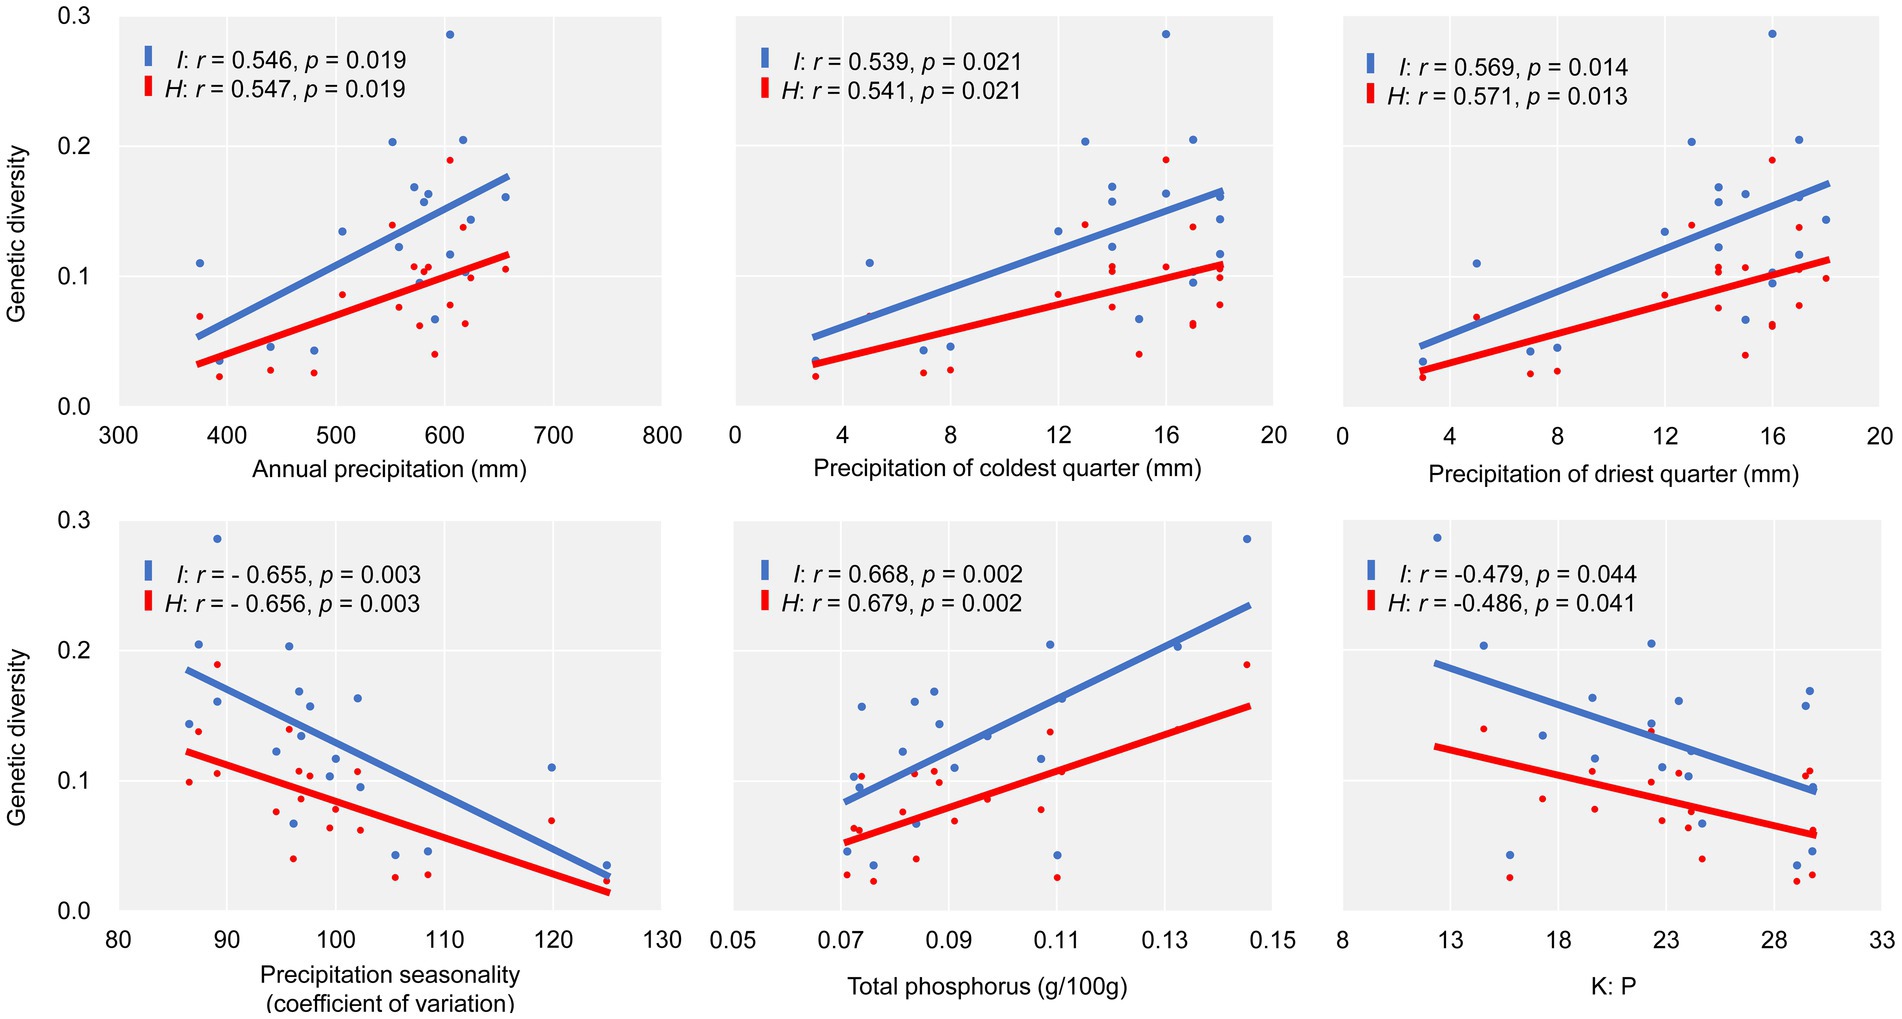
Figure 6. Scatter plots showing the relationships between two genetic diversity parameters (I, H) and environmental factors.
Effects of environmental and geographic distances on genetic divergence
Correlation tests based on pairwise FST values showed that both environmental distance and geographical distance had significant effects on the genetic differentiation among E. breviaristatus populations (p < 0.001; Figures 7A,B). However, there was a significant autocorrelation between geographic and environmental distances (Figure 7C). Compared with geographic distance, environmental distance had a greater effect on the pairwise FST values, and the correlation between geographic distance and genetic distance when controlling for environmental distance (r = 0.202, p = 0.012) was weaker than the correlation between environmental distance and genetic differentiation when controlling for geographic distance (r = 0.260, p < 0.001; Table 3). These two statistical methods show that both IBD and IBE contributed to the observed patterns of genetic variation, but the IBE model better explained inter-population patterns of genetic diversity than the IBD model.
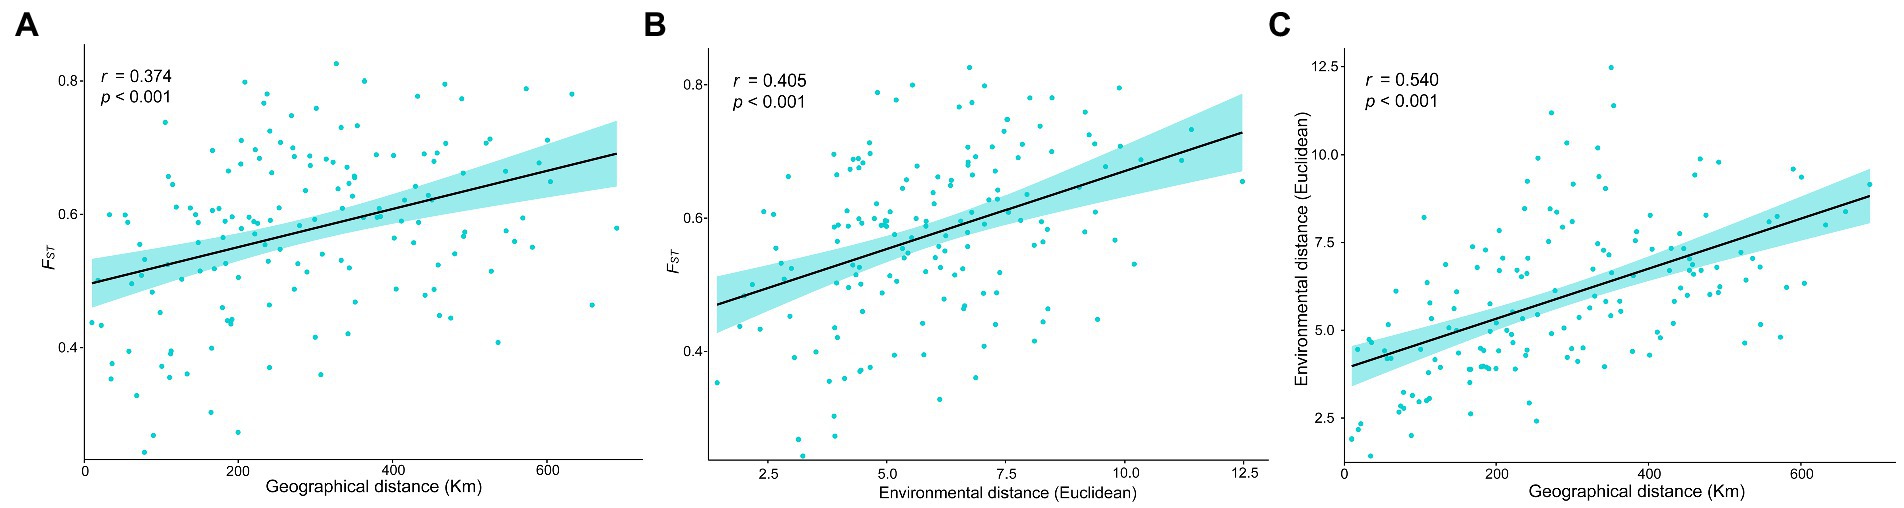
Figure 7. Linear regressions showing pairwise genetic, geographic, and environmental distances among the E. breviaristatus populations. (A) Regression showing genetic differentiation (FST) and geographic distance. (B) Regression showing genetic differentiation (FST) and environmental distance. (C) Regression showing geographic distance and environmental distance. Correlation coefficients and p-values are shown in the upper left-hand corner of each plot.
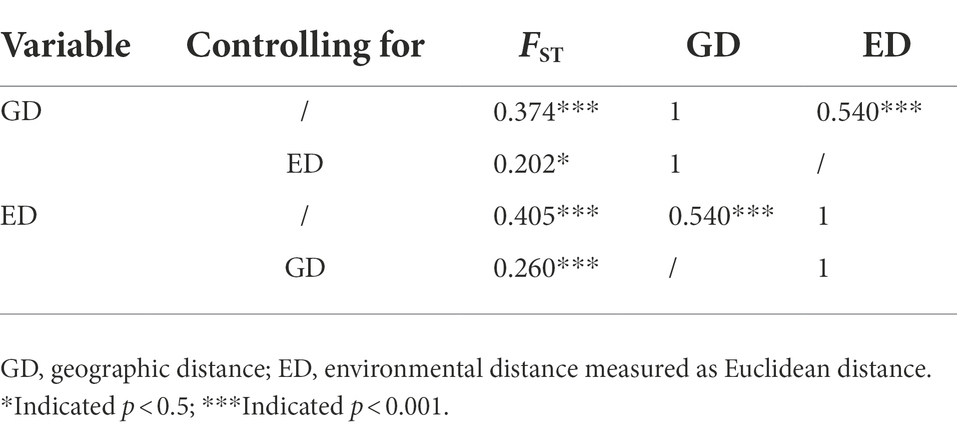
Table 3. Mantel and partial mantel tests for the correlation between genetic, geographic, and environmental distances.
Discussion
Genetic diversity of Elymus breviaristatus
Genetic diversity is important for the long-term survival of populations (Bell and Collins, 2008). As many rare species are restricted to the QTP, it is valuable to compare the genetic diversity of these species with that of more widespread congenerics (Wang, Z. F. et al., 2019). In a previous study, SSR and SRAP markers were used to explore the genetic diversity of seven populations of E. breviaristatus on the Northwest Sichuan Plateau (Gu et al., 2015; Yu et al., 2019). Here, our analyses of EST-SSR data showed that E. breviaristatus populations in the transition zone between Tibet and the Hengduan Mountains had lower genetic diversity than congenerics such as E. sibiricus (Ma et al., 2012), E. nutans (Chen et al., 2009, 2013), and E. trachycaulus (Gaudett et al., 2005). This was consistent with previous studies in the Northwest Sichuan Plateau, as well as a previous meta-analysis (Cole, 2003). In general, the genetic diversity of endemic species is lower than that of widespread species (Huh and Huh, 1999). The lower diversity of endemics might have multiple explanations, including smaller population numbers and limited distribution ranges; in addition, the adaptation of certain populations to specific habitats may have quickly led to the isolation of small, genetically similar populations (Hamrick and Godt, 1996; Sarin et al., 2015). Consequently, the lower genetic diversity of natural E. breviaristatus populations might suggest a decreased ability to adapt to changing environmental conditions and may lead to an increased risk of extinction (Tansley and Brown, 2000; Wang, 2020).
Population genetic structure and barriers to gene flow
Across the 18 E. breviaristatus populations, AMOVAs (p < 0.001) showed that 67% of the genetic variation was among populations, with only a small proportion of the genetic variation found within populations. Similar results have been reported for several other self-pollinating Elymus species, including E. canadensis (Sanders et al., 1979), E. fibrosus (Díaz et al., 2000), and E. caninus (Sun et al., 2001). Compared to the results of previous studies (Gu et al., 2015; Yu et al., 2019), the genetic variation within E. breviaristatus populations in our study area was extremely low, suggesting that the severe environmental pressures associated with higher elevations have had a notable impact on population genetic variation, consistent with the results of Jiang et al. (2019). Pairwise FST values (0.243–0.822) likewise revealed significant genetic differentiation among populations; FST values for populations of E. breviaristatus were substantially higher than those of widespread species and species with mixed mating systems (Nybom and Bartish, 2000). The possible factors leading to this high level of genetic differentiation among populations may include the extremely narrow geographical distribution, high selfing rate (Honnay and Jacquemyn, 2007), long history of evolution and genetic drift (Su et al., 2009), and limited pollination due to the complex topography and challenging climate of the QTP (Fu and Jin, 1992).
Gene exchange plays an important role in plant evolution and population structuring (Wang, D. W. et al., 2019). Here, we explored the potential barriers to gene dispersal formed by the complex changes in topography among different geographical regions. Using BARRIER v2.2, we identified several possible barriers to gene flow among the 18 populations. The most important barrier may be the Yarlung Zangbo Grand Canyon and Tanggula Mountains, while another barrier may be formed by the G214 road and the Ziqu River. As rivers are permanent geographic barriers that can disrupt continuous population distributions (Vences et al., 2009), the Ziqu River barrier might explain some of the genetic differentiation among populations. The gene pools isolated by geographical barriers were consistent with those identified in the STRUCTURE analysis based on a Bayesian algorithm, which clearly divided the 269 wild E. breviaristatus accessions into three subgroups plus some admixed individuals. The patterns revealed by our PCoA were also similar. Thus, our clustering results were likely reliable.
Environmental drivers of Elymus breviaristatus genetic diversity
Of the 25 studied environmental factors, precipitation and soil phosphorus content were most strongly associated with E. breviaristatus population genetic diversity. Among the precipitation-related variables, annual precipitation, precipitation in the driest quarter, and precipitation in the coldest quarter were significantly positively correlated with genetic diversity, suggesting that genetic diversity is strongly limited by rainfall, especially for populations in extremely cold and dry environments. In addition, higher precipitation levels in these environments may improve seed survival, thereby increasing genetic diversity. Consistent with these findings, several studies have demonstrated that plant genetic diversity tends to be low in extreme climates (Brito et al., 2016; Šurinová et al., 2019), suggesting that genetic diversity may be controlled by environmental selection pressures.
Previous studies have shown that changes in climate reduce genetic diversity (Avolio et al., 2013). However, the only climatic factor significantly negatively correlated with genetic diversity was the coefficient of variation of precipitation seasonality, suggesting that decreases in the population genetic diversity of E. breviaristatus were associated with high levels of variation in precipitation amounts. Due to global warming, the temporal distribution of precipitation will become more uneven, and precipitation fluctuations during dry and wet periods will become more intense (Zhang et al., 2021). As precipitation variability will increase with global warming, the genetic diversity of E. breviaristatus is likely continue to decrease in the future. Some studies also highlighted an association between temperature and genetic diversity in various environments (Kovach et al., 2015; Manel et al., 2020). However, temperature-related variables and genetic diversity were only poorly correlated in the present study, indicating that rainfall change, not global warming, will have a more significant impact on the adaptation of E. breviaristatus to new environmental conditions.
Soil nutrient also plays an important role in maintaining the genetic diversity of plant populations. The previous research in other Elymus species found that the soil nutrient factors including nitrogen, potassium and magnesium contents had the significant correlation with the genetic diversity (Guo et al., 2014). In the present study, of the eight soil variables, soil phosphorus content and soil K:P ratio showed the significant effects on population genetic variation of E. breviaristatus. Meanwhile, the soil nutrient correlation analysis was also affected by sampling regions, number of molecular markers, characteristic of the species, etc. Furthermore, the genetic variation of E. breviaristatus populations in the study was lower than other Elymus species. Thus, we speculate that low phosphorus could be one of limiting factors for the genetic diversity of E. breviaristatus. Soil phosphorus is an essential macronutrient for plants and microbes development, which is also vital for the plant–soil-microbe network (Wang Z. Q. et al., 2019; Oldroyd and Leyser, 2020; Wang et al., 2021). Therefore, the plant–soil-microbe combined effects should be paid attention on the conservation and utilization of E. breviaristatus in the future.
IBE was more important than IBD
Habitats are often variable, especially in a climate-sensitive region such as the QTP, and this variation may eventually lead to speciation (Gray et al., 2014). For most species, both geography and ecology contribute to spatial genetic divergence (Wang et al., 2013). As a determining factor in major evolutionary processes from local adaptation to species formation, the genetic differentiation model has long promoted the development of a strong theoretical framework (Castilla et al., 2020). As shown in Figure 7, our results were incongruent with those of previous studies and suggested that both IBD and IBE played significant roles in the genetic differentiation of E. breviaristatus populations across the Tibet and Hengduan Mountains transition zone (r = 0.374 and 0.405, respectively). Sexton et al. (2014) reported significant autocorrelations between geographic and environmental distance in 37.1% of 70 previous studies (r = 0.540). In partial Mantel tests, significant relationships between IBD and IBE were detected, albeit with weak correlations. This indicated that genetic differentiation among E. breviaristatus populations was correlated with both geographical and environmental differences. This was consistent with the findings of several recent studies, which suggested that both factors may contribute to spatial genetic differences in many cases (Lee and Mitchell-Olds, 2011), although IBE in general plays a dominant role.
Conclusion
To the best of our knowledge, this study is the first to combine EST-SSR markers and landscape genetic analyses to investigate the population genetic patterns of E. breviaristatus. Our results demonstrated that the genetic variation mainly occurred in inter-population rather than intra-population. Various analyses supported the division of the 18 studied populations into three genetic clusters, which will be useful for developing protection management plans for this species. Genetic diversity was associated with six environmental factors and was predicted to further decrease with further climate change. In addition, population genetic differentiation patterns were influenced by both IBE and IBD. These results improve our understanding of E. breviaristatus and may be valuable for the conservation and management of this species in the future.
Data availability statement
The original contributions presented in the study are included in the article/Supplementary material, further inquiries can be directed to the corresponding author.
Author contributions
SC and WL designed the research and edited the manuscript. JL, KJ, and SM performed the research. CZ and SC collected and identified the plant materials. JL, SM, and SC analyzed the data and wrote the manuscript. All authors contributed to the article and approved the final manuscript.
Funding
This work was supported by the National Natural Science Foundation of China (no. 31900280), the Fundamental Research Funds for the Central Universities, Southwest Minzu University (ZYN2022001), and the Key Laboratory of Superior Forage Germplasm in the Qinghai-Tibetan plateau (2020-ZJ-Y03).
Conflict of interest
The authors declare that the research was conducted in the absence of any commercial or financial relationships that could be construed as a potential conflict of interest.
The reviewer KZ declared a shared affiliation with the author CZ to the handling editor at the time of review.
Publisher’s note
All claims expressed in this article are solely those of the authors and do not necessarily represent those of their affiliated organizations, or those of the publisher, the editors and the reviewers. Any product that may be evaluated in this article, or claim that may be made by its manufacturer, is not guaranteed or endorsed by the publisher.
Supplementary material
The Supplementary material for this article can be found online at: https://www.frontiersin.org/articles/10.3389/fevo.2022.1068739/full#supplementary-material
Footnotes
References
Avolio, M. L., Beaulieu, J. M., and Smith, M. D. (2013). Genetic diversity of a dominant C4 grass is altered with increased precipitation variability. Oecologia 171, 571–581. doi: 10.1007/s00442-012-2427-4
Bell, G., and Collins, S. (2008). Adaptation, extinction and global change. Evol. Appl. 1, 3–16. doi: 10.1111/j.1752-4571.2007.00011.x
Booy, G., Hendriks, R., Smulders, M., Groenendael, J. M., and Vosman, B. (2000). Genetic diversity and the survival of populations. Plant Biol. 2, 379–395. doi: 10.1055/s-2000-5958
Brito, V. L., Mori, G. M., Vigna, B. B., Azevedo-Silva, M., Souza, A. P., and Sazima, M. (2016). Genetic structure and diversity of populations of polyploid Tibouchina pulchra Cogn.(Melastomataceae) under different environmental conditions in extremes of an elevational gradient. Tree Genet. Genomes 12:101. doi: 10.1007/s11295-016-1059-y
Castilla, A. R., Méndez-Vigo, B., Marcer, A., Martínez-Minaya, J., Conesa, D., Picó, F. X., et al. (2020). Ecological, genetic and evolutionary drivers of regional genetic differentiation in Arabidopsis thaliana. BMC Evol. Biol. 20:71. doi: 10.1186/s12862-020-01635-2
Chen, S. Y., Ma, X., Zhang, X. Q., and Chen, Z. H. (2009). Genetic variation and geographical divergence in Elymus nutans (Poaceae: Triticeae) from West China. Biochem. Syst. Ecol. 37, 716–722. doi: 10.1016/j.bse.2009.12.005
Chen, S. Y., Zhang, X. Q., Ma, X., and Huang, L. K. (2013). Assessment of genetic diversity and differentiation of Elymus nutans indigenous to Qinghai-Tibet plateau using simple sequence repeats markers. Can. J. Plant Sci. 93, 1089–1096. doi: 10.4141/CJPS2013-062
Cole, C. T. (2003). Genetic variation in rare and common plants. Annu. Rev. Ecol. Evol. Syst. 34, 213–237. doi: 10.1146/annurev.ecolsys.34.030102.151717
Díaz, O., Sun, G. L., Salomon, B., and von Bothmer, R. (2000). Levels and distribution of allozyme and RAPD variation in populations of Elymus fibrosus (Schrenk) Tzvel. (Poaceae). Genet. Resour. Crop. Evol. 47, 11–24. doi: 10.1023/A:1008719119756
Earl, D. A., and von Holdt, B. M. (2012). STRUCTURE HARVESTER: a website and program for visualizing STRUCTURE output and implementing the Evanno method. Conserv. Genet. Resour. 4, 359–361. doi: 10.1007/s12686-011-9548-7
Evanno, G., Regnaut, S., and Goudet, J. (2005). Detecting the number of clusters of individuals using the software STRUCTURE: a simulation study. Mol. Ecol. 14, 2611–2620. doi: 10.1111/j.1365-294X.2005.02553.x
Falush, D., Stephens, M., and Pritchard, J. K. (2007). Inference of population structure using multilocus genotype data: dominant markers and null alleles. Mol. Ecol. Notes 7, 574–578. doi: 10.1111/j.1471-8286.2007.01758.x
Franks, S. J., Weber, J. J., and Aitken, S. N. (2014). Evolutionary and plastic responses to climate change in terrestrial plant populations. Evol. Appl. 7, 123–139. doi: 10.1111/eva.12112
Gaudett, M., Salomon, B., and Sun, G. (2005). Molecular variation and population structure in Elymus trachycaulus and comparison with its morphologically similar E. alaskanus. Plant Syst. Evol. 250, 81–91. doi: 10.1007/s00606-004-0199-y
Ghalambor, C. K., McKay, J. K., Carroll, S. P., and Reznick, D. N. (2007). Adaptive versus non-adaptive phenotypic plasticity and the potential for contemporary adaptation in new environments. Funct. Ecol. 21, 394–407. doi: 10.1111/j.1365-2435.2007.01283.x
Gray, M., Amanda, P., Bello, N., Galliart, M., Knapp, M., Garret, K., et al. (2014). Ecotypes of an ecologically dominant prairie grass (Andropogon gerardii) exhibit genetic divergence across the U.S. Midwest grasslands’ environmental gradient. Mol. Ecol. 23, 6011–6028. doi: 10.1111/mec.12993
Gu, X., Guo, Z., Ma, X., Bai, S., Zhang, X., Zhang, C., et al. (2015). Population genetic variability and structure of Elymus breviaristatus (Poaceae: Triticeae) endemic to Qinghai-Tibetan plateau inferred from SSR markers. Biochem. Syst. Ecol. 58, 247–256. doi: 10.1016/j.bse.2014.12.009
Guo, Y. X., Wang, C. Z., Yan, X. B., Wang, R. Y., Liu, S. S., and Tian, M. (2014). Markers associated with altitude and ecological factors in hexaploidy Campeiostachys nutans (Griseb.) J. L. Yang, B. R. Baum et C. Yen and tetraploid Roegneria nutans (Keng) Keng. Genet. Resour. Crop. Evol. 61, 511–521. doi: 10.1007/s10722-013-0055-4
Hamrick, J. L., and Godt, M. J. W. (1996). Effects of life history traits on genetic diversity in plant species. Philos. Trans. R. Soc. B 351, 1291–1298. doi: 10.1098/rstb.1996.0112
Honnay, O., and Jacquemyn, H. (2007). Susceptibility of common and rare plant species to the genetic consequences of habitat fragmentation. Conserv. Biol. 21, 823–831. doi: 10.1111/j.1523-1739.2006.00646.x
Huang, W. D., Zhao, X. Y., Zhao, X., Li, Y. Q., Lian, J., and Yun, J. Y. (2014). Relationship between the genetic diversity of Artemisia halodendron and climatic factors. Acta Oecol. 55, 97–103. doi: 10.1016/j.actao.2013.12.005
Huh, M., and Huh, H. W. (1999). Patterns of genetic diversity and population structure of the clonal herb, Potentilla fragarioides var. sprengeliana (Rosaceae) in Korea. Acta Bot. Sin. 42, 64–70.
Jakobsson, M., and Rosenberg, N. A. (2007). CLUMPP: a cluster matching and permutation program for dealing with label switching and multimodality in analysis of population structure. Bioinformatics 23, 1801–1806. doi: 10.1093/bioinformatics/btm233
Jiang, S., Luo, M. X., Gao, R. H., Zhang, W., Yang, Y. Z., Li, Y. J., et al. (2019). Isolation-by-environment as a driver of genetic differentiation among populations of the only broad-leaved evergreen shrub Ammopiptanthus mongolicus in Asian temperate deserts. Sci. Rep. 9:12008. doi: 10.1038/s41598-019-48472-y
Kahilainen, A., Puurtinen, M., and Kotiaho, J. S. (2014). Conservation implications of species-genetic diversity correlations. Glob. Ecol. Conserv. 2, 315–323. doi: 10.1016/j.gecco.2014.10.013
Kovach, R. P., Muhlfeld, C. C., Wade, A. A., Hand, B. K., Whited, D. C., DeHaan, P. W., et al. (2015). Genetic diversity is related to climatic variation and vulnerability in threatened bull trout. Glob. Chang. Biol. 21, 2510–2524. doi: 10.1111/gcb.12850
Lee, C. R., and Mitchell-Olds, T. (2011). Quantifying effects of environmental and geographical factors on patterns of genetic differentiation. Mol. Ecol. 20, 4631–4642. doi: 10.1111/j.1365-294X.2011.05310.x
Li, C. X., De Jong, R., Schmid, B., Wulf, H., and Schaepman, M. E. (2019). Spatial variation of human influences on grassland biomass on the Qinghai-Tibetan plateau. Sci. Total Environ. 665, 678–689. doi: 10.1016/j.scitotenv.2019.01.321
Liang, Q. L., Xu, X. T., Mao, K. S., Wang, M. C., Wang, K., Xi, Z. X., et al. (2018). Shifts in plant distributions in response to climate warming in a biodiversity hotspot, the Hengduan Mountains. J. Biogeogr. 45, 1334–1344. doi: 10.1111/jbi.13229
Ma, X., Chen, S. Y., Zhang, X. Q., Bai, S. Q., and Zhang, C. B. (2012). Assessment of worldwide genetic diversity of Siberian wild rye (Elymus sibiricus L.) germplasm based on gliadin analysis. Molecules 17, 4424–4434. doi: 10.3390/molecules17044424
Manel, S., Guerin, P. E., Mouillot, D., Blanchet, S., Velez, L., Albouy, C., et al. (2020). Global determinants of freshwater and marine fish genetic diversity. Nat. Commun. 11, 1–9. doi: 10.1038/s41467-020-14409-7
Manni, F., Guerard, E., and Heyer, E. (2004). Geographic patterns of (genetic, morphologic, and linguistic) variation: how barriers can be detected by using Monmonier’s algorithm. Hum. Biol. 76, 173–190. doi: 10.1353/hub.2004.0034
Marchese, C. (2015). Biodiversity hotspots: a shortcut for a more complicated concept. Glob. Ecol. Conserv. 3, 297–309. doi: 10.1016/j.gecco.2014.12.008
Myers, N., Mittermeier, R. A., Mittermeier, C. G., Da Fonseca, G. A. B., and Kent, J. (2000). Biodiversity hotspots for conservation priorities. Nature 403, 853–858. doi: 10.1038/35002501
Noguerales, V., Cordero, P. J., and Ortego, J. (2016). Hierarchical genetic structure shaped by topography in a narrow-endemic montane grasshopper. BMC Evol. Biol. 16:96. doi: 10.1186/s12862-016-0663-7
Nybom, H., and Bartish, I. V. (2000). Effects of life history traits and sampling strategies on genetic diversity estimates obtained with RAPD markers in plants. Perspect. Plant Ecol. 3, 93–114. doi: 10.1078/1433-8319-00006
Oldroyd, G. E. D., and Leyser, O. (2020). A plant’s diet, surviving in a variable nutrient environment. Science 368:eaba0196. doi: 10.1126/science.aba0196
Peakall, R., and Smouse, P. E. (2012). GenAlEx 6.5: genetic analysis in excel. Population genetic software for teaching and research – an update. Bioinformatics 28, 2537–2539. doi: 10.1093/bioinformatics/bts460
Riddle, B. R. (2016). Comparative phylogeography clarifies the complexity and problems of continental distribution that drove A. R. Wallace to favor islands. Proc. Natl. Acad. Sci. U. S. A. 113, 7970–7977. doi: 10.1073/pnas.1601072113
Sanders, T. B., Hamrick, J. L., and Holden, L. R. (1979). Allozyme variation in Elymus canadensis from the tallgrass prairie region: geographic variation. Am. Midl. Nat. 101, 1–12. doi: 10.2307/2424895
Sarin, B., Martin, J. P., and Mohanty, A. (2015). Differences in population genetic structure of two ethnomedicinal herbs of the genus Phyllanthus from India: a consequence of anthropogenic intervention? Plant Syst. Evol. 301, 667–676. doi: 10.1007/s00606-014-1104-y
Sexton, J. P., Hangartner, S. B., and Hoffmann, A. A. (2014). Genetic isolation by environment or distance: which pattern of gene flow is most common? Evolution 68, 1–15. doi: 10.1111/evo.12258
Shafer, A. B. A., and Wolf, J. B. W. (2013). Widespread evidence for incipient ecological speciation: a meta-analysis of isolation-by-ecology. Ecol. Lett. 16, 940–950. doi: 10.1111/ele.12120
Shangguan, W., Dai, Y. J., Liu, B., Zhu, A., Duan, Q., Wu, L., et al. (2013). A China dataset of soil properties for land surface modeling. J. Adv. Model Earth Syst. 5, 212–224. doi: 10.1002/jame.20026
Su, Y. J., Wang, T., and Ouyang, P. Y. (2009). High genetic differentiation and variation as revealed by ISSR marker in Pseudotaxus chienii (taxaceae), an old rare conifer endemic to China. Biochem. Syst. Ecol. 37, 579–588. doi: 10.1016/j.bse.2009.10.005
Sun, G. L., Diaz, O., Salomon, B., and Von Bothmer, R. (2001). Genetic diversity and structure in a natural Elymus caninus population from Denmark based on microsatellite and isozyme analyses. Plant Syst. Evol. 227, 235–244. doi: 10.1007/s006060170051
Šurinová, M., Hadincová, V., Vandvik, V., and Münzbergová, Z. (2019). Temperature and precipitation, but not geographic distance, explain genetic relatedness among populations in the perennial grass Festuca rubra. J. Plant Ecol. 12, 730–741. doi: 10.1093/jpe/rtz010
Tamura, K., Stecher, G., Peterson, D., Filipski, A., and Kumar, S. (2013). MEGA6: molecular evolutionary genetics analysis version 6.0. Mol. Biol. Evol. 30, 2725–2729. doi: 10.1093/molbev/mst197
Tansley, S. A., and Brown, C. R. (2000). RAPD variation in the rare and endangered Leucadendron elimense (Proteaceae): implications for their conservation. Biol. Conserv. 95, 39–48. doi: 10.1016/S0006-3207(00)00015-X
Trejo, L., Alvarado-Cardenas, L. O., Scheinvar, E., and Eguiarte, L. E. (2016). Population genetic analysis and bioclimatic modeling in Agave striata in the Chihuahuan Desert indicate higher genetic variation and lower differentiation in drier and more variable environments. Am. J. Bot. 103, 1020–1029. doi: 10.3732/ajb.1500446
Vekemans, X., Beauwens, T., Lemaire, M., and Roldan-Ruiz, I. (2002). Data from amplified fragment length polymorphism (AFLP) markers show indication of size homoplasy and of a relationship between degree of homoplasy and fragment size. Mol. Ecol. 11, 139–151. doi: 10.1046/j.0962-1083.2001.01415.x
Vences, M., Wollenberg, K. C., Vieites, D. R., and Lees, D. C. (2009). Madagascar as a model region of species diversification. Trends Ecol. Evol. 24, 456–465. doi: 10.1016/j.tree.2009.03.011
Wang, S. Q. (2020). Genetic diversity and population structure of the endangered species Paeonia decomposita endemic to China and implications for its conservation. BMC Plant Biol. 20:510. doi: 10.1186/s12870-020-02682-z
Wang, I. J., and Bradburd, G. S. (2014). Isolation by environment. Mol. Ecol. 23, 5649–5662. doi: 10.1111/mec.12938
Wang, I. J., Glor, R. E., and Losos, J. B. (2013). Quantifying the roles of ecology and geography in spatial genetic divergence. Ecol. Lett. 16, 175–182. doi: 10.1111/ele.12025
Wang, Z. F., Liu, H. L., Dai, S. P., Cao, H. L., Wang, R. J., and Wang, Z. M. (2019). Endangered but genetically stable— Erythrophleum fordii within Feng Shui woodlands in suburbanized villages. Ecol. Evol. 9, 10950–10963. doi: 10.1002/ece3.5513
Wang, D. W., Shen, B. Q., and Gong, H. D. (2019). Genetic diversity of Simao pine in China revealed by SRAP markers. Peer J. 7:e6529. doi: 10.7717/peerj.6529
Wang, Z., Wang, M., Yu, K., Hu, H., Yang, Y., Ciais, P., et al. (2021). Global synthesis for the scaling of soil microbial nitrogen to phosphorus in terrestrial ecosystems. Environ. Res. Lett. 16:044034. doi: 10.1088/1748-9326/abed78
Wang, Z. Q., Yu, K. L., Lv, S. Q., Niklas, K. J., Mipam, T. D., Crowther, T. W., et al. (2019). The scaling of fine root nitrogen versus phosphorus in terrestrial plants: a global synthesis. Funct. Ecol. 33, 2081–2094. doi: 10.1111/1365-2435.13434
Wright, S. (1945). Isolation by distance under diverse systems of mating. Genetics 30, 571–572. doi: 10.1093/genetics/31.1.39
Xue, X., Guo, J., Han, B. S. A., Sun, Q. W., and Liu, L. C. (2009). The effect of climate warming and permafrost thaw on desertification in the Qinghai-Tibetan plateau. Geomorphology 108, 182–190. doi: 10.1016/j.geomorph.2009.01.004
Yang, J., Vazquez, L., Feng, L., Liu, Z., and Zhao, G. (2018). Climatic and soil factors shape the demographical history and genetic diversity of a deciduous oak (Quercus liaotungensis) in northern China. Front. Plant Sci. 9:1534. doi: 10.3389/fpls.2018.01534
Yeh, F. C., and Boyle, T. J. B. (1997). Population genetic analysis of co-dominant and dominant markers and quantitative traits. Belg. J. Bot. 129, 157–163.
Yin, L., Dai, E. F., Zheng, D., Wang, Y. H., Ma, L., and Tong, M. (2020). What drives the vegetation dynamics in the Hengduan Mountain region, Southwest China: climate change or human activity? Ecol. Indic. 112:106013. doi: 10.1016/j.ecolind.2019.106013
Yu, Q., Liu, Q., Xiong, Y., Xiong, Y., Dong, Z., Yang, J., et al. (2019). Genetic diversity and population divergence of a rare, endemic grass (Elymus breviaristatus) in the southeastern Qinghai-Tibetan plateau. Sustainability 11:5863. doi: 10.3390/su11205863
Zellmer, A. J., Hanes, M. M., Hird, S. M., and Carstens, B. C. (2012). Deep phylogeographic structure and environmental differentiation in the carnivorous plant Sarracenia alata. Syst. Biol. 61, 763–777. doi: 10.1093/sysbio/sys048
Zhang, D. F., Fengquan, L., and Jianmin, B. (2000). Eco-environmental effects of the Qinghai-Tibet plateau uplift during the quaternary in China. Environ. Geol. 39, 1352–1358. doi: 10.1007/s002540000174
Zhang, W. X., Furtado, K., Wu, P. L., Zhou, T. J., Chadwick, R., Marzin, C., et al. (2021). Increasing precipitation variability on daily-to-multiyear time scales in a warmer world. Sci. Adv. 7:eabf8021. doi: 10.1126/sciadv.abf8021
Keywords: Qinghai-Tibet plateau, Elymus, genetic diversity, spatial structure, isolation model, climate change, precipitation, soil phosphorus
Citation: Li J, Ma S, Jiang K, Zhang C, Liu W and Chen S (2022) Drivers of population divergence and genetic variation in Elymus breviaristatus (Keng) Keng f. (Poaceae: Triticeae), an endemic perennial herb of the Qinghai-Tibet plateau. Front. Ecol. Evol. 10:1068739. doi: 10.3389/fevo.2022.1068739
Edited by:
Heng Huang, University of California, Berkeley,United StatesReviewed by:
Kai Zhou, Independent Researcher, Kunming, ChinaLinkai Huang, Sichuan Agricultural University, China
Jian Sun, Institute of Tibetan Plateau Research (CAS), China
Copyright © 2022 Li, Ma, Jiang, Zhang, Liu and Chen. This is an open-access article distributed under the terms of the Creative Commons Attribution License (CC BY). The use, distribution or reproduction in other forums is permitted, provided the original author(s) and the copyright owner(s) are credited and that the original publication in this journal is cited, in accordance with accepted academic practice. No use, distribution or reproduction is permitted which does not comply with these terms.
*Correspondence: Shiyong Chen, chengshi8827@163.com; Wenhui Liu, qhliuwenhui@163.com