 Nadi M. Dixit
 Malte Zirpel1
- 1Department of Botany, Institute of Biology, University of Kassel, Kassel, Germany
- 2Environmental and Life Sciences Department, Faculty of Science, Universiti Brunei Darussalam, Gadong, Brunei
- 3Magister Programme of Biotechnology, Post Graduate School, Universitas Andalas, Padang, West Sumatera, Indonesia
The Southeast Asian region of Sundaland is among the world’s major biodiversity hotspots. The region’s biodiversity coupled with its complex and dynamic geographic and climatic histories makes it an ideal region to study the various factors that determine the diversification and distribution patterns of tropical biota. Here we investigate the biogeographic patterns in the partly myrmecophytic Macaranga section Pruinosae to reveal some of the factors that play a role in determining the distribution of biota in Sundaland. We used single nucleotide polymorphisms (SNP) data derived from GBS, a next generation sequencing technique, in maximum likelihood and cluster analyses to determine phylogenetic relationships and population structures within this taxonomic section. Bayesian inference based on secondary calibration points and ancestral area reconstruction analyses were performed to infer spatial–temporal origins of the major lineages in the section. The results from these analyses were further substantiated using nuclear microsatellite data obtained from a broader sample set of two widely distributed species within the section: Macaranga gigantea and Macaranga pruinosa. Phylogenetic and cluster analyses reveal four well-defined, discrete species groups within section Pruinosae, all of which but one originated in Borneo with the crown node dated at 3.58 mya. Biogeographic patterns within the species reveal a biogeographic barrier between east and west Sundaland besides bringing to light the role played by various geological factors, especially the Crocker Range, on Borneo. Patterns also reveal a biogeographic barrier between the Bangka/Belitung islands and Sumatra for ant-free, swamp-adapted species. This study provides evidence that geographic barriers, edaphic conditions, and ecological adaptations are tightly linked and that their mutual interaction determines the diversification and distribution of species.
1. Introduction
The Indo-Australian Archipelago, commonly known as the Malay Archipelago, consists of around 20,000 islands on either side of the equator and is one of the most geographically complex tropical areas on the planet (Lohman et al., 2011). Although this region occupies only 4% of the Earth’s land area, it is a major biodiversity hotspot, housing 20–25% of the planet’s plant and animal species (Myers et al., 2000; Mittermeier et al., 2005; Woodruff, 2010; Corlett, 2014). In particular, the Malay Peninsula and the three large islands of Borneo, Sumatra, and Java possess extraordinary biodiversity and are home to more than 15,000 endemic plant species (Brooks et al., 2002) and around 7–8% of all flowering plants and vertebrate species on Earth (Myers et al., 2000; Husson et al., 2020). Understanding which factors are the main drivers of species diversity in this area has been and still is a major subject of interest.
Southeast Asia has had a very complex and dynamic geological and climatic history that has played a major role in the diversification and distribution of the region’s biota (Cannon et al., 2009; Woodruff, 2010; Lohman et al., 2011). In particular, Pleistocene climatic fluctuations (PCF; 2.58–0.012 mya; Walker, 2019) are considered to be one of the main drivers in this regard (Dodson et al., 1995; Haffer, 1997; Lohman et al., 2011; de Bruyn et al., 2014; Sholihah et al., 2021). Repeated exposure and inundation of the Sunda Shelf during glacial and interglacial times in this period is considered to have functioned as a sort of “species pump” through alternating cycles of range expansion and contraction, respectively (Esselstyn and Brown, 2009; April et al., 2013; Papadopoulou and Knowles, 2015a,b; Li and Li, 2018). There is, however, recent evidence for a scenario in which the Sunda Shelf has been continuously exposed prior to 400 kya (Husson et al., 2020) and if this were to apply, dispersal across the Shelf must have been possible throughout most of the Pleistocene. This would require a reshaping in the way phylogeographic data is interpreted and other factors such as paleoclimatic conditions, soil properties, and extent of forested habitats need to be given more importance (Salles et al., 2021) in the context of understanding Sundaland biogeography. Despite this implication of continuous geological connectivity over a long period, various studies have shown the presence of a clear-cut biogeographic boundary between western (Malay Peninsula and Sumatra) and eastern (Borneo) Sundaland (Meijaard, 2003; Woodruff, 2010; Lim et al., 2011; Slik et al., 2011; Hinckley et al., 2020). Two hypotheses have been postulated to explain this lack of gene flow across the Shelf: the first is the “savannah corridor” hypothesis first posited by Heaney (1991) which proposes a seasonal climate corridor extending from southern Thailand to Java that could have served as a barrier to the migration of rainforest taxa (see also Bird et al., 2005). The second hypothesis put forth by Slik et al. (2011) proposes that coarse-textured nutrient-poor soils on the exposed Sunda Shelf could have acted as a potential barrier to gene flow.
Increased human activities such as logging have paved the way for pioneer trees to become dominant in many tropical habitats, including the lowland dipterocarp forests of Borneo (Guicking et al., 2011). Some of the most important pioneer trees of the lowland forests in the Malay Archipelago belong to the genus Macaranga Thouars (Euphorbiaceae). This genus comprises ~280 dioecious species that are distributed from Africa in the West to tropical Asia, North Australia, and some Pacific islands in the East (Whitmore et al., 2008). Potential habitats for Macaranga pioneers have greatly increased as a result of human activities and one can now find them frequently growing along roadsides, forest edges, and logged areas (Blattner et al., 2001). A key feature of this genus is its multitudinous associations with ants which vary over a wide spectrum (Fiala et al., 1989; Fiala, 1999). While non-myrmecophytic Macaranga species opportunistically attract ants by offering them food bodies and/or extrafloral nectar, obligate myrmecophytes form tighter associations by providing both food and nesting spaces to their ant partners (Fiala et al., 1989). The ants in return protect their host plants against herbivory, competition from encroaching vines (Fiala et al., 1989, 1994), and fungal pathogens (Heil et al., 1999). These obligate myrmecophytes are confined to three taxonomic sections—Pachystemon, Pruinosae, and Winklerianae (Davies, 2001; Davies et al., 2001; Whitmore et al., 2008)—and are only found in the ever-wet rainforests of Sundaland with Borneo being a diversity hotspot (reviewed in Fiala, 1999; Blattner et al., 2001).
In this study we re-evaluate Sundaland’s biogeographic history by taking a closer look at the evolutionary history and biogeography of Macaranga section Pruinosae using next-generation sequencing (NGS) data, specifically, data derived from genotyping-by-sequencing (GBS; Elshire et al., 2011), and nuclear microsatellite (ncSSR) analysis. The seven species that make up this taxonomic section differ in terms of their distribution ranges, ecological requirements, and association with ants (Davies, 2001; Whitmore et al., 2008)—allowing a comparative analysis and discussion of putatively causative factors to explain species-specific phylogeographic patterns. Four of these species are myrmecophytic throughout their entire geographic range (Macaranga hosei, M. pearsonii, M. puberula, and M. rufescens), two are non-myrmecophytes (Macaranga gigantea and M. pentaloba), and one (Macaranga pruinosa) is myrmecophytic in only a part of its geographic range (Davies, 2001; Guicking et al., 2011). In the current study, we exclude the rare M. pentaloba, endemic to Kelabit Highlands on Borneo (Davies, 2001), due to lack of sampling. The locally very abundant M. gigantea has a broad ecological range, from lowlands to altitudes of ca. 1,000 m, with a distribution range encompassing Borneo, the Malay Peninsula, Sumatra, and the Bangka/Belitung islands (Davies, 2001; Figure 1). M. hosei shares the same geographic range as M. gigantea although it is not found in northeastern Borneo (Sabah) and the Bangka/Belitung islands. It occurs on a wide range of substrates from nutrient poor sandy soils to shale-derived rich soils but it is not found in swamps (Davies, 2001). Due to the morphological ambiguity associated with the identity of the specimens determined as M. rufescens in Davies et al. (2001), we address this particular clade as M. cf. rufescens throughout this study. Macaranga cf. rufescens, M. pearsonii, and M. puberula are all endemic to Borneo with M. puberula being a submontane species known only from the mountainous habitats of the Crocker Range (Davies, 2001; Guicking et al., 2011). M. pruinosa, a peat swamp early successional tree, occurs in both western and eastern Sundaland (including the Bangka/Belitung islands) but it has never been found associated with ants on Borneo and is polymorphic for this trait in Sumatra and the Malay Peninsula. Curiously, individuals of M. pruinosa found on the Bangka/Belitung islands are non-myrmecophytic like those on Borneo suggesting a close association despite their geographical vicinity to Sumatra (Figure 1; Davies, 2001).
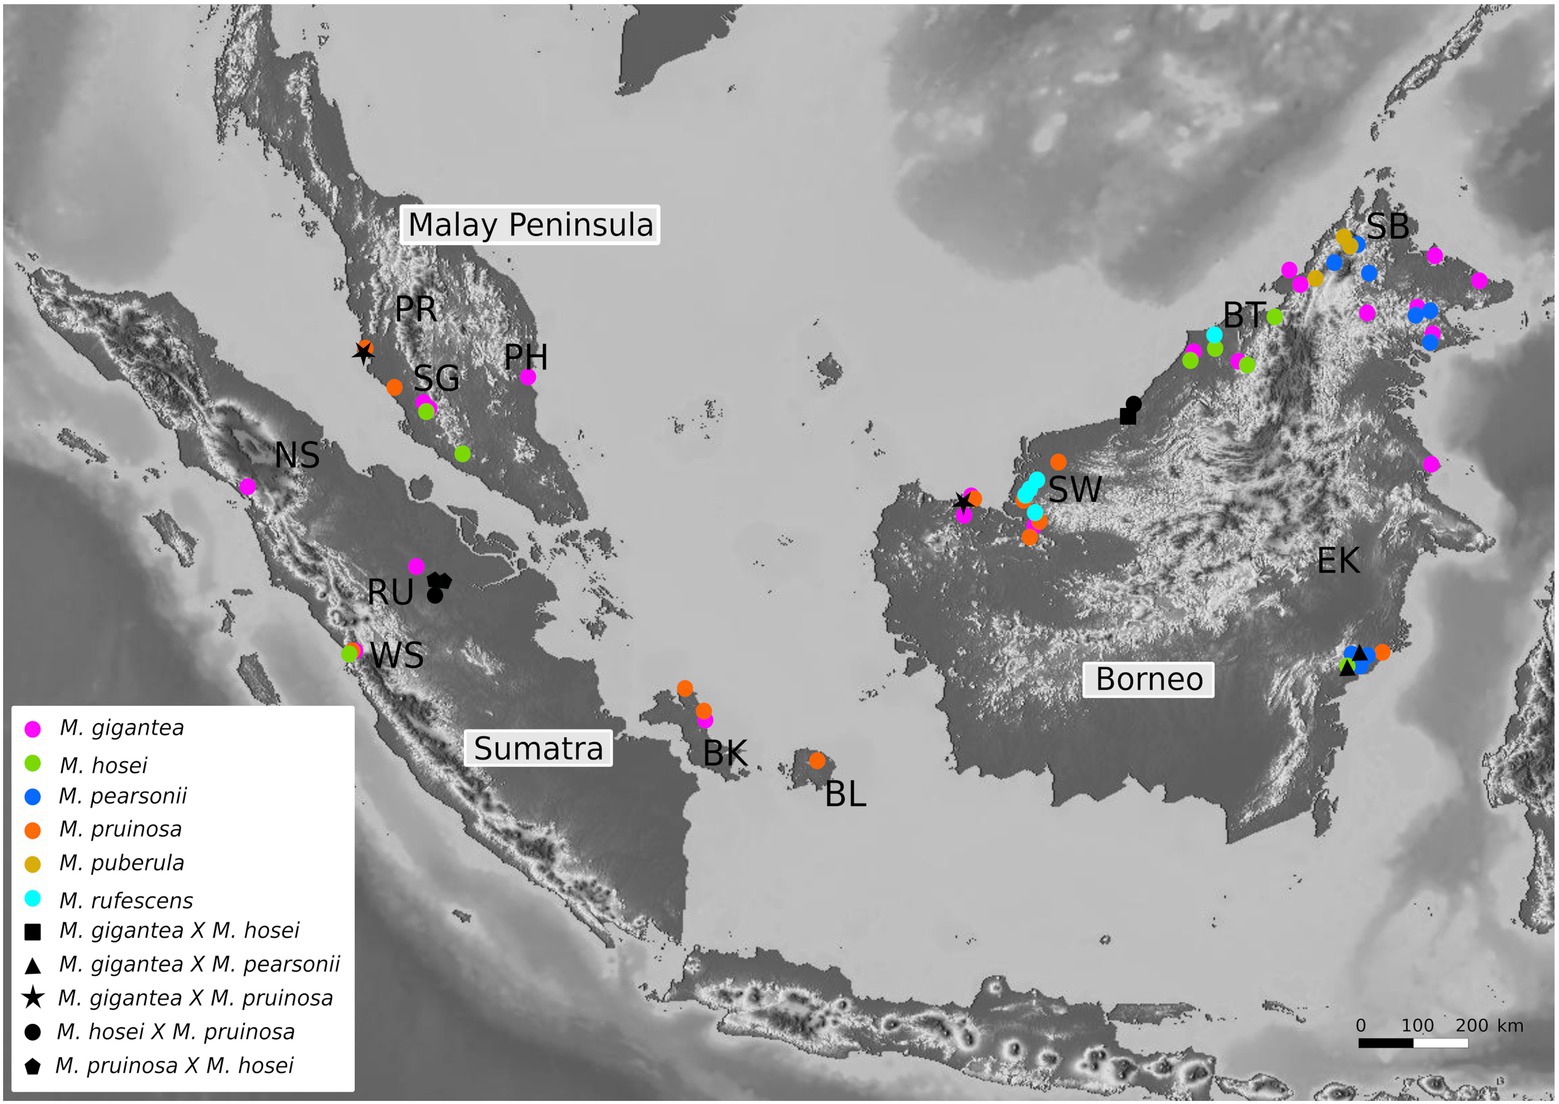
Figure 1. Specimen distribution map for 72 Pruinosae individuals included in the GBS analysis. Major regions or provinces wherefrom the individuals were collected are indicated as abbreviations: BK, Bangka; BL, Belitung; BT, Belait (Brunei); EK, East Kalimantan; NS, North Sumatra; PH, Pahang; PR, Perak; RU, Riau; SB, Sabah; SG, Selangor; SW, Sarawak; WS, West Sumatra.
Up until now, the most comprehensive DNA-based phylogenies of myrmecophytic Macaranga species rely on nuclear internal transcribed spacer sequences that show very little to no variation among species (Blattner et al., 2001; Davies, 2001; Chomicki and Renner, 2015; Fiala et al., 2016). The intraspecific evolutionary relationships, as a result, remain largely elusive, precluding further investigation into the spatio-temporal divergences within the broadly distributed species. The application of NGS technology in this study has enabled, for the first time, the reconstruction of a highly resolved phylogeny of myrmecophytic Macaranga within section Pruinosae, to unravel its evolutionary history in a spatial and temporal context. In the current study, we present GBS and ncSSR data to achieve the following (1) resolve the evolutionary relationships within section Pruinosae both at the interspecific and intraspecific levels (2) identify geographic origins of species and investigate biogeographical patterns of diversification, dispersal routes and geological events that might have influenced distribution and speciation within the section, and (3) elucidate the biogeographic position of the Bangka/Belitung islands with respect to Sumatra and Borneo, and test whether a possible biogeographic barrier runs between them and Sumatra despite the geographic vicinity (<20 km).
2. Materials and methods
2.1. Plant material and DNA isolation
In total, 72 accessions representing six species within section Pruinosae and two accessions from its presumed sister group, section Pachystemon (Davies et al., 2001; Bänfer et al., 2004; Dixit et al., unpublished data) were included in the GBS study. For a more comprehensive look at the distribution of intraspecific genetic diversity in M. gigantea and M. pruinosa, the only two species of section Pruinosae that occur on the islands of Bangka and Belitung, a broader sampling of these two species (480 accessions from 19 populations of M. gigantea and 119 accessions from 12 populations of M. pruinosa) was subjected to ncSSR analyses.
Details of specimens used in GBS analysis are provided in Supplementary Table S1 (Supporting material). Plant material from specimens was available as frozen dried samples at the University of Kassel as a part of a huge repertoire of leaf material of Macaranga individuals collected during extensive fieldwork between the late 1990s and 2014 in Southeast Asia. DNA extraction from the frozen, dried leaf samples for GBS analysis was carried out with high-salt cetyltrimethylammonium bromide (CTAB) buffer in accordance with Tel-Zur et al. (1999). DNA from samples that were exclusively used for ncSSR analysis was isolated following a standard CTAB protocol (Bänfer et al., 2006).
2.2. Genotyping-by-sequencing
Quality check of DNA extracts, GBS library preparation, and Illumina paired-end sequencing were outsourced to a commercial company (LGC Genomics, Berlin). Construction of reduced representation libraries was carried out by digesting DNA with two restriction enzymes: PstI and ApekI. Following PCR amplification and library preparation, 150 bp paired-end sequencing was carried out on an Illumina NovaSeq 6000 sequencer. Approximately 1.5 million reads were obtained per sample and the raw sequencing data was received as demultiplexed files in compressed FASTQ format.
2.3. Sequence alignment and single nucleotide polymorphisms (SNP) mining
Raw R1 reads were fed into the ipyrad assembly pipeline (version 0.9.31; Eaton and Overcast, 2020) for denovo sequence alignment and single nucleotide polymorphisms (SNP) extraction. Within the parameter file, min samples locus (minimum number of samples that should have data at a locus in the final assembly) was set at 5. The first five bases from all reads were trimmed. All other parameters were left at their defaults.
2.4. Phylogenetic tree construction and genetic structure analysis
A phylogenetic tree was constructed through the maximum likelihood (ML) approach using ipa.raxml() (Eaton and Overcast, 2020), a tool that automates the processes of generating and running RAxML command line strings (Stamatakis, 2014). The code was implemented in Python through Jupyter Notebook. A rapid bootstrap analysis with 100 replicates along with the search for the best-scoring ML tree was conducted in one single program run. The generalized time reversible (GTR) model was picked as the substitution model along with the GAMMA model for rate heterogeneity (GTRGAMMA). After the program run, Toytree (Eaton, 2020) was used to plot the best-scoring tree with node support values. The tree was rooted with two individuals from section Pachystemon: Macaranga bancana and M. hypoleuca.
To assess the genetic structure and identify putative hybrids among the section Pruinosae individuals, the STRUCTURE v.2.3.4 (Pritchard et al., 2000; Hubisz et al., 2009) tool available in the ipyrad-analysis toolkit was used. Further, owing to their wide distribution, specimens of M. gigantea and M. pruinosa were independently subjected to intraspecific STRUCTURE analyses to ascertain genetic structuring based on geographic distribution. The admixture model was chosen as our ancestry model in all three analyses. Hybrids, based on the results of the all-species inclusive STRUCTURE analysis discussed above, were excluded from the intraspecific STRUCTURE analyses of M. gigantea and M. pruinosa to avoid conflicts between interspecific and intraspecific variation. In the interspecific analysis, the K parameter was allowed to vary from 2 to 10 while in the intraspecific analyses K varied from 2 to 5; each run was repeated 10 times. The rest of the parameters and priors were left at the recommended default values (Pritchard et al., 2010). Following the STRUCTURE runs, ΔK value was computed to identify the most probable number of clusters according to Evanno et al. (2005) within the ipyrad STRUCTURE toolkit.
2.5. Intraspecific principal component analyses
To further visualize intraspecific relationships and genetic distances among M. gigantea and M. pruinosa individuals, SNP data was used to perform principal component analyses (PCA) with the ipyrad.pca tool (Eaton and Overcast, 2020). Points were color coded in accordance with their geographic distribution (Borneo, Bangka/Belitung islands, Sumatra/Malay Peninsula) to make biogeographic pattern visualization with respect to the three regions easier.
2.6. Divergence time estimation and parametric biogeographic analysis
A second denovo alignment from ipyrad, obtained after dropping specimens identified as hybrids in the STRUCTURE analysis, was used to estimate divergence times on BEAST2 (version 2.6.3; Bouckaert et al., 2019). The input file for the program was created on BEAUTi (version 2.6.3). HKY was set as the site model according to the settings in van Welzen et al. (2014); since implementing more complicated models (model 123124) as suggested by the bModelTest (Bouckaert and Drummond, 2017) led to only negligible changes, we stuck to the simpler HKY model. A relaxed uncorrelated lognormal clock was chosen and speciation was set to occur according to a Yule process (Drummond et al., 2006). Birth-death model as an alternative showed poor convergence. As there are no fossil records available for any species within our focus group, a secondary calibration point for the split between M. gigantea and M. pearsonii derived from van Welzen et al. (2014) was used as an MRCA uniform distribution prior with its limits derived from the 95% HPD interval (9.46–2.17 mya) of the secondary calibration point estimate (Ho, 2007; Kuriyama et al., 2011; Ryberg and Matheny, 2011; Siler et al., 2012; Kornilios et al., 2013; Ruiz-Sanchez and Specht, 2013; Schenk, 2013, 2016; Zhao et al., 2013). All other priors were left at default. The analysis was run for 50,000,000 generations from which every 1000th tree was logged. Tracer (version 1.7.1; Rambaut et al., 2018) was used to check for convergence and ESS values (>200) were used as a criterion to check for quality of the resulting sample sequence. Finally, the maximum clade credibility tree with mean heights was calculated using TreeAnnotator (version 2.6.3 BEAST2 package) and visualized on FigTree (version 1.4.4; Rambaut, 2019).
In order to investigate the ancestral geographic distribution of species in section Pruinosae, ancestral state reconstruction was performed on the dated phylogeny on RASP (version 4.0.0; Yu et al., 2020). Terminal taxa were coded according to their geographic distribution which fell into one of the four areas defined as states: Borneo (A), Bangka and Belitung (B), Malay Peninsula (C), and Sumatra (D). The reconstruction was done using the six models available in the BioGeoBEARS ML implementation (Matzke, 2014; DEC, DIVALIKE, BAYAREALIKE, and their +J counterparts) on RASP. Likelihood ratio tests and AIC values were used to determine the best model for ancestral range estimation.
2.7. Nuclear microsatellite analysis
We also include ncSSR data based on a much larger sample set of the two most broadly distributed species, M. gigantea and M. pruinosa, to provide further support to our GBS-based findings on their intraspecific population structure. In each species, 13 nuclear microsatellite loci were used for ncSSR genotyping. Primer sequences and locus characteristics are compiled in Supplementary Table S2. Amplification of target fragments by PCR, separation of fragments on an automated LI-COR 4200 IR2 sequencer (LI-COR Biosciences, Germany), and visual inspection of fragment lengths were performed as in Guicking et al. (2013) and Fiala et al. (2016). All loci were tested for linkage disequilibrium using Arlequin 5.2.2 (Excoffier and Lischer, 2010) and for the occurrence of null alleles using Microchecker 3.2.2 (Van Oosterhout et al., 2004). No consistent linkage among any locus pair was observed. Putative null alleles were detected at six loci in M. gigantea, but each in only a single population. No indications of null alleles were found in M. pruinosa. Downstream analyses were hence performed with 13 nuclear microsatellite loci in each species (Supplementary Table S2).
To determine the most likely number of genetic entities within M. gigantea and M. pruinosa, a STRUCTURE analysis (version 2.3.4; Pritchard et al., 2000, 2010) was performed using ncSSR data. The number of genetic clusters (K) was set from 1 to 12, and each run was repeated 10 times. The run-length was set to 1,000,000, and the burn-in to 100,000. The admixture model was used and allele frequencies were allowed to be connected among clusters (Falush et al., 2003). The best number of clusters was chosen by calculating the ∆K statistics (Evanno et al., 2005) using STRUCTURE Harvester v. 0.6.94 (Earl and VonHoldt, 2012).
To evaluate genetic diversity within and among populations of the two species, we defined populations as groups of specimens that originated from genetically little differentiated localities. For each population, the number of polymorphic loci, average number of alleles per locus, observed (Ho) and expected heterozygosity (He), and average gene diversity over loci (Nei, 1987) were calculated with Arlequin 5.2.2 (Excoffier and Lischer, 2010). The same program was used to estimate population pairwise FST values and respective levels of significance based on 1,000 permutations.
3. Results
3.1. Genotyping-by-sequencing analysis
3.1.1. Sequence alignment and SNP mining
The alignment with ipyrad resulted in a sequence matrix with 4,365,404 sites for 74 individuals with 64.23% missing sites. A total of 31,379 loci were retained after applying filters in accordance with the parameter settings. The SNP matrix had 209,536 sites with 53.85% missing sites.
3.1.2. Genetic structure analysis and phylogenetic tree construction
STRUCTURE analysis at the interspecific level yielded greatest support for four genetic clusters (K = 4; See Supplementary Figure S2 in supporting material), whereas K = 8 received a secondary ΔK peak and seemed biologically more informative (Figure 2B). In the K = 8 plot, we found four distinct clusters corresponding to M. gigantea, M. hosei, M. pruinosa, and M. pearsonii. Macaranga puberula and M. cf. rufescens appear as admixtured populations between M. pearsonii and an as yet unknown cluster. Multiple hybrids were identified throughout this analysis (Figure 2B). One individual previously identified as an M. gigantea (MMZ090) appears as an admixtured individual between M. gigantea and an as yet unknown cluster.
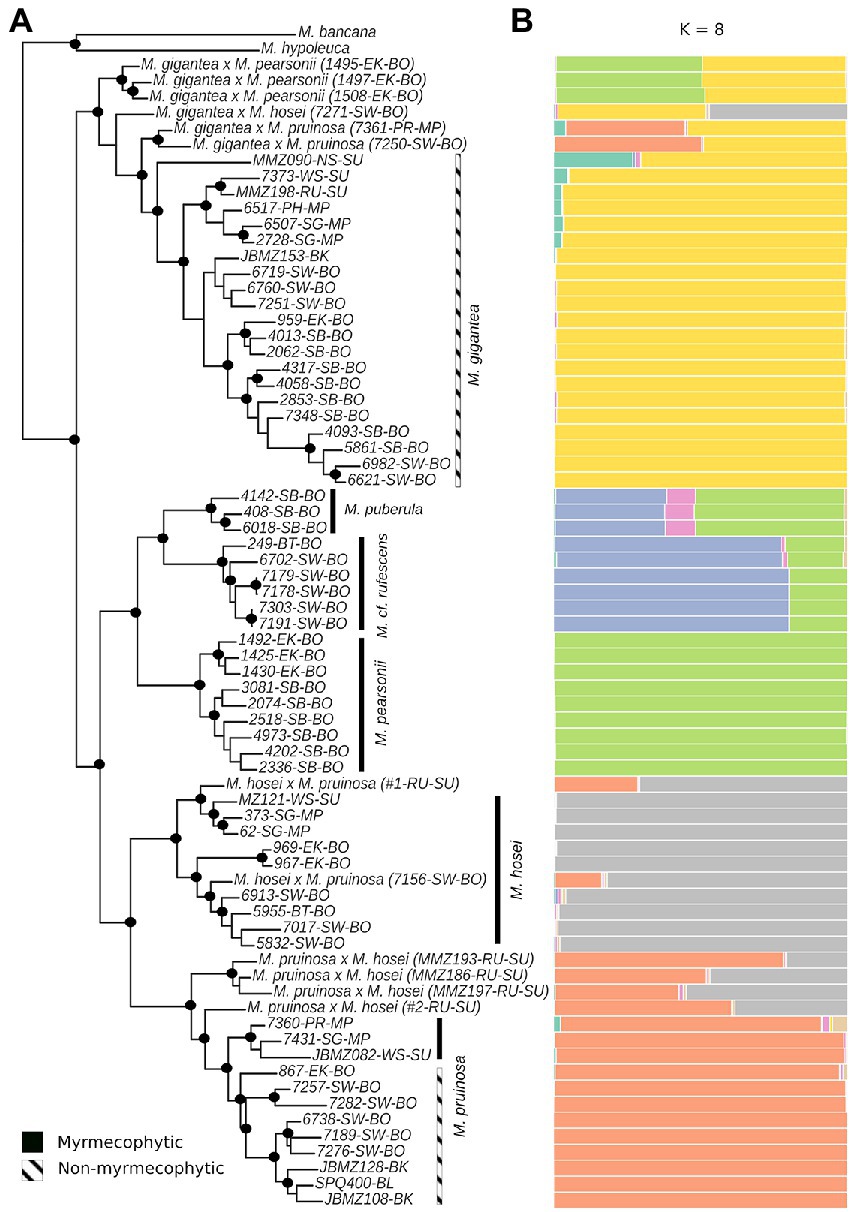
Figure 2. Maximum likelihood tree construction of the 72 Pruinosae individuals using GBS data. Nodes marked with a black solid circle indicate those that received bootstrap support >95%. Myrmecophytic clades are marked with a solid black bar while non-myrmecophytic clades are marked with a hatched black and white bar. Individuals are represented by their accession numbers along with their regions of collection which are indicated by abbreviations as in Figure 1: BK, Bangka; BL, Belitung; BT, Belait (Brunei); EK, East Kalimantan; NS, North Sumatra; PH, Pahang; PR, Perak; RU, Riau; SB, Sabah; SG, Selangor; SW, Sarawak; WS, West Sumatra. Major regions of Borneo, Malay Peninsula, and Sumatra to which the aforementioned regions belong are abbreviated as BO, MP, and SU respectively, and are also included in the names (A). K = 8 STRUCTURE plot for the 72 individuals obtained using GBS-derived SNP data (B).
The ML analysis of the assembled sequence data yielded all six species as monophyletic groups with 100% bootstrap support (Figure 2A). The non-myrmecophytic species M. gigantea was recovered as sister to the rest of the species, corroborating the results of Bänfer et al. (2004). The remaining five, mainly myrmecophytic, species formed a monophyletic group with two main lineages. The first lineage is composed of three species—M. puberula, M. cf. rufescens, and M. pearsonii, with M. pearsonii being sister to the monophyletic group comprising M. puberula and M. cf. rufescens. The individuals of M. pearsonii form two well-supported groups corresponding to their geographical locations in East-Kalimantan and Sabah. The second lineage comprises two species—M. hosei and M. pruinosa. A basal split within the M. hosei lineage separates the western Sundaland individuals (Sumatra and Malay Peninsula) from the eastern ones (Borneo). Within the Bornean group, there is a split between the northern and western specimens from Sarawak and Belait and those from East Kalimantan. Within the M. pruinosa lineage, specimens from Malay Peninsula and Sumatra appear as sister to those from Borneo. Individuals from the islands of Bangka/Belitung clustered with the Borneo group, specifically with those from Sarawak.
Within M. gigantea, the admixtured individual (MMZ090) appears at the basal position. Like in M. pruinosa and M. hosei lineages, two distinct groups correspond to western Sundaland (Malay Peninsula and Sumatra) and eastern Sundaland (Borneo). Here again, one individual from the island of Bangka clustered with the Sarawak (Borneo) individuals (bootstrap support: 0.95).
3.1.3. Divergence time estimation and parametric biogeographic analysis
The phylogenetic tree resulting from the Bayesian BEAST2 analysis (Figure 3) differed only slightly from that estimated within the ML framework of RAxML shown in Figure 2A. The major difference is that within the M. gigantea clade, east and west Sundaland individuals appear as separate clades in the RAxML estimation unlike in the Bayesian tree. The “west” Sundaland clade in the Bayesian tree includes three individuals (7251, 6760 and 6719) from Sarawak (Borneo) as a monophyletic clade and the single individual from the island of Bangka clusters within the Sumatra and Malay Peninsula clade. The crown node of section Pruinosae, where the non-myrmecophytic M. gigantea splits from the rest of the section, was dated at 3.58 mya (95% HPD: 2.17–6.99 mya; Figure 3). The intraspecific splits between east and west Sundaland lineages within M. gigantea, M. pruinosa, and M. hosei all align at around 1.4 mya (1.48 mya (95% HPD: 0.65–2.98 mya), 1.40 (95% HPD: 0.60–2.83 mya), and 1.37 mya (95% HPD: 0.54–2.76 mya) respectively).
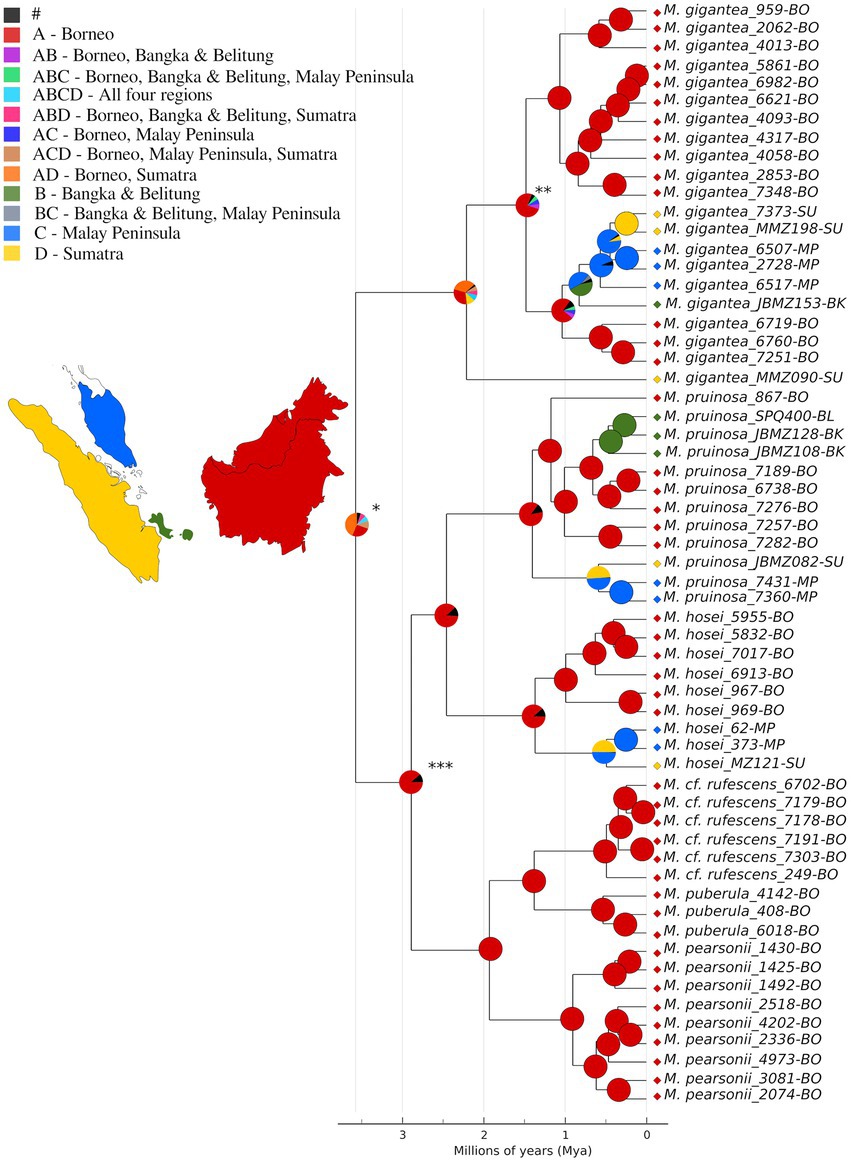
Figure 3. Ancestral area reconstruction according to the DEC + J model calculated by implementing six BioGeoBEARS models on RASP. Pie figures at each node represent geographical area or a combination of geographical areas occupied by ancestral taxa as inferred in the analysis. Colors used to represent areas and combination of areas are as indicated in the legend. The width of the wedges in the pie figures is proportional to the probability of that area or combination of areas; black colored wedges (#) indicate the sum total of all the areas or combination of areas that received probabilities <5% in the analysis. Colored diamonds at the tips indicate the present-day distributions of the respective individuals. Asterisks mark the crown node of section Pruinosae (*), MRCA of M. gigantea clade excluding the admixtured individual (MMZ090; **), and the crown node of the myrmecophytic clade of the section (***) as referenced in the text. Individuals are named in the following format: Species name_accession number-geographical distribution (BO, Borneo; BK, Bangka; BL, Belitung; MP, Malay Peninsula; and SU, Sumatra).
Of the six models implemented in ancestral area reconstruction, DEC + J came out as the most likely (Supplementary Table S5). According to this model, Borneo and Sumatra (AD) are the most likely areas of origin for the crown node of section Pruinosae (Figure 3, marked *) as well as for that of M. gigantea (Figure 3). The MRCA node (Figure 3, marked ***) of the myrmecophytic clade within the section was mapped to Borneo (A). The island also came out to be the most likely ancestral area for all the species within this clade.
3.1.4. Intraspecific differentiation within Macaranga gigantea and Macaranga pruinosa
The intraspecific STRUCTURE analyses based on GBS data yielded greatest support for K = 4 for M. gigantea and K = 3 for M. pruinosa (See Supplementary Figures S1A, B in supporting material). In M. gigantea, the populations from Borneo, specifically from Sabah and East Kalimantan, appear clearly distinct from the Sumatra and Malay Peninsula populations. Interestingly, individuals from Sarawak and Bangka/Belitung appear as a sort of transitional group with an admixture of elements from both east and west Sundaland. The specimen MMZ090 from Sumatra forms its own cluster and appears completely distinct from the rest of the sampling. In M. pruinosa individuals from Borneo appear distinct from those collected in west Sundaland. The three individuals from Bangka and Belitung appear to have >0.5 proportion of their genetic makeup borrowed from Borneo rather than from Sumatra, despite the geographical vicinity to the latter.
The intraspecific variation in M. gigantea and M. pruinosa is further illustrated by the results of the PCA (Supplementary Figures S1A, B). There are three major clusters observed within M. gigantea, comprising specimens from (1) Sarawak, Sabah, and East Kalimantan, (2) Sarawak and Bangka, and (3) Sumatra and Malay Peninsula. Specimen MMZ090 takes an outlier position away from the rest of the individuals. Within M. pruinosa, three clusters are observed, comprising specimens from (1) East Kalimantan, which appears as an outlier, (2) Sarawak and Bangka/Belitung, and (3) Sumatra and the Malay Peninsula.
3.2. Genetic diversity at nuclear microsatellite loci
STRUCTURE analysis using ncSSR data for M. gigantea and M. pruinosa yielded the highest likelihood for K = 6 clusters in both species. Figure 4A shows the geographic distribution of these clusters revealed in M. gigantea. There was a strong overall correlation between genetic and geographic information. Two of the six clusters were dominant in Sumatra and the Malay Peninsula, with the population from Sibolga in northern Sumatra being clearly distinct from all other regions. The remaining four clusters were predominantly found in Borneo, with eastern Kalimantan, eastern Sabah, western Sabah plus northeastern Sarawak, and southwestern Sarawak forming four separate entities. Populations collected on the islands of Bangka and Belitung showed mixed proportions of the west Sundaland and Bornean clusters.
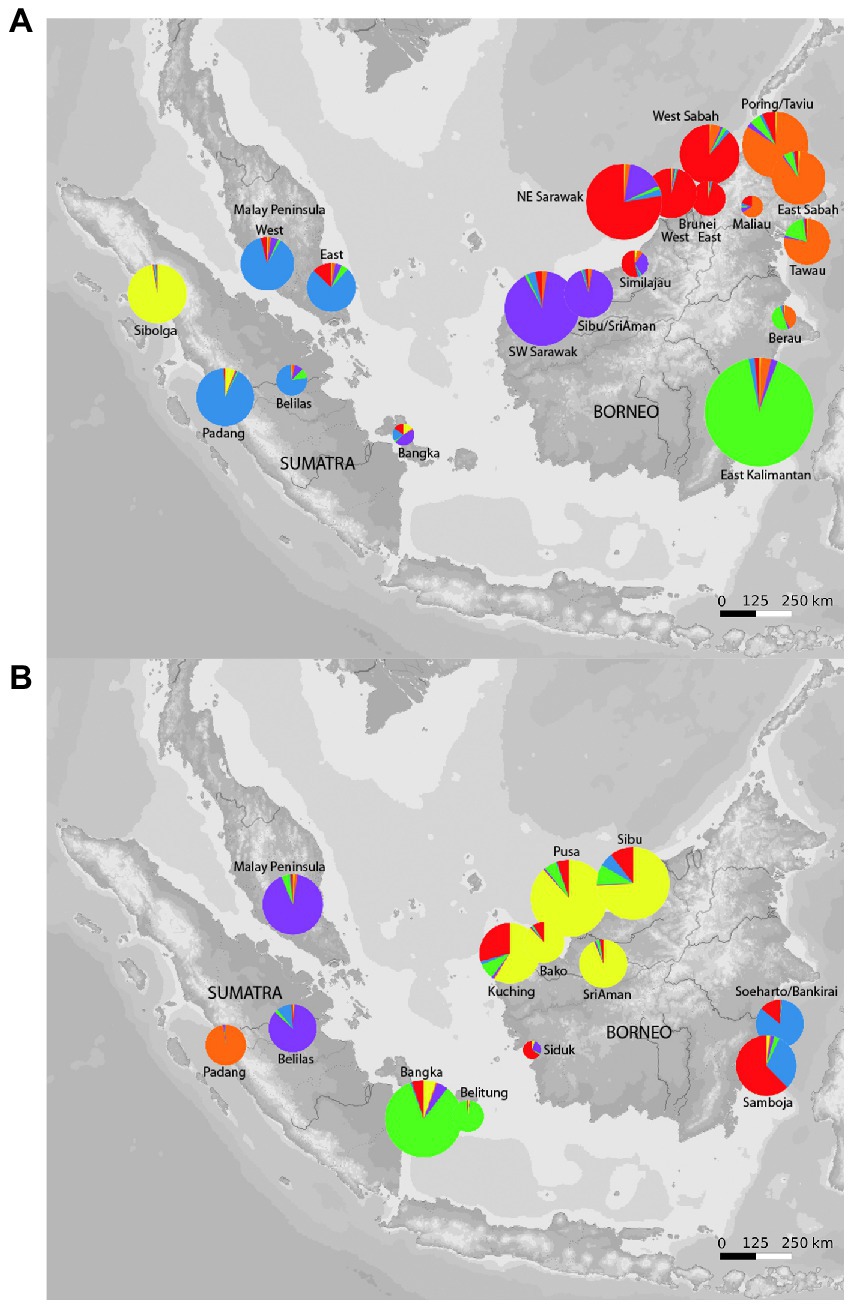
Figure 4. Geographical distribution of genetic diversity in Macaranga gigantea (A), geographical distribution of genetic diversity in Macaranga pruinosa (B). Pie charts show the relative proportion of ancestry in each of six genetic clusters based on ncSSR data and defined by a Bayesian cluster analysis using STRUCTURE 2.3.4. Circle sizes are proportional to sample sizes.
Figure 4B shows the geographic distribution of clusters found in M. pruinosa. Two distinct clusters were found in Sumatra and the Malay Peninsula, and four clusters were found in Borneo that showed some admixture. Bangka and Belitung were grouped into a distinct cluster of their own (green) that otherwise occurred in western Borneo but much less in Sumatra.
Within-population genetic diversity estimates over ncSSR loci showed values that occur in a similar range across all populations in both species. In general, no indication of higher genetic diversity in either east or west Sundaland populations was observed in neither species (Supplementary Tables S3, S4). Pairwise FST values from both species corroborated major findings from the cluster and GBS analyses. In M. gigantea, strongest differentiation was again noted between the northern Sumatra population near Sibolga, and the Bangka sample similarly showed high differentiation from both west and east Sundaland populations (Table 1). Consistent with the findings in STRUCTURE, the M. pruinosa populations on Bangka and Belitung both showed stronger differentiation from west Sundaland than from East Sundaland populations on Borneo.
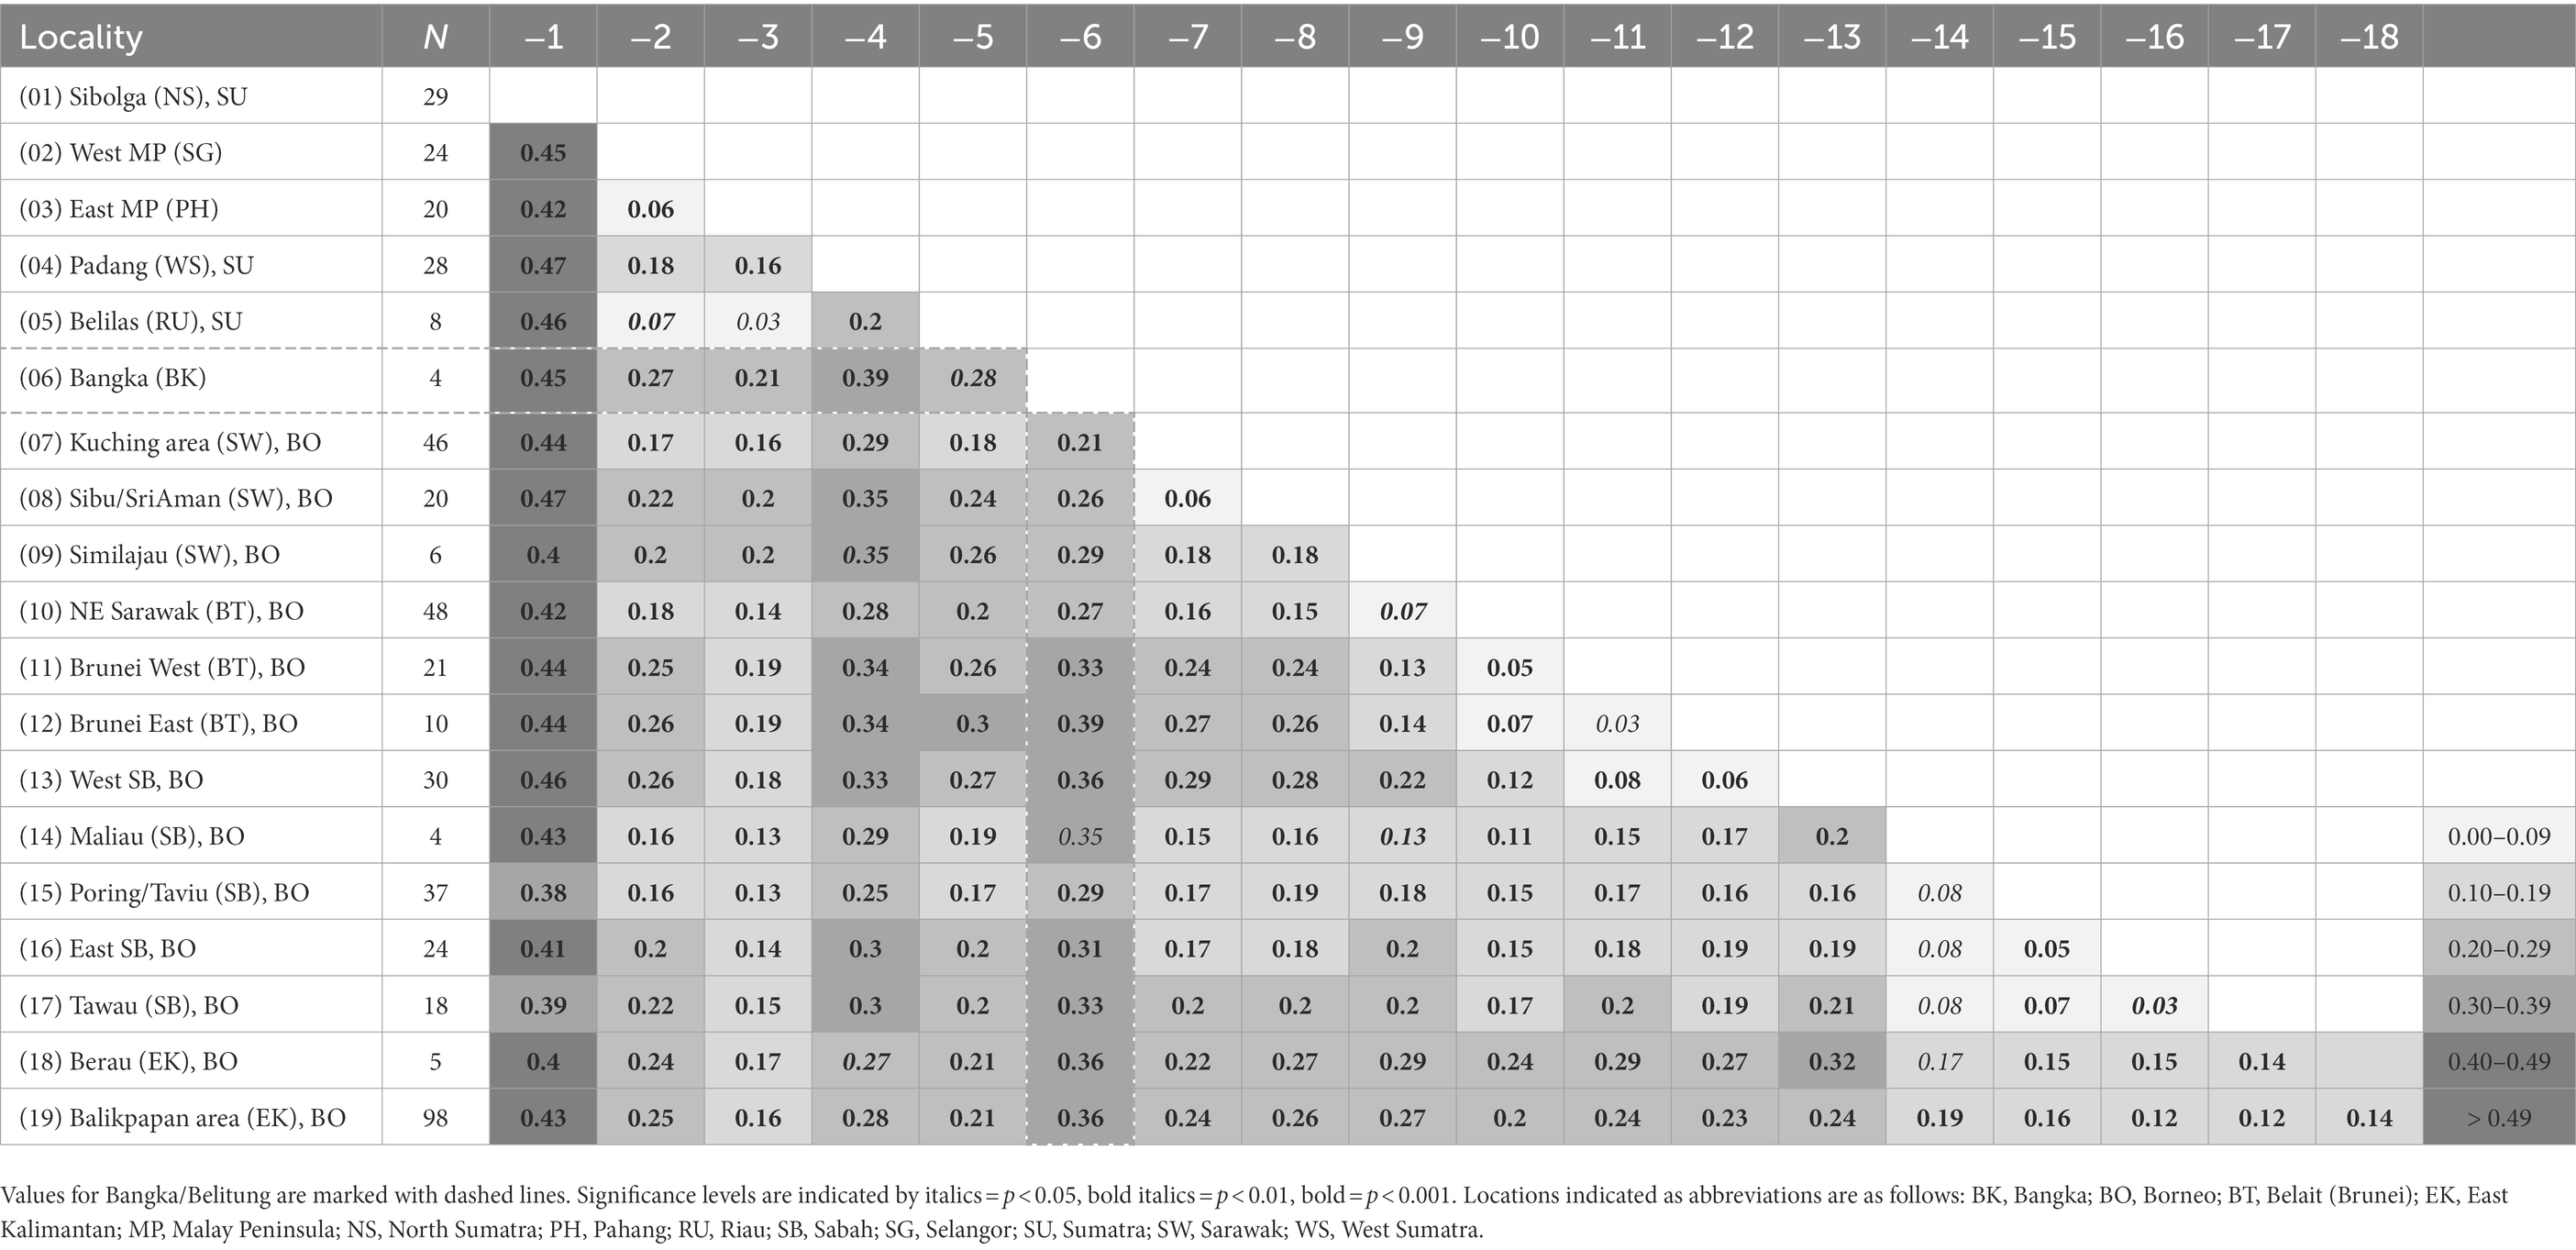
Table 1. Pairwise FST values for 19 populations of M. gigantea based on ncSSR data.
4. Discussion
4.1. Resolving evolutionary relationships within section Pruinosae
The current study presents a successful reconstruction of a well-supported and robust phylogeny, demonstrating the technical prowess of GBS in resolving evolutionary relationships within a relatively young tropical genus like Macaranga at the inter- and intraspecific levels. Moreover, the high bootstrap support values (>95%) obtained for all the backbone nodes in the phylogenetic tree (Figure 2A) suggest that a high degree of confidence can be assigned to all the major clades in the analysis.
The basal positioning of M. gigantea indicates that the non-myrmecophytic species diverged first within Pruinosae, as in Bänfer et al. (2004), evidencing a non-myrmecophytic origin of the section or alternatively, a loss of myrmecophytism in M. gigantea with the retention of the trait in the rest of the species. Through ncSSR data, it is rather clear that the one admixture individual (MMZ090) found at the basal position within the M. gigantea clade is representative of a whole population from the region of Sibolga, Sumatra that has this divergent genotype. Macaranga pruinosa takes a relatively derived position in contrast to previous studies (Blattner et al., 2001; Davies et al., 2001; Bänfer et al., 2004) suggesting that the partial absence of myrmecophytism in this species represents a secondary loss of this trait.
From the ML tree as well as the STRUCTURE analyses (Figures 2A,B) it is quite clear that Pruinosae has at least four well-defined species: M. gigantea, M. pruinosa, M. hosei, and M. pearsonii all of which form monophyletic clades. Macaranga cf. rufescens and M. puberula appear to be very closely related to M. pearsonii (Figure 2B). Although M. pearsonii, M. cf. rufescens, and M. puberula have been previously described as distinct species (Davies, 2001), our data suggests that the three may represent different ecotypes or morphotypes of a single species on their way to speciation. This is supported by their relatively young age (Figure 3; 0.905, 0.492, and 0.532 mya respectively). What has been described as M. rufescens by Davies et al. (2001) is a lowland early successional tree known from Sarawak and Brunei to the west of the Crocker range in Borneo while M. puberula is a submontane early successional that occurs only on the Crocker Range at altitudes ranging from 800 to 1,800 m (Davies, 2001). Macaranga pearsonii on the other hand occurs on the eastern side of the mountain range in Sabah as well as in East and South Kalimantan (Davies, 2001). Considering the distribution patterns of the three species, a likely scenario would be that the Crocker Range not only presented a barrier but also provided new ecological opportunities to an ancestral species in northern Borneo, a likely predecessor of the M. pearsonii/M. cf. rufescens/M. puberula clade, allowing for two diversification modes to occur in tandem. In this scenario, the Crocker Range functioning as a barrier would have allowed for allopatric diversification to occur by separating the more widespread northern population to the geographically isolated eastern M. pearsonii and a western population ancestral to the M. cf. rufescens/M. puberula clade. There are many studies that report parapatric speciation occurring along elevational gradients (Watson, 1835; Bond, 1989; Knox and Palmer, 1995; Carpenter, 2005; Givnish et al., 2009; Sanders and Rahbek, 2012; Caro et al., 2013; Guo et al., 2013; Gao et al., 2019). We hypothesize a similar trend here where expansion of the west Crocker Range population to higher altitudes resulted in diversification along the slopes, giving rise to a mountain-adapted lineage that we currently identify as M. puberula and a lowland lineage we refer to as M. cf. rufescens. This represents a case of ecological speciation brought about by elevational niche partitioning, evidencing the idea that increased species accumulation through in-situ diversification on Borneo could be attributed to, among other factors, its large size and complexity which allow for greater niche variation (Losos and Ricklefs, 2009; O’Connell et al., 2018).
Hybridization between different species within the section appears to be a common phenomenon. Of the 72 individuals included in the GBS part of the study, 12 were identified as hybrids through the STRUCTURE analysis (Figure 2B). Although M. pearsonii X M. pruinosa and M. pearsonii X M. hosei hybrids were not identified in this study, we cannot exclude the possibility of occurrence of these hybrids in the wild in regions where the geographic ranges of the species overlap. Macaranga pearsonii and M. pruinosa occur sympatrically in East Kalimantan while M. pearsonii and M. hosei in East and South Kalimantan (Davies, 2001). In the STRUCTURE analysis, most of these hybrids showed an almost exact 50:50 affiliation to the corresponding species-specific clusters, suggesting that these specimens are likely F1 hybrids. A few specimens also showed a rather 75:25 affiliation, indicating that at least some of the hybrids in this group are able to backcross with the parental species.
4.2. Biogeographic patterns
Three of the principal species in Pruinosae, i.e., M. gigantea, M. hosei, and M. pruinosa, each show a broad distributional pattern, encompassing the major regions of Borneo, the Malay Peninsula, and Sumatra while all remaining species are endemic to Borneo. In addition, M. gigantea and M. pruinosa are also found on the islands of Bangka/Belitung (Figure 1). Macaranga hosei is apparently not found on these islands.
Within Borneo, the Crocker Range has a clear influence as a barrier on all the species. This becomes particularly prominent in northern Borneo, where the Crocker Range reaches highest altitudes: In M. gigantea, populations on either side of the range comprise two distinct genetic clusters (Figure 4A). The distinction on each side is along the north–south transect with mixed intermediate populations occurring in between (EK Berau in the East and NW Sarawak in the west). Correspondingly, there is a demarcation between the East Kalimantan and Sabah populations in M. pearsonii (Figure 2A). These findings corroborate with chloroplast haplotype studies in Guicking et al. (2011). This could probably be a result of isolation by distance among populations on either side of the Crocker Range. The mountains that separate Sabah from East Kalimantan are not very high. However, it is also known that vegetation shifted to lower altitudes in the glacial periods of the Pleistocene (Cannon et al., 2009) and that M. pearsonii is a lowland species in contrast to M. gigantea which has a much broader ecological range in terms of altitude. Hence the separation of the two populations of M. pearsonii could be attributed to isolation by distance compounded by the mountainous terrain separating the two regions.
In the three broadly distributed species, especially in M. pruinosa and M. hosei, there is a clear distinction between the eastern and western Sundaland individuals (Figures 2A, 3, 4B, Supplementary Figure S1B). Sumatra and Malay Peninsula are markedly different from the Borneo individuals, although the positioning of Sarawak with respect to M. gigantea is not clear and appears as transitional between east and west (Supplementary Figure S1A). The Sarawak individuals also do not show a consistent phylogenetic positioning in the two trees within this species (Figures 2A, 3). This suggests that perhaps Sarawak is a link between east and west Sundaland populations in M. gigantea. The insular nature of Sundaland that we witness today is misleading to biogeographers, because, for the majority of the past, the area formed a single landmass due to lowered sea levels associated with global cooling events (Voris, 2000; Meijaard, 2003; Cannon et al., 2009; Woodruff, 2010; Slik et al., 2011). A recent study by Husson et al. (2020) even suggests that the Sunda Shelf had been permanently exposed prior to 400 kya making the history of land connections between east and west even longer. Despite this, a clear biogeographic boundary has been observed between western and eastern Sundaland before (e.g., Meijaard, 2003; Woodruff, 2010; Lim et al., 2011). The observations we make here are concordant with these previous findings, reinforcing the idea of a biogeographic barrier between east and west Sundaland even during periods when the Sunda Shelf was exposed. The divergence times for the east–west lineages in all three major Macaranga species of this section averaged at 1.42 mya (Figure 3; M. gigantea: 1.48 mya (95% HPD: 0.65–2.98 mya), M. hosei: 1.40 (95% HPD: 0.60–2.83 mya), M. pruinosa: 1.37 mya (95% HPD: 0.54–2.76 mya)), which is in agreement with previous observations made in multiple mammal and bird species (mean 1.31 mya; Leonard et al., 2015; Mason et al., 2019). This suggests that the biogeographic structure observed in these species is very likely a consequence of Pleistocene climatic fluctuations and that perhaps forested corridors provided means for the genetic exchange to occur between east and west during the lowered sea levels while periods of submergence hindered the exchange (Leonard et al., 2015; Mason et al., 2019). If one were to consider the premise of Sundaland being permanently subaerial prior to 400 kya, we could argue the drier conditions during glacial maxima coupled with the coarse sandy soils of central Sundaland (Slik et al., 2011) presented a potential barrier for rainforest elements to cross over during the Pleistocene.
DEC + J makes it likely that Borneo is the center of origin for this section, although significant weight was given to Sumatra in the analysis as well (Figure 3). The latter can be attributed to the single M. gigantea individual from Sumatra which appears in an ancestral basal position. However, the MRCA node of the rest of M. gigantea excluding this one individual (Figure 3, marked **) was mapped to Borneo. This specific result is an impressive case illustrating the significance of comprehensive sampling in historical biogeographic analyses. For the rest of the species, Borneo is supported as the ancestral region. The “out-of-Borneo” hypothesis that follows from this suggests a Bornean origin for these species after which they migrated to their current distributions. This pattern has been observed in other biotic groups as well (de Bruyn et al., 2014; Grismer et al., 2017) and is owed to Borneo’s long emergent history, maintenance of rainforest cover and generally stable climate (Morley, 2012; de Bruyn et al., 2014).
4.3. The biogeographic positioning of the Bangka/Belitung islands
The Bangka/Belitung islands are a small complex of islands off the southeastern coast of Sumatra at a distance of less than 20 kilometers. Despite the geographic vicinity to Sumatra, individuals of M. pruinosa and M. gigantea from these islands showed a strong affiliation to populations from Borneo. In M. pruinosa, the phylogeny suggests that these islands have been colonized from Borneo because specimens from Bangka/Belitung occur as derived from the Bornean clade. This affiliation between Bangka/Belitung and Sarawak is further supported by ncSSR data (Figures 4A,B, Tables 1, 2). In addition, there is also an ecological relatedness in relation to M. pruinosa in that those found on the Bangka/Belitung islands are non-myrmecophytic like all individuals on Borneo, while individuals from West Sundaland are mostly myrmecophytic.
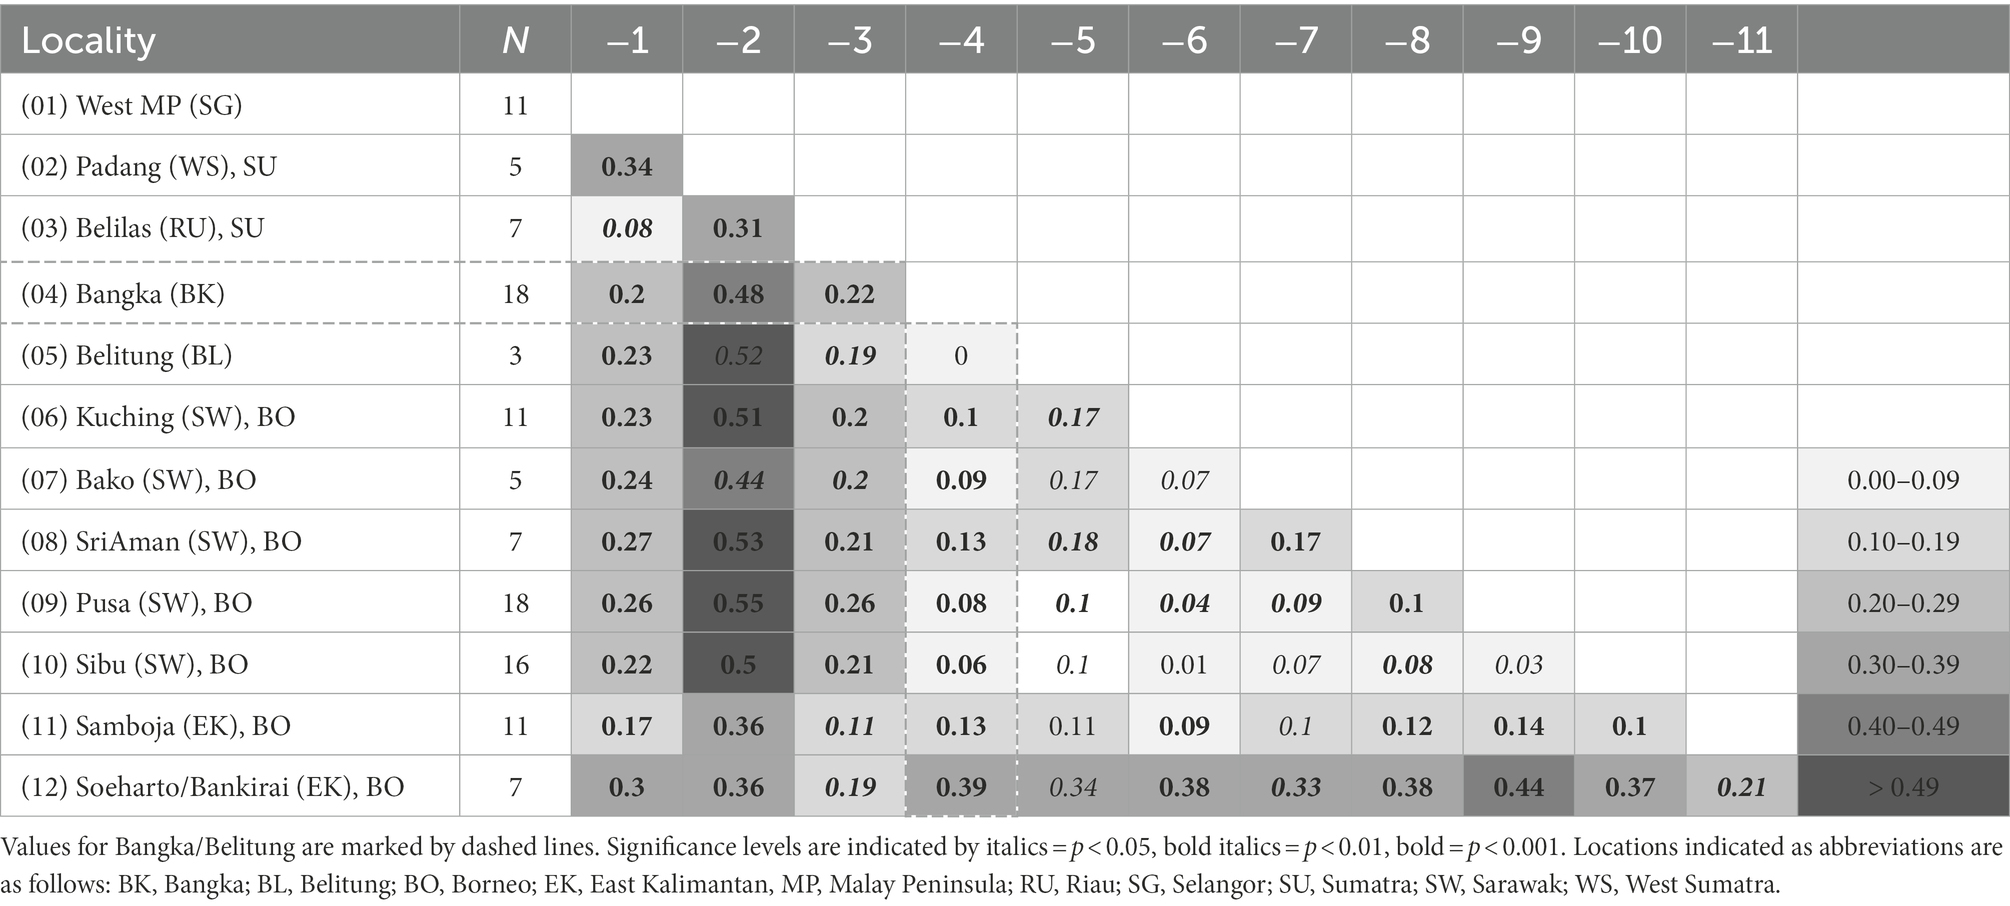
Table 2. Pairwise FST values for 12 populations of M. pruinosa based on ncSSR data.
This pattern, although evident in M. gigantea, is not as significant as in M. pruinosa; the single individual from Bangka in our GBS analysis was positioned ambiguously in the two trees, clustering with Sarawak individuals in the maximum likelihood calculation (Figure 2A) and with west Sundaland individuals in the Bayesian estimation (Figure 3). We could gauge the positioning of these islands better from PCA and STRUCTURE analyses which both suggest that Sarawak and Bangka individuals are transitional between east and west individuals. This could indicate either a relatively recent gene flow between east and west Sundaland with Bangka/Belitung functioning as a stepping stone or that the present-day distribution represents a remnant of a former widespread distribution that spanned the whole of the Sunda Shelf while exhibiting gradual variation as an increasing function of distance.
Surprisingly, M. hosei is not found on these islands, although it occurs on Sumatra and Malay Peninsula (Figure 1). It is not known if Crematogaster linsenmairi and Crematogaster borneensis, the ant species associated with all myrmecophytic species in the section (Feldhaar et al., 2016), are found on these islands. The absence of these ants could mean that even if a few M. hosei individuals managed to disperse to Bangka/Belitung, they failed to establish a viable population – myrmecophytes are not known to survive without their ant partners in the wild (Heil et al., 2001).
Interestingly, despite the narrow geographical distance between Sumatra and Bangka/Belitung islands, the apparent biogeographic discontinuity between the two regions is not limited to M. pruinosa alone. Mason et al. (2019) observed monophyly of greater mouse deer from west Borneo and Belitung island in a study that also incorporated individuals from west Sundaland. Lophura ignita, also called the Bornean Crested Fireback, is a pheasant species found only on Borneo and Bangka islands but not on Sumatra (IUCN, 2020). These observations coupled with our own results seem to indicate not only a biogeographic contiguity which made dispersal easier between Borneo and Bangka/Belitung but also some kind of barrier that possibly ran between the latter and Sumatra which some species are unable to cross. Inclusion of individuals from south Sumatra in the vicinity of these islands would shed more light on the discontinuity of the two regions, however we are unsure if M. pruinosa occurs in this region and very little sampling of Macaranga specimens could be achieved in this part of the island. Slik et al. (2011) suggests that the former soils of the submerged Sunda Shelf were characterized by vegetation ranging from heath forests on well-drained sandy soils, peat swamps on poorly drained soils to seasonal vegetation in Java. This complex mix of soil conditions possibly provided different sets of barriers to different species depending on their ecological requirements. Macaranga pruinosa is adapted to peat swamp substrates and occurs exclusively on poorly drained soils (Davies, 2001). Lophura ignita (IUCN, 2020) is known to occur in lowland tropical/subtropical swamp forests and the greater mouse deer in thick brush habitat near swampy areas in tropical forests or mangroves (Prothero and Foss, 2007). Given the observed biogeographic pattern in swamp-adapted species, we hypothesize a probable belt of heath forests occurring on well-drained nutrient poor sandy soils between Bangka/Belitung and Sumatra. This belt could have presented a barrier, specifically to the expansion of swamp-adapted species like M. pruinosa. The soil conditions may not have had a significant effect on the distribution of M. gigantea owing to its broad ecological range, which includes sandy soils and heath forests (although not very common; Davies, 2001). Central Sundaland may have hosted the ground for the intermingling of the east and west populations for this species, making the Sarawak and Bangka population a transitional one.
Data availability statement
The data presented in this study are deposited in the EMBL-EBI’s BioStudies repository with the following submission ID at: https://www.ebi.ac.uk/biostudies/studies/S-BSST995; Accession ID: S-BSST995.
Author contributions
ND and DG are the principal contributors and conceivers of this study. DG, MZ, FS, and JJ were involved in fieldwork. MZ collected ncSSR data. ND assembled and analyzed the GBS data and led the writing with assistance from all authors. DG analyzed the ncSSR data. All authors contributed to the article and approved the submitted version.
Funding
Financial support offered by the German Research Foundation (DFG) is gratefully acknowledged (grant Gu1840/1).
Acknowledgments
We acknowledge the following people for contributing plant material through the late 1990s to the early 2000s to our large collection of Macaranga samples available at the University of Kassel: Christina Baier, Heike Feldhaar, the late Brigitte Fiala, the late Ulrich Maschwitz, Ute Moog, and Swee-Peck Quek. We thank Nurainas from the Herbarium of Universitas Andalas in Padang, Sumatra, for providing additional sample material. DG acknowledges the following for issuing collection permits: The Economic Planning Unit (EPU), Kuala Lumpur for collection in Sabah, Borneo (2004/2005); EPU in Kota Kinabalu, Sabah, and the Danum Valley Management Committee; FS thanks LIPI for collection in East Kalimantan, Borneo, in the early 2000s.
Conflict of interest
The authors declare that the research was conducted in the absence of any commercial or financial relationships that could be construed as a potential conflict of interest.
Publisher’s note
All claims expressed in this article are solely those of the authors and do not necessarily represent those of their affiliated organizations, or those of the publisher, the editors and the reviewers. Any product that may be evaluated in this article, or claim that may be made by its manufacturer, is not guaranteed or endorsed by the publisher.
Supplementary material
The Supplementary material for this article can be found online at: https://www.frontiersin.org/articles/10.3389/fevo.2022.1049243/full#supplementary-material
References
April, J., Hanner, R. H., Dion-Côté, A.-M., and Bernatchez, L. (2013). Glacial cycles as an allopatric speciation pump in north-eastern American freshwater fishes. Mol. Ecol. 22, 409–422. doi: 10.1111/mec.12116
Bänfer, G., Fiala, B., and Weising, K. (2004). AFLP analysis of phylogenetic relationships among myrmecophytic species of Macaranga. Plant Syst. Evol. 249, 213–231. doi: 10.1007/s00606-004-0219-4
Bänfer, G., Moog, U., Fiala, B., Mohamed, M., Weising, K., and Blattner, F. R. (2006). A chloroplast genealogy of myrmecophytic Macaranga species (Euphorbiaceae) in Southeast Asia reveals hybridization, vicariance and long-distance dispersals: Macaranga chloroplast genealogy. Mol. Ecol. 15, 4409–4424. doi: 10.1111/j.1365-294X.2006.03064.x
Bird, M. I., Taylor, D., and Hunt, C. (2005). Palaeoenvironments of insular Southeast Asia during the last glacial period: a savanna corridor in Sundaland? Quat. Sci. Rev. 24, 2228–2242. doi: 10.1016/j.quascirev.2005.04.004
Blattner, F. R., Weising, K., Bänfer, G., Maschwitz, U., and Fiala, B. (2001). Molecular analysis of phylogenetic relationships among myrmecophytic Macaranga species (Euphorbiaceae). Mol. Phylogenet. Evol. 19, 331–344. doi: 10.1006/mpev.2001.0941
Bond, W. J. (1989). The tortoise and the hare: ecology of angiosperm dominance and gymnosperm persistence. Biol. J. Linn. Soc. 36, 227–249. doi: 10.1111/j.1095-8312.1989.tb00492.x
Bouckaert, R. R., and Drummond, A. J. (2017). bModelTest: Bayesian phylogenetic site model averaging and model comparison. BMC Evol. Biol. 17, 42–11. doi: 10.1186/s12862-017-0890-6
Bouckaert, R., Vaughan, T. G., Barido-Sottani, J., Duchêne, S., Fourment, M., Gavryushkina, A., et al. (2019). BEAST 2.5: an advanced software platform for Bayesian evolutionary analysis. PLoS Comput. Biol. 15:e1006650. doi: 10.1371/journal.pcbi.1006650
Brooks, T. M., Mittermeier, R. A., Mittermeier, C. G., da Fonseca, G. A. B., Rylands, A. B., Konstant, W. R., et al. (2002). Habitat loss and extinction in the hotspots of biodiversity. Conserv. Biol. 16, 909–923. doi: 10.1046/j.1523-1739.2002.00530.x
Cannon, C. H., Morley, R. J., and Bush, A. B. G. (2009). The current refugial rainforests of Sundaland are unrepresentative of their biogeographic past and highly vulnerable to disturbance. Proc. Natl. Acad. Sci. 106, 11188–11193. doi: 10.1073/pnas.0809865106
Caro, L. M., Caycedo-Rosales, P. C., Bowie, R. C. K., Slabbekoorn, H., and Cadena, C. D. (2013). Ecological speciation along an elevational gradient in a tropical passerine bird? J. Evol. Biol. 26, 357–374. doi: 10.1111/jeb.12055
Carpenter, C. (2005). The environmental control of plant species density on a Himalayan elevation gradient. J. Biogeogr. 32, 999–1018. doi: 10.1111/j.1365-2699.2005.01249.x
Chomicki, G., and Renner, S. S. (2015). Phylogenetics and molecular clocks reveal the repeated evolution of ant-plants after the late Miocene in Africa and the early Miocene in Australasia and the Neotropics. New Phytol. 207, 411–424. doi: 10.1111/nph.13271
Davies, S. J. (2001). Systematics of Macaranga sects. Pachystemon and Pruinosae (Euphorbiaceae). Harv. Pap. Bot. 6, 371–448.
Davies, S. J., Lum, S. K. Y., Chan, R., and Wang, L. K. (2001). Evolution of myrmecophytism in western Malesian Macaranga (Euphorbiaceae). Evolution 55, 1542–1559. doi: 10.1111/j.0014-3820.2001.tb00674.x
de Bruyn, M., Stelbrink, B., Morley, R. J., Hall, R., Carvalho, G. R., Cannon, C. H., et al. (2014). Borneo and Indochina are major evolutionary hotspots for southeast Asian biodiversity. Syst. Biol. 63, 879–901. doi: 10.1093/sysbio/syu047
Dodson, J. J., Colombani, F., and Ng, P. K. L. (1995). Phylogeographic structure in mitochondrial DNA of a south-east Asian freshwater fish, Hemibagrus nemurus (Siluroidei; Bagridae) and Pleistocene Sea-level changes on the Sunda Shelf. Mol. Ecol. 4, 331–346. doi: 10.1111/j.1365-294X.1995.tb00226.x
Drummond, A. J., Ho, S. Y. W., Phillips, M. J., and Rambaut, A. (2006). Relaxed phylogenetics and dating with confidence. PLoS Biol. 4:e88. doi: 10.1371/journal.pbio.0040088
Earl, D. A., and VonHoldt, B. M. (2012). STRUCTURE harvester: a website and program for visualizing STRUCTURE output and implementing the Evanno method. Conserv. Genet. Resour. 4, 359–361. doi: 10.1007/s12686-011-9548-7
Eaton, D. A. R. (2020). Toytree: a minimalist tree visualization and manipulation library for python. Methods Ecol. Evol. 11, 187–191. doi: 10.1111/2041-210X.13313
Eaton, D. A. R., and Overcast, I. (2020). Ipyrad: interactive assembly and analysis of RADseq datasets. Bioinformatics 36, 2592–2594. doi: 10.1093/bioinformatics/btz966
Elshire, R. J., Glaubitz, J. C., Sun, Q., Poland, J. A., Kawamoto, K., Buckler, E. S., et al. (2011). A robust, simple genotyping-by-sequencing (GBS) approach for high diversity species. PLoS One 6:e19379. doi: 10.1371/journal.pone.0019379
Esselstyn, J. A., and Brown, R. M. (2009). The role of repeated sea-level fluctuations in the generation of shrew (Soricidae: Crocidura) diversity in the Philippine archipelago. Mol. Phylogenet. Evol. 53, 171–181. doi: 10.1016/j.ympev.2009.05.034
Evanno, G., Regnaut, S., and Goudet, J. (2005). Detecting the number of clusters of individuals using the software structure: a simulation study. Mol. Ecol. 14, 2611–2620. doi: 10.1111/j.1365-294X.2005.02553.x
Excoffier, L., and Lischer, H. E. (2010). Arlequin suite ver 3.5: a new series of programs to perform population genetics analyses under Linux and windows. Mol. Ecol. Resour. 10, 564–567. doi: 10.1111/j.1755-0998.2010.02847.x
Falush, D., Stephens, M., and Pritchard, J. K. (2003). Inference of population structure using multilocus genotype data: linked loci and correlated allele frequencies. Genetics 164, 1567–1587. doi: 10.1111/j.1471-8286.2007.01758.x
Feldhaar, H., Maschwitz, U., and Fiala, B. (2016). Taxonomic revision of the obligate plant-ants of the genus Crematogaster Lund (Hymenoptera, Formicidae, Myrmicinae), associated with Macaranga (Thouars Euphorbiaceae) on Borneo and the Malay Peninsula. Sociobiology 63:651. doi: 10.13102/sociobiology.v63i1.949
Fiala, B. (1999). Diversity, evolutionary specialization and geographic distribution of a mutualistic ant-plant complex and Crematogaster in South East Asia. Biol. J. Linn. Soc. 66, 305–331. doi: 10.1006/bijl.1998.0279
Fiala, B., Grunsky, H., Maschwitz, U., and Linsenmair, K. E. (1994). Diversity of ant-plant interactions: protective efficacy in Macaranga species with different degrees of ant association. Oecologia 97, 186–192. doi: 10.1007/BF00323148
Fiala, B., Maschwitz, U., Pong, T. Y., and Helbig, A. J. (1989). Studies of a south east Asian ant-plant association: protection of Macaranga trees by Crematogaster borneensis. Oecologia 79, 463–470. doi: 10.1007/BF00378662
Fiala, B., Slik, F., Weising, K., Maschwitz, U., Mohamed, M., Jamsari,, et al. (2016). Phylogeography of three closely related myrmecophytic pioneer tree species in SE Asia: implications for species delimitation. Org. Divers. Evol. 16, 39–52. doi: 10.1007/s13127-015-0254-2
Gao, Y. D., Gao, X. F., and Harris, A. (2019). Species boundaries and parapatric speciation in the complex of alpine shrubs, Rosa sericea (Rosaceae), based on population genetics and ecological tolerances. Front. Plant Sci. 10:321. doi: 10.3389/fpls.2019.00321
Givnish, T. J., Millam, K. C., Mast, A. R., Paterson, T. B., Theim, T. J., Hipp, A. L., et al. (2009). Origin, adaptive radiation and diversification of the Hawaiian lobeliads (Asterales: Campanulaceae). Proc. R. Soc. B Biol. Sci. 276, 407–416. doi: 10.1098/rspb.2008.1204
Grismer, L. L., Wood, P. L. Jr., Aowphol, A., Cota, M., Grismer, M. S., Murdoch, M. L., et al. (2017). Out of Borneo, again and again: biogeography of the stream toad genus Ansonia Stoliczka (Anura: Bufonidae) and the discovery of the first limestone cave-dwelling species. Biol. J. Linn. Soc. 120, 371–395. doi: 10.1111/bij.12886
Guicking, D., Fiala, B., Blattner, F. R., Slik, F., Mohamed, M., and Weising, K. (2011). Comparative chloroplast DNA phylogeography of two tropical pioneer trees, Macaranga gigantea and Macaranga pearsonii (Euphorbiaceae). Tree Genet. Genomes 7, 573–585. doi: 10.1007/s11295-010-0357-z
Guicking, D., Fiala, B., Kröger-Kilian, T., Mohamed, M., and Weising, K. (2013). High gene flow in two thrips-pollinated Southeast Asian pioneer trees: genetic diversity and population structure of Macaranga hypoleuca and M. beccariana (Euphorbiaceae). Bot. J. Linn. Soc. 173, 606–621. doi: 10.1111/boj.12100
Guo, Q., Kelt, D. A., Sun, Z., Liu, H., Hu, L., Ren, H., et al. (2013). Global variation in elevational diversity patterns. Sci. Rep. 3, 1–7. doi: 10.1038/srep03007
Haffer, J. (1997). Alternative models of vertebrate speciation in Amazonia: an overview. Biodivers. Conserv. 6, 451–476. doi: 10.1023/A:1018320925954
Heaney, L. R. (1991). “A synopsis of climatic and Vegetational change in Southeast Asia” in Tropical Forests and Climate. ed. N. Myers (Heidelberg: Springer Netherlands), 53–61.
Heil, M., Fiala, B., Linsenmair, K. E., and Boller, T. (1999). Reduced chitinase activities in ant plants of the genus Macaranga. Naturwissenschaften 86, 146–149. doi: 10.1007/s001140050589
Heil, M., Fiala, B., Maschwitz, U., and Linsenmair, K. E. (2001). On benefits of indirect defence: short-and long-term studies of antiherbivore protection via mutualistic ants. Oecologia 126, 395–403. doi: 10.1007/s004420000532
Hinckley, A., Hawkins, M. T. R., Achmadi, A. S., Maldonado, J. E., and Leonard, J. A. (2020). Ancient divergence driven by geographic isolation and ecological adaptation in forest dependent Sundaland tree squirrels. Front. Ecol. Evol. :8208. doi: 10.3389/fevo.2020.00208
Ho, S. Y. M. (2007). Calibrating molecular estimates of substitution rates and divergence times in birds. J. Avian Biol. 38, 409–414. doi: 10.1111/j.0908-8857.2007.04168.x
Hubisz, M. J., Falush, D., Stephens, M., and Pritchard, J. K. (2009). Inferring weak population structure with the assistance of sample group information. Mol. Ecol. Resour. 9, 1322–1332. doi: 10.1111/j.1755-0998.2009.02591.x
Husson, L., Boucher, F. C., Sarr, A., Sepulchre, P., and Cahyarini, S. Y. (2020). Evidence of Sundaland’s subsidence requires revisiting its biogeography. J. Biogeogr. 47, 843–853. doi: 10.1111/jbi.13762
IUCN. (2020). Lophura ignita: BirdLife International: The IUCN Red List of Threatened Species 2020: E.T22727431A184560985 [data set]. Gland: International Union for Conservation of Nature.
Knox, E. B., and Palmer, J. D. (1995). Chloroplast DNA variation and the recent radiation of the giant senecios (Asteraceae) on the tall mountains of eastern Africa. Proc. Natl. Acad. Sci. 92, 10349–10353. doi: 10.1073/pnas.92.22.10349
Kornilios, P., Giokas, S., Lymberakis, P., and Sindaco, R. (2013). Phylogenetic position, origin and biogeography of Palearctic and Socotran blind-snakes (Serpentes: Typhlopidae). Mol. Phylogenet. Evol. 68, 35–41. doi: 10.1016/j.ympev.2013.03.009
Kuriyama, T., Brandley, M. C., Katayama, A., Mori, A., Honda, M., and Hasegawa, M. (2011). A time-calibrated phylogenetic approach to assessing the phylogeography, colonization history and phenotypic evolution of snakes in the Japanese Izu Islands: colonization history of Izu Island snakes. J. Biogeogr. 38, 259–271. doi: 10.1111/j.1365-2699.2010.02403.x
Leonard, J. A., den Tex, R.-J., Hawkins, M. T. R., Muñoz-Fuentes, V., Thorington, R., and Maldonado, J. E. (2015). Phylogeography of vertebrates on the Sunda Shelf: a multi-species comparison. J. Biogeogr. 42, 871–879. doi: 10.1111/jbi.12465
Li, F., and Li, S. (2018). Paleocene–Eocene and Plio–Pleistocene Sea-level changes as species pumps in Southeast Asia: evidence from Althepus spiders. Mol. Phylogenet. Evol. 127, 545–555. doi: 10.1016/j.ympev.2018.05.014
Lim, H. C., Rahman, M. A., Lim, S. L. H., Moyle, R. G., and Sheldon, F. H. (2011). Revisiting Wallace’s haunt: coalescent simulations and comparative niche modeling reveal historical mechanisms that promoted avian population divergence in the Malay archipelago: Malay archipelago avian phylogeography. Evolution 65, 321–334. doi: 10.1111/j.1558-5646.2010.01105.x
Lohman, D. J., de Bruyn, M., Page, T., von Rintelen, K., Hall, R., Ng, P. K. L., et al. (2011). Biogeography of the indo-Australian archipelago. Annu. Rev. Ecol. Evol. Syst. 42, 205–226. doi: 10.1146/annurev-ecolsys-102710-145001
Losos, J. B., and Ricklefs, R. E. (2009). Adaptation and diversification on islands. Nature 457, 830–836. doi: 10.1038/nature07893
Mason, V. C., Helgen, K. M., and Murphy, W. J. (2019). Comparative phylogeography of forest-dependent mammals reveals paleo-forest corridors throughout Sundaland. J. Hered. 110, 158–172. doi: 10.1093/jhered/esy046
Matzke, N. J. (2014). Model selection in historical biogeography reveals that founder-event speciation is a crucial process in island clades. Syst. Biol. 63, 951–970. doi: 10.1093/sysbio/syu056
Meijaard, E. (2003). Mammals of south-east Asian islands and their late Pleistocene environments: late Pleistocene environments of south-east Asian mammals. J. Biogeogr. 30, 1245–1257. doi: 10.1046/j.1365-2699.2003.00890.x
Mittermeier, R., Gil, P., Hoffmann, M., Pilgrim, J., Brooks, T., Mittermeier, C., et al. (2005). Hotspots Revisited: Earth’s Biologically Richest and Most Endangered Terrestrial Ecoregions: Conservation International. Sierra Madre, Cemex315.
Morley, R. J. (2012). “A review of the Cenozoic palaeoclimate history of Southeast Asia”, in Biotic Evolution and Environmental Change in Southeast Asia. eds. D. Gower, K. Johnson, J. Richardson, B. Rosen, L. Rüber, and S. Williams (Cambridge: Cambridge University Press), 79–114.
Myers, N., Mittermeier, R. A., Mittermeier, C. G., da Fonseca, G. A. B., and Kent, J. (2000). Biodiversity hotspots for conservation priorities. Nature 403, 853–858. doi: 10.1038/35002501
O’Connell, K. A., Smart, U., Smith, E. N., Hamidy, A., Kurniawan, N., and Fujita, M. K. (2018). Within-island diversification underlies parachuting frog (Rhacophorus) species accumulation on the Sunda Shelf. J. Biogeogr. 45, 929–940. doi: 10.1111/jbi.13162
Papadopoulou, A., and Knowles, L. L. (2015a). Genomic tests of the species-pump hypothesis: recent island connectivity cycles drive population divergence but not speciation in Caribbean crickets across the Virgin Islands: genomic tests of the species pump hypothesis. Evolution 69, 1501–1517. doi: 10.1111/evo.12667
Papadopoulou, A., and Knowles, L. L. (2015b). Species-specific responses to island connectivity cycles: refined models for testing phylogeographic concordance across a Mediterranean Pleistocene aggregate island complex. Mol. Ecol. 24, 4252–4268. doi: 10.1111/mec.13305
Pritchard, J. K., Stephens, M., and Donnelly, P. (2000). Inference of population structure using multilocus genotype data. Genetics 155, 945–959. doi: 10.1093/genetics/155.2.945
Pritchard, J. K., Wen, W., and Falush, D. (2010). Documentation for STRUCTURE Software: Version 2. University of Chicago, Chicago, IL.
Rambaut, A. (2019). Figtree (1.4.4). Available at: http://tree.bio.ed.ac.uk/software/figtree/
Rambaut, A., Drummond, A. J., Xie, D., Baele, G., and Suchard, M. A. (2018). Posterior summarization in Bayesian phylogenetics using tracer 1.7. Syst. Biol. 67, 901–904. doi: 10.1093/sysbio/syy032
Ruiz-Sanchez, E., and Specht, C. D. (2013). Influence of the geological history of the trans-Mexican Volcanic Belt on the diversification of Nolina parviflora (Asparagaceae: Nolinoideae). J. Biogeogr. 40, 1336–1347. doi: 10.1111/jbi.12073
Ryberg, M., and Matheny, P. B. (2011). Dealing with incomplete taxon sampling and diversification of a large clade of mushroom-forming fungi: diversification of a large mushroom-forming clade. Evolution 65, 1862–1878. doi: 10.1111/j.1558-5646.2011.01251.x
Salles, T., Mallard, C., Husson, L., Zahirovic, S., Sarr, A.-C., and Sepulchre, P. (2021). Quaternary landscape dynamics boosted species dispersal across Southeast Asia. Commun. Earth Environ. 2:240. doi: 10.1038/s43247-021-00311-7
Sanders, N. J., and Rahbek, C. (2012). The patterns and causes of elevational diversity gradients. Ecography 35, 1–3. doi: 10.1111/j.1600-0587.2011.07338.x
Schenk, J. J. (2013). Biogeographical diversification of Mentzelia section Bartonia in western North America. J. Biogeogr. 40, 455–465. doi: 10.1111/jbi.12018
Schenk, J. J. (2016). Consequences of secondary calibrations on divergence time estimates. PLoS One 11:e0148228. doi: 10.1371/journal.pone.0148228
Sholihah, A., Delrieu-Trottin, E., Condamine, F. L., Wowor, D., Rüber, L., Pouyaud, L., et al. (2021). Impact of Pleistocene eustatic fluctuations on evolutionary dynamics in Southeast Asian biodiversity hotspots. Syst. Biol. 70, 940–960. doi: 10.1093/sysbio/syab006
Siler, C. D., Oaks, J. R., Welton, L. J., Linkem, C. W., Swab, J. C., Diesmos, A. C., et al. (2012). Did geckos ride the Palawan raft to the Philippines?: ark-driven diversification of geckos. J. Biogeogr. 39, 1217–1234. doi: 10.1111/j.1365-2699.2011.02680.x
Slik, J. W. F., Aiba, S.-I., Bastian, M., Brearley, F. Q., Cannon, C. H., Eichhorn, K. A. O., et al. (2011). Soils on exposed Sunda Shelf shaped biogeographic patterns in the equatorial forests of Southeast Asia. Proc. Natl. Acad. Sci. 108, 12343–12347. doi: 10.1073/pnas.1103353108
Stamatakis, A. (2014). RAxML version 8: a tool for phylogenetic analysis and post-analysis of large phylogenies. Bioinformatics 30, 1312–1313. doi: 10.1093/bioinformatics/btu033
Tel-Zur, N., Abbo, S., Myslabodski, D., and Mizrahi, Y. (1999). Modified CTAB procedure for DNA isolation from epiphytic cacti of the genera Hylocereus and Selenicereus (Cactaceae). Plant Mol. Biol. Report. 17, 249–254. doi: 10.1023/A:1007656315275
Van Oosterhout, C., Hutchinson, W. F., Wills, D. P., and Shipley, P. (2004). Microchecker: software for identifying and correcting genotyping errors in microsatellite data. Mol. Ecol. Notes 4, 535–538. doi: 10.1111/j.1471-8286.2004.00684.x
Van Welzen, P. C., Strijk, J. S., Konijnenburg-van Cittert, J. H. A., Nucete, M., and Merckx, V. S. F. T. (2014). Dated phylogenies of the sister genera Macaranga and Mallotus (Euphorbiaceae): congruence in historical biogeographic patterns? PLoS One, 9,:e85713. doi: 10.1371/journal.pone
Voris, H. K. (2000). Maps of Pleistocene Sea levels in Southeast Asia: shorelines, river systems and time durations. J. Biogeogr. 27, 1153–1167. doi: 10.1046/j.1365-2699.2000.00489.x
Watson, H. C. (1835). Remarks on the Geographical Distribution of British Plants: Chiefly in Connection With Latitude, Elevation, and Climate. London: Longman, Rees, Orme, Brown, Green, and Longman, Paternoster-Row.
Whitmore, T. C., Ashton, P. S., Coode, M. J. E., and Hoffmann, P. (2008). The genus Macaranga: A Prodromus. Melbourne, VIC: Royal Botanical Gardens Kew.
Woodruff, D. S. (2010). Biogeography and conservation in Southeast Asia: how 2.7 million years of repeated environmental fluctuations affect today’s patterns and the future of the remaining refugial-phase biodiversity. Biodivers. Conserv. 19, 919–941. doi: 10.1007/s10531-010-9783-3
Yu, Y., Blair, C., and He, X. (2020). RASP 4: ancestral state reconstruction tool for multiple genes and characters. Mol. Biol. Evol. 37, 604–606. doi: 10.1093/molbev/msz257
Zhao, Y., Qi, Z., Ma, W., Dai, Q., Li, P., Cameron, K. M., et al. (2013). Comparative phylogeography of the Smilax hispida group (Smilacaceae) in eastern Asia and North America – implications for allopatric speciation, causes of diversity disparity, and origins of temperate elements in Mexico. Mol. Phylogenet. Evol. 68, 300–311. doi: 10.1016/j.ympev.2013.03.025
Keywords: Bangka/Belitung islands, genotyping-by-sequencing, geographic barriers, Macaranga, myrmecophytism, nuclear microsatellites, soil conditions, Sundaland
Citation: Dixit NM, Zirpel M, Slik JWF, Jamsari J, Weising K and Guicking D (2023) Biogeography of the Sunda Shelf revisited: Insights from Macaranga section Pruinosae (Euphorbiaceae). Front. Ecol. Evol. 10:1049243. doi: 10.3389/fevo.2022.1049243
Edited by:
Hang Sun, Kunming Institute of Botany (CAS), ChinaReviewed by:
Yu-Chung Chiang, National Sun Yat-sen University, TaiwanElijah Wostl, St. Edward’s University, United States
Copyright © 2023 Dixit, Zirpel, Slik, Jamsari, Weising and Guicking. This is an open-access article distributed under the terms of the Creative Commons Attribution License (CC BY). The use, distribution or reproduction in other forums is permitted, provided the original author(s) and the copyright owner(s) are credited and that the original publication in this journal is cited, in accordance with accepted academic practice. No use, distribution or reproduction is permitted which does not comply with these terms.
*Correspondence: Nadi M. Dixit, ✉ bmFkaS5kaXhpdEB1bmkta2Fzc2VsLmRl